Embed Size (px)
Citation preview
Abstract—Business Processes (BPs) are the key instrument to understand how companies operate at an organizational level, taking an as-is view of the workflow, and how to address their issues by identifying a to-be model. In last year’s, the BP Model and Notation (BPMN) has become a de-facto standard for modeling processes. However, this standard does not incorporate explicitly the Problem-Solving (PS) knowledge in the Process Modeling (PM) results. Thus, such knowledge cannot be shared or reused. To narrow this gap is today a challenging research area. In this paper we present a framework able to capture the PS knowledge and to improve a workflow. This framework extends the BPMN specification by incorporating new general-purpose elements. A pilot scenario is also presented and discussed.
Keywords—Business Process Management, BPMN, Problem
Solving, Process mapping.
I. INTRODUCTION
ROBLEM solving (PS) strategies in engineering are
applied when products or processes fail, to take corrective
actions and then preventing further failures. PS can also be
applied to a product or process prior to an actual fail event.
For instance, when a potential problem can be predicted,
analyzed, and mitigation applied to avoid new occurrences of
it. To support the improvement of processes methodologies,
many techniques and tools has been developed [1][4][5],
together with a number of languages specifications for
describing processes or workflows [4][6]. Such languages
represent a workflow on the basis of its control structure (i.e.,
where the execution control of the activities is defined) and its
participants (i.e., which agents execute the workflow
activities). However, these approaches do not incorporate
explicitly the PS knowledge in the workflow definition: this
knowledge is implicitly used and then it cannot be shared or
reused. For dealing with this drawback, workflows need to be
specified as a view at the knowledge level.
In this paper a framework, which captures the PS
knowledge used to define and execute a workflow, is
developed and proposed. The framework extends the Business
Process Model and Notation (BPMN) [8] specification, by
incorporating new executable components. More specifically,
the proposed BPMN-PS approach supports the conventional
G. Carmignani is with the Department of Energy, System, Territory and
Construction of the University of Pisa, Italy (e-mail: gionata.carmignani@ unipi.it).
M.G.C.A. Cimino is with the Department of Information Engineering of the University of Pisa, Italy (e-mail: [email protected]).
F. Failli is with the Department of Civil and Industrial Engineering of the University of Pisa, Italy (phone: +39-050-2218133; fax: +39-050-2218065; e-mail: [email protected]).
three phases used in workflow modeling [1][2][3]:
I. Frame the process: to develop an overall process map,
the so-called “landscape”, clarifying what is in and what
is out of scope; to establish the scope of the target
process to be studied; to perform an initial process
assessment; to determine the process goals and
performance objectives.
II. Understand the current (as-is) process: to map the
current process workflow; to document important
observations about all enablers;
III. Design the new (to-be) process: to characterize the to-be
process; to design the to-be workflow.
Fig. 1 represents the three-phases via a BPMN diagram.
Here, a circle represents an event, denoting something that
happens, whereas a rounded-corner rectangle with a plus sign
against the bottom line represents a sub-process, describing
the kind of work at a high level of business process detail.
Finally the sequence flow is represented by a solid black-
headed arrow, showing the source and target work units and
how the work is flowing.
Fig. 1 A BPMN diagram representing the conventional three-phases
used in workflow modeling
An overall ontological view of our BPMN-PS approach is
depicted in Fig. 2, where concepts (enclosed in ovals) are
connected by properties (represented by black arrows) or by
specialized properties (the general-to-specific property,
represented by white arrows). The right side of the diagram
pertains to process modeling, where solutions to problems are
represented. Here, a business process is aimed at delivering
products or services which can have a problem. A problem is
characterized by an as-is business process and solved by a to-
be business process. A business process can be mapped by a
workflow, expressed as a BPMN model, which in turn can be
deployed and executed by means of a Business Process
Management (BPM) platform. The left side of the diagram
pertains to PS, where knowledge generating solutions to
problems is represented. In our BPMN-PS approach the PS
knowledge is defined by means of six enablers, i.e., central
factors that determine how the process (mis-)behaves [3].
Gionata Carmignani, Mario G. C. A. Cimino, Franco Failli
Process Modeling and Problem Solving: Connecting Two Worlds by BPMN
P
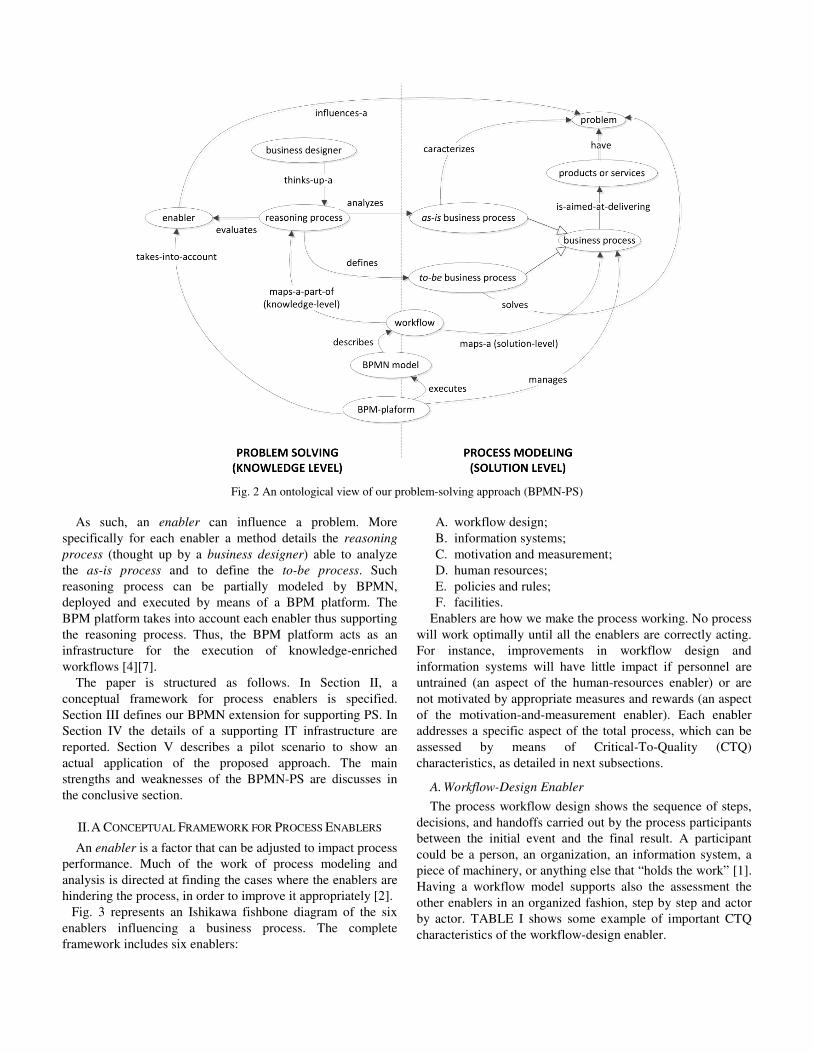
Fig. 2 An ontological view of our problem-solving approach (BPMN-PS)
As such, an enabler can influence a problem. More
specifically for each enabler a method details the reasoning
process (thought up by a business designer) able to analyze
the as-is process and to define the to-be process. Such
reasoning process can be partially modeled by BPMN,
deployed and executed by means of a BPM platform. The
BPM platform takes into account each enabler thus supporting
the reasoning process. Thus, the BPM platform acts as an
infrastructure for the execution of knowledge-enriched
workflows [4][7].
The paper is structured as follows. In Section II, a
conceptual framework for process enablers is specified.
Section III defines our BPMN extension for supporting PS. In
Section IV the details of a supporting IT infrastructure are
reported. Section V describes a pilot scenario to show an
actual application of the proposed approach. The main
strengths and weaknesses of the BPMN-PS are discusses in
the conclusive section.
II. A CONCEPTUAL FRAMEWORK FOR PROCESS ENABLERS
An enabler is a factor that can be adjusted to impact process
performance. Much of the work of process modeling and
analysis is directed at finding the cases where the enablers are
hindering the process, in order to improve it appropriately [2].
Fig. 3 represents an Ishikawa fishbone diagram of the six
enablers influencing a business process. The complete
framework includes six enablers:
A. workflow design;
B. information systems;
C. motivation and measurement;
D. human resources;
E. policies and rules;
F. facilities.
Enablers are how we make the process working. No process
will work optimally until all the enablers are correctly acting.
For instance, improvements in workflow design and
information systems will have little impact if personnel are
untrained (an aspect of the human-resources enabler) or are
not motivated by appropriate measures and rewards (an aspect
of the motivation-and-measurement enabler). Each enabler
addresses a specific aspect of the total process, which can be
assessed by means of Critical-To-Quality (CTQ)
characteristics, as detailed in next subsections.
A. Workflow-Design Enabler
The process workflow design shows the sequence of steps,
decisions, and handoffs carried out by the process participants
between the initial event and the final result. A participant
could be a person, an organization, an information system, a
piece of machinery, or anything else that “holds the work” [1].
Having a workflow model supports also the assessment the
other enablers in an organized fashion, step by step and actor
by actor. TABLE I shows some example of important CTQ
characteristics of the workflow-design enabler.
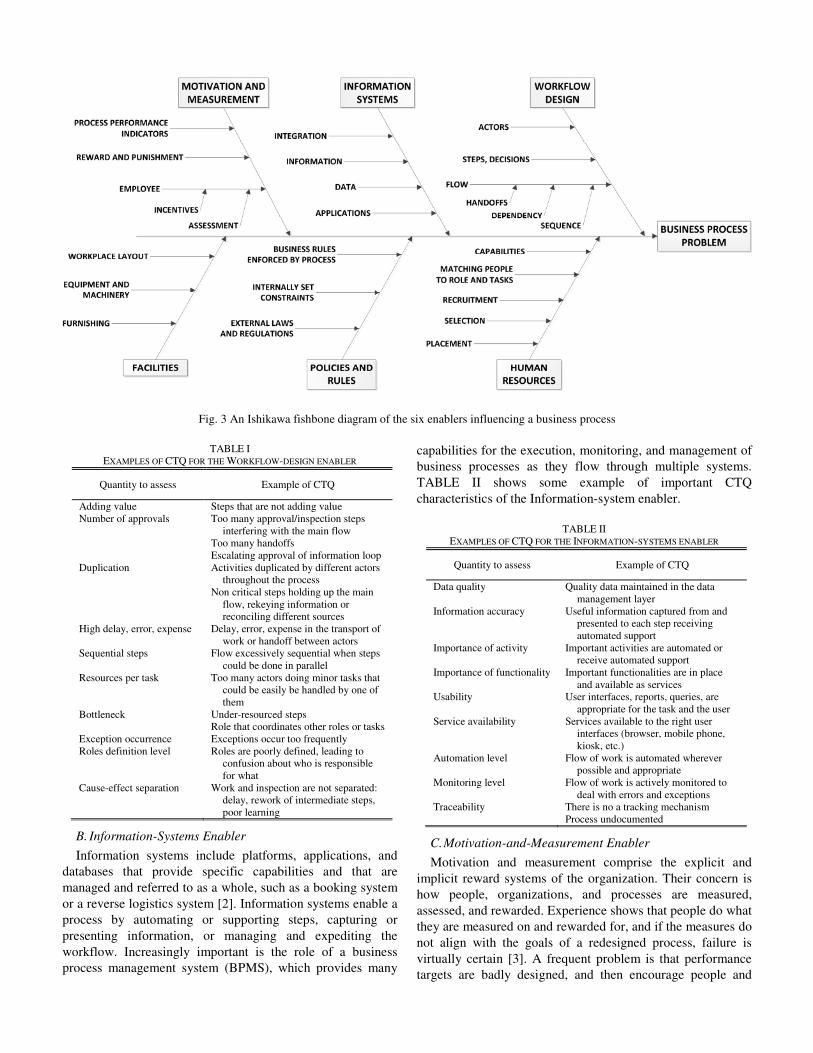
Fig. 3 An Ishikawa fishbone diagram of the six enablers influencing a business process
TABLE I
EXAMPLES OF CTQ FOR THE WORKFLOW-DESIGN ENABLER
Quantity to assess Example of CTQ
Adding value Steps that are not adding value Number of approvals Too many approval/inspection steps
interfering with the main flow Too many handoffs Escalating approval of information loop
Duplication Activities duplicated by different actors throughout the process
Non critical steps holding up the main flow, rekeying information or reconciling different sources
High delay, error, expense Delay, error, expense in the transport of work or handoff between actors
Sequential steps Flow excessively sequential when steps could be done in parallel
Resources per task Too many actors doing minor tasks that could be easily be handled by one of them
Bottleneck Under-resourced steps Role that coordinates other roles or tasks
Exception occurrence Exceptions occur too frequently Roles definition level Roles are poorly defined, leading to
confusion about who is responsible for what
Cause-effect separation Work and inspection are not separated: delay, rework of intermediate steps, poor learning
B. Information-Systems Enabler
Information systems include platforms, applications, and
databases that provide specific capabilities and that are
managed and referred to as a whole, such as a booking system
or a reverse logistics system [2]. Information systems enable a
process by automating or supporting steps, capturing or
presenting information, or managing and expediting the
workflow. Increasingly important is the role of a business
process management system (BPMS), which provides many
capabilities for the execution, monitoring, and management of
business processes as they flow through multiple systems.
TABLE II shows some example of important CTQ
characteristics of the Information-system enabler.
TABLE II
EXAMPLES OF CTQ FOR THE INFORMATION-SYSTEMS ENABLER
Quantity to assess Example of CTQ
Data quality Quality data maintained in the data management layer
Information accuracy Useful information captured from and presented to each step receiving automated support
Importance of activity Important activities are automated or receive automated support
Importance of functionality Important functionalities are in place and available as services
Usability User interfaces, reports, queries, are appropriate for the task and the user
Service availability Services available to the right user interfaces (browser, mobile phone, kiosk, etc.)
Automation level Flow of work is automated wherever possible and appropriate
Monitoring level Flow of work is actively monitored to deal with errors and exceptions
Traceability There is no a tracking mechanism Process undocumented
C. Motivation-and-Measurement Enabler
Motivation and measurement comprise the explicit and
implicit reward systems of the organization. Their concern is
how people, organizations, and processes are measured,
assessed, and rewarded. Experience shows that people do what
they are measured on and rewarded for, and if the measures do
not align with the goals of a redesigned process, failure is
virtually certain [3]. A frequent problem is that performance
targets are badly designed, and then encourage people and
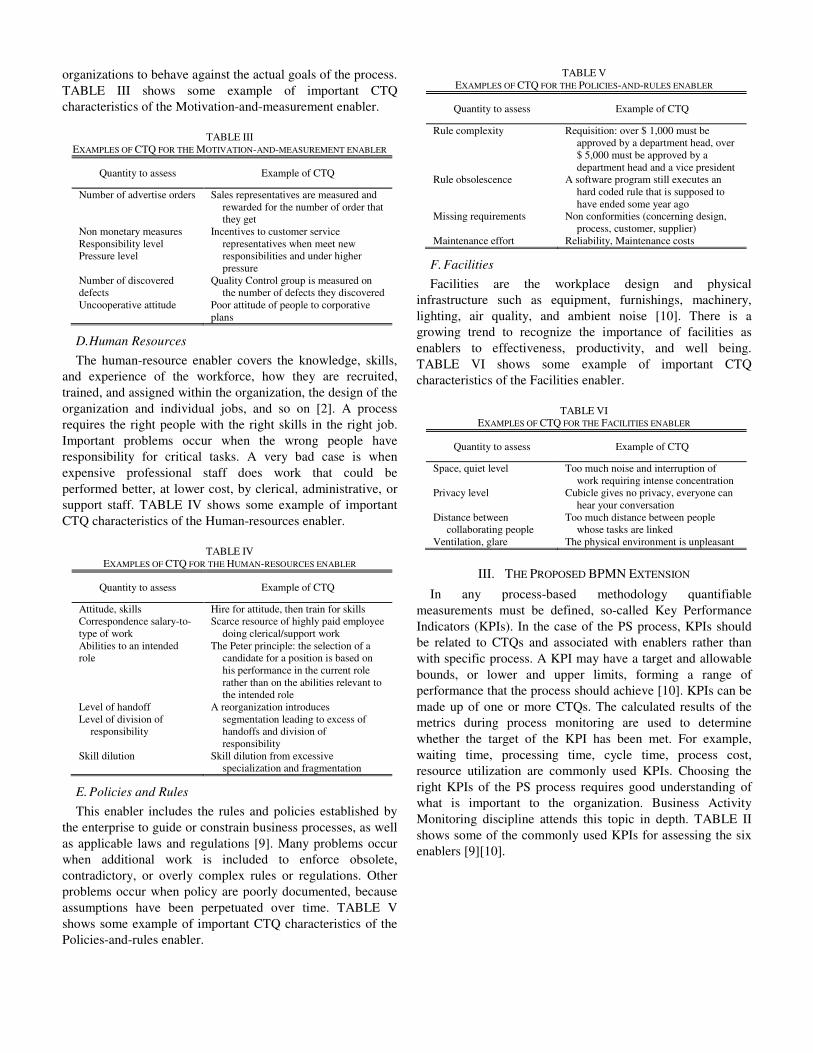
organizations to behave against the actual goals of the process.
TABLE III shows some example of important CTQ
characteristics of the Motivation-and-measurement enabler.
TABLE III
EXAMPLES OF CTQ FOR THE MOTIVATION-AND-MEASUREMENT ENABLER
Quantity to assess Example of CTQ
Number of advertise orders Sales representatives are measured and rewarded for the number of order that they get
Non monetary measures Responsibility level Pressure level
Incentives to customer service representatives when meet new responsibilities and under higher pressure
Number of discovered defects
Quality Control group is measured on the number of defects they discovered
Uncooperative attitude Poor attitude of people to corporative plans
D. Human Resources
The human-resource enabler covers the knowledge, skills,
and experience of the workforce, how they are recruited,
trained, and assigned within the organization, the design of the
organization and individual jobs, and so on [2]. A process
requires the right people with the right skills in the right job.
Important problems occur when the wrong people have
responsibility for critical tasks. A very bad case is when
expensive professional staff does work that could be
performed better, at lower cost, by clerical, administrative, or
support staff. TABLE IV shows some example of important
CTQ characteristics of the Human-resources enabler.
TABLE IV
EXAMPLES OF CTQ FOR THE HUMAN-RESOURCES ENABLER
Quantity to assess Example of CTQ
Attitude, skills Hire for attitude, then train for skills Correspondence salary-to-type of work
Scarce resource of highly paid employee doing clerical/support work
Abilities to an intended role
The Peter principle: the selection of a candidate for a position is based on his performance in the current role rather than on the abilities relevant to the intended role
Level of handoff Level of division of
responsibility
A reorganization introduces segmentation leading to excess of handoffs and division of responsibility
Skill dilution Skill dilution from excessive specialization and fragmentation
E. Policies and Rules
This enabler includes the rules and policies established by
the enterprise to guide or constrain business processes, as well
as applicable laws and regulations [9]. Many problems occur
when additional work is included to enforce obsolete,
contradictory, or overly complex rules or regulations. Other
problems occur when policy are poorly documented, because
assumptions have been perpetuated over time. TABLE V
shows some example of important CTQ characteristics of the
Policies-and-rules enabler.
TABLE V EXAMPLES OF CTQ FOR THE POLICIES-AND-RULES ENABLER
Quantity to assess Example of CTQ
Rule complexity Requisition: over $ 1,000 must be approved by a department head, over $ 5,000 must be approved by a department head and a vice president
Rule obsolescence A software program still executes an hard coded rule that is supposed to have ended some year ago
Missing requirements Non conformities (concerning design, process, customer, supplier)
Maintenance effort Reliability, Maintenance costs
F. Facilities
Facilities are the workplace design and physical
infrastructure such as equipment, furnishings, machinery,
lighting, air quality, and ambient noise [10]. There is a
growing trend to recognize the importance of facilities as
enablers to effectiveness, productivity, and well being.
TABLE VI shows some example of important CTQ
characteristics of the Facilities enabler.
TABLE VI
EXAMPLES OF CTQ FOR THE FACILITIES ENABLER
Quantity to assess Example of CTQ
Space, quiet level Too much noise and interruption of work requiring intense concentration
Privacy level Cubicle gives no privacy, everyone can hear your conversation
Distance between collaborating people
Too much distance between people whose tasks are linked
Ventilation, glare The physical environment is unpleasant
III. THE PROPOSED BPMN EXTENSION
In any process-based methodology quantifiable
measurements must be defined, so-called Key Performance
Indicators (KPIs). In the case of the PS process, KPIs should
be related to CTQs and associated with enablers rather than
with specific process. A KPI may have a target and allowable
bounds, or lower and upper limits, forming a range of
performance that the process should achieve [10]. KPIs can be
made up of one or more CTQs. The calculated results of the
metrics during process monitoring are used to determine
whether the target of the KPI has been met. For example,
waiting time, processing time, cycle time, process cost,
resource utilization are commonly used KPIs. Choosing the
right KPIs of the PS process requires good understanding of
what is important to the organization. Business Activity
Monitoring discipline attends this topic in depth. TABLE II
shows some of the commonly used KPIs for assessing the six
enablers [9][10].
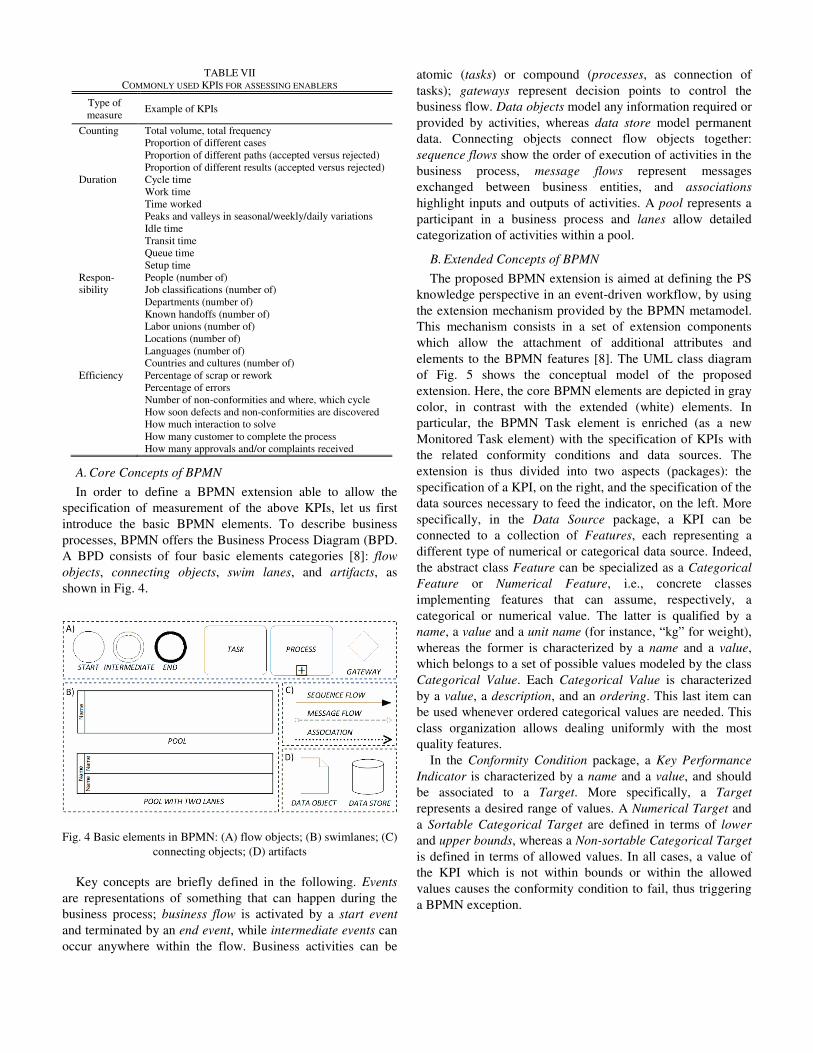
TABLE VII COMMONLY USED KPIS FOR ASSESSING ENABLERS
Type of measure
Example of KPIs
Counting Total volume, total frequency Proportion of different cases Proportion of different paths (accepted versus rejected) Proportion of different results (accepted versus rejected) Duration Cycle time Work time Time worked Peaks and valleys in seasonal/weekly/daily variations Idle time Transit time Queue time Setup time Respon- People (number of) sibility Job classifications (number of) Departments (number of) Known handoffs (number of) Labor unions (number of) Locations (number of) Languages (number of) Countries and cultures (number of) Efficiency Percentage of scrap or rework Percentage of errors Number of non-conformities and where, which cycle How soon defects and non-conformities are discovered How much interaction to solve How many customer to complete the process How many approvals and/or complaints received
A. Core Concepts of BPMN
In order to define a BPMN extension able to allow the
specification of measurement of the above KPIs, let us first
introduce the basic BPMN elements. To describe business
processes, BPMN offers the Business Process Diagram (BPD.
A BPD consists of four basic elements categories [8]: flow
objects, connecting objects, swim lanes, and artifacts, as
shown in Fig. 4.
Fig. 4 Basic elements in BPMN: (A) flow objects; (B) swimlanes; (C)
connecting objects; (D) artifacts
Key concepts are briefly defined in the following. Events
are representations of something that can happen during the
business process; business flow is activated by a start event
and terminated by an end event, while intermediate events can
occur anywhere within the flow. Business activities can be
atomic (tasks) or compound (processes, as connection of
tasks); gateways represent decision points to control the
business flow. Data objects model any information required or
provided by activities, whereas data store model permanent
data. Connecting objects connect flow objects together:
sequence flows show the order of execution of activities in the
business process, message flows represent messages
exchanged between business entities, and associations
highlight inputs and outputs of activities. A pool represents a
participant in a business process and lanes allow detailed
categorization of activities within a pool.
B. Extended Concepts of BPMN
The proposed BPMN extension is aimed at defining the PS
knowledge perspective in an event-driven workflow, by using
the extension mechanism provided by the BPMN metamodel.
This mechanism consists in a set of extension components
which allow the attachment of additional attributes and
elements to the BPMN features [8]. The UML class diagram
of Fig. 5 shows the conceptual model of the proposed
extension. Here, the core BPMN elements are depicted in gray
color, in contrast with the extended (white) elements. In
particular, the BPMN Task element is enriched (as a new
Monitored Task element) with the specification of KPIs with
the related conformity conditions and data sources. The
extension is thus divided into two aspects (packages): the
specification of a KPI, on the right, and the specification of the
data sources necessary to feed the indicator, on the left. More
specifically, in the Data Source package, a KPI can be
connected to a collection of Features, each representing a
different type of numerical or categorical data source. Indeed,
the abstract class Feature can be specialized as a Categorical
Feature or Numerical Feature, i.e., concrete classes
implementing features that can assume, respectively, a
categorical or numerical value. The latter is qualified by a
name, a value and a unit name (for instance, “kg” for weight),
whereas the former is characterized by a name and a value,
which belongs to a set of possible values modeled by the class
Categorical Value. Each Categorical Value is characterized
by a value, a description, and an ordering. This last item can
be used whenever ordered categorical values are needed. This
class organization allows dealing uniformly with the most
quality features.
In the Conformity Condition package, a Key Performance
Indicator is characterized by a name and a value, and should
be associated to a Target. More specifically, a Target
represents a desired range of values. A Numerical Target and
a Sortable Categorical Target are defined in terms of lower
and upper bounds, whereas a Non-sortable Categorical Target
is defined in terms of allowed values. In all cases, a value of
the KPI which is not within bounds or within the allowed
values causes the conformity condition to fail, thus triggering
a BPMN exception.
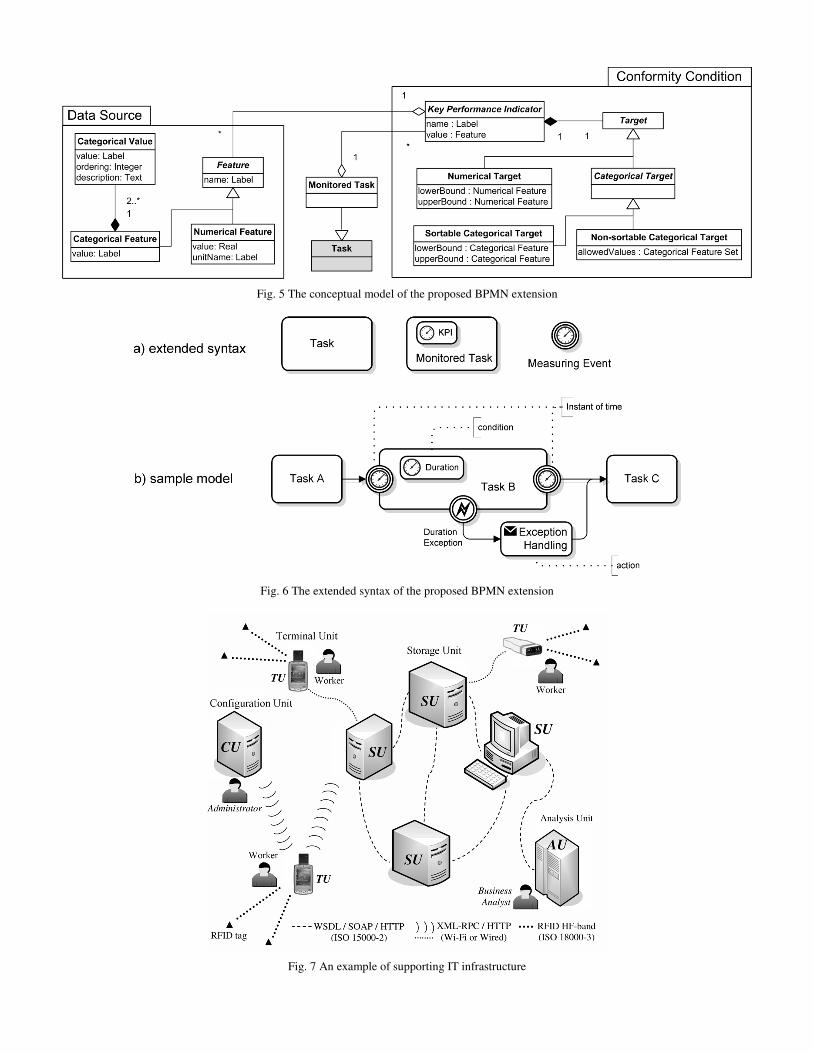
Fig. 5 The conceptual model of the proposed BPMN extension
Fig. 6 The extended syntax of the proposed BPMN extension
Fig. 7 An example of supporting IT infrastructure
In order to create graphical models with the extended
BPMN, the extended syntax has to be specified by providing
visual representations, i.e., graphical symbols and textual
labels that express their behavior. The proposed notation is
depicted in Fig. 6. Fig. 6.a shows: (i) a core BPMN Task, (ii) a
Monitored Task, and (iii) a Measuring Event which can be
connected to a data source. Fig. 6.b shows a sample of
Monitored Task, which is measured in terms of total duration.
The data sources are connected to the KPI via two measuring
events attached at the beginning and the end of the activity.
Each event provides the instant of time. In case of a KPI value
which does not satisfy the conformity condition, a duration
exception event is triggered, and an exception handling
activity can be executed, as the corresponding action.
IV. A SUPPORTING IT INFRASTRUCTURE
The strength of BPMN resides in two important aspects.
First, its simplicity, which is due to the abstraction level
provided by the standard. Second, the possibility of being
translated (in an automatic manner) into a business execution
language, and then to generate a machine-readable prototype
of business processes [11]. Indeed, BPMN is supported with
an internal model that enables the generation of executable
programs in Web Service Business Process Execution
Language (WSBPEL), a language for specifying business
process behavior based on web services. Thus, BPMN
represents a standardized bridge for the gap between the
business process design and implementation.
In this section, we introduce an IT infrastructure to support
our PS approach. To this aim, let us consider the architectural
view shown in. Fig. 7. Here, different Terminal Units (TU) are
comprised, equipped with RFID readers, to serve as data
source. Indeed, a TU gathers data and transmits them to a
Storage Unit (SU). SUs keep data supplied by TUs, according
to defined KPIs. Analysis Units (AUs) harvest data supplied
by SUs and compute the KPIs. TUs can be hosted by a mobile
device (e.g., PDA or smart phone equipped with an RFID
reader), or fixed device (e.g., bank reader, door gate reader).
TUs are configured on the basis of the deployed BPMN
model, via some Configuration Units (CUs). CUs contain also
the definitions of the quality features requested by AUs. Thus,
for instance, when quality attributes have to be inserted, the
TU is automatically configured by the corresponding CU so as
to show appropriate interface widgets.
The presented IT infrastructure is based on a distributed
architecture in which data is managed according to a “pull”
model, in which data is stored according to computation of
particular KPIs. According to the service-oriented paradigm,
the communication between SUs and AUs relies on an
asynchronous message-centric protocol, which provides a
robust interaction mechanism among peers, based on the
SOAP/HTTP stack (ISO 15000-2). On the other hand, the
communication between TU and the other units can be
proficiently achieved using a more efficient and lightweight
XML-RPC/HTTP based interaction. Finally, the
communication between RFID readers and tags is based on the
EPC standard (e.g., ISO 18000-3) [12].
V. A PILOT SCENARIO
To show an example of our PS approach, in this section we
introduce an excerpt of a Wine Production process taken from
a real-world case study. To this purpose, we take the
perspective of a wine manufacturing company that provides
products on stock and operates in a business-to-business
supply chain environment. Fig. 8 represents the macro
processes in BPMN language, for two distinct lanes: raisin and
white wine. More specifically, the start event in the Raisin
Wine Processor lane indicates that the process starts at the half
of August (timing event). Then, three activities are performed
on the grasp: early harvesting, sun-withering, and storage in
wooden boxes. The second activity is characterized by a
duration of 20-30 days (lower and upper bounds,
respectively). The start event in the White Wine Processor
lane indicates that the process starts in September-October
(the period of vintage) and performs four activities on the
grasp: harvesting, crushing, maceration and pressing. The
third activity is characterized by a duration of 24-48 hours
(lower and upper bounds, respectively). At this point, in the
Raisin Wine Processor lane the raising wine-must is mixed
with part of the white wine-must to allow the subsequent
activity: maceration in base-must, during the next 30-40 days.
Subsequently, the base-must is processed by fermentation,
pressing (at 4-5 °C) and decantation. Then, it is mixed with
the white wine-must, which in the meanwhile has been
processed, in turn, by fermentation (with 50 gr./hl of
Bentonite) and clarifying. The mixed-must is later processed
via aging (36-42 months) and bottling. Finally, quality check
and packing activity is carried out, including the control of the
color intensity of the raisin wine, which should be between 5.3
and 6.6 in (intensity). The end event indicates where the
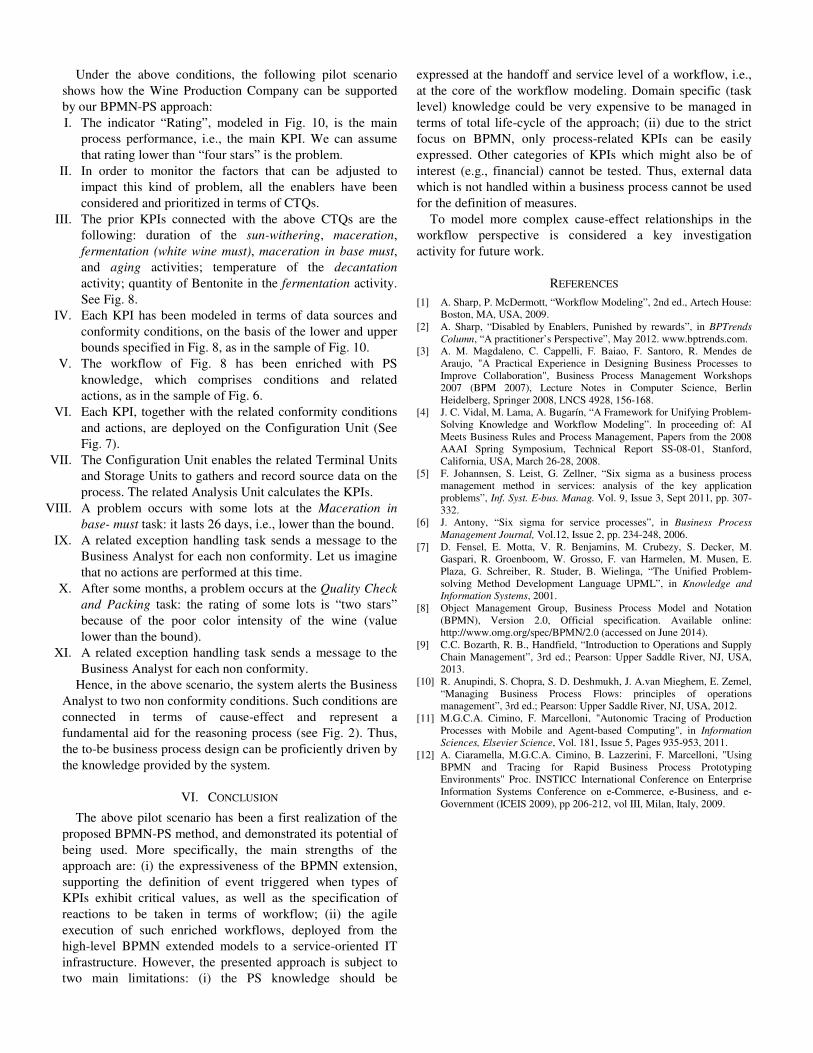
process ends and where final product is made. Fig. 9 shows
the packing room (on the left) and two IT devices used to
collect data source: an RFID reader for tracking the instant of
time when each box is completed (on the top-right), and a
mobile device to report non conformities related to the quality
check and packing task. Fig. 10 shows the BPMN extended
data objects related to two KPIs of the quality check and
packing task: Average Wine Rating and Average Color
Intensity. The former is a sortable categorical feature, ranging
from “one star” to “five star” and expressing the quality of the
wine, whereas the latter is a numerical feature. The target
values of the features are four-five stars and 5.3-6.6 in,
respectively.
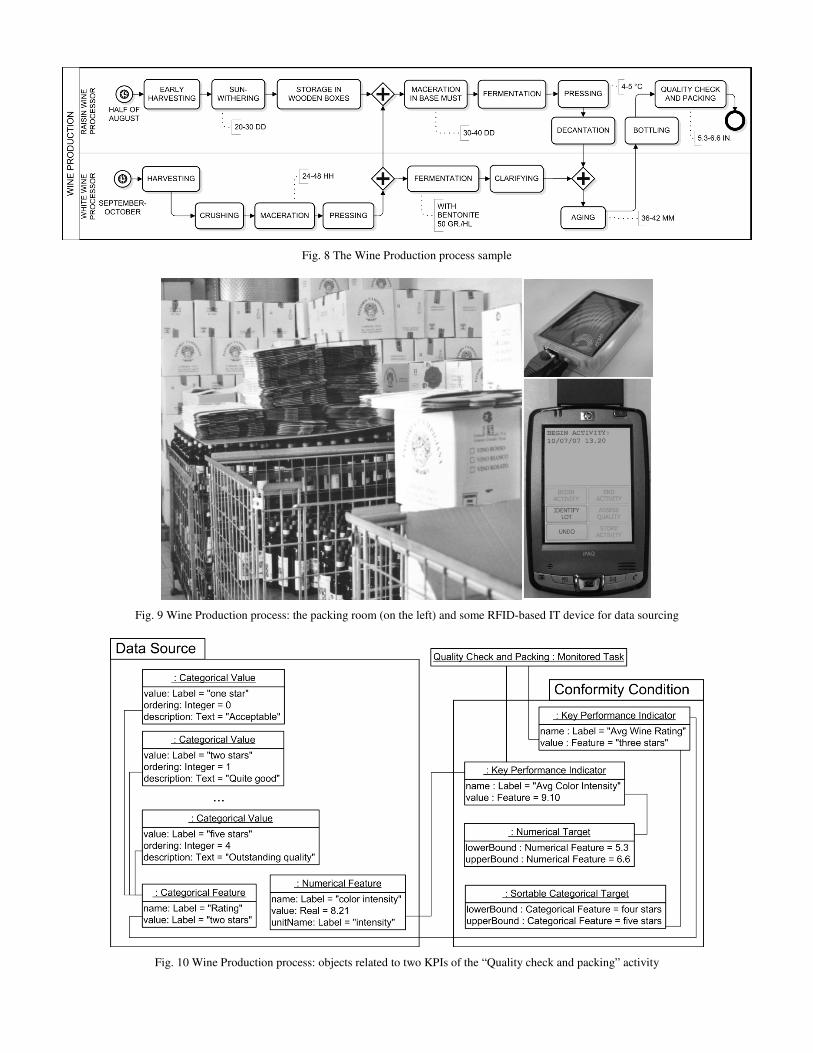
Fig. 8 The Wine Production process sample
Fig. 9 Wine Production process: the packing room (on the left) and some RFID-based IT device for data sourcing
Fig. 10 Wine Production process: objects related to two KPIs of the “Quality check and packing” activity
Under the above conditions, the following pilot scenario
shows how the Wine Production Company can be supported
by our BPMN-PS approach:
I. The indicator “Rating”, modeled in Fig. 10, is the main
process performance, i.e., the main KPI. We can assume
that rating lower than “four stars” is the problem.
II. In order to monitor the factors that can be adjusted to
impact this kind of problem, all the enablers have been
considered and prioritized in terms of CTQs.
III. The prior KPIs connected with the above CTQs are the
following: duration of the sun-withering, maceration,
fermentation (white wine must), maceration in base must,
and aging activities; temperature of the decantation
activity; quantity of Bentonite in the fermentation activity.
See Fig. 8.
IV. Each KPI has been modeled in terms of data sources and
conformity conditions, on the basis of the lower and upper
bounds specified in Fig. 8, as in the sample of Fig. 10.
V. The workflow of Fig. 8 has been enriched with PS
knowledge, which comprises conditions and related
actions, as in the sample of Fig. 6.
VI. Each KPI, together with the related conformity conditions
and actions, are deployed on the Configuration Unit (See
Fig. 7).
VII. The Configuration Unit enables the related Terminal Units
and Storage Units to gathers and record source data on the
process. The related Analysis Unit calculates the KPIs.
VIII. A problem occurs with some lots at the Maceration in
base- must task: it lasts 26 days, i.e., lower than the bound.
IX. A related exception handling task sends a message to the
Business Analyst for each non conformity. Let us imagine
that no actions are performed at this time.
X. After some months, a problem occurs at the Quality Check
and Packing task: the rating of some lots is “two stars”
because of the poor color intensity of the wine (value
lower than the bound).
XI. A related exception handling task sends a message to the
Business Analyst for each non conformity.
Hence, in the above scenario, the system alerts the Business
Analyst to two non conformity conditions. Such conditions are
connected in terms of cause-effect and represent a
fundamental aid for the reasoning process (see Fig. 2). Thus,
the to-be business process design can be proficiently driven by
the knowledge provided by the system.
VI. CONCLUSION
The above pilot scenario has been a first realization of the
proposed BPMN-PS method, and demonstrated its potential of
being used. More specifically, the main strengths of the
approach are: (i) the expressiveness of the BPMN extension,
supporting the definition of event triggered when types of
KPIs exhibit critical values, as well as the specification of
reactions to be taken in terms of workflow; (ii) the agile
execution of such enriched workflows, deployed from the
high-level BPMN extended models to a service-oriented IT
infrastructure. However, the presented approach is subject to
two main limitations: (i) the PS knowledge should be
expressed at the handoff and service level of a workflow, i.e.,
at the core of the workflow modeling. Domain specific (task
level) knowledge could be very expensive to be managed in
terms of total life-cycle of the approach; (ii) due to the strict
focus on BPMN, only process-related KPIs can be easily
expressed. Other categories of KPIs which might also be of
interest (e.g., financial) cannot be tested. Thus, external data
which is not handled within a business process cannot be used
for the definition of measures.
To model more complex cause-effect relationships in the
workflow perspective is considered a key investigation
activity for future work.
REFERENCES
[1] A. Sharp, P. McDermott, “Workflow Modeling”, 2nd ed., Artech House: Boston, MA, USA, 2009.
[2] A. Sharp, “Disabled by Enablers, Punished by rewards”, in BPTrends
Column, “A practitioner’s Perspective”, May 2012. www.bptrends.com. [3] A. M. Magdaleno, C. Cappelli, F. Baiao, F. Santoro, R. Mendes de
Araujo, "A Practical Experience in Designing Business Processes to Improve Collaboration", Business Process Management Workshops 2007 (BPM 2007), Lecture Notes in Computer Science, Berlin Heidelberg, Springer 2008, LNCS 4928, 156-168.
[4] J. C. Vidal, M. Lama, A. Bugarín, “A Framework for Unifying Problem-Solving Knowledge and Workflow Modeling”. In proceeding of: AI Meets Business Rules and Process Management, Papers from the 2008 AAAI Spring Symposium, Technical Report SS-08-01, Stanford, California, USA, March 26-28, 2008.
[5] F. Johannsen, S. Leist, G. Zellner, “Six sigma as a business process management method in services: analysis of the key application problems”, Inf. Syst. E-bus. Manag. Vol. 9, Issue 3, Sept 2011, pp. 307-332.
[6] J. Antony, “Six sigma for service processes”, in Business Process
Management Journal, Vol.12, Issue 2, pp. 234-248, 2006. [7] D. Fensel, E. Motta, V. R. Benjamins, M. Crubezy, S. Decker, M.
Gaspari, R. Groenboom, W. Grosso, F. van Harmelen, M. Musen, E. Plaza, G. Schreiber, R. Studer, B. Wielinga, “The Unified Problem-solving Method Development Language UPML”, in Knowledge and
Information Systems, 2001. [8] Object Management Group, Business Process Model and Notation
(BPMN), Version 2.0, Official specification. Available online: http://www.omg.org/spec/BPMN/2.0 (accessed on June 2014).
[9] C.C. Bozarth, R. B., Handfield, “Introduction to Operations and Supply Chain Management”, 3rd ed.; Pearson: Upper Saddle River, NJ, USA, 2013.
[10] R. Anupindi, S. Chopra, S. D. Deshmukh, J. A.van Mieghem, E. Zemel, “Managing Business Process Flows: principles of operations management”, 3rd ed.; Pearson: Upper Saddle River, NJ, USA, 2012.
[11] M.G.C.A. Cimino, F. Marcelloni, "Autonomic Tracing of Production Processes with Mobile and Agent-based Computing", in Information
Sciences, Elsevier Science, Vol. 181, Issue 5, Pages 935-953, 2011. [12] A. Ciaramella, M.G.C.A. Cimino, B. Lazzerini, F. Marcelloni, "Using
BPMN and Tracing for Rapid Business Process Prototyping Environments" Proc. INSTICC International Conference on Enterprise Information Systems Conference on e-Commerce, e-Business, and e-Government (ICEIS 2009), pp 206-212, vol III, Milan, Italy, 2009.