Embed Size (px)
Citation preview
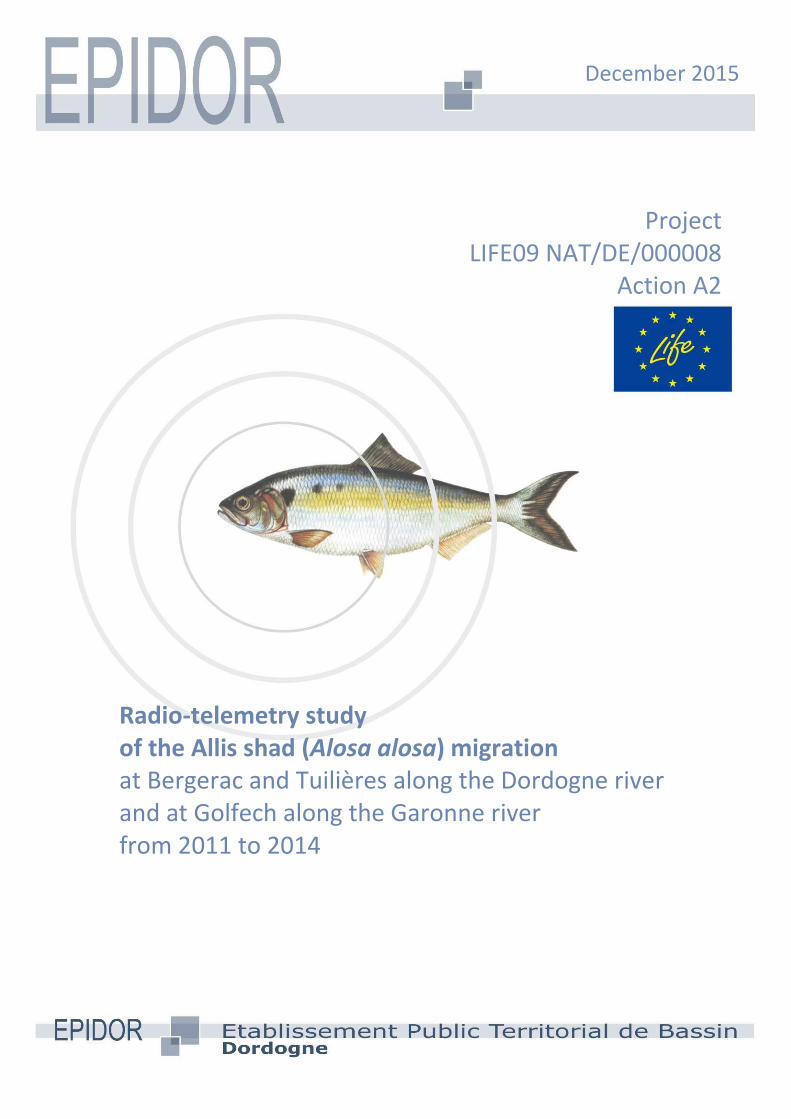
December 2015
Project LIFE09 NAT/DE/000008
Action A2
Radio-telemetry study of the Allis shad (Alosa alosa) migration at Bergerac and Tuilières along the Dordogne river and at Golfech along the Garonne river from 2011 to 2014


EPIDOR 2015 - LIFE+ Shad, action A2 3
Pascal VERDEYROUX EPIDOR (Etablissement Public Territorial Dordogne) Olivier GUERRI EPIDOR (Etablissement Public Territorial Dordogne) Matthieu CHANSEAU ONEMA (Office National de l’Eau et des Milieux Aquatiques) Jérémy CAZEAUX Université de Poitiers - Licence professionnelle Usages et Qualité des Eaux Flavien FAUVEL Université Bordeaux 1 - M1 Sciences de la Terre Environnement et Ecologie Floriane BOGUN Université de la Rochelle - M1 Sciences pour l’environnement Arnaud DESMOULIN Université de Tours - M2 Ingénierie des Hydrosystèmes et des Bassins Versants Coralie TARRENE Université de Pau et des Pays de l’Adour - M1 Dynamique des écosystèmes aquatiques Thomas NICOLE Université de Limoges - Licence pro. Diagnostic et Aménagement des Ressources en Eau Antoine DUBOIS Université de Limoges - Licence pro. Diagnostic et Aménagement des Ressources en Eau Julien RAYNAL Université de Tours – M2 Ingénierie des Hydrosystèmes et des Bassins Versants
December 2015
EPIDOR 2015 - LIFE+ Shad, action A2 4
Table of contents
INTRODUCTION .................................................................................................................... 6
SECTION A: CONTEXT AND AIMS OF THE STUDY ...................................................................... 7
1. CONTEXT : THE LIFE PROJECT ........................................................................................................................ 7 1.1. BACKGROUND ................................................................................................................................................. 7 1.2. ACTIONS ........................................................................................................................................................ 7 1.3. ORGANIZATION OF THE ACTION A2 OF THE SHAD LIFE+ PROGRAM ............................................................................. 8
1.3.1. Project management ...................................................................................................................... 8 1.3.2. Technical collaboration ................................................................................................................... 8
2. AIMS OF THE STUDY .................................................................................................................................... 8
SECTION B : MATERIAL AND METHOD ..................................................................................... 9
1. STUDY SITES .............................................................................................................................................. 9 1.1. GEOGRAPHICAL SITUATION ................................................................................................................................. 9 1.2. CONCERNED STRUCTURES ................................................................................................................................. 10
1.2.1. Golfech .......................................................................................................................................... 10 1.2.2. Bergerac ........................................................................................................................................ 12 1.2.3. Tuilières ......................................................................................................................................... 13 1.2.4. Mauzac ......................................................................................................................................... 14
1.3. OVERVIEW .................................................................................................................................................... 15 1.4. THE SITUATION OF THE ALLIS SHAD SPAWNING GROUNDS ........................................................................................ 15
2. THE RADIO-TELEMETRY PRINCIPLE ................................................................................................................. 16 3. SHAD TAGGING ........................................................................................................................................ 16
3.1. CAPTURE ...................................................................................................................................................... 16 3.1.1. Garonne ........................................................................................................................................ 16 3.1.2. Dordogne ...................................................................................................................................... 17
3.2. TAGGING ...................................................................................................................................................... 18 3.2.1. Anesthesia ..................................................................................................................................... 18 3.2.2. Transmitters .................................................................................................................................. 18 3.2.3. Insertion ........................................................................................................................................ 19
3.3. FISH TRANSPORT AND RELEASE .......................................................................................................................... 20 4. RADIO-TELEMETRY .................................................................................................................................... 21
4.1. MANUAL MONITORING .................................................................................................................................... 21 4.2. FIXED TRACKING ............................................................................................................................................. 21
SECTION C : MIGRATIONS AND CAPTURES ............................................................................. 22
1. MIGRATIONS ........................................................................................................................................... 22 2. CAPTURE, TAGGING, AND RELEASE ................................................................................................................ 23 3. BIOMETRICS ............................................................................................................................................ 23
EPIDOR 2015 - LIFE+ Shad, action A2 5
SECTION D : RESULTS ............................................................................................................. 24
1. MANUAL TRACKING .................................................................................................................................. 24 2. TRACKINGS AROUND GOLFECH ..................................................................................................................... 25
2.1. ZONING OF THE GOLFECH SITE ........................................................................................................................... 25 2.2. THE TRACKED FISH .......................................................................................................................................... 26 2.3. BEHAVIOR ANALYSIS ........................................................................................................................................ 26 2.4. THE OPERATION OF THE GOLFECH PLANT ............................................................................................................. 28 2.5. THE OPERATION OF THE FISH LIFT ....................................................................................................................... 28
3. TRACKINGS AROUND BERGERAC ................................................................................................................... 29 3.1. ZONING OF THE BERGERAC SITE ......................................................................................................................... 29 3.2. THE TRACKED FISH .......................................................................................................................................... 30 3.3. BEHAVIOR ANALYSIS ........................................................................................................................................ 30 3.4. THE OPERATION OF THE BERGERAC PLANT ............................................................................................................ 30
4. TRACKINGS AT TUILIÈRES ............................................................................................................................ 32 4.1. ZONING OF THE TUILIÈRES SITE .......................................................................................................................... 32 4.2. THE TRACKED FISH .......................................................................................................................................... 33 4.3. BEHAVIOR ANALYSIS ........................................................................................................................................ 33 4.4. THE OPERATION OF THE TUILIÈRES PLANT ............................................................................................................. 35 4.5. THE OPERATION OF THE FISH LIFT ....................................................................................................................... 35
5. SITES TRACKING REVIEW ............................................................................................................................. 36
SECTION E : DISCUSSION ......................................................................................................... 37
1. SHADS GENERAL BEHAVIOR ......................................................................................................................... 37 2. DISPLACEMENT ALONG THE AXES .................................................................................................................. 37 3. BEHAVIOR AT THE BASE OF THE STRUCTURES ................................................................................................... 38 4. SHADS BEHAVIOR AT GOLFECH ..................................................................................................................... 38
4.1. ATTRACTIVENESS OF ENTRANCES ........................................................................................................................ 38 4.2. EASE OF ENTRY INTO THE PASS ........................................................................................................................... 38 4.3. PROGRESSION IN THE PASS ............................................................................................................................... 39 4.4. POSSIBLE IMPROVEMENTS ................................................................................................................................ 39
5. SHADS BEHAVIOR AT BERGERAC ................................................................................................................... 40 5.1. ENTRANCE ATTRACTIVENESS.............................................................................................................................. 40 5.2. EASE ENTERING THE PASS ................................................................................................................................. 40 5.3. PROGRESSION IN THE PASS ............................................................................................................................... 40 5.4. POSSIBLE IMPROVEMENTS ................................................................................................................................ 40
6. SHADS BEHAVIOR AT TUILIÈRES .................................................................................................................... 41 6.1. ENTRANCE AND DOWNSTREAM MIGRATION VALVE ATTRACTIVENESS ........................................................................... 41 6.2. EASE OF ENTRY INTO THE PASS ........................................................................................................................... 42 6.3. POSSIBLE IMPROVEMENTS ................................................................................................................................ 42
7. SUMMARY RESULTS ................................................................................................................................... 42
CONCLUSION ....................................................................................................................... 43
BIBLIOGRAPHY
EPIDOR 2015 - LIFE+ Shad, action A2 6
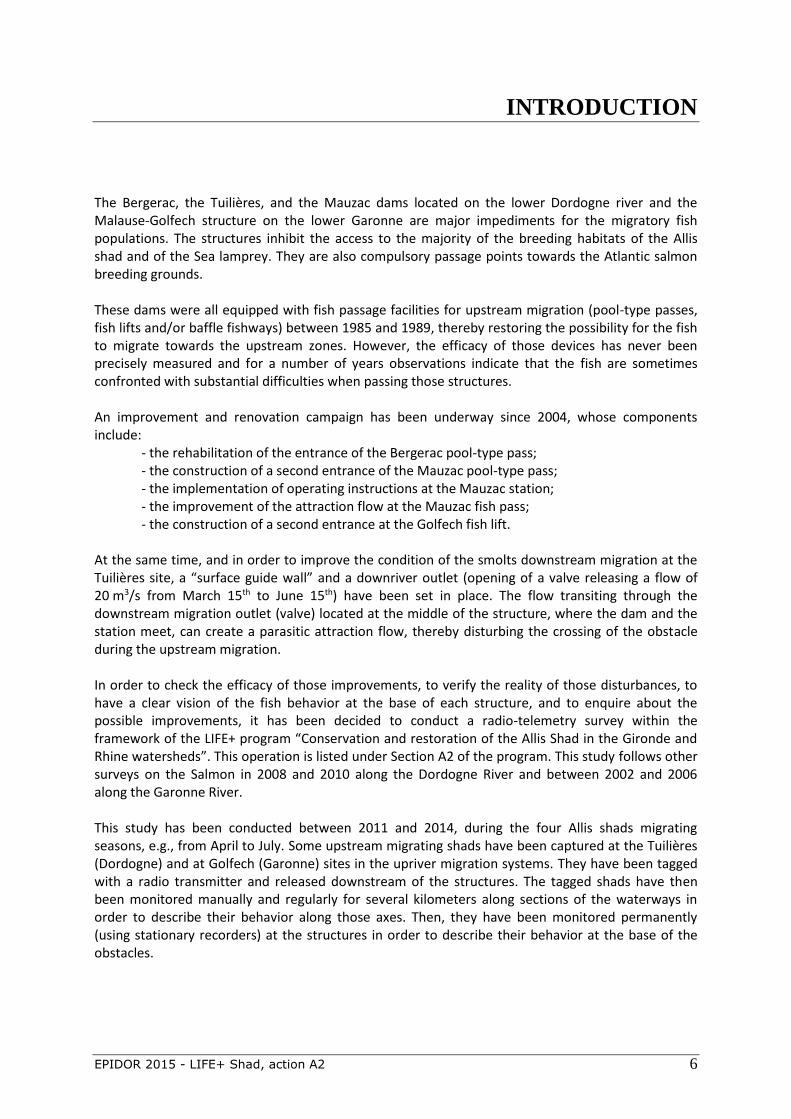
INTRODUCTION The Bergerac, the Tuilières, and the Mauzac dams located on the lower Dordogne river and the Malause-Golfech structure on the lower Garonne are major impediments for the migratory fish populations. The structures inhibit the access to the majority of the breeding habitats of the Allis shad and of the Sea lamprey. They are also compulsory passage points towards the Atlantic salmon breeding grounds. These dams were all equipped with fish passage facilities for upstream migration (pool-type passes, fish lifts and/or baffle fishways) between 1985 and 1989, thereby restoring the possibility for the fish to migrate towards the upstream zones. However, the efficacy of those devices has never been precisely measured and for a number of years observations indicate that the fish are sometimes confronted with substantial difficulties when passing those structures. An improvement and renovation campaign has been underway since 2004, whose components include: - the rehabilitation of the entrance of the Bergerac pool-type pass; - the construction of a second entrance of the Mauzac pool-type pass; - the implementation of operating instructions at the Mauzac station; - the improvement of the attraction flow at the Mauzac fish pass; - the construction of a second entrance at the Golfech fish lift. At the same time, and in order to improve the condition of the smolts downstream migration at the Tuilières site, a “surface guide wall” and a downriver outlet (opening of a valve releasing a flow of 20 m3/s from March 15th to June 15th) have been set in place. The flow transiting through the downstream migration outlet (valve) located at the middle of the structure, where the dam and the station meet, can create a parasitic attraction flow, thereby disturbing the crossing of the obstacle during the upstream migration. In order to check the efficacy of those improvements, to verify the reality of those disturbances, to have a clear vision of the fish behavior at the base of each structure, and to enquire about the possible improvements, it has been decided to conduct a radio-telemetry survey within the framework of the LIFE+ program “Conservation and restoration of the Allis Shad in the Gironde and Rhine watersheds”. This operation is listed under Section A2 of the program. This study follows other surveys on the Salmon in 2008 and 2010 along the Dordogne River and between 2002 and 2006 along the Garonne River. This study has been conducted between 2011 and 2014, during the four Allis shads migrating seasons, e.g., from April to July. Some upstream migrating shads have been captured at the Tuilières (Dordogne) and at Golfech (Garonne) sites in the upriver migration systems. They have been tagged with a radio transmitter and released downstream of the structures. The tagged shads have then been monitored manually and regularly for several kilometers along sections of the waterways in order to describe their behavior along those axes. Then, they have been monitored permanently (using stationary recorders) at the structures in order to describe their behavior at the base of the obstacles.
EPIDOR 2015 - LIFE+ Shad, action A2 7
Section A: Context and aims of the study
1. Context : the LIFE project
1.1. Background From 2008 to 2010, a LIFE program has been carried out to reestablish the Allis shad in the Rhine River using fries from the Garonne-Dordogne. It has been managed by the National Office for Nature, the Environment and of Consumer Protection of North Rhine-Westphalia (LANUV). The steady decrease of the Dordogne-Garonne Allis shad population, observed in recent years, followed by its subsequent collapse in 2006 and 2007, has led several partners to express concerns. In this context, a new Franco-German project has been developed for 2011-2015, within the LIFE+ programs framework. The European Commission approved the project in June 2010.
1.2. Actions Besides the continuation of the shads reestablishment actions in the Rhine River, this second project includes a section, which deals with the Garonne-Dordogne Allis shad populations: ■ Action A1 : « Updating knowledge on the shad fish passes » It meant to assess existing knowledge of the shad fish passes, based in particular on the work done across the Atlantic. This action has been conducted by ONEMA (National Office for Water and Aquatic Environment). ■ Action A2 : « Study of the shad free circulation on the downstream section of the Garonne and the Dordogne axes » This action corresponds to the present study, led by EPIDOR (Interdepartmental Public Authority for the Dordogne Basin or EPTB Dordogne). It aimed at evaluating the crossing conditions at the Golfech (Garonne), Bergerac, Tuilières, and Mauzac (Dordogne) facilities. The radio-telemetric method has been chosen because it is the best suited to understand the shad behavior at the base of those facilities. ■ Action E4 : « Juvenile Allis shads monitoring on the downstream section of the Garonne and the Dordogne axes » Led by SMEAG (Joint Association for the Study and Management of the Garonne River or EPTB Garonne), this action aimed to understand the functionality of the spawning grounds located along the downstream sections of the migratory axes and to link it with specific environmental data. It was also about better understanding the juvenile stage, in particular their favorite habitats, and to design an indicator allowing for the estimation of the natural reproduction success. These three studies have been conducted in partnership in with the EPTB Garonne and Dordogne, ONEMA, EDF and MIGADO, in the framework of “An Agreement for the implementation of the Shad LIFE+ program 2011-2015”. As such, all partners are involved in the general implementation of the project actions, including analysis and reporting (article 3 of the agreement).
EPIDOR 2015 - LIFE+ Shad, action A2 8
1.3. Organization of the Action A2 of the Shad LIFE+ Program
1.3.1. Project management Action A2 management is provided by EPIDOR (Interdepartmental Public Authority for the Dordogne Basin) in collaboration with EDF, ONEMA, SMEAG and MIGADO. The study concerning the Golfech site, on the Garonne, is the object of an agreement with the SMEAG (or EPTB Garonne). Action E4 is conducted by this EPTB on both axes. Both actions have been conducted over the course of four years (from 2011 to 2014).
1.3.2. Technical collaboration The study is conducted in collaboration with ONEMA (South-West Interregional Delegation and Ecohydraulics Pole), which provides radio-telemetry equipment and brings technical and methodological support to the primary contractor. The Association MIGADO (Garonne Dordogne Migrators), brings technical and logistical support during the transport of the shads. EDF is involved in the providing of the radio-telemetry equipment, its installation, its calibration, as well as the interpretation and the treatment of the monitoring data. Access to structures and workspaces is provided by EDF. Moreover, EDF provides data regarding the hydroelectric plants operations. The scientific monitoring is provided by a group composed of EPIDOR, ONEMA, MIGADO, and EDF.
2. Aims of the study The study aims to:
1) determine the impacts of the Golfech structure on the Garonne and of the Bergerac, Tuilières, and Mauzac structures on the Dordogne, on the Allis shad during its upstream migration,
2) describe the fish behavior at the base of the structures in order to propose solutions that would reduce the impacts on the migration.
EPIDOR 2015 - LIFE+ Shad, action A2 9
Section B : Material and method
1. Study sites
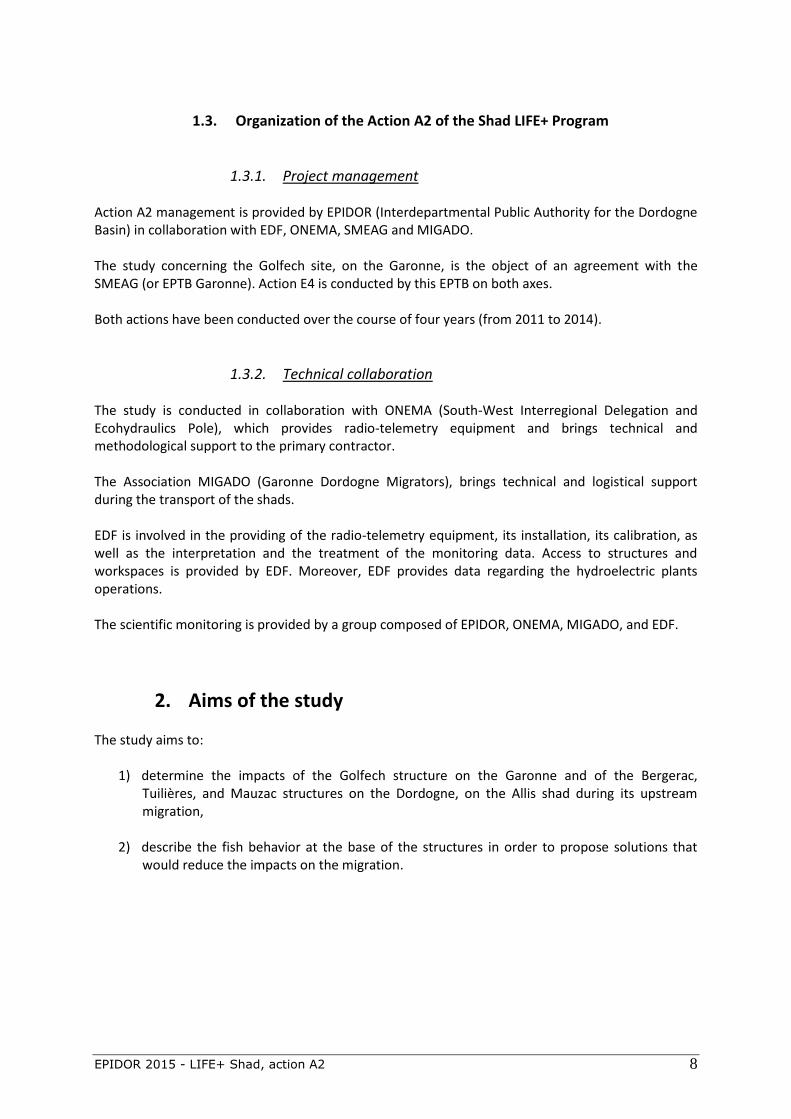
1.1. Geographical situation The Garonne-Dordogne basin is made of two main axes, the Garonne and the Dordogne that meet at the Bec d’Ambès to form the Gironde estuary. This study focuses on the first of the downstream structures along these axes (pic. 1).
Pic. 1: Garonne-Dordogne basin and studied structures (ONEMA, BD Carthage).
Adour-Garonne administrative basin
Garonne-Dordogne hydrographic basin
EPIDOR 2015 - LIFE+ Shad, action A2 10
1.2. Concerned structures
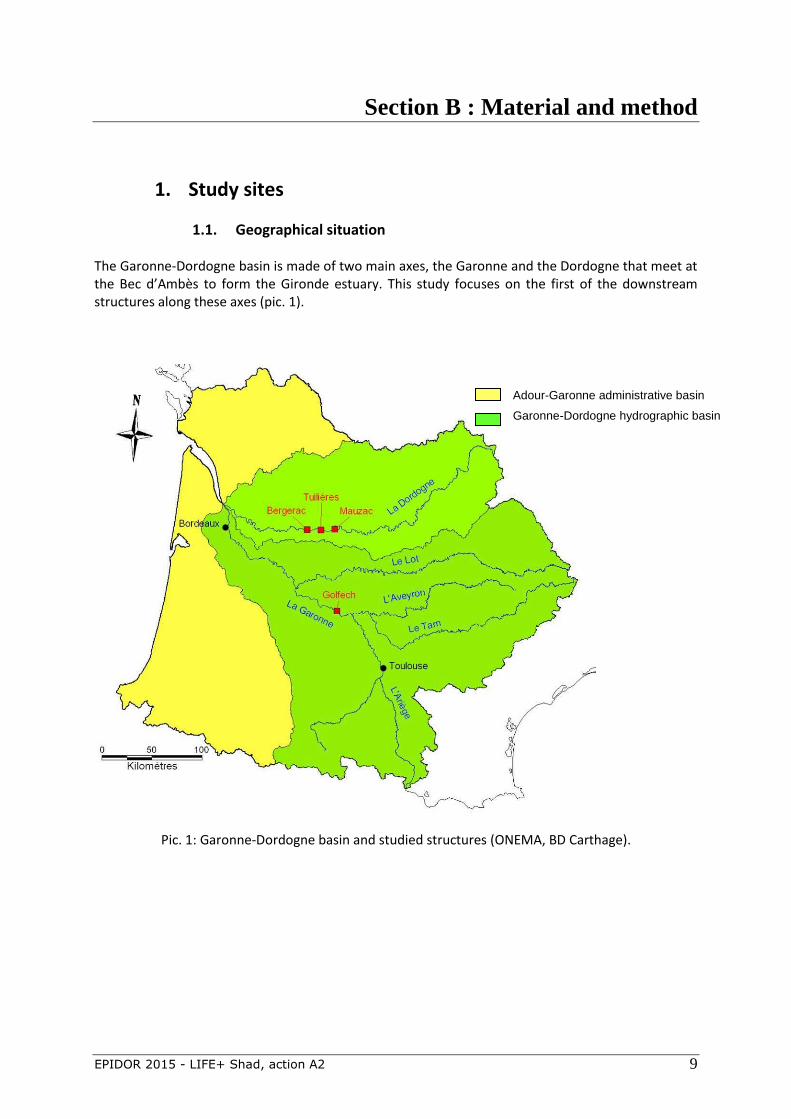
1.2.1. Golfech The so-called “Malause-Golfech” structure was put into service in 1973. It consists of a dam (Malause), of a 10 km long intake channel, and of a hydroelectric power plant (Golfech). This power plant is made of three bulb type generating units with a design flow of 540 m3/s. The turbine flow rejoins the Garonne via a 1.8 km outlet channel. The bypassed river segment is 15 km long and includes 5 anti-erosion thresholds, which makes it together with the dam, impassable for the shads.
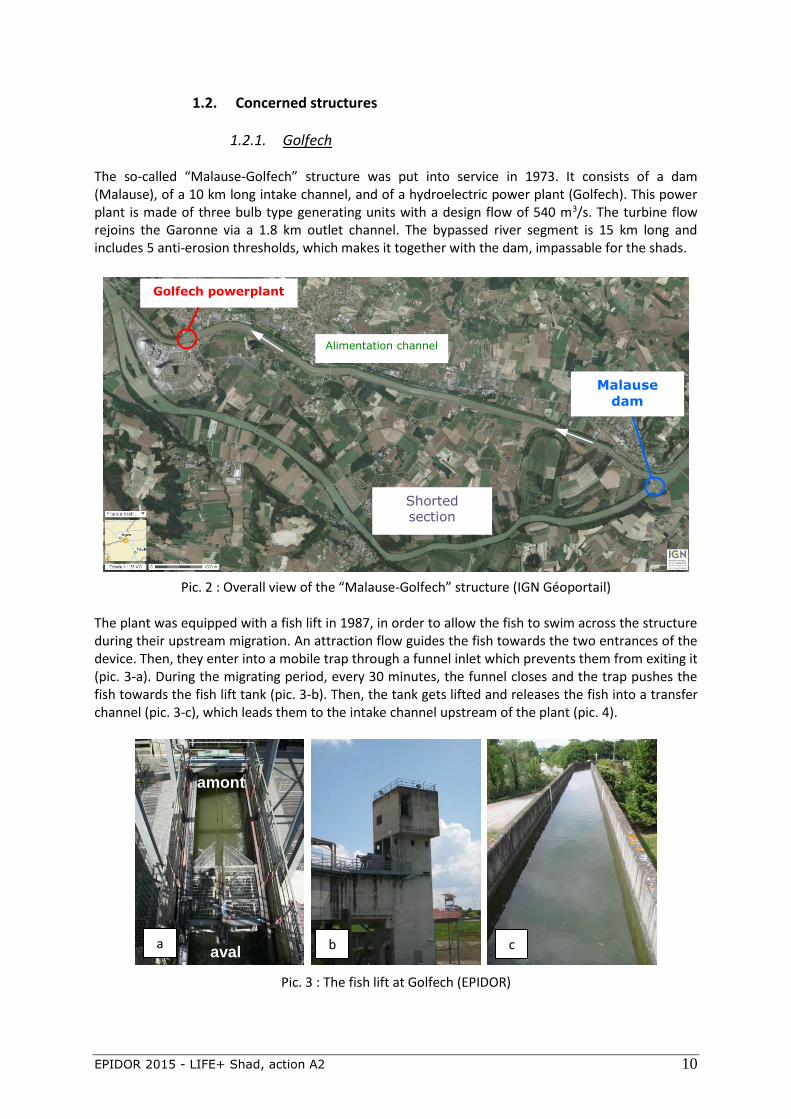
Pic. 2 : Overall view of the “Malause-Golfech” structure (IGN Géoportail) The plant was equipped with a fish lift in 1987, in order to allow the fish to swim across the structure during their upstream migration. An attraction flow guides the fish towards the two entrances of the device. Then, they enter into a mobile trap through a funnel inlet which prevents them from exiting it (pic. 3-a). During the migrating period, every 30 minutes, the funnel closes and the trap pushes the fish towards the fish lift tank (pic. 3-b). Then, the tank gets lifted and releases the fish into a transfer channel (pic. 3-c), which leads them to the intake channel upstream of the plant (pic. 4).
Pic. 3 : The fish lift at Golfech (EPIDOR)
a b c
Golfech powerplant
Malause
dam
Alimentation channel
Shorted section
aval
amont
EPIDOR 2015 - LIFE+ Shad, action A2 11
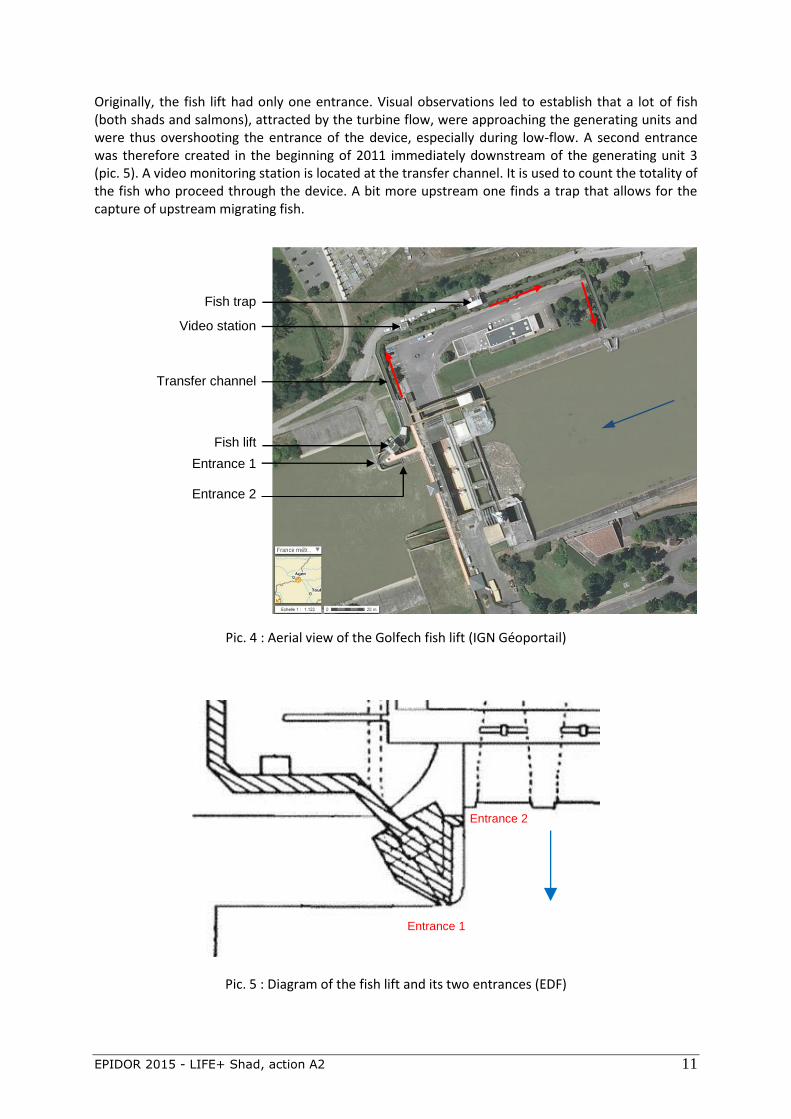
Originally, the fish lift had only one entrance. Visual observations led to establish that a lot of fish (both shads and salmons), attracted by the turbine flow, were approaching the generating units and were thus overshooting the entrance of the device, especially during low-flow. A second entrance was therefore created in the beginning of 2011 immediately downstream of the generating unit 3 (pic. 5). A video monitoring station is located at the transfer channel. It is used to count the totality of the fish who proceed through the device. A bit more upstream one finds a trap that allows for the capture of upstream migrating fish.
Pic. 4 : Aerial view of the Golfech fish lift (IGN Géoportail)
Pic. 5 : Diagram of the fish lift and its two entrances (EDF)
Entrance 1
Entrance 2
Fish trap
Video station
Transfer channel
Fish lift
Entrance 1
Entrance 2
EPIDOR 2015 - LIFE+ Shad, action A2 12
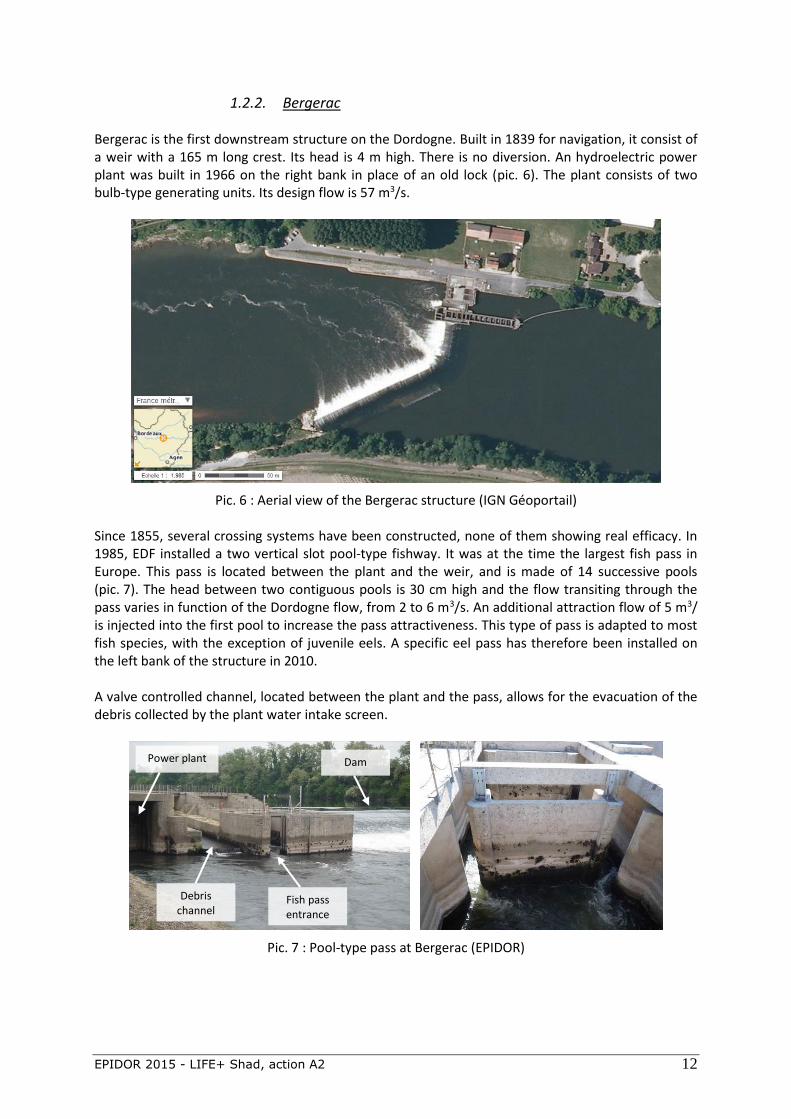
1.2.2. Bergerac Bergerac is the first downstream structure on the Dordogne. Built in 1839 for navigation, it consist of a weir with a 165 m long crest. Its head is 4 m high. There is no diversion. An hydroelectric power plant was built in 1966 on the right bank in place of an old lock (pic. 6). The plant consists of two bulb-type generating units. Its design flow is 57 m3/s.
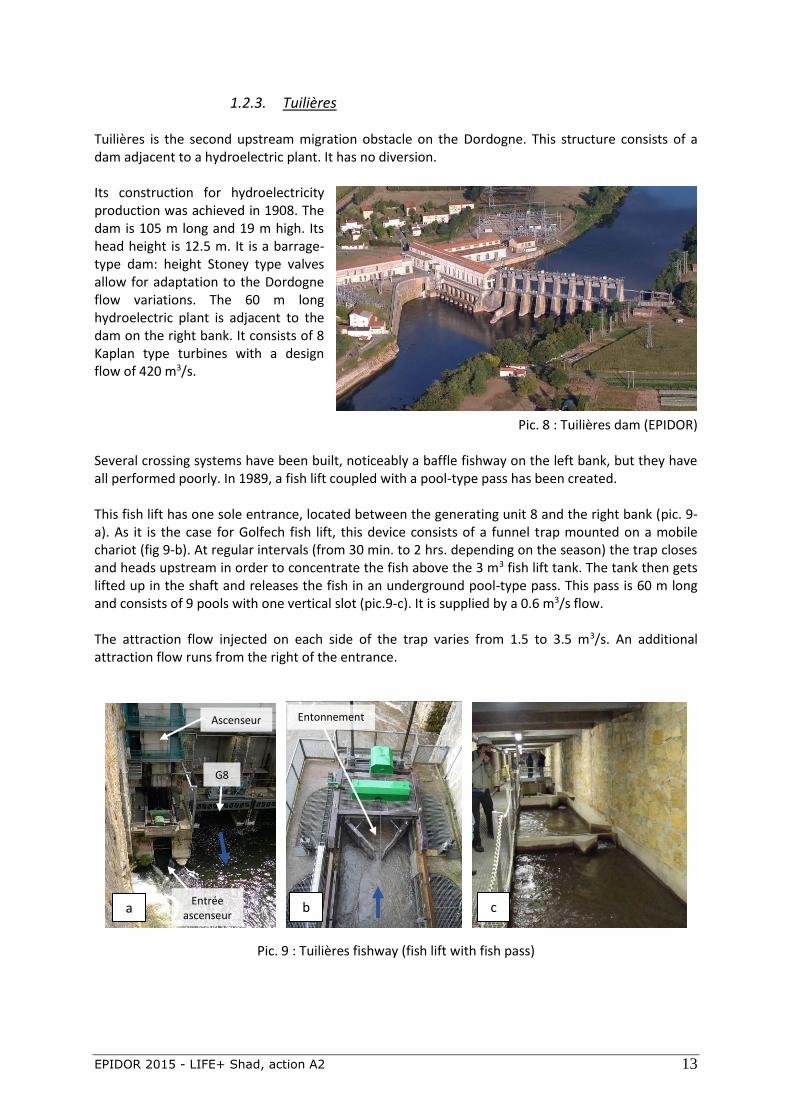
Pic. 6 : Aerial view of the Bergerac structure (IGN Géoportail) Since 1855, several crossing systems have been constructed, none of them showing real efficacy. In 1985, EDF installed a two vertical slot pool-type fishway. It was at the time the largest fish pass in Europe. This pass is located between the plant and the weir, and is made of 14 successive pools (pic. 7). The head between two contiguous pools is 30 cm high and the flow transiting through the pass varies in function of the Dordogne flow, from 2 to 6 m3/s. An additional attraction flow of 5 m3/ is injected into the first pool to increase the pass attractiveness. This type of pass is adapted to most fish species, with the exception of juvenile eels. A specific eel pass has therefore been installed on the left bank of the structure in 2010. A valve controlled channel, located between the plant and the pass, allows for the evacuation of the debris collected by the plant water intake screen.
Pic. 7 : Pool-type pass at Bergerac (EPIDOR)
Fish pass entrance
Debris channel
Dam Power plant
EPIDOR 2015 - LIFE+ Shad, action A2 13
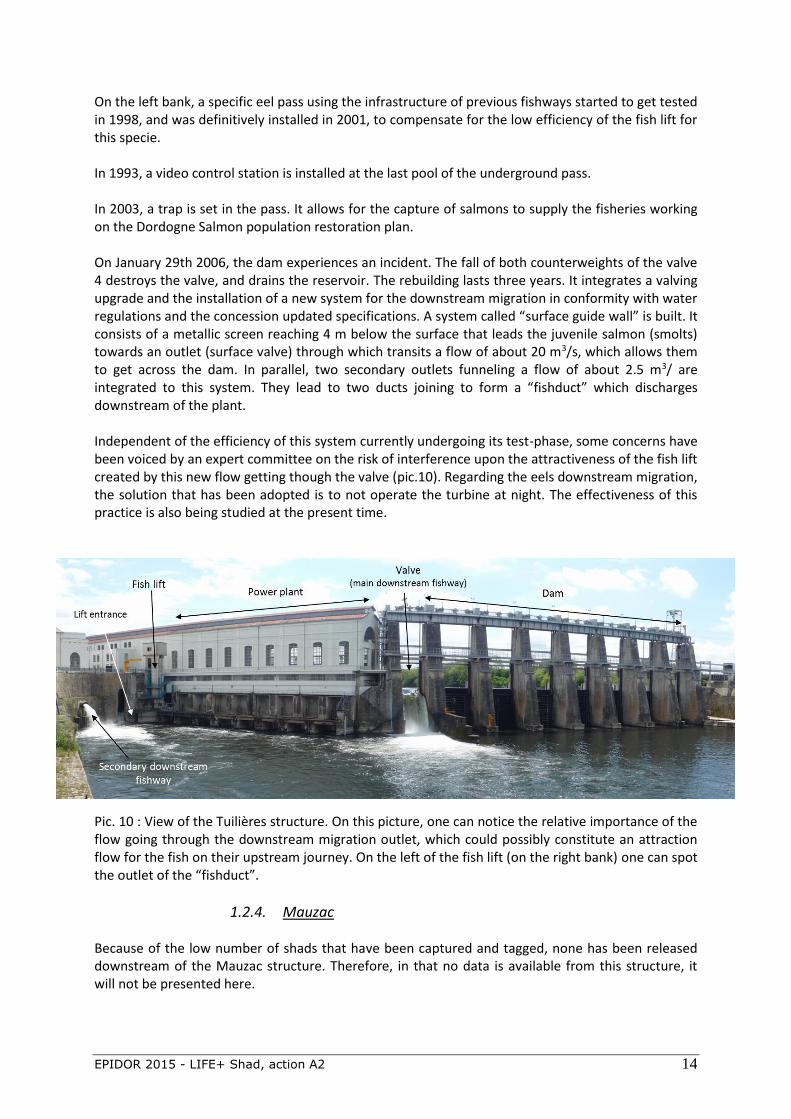
1.2.3. Tuilières Tuilières is the second upstream migration obstacle on the Dordogne. This structure consists of a dam adjacent to a hydroelectric plant. It has no diversion. Its construction for hydroelectricity production was achieved in 1908. The dam is 105 m long and 19 m high. Its head height is 12.5 m. It is a barrage-type dam: height Stoney type valves allow for adaptation to the Dordogne flow variations. The 60 m long hydroelectric plant is adjacent to the dam on the right bank. It consists of 8 Kaplan type turbines with a design flow of 420 m3/s.
Pic. 8 : Tuilières dam (EPIDOR) Several crossing systems have been built, noticeably a baffle fishway on the left bank, but they have all performed poorly. In 1989, a fish lift coupled with a pool-type pass has been created. This fish lift has one sole entrance, located between the generating unit 8 and the right bank (pic. 9-a). As it is the case for Golfech fish lift, this device consists of a funnel trap mounted on a mobile chariot (fig 9-b). At regular intervals (from 30 min. to 2 hrs. depending on the season) the trap closes and heads upstream in order to concentrate the fish above the 3 m3 fish lift tank. The tank then gets lifted up in the shaft and releases the fish in an underground pool-type pass. This pass is 60 m long and consists of 9 pools with one vertical slot (pic.9-c). It is supplied by a 0.6 m3/s flow. The attraction flow injected on each side of the trap varies from 1.5 to 3.5 m3/s. An additional attraction flow runs from the right of the entrance.
Pic. 9 : Tuilières fishway (fish lift with fish pass)
a b c
Entonnement
Entrée ascenseur
G8
Ascenseur
EPIDOR 2015 - LIFE+ Shad, action A2 14
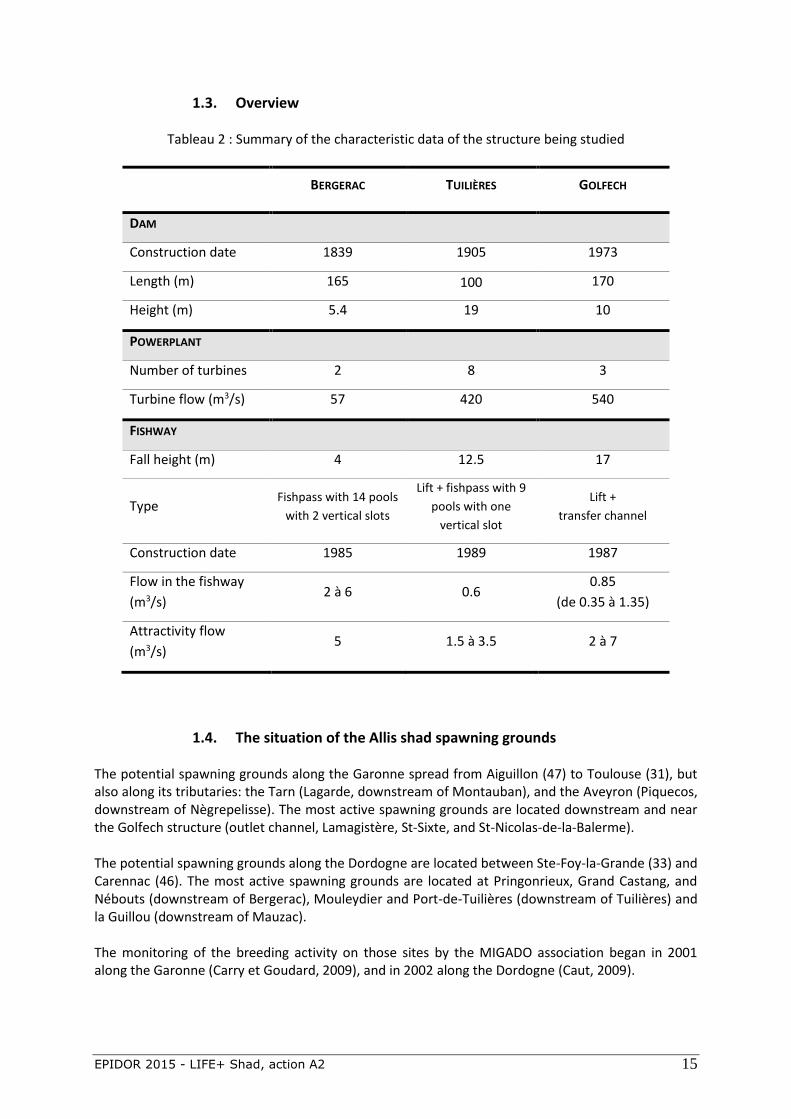
On the left bank, a specific eel pass using the infrastructure of previous fishways started to get tested in 1998, and was definitively installed in 2001, to compensate for the low efficiency of the fish lift for this specie. In 1993, a video control station is installed at the last pool of the underground pass. In 2003, a trap is set in the pass. It allows for the capture of salmons to supply the fisheries working on the Dordogne Salmon population restoration plan. On January 29th 2006, the dam experiences an incident. The fall of both counterweights of the valve 4 destroys the valve, and drains the reservoir. The rebuilding lasts three years. It integrates a valving upgrade and the installation of a new system for the downstream migration in conformity with water regulations and the concession updated specifications. A system called “surface guide wall” is built. It consists of a metallic screen reaching 4 m below the surface that leads the juvenile salmon (smolts) towards an outlet (surface valve) through which transits a flow of about 20 m3/s, which allows them to get across the dam. In parallel, two secondary outlets funneling a flow of about 2.5 m3/ are integrated to this system. They lead to two ducts joining to form a “fishduct” which discharges downstream of the plant. Independent of the efficiency of this system currently undergoing its test-phase, some concerns have been voiced by an expert committee on the risk of interference upon the attractiveness of the fish lift created by this new flow getting though the valve (pic.10). Regarding the eels downstream migration, the solution that has been adopted is to not operate the turbine at night. The effectiveness of this practice is also being studied at the present time.
Pic. 10 : View of the Tuilières structure. On this picture, one can notice the relative importance of the flow going through the downstream migration outlet, which could possibly constitute an attraction flow for the fish on their upstream journey. On the left of the fish lift (on the right bank) one can spot the outlet of the “fishduct”.
1.2.4. Mauzac Because of the low number of shads that have been captured and tagged, none has been released downstream of the Mauzac structure. Therefore, in that no data is available from this structure, it will not be presented here.
EPIDOR 2015 - LIFE+ Shad, action A2 15
1.3. Overview
Tableau 2 : Summary of the characteristic data of the structure being studied
BERGERAC TUILIÈRES GOLFECH
DAM
Construction date 1839 1905 1973
Length (m) 165 100 170
Height (m) 5.4 19 10
POWERPLANT
Number of turbines 2 8 3
Turbine flow (m3/s) 57 420 540
FISHWAY
Fall height (m) 4 12.5 17
Type Fishpass with 14 pools
with 2 vertical slots
Lift + fishpass with 9
pools with one
vertical slot
Lift +
transfer channel
Construction date 1985 1989 1987
Flow in the fishway
(m3/s) 2 à 6 0.6
0.85
(de 0.35 à 1.35)
Attractivity flow
(m3/s) 5 1.5 à 3.5 2 à 7
1.4. The situation of the Allis shad spawning grounds The potential spawning grounds along the Garonne spread from Aiguillon (47) to Toulouse (31), but also along its tributaries: the Tarn (Lagarde, downstream of Montauban), and the Aveyron (Piquecos, downstream of Nègrepelisse). The most active spawning grounds are located downstream and near the Golfech structure (outlet channel, Lamagistère, St-Sixte, and St-Nicolas-de-la-Balerme). The potential spawning grounds along the Dordogne are located between Ste-Foy-la-Grande (33) and Carennac (46). The most active spawning grounds are located at Pringonrieux, Grand Castang, and Nébouts (downstream of Bergerac), Mouleydier and Port-de-Tuilières (downstream of Tuilières) and la Guillou (downstream of Mauzac). The monitoring of the breeding activity on those sites by the MIGADO association began in 2001 along the Garonne (Carry et Goudard, 2009), and in 2002 along the Dordogne (Caut, 2009).
EPIDOR 2015 - LIFE+ Shad, action A2 16
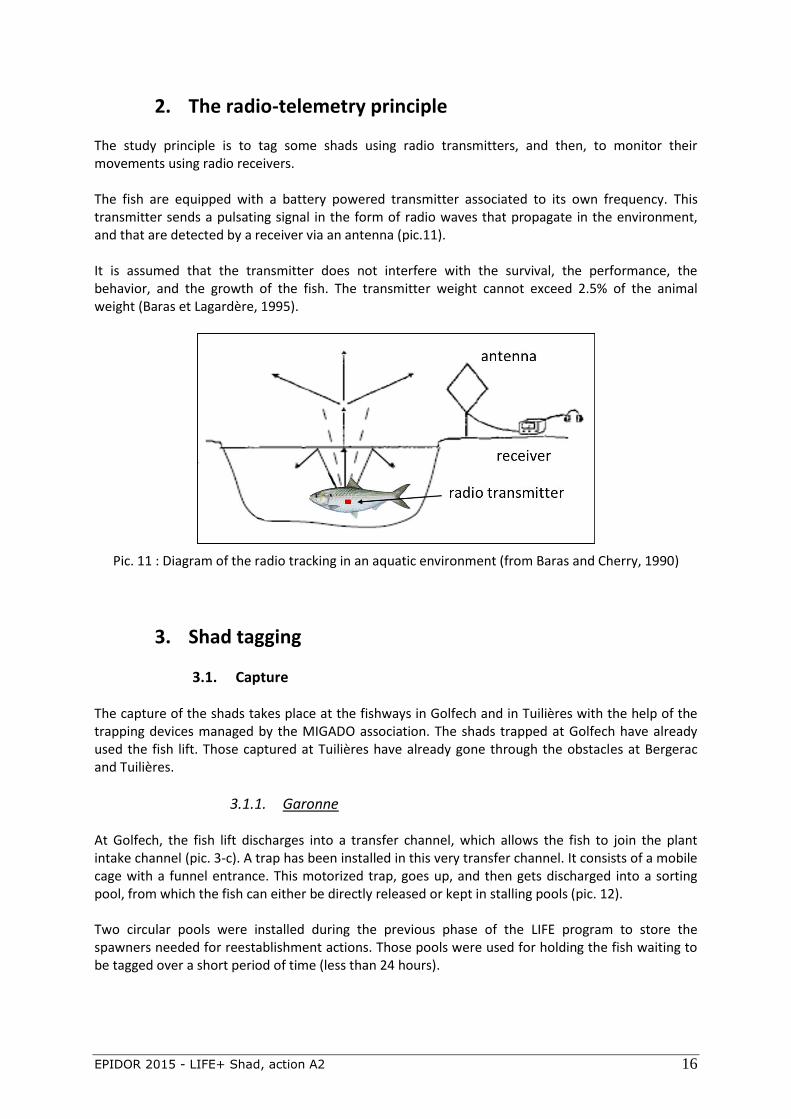
2. The radio-telemetry principle The study principle is to tag some shads using radio transmitters, and then, to monitor their movements using radio receivers. The fish are equipped with a battery powered transmitter associated to its own frequency. This transmitter sends a pulsating signal in the form of radio waves that propagate in the environment, and that are detected by a receiver via an antenna (pic.11). It is assumed that the transmitter does not interfere with the survival, the performance, the behavior, and the growth of the fish. The transmitter weight cannot exceed 2.5% of the animal weight (Baras et Lagardère, 1995).
Pic. 11 : Diagram of the radio tracking in an aquatic environment (from Baras and Cherry, 1990)
3. Shad tagging
3.1. Capture The capture of the shads takes place at the fishways in Golfech and in Tuilières with the help of the trapping devices managed by the MIGADO association. The shads trapped at Golfech have already used the fish lift. Those captured at Tuilières have already gone through the obstacles at Bergerac and Tuilières.
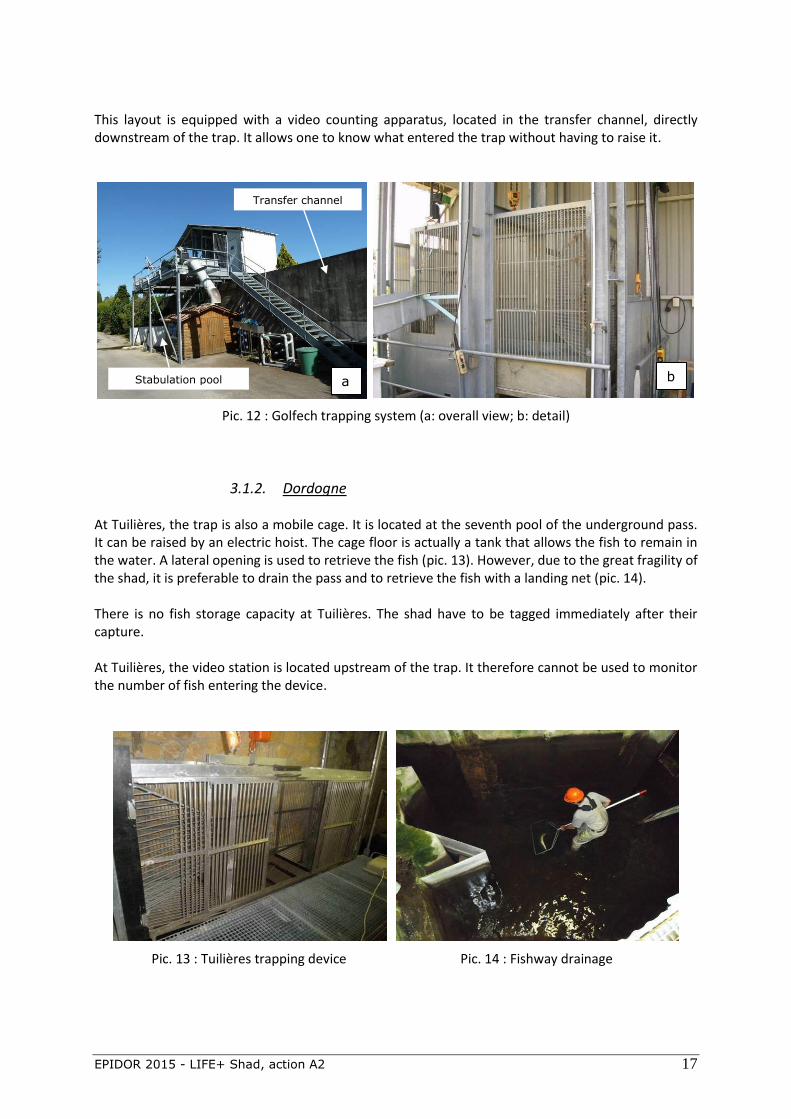
3.1.1. Garonne At Golfech, the fish lift discharges into a transfer channel, which allows the fish to join the plant intake channel (pic. 3-c). A trap has been installed in this very transfer channel. It consists of a mobile cage with a funnel entrance. This motorized trap, goes up, and then gets discharged into a sorting pool, from which the fish can either be directly released or kept in stalling pools (pic. 12). Two circular pools were installed during the previous phase of the LIFE program to store the spawners needed for reestablishment actions. Those pools were used for holding the fish waiting to be tagged over a short period of time (less than 24 hours).
bassin Adour-Garonne
EPIDOR 2015 - LIFE+ Shad, action A2 17
This layout is equipped with a video counting apparatus, located in the transfer channel, directly downstream of the trap. It allows one to know what entered the trap without having to raise it.
Pic. 12 : Golfech trapping system (a: overall view; b: detail)
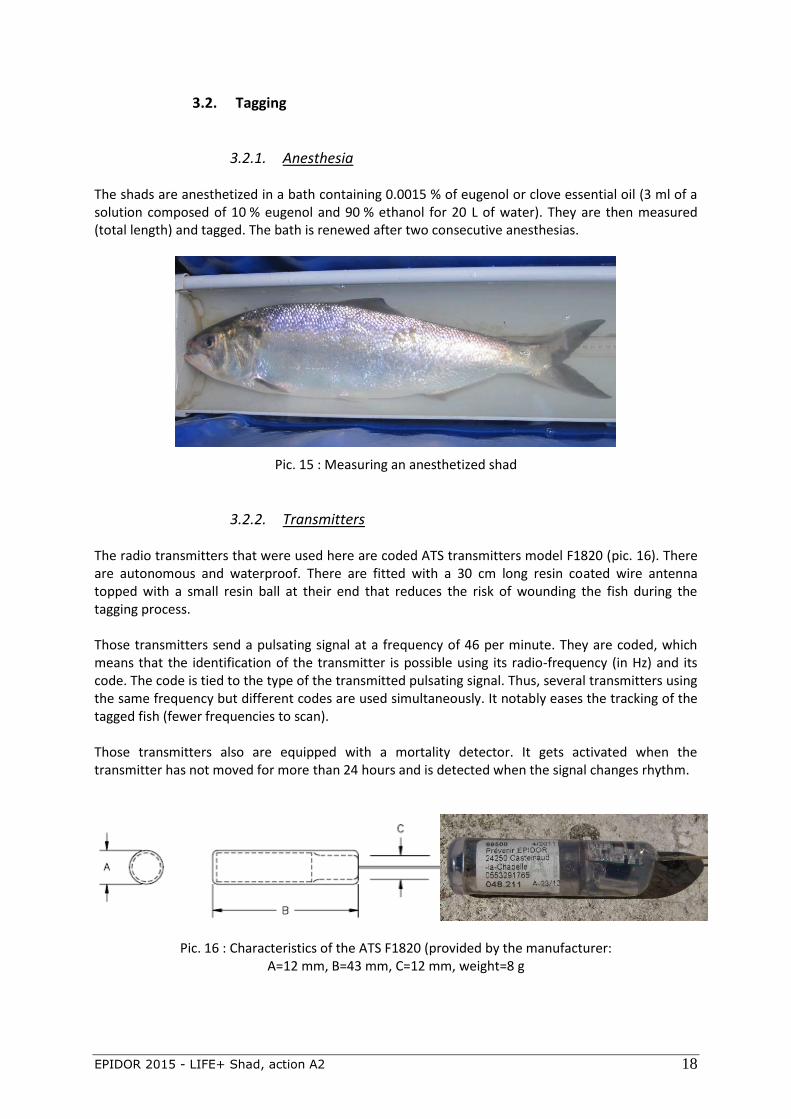
3.1.2. Dordogne At Tuilières, the trap is also a mobile cage. It is located at the seventh pool of the underground pass. It can be raised by an electric hoist. The cage floor is actually a tank that allows the fish to remain in the water. A lateral opening is used to retrieve the fish (pic. 13). However, due to the great fragility of the shad, it is preferable to drain the pass and to retrieve the fish with a landing net (pic. 14). There is no fish storage capacity at Tuilières. The shad have to be tagged immediately after their capture. At Tuilières, the video station is located upstream of the trap. It therefore cannot be used to monitor the number of fish entering the device.
Pic. 13 : Tuilières trapping device Pic. 14 : Fishway drainage
Stabulation pool
Transfer channel
a b
EPIDOR 2015 - LIFE+ Shad, action A2 18
3.2. Tagging
3.2.1. Anesthesia The shads are anesthetized in a bath containing 0.0015 % of eugenol or clove essential oil (3 ml of a solution composed of 10 % eugenol and 90 % ethanol for 20 L of water). They are then measured (total length) and tagged. The bath is renewed after two consecutive anesthesias.
Pic. 15 : Measuring an anesthetized shad
3.2.2. Transmitters The radio transmitters that were used here are coded ATS transmitters model F1820 (pic. 16). There are autonomous and waterproof. There are fitted with a 30 cm long resin coated wire antenna topped with a small resin ball at their end that reduces the risk of wounding the fish during the tagging process. Those transmitters send a pulsating signal at a frequency of 46 per minute. They are coded, which means that the identification of the transmitter is possible using its radio-frequency (in Hz) and its code. The code is tied to the type of the transmitted pulsating signal. Thus, several transmitters using the same frequency but different codes are used simultaneously. It notably eases the tracking of the tagged fish (fewer frequencies to scan). Those transmitters also are equipped with a mortality detector. It gets activated when the transmitter has not moved for more than 24 hours and is detected when the signal changes rhythm.
Pic. 16 : Characteristics of the ATS F1820 (provided by the manufacturer: A=12 mm, B=43 mm, C=12 mm, weight=8 g
EPIDOR 2015 - LIFE+ Shad, action A2 19
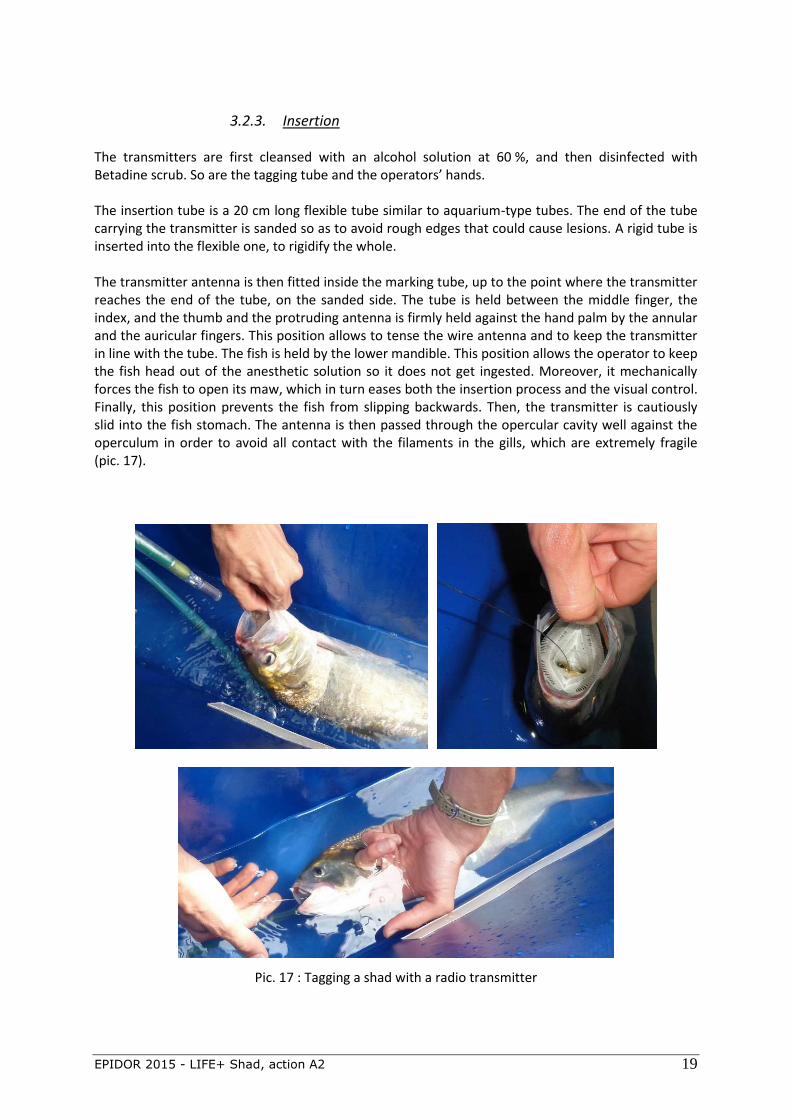
3.2.3. Insertion The transmitters are first cleansed with an alcohol solution at 60 %, and then disinfected with Betadine scrub. So are the tagging tube and the operators’ hands. The insertion tube is a 20 cm long flexible tube similar to aquarium-type tubes. The end of the tube carrying the transmitter is sanded so as to avoid rough edges that could cause lesions. A rigid tube is inserted into the flexible one, to rigidify the whole. The transmitter antenna is then fitted inside the marking tube, up to the point where the transmitter reaches the end of the tube, on the sanded side. The tube is held between the middle finger, the index, and the thumb and the protruding antenna is firmly held against the hand palm by the annular and the auricular fingers. This position allows to tense the wire antenna and to keep the transmitter in line with the tube. The fish is held by the lower mandible. This position allows the operator to keep the fish head out of the anesthetic solution so it does not get ingested. Moreover, it mechanically forces the fish to open its maw, which in turn eases both the insertion process and the visual control. Finally, this position prevents the fish from slipping backwards. Then, the transmitter is cautiously slid into the fish stomach. The antenna is then passed through the opercular cavity well against the operculum in order to avoid all contact with the filaments in the gills, which are extremely fragile (pic. 17).
Pic. 17 : Tagging a shad with a radio transmitter
EPIDOR 2015 - LIFE+ Shad, action A2 20
3.3. Fish transport and release
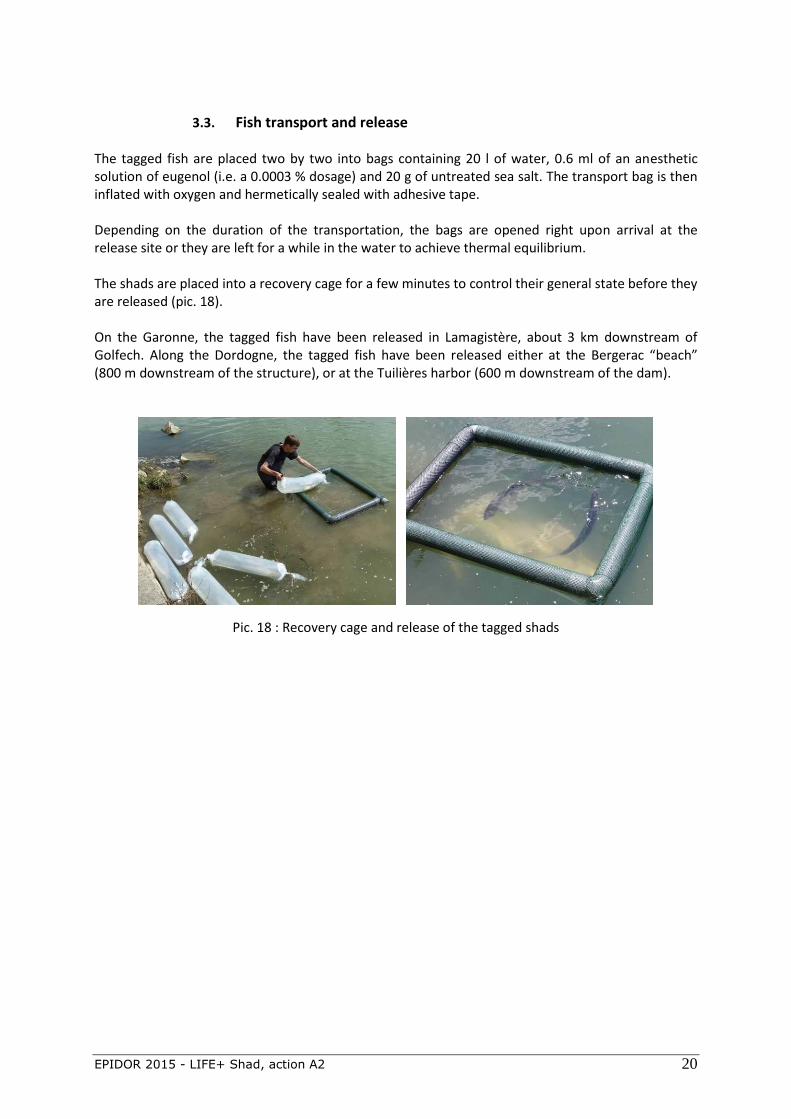
The tagged fish are placed two by two into bags containing 20 l of water, 0.6 ml of an anesthetic solution of eugenol (i.e. a 0.0003 % dosage) and 20 g of untreated sea salt. The transport bag is then inflated with oxygen and hermetically sealed with adhesive tape. Depending on the duration of the transportation, the bags are opened right upon arrival at the release site or they are left for a while in the water to achieve thermal equilibrium. The shads are placed into a recovery cage for a few minutes to control their general state before they are released (pic. 18). On the Garonne, the tagged fish have been released in Lamagistère, about 3 km downstream of Golfech. Along the Dordogne, the tagged fish have been released either at the Bergerac “beach” (800 m downstream of the structure), or at the Tuilières harbor (600 m downstream of the dam).
Pic. 18 : Recovery cage and release of the tagged shads
EPIDOR 2015 - LIFE+ Shad, action A2 21
4. Radio-telemetry The equipment required for radio-telemetry monitoring is provided by the Eco Hydraulic Pole (ONEMA and IMFT) and by EDF. It consist of 26 ATS4500C receptors, with 220V power supply and chargers, loop antennas, and roof antennas.
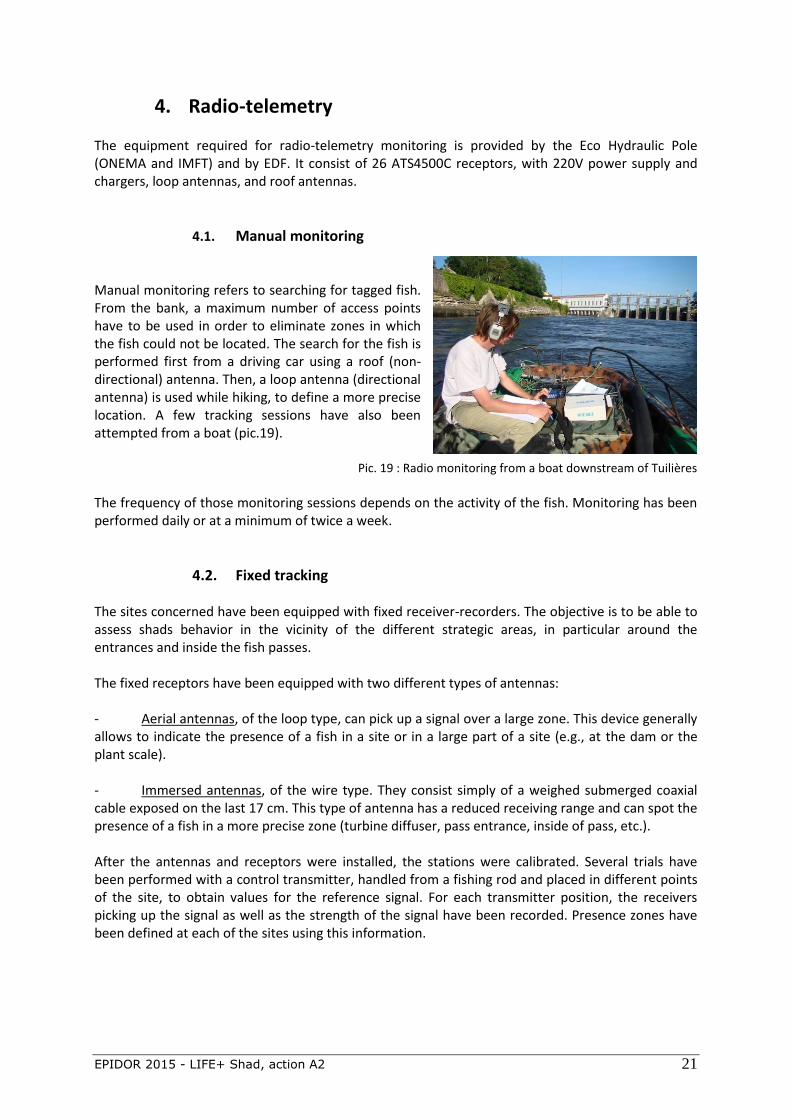
4.1. Manual monitoring Manual monitoring refers to searching for tagged fish. From the bank, a maximum number of access points have to be used in order to eliminate zones in which the fish could not be located. The search for the fish is performed first from a driving car using a roof (non-directional) antenna. Then, a loop antenna (directional antenna) is used while hiking, to define a more precise location. A few tracking sessions have also been attempted from a boat (pic.19).
Pic. 19 : Radio monitoring from a boat downstream of Tuilières
The frequency of those monitoring sessions depends on the activity of the fish. Monitoring has been performed daily or at a minimum of twice a week.
4.2. Fixed tracking The sites concerned have been equipped with fixed receiver-recorders. The objective is to be able to assess shads behavior in the vicinity of the different strategic areas, in particular around the entrances and inside the fish passes. The fixed receptors have been equipped with two different types of antennas: - Aerial antennas, of the loop type, can pick up a signal over a large zone. This device generally allows to indicate the presence of a fish in a site or in a large part of a site (e.g., at the dam or the plant scale). - Immersed antennas, of the wire type. They consist simply of a weighed submerged coaxial cable exposed on the last 17 cm. This type of antenna has a reduced receiving range and can spot the presence of a fish in a more precise zone (turbine diffuser, pass entrance, inside of pass, etc.). After the antennas and receptors were installed, the stations were calibrated. Several trials have been performed with a control transmitter, handled from a fishing rod and placed in different points of the site, to obtain values for the reference signal. For each transmitter position, the receivers picking up the signal as well as the strength of the signal have been recorded. Presence zones have been defined at each of the sites using this information.
EPIDOR 2015 - LIFE+ Shad, action A2 22
Section C : Migrations and captures
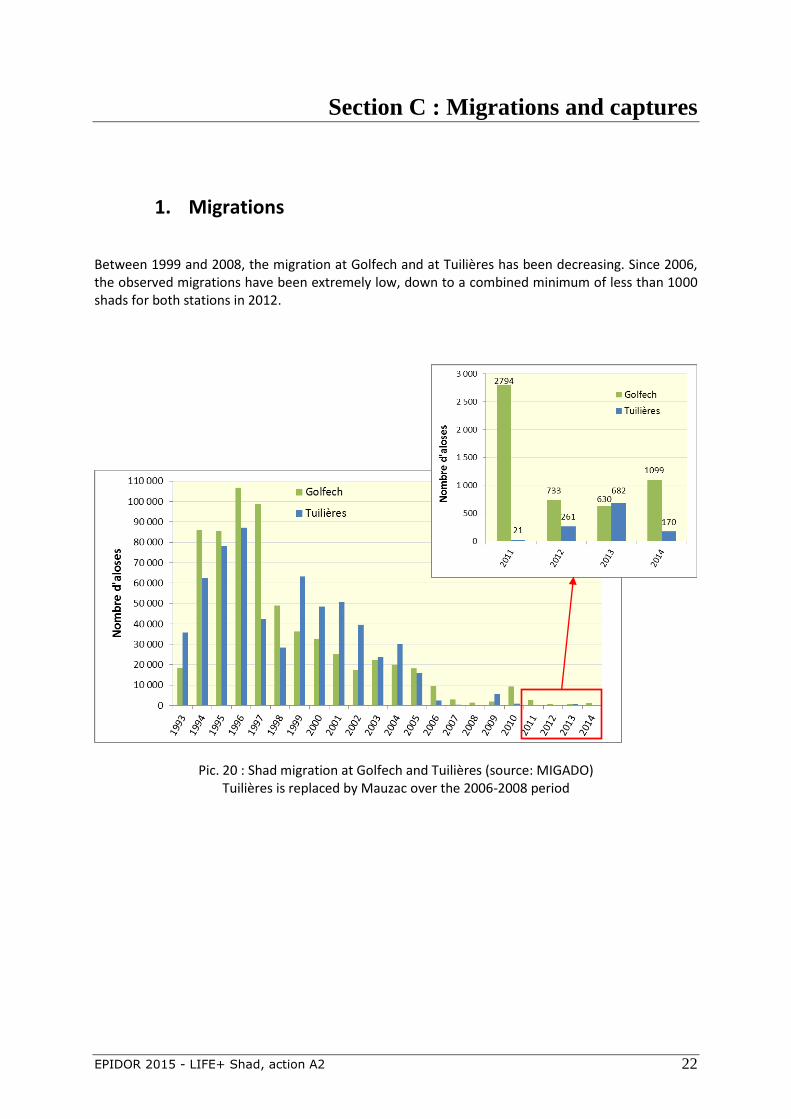
1. Migrations Between 1999 and 2008, the migration at Golfech and at Tuilières has been decreasing. Since 2006, the observed migrations have been extremely low, down to a combined minimum of less than 1000 shads for both stations in 2012.
Pic. 20 : Shad migration at Golfech and Tuilières (source: MIGADO) Tuilières is replaced by Mauzac over the 2006-2008 period
bassin Adour-Garonne
EPIDOR 2015 - LIFE+ Shad, action A2 23
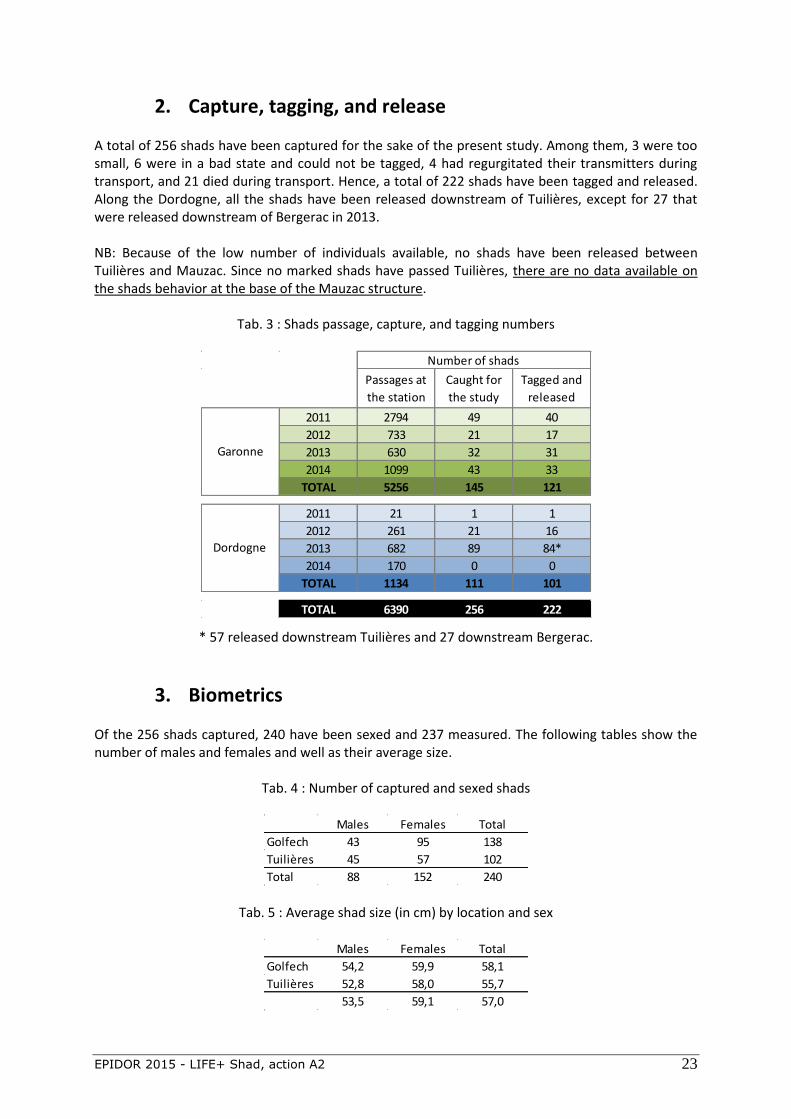
2. Capture, tagging, and release A total of 256 shads have been captured for the sake of the present study. Among them, 3 were too small, 6 were in a bad state and could not be tagged, 4 had regurgitated their transmitters during transport, and 21 died during transport. Hence, a total of 222 shads have been tagged and released. Along the Dordogne, all the shads have been released downstream of Tuilières, except for 27 that were released downstream of Bergerac in 2013. NB: Because of the low number of individuals available, no shads have been released between Tuilières and Mauzac. Since no marked shads have passed Tuilières, there are no data available on the shads behavior at the base of the Mauzac structure.
Tab. 3 : Shads passage, capture, and tagging numbers
Passages at
the station
Caught for
the study
Tagged and
released
2011 2794 49 40
2012 733 21 17
2013 630 32 31
2014 1099 43 33
TOTAL 5256 145 121
2011 21 1 1
2012 261 21 16
2013 682 89 84*
2014 170 0 0
TOTAL 1134 111 101
TOTAL 6390 256 222
Garonne
Dordogne
Number of shads
* 57 released downstream Tuilières and 27 downstream Bergerac.
3. Biometrics Of the 256 shads captured, 240 have been sexed and 237 measured. The following tables show the number of males and females and well as their average size.
Tab. 4 : Number of captured and sexed shads
Males Females Total
Golfech 43 95 138
Tuilières 45 57 102
Total 88 152 240
Tab. 5 : Average shad size (in cm) by location and sex
Males Females Total
Golfech 54,2 59,9 58,1
Tuilières 52,8 58,0 55,7
53,5 59,1 57,0
EPIDOR 2015 - LIFE+ Shad, action A2 24
Section D : Results
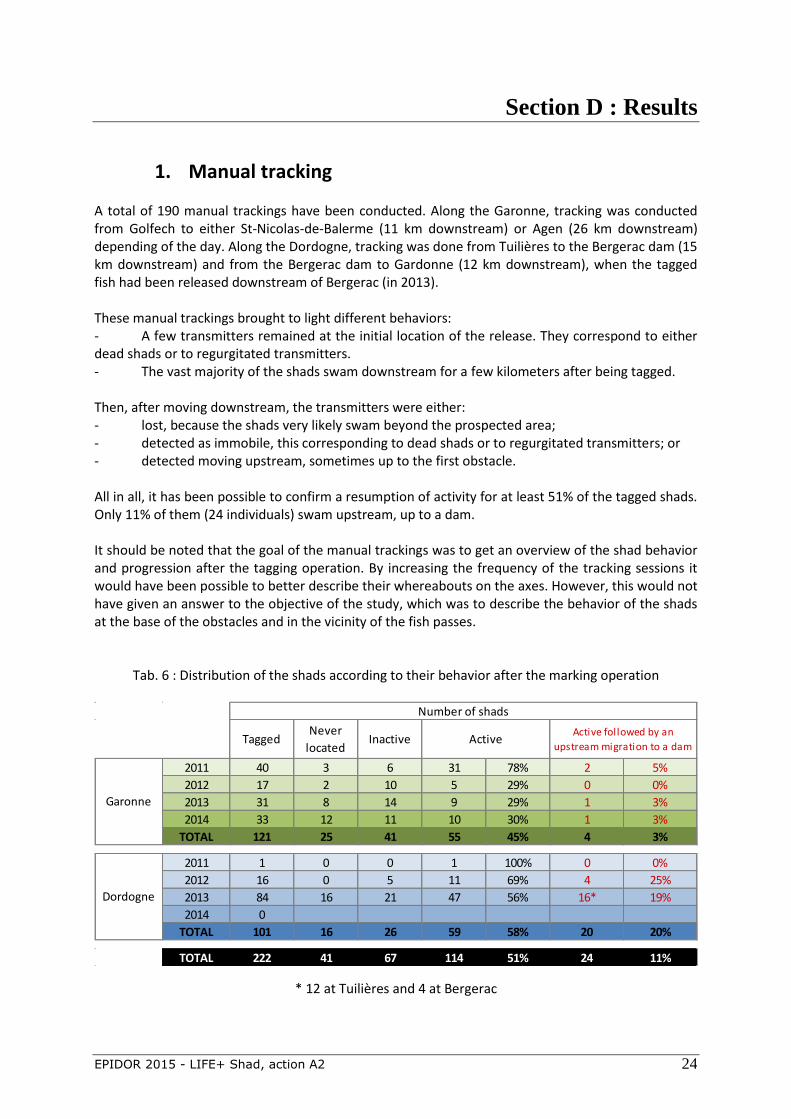
1. Manual tracking A total of 190 manual trackings have been conducted. Along the Garonne, tracking was conducted from Golfech to either St-Nicolas-de-Balerme (11 km downstream) or Agen (26 km downstream) depending of the day. Along the Dordogne, tracking was done from Tuilières to the Bergerac dam (15 km downstream) and from the Bergerac dam to Gardonne (12 km downstream), when the tagged fish had been released downstream of Bergerac (in 2013). These manual trackings brought to light different behaviors: - A few transmitters remained at the initial location of the release. They correspond to either dead shads or to regurgitated transmitters. - The vast majority of the shads swam downstream for a few kilometers after being tagged. Then, after moving downstream, the transmitters were either: - lost, because the shads very likely swam beyond the prospected area; - detected as immobile, this corresponding to dead shads or to regurgitated transmitters; or - detected moving upstream, sometimes up to the first obstacle. All in all, it has been possible to confirm a resumption of activity for at least 51% of the tagged shads. Only 11% of them (24 individuals) swam upstream, up to a dam. It should be noted that the goal of the manual trackings was to get an overview of the shad behavior and progression after the tagging operation. By increasing the frequency of the tracking sessions it would have been possible to better describe their whereabouts on the axes. However, this would not have given an answer to the objective of the study, which was to describe the behavior of the shads at the base of the obstacles and in the vicinity of the fish passes.
Tab. 6 : Distribution of the shads according to their behavior after the marking operation
TaggedNever
locatedInactive
2011 40 3 6 31 78% 2 5%
2012 17 2 10 5 29% 0 0%
2013 31 8 14 9 29% 1 3%
2014 33 12 11 10 30% 1 3%
TOTAL 121 25 41 55 45% 4 3%
2011 1 0 0 1 100% 0 0%
2012 16 0 5 11 69% 4 25%
2013 84 16 21 47 56% 16* 19%
2014 0
TOTAL 101 16 26 59 58% 20 20%
TOTAL 222 41 67 114 51% 24 11%
Garonne
Active followed by an
upstream migration to a damActive
Dordogne
Number of shads
* 12 at Tuilières and 4 at Bergerac
EPIDOR 2015 - LIFE+ Shad, action A2 25
2. Trackings around Golfech
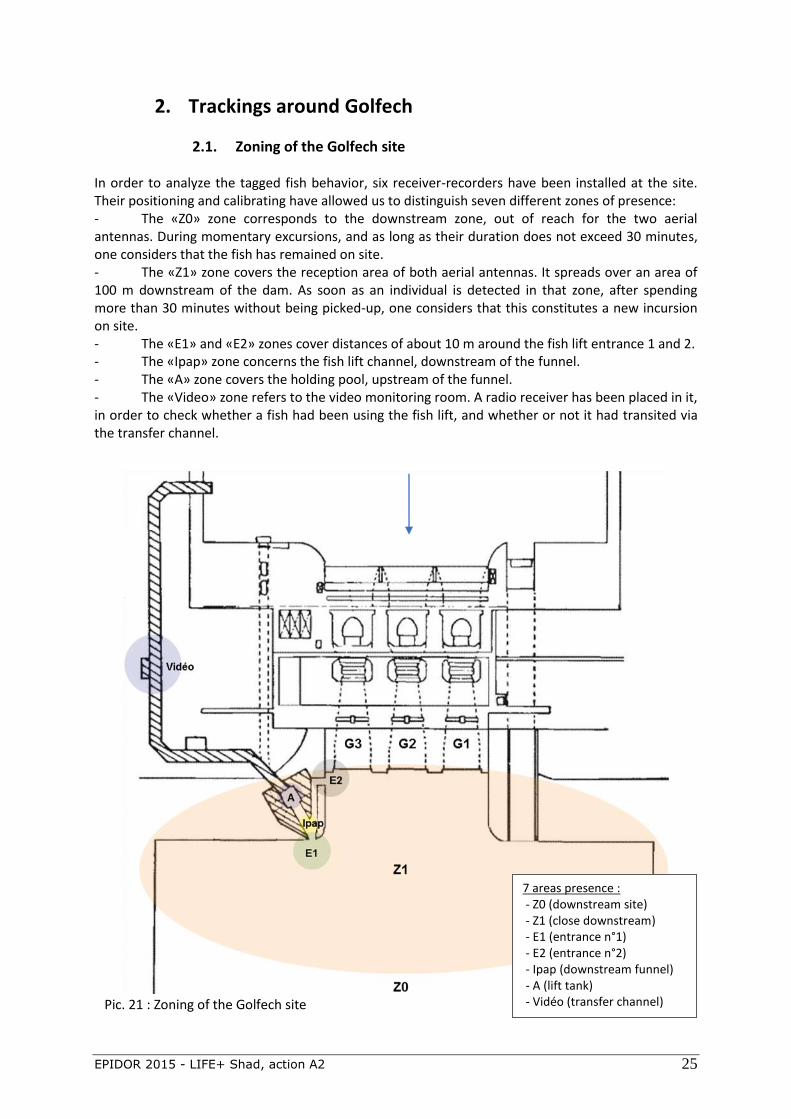
2.1. Zoning of the Golfech site In order to analyze the tagged fish behavior, six receiver-recorders have been installed at the site. Their positioning and calibrating have allowed us to distinguish seven different zones of presence: - The «Z0» zone corresponds to the downstream zone, out of reach for the two aerial antennas. During momentary excursions, and as long as their duration does not exceed 30 minutes, one considers that the fish has remained on site. - The «Z1» zone covers the reception area of both aerial antennas. It spreads over an area of 100 m downstream of the dam. As soon as an individual is detected in that zone, after spending more than 30 minutes without being picked-up, one considers that this constitutes a new incursion on site. - The «E1» and «E2» zones cover distances of about 10 m around the fish lift entrance 1 and 2. - The «Ipap» zone concerns the fish lift channel, downstream of the funnel. - The «A» zone covers the holding pool, upstream of the funnel. - The «Video» zone refers to the video monitoring room. A radio receiver has been placed in it, in order to check whether a fish had been using the fish lift, and whether or not it had transited via the transfer channel. Pic. 21 : Zoning of the Golfech site
7 areas presence : - Z0 (downstream site) - Z1 (close downstream) - E1 (entrance n°1) - E2 (entrance n°2) - Ipap (downstream funnel) - A (lift tank) - Vidéo (transfer channel)
EPIDOR 2015 - LIFE+ Shad, action A2 26
2.2. The tracked fish A total of four shads came back up to the Golfech hydroelectric power station. They were onsite on seven different days.
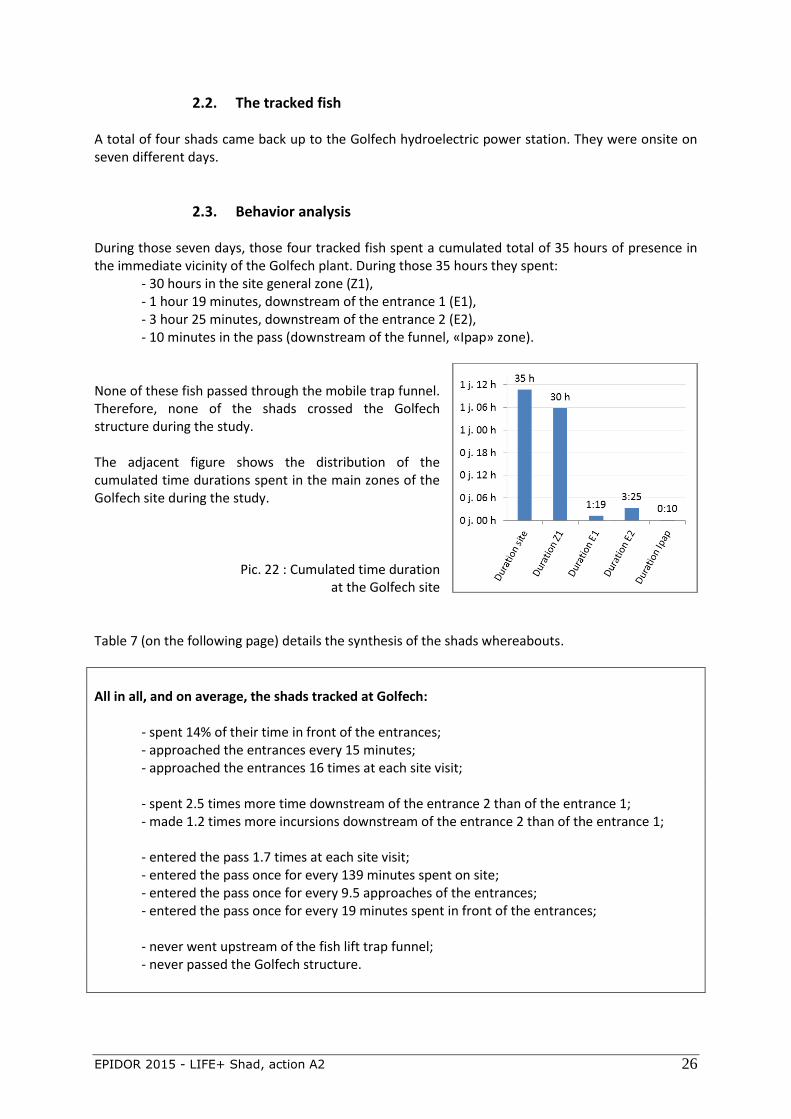
2.3. Behavior analysis During those seven days, those four tracked fish spent a cumulated total of 35 hours of presence in the immediate vicinity of the Golfech plant. During those 35 hours they spent: - 30 hours in the site general zone (Z1), - 1 hour 19 minutes, downstream of the entrance 1 (E1), - 3 hour 25 minutes, downstream of the entrance 2 (E2), - 10 minutes in the pass (downstream of the funnel, «Ipap» zone). None of these fish passed through the mobile trap funnel. Therefore, none of the shads crossed the Golfech structure during the study. The adjacent figure shows the distribution of the cumulated time durations spent in the main zones of the Golfech site during the study.
Pic. 22 : Cumulated time duration at the Golfech site
Table 7 (on the following page) details the synthesis of the shads whereabouts.
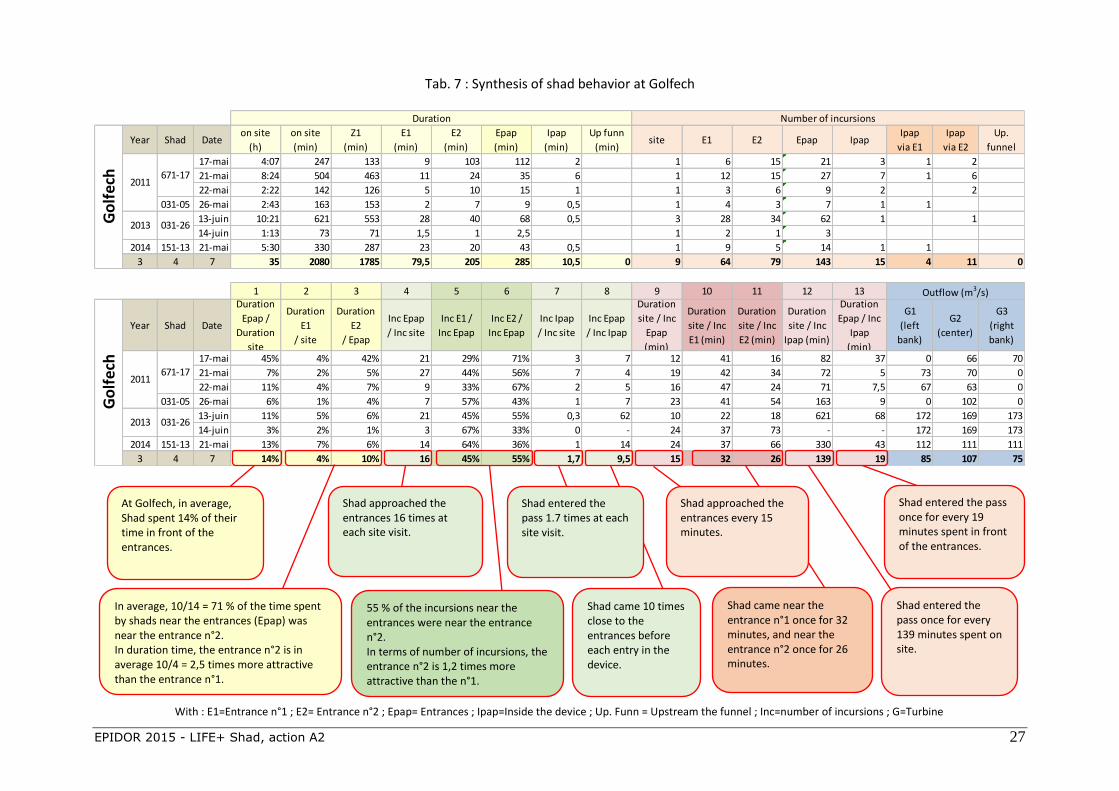
All in all, and on average, the shads tracked at Golfech: - spent 14% of their time in front of the entrances; - approached the entrances every 15 minutes; - approached the entrances 16 times at each site visit; - spent 2.5 times more time downstream of the entrance 2 than of the entrance 1; - made 1.2 times more incursions downstream of the entrance 2 than of the entrance 1; - entered the pass 1.7 times at each site visit; - entered the pass once for every 139 minutes spent on site; - entered the pass once for every 9.5 approaches of the entrances; - entered the pass once for every 19 minutes spent in front of the entrances; - never went upstream of the fish lift trap funnel; - never passed the Golfech structure.
EPIDOR 2015 - LIFE+ Shad, action A2 27
Tab. 7 : Synthesis of shad behavior at Golfech
Year Shad Dateon site
(h)
on site
(min)
Z1
(min)
E1
(min)
E2
(min)
Epap
(min)
Ipap
(min)
Up funn
(min)site E1 E2 Epap Ipap
Ipap
via E1
Ipap
via E2
Up.
funnel
17-mai 4:07 247 133 9 103 112 2 1 6 15 21 3 1 2
21-mai 8:24 504 463 11 24 35 6 1 12 15 27 7 1 6
22-mai 2:22 142 126 5 10 15 1 1 3 6 9 2 2
031-05 26-mai 2:43 163 153 2 7 9 0,5 1 4 3 7 1 1
13-juin 10:21 621 553 28 40 68 0,5 3 28 34 62 1 1
14-juin 1:13 73 71 1,5 1 2,5 1 2 1 3
2014 151-13 21-mai 5:30 330 287 23 20 43 0,5 1 9 5 14 1 1
3 4 7 35 2080 1785 79,5 205 285 10,5 0 9 64 79 143 15 4 11 0
1 2 3 4 5 6 7 8 9 10 11 12 13
Year Shad Date
Duration
Epap /
Duration
site
Duration
E1
/ site
Duration
E2
/ Epap
Inc Epap
/ Inc site
Inc E1 /
Inc Epap
Inc E2 /
Inc Epap
Inc Ipap
/ Inc site
Inc Epap
/ Inc Ipap
Duration
site / Inc
Epap
(min)
Duration
site / Inc
E1 (min)
Duration
site / Inc
E2 (min)
Duration
site / Inc
Ipap (min)
Duration
Epap / Inc
Ipap
(min)
G1
(left
bank)
G2
(center)
G3
(right
bank)
17-mai 45% 4% 42% 21 29% 71% 3 7 12 41 16 82 37 0 66 70
21-mai 7% 2% 5% 27 44% 56% 7 4 19 42 34 72 5 73 70 0
22-mai 11% 4% 7% 9 33% 67% 2 5 16 47 24 71 7,5 67 63 0
031-05 26-mai 6% 1% 4% 7 57% 43% 1 7 23 41 54 163 9 0 102 0
13-juin 11% 5% 6% 21 45% 55% 0,3 62 10 22 18 621 68 172 169 173
14-juin 3% 2% 1% 3 67% 33% 0 - 24 37 73 - - 172 169 173
2014 151-13 21-mai 13% 7% 6% 14 64% 36% 1 14 24 37 66 330 43 112 111 111
3 4 7 14% 4% 10% 16 45% 55% 1,7 9,5 15 32 26 139 19 85 107 75
Outflow (m3/s)
Go
lfec
h
2011671-17
2013 031-26
Duration Number of incursionsG
olf
ech
2011671-17
2013 031-26
At Golfech, in average, Shad spent 14% of their time in front of the entrances.
In average, 10/14 = 71 % of the time spent by shads near the entrances (Epap) was near the entrance n°2. In duration time, the entrance n°2 is in average 10/4 = 2,5 times more attractive than the entrance n°1.
Shad approached the entrances 16 times at each site visit.
55 % of the incursions near the entrances were near the entrance n°2. In terms of number of incursions, the entrance n°2 is 1,2 times more attractive than the n°1.
Shad entered the pass 1.7 times at each site visit.
Shad came 10 times close to the entrances before each entry in the device.
Shad approached the entrances every 15 minutes.
Shad came near the entrance n°1 once for 32 minutes, and near the entrance n°2 once for 26 minutes.
Shad entered the pass once for every 139 minutes spent on site.
With : E1=Entrance n°1 ; E2= Entrance n°2 ; Epap= Entrances ; Ipap=Inside the device ; Up. Funn = Upstream the funnel ; Inc=number of incursions ; G=Turbine
Shad entered the pass once for every 19 minutes spent in front of the entrances.
EPIDOR 2015 - LIFE+ Shad, action A2 28
2.4. The operation of the Golfech plant The previous table shows the turbine flow at Golfech when the tagged shads were present. These data demonstrate that the day when the time spent in front of the entrances was the most important (45%, see column 1 of the table 7 second part) - the 17th of May 2011 - corresponds to a day when the turbine flow was rather low (136 m3/s) and when only units 2 and 3 were generating power. This configuration was in place only on that day. During the other days, the time spent in front of the entrances was very much shorter (from 3 to 13%). The strong amplitude of the time spent in front of the entrances during the other days (from 3 to 13%) does not seem to be based upon units operating mode. For example, the 13th and 14th of June 2013, the turbine flows were identical and the time spent in front of the entrance went from 11% down to 3%.
2.5. The operation of the fish lift
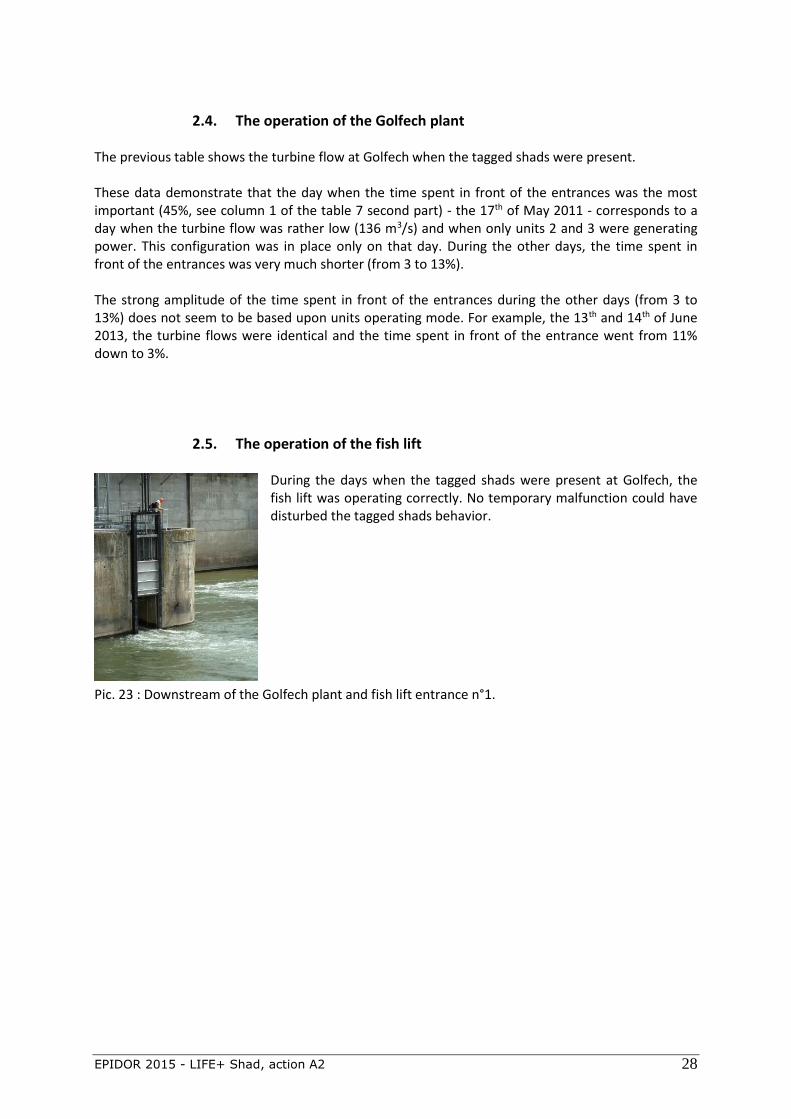
During the days when the tagged shads were present at Golfech, the fish lift was operating correctly. No temporary malfunction could have disturbed the tagged shads behavior.
Pic. 23 : Downstream of the Golfech plant and fish lift entrance n°1.
EPIDOR 2015 - LIFE+ Shad, action A2 29
3. Trackings around Bergerac
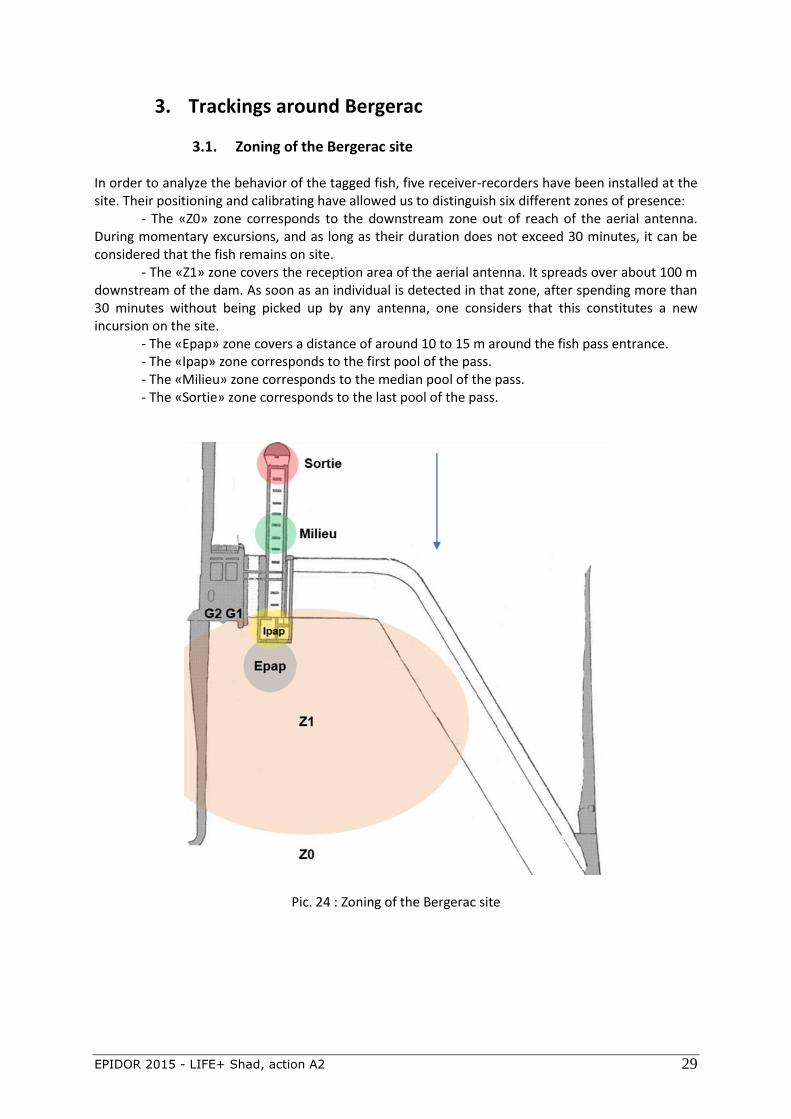
3.1. Zoning of the Bergerac site In order to analyze the behavior of the tagged fish, five receiver-recorders have been installed at the site. Their positioning and calibrating have allowed us to distinguish six different zones of presence: - The «Z0» zone corresponds to the downstream zone out of reach of the aerial antenna. During momentary excursions, and as long as their duration does not exceed 30 minutes, it can be considered that the fish remains on site. - The «Z1» zone covers the reception area of the aerial antenna. It spreads over about 100 m downstream of the dam. As soon as an individual is detected in that zone, after spending more than 30 minutes without being picked up by any antenna, one considers that this constitutes a new incursion on the site. - The «Epap» zone covers a distance of around 10 to 15 m around the fish pass entrance. - The «Ipap» zone corresponds to the first pool of the pass. - The «Milieu» zone corresponds to the median pool of the pass. - The «Sortie» zone corresponds to the last pool of the pass.
Pic. 24 : Zoning of the Bergerac site
EPIDOR 2015 - LIFE+ Shad, action A2 30
3.2. The tracked fish A total of four shads came back up to the Bergerac dam and achieved active prospections at the dam base on four different days.
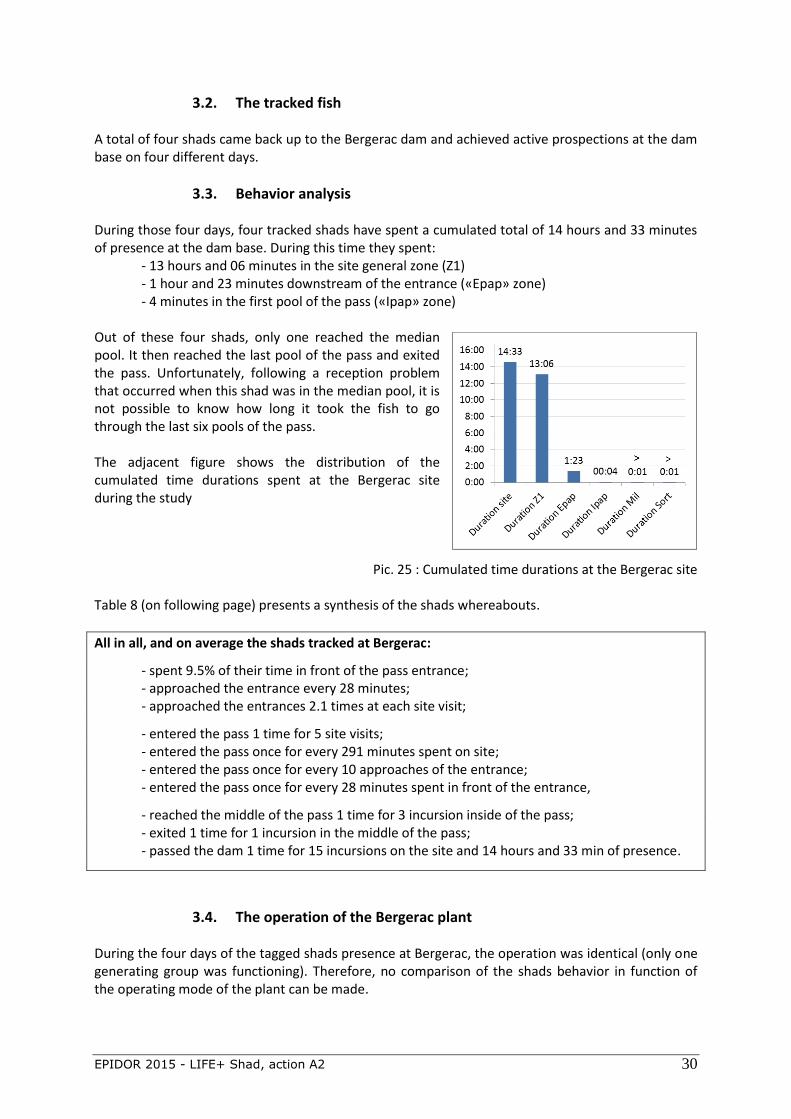
3.3. Behavior analysis During those four days, four tracked shads have spent a cumulated total of 14 hours and 33 minutes of presence at the dam base. During this time they spent: - 13 hours and 06 minutes in the site general zone (Z1) - 1 hour and 23 minutes downstream of the entrance («Epap» zone) - 4 minutes in the first pool of the pass («Ipap» zone) Out of these four shads, only one reached the median pool. It then reached the last pool of the pass and exited the pass. Unfortunately, following a reception problem that occurred when this shad was in the median pool, it is not possible to know how long it took the fish to go through the last six pools of the pass. The adjacent figure shows the distribution of the cumulated time durations spent at the Bergerac site during the study
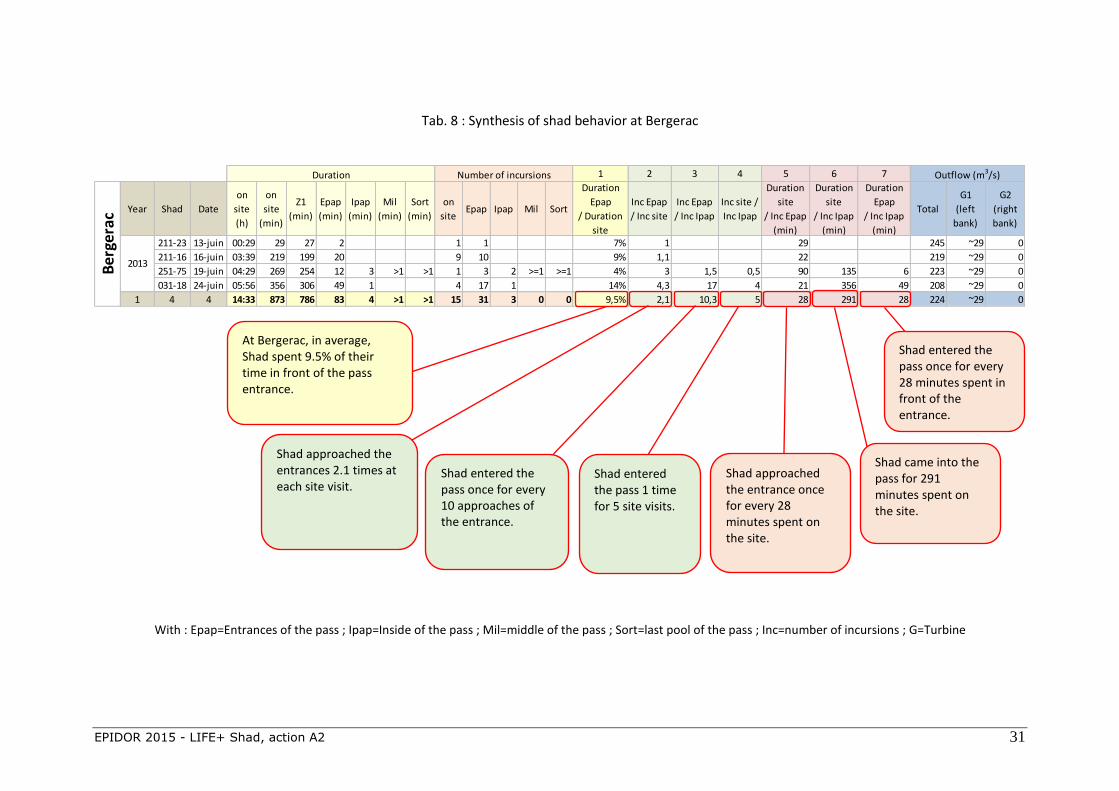
Pic. 25 : Cumulated time durations at the Bergerac site Table 8 (on following page) presents a synthesis of the shads whereabouts.
All in all, and on average the shads tracked at Bergerac:
- spent 9.5% of their time in front of the pass entrance; - approached the entrance every 28 minutes; - approached the entrances 2.1 times at each site visit;
- entered the pass 1 time for 5 site visits; - entered the pass once for every 291 minutes spent on site; - entered the pass once for every 10 approaches of the entrance; - entered the pass once for every 28 minutes spent in front of the entrance,
- reached the middle of the pass 1 time for 3 incursion inside of the pass; - exited 1 time for 1 incursion in the middle of the pass; - passed the dam 1 time for 15 incursions on the site and 14 hours and 33 min of presence.
3.4. The operation of the Bergerac plant During the four days of the tagged shads presence at Bergerac, the operation was identical (only one generating group was functioning). Therefore, no comparison of the shads behavior in function of the operating mode of the plant can be made.
EPIDOR 2015 - LIFE+ Shad, action A2 31
Tab. 8 : Synthesis of shad behavior at Bergerac
1 2 3 4 5 6 7
Year Shad Date
on
site
(h)
on
site
(min)
Z1
(min)
Epap
(min)
Ipap
(min)
Mil
(min)
Sort
(min)
on
siteEpap Ipap Mil Sort
Duration
Epap
/ Duration
site
Inc Epap
/ Inc site
Inc Epap
/ Inc Ipap
Inc site /
Inc Ipap
Duration
site
/ Inc Epap
(min)
Duration
site
/ Inc Ipap
(min)
Duration
Epap
/ Inc Ipap
(min)
Total
G1
(left
bank)
G2
(right
bank)
211-23 13-juin 00:29 29 27 2 1 1 7% 1 29 245 ~29 0
211-16 16-juin 03:39 219 199 20 9 10 9% 1,1 22 219 ~29 0
251-75 19-juin 04:29 269 254 12 3 >1 >1 1 3 2 >=1 >=1 4% 3 1,5 0,5 90 135 6 223 ~29 0
031-18 24-juin 05:56 356 306 49 1 4 17 1 14% 4,3 17 4 21 356 49 208 ~29 0
1 4 4 14:33 873 786 83 4 >1 >1 15 31 3 0 0 9,5% 2,1 10,3 5 28 291 28 224 ~29 0
Duration Number of incursions Outflow (m3/s)
Ber
gera
c
2013
With : Epap=Entrances of the pass ; Ipap=Inside of the pass ; Mil=middle of the pass ; Sort=last pool of the pass ; Inc=number of incursions ; G=Turbine
At Bergerac, in average, Shad spent 9.5% of their time in front of the pass entrance.
Shad approached the entrances 2.1 times at each site visit.
Shad entered the pass once for every 10 approaches of the entrance.
Shad approached the entrance once for every 28 minutes spent on the site.
Shad came into the pass for 291 minutes spent on the site.
Shad entered the pass 1 time for 5 site visits.
Shad entered the pass once for every 28 minutes spent in front of the entrance.
EPIDOR 2015 - LIFE+ Shad, action A2 32
4. Trackings at Tuilières
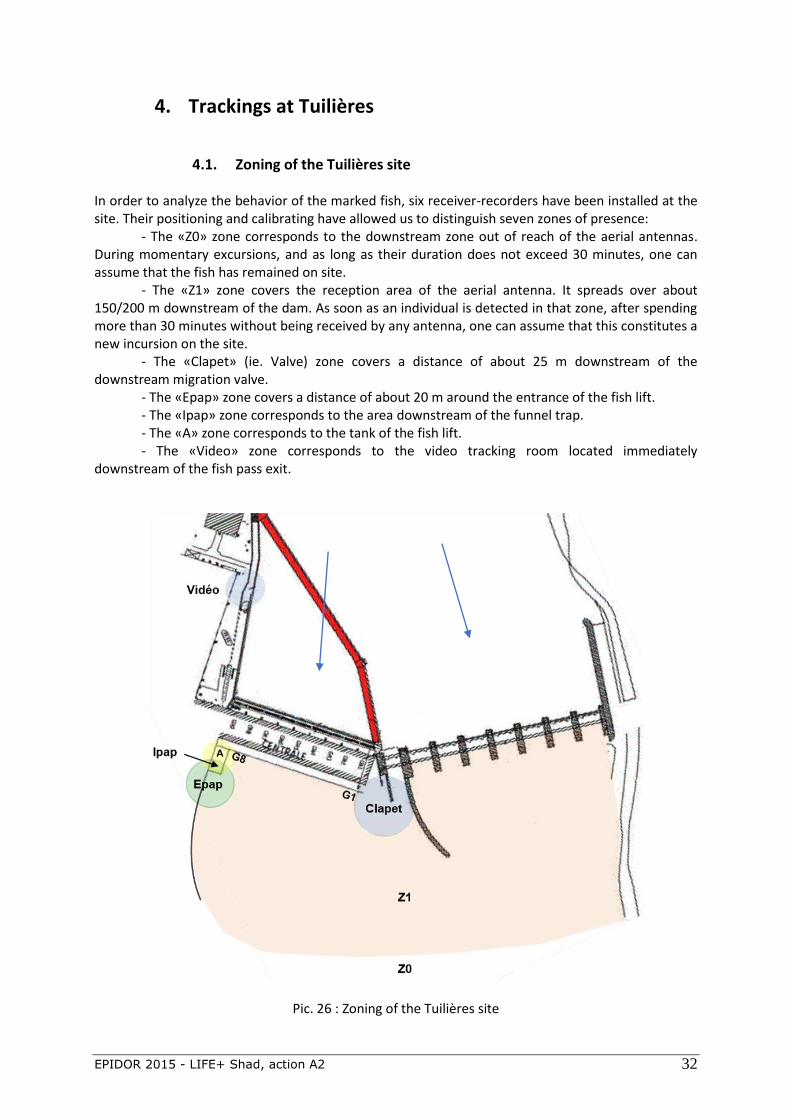
4.1. Zoning of the Tuilières site In order to analyze the behavior of the marked fish, six receiver-recorders have been installed at the site. Their positioning and calibrating have allowed us to distinguish seven zones of presence: - The «Z0» zone corresponds to the downstream zone out of reach of the aerial antennas. During momentary excursions, and as long as their duration does not exceed 30 minutes, one can assume that the fish has remained on site. - The «Z1» zone covers the reception area of the aerial antenna. It spreads over about 150/200 m downstream of the dam. As soon as an individual is detected in that zone, after spending more than 30 minutes without being received by any antenna, one can assume that this constitutes a new incursion on the site. - The «Clapet» (ie. Valve) zone covers a distance of about 25 m downstream of the downstream migration valve. - The «Epap» zone covers a distance of about 20 m around the entrance of the fish lift. - The «Ipap» zone corresponds to the area downstream of the funnel trap. - The «A» zone corresponds to the tank of the fish lift. - The «Video» zone corresponds to the video tracking room located immediately downstream of the fish pass exit.
Pic. 26 : Zoning of the Tuilières site
EPIDOR 2015 - LIFE+ Shad, action A2 33
4.2. The tracked fish A total of 16 different shads swam back up to the Tuilières site. Two very different behaviors have been observed; - 13 different shads got close to the dam but have been detected only by the two aerial antennas. They stayed slightly back and did not approach neither the valve, nor the fish lift. This behavior has been observed for 37 shads/days and corresponds to a cumulated duration of 130 hours (about 5.4 days). - 7 different shads actively prospected the Tuilières dam toe at a rate of 18 shads/days. The following analysis relates solely to those 18 active prospections.
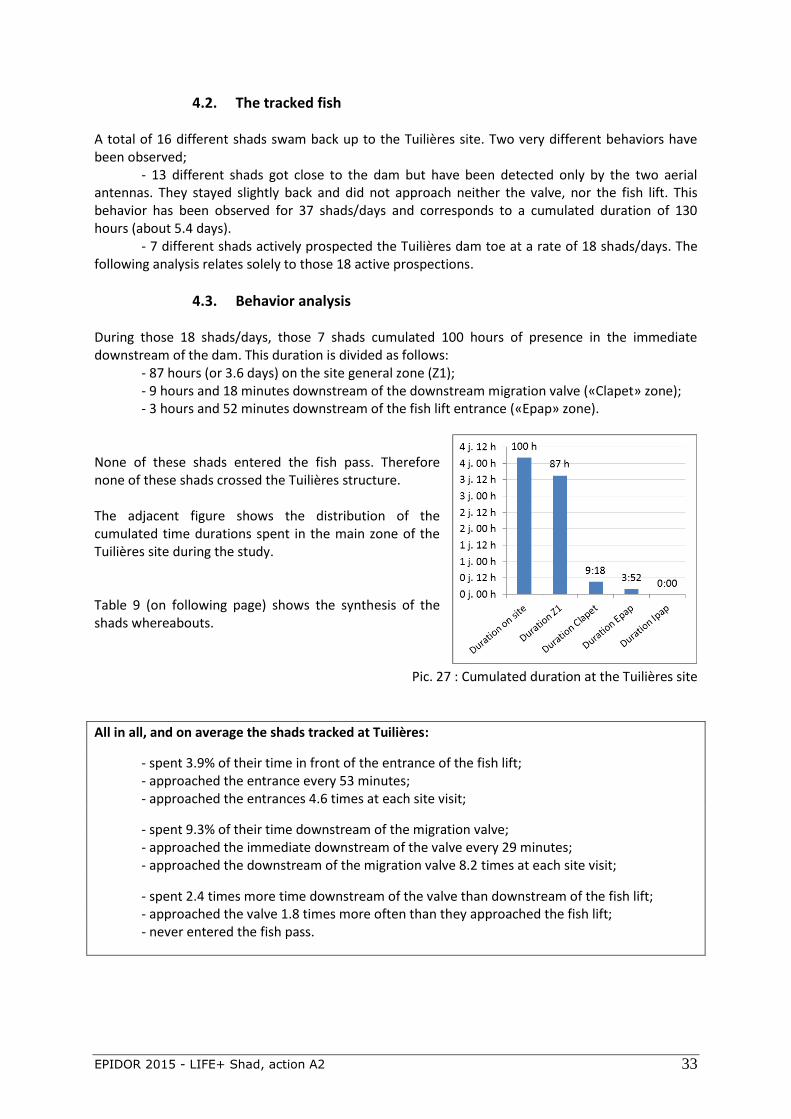
4.3. Behavior analysis During those 18 shads/days, those 7 shads cumulated 100 hours of presence in the immediate downstream of the dam. This duration is divided as follows: - 87 hours (or 3.6 days) on the site general zone (Z1); - 9 hours and 18 minutes downstream of the downstream migration valve («Clapet» zone); - 3 hours and 52 minutes downstream of the fish lift entrance («Epap» zone). None of these shads entered the fish pass. Therefore none of these shads crossed the Tuilières structure. The adjacent figure shows the distribution of the cumulated time durations spent in the main zone of the Tuilières site during the study. Table 9 (on following page) shows the synthesis of the shads whereabouts.
Pic. 27 : Cumulated duration at the Tuilières site
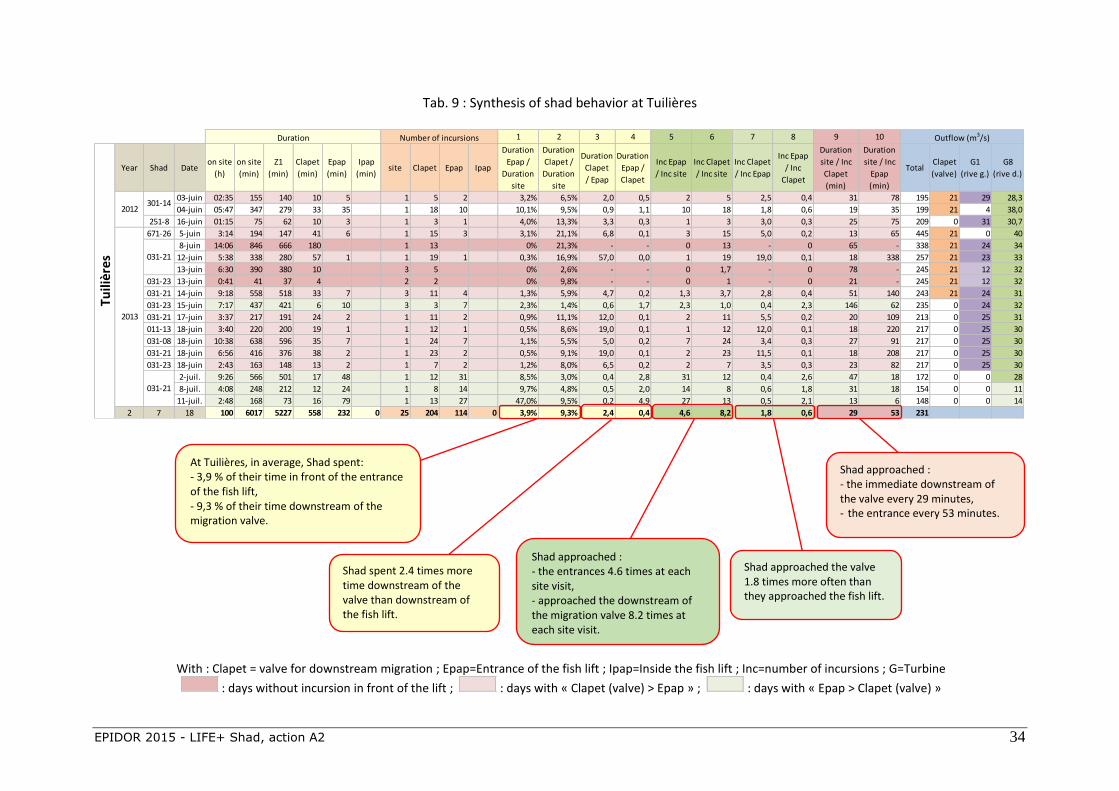
All in all, and on average the shads tracked at Tuilières:
- spent 3.9% of their time in front of the entrance of the fish lift; - approached the entrance every 53 minutes; - approached the entrances 4.6 times at each site visit;
- spent 9.3% of their time downstream of the migration valve; - approached the immediate downstream of the valve every 29 minutes; - approached the downstream of the migration valve 8.2 times at each site visit;
- spent 2.4 times more time downstream of the valve than downstream of the fish lift; - approached the valve 1.8 times more often than they approached the fish lift; - never entered the fish pass.
EPIDOR 2015 - LIFE+ Shad, action A2 34
Tab. 9 : Synthesis of shad behavior at Tuilières
1 2 3 4 5 6 7 8 9 10
Year Shad Dateon site
(h)
on site
(min)
Z1
(min)
Clapet
(min)
Epap
(min)
Ipap
(min)site Clapet Epap Ipap
Duration
Epap /
Duration
site
Duration
Clapet /
Duration
site
Duration
Clapet
/ Epap
Duration
Epap /
Clapet
Inc Epap
/ Inc site
Inc Clapet
/ Inc site
Inc Clapet
/ Inc Epap
Inc Epap
/ Inc
Clapet
Duration
site / Inc
Clapet
(min)
Duration
site / Inc
Epap
(min)
TotalClapet
(valve)
G1
(rive g.)
G8
(rive d.)
03-juin 02:35 155 140 10 5 1 5 2 3,2% 6,5% 2,0 0,5 2 5 2,5 0,4 31 78 195 21 29 28,3
04-juin 05:47 347 279 33 35 1 18 10 10,1% 9,5% 0,9 1,1 10 18 1,8 0,6 19 35 199 21 4 38,0
251-8 16-juin 01:15 75 62 10 3 1 3 1 4,0% 13,3% 3,3 0,3 1 3 3,0 0,3 25 75 209 0 31 30,7
671-26 5-juin 3:14 194 147 41 6 1 15 3 3,1% 21,1% 6,8 0,1 3 15 5,0 0,2 13 65 445 21 0 40
8-juin 14:06 846 666 180 1 13 0% 21,3% - - 0 13 - 0 65 - 338 21 24 34
12-juin 5:38 338 280 57 1 1 19 1 0,3% 16,9% 57,0 0,0 1 19 19,0 0,1 18 338 257 21 23 33
13-juin 6:30 390 380 10 3 5 0% 2,6% - - 0 1,7 - 0 78 - 245 21 12 32
031-23 13-juin 0:41 41 37 4 2 2 0% 9,8% - - 0 1 - 0 21 - 245 21 12 32
031-21 14-juin 9:18 558 518 33 7 3 11 4 1,3% 5,9% 4,7 0,2 1,3 3,7 2,8 0,4 51 140 243 21 24 31
031-23 15-juin 7:17 437 421 6 10 3 3 7 2,3% 1,4% 0,6 1,7 2,3 1,0 0,4 2,3 146 62 235 0 24 32
031-21 17-juin 3:37 217 191 24 2 1 11 2 0,9% 11,1% 12,0 0,1 2 11 5,5 0,2 20 109 213 0 25 31
011-13 18-juin 3:40 220 200 19 1 1 12 1 0,5% 8,6% 19,0 0,1 1 12 12,0 0,1 18 220 217 0 25 30
031-08 18-juin 10:38 638 596 35 7 1 24 7 1,1% 5,5% 5,0 0,2 7 24 3,4 0,3 27 91 217 0 25 30
031-21 18-juin 6:56 416 376 38 2 1 23 2 0,5% 9,1% 19,0 0,1 2 23 11,5 0,1 18 208 217 0 25 30
031-23 18-juin 2:43 163 148 13 2 1 7 2 1,2% 8,0% 6,5 0,2 2 7 3,5 0,3 23 82 217 0 25 30
2-juil. 9:26 566 501 17 48 1 12 31 8,5% 3,0% 0,4 2,8 31 12 0,4 2,6 47 18 172 0 0 28
8-juil. 4:08 248 212 12 24 1 8 14 9,7% 4,8% 0,5 2,0 14 8 0,6 1,8 31 18 154 0 0 11
11-juil. 2:48 168 73 16 79 1 13 27 47,0% 9,5% 0,2 4,9 27 13 0,5 2,1 13 6 148 0 0 14
2 7 18 100 6017 5227 558 232 0 25 204 114 0 3,9% 9,3% 2,4 0,4 4,6 8,2 1,8 0,6 29 53 231
Duration Number of incursions Outflow (m3/s)
Tuili
ères
2012301-14
2013
031-21
031-21
With : Clapet = valve for downstream migration ; Epap=Entrance of the fish lift ; Ipap=Inside the fish lift ; Inc=number of incursions ; G=Turbine
: days without incursion in front of the lift ; : days with « Clapet (valve) > Epap » ; : days with « Epap > Clapet (valve) »
At Tuilières, in average, Shad spent: - 3,9 % of their time in front of the entrance of the fish lift, - 9,3 % of their time downstream of the migration valve.
Shad approached : - the entrances 4.6 times at each site visit, - approached the downstream of the migration valve 8.2 times at each site visit.
Shad approached the valve 1.8 times more often than they approached the fish lift.
Shad approached : - the immediate downstream of the valve every 29 minutes, - the entrance every 53 minutes.
Shad spent 2.4 times more time downstream of the valve than downstream of the fish lift.
EPIDOR 2015 - LIFE+ Shad, action A2 35
4.4. The operation of the Tuilières plant The Dordogne flow at Bergerac (source: Banque Hydro), the turbine flows from Tuilières number 1 and 8 generating units (G), and the flows going through the downstream migration valve are all transcribed in table 9. Three different configurations have been observed: - Configuration 1: Valve+G1+G8 - Configuration 2: G1+G8 - Configuration 3: G8 Over the course of three days, the shads approached the valve but did not go on the side of the fish lift (dark pink lines in table 9). For those three dates, the configuration 1 was in place (Valve + G1 + G8). When the shads spent more time by the valve than by the fish lift (light pink lines, which is the majority of the time), the configurations observed were either Configuration 1 or Configuration 2 (Valve + G1+G8 or G1+G8), except for one day (June 5th 2013: G8 + Valve). The time spent by the shads on the side of the fish lift has been more important than the time they spent on the side of the valve on four days (green lines). During those four days, the valve was not operating (Configuration 2 or 3). Finally, at each time the Configuration 3 was in place, the time spent by the shads by the fish lift was more important than the time spent by the valve (green lines).
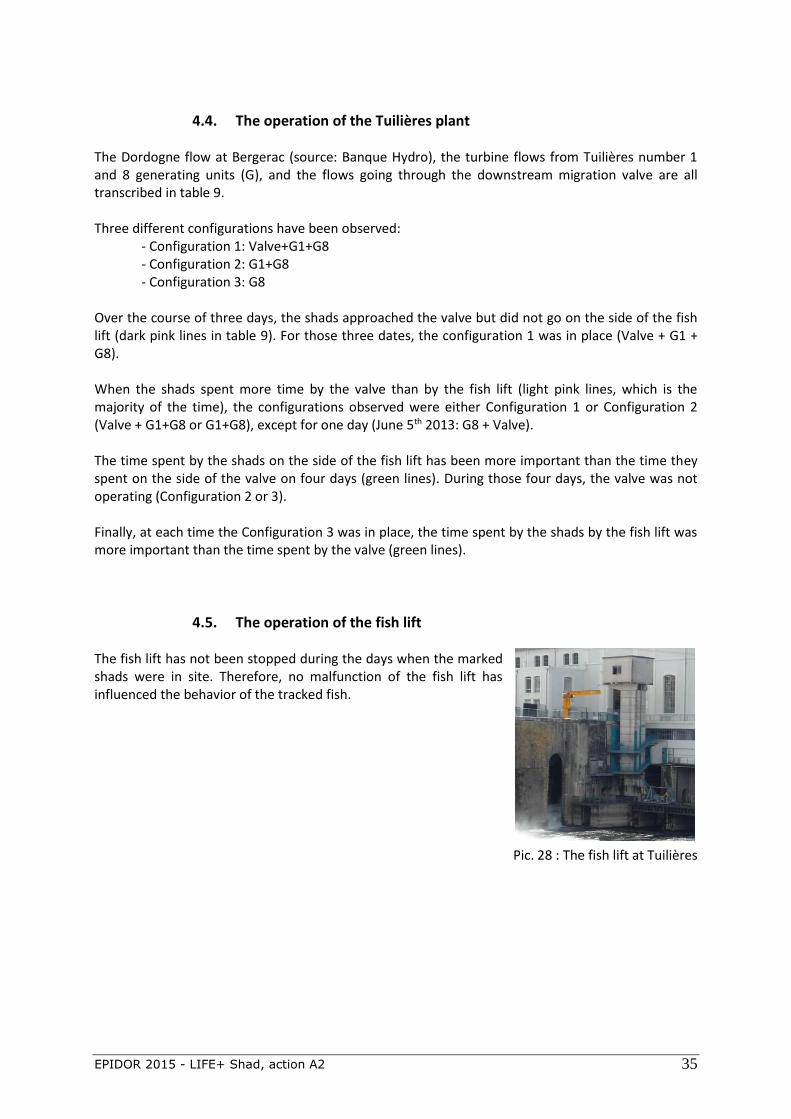
4.5. The operation of the fish lift The fish lift has not been stopped during the days when the marked shads were in site. Therefore, no malfunction of the fish lift has influenced the behavior of the tracked fish.
Pic. 28 : The fish lift at Tuilières
EPIDOR 2015 - LIFE+ Shad, action A2 36
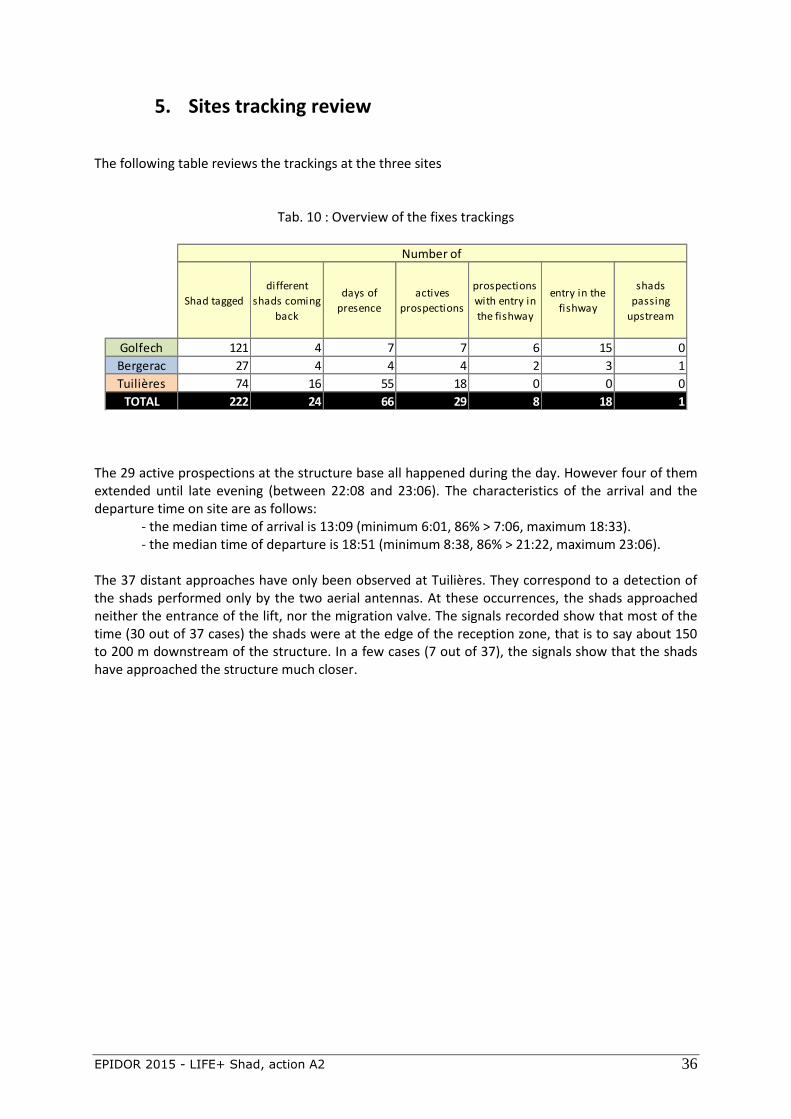
5. Sites tracking review The following table reviews the trackings at the three sites
Tab. 10 : Overview of the fixes trackings
Shad tagged
different
shads coming
back
days of
presence
actives
prospections
prospections
with entry in
the fishway
entry in the
fishway
shads
passing
upstream
Golfech 121 4 7 7 6 15 0
Bergerac 27 4 4 4 2 3 1
Tuilières 74 16 55 18 0 0 0
TOTAL 222 24 66 29 8 18 1
Number of
The 29 active prospections at the structure base all happened during the day. However four of them extended until late evening (between 22:08 and 23:06). The characteristics of the arrival and the departure time on site are as follows: - the median time of arrival is 13:09 (minimum 6:01, 86% > 7:06, maximum 18:33). - the median time of departure is 18:51 (minimum 8:38, 86% > 21:22, maximum 23:06). The 37 distant approaches have only been observed at Tuilières. They correspond to a detection of the shads performed only by the two aerial antennas. At these occurrences, the shads approached neither the entrance of the lift, nor the migration valve. The signals recorded show that most of the time (30 out of 37 cases) the shads were at the edge of the reception zone, that is to say about 150 to 200 m downstream of the structure. In a few cases (7 out of 37), the signals show that the shads have approached the structure much closer.
EPIDOR 2015 - LIFE+ Shad, action A2 37
Section E : Discussion
NB : The shads tagged and tracked along the Garonne and along the Dordogne had been
respectively captured in the Golfech and the Tuilières fish passes. They had therefore already at one time used the Golfech, Bergerac, and Tuilières passes. However, this information does not support the formulation of the hypothesis of the existence of a bias that favored or disfavored the fish in their attempt to cross the structures. As a matter of fact, if one can imagine that the stress caused by the capture and the tagging operations could dissuade the shads from attempting it a second time, one can as well consider that the sampling method has favored the fish that displayed the best crossing abilities, since they had already done so.
1. Shads general behavior In total, out of 222 tagged and released shads, 51% (114 individuals) have shown signs of activity, and 11% (24 individuals) swam up to an obstacle. Although those figures may seem low, they are comparable to those of previous shads radio-tracking studies and are linked to the highly fragile nature of that fish (Steinbach et al., 1986; Roche et al., 2007). In order to obtain a higher number of observations, and to acquire more data, the initial objective aimed at marking 200 shads per season. Unfortunately, the catastrophic decrease of the number of shads engaging in upstream migration has not allowed us to achieve these objectives.
2. Displacement along the axes Manual tracking allowed us to observe that, after being tagged, the vast majority of the shads swam downstream for several kilometers, often from 2 to 5 km, but sometimes up to 15 km depending on conditions (and in some cases even farther, with the loss of some individuals altogether), noticeably during periods of high flow. This behavior is to be considered in relation to the disturbances caused by the manipulations. The active shads showed that they could move very fast. For example, one shad moved 2 km upstream in just one hour, and several shads completed upstream journeys of 10 km in less than 24 hours. The shads have very often been located at the main spawning grounds (Lamagistère, St-Sixte, and Saint-Nicolas on the Garonne; Port-de-Tuilières, la Gravière, and Grand-Castang on the Dordogne). However, some other areas have been identified as being regularly frequented by the tagged fish (Ribet on the Garonne, the Mouleydier bridge and the area in between Migay and Le Peyrat along the Dordogne). No spawning activity has been reported by MIGADO on these areas. They very likely correspond to resting zones. The periods during which the shads have been followed are rather short, lasting from two to four weeks. They rarely lasted more than a month. This is directly linked to the species life cycle, which is characterized by a very short migration and spawning window.
EPIDOR 2015 - LIFE+ Shad, action A2 38
3. Behavior at the base of the structures The literature indicates that the shad upstream migration is mostly diurnal. This is confirmed on the Garonne-Dordogne by the vast majority of day time passages through the video monitoring stations (Chanceau et al., 2000; MIGADO, pers. com.). In the present study, all of the active prospections at the base of the obstacles (29 of them) occurred during daylight. This confirms that the shads tagged were indeed engaged in migration, and that they tried to cross the structures. Numerous distant approaches of the Tuilières structure have been observed. On these occasions, the tracked shads swam up to the mid-channel gravel bar located 200 m downstream of the dam. These movements often occurred during the evening or the night and are probably linked to the spawning activity, which is nocturnal for this specie. Thus, it is possible that some shads have been detected by aerial antennas while they were moving in search of a spawning ground, or a sexual partner, around the Port-de-Tuilières forced spawning ground. In this context, it is logical to conclude that the upstream migration valve and the fish lift zones have not been prospected.
4. Shads behavior at Golfech
4.1. Attractiveness of entrances
On average, the shads tracked at Golfech: - spent 14% of their time in front of the entrances; - approached the entrances every 15 minutes; - approached the entrances 16 times at each visit.
This information seems to indicate that the entrances offer a good level of attractiveness. However, since those entrances, in particular the number 2 entrance, are located very close to the outlet of the turbines, it is difficult to know whether what attracts the shads are the entrances themselves or the flow transiting through the turbines.
Those shads: - spent 2.5 times more time downstream of the entrance number 2 than of the entrance n°1; - have made 1.2 times more incursions downstream of the entrance 2 than of the entrance n°1.
Consequently, the second entrance seems to be more attractive. However, since it is situated closer to the generating units, it is difficult to know whether what attracts the shads in this zone is the entrance itself or the flow transiting through the turbines, especially through the turbine number 3.
4.2. Ease of entry into the pass
Those shads entered the pass: - 1.7 times at each visit; - once for every 139 minutes spent onsite; - once for every 9.5 entrance approaches; - once for every 19 minutes spent in front of the entrances.
These data seem to indicate relative ease of entry into the pass. However, if one takes into account the different prospection observed, one realizes that this ease of entry is highly variable: - number of entrance for each site visit: average = 1,7 ; min = 0 ; max = 7 - presence duration on site before entering: average = 139 min ; min = 71 ; max = 621 - number of entrance approaches before entering: average = 9,5 ; min = 4 ; max = 62 - presence duration near the entrances before entering: average = 19 min; min = 5; max = 68
EPIDOR 2015 - LIFE+ Shad, action A2 39
4.3. Progression in the pass
These shads : - have never been upstream of the fish lift trap funnel; - have never crossed the Golfech structure.
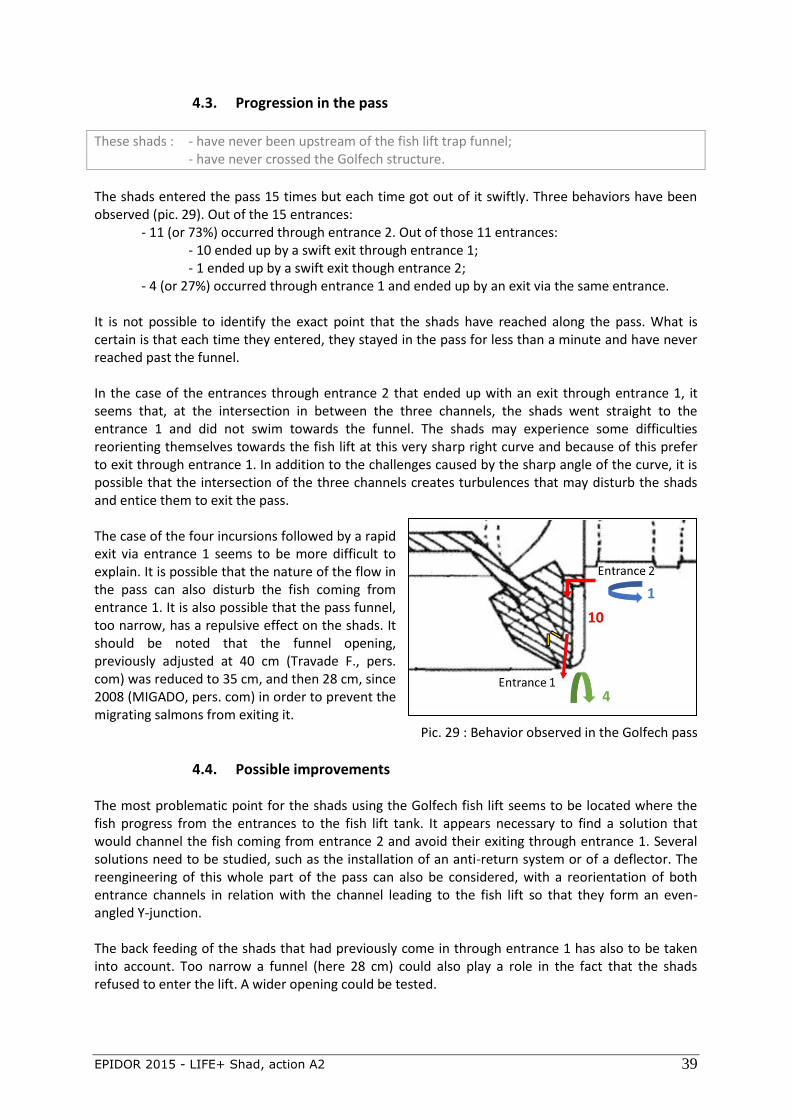
The shads entered the pass 15 times but each time got out of it swiftly. Three behaviors have been observed (pic. 29). Out of the 15 entrances: - 11 (or 73%) occurred through entrance 2. Out of those 11 entrances: - 10 ended up by a swift exit through entrance 1; - 1 ended up by a swift exit though entrance 2; - 4 (or 27%) occurred through entrance 1 and ended up by an exit via the same entrance. It is not possible to identify the exact point that the shads have reached along the pass. What is certain is that each time they entered, they stayed in the pass for less than a minute and have never reached past the funnel. In the case of the entrances through entrance 2 that ended up with an exit through entrance 1, it seems that, at the intersection in between the three channels, the shads went straight to the entrance 1 and did not swim towards the funnel. The shads may experience some difficulties reorienting themselves towards the fish lift at this very sharp right curve and because of this prefer to exit through entrance 1. In addition to the challenges caused by the sharp angle of the curve, it is possible that the intersection of the three channels creates turbulences that may disturb the shads and entice them to exit the pass. The case of the four incursions followed by a rapid exit via entrance 1 seems to be more difficult to explain. It is possible that the nature of the flow in the pass can also disturb the fish coming from entrance 1. It is also possible that the pass funnel, too narrow, has a repulsive effect on the shads. It should be noted that the funnel opening, previously adjusted at 40 cm (Travade F., pers. com) was reduced to 35 cm, and then 28 cm, since 2008 (MIGADO, pers. com) in order to prevent the migrating salmons from exiting it.
Pic. 29 : Behavior observed in the Golfech pass
4.4. Possible improvements The most problematic point for the shads using the Golfech fish lift seems to be located where the fish progress from the entrances to the fish lift tank. It appears necessary to find a solution that would channel the fish coming from entrance 2 and avoid their exiting through entrance 1. Several solutions need to be studied, such as the installation of an anti-return system or of a deflector. The reengineering of this whole part of the pass can also be considered, with a reorientation of both entrance channels in relation with the channel leading to the fish lift so that they form an even-angled Y-junction. The back feeding of the shads that had previously come in through entrance 1 has also to be taken into account. Too narrow a funnel (here 28 cm) could also play a role in the fact that the shads refused to enter the lift. A wider opening could be tested.
EPIDOR 2015 - LIFE+ Shad, action A2 40
5. Shads behavior at Bergerac
5.1. Entrance attractiveness
On average, the shads tracked at Bergerac: - spent 9.5% of their time in front of the pass entrance; - approached the entrance every 28 minutes; - approached the entrance 2.1 times at each visit,
The shads spent a significant part of their time in front of the entrance. Its attractiveness seems to be quite good. However, one notices that the shads have not been very mobile on the site since they move to the front of the entrance only 2.1 times at each visit.
5.2. Ease entering the pass
Those shads entered the pass once for : - every 5 sites visits; - every 291 minutes (or 4 hours 51 minutes) spent onsite; - every 10 entrance approaches; - every 28 minutes spent in front of the entrance.
These data show that the ease of entry into the pass is not optimal, since the shads need to approach the entrance many times before entering it, and only can manage to do so after a long period spent on site and in front of the entrance.
5.3. Progression in the pass Only three incursions into the first pool of the pass have been observed, and two of these ended up with a swift downstream exit. By contrast, the third incursion was followed by the shad passing every single pool and exiting upstream of the dam. This observation has to be considered with the greatest caution, for it is based upon only one incursion upstream of the first pool, however it does not show there to be any specific problem at the level of the progression of the fish in the pool-type pass at Bergerac.
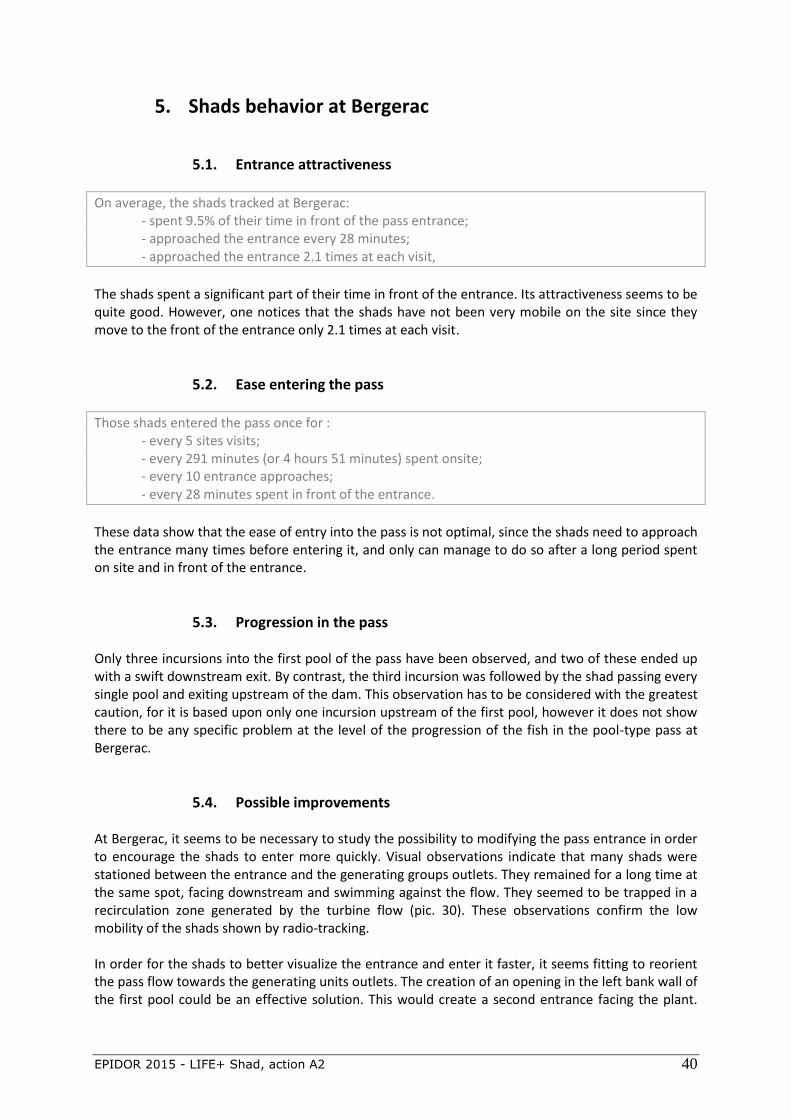
5.4. Possible improvements At Bergerac, it seems to be necessary to study the possibility to modifying the pass entrance in order to encourage the shads to enter more quickly. Visual observations indicate that many shads were stationed between the entrance and the generating groups outlets. They remained for a long time at the same spot, facing downstream and swimming against the flow. They seemed to be trapped in a recirculation zone generated by the turbine flow (pic. 30). These observations confirm the low mobility of the shads shown by radio-tracking. In order for the shads to better visualize the entrance and enter it faster, it seems fitting to reorient the pass flow towards the generating units outlets. The creation of an opening in the left bank wall of the first pool could be an effective solution. This would create a second entrance facing the plant.
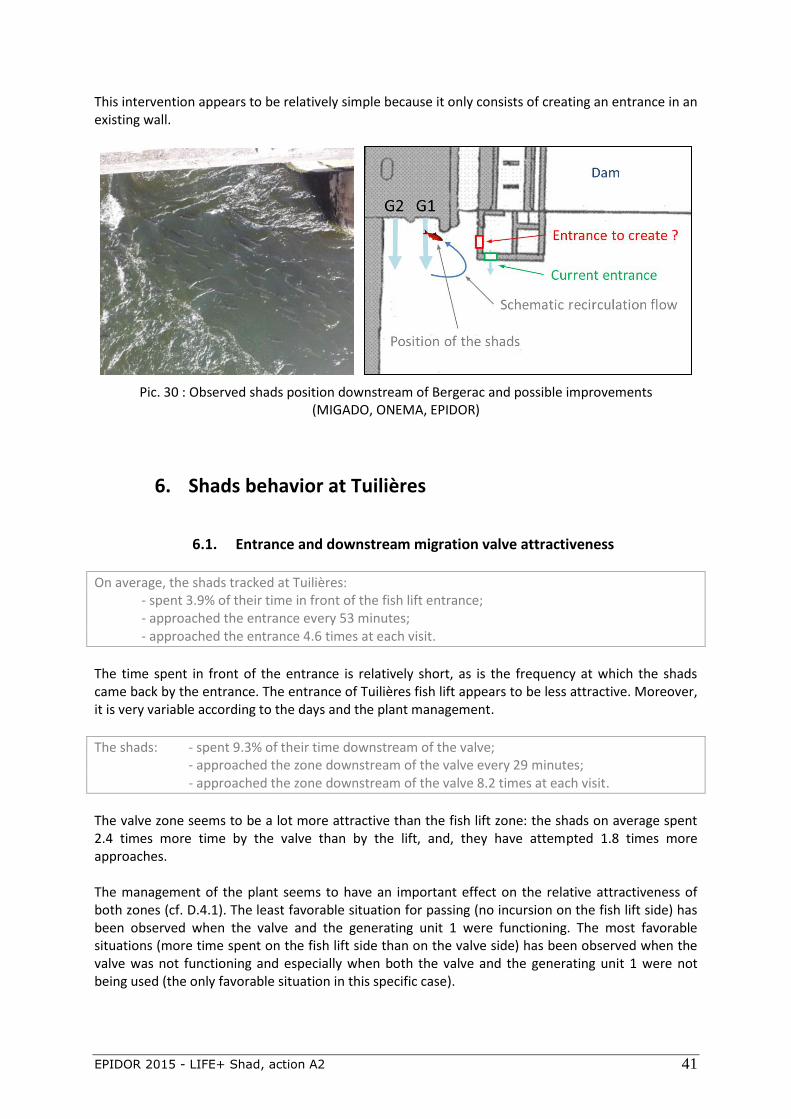
EPIDOR 2015 - LIFE+ Shad, action A2 41
This intervention appears to be relatively simple because it only consists of creating an entrance in an existing wall.
Pic. 30 : Observed shads position downstream of Bergerac and possible improvements (MIGADO, ONEMA, EPIDOR)
6. Shads behavior at Tuilières
6.1. Entrance and downstream migration valve attractiveness
On average, the shads tracked at Tuilières: - spent 3.9% of their time in front of the fish lift entrance; - approached the entrance every 53 minutes; - approached the entrance 4.6 times at each visit.
The time spent in front of the entrance is relatively short, as is the frequency at which the shads came back by the entrance. The entrance of Tuilières fish lift appears to be less attractive. Moreover, it is very variable according to the days and the plant management.
The shads: - spent 9.3% of their time downstream of the valve; - approached the zone downstream of the valve every 29 minutes; - approached the zone downstream of the valve 8.2 times at each visit.
The valve zone seems to be a lot more attractive than the fish lift zone: the shads on average spent 2.4 times more time by the valve than by the lift, and, they have attempted 1.8 times more approaches. The management of the plant seems to have an important effect on the relative attractiveness of both zones (cf. D.4.1). The least favorable situation for passing (no incursion on the fish lift side) has been observed when the valve and the generating unit 1 were functioning. The most favorable situations (more time spent on the fish lift side than on the valve side) has been observed when the valve was not functioning and especially when both the valve and the generating unit 1 were not being used (the only favorable situation in this specific case).
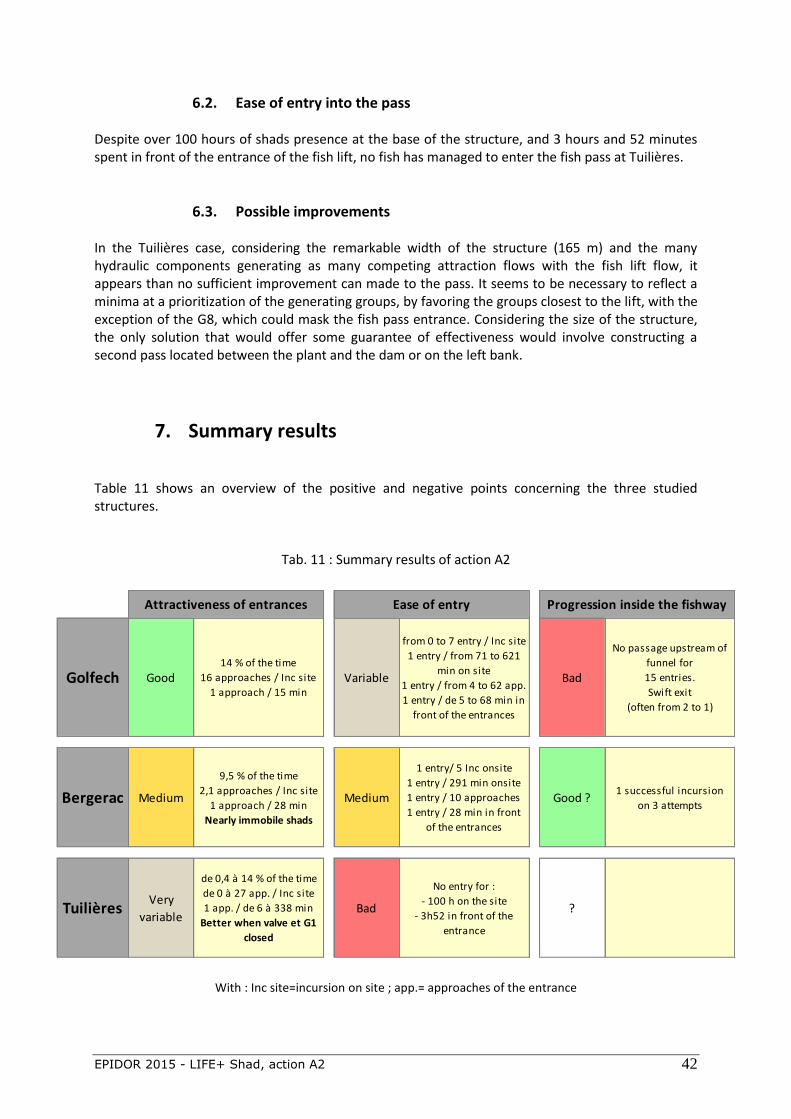
EPIDOR 2015 - LIFE+ Shad, action A2 42
Golfech Good14 % of the time
16 approaches / Inc site
1 approach / 15 minVariable
from 0 to 7 entry / Inc site
1 entry / from 71 to 621
min on site
1 entry / from 4 to 62 app.
1 entry / de 5 to 68 min in
front of the entrances
Bad
No passage upstream of
funnel for
15 entries.
Swift exit
(often from 2 to 1)
Bergerac Medium
9,5 % of the time
2,1 approaches / Inc site
1 approach / 28 min
Nearly immobile shads
Medium
1 entry/ 5 Inc onsite
1 entry / 291 min onsite
1 entry / 10 approaches
1 entry / 28 min in front
of the entrances
Good ?1 successful incursion
on 3 attempts
TuilièresVery
variable
de 0,4 à 14 % of the time
de 0 à 27 app. / Inc site
1 app. / de 6 à 338 min
Better when valve et G1
closed
Bad
No entry for :
- 100 h on the site
- 3h52 in front of the
entrance
?
Attractiveness of entrances Ease of entry Progression inside the fishway
6.2. Ease of entry into the pass Despite over 100 hours of shads presence at the base of the structure, and 3 hours and 52 minutes spent in front of the entrance of the fish lift, no fish has managed to enter the fish pass at Tuilières.
6.3. Possible improvements In the Tuilières case, considering the remarkable width of the structure (165 m) and the many hydraulic components generating as many competing attraction flows with the fish lift flow, it appears than no sufficient improvement can made to the pass. It seems to be necessary to reflect a minima at a prioritization of the generating groups, by favoring the groups closest to the lift, with the exception of the G8, which could mask the fish pass entrance. Considering the size of the structure, the only solution that would offer some guarantee of effectiveness would involve constructing a second pass located between the plant and the dam or on the left bank.
7. Summary results Table 11 shows an overview of the positive and negative points concerning the three studied structures.
Tab. 11 : Summary results of action A2
With : Inc site=incursion on site ; app.= approaches of the entrance
EPIDOR 2015 - LIFE+ Shad, action A2 43
CONCLUSION As an integral part of the LIFE+ project “Conservation and Restoration of the Allis shad in the Gironde and Rhine Watersheds”, this study aimed at, with the support of radio-telemetry, understanding the behavior of the shads at the base of the first structures on the Garonne-Dordogne, and identifying the problems that this species faces. This method has often been used with the atlantic Salmon, but is not widespread with the shad because of the fragility of the specie. Because of the sparse upstream migration observed in recent years, the number of tagged individuals has been - very considerably - much lower that anticipated. However, some of the difficulties faced by the shads when attempting to cross the structures have been identified. They are linked to the capacity of the individuals to approach the fish passes entrances frequently (in the case of Tuilières and Bergerac), to enter inside of the passes (in the case of Tuilières and sometimes of Golfech), or to continue in their progression upstream once inside of the passes (in the case of Golfech). The possible structure crossing improvements are neither obvious, nor easy to implement. If possible improvements are the modification of a part of the pass at Golfech (junction of the entrances) and at Bergerac (creation of a new entrance), they seem more complex at Tuilières, where it appears that the attractiveness of the combined elements of the site compared to the attractiveness of the sole fish lift does not allow for significant improvement to be made to the pass without undertaking a reflection on the structure as a whole and noticeably on the management of the different hydraulic components and the necessity of a second pass.
EPIDOR 2015 - LIFE+ Shad, action A2 44
BIBLIOGRAPHY BARAS E., BENECH V., MARMULLA G., 2001, Manuel de biotélémétrie aquatique, Document Atelier – Pilote ; IER-ODRS-IRD-ULg-FAO, 160p. BARAS E., CHERRY B., 1990, Seasonal activities of female Barbus barbus (L.) in the river Ourthe (Southern Belgium), as revealed by radio tracking. Aquatic Living Ressources, 3, 283-294. BARAS E., LAGARDERE J-P., 1995, Fish telemetry in aquaculture : review and perspectives. Aquaculture International, 3, 77-102. BENSETTITI F., GAUDILLAT V., 2004, Cahiers d'habitats Natura 2000. Connaissance et gestion des habitats et des espèces d'intérêt communautaire. Tome 7. Espèces animales. La Documentation française. 353 pp. CARRY L., CHONG S., 2009, Suivi de la reproduction de la grande alose sur la Garonne en 2008, rapport MIGADO 10G-09-RT, 21 p. CARRY L., DELPEYROUX J-M., 2008, Etude des rythmes de migration des espèces amphibiotiques et holobiotiques de la Garonne au niveau de la station de contrôle de Golfech au cours de l'année 2007, Rapport MI.GA.DO 10G-08-RT, 31 pp. CARRY L., GOUDARD A., 2009, Suivi de la reproduction de la grande alose sur la Garonne en 2009 - Suivi du comportement du silure au droit de l’usine hydroelectrique EDF de Golfech - Synthese 2006-2009, Rapport MIGADO 9G-RT-10, 32p. CASSOU-LEINS F., CASSOU-LEINS J-J., 1981, Recherches sur la biologie et l’halieutique des migrateurs de la Garonne et principalement de l’Alose, Alosa alosa L. Thèse doctorat 3ème cycle, Institut National Polytechnique de Toulouse, 382p. CAUT I., 2009, Suivi de la reproduction naturelle de l'alose vraie et de la lamproie marine - Suivi de la population de l’alose feinte (alosa fallax) du bassin Gironde-Garonne-Dordogne, rapport MIGADO 24D-10-RT, 48p. CEMAGREF, 2007, Etude de la franchissabilité de l’aménagement hydroélectrique de Golfech/Malause par le saumon atlantique. Rapport GHAAPPE RA07.07.
EPIDOR 2015 - LIFE+ Shad, action A2 45
CHANSEAU M., DARTIGUELONGUE J., LARINIER M., 2000, Analyse des données sur les passages enregistrés aux stations de contrôle des poissons migrateurs de Golfech et du Bazacle sur la Garonne et de Tuilières sur la Dordogne, Rapport GHAAPPE RA00.02 / MIGADO G14-00-RT, 64p. COUSTILLAS J., 2007, Localisation des zones de frai de la Lamproie marine (Petromyzon marinus L.) en moyenne Garonne - Etude du comportement de la Lamproie marine face à la problématique de franchissement du barrage hydroélectrique de Golfech - Etude du comportement du Silure glane (Silurus glanis L.) au droit du barrage de Golfech - Technique commune : la radiotélémétrie, Rapport de stage MIGADO - Université Paul Sabatier, 35p. CROZE O. 2008. Impact des seuils et barrages sur la migration anadrome du saumon atlantique (Salmo salar L.) : caractérisation et modélisation des processus de franchissement. pp 1-34. EPTB Charente, 2010, Compte rendu Commission de suivi poissons migrateurs du bassin de la Charente. FARGEIX S., GUERRI O., CHANSEAU M., 2011, Etude par radiotélémétrie de la migration du Saumon atlantique (Salmo salar) au niveau des barrages du Bergeracois sur la rivière Dordogne - Campagne de suivi 2010, Rapport EPIDOR, 68 p. ROCHE P., BALLE G., BROSSE L., DELHOM J., GOMES P., LEBEL I., SUBRA S., VANEL N., 2007, Etude par radiopistage de la migration de l’Alose dans le Rhône aval – Rapport final – Synthèse 2004 2005 2006, Rapport CNR CSP, 60p. STEINBACH P., GUENEAU P., AUTUORO A., BROUSSARD D., 1986, Radio-pistage de grandes aloses adultes en Loire, Bulletin Français de Pêche et de Pisciculture n°302 : 106-117, 11p. www.geoportail.fr

Etablissement Public Territorial du Bassin de la Dordogne Place de la laïcité
24250 Castelnaud-la-Chapelle
05.53.29.17.65 [email protected]
www.eptb-dordogne.fr
Financial partners
Technical partners