Embed Size (px)
Citation preview
Climatic Change manuscript No.(will be inserted by the editor)
Projected Changes in the Physical Climate of the Gulf Coast and Caribbean
Michela Biasutti · Adam H. Sobel · Suzana J. Camargo ·Timothy T. Creyts
Received: date / Accepted: date
Abstract As the global climate warms due to increasing greenhouse gases, the regional climate of the Gulf ofMexico and Caribbean region will also change. This study presents the latest estimates of the expected changesin temperature, precipitation, tropical cyclone activity, and sea level.
Changes in temperature and precipitation are derived from climate model simulations produced for the FourthAssessment Report of the Intergovernmental Panel on Climate Change (IPCC AR4), by comparing projections forthe mid- and late-21st century to the late 20th century and assuming a ”middle-of-the-road” scenario for futuregreenhouse gas emissions. Regional simulations from the North America Regional Climate Change Program(NARCCAP) are used to corroborate the IPCC AR4 rainfall projections over the US portion of the domain.
Changes in tropical cyclones and sea level are more uncertain, and our understanding of these variables haschanged more since IPCC AR4 than in the case of temperature and precipitation. For these quantities, the currentstate of knowledge is described based on the recent peer-reviewed literature.
Keywords Climate Change · Gulf Coast · Caribbean
1 Introduction
The nations of the Gulf Coast and Caribbean lie in the region comprised by the Gulf of Mexico, CaribbeanSea, and the tropical portion of the western Atlantic ocean; the coastal portions of the North, Central, and SouthAmerican land masses that enclose them on three sides; and the Caribbean islands. This is a low-latitude region ofthe earth, whose proximity to the equator and maritime geography render its climate generally warm and humid.
Rainfall is present throughout the year, evenly distributed between the seasons in the Gulf region but moreconcentrated during the summer and fall rainy season in the Caribbean, and nearly the whole region is threatened(to varying degrees) by hurricanes during the months between May and October. Yet much of the region lies inthe subtropical latitudes which, elsewhere on the earth, feature deserts, and parts of the Gulf Coast and Caribbeanregion can also be threatened by drought.
As the global climate changes, the regional climate of the Gulf Coast and Caribbean will change as well.Some of the ways in which it will change are fairly certain, while others are much less so. We cannot predict with
M. BiasuttiLamont-Doherty Earth Observatory of Columbia University,Palisades, NY 10964Tel.: +1-845-365-8512Fax: +1-845-365-8736E-mail: [email protected]
A. H. SobelLamont-Doherty Earth Observatory of Columbia UniversityDepartment of Applied Physics and Applied MathematicsDepartment of Earth and Environmental Sciences
S. J. CamargoLamont-Doherty Earth Observatory of Columbia University
T. T. CreytsLamont-Doherty Earth Observatory of Columbia University
precision all the ways in which the nations, people, and economies of the region will be harmed (or will benefit)from climate change. Some of the vulnerabilities are clear, however.
In a region that is already warm, increases in temperature — accompanied almost inevitably by increasesin specific humidity — may constitute the most obvious and predictable hazard. Precipitation is a more subtlematter, predicted to increase in some places and decrease in others, and in any case predicted with less certaintythan temperature. Whether an increase or a decrease in precipitation is considered harmful or beneficial may alsovary across the region. Hurricanes may be the most feared hazard in the present climate. How they will change asthe climate warms is relatively uncertain, but very focused research from the last several years suggests they willbe fewer, but more intense. Sea level rise is a major threat to this region of coasts and islands, both on its own andwhen coupled with hurricane-induced storm surge; it is inexorable, but the speed with which it will occur is verydifficult to predict, depending not only on the rate of global warming but also on the subtle dynamics of polar icesheets far away.
In this paper, we review the most recent state of knowledge about what changes in climate are expected in theGulf Coast and Caribbean. We focus on temperature, precipitation, hurricanes, and sea level. We do not attempt tocharacterize what the impacts of these changes will be, instead limiting ourselves to a discussion of the physicalclimate alone. We do describe the changes in terms that we expect to be relevant to a variety of societal impacts.
Some regional assessment reports based on the same climate scenarios simulations have been produced, e.g.,for the US (Karl et al. 2009) or the Caribbean (Bueno et al. 2008). Our treatment here differs in focusing onthe Gulf coast and Caribbean together, in our focus on the projected physical changes (as opposed to on recentclimatic trends or on the economic impact of future climatic trends), in our use of regional simulations, and in ourtreatment of tropical cyclones and sea level, and perhaps in some other aspects of our interpretation. The essentialelements of our discussion are, however, consistent with the broad scientific consensus reflected in IPCC AR4,particularly regarding temperature and precipitation.
2 Data and Methodology
For temperature and precipitation, we make use of the global climate model simulations performed under theThird Coupled Model Intercomparison Project (CMIP3; Meehl et al. 2007) for the purpose of the Fourth Assess-ment Report (AR4; IPCC 2007) of the Intergovernmental Panel on Climate Change (IPCC). These simulations,and the models used to produce them, are described in greater detail in IPCC AR4 (and the peer-reviewed lit-erature on which that report is based). For the US, we supplement the AR4 simulations with more recent high-resolution (about a third of a degree) regional simulations from the North America Regional Climate ChangeAssessment Program (NARCCAP). In these simulations, different regional models are integrated with boundaryconditions provided from coupled models from the IPCC AR4 archives; at this time, four such simulations areavailable, using a combination of three regional and three global models. More information on the NARCCAPsimulations can be found here: http://www.narccap.ucar.edu/about/index.html.
The large set of global climate model simulations done for IPCC offers the best scientific basis we have formaking detailed projections about how climate will change in a specific region. They are not predictions, butscenarios, contingent on assumptions about how anthropogenic emissions of greenhouse gases, as well as otherfactors which are external to the climate system but which influence it, will evolve in the future. It is virtuallycertain that anthropogenic emissions of greenhouse gases have been warming the global climate for some timeand will continue to do so (most likely at a greater rate) in the future. The precise rate of warming we expect inthe future is somewhat more uncertain. One source of uncertainty is our incomplete understanding of the climatesystem, as manifest by the fact that different climate models project different rates of global mean warming evenfor the same increases in greenhouse gas concentrations. Another — probably greater — source of uncertaintyis that due to our uncertainty about future greenhouse gas emissions. This results from our inability to predicteconomic and political developments rather than the physics of the climate system.
In this report we use results from the A1B scenario of the IPCC AR4. This is considered a “middle-of-the-road scenario, neither worst-case nor best-case (see fig. 1). It is possible (though it seems unlikely in the shortterm) that reductions in emissions will cause the rate at which greenhouse gases increase to be less than that inA1B, leading to less warming. It is also quite possible that the increases in greenhouse gases will be significantlymore rapid than in A1B, leading to faster warming than that in the A1B projections. Many (though not all) ofthe results are to some degree linearly proportional to the global mean surface temperature change: if the rate ofglobal warming is less or greater than that in A1B by some factor, the change in local temperature or precipitationin the A1B projections is also likely to be less or greater by a similar factor.
The changes we show are computed by averaging the physical quantity (e.g., temperature, precipitation) fora future period in the A1B projections, and subtracting the same quantity averaged over a period of the same
2
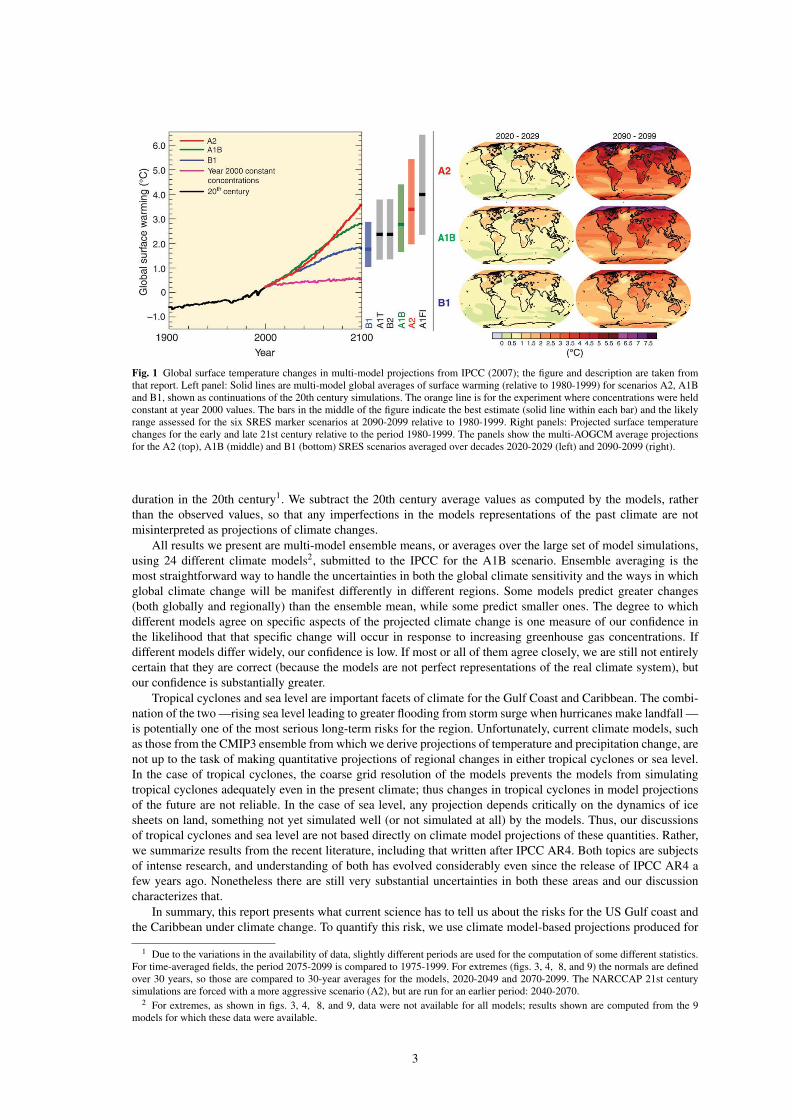
Fig. 1 Global surface temperature changes in multi-model projections from IPCC (2007); the figure and description are taken fromthat report. Left panel: Solid lines are multi-model global averages of surface warming (relative to 1980-1999) for scenarios A2, A1Band B1, shown as continuations of the 20th century simulations. The orange line is for the experiment where concentrations were heldconstant at year 2000 values. The bars in the middle of the figure indicate the best estimate (solid line within each bar) and the likelyrange assessed for the six SRES marker scenarios at 2090-2099 relative to 1980-1999. Right panels: Projected surface temperaturechanges for the early and late 21st century relative to the period 1980-1999. The panels show the multi-AOGCM average projectionsfor the A2 (top), A1B (middle) and B1 (bottom) SRES scenarios averaged over decades 2020-2029 (left) and 2090-2099 (right).
duration in the 20th century1. We subtract the 20th century average values as computed by the models, ratherthan the observed values, so that any imperfections in the models representations of the past climate are notmisinterpreted as projections of climate changes.
All results we present are multi-model ensemble means, or averages over the large set of model simulations,using 24 different climate models2, submitted to the IPCC for the A1B scenario. Ensemble averaging is themost straightforward way to handle the uncertainties in both the global climate sensitivity and the ways in whichglobal climate change will be manifest differently in different regions. Some models predict greater changes(both globally and regionally) than the ensemble mean, while some predict smaller ones. The degree to whichdifferent models agree on specific aspects of the projected climate change is one measure of our confidence inthe likelihood that that specific change will occur in response to increasing greenhouse gas concentrations. Ifdifferent models differ widely, our confidence is low. If most or all of them agree closely, we are still not entirelycertain that they are correct (because the models are not perfect representations of the real climate system), butour confidence is substantially greater.
Tropical cyclones and sea level are important facets of climate for the Gulf Coast and Caribbean. The combi-nation of the two —rising sea level leading to greater flooding from storm surge when hurricanes make landfall —is potentially one of the most serious long-term risks for the region. Unfortunately, current climate models, suchas those from the CMIP3 ensemble from which we derive projections of temperature and precipitation change, arenot up to the task of making quantitative projections of regional changes in either tropical cyclones or sea level.In the case of tropical cyclones, the coarse grid resolution of the models prevents the models from simulatingtropical cyclones adequately even in the present climate; thus changes in tropical cyclones in model projectionsof the future are not reliable. In the case of sea level, any projection depends critically on the dynamics of icesheets on land, something not yet simulated well (or not simulated at all) by the models. Thus, our discussionsof tropical cyclones and sea level are not based directly on climate model projections of these quantities. Rather,we summarize results from the recent literature, including that written after IPCC AR4. Both topics are subjectsof intense research, and understanding of both has evolved considerably even since the release of IPCC AR4 afew years ago. Nonetheless there are still very substantial uncertainties in both these areas and our discussioncharacterizes that.
In summary, this report presents what current science has to tell us about the risks for the US Gulf coast andthe Caribbean under climate change. To quantify this risk, we use climate model-based projections produced for
1 Due to the variations in the availability of data, slightly different periods are used for the computation of some different statistics.For time-averaged fields, the period 2075-2099 is compared to 1975-1999. For extremes (figs. 3, 4, 8, and 9) the normals are definedover 30 years, so those are compared to 30-year averages for the models, 2020-2049 and 2070-2099. The NARCCAP 21st centurysimulations are forced with a more aggressive scenario (A2), but are run for an earlier period: 2040-2070.
2 For extremes, as shown in figs. 3, 4, 8, and 9, data were not available for all models; results shown are computed from the 9models for which these data were available.
3
Winter (DJF)
90W 60W
20N
Spring (MAM)
90W 60W
20N
Summer (JJA)
90W 60W
20N
Fall (SON)
90W 60W
20N
0
1
2
3
4
5
0
1
2
3
4
5
0
1
2
3
4
5
0
1
2
3
4
5
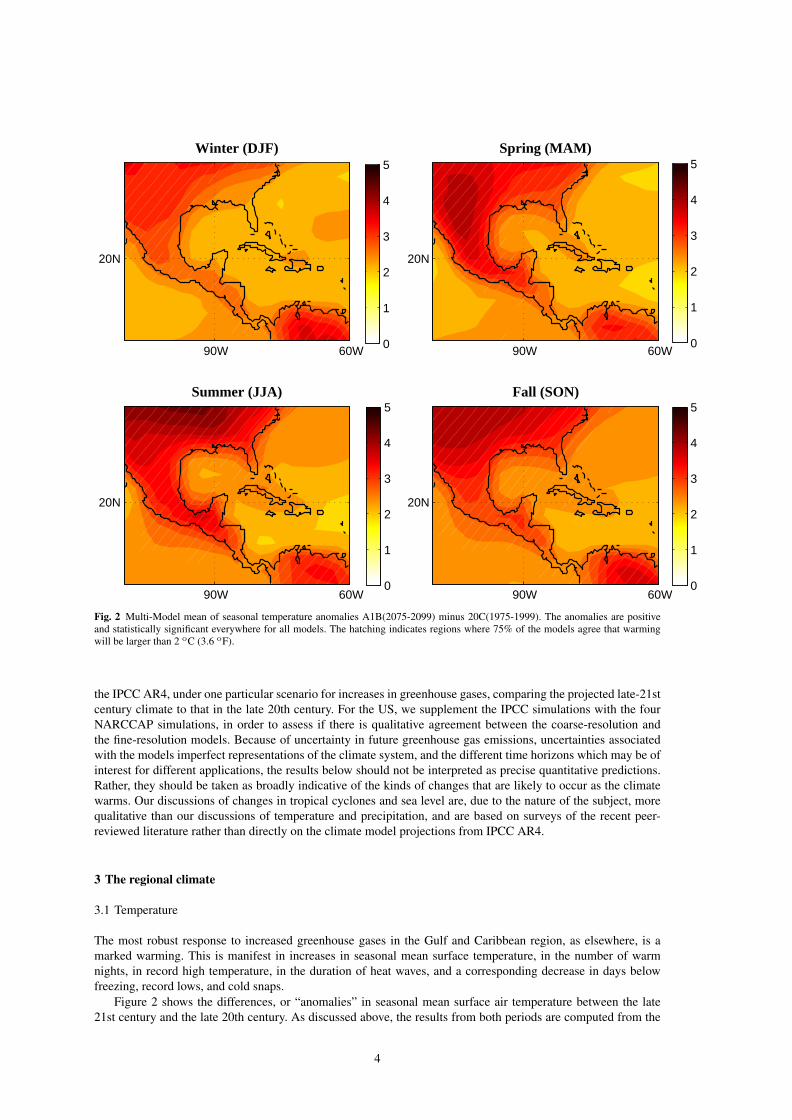
Fig. 2 Multi-Model mean of seasonal temperature anomalies A1B(2075-2099) minus 20C(1975-1999). The anomalies are positiveand statistically significant everywhere for all models. The hatching indicates regions where 75% of the models agree that warmingwill be larger than 2 oC (3.6 oF).
the IPCC AR4, under one particular scenario for increases in greenhouse gases, comparing the projected late-21stcentury climate to that in the late 20th century. For the US, we supplement the IPCC simulations with the fourNARCCAP simulations, in order to assess if there is qualitative agreement between the coarse-resolution andthe fine-resolution models. Because of uncertainty in future greenhouse gas emissions, uncertainties associatedwith the models imperfect representations of the climate system, and the different time horizons which may be ofinterest for different applications, the results below should not be interpreted as precise quantitative predictions.Rather, they should be taken as broadly indicative of the kinds of changes that are likely to occur as the climatewarms. Our discussions of changes in tropical cyclones and sea level are, due to the nature of the subject, morequalitative than our discussions of temperature and precipitation, and are based on surveys of the recent peer-reviewed literature rather than directly on the climate model projections from IPCC AR4.
3 The regional climate
3.1 Temperature
The most robust response to increased greenhouse gases in the Gulf and Caribbean region, as elsewhere, is amarked warming. This is manifest in increases in seasonal mean surface temperature, in the number of warmnights, in record high temperature, in the duration of heat waves, and a corresponding decrease in days belowfreezing, record lows, and cold snaps.
Figure 2 shows the differences, or “anomalies” in seasonal mean surface air temperature between the late21st century and the late 20th century. As discussed above, the results from both periods are computed from the
4
HWDI 20C normal
90W 60W
20N
HWDI mid 21C
90W 60W
20N
HWDI late 21C
90W 60W
20N
0
50
100
0
50
100
0
50
100
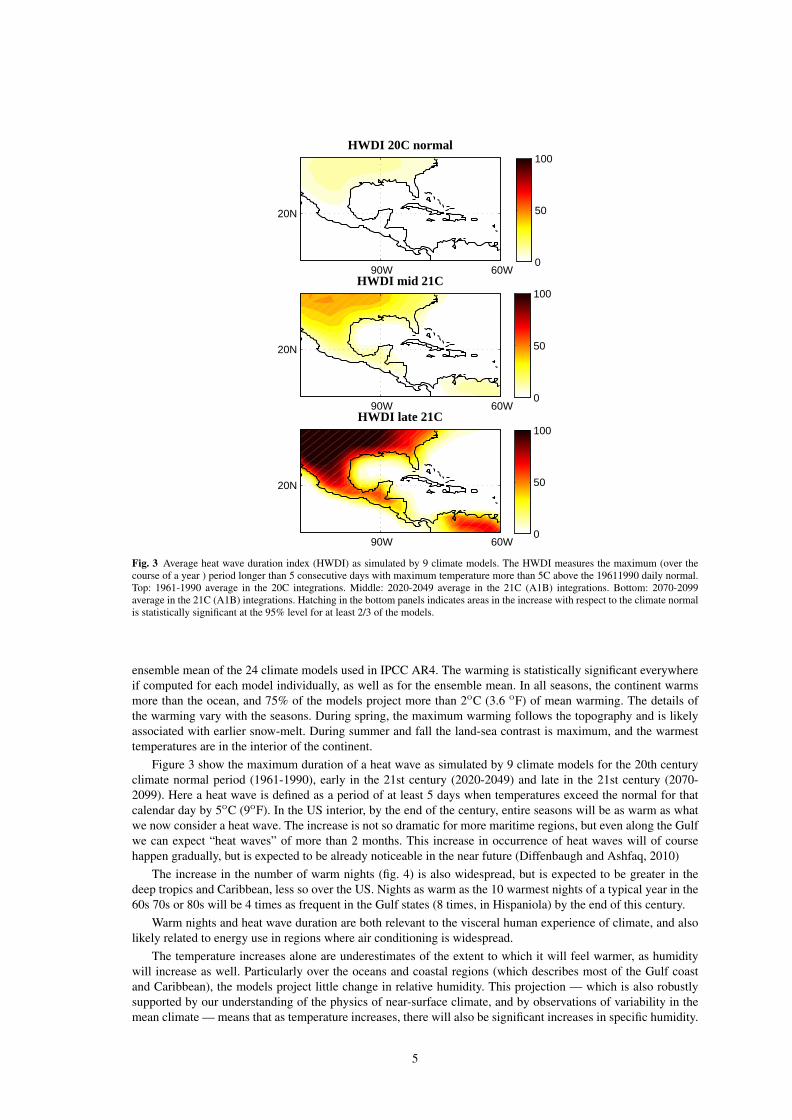
Fig. 3 Average heat wave duration index (HWDI) as simulated by 9 climate models. The HWDI measures the maximum (over thecourse of a year ) period longer than 5 consecutive days with maximum temperature more than 5C above the 19611990 daily normal.Top: 1961-1990 average in the 20C integrations. Middle: 2020-2049 average in the 21C (A1B) integrations. Bottom: 2070-2099average in the 21C (A1B) integrations. Hatching in the bottom panels indicates areas in the increase with respect to the climate normalis statistically significant at the 95% level for at least 2/3 of the models.
ensemble mean of the 24 climate models used in IPCC AR4. The warming is statistically significant everywhereif computed for each model individually, as well as for the ensemble mean. In all seasons, the continent warmsmore than the ocean, and 75% of the models project more than 2oC (3.6 oF) of mean warming. The details ofthe warming vary with the seasons. During spring, the maximum warming follows the topography and is likelyassociated with earlier snow-melt. During summer and fall the land-sea contrast is maximum, and the warmesttemperatures are in the interior of the continent.
Figure 3 show the maximum duration of a heat wave as simulated by 9 climate models for the 20th centuryclimate normal period (1961-1990), early in the 21st century (2020-2049) and late in the 21st century (2070-2099). Here a heat wave is defined as a period of at least 5 days when temperatures exceed the normal for thatcalendar day by 5oC (9oF). In the US interior, by the end of the century, entire seasons will be as warm as whatwe now consider a heat wave. The increase is not so dramatic for more maritime regions, but even along the Gulfwe can expect “heat waves” of more than 2 months. This increase in occurrence of heat waves will of coursehappen gradually, but is expected to be already noticeable in the near future (Diffenbaugh and Ashfaq, 2010)
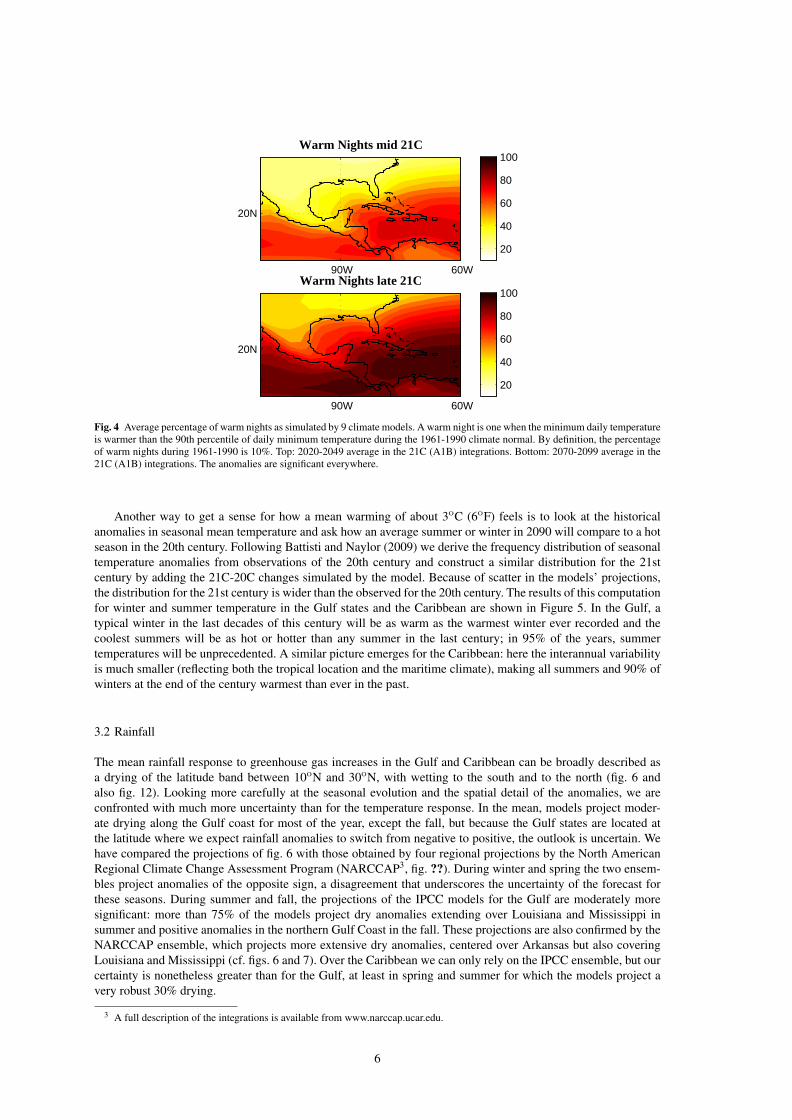
The increase in the number of warm nights (fig. 4) is also widespread, but is expected to be greater in thedeep tropics and Caribbean, less so over the US. Nights as warm as the 10 warmest nights of a typical year in the60s 70s or 80s will be 4 times as frequent in the Gulf states (8 times, in Hispaniola) by the end of this century.
Warm nights and heat wave duration are both relevant to the visceral human experience of climate, and alsolikely related to energy use in regions where air conditioning is widespread.
The temperature increases alone are underestimates of the extent to which it will feel warmer, as humiditywill increase as well. Particularly over the oceans and coastal regions (which describes most of the Gulf coastand Caribbean), the models project little change in relative humidity. This projection — which is also robustlysupported by our understanding of the physics of near-surface climate, and by observations of variability in themean climate — means that as temperature increases, there will also be significant increases in specific humidity.
5
Warm Nights mid 21C
90W 60W
20N
Warm Nights late 21C
90W 60W
20N
20
40
60
80
100
20
40
60
80
100
Fig. 4 Average percentage of warm nights as simulated by 9 climate models. A warm night is one when the minimum daily temperatureis warmer than the 90th percentile of daily minimum temperature during the 1961-1990 climate normal. By definition, the percentageof warm nights during 1961-1990 is 10%. Top: 2020-2049 average in the 21C (A1B) integrations. Bottom: 2070-2099 average in the21C (A1B) integrations. The anomalies are significant everywhere.
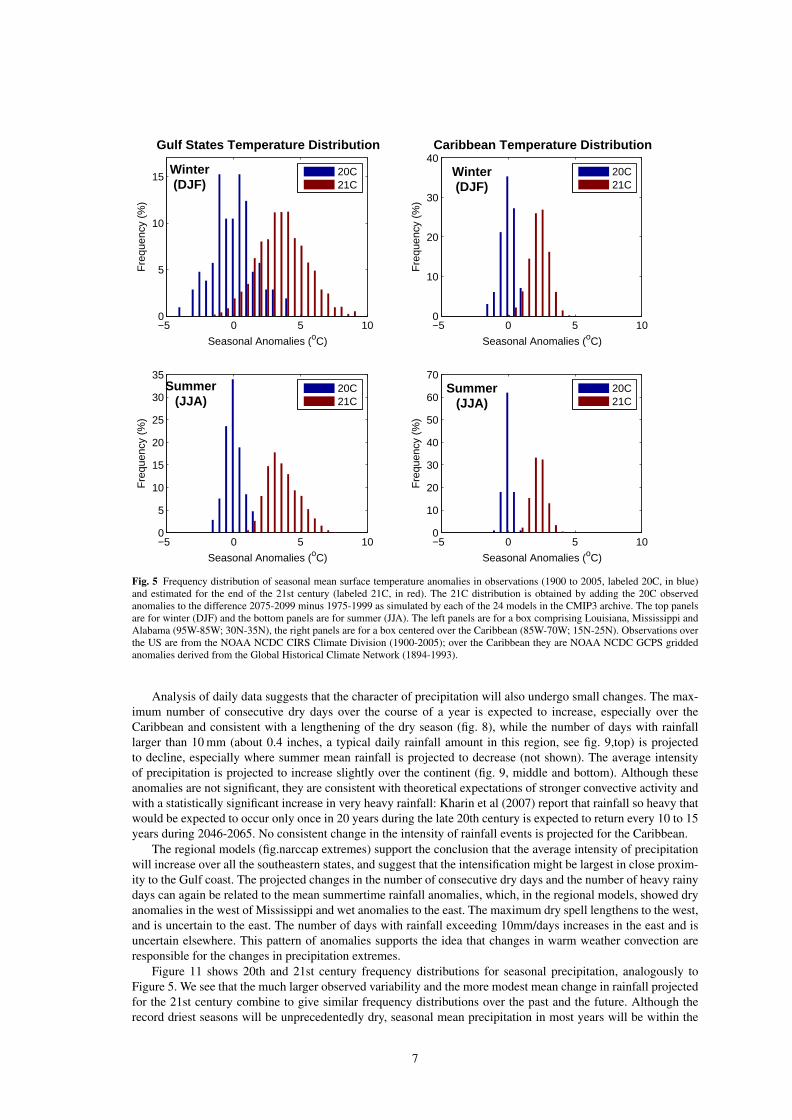
Another way to get a sense for how a mean warming of about 3oC (6oF) feels is to look at the historicalanomalies in seasonal mean temperature and ask how an average summer or winter in 2090 will compare to a hotseason in the 20th century. Following Battisti and Naylor (2009) we derive the frequency distribution of seasonaltemperature anomalies from observations of the 20th century and construct a similar distribution for the 21stcentury by adding the 21C-20C changes simulated by the model. Because of scatter in the models’ projections,the distribution for the 21st century is wider than the observed for the 20th century. The results of this computationfor winter and summer temperature in the Gulf states and the Caribbean are shown in Figure 5. In the Gulf, atypical winter in the last decades of this century will be as warm as the warmest winter ever recorded and thecoolest summers will be as hot or hotter than any summer in the last century; in 95% of the years, summertemperatures will be unprecedented. A similar picture emerges for the Caribbean: here the interannual variabilityis much smaller (reflecting both the tropical location and the maritime climate), making all summers and 90% ofwinters at the end of the century warmest than ever in the past.
3.2 Rainfall
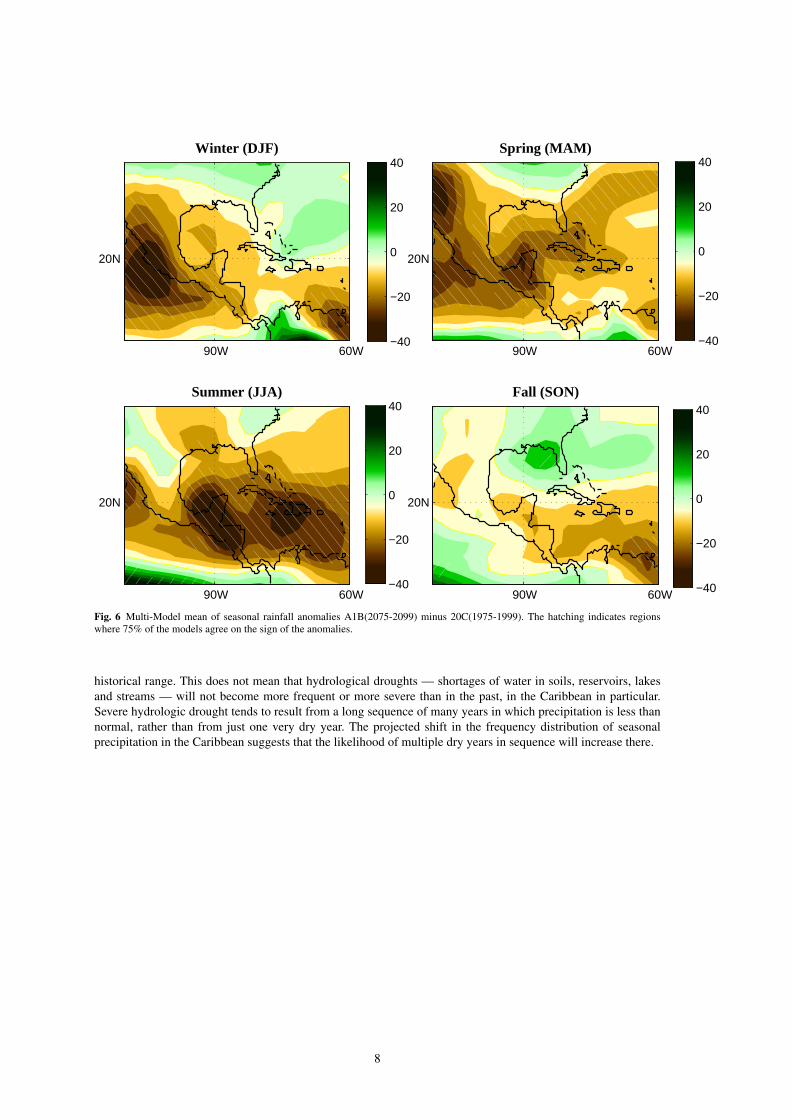
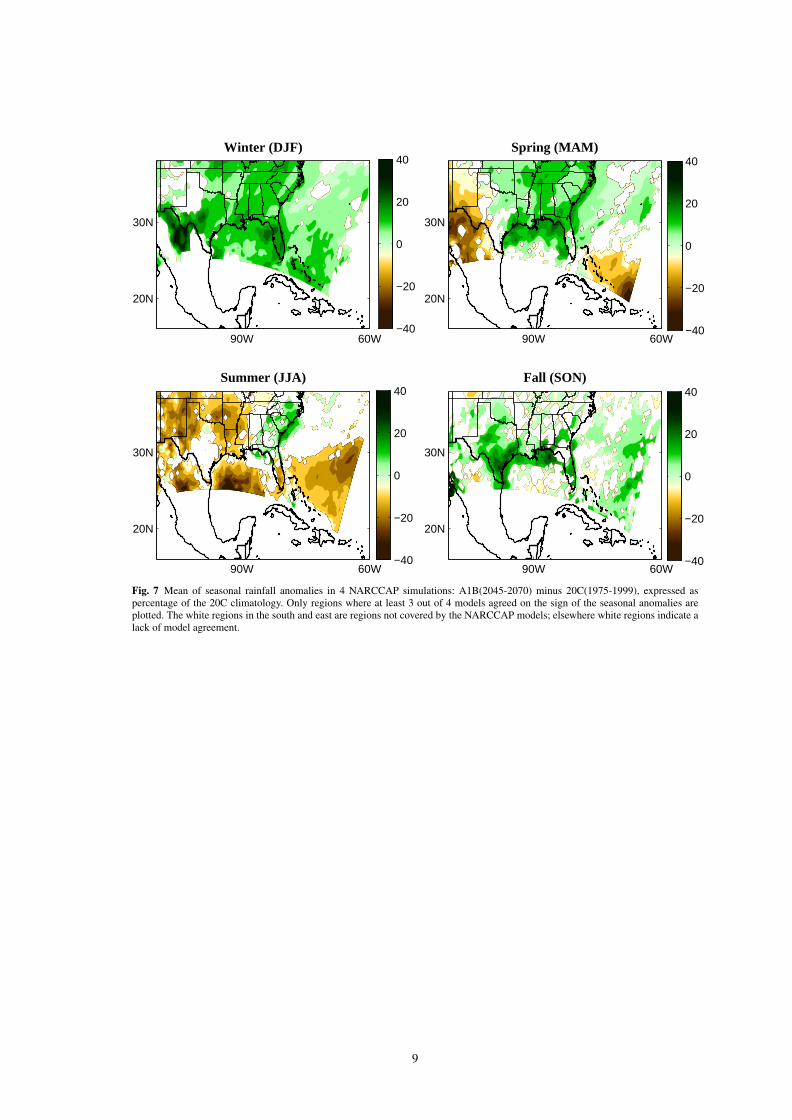
The mean rainfall response to greenhouse gas increases in the Gulf and Caribbean can be broadly described asa drying of the latitude band between 10oN and 30oN, with wetting to the south and to the north (fig. 6 andalso fig. 12). Looking more carefully at the seasonal evolution and the spatial detail of the anomalies, we areconfronted with much more uncertainty than for the temperature response. In the mean, models project moder-ate drying along the Gulf coast for most of the year, except the fall, but because the Gulf states are located atthe latitude where we expect rainfall anomalies to switch from negative to positive, the outlook is uncertain. Wehave compared the projections of fig. 6 with those obtained by four regional projections by the North AmericanRegional Climate Change Assessment Program (NARCCAP3, fig. ??). During winter and spring the two ensem-bles project anomalies of the opposite sign, a disagreement that underscores the uncertainty of the forecast forthese seasons. During summer and fall, the projections of the IPCC models for the Gulf are moderately moresignificant: more than 75% of the models project dry anomalies extending over Louisiana and Mississippi insummer and positive anomalies in the northern Gulf Coast in the fall. These projections are also confirmed by theNARCCAP ensemble, which projects more extensive dry anomalies, centered over Arkansas but also coveringLouisiana and Mississippi (cf. figs. 6 and 7). Over the Caribbean we can only rely on the IPCC ensemble, but ourcertainty is nonetheless greater than for the Gulf, at least in spring and summer for which the models project avery robust 30% drying.
3 A full description of the integrations is available from www.narccap.ucar.edu.
6
−5 0 5 100
10
20
30
40
50
60
70
Seasonal Anomalies (oC)
Fre
quen
cy (
%)
Summer
(JJA)
−5 0 5 100
10
20
30
40
Seasonal Anomalies (oC)
Fre
quen
cy (
%)
Caribbean Temperature Distribution
Winter(DJF)
−5 0 5 100
5
10
15
20
25
30
35
Seasonal Anomalies (oC)
Fre
quen
cy (
%)
Summer
(JJA)20C21C
−5 0 5 100
5
10
15
Seasonal Anomalies (oC)
Fre
quen
cy (
%)
Gulf States Temperature Distribution
Winter(DJF)
20C21C
20C21C
20C21C
Fig. 5 Frequency distribution of seasonal mean surface temperature anomalies in observations (1900 to 2005, labeled 20C, in blue)and estimated for the end of the 21st century (labeled 21C, in red). The 21C distribution is obtained by adding the 20C observedanomalies to the difference 2075-2099 minus 1975-1999 as simulated by each of the 24 models in the CMIP3 archive. The top panelsare for winter (DJF) and the bottom panels are for summer (JJA). The left panels are for a box comprising Louisiana, Mississippi andAlabama (95W-85W; 30N-35N), the right panels are for a box centered over the Caribbean (85W-70W; 15N-25N). Observations overthe US are from the NOAA NCDC CIRS Climate Division (1900-2005); over the Caribbean they are NOAA NCDC GCPS griddedanomalies derived from the Global Historical Climate Network (1894-1993).
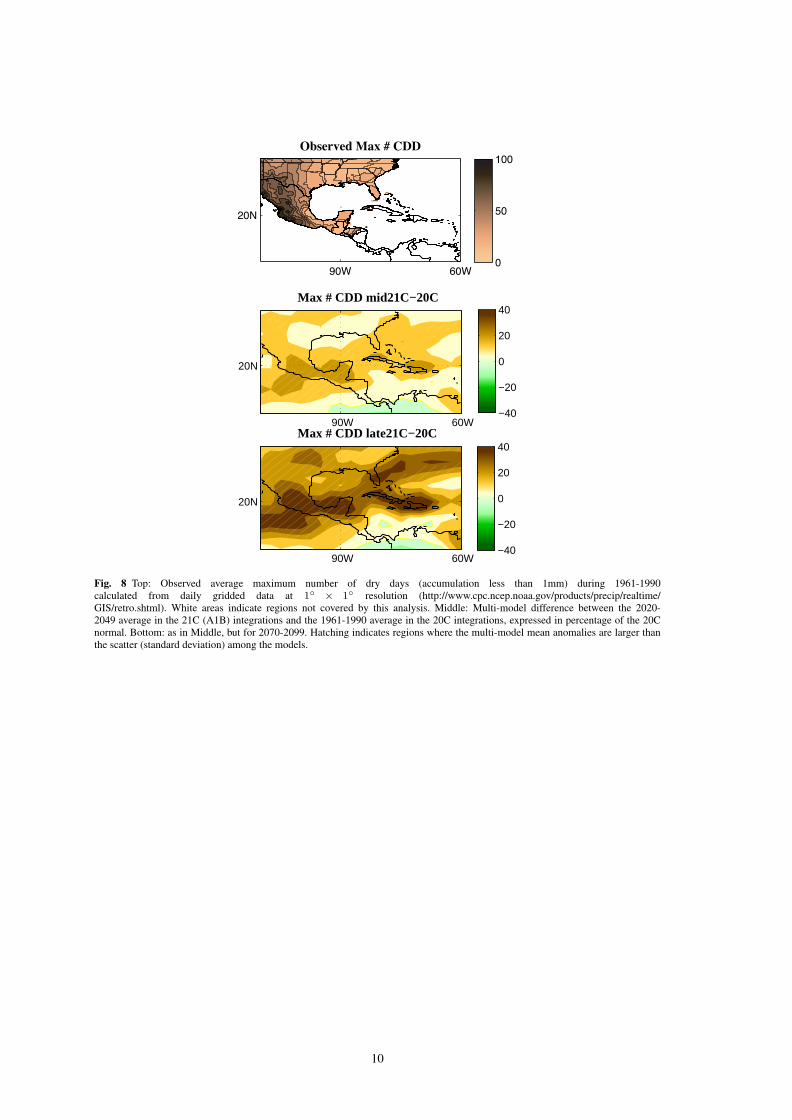
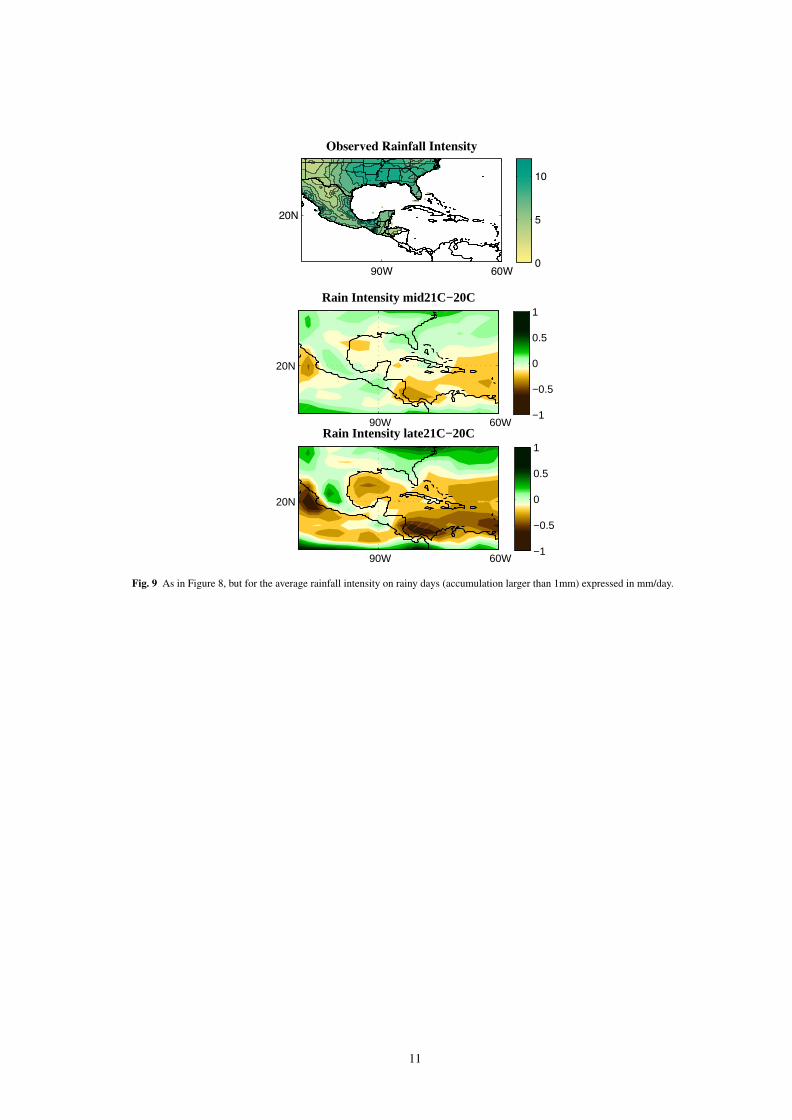
Analysis of daily data suggests that the character of precipitation will also undergo small changes. The max-imum number of consecutive dry days over the course of a year is expected to increase, especially over theCaribbean and consistent with a lengthening of the dry season (fig. 8), while the number of days with rainfalllarger than 10 mm (about 0.4 inches, a typical daily rainfall amount in this region, see fig. 9,top) is projectedto decline, especially where summer mean rainfall is projected to decrease (not shown). The average intensityof precipitation is projected to increase slightly over the continent (fig. 9, middle and bottom). Although theseanomalies are not significant, they are consistent with theoretical expectations of stronger convective activity andwith a statistically significant increase in very heavy rainfall: Kharin et al (2007) report that rainfall so heavy thatwould be expected to occur only once in 20 years during the late 20th century is expected to return every 10 to 15years during 2046-2065. No consistent change in the intensity of rainfall events is projected for the Caribbean.
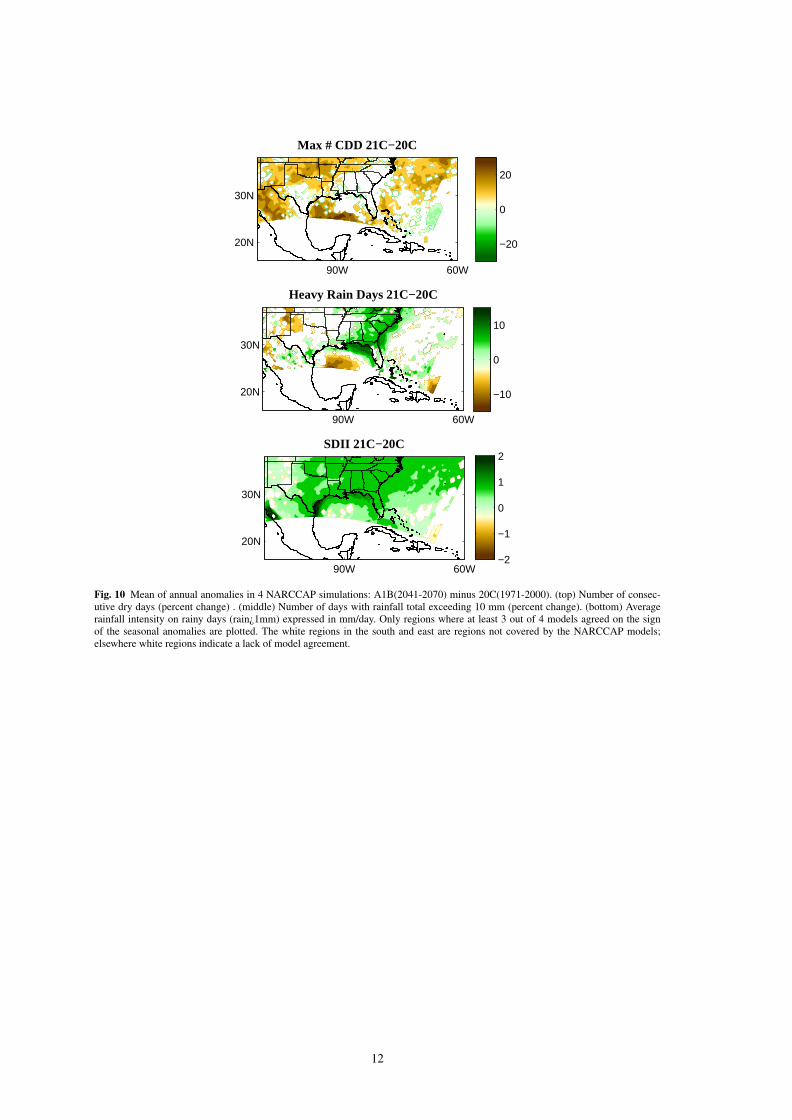
The regional models (fig.narccap extremes) support the conclusion that the average intensity of precipitationwill increase over all the southeastern states, and suggest that the intensification might be largest in close proxim-ity to the Gulf coast. The projected changes in the number of consecutive dry days and the number of heavy rainydays can again be related to the mean summertime rainfall anomalies, which, in the regional models, showed dryanomalies in the west of Mississippi and wet anomalies to the east. The maximum dry spell lengthens to the west,and is uncertain to the east. The number of days with rainfall exceeding 10mm/days increases in the east and isuncertain elsewhere. This pattern of anomalies supports the idea that changes in warm weather convection areresponsible for the changes in precipitation extremes.
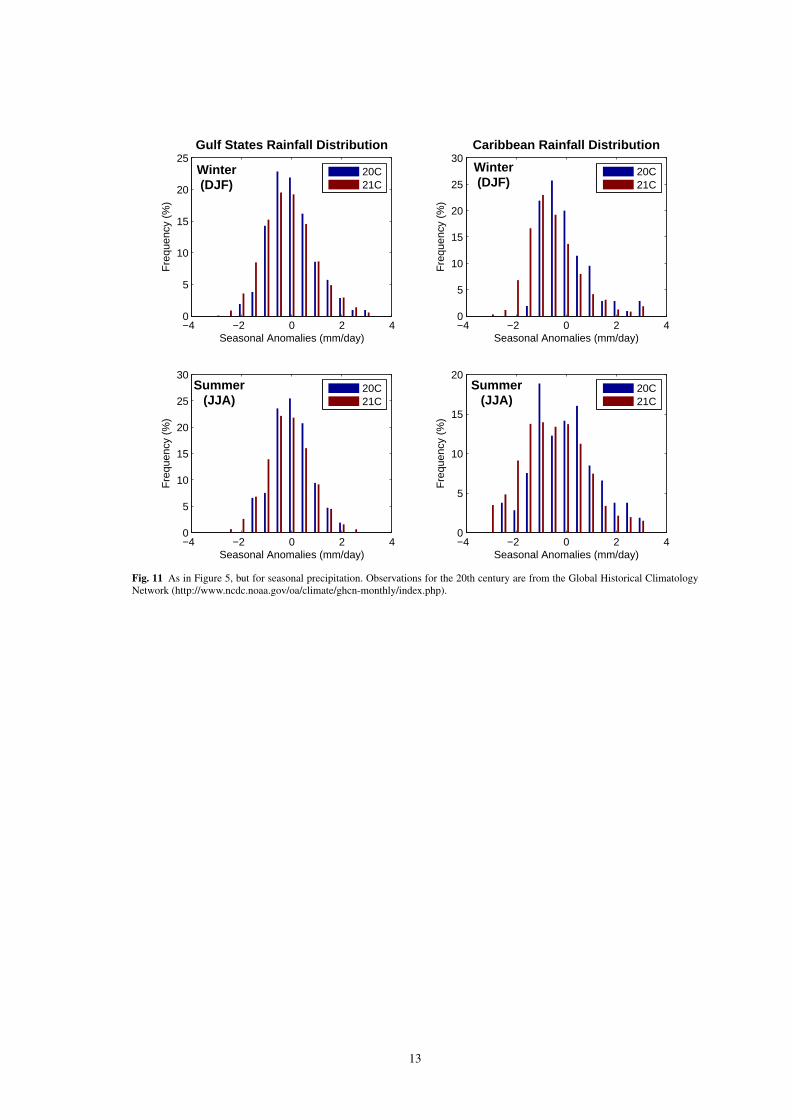
Figure 11 shows 20th and 21st century frequency distributions for seasonal precipitation, analogously toFigure 5. We see that the much larger observed variability and the more modest mean change in rainfall projectedfor the 21st century combine to give similar frequency distributions over the past and the future. Although therecord driest seasons will be unprecedentedly dry, seasonal mean precipitation in most years will be within the
7
Winter (DJF)
90W 60W
20N
Spring (MAM)
90W 60W
20N
Summer (JJA)
90W 60W
20N
Fall (SON)
90W 60W
20N
−40
−20
0
20
40
−40
−20
0
20
40
−40
−20
0
20
40
−40
−20
0
20
40
Fig. 6 Multi-Model mean of seasonal rainfall anomalies A1B(2075-2099) minus 20C(1975-1999). The hatching indicates regionswhere 75% of the models agree on the sign of the anomalies.
historical range. This does not mean that hydrological droughts — shortages of water in soils, reservoirs, lakesand streams — will not become more frequent or more severe than in the past, in the Caribbean in particular.Severe hydrologic drought tends to result from a long sequence of many years in which precipitation is less thannormal, rather than from just one very dry year. The projected shift in the frequency distribution of seasonalprecipitation in the Caribbean suggests that the likelihood of multiple dry years in sequence will increase there.
8
Winter (DJF)
90W 60W
20N
30N
−40
−20
0
20
40Spring (MAM)
90W 60W
20N
30N
−40
−20
0
20
40
Summer (JJA)
90W 60W
20N
30N
−40
−20
0
20
40Fall (SON)
90W 60W
20N
30N
−40
−20
0
20
40
Fig. 7 Mean of seasonal rainfall anomalies in 4 NARCCAP simulations: A1B(2045-2070) minus 20C(1975-1999), expressed aspercentage of the 20C climatology. Only regions where at least 3 out of 4 models agreed on the sign of the seasonal anomalies areplotted. The white regions in the south and east are regions not covered by the NARCCAP models; elsewhere white regions indicate alack of model agreement.
9
Observed Max # CDD
90W 60W
20N
0
50
100
Max # CDD mid21C−20C
90W 60W
20N
Max # CDD late21C−20C
90W 60W
20N
−40
−20
0
20
40
−40
−20
0
20
40
Fig. 8 Top: Observed average maximum number of dry days (accumulation less than 1mm) during 1961-1990calculated from daily gridded data at 1◦ × 1◦ resolution (http://www.cpc.ncep.noaa.gov/products/precip/realtime/GIS/retro.shtml). White areas indicate regions not covered by this analysis. Middle: Multi-model difference between the 2020-2049 average in the 21C (A1B) integrations and the 1961-1990 average in the 20C integrations, expressed in percentage of the 20Cnormal. Bottom: as in Middle, but for 2070-2099. Hatching indicates regions where the multi-model mean anomalies are larger thanthe scatter (standard deviation) among the models.
10
Observed Rainfall Intensity
90W 60W
20N
0
5
10
Rain Intensity mid21C−20C
90W 60W
20N
Rain Intensity late21C−20C
90W 60W
20N
−1
−0.5
0
0.5
1
−1
−0.5
0
0.5
1
Fig. 9 As in Figure 8, but for the average rainfall intensity on rainy days (accumulation larger than 1mm) expressed in mm/day.
11
Max # CDD 21C−20C
90W 60W
20N
30N
−20
0
20
Heavy Rain Days 21C−20C
90W 60W
20N
30N
−10
0
10
SDII 21C−20C
90W 60W
20N
30N
−2
−1
0
1
2
Fig. 10 Mean of annual anomalies in 4 NARCCAP simulations: A1B(2041-2070) minus 20C(1971-2000). (top) Number of consec-utive dry days (percent change) . (middle) Number of days with rainfall total exceeding 10 mm (percent change). (bottom) Averagerainfall intensity on rainy days (rain¿1mm) expressed in mm/day. Only regions where at least 3 out of 4 models agreed on the signof the seasonal anomalies are plotted. The white regions in the south and east are regions not covered by the NARCCAP models;elsewhere white regions indicate a lack of model agreement.
12
−4 −2 0 2 40
5
10
15
20
25
30
Seasonal Anomalies (mm/day)
Fre
quen
cy (
%)
Summer
(JJA)20C21C
−4 −2 0 2 40
5
10
15
20
25
Seasonal Anomalies (mm/day)
Fre
quen
cy (
%)
Gulf States Rainfall Distribution
Winter(DJF)
20C21C
−4 −2 0 2 40
5
10
15
20
Seasonal Anomalies (mm/day)
Fre
quen
cy (
%)
Summer
(JJA)20C21C
−4 −2 0 2 40
5
10
15
20
25
30
Seasonal Anomalies (mm/day)
Fre
quen
cy (
%)
Caribbean Rainfall Distribution
Winter(DJF)
20C21C
Fig. 11 As in Figure 5, but for seasonal precipitation. Observations for the 20th century are from the Global Historical ClimatologyNetwork (http://www.ncdc.noaa.gov/oa/climate/ghcn-monthly/index.php).
13
3.3 The physical basis
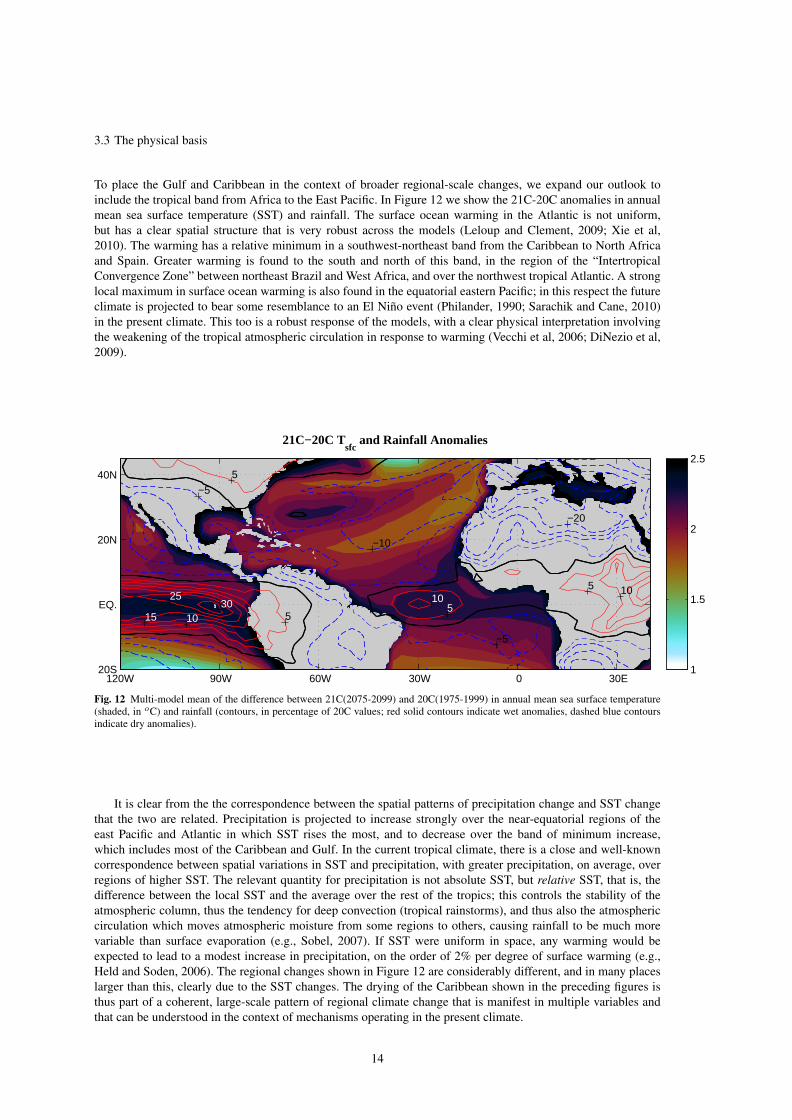
To place the Gulf and Caribbean in the context of broader regional-scale changes, we expand our outlook toinclude the tropical band from Africa to the East Pacific. In Figure 12 we show the 21C-20C anomalies in annualmean sea surface temperature (SST) and rainfall. The surface ocean warming in the Atlantic is not uniform,but has a clear spatial structure that is very robust across the models (Leloup and Clement, 2009; Xie et al,2010). The warming has a relative minimum in a southwest-northeast band from the Caribbean to North Africaand Spain. Greater warming is found to the south and north of this band, in the region of the “IntertropicalConvergence Zone” between northeast Brazil and West Africa, and over the northwest tropical Atlantic. A stronglocal maximum in surface ocean warming is also found in the equatorial eastern Pacific; in this respect the futureclimate is projected to bear some resemblance to an El Nino event (Philander, 1990; Sarachik and Cane, 2010)in the present climate. This too is a robust response of the models, with a clear physical interpretation involvingthe weakening of the tropical atmospheric circulation in response to warming (Vecchi et al, 2006; DiNezio et al,2009).
21C−20C Tsfc
and Rainfall Anomalies
−20
−10
−5
−5
5
5
5
5
5
1010
1015
2530
120W 90W 60W 30W 0 30E 20S
EQ.
20N
40N
1
1.5
2
2.5
Fig. 12 Multi-model mean of the difference between 21C(2075-2099) and 20C(1975-1999) in annual mean sea surface temperature(shaded, in oC) and rainfall (contours, in percentage of 20C values; red solid contours indicate wet anomalies, dashed blue contoursindicate dry anomalies).
It is clear from the the correspondence between the spatial patterns of precipitation change and SST changethat the two are related. Precipitation is projected to increase strongly over the near-equatorial regions of theeast Pacific and Atlantic in which SST rises the most, and to decrease over the band of minimum increase,which includes most of the Caribbean and Gulf. In the current tropical climate, there is a close and well-knowncorrespondence between spatial variations in SST and precipitation, with greater precipitation, on average, overregions of higher SST. The relevant quantity for precipitation is not absolute SST, but relative SST, that is, thedifference between the local SST and the average over the rest of the tropics; this controls the stability of theatmospheric column, thus the tendency for deep convection (tropical rainstorms), and thus also the atmosphericcirculation which moves atmospheric moisture from some regions to others, causing rainfall to be much morevariable than surface evaporation (e.g., Sobel, 2007). If SST were uniform in space, any warming would beexpected to lead to a modest increase in precipitation, on the order of 2% per degree of surface warming (e.g.,Held and Soden, 2006). The regional changes shown in Figure 12 are considerably different, and in many placeslarger than this, clearly due to the SST changes. The drying of the Caribbean shown in the preceding figures isthus part of a coherent, large-scale pattern of regional climate change that is manifest in multiple variables andthat can be understood in the context of mechanisms operating in the present climate.
14
120W 100W 80W 60W 40W 20W 0W 0
10N
20N
30N
40N
50N
60N
70N1950−2009 Caribbean and Gulf of Mexico TCs (418)
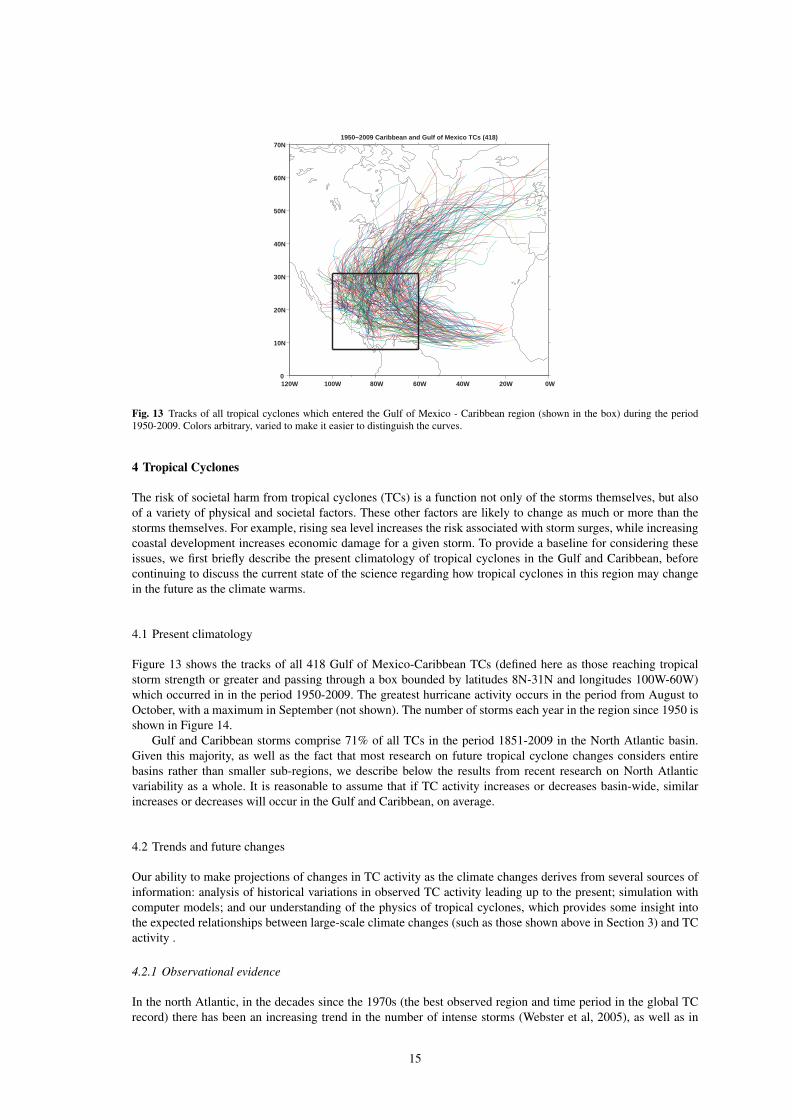
Fig. 13 Tracks of all tropical cyclones which entered the Gulf of Mexico - Caribbean region (shown in the box) during the period1950-2009. Colors arbitrary, varied to make it easier to distinguish the curves.
4 Tropical Cyclones
The risk of societal harm from tropical cyclones (TCs) is a function not only of the storms themselves, but alsoof a variety of physical and societal factors. These other factors are likely to change as much or more than thestorms themselves. For example, rising sea level increases the risk associated with storm surges, while increasingcoastal development increases economic damage for a given storm. To provide a baseline for considering theseissues, we first briefly describe the present climatology of tropical cyclones in the Gulf and Caribbean, beforecontinuing to discuss the current state of the science regarding how tropical cyclones in this region may changein the future as the climate warms.
4.1 Present climatology
Figure 13 shows the tracks of all 418 Gulf of Mexico-Caribbean TCs (defined here as those reaching tropicalstorm strength or greater and passing through a box bounded by latitudes 8N-31N and longitudes 100W-60W)which occurred in in the period 1950-2009. The greatest hurricane activity occurs in the period from August toOctober, with a maximum in September (not shown). The number of storms each year in the region since 1950 isshown in Figure 14.
Gulf and Caribbean storms comprise 71% of all TCs in the period 1851-2009 in the North Atlantic basin.Given this majority, as well as the fact that most research on future tropical cyclone changes considers entirebasins rather than smaller sub-regions, we describe below the results from recent research on North Atlanticvariability as a whole. It is reasonable to assume that if TC activity increases or decreases basin-wide, similarincreases or decreases will occur in the Gulf and Caribbean, on average.
4.2 Trends and future changes
Our ability to make projections of changes in TC activity as the climate changes derives from several sources ofinformation: analysis of historical variations in observed TC activity leading up to the present; simulation withcomputer models; and our understanding of the physics of tropical cyclones, which provides some insight intothe expected relationships between large-scale climate changes (such as those shown above in Section 3) and TCactivity .
4.2.1 Observational evidence
In the north Atlantic, in the decades since the 1970s (the best observed region and time period in the global TCrecord) there has been an increasing trend in the number of intense storms (Webster et al, 2005), as well as in
15
1950 1955 1960 1965 1970 1975 1980 1985 1990 1995 2000 2005 2010
0
2
4
6
8
10
12
14
16
18
Year
Num
ber
of s
torm
sNumber of Tropical Cyclones: Caribbean and Gulf of Mexico 1950−2009
Tropical StormsHurricanesMajor Hurricanes
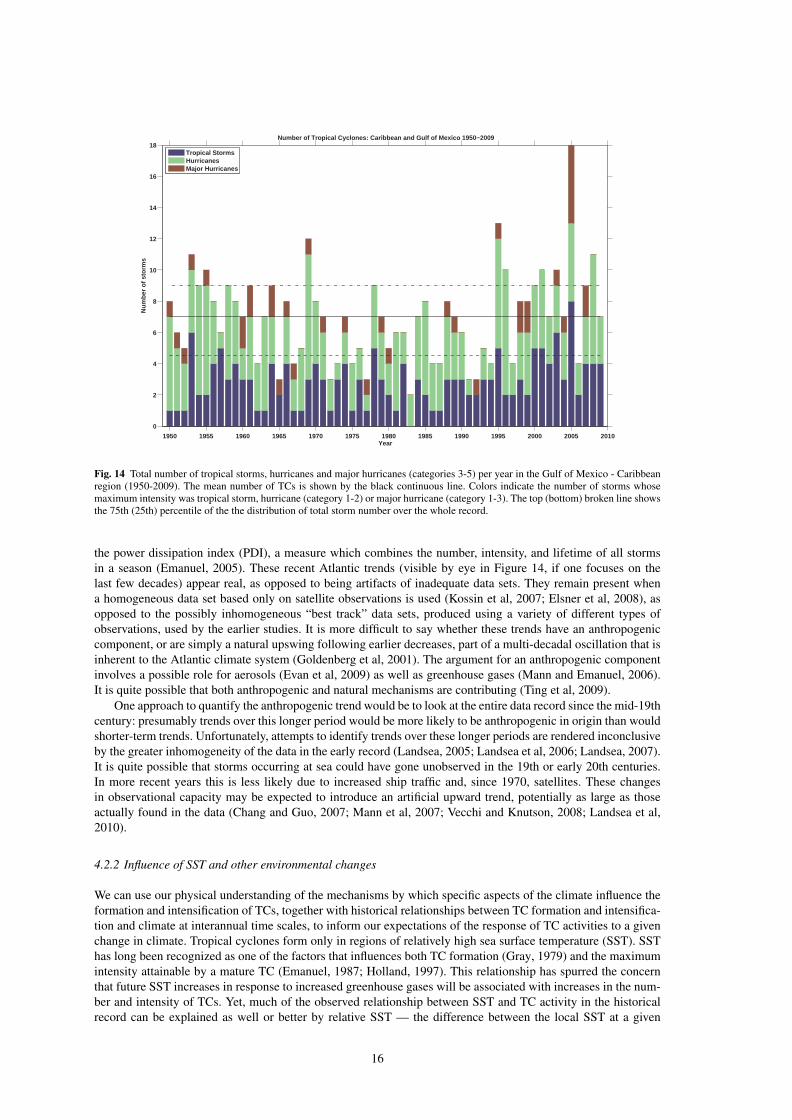
Fig. 14 Total number of tropical storms, hurricanes and major hurricanes (categories 3-5) per year in the Gulf of Mexico - Caribbeanregion (1950-2009). The mean number of TCs is shown by the black continuous line. Colors indicate the number of storms whosemaximum intensity was tropical storm, hurricane (category 1-2) or major hurricane (category 1-3). The top (bottom) broken line showsthe 75th (25th) percentile of the the distribution of total storm number over the whole record.
the power dissipation index (PDI), a measure which combines the number, intensity, and lifetime of all stormsin a season (Emanuel, 2005). These recent Atlantic trends (visible by eye in Figure 14, if one focuses on thelast few decades) appear real, as opposed to being artifacts of inadequate data sets. They remain present whena homogeneous data set based only on satellite observations is used (Kossin et al, 2007; Elsner et al, 2008), asopposed to the possibly inhomogeneous “best track” data sets, produced using a variety of different types ofobservations, used by the earlier studies. It is more difficult to say whether these trends have an anthropogeniccomponent, or are simply a natural upswing following earlier decreases, part of a multi-decadal oscillation that isinherent to the Atlantic climate system (Goldenberg et al, 2001). The argument for an anthropogenic componentinvolves a possible role for aerosols (Evan et al, 2009) as well as greenhouse gases (Mann and Emanuel, 2006).It is quite possible that both anthropogenic and natural mechanisms are contributing (Ting et al, 2009).
One approach to quantify the anthropogenic trend would be to look at the entire data record since the mid-19thcentury: presumably trends over this longer period would be more likely to be anthropogenic in origin than wouldshorter-term trends. Unfortunately, attempts to identify trends over these longer periods are rendered inconclusiveby the greater inhomogeneity of the data in the early record (Landsea, 2005; Landsea et al, 2006; Landsea, 2007).It is quite possible that storms occurring at sea could have gone unobserved in the 19th or early 20th centuries.In more recent years this is less likely due to increased ship traffic and, since 1970, satellites. These changesin observational capacity may be expected to introduce an artificial upward trend, potentially as large as thoseactually found in the data (Chang and Guo, 2007; Mann et al, 2007; Vecchi and Knutson, 2008; Landsea et al,2010).
4.2.2 Influence of SST and other environmental changes
We can use our physical understanding of the mechanisms by which specific aspects of the climate influence theformation and intensification of TCs, together with historical relationships between TC formation and intensifica-tion and climate at interannual time scales, to inform our expectations of the response of TC activities to a givenchange in climate. Tropical cyclones form only in regions of relatively high sea surface temperature (SST). SSThas long been recognized as one of the factors that influences both TC formation (Gray, 1979) and the maximumintensity attainable by a mature TC (Emanuel, 1987; Holland, 1997). This relationship has spurred the concernthat future SST increases in response to increased greenhouse gases will be associated with increases in the num-ber and intensity of TCs. Yet, much of the observed relationship between SST and TC activity in the historicalrecord can be explained as well or better by relative SST — the difference between the local SST at a given
16
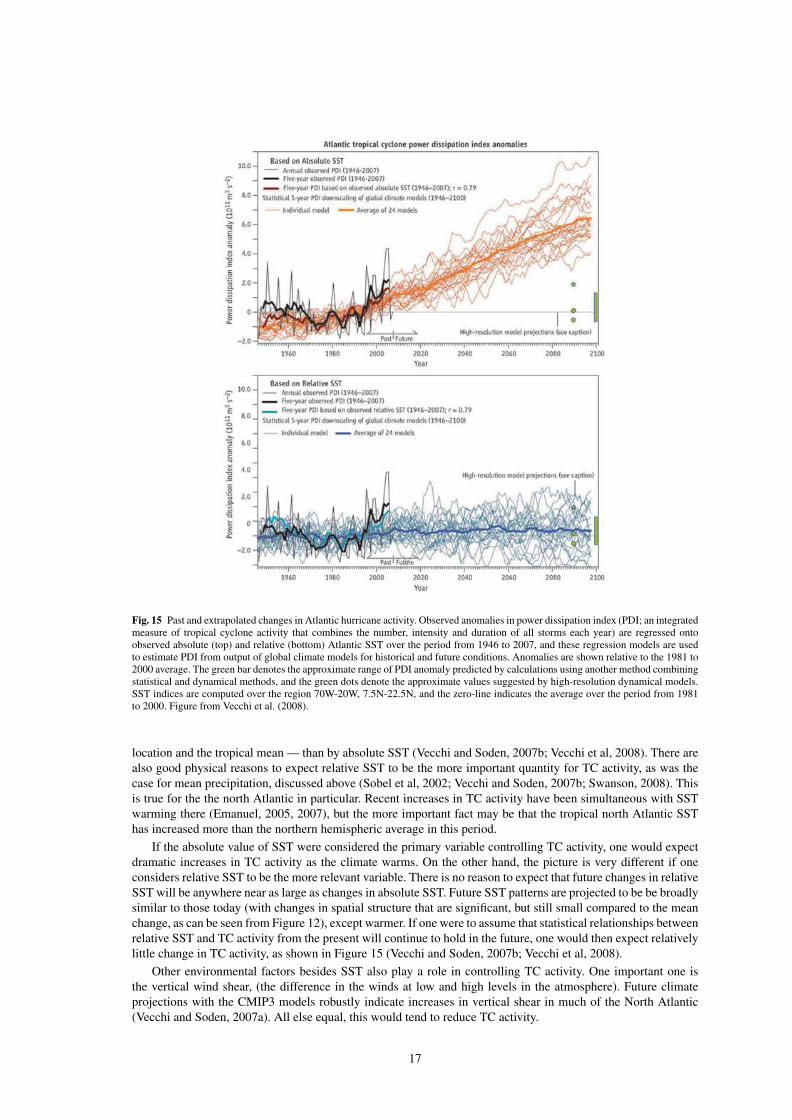
Fig. 15 Past and extrapolated changes in Atlantic hurricane activity. Observed anomalies in power dissipation index (PDI; an integratedmeasure of tropical cyclone activity that combines the number, intensity and duration of all storms each year) are regressed ontoobserved absolute (top) and relative (bottom) Atlantic SST over the period from 1946 to 2007, and these regression models are usedto estimate PDI from output of global climate models for historical and future conditions. Anomalies are shown relative to the 1981 to2000 average. The green bar denotes the approximate range of PDI anomaly predicted by calculations using another method combiningstatistical and dynamical methods, and the green dots denote the approximate values suggested by high-resolution dynamical models.SST indices are computed over the region 70W-20W, 7.5N-22.5N, and the zero-line indicates the average over the period from 1981to 2000. Figure from Vecchi et al. (2008).
location and the tropical mean — than by absolute SST (Vecchi and Soden, 2007b; Vecchi et al, 2008). There arealso good physical reasons to expect relative SST to be the more important quantity for TC activity, as was thecase for mean precipitation, discussed above (Sobel et al, 2002; Vecchi and Soden, 2007b; Swanson, 2008). Thisis true for the the north Atlantic in particular. Recent increases in TC activity have been simultaneous with SSTwarming there (Emanuel, 2005, 2007), but the more important fact may be that the tropical north Atlantic SSThas increased more than the northern hemispheric average in this period.
If the absolute value of SST were considered the primary variable controlling TC activity, one would expectdramatic increases in TC activity as the climate warms. On the other hand, the picture is very different if oneconsiders relative SST to be the more relevant variable. There is no reason to expect that future changes in relativeSST will be anywhere near as large as changes in absolute SST. Future SST patterns are projected to be be broadlysimilar to those today (with changes in spatial structure that are significant, but still small compared to the meanchange, as can be seen from Figure 12), except warmer. If one were to assume that statistical relationships betweenrelative SST and TC activity from the present will continue to hold in the future, one would then expect relativelylittle change in TC activity, as shown in Figure 15 (Vecchi and Soden, 2007b; Vecchi et al, 2008).
Other environmental factors besides SST also play a role in controlling TC activity. One important one isthe vertical wind shear, (the difference in the winds at low and high levels in the atmosphere). Future climateprojections with the CMIP3 models robustly indicate increases in vertical shear in much of the North Atlantic(Vecchi and Soden, 2007a). All else equal, this would tend to reduce TC activity.
17
4.2.3 New modeling evidence
As available computing power has increased, models have improved, and new simulation strategies have beendeveloped, rapid new progress has been made in the last few years (particularly since 2005, when Katrina oc-curred simultaneously with the publication of two influential studies indicating climatically-driven increases).Several new models have resolutions sufficiently high to represent TCs with reasonable fidelity — representingto some degree the eyes and other key structural features of TCs that cannot be captured by the low-resolutionmodels used for IPCC AR4 — while still representing global or at least large regional domains for long enoughtime periods that the large-scale climate is also organically simulated. Another new approach involves sophisti-cated “downscaling” methods which take information about the large-scale climate from low-resolution globalclimate models and use it as input for higher-resolution simulations of tropical cyclones to produce projectionsincorporating advantages of both elements.
Results from studies with both of these new methodologies show considerable diversity, but also an emergingconsensus on the broad outlines of the changes in global TC activity that are expected in the warming climate.On average across the globe, assuming global climate changes within the range deemed most likely, the averageintensity of tropical cyclones is expected to increase by 2-11% while the frequency of TC occurrence is expectedto decrease by 6-34% (Knutson et al, 2010). This projected decrease in frequency of all storms (from tropicalstorm up to category 5 hurricane strength) is not comforting, because the frequency of the most intense storms inparticular is projected to increase. The most intense storms produce by far the greatest damage.
These projections are considerably more robust than those of just a few years ago, but they apply only toglobal average TC activity. We are not able to make projections with any confidence for individual regions suchas the North Atlantic: when applied to individual regions, the available methodologies give results which varytoo widely. Similarly, we cannot make with confidence any statements about changes in other aspects of tropicalcyclone activity, such as genesis location, duration, and tracks.
5 Sea Level
Worldwide, sea level rise is driven by processes occurring in the ocean and by transfer of water currently onland into the oceans (IPCC, 2007). The two specific processes that contribute most are thermal expansion ofocean water and melting of land ice4. Because seawater density depends on temperature, with warmer waterhaving lower density, water in the ocean basins will expand as global mean temperature increases. The amount ofexpansion varies with location because warmer water expands more per unit temperature increase than does colderwater, and the temperature of the ocean currently varies greatly with both depth and geography. Nonetheless, thecontribution to sea level rise from thermal expansion is both well-understood and relatively small. The muchlarger and less-constrained contribution is the addition of water to the ocean from melting ice sheets and glacierson land. Presently, the large ice sheets contain a total sea level equivalent of approximately 70 m (Bamber et al,2007), meaning that sea level would rise by that much if the large ice sheets were to melt completely. Whilecomplete melting of all land ice is unlikely in the near future, this number gives a sense of the magnitude of thepotential problem in the very long term.
The rate at which land ice is lost to the oceans ultimately depends on temperature, but not in a simple orobvious way. Simple melting of the ice on land is only one factor; the greater one is the possibility for largeportions of marine-based ice sheets (ice resting on land whose base is below sea level but with a surface abovesea level) to become unstable and retreat rapidly (Schoof, 2007). Globally averaged sea level rises by an amountof water equal to the volume of ice above an equivalent sea level. However, meltwater from rapid retreats isnot distributed equally across the globe. Large changes in ice volume in Antarctica, for example, yield sea levelchanges 15 to 30% higher than the global average for the Gulf of Mexico and Caribbean (Mitrovica et al, 2009).The likelihood that a collapse will happen for any given ice sheet depends on ice sheet surface snow accumulationrates, magnitude of sea level rise to date, ocean temperature along a marine margin of an ice sheet, and both icesheet configuration and sub-ice topography. The first three of these processes are linked intimately to temperature.Large scale ice sheet models that incorporate these features show tendency for rapid retreat (Pollard and DeConto,2009). However, at present no climate models incorporate these processes.
New semi-empirical approaches provide an alternative way to climate models to estimate sea level rise. Theseare based on the idea that the rate of sea level rise is proportional to the amount of global warming—the warmerit gets, the faster ice melts—and they use past sea level and temperature data to quantify this effect. Extrapo-lating into the future, these models suggest global sea level rises of about one meter by 2100 under the A1B
4 Melting of sea ice — ice currently floating on the surface of the ocean — does not increase sea level, because the floating icealready displaces its weight in liquid water by Archimedes’ principle, and that weight does not change when the ice melts.
18
http://www.copenhagendiagnosis.com/
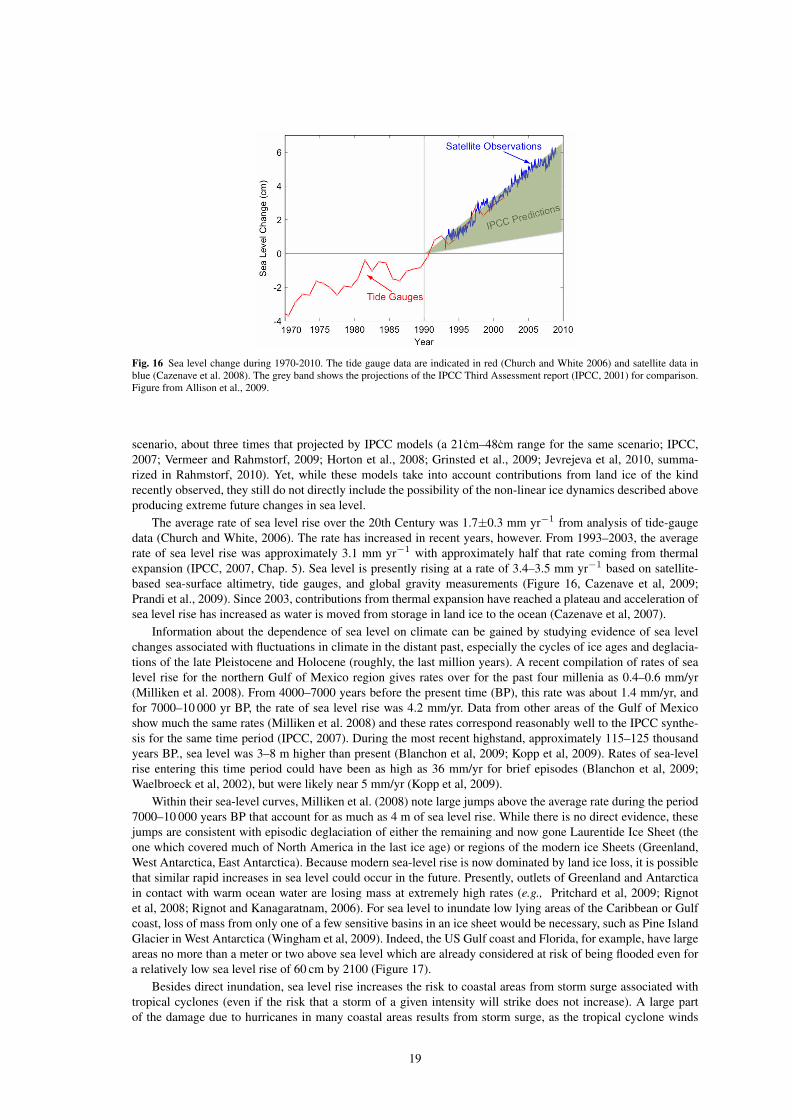
Figure 16: Sea-level change 1970-2010Fig. 16 Sea level change during 1970-2010. The tide gauge data are indicated in red (Church and White 2006) and satellite data inblue (Cazenave et al. 2008). The grey band shows the projections of the IPCC Third Assessment report (IPCC, 2001) for comparison.Figure from Allison et al., 2009.
scenario, about three times that projected by IPCC models (a 21cm–48cm range for the same scenario; IPCC,2007; Vermeer and Rahmstorf, 2009; Horton et al., 2008; Grinsted et al., 2009; Jevrejeva et al, 2010, summa-rized in Rahmstorf, 2010). Yet, while these models take into account contributions from land ice of the kindrecently observed, they still do not directly include the possibility of the non-linear ice dynamics described aboveproducing extreme future changes in sea level.
The average rate of sea level rise over the 20th Century was 1.7±0.3 mm yr−1 from analysis of tide-gaugedata (Church and White, 2006). The rate has increased in recent years, however. From 1993–2003, the averagerate of sea level rise was approximately 3.1 mm yr−1 with approximately half that rate coming from thermalexpansion (IPCC, 2007, Chap. 5). Sea level is presently rising at a rate of 3.4–3.5 mm yr−1 based on satellite-based sea-surface altimetry, tide gauges, and global gravity measurements (Figure 16, Cazenave et al, 2009;Prandi et al., 2009). Since 2003, contributions from thermal expansion have reached a plateau and acceleration ofsea level rise has increased as water is moved from storage in land ice to the ocean (Cazenave et al, 2007).
Information about the dependence of sea level on climate can be gained by studying evidence of sea levelchanges associated with fluctuations in climate in the distant past, especially the cycles of ice ages and deglacia-tions of the late Pleistocene and Holocene (roughly, the last million years). A recent compilation of rates of sealevel rise for the northern Gulf of Mexico region gives rates over for the past four millenia as 0.4–0.6 mm/yr(Milliken et al. 2008). From 4000–7000 years before the present time (BP), this rate was about 1.4 mm/yr, andfor 7000–10 000 yr BP, the rate of sea level rise was 4.2 mm/yr. Data from other areas of the Gulf of Mexicoshow much the same rates (Milliken et al. 2008) and these rates correspond reasonably well to the IPCC synthe-sis for the same time period (IPCC, 2007). During the most recent highstand, approximately 115–125 thousandyears BP., sea level was 3–8 m higher than present (Blanchon et al, 2009; Kopp et al, 2009). Rates of sea-levelrise entering this time period could have been as high as 36 mm/yr for brief episodes (Blanchon et al, 2009;Waelbroeck et al, 2002), but were likely near 5 mm/yr (Kopp et al, 2009).
Within their sea-level curves, Milliken et al. (2008) note large jumps above the average rate during the period7000–10 000 years BP that account for as much as 4 m of sea level rise. While there is no direct evidence, thesejumps are consistent with episodic deglaciation of either the remaining and now gone Laurentide Ice Sheet (theone which covered much of North America in the last ice age) or regions of the modern ice Sheets (Greenland,West Antarctica, East Antarctica). Because modern sea-level rise is now dominated by land ice loss, it is possiblethat similar rapid increases in sea level could occur in the future. Presently, outlets of Greenland and Antarcticain contact with warm ocean water are losing mass at extremely high rates (e.g., Pritchard et al, 2009; Rignotet al, 2008; Rignot and Kanagaratnam, 2006). For sea level to inundate low lying areas of the Caribbean or Gulfcoast, loss of mass from only one of a few sensitive basins in an ice sheet would be necessary, such as Pine IslandGlacier in West Antarctica (Wingham et al, 2009). Indeed, the US Gulf coast and Florida, for example, have largeareas no more than a meter or two above sea level which are already considered at risk of being flooded even fora relatively low sea level rise of 60 cm by 2100 (Figure 17).
Besides direct inundation, sea level rise increases the risk to coastal areas from storm surge associated withtropical cyclones (even if the risk that a storm of a given intensity will strike does not increase). A large partof the damage due to hurricanes in many coastal areas results from storm surge, as the tropical cyclone winds
19
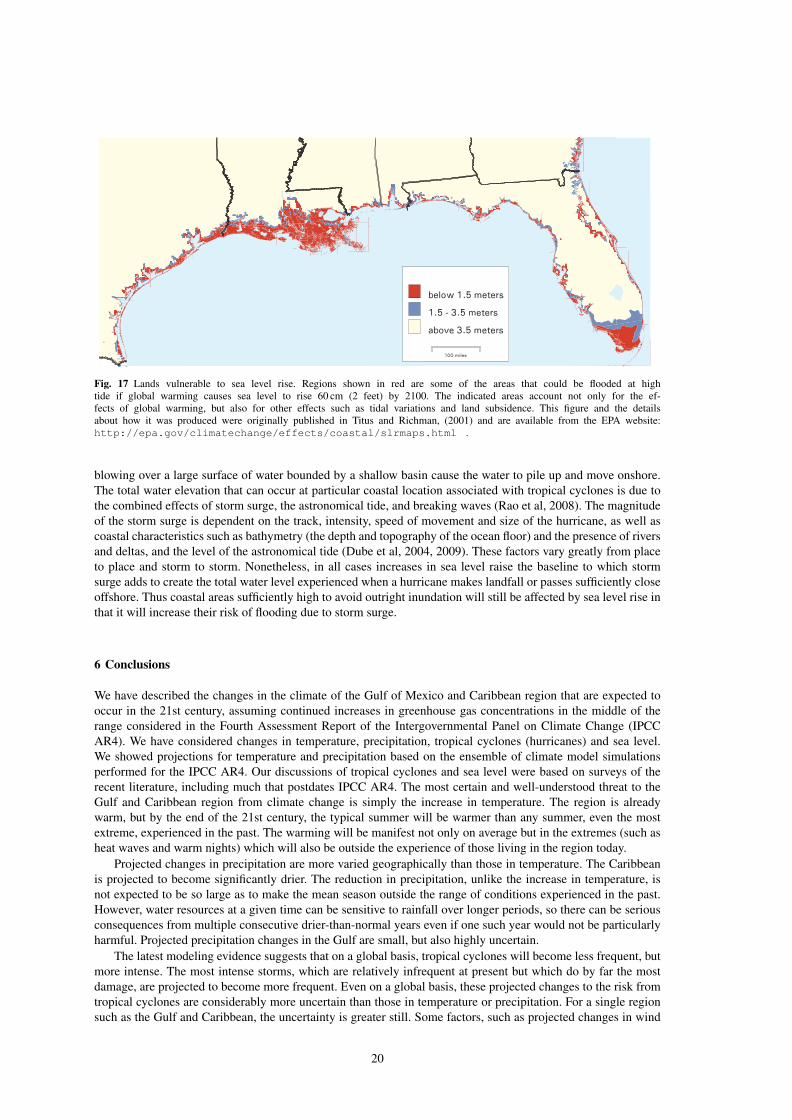
Fig. 17 Lands vulnerable to sea level rise. Regions shown in red are some of the areas that could be flooded at hightide if global warming causes sea level to rise 60 cm (2 feet) by 2100. The indicated areas account not only for the ef-fects of global warming, but also for other effects such as tidal variations and land subsidence. This figure and the detailsabout how it was produced were originally published in Titus and Richman, (2001) and are available from the EPA website:http://epa.gov/climatechange/effects/coastal/slrmaps.html .
blowing over a large surface of water bounded by a shallow basin cause the water to pile up and move onshore.The total water elevation that can occur at particular coastal location associated with tropical cyclones is due tothe combined effects of storm surge, the astronomical tide, and breaking waves (Rao et al, 2008). The magnitudeof the storm surge is dependent on the track, intensity, speed of movement and size of the hurricane, as well ascoastal characteristics such as bathymetry (the depth and topography of the ocean floor) and the presence of riversand deltas, and the level of the astronomical tide (Dube et al, 2004, 2009). These factors vary greatly from placeto place and storm to storm. Nonetheless, in all cases increases in sea level raise the baseline to which stormsurge adds to create the total water level experienced when a hurricane makes landfall or passes sufficiently closeoffshore. Thus coastal areas sufficiently high to avoid outright inundation will still be affected by sea level rise inthat it will increase their risk of flooding due to storm surge.
6 Conclusions
We have described the changes in the climate of the Gulf of Mexico and Caribbean region that are expected tooccur in the 21st century, assuming continued increases in greenhouse gas concentrations in the middle of therange considered in the Fourth Assessment Report of the Intergovernmental Panel on Climate Change (IPCCAR4). We have considered changes in temperature, precipitation, tropical cyclones (hurricanes) and sea level.We showed projections for temperature and precipitation based on the ensemble of climate model simulationsperformed for the IPCC AR4. Our discussions of tropical cyclones and sea level were based on surveys of therecent literature, including much that postdates IPCC AR4. The most certain and well-understood threat to theGulf and Caribbean region from climate change is simply the increase in temperature. The region is alreadywarm, but by the end of the 21st century, the typical summer will be warmer than any summer, even the mostextreme, experienced in the past. The warming will be manifest not only on average but in the extremes (such asheat waves and warm nights) which will also be outside the experience of those living in the region today.
Projected changes in precipitation are more varied geographically than those in temperature. The Caribbeanis projected to become significantly drier. The reduction in precipitation, unlike the increase in temperature, isnot expected to be so large as to make the mean season outside the range of conditions experienced in the past.However, water resources at a given time can be sensitive to rainfall over longer periods, so there can be seriousconsequences from multiple consecutive drier-than-normal years even if one such year would not be particularlyharmful. Projected precipitation changes in the Gulf are small, but also highly uncertain.
The latest modeling evidence suggests that on a global basis, tropical cyclones will become less frequent, butmore intense. The most intense storms, which are relatively infrequent at present but which do by far the mostdamage, are projected to become more frequent. Even on a global basis, these projected changes to the risk fromtropical cyclones are considerably more uncertain than those in temperature or precipitation. For a single regionsuch as the Gulf and Caribbean, the uncertainty is greater still. Some factors, such as projected changes in wind
20
shear, may be expected to reduce the number and intensity of tropical cyclones in the region. Nonetheless, giventhe expected global tendency towards more of the most severe storms, there is little reason for complacency.
Sea level rise may ultimately be the greatest threat to the coasts and islands of the Gulf and Caribbean. Theloss of even a small fraction of either the Greenland or Antarctica ice sheets would raise sea level enough toinundate significant areas of the region, and place larger areas at increased risk of storm surge from tropicalcyclones (even if there were no change in the risk of tropical cyclone occurrence itself). The likelihood that suchrapid ice loss and sea level rise will occur in the 21st century is very difficult to estimate, but there is evidencefrom the geologic record that they have occurred in the past in periods of warming. The probability becomesgreater as the time horizon one considers increases, assuming continued warming. If greenhouse gas increasescontinue, the question over the long term becomes not whether sea level will rise greatly, but simply how soon itwill do so.
Acknowledgements We are grateful to the researchers that produced Figures 1, 12, 16, and 17 and to the publishers that grantedpermission to use them; to the modeling groups that provided climate simulations to the CMIP3 project; to the Program for ClimateModel Diagnosis and Intercomparison (PCMDI) and the World Climate Research Programme’s (WCRP’s) Working Group on CoupledModelling (WGCM) for their roles in making available the WCRP CMIP3 multi-model dataset (support of this dataset is providedby the Office of Science, U.S. Department of Energy); and to NARCCAP for the regional simulations (NARCCAP is funded by theNational Science Foundation (NSF), the U.S. Department of Energy (DoE), the National Oceanic and Atmospheric Administration(NOAA), and the U.S. Environmental Protection Agency Office of Research and Development (EPA)).
This work was supported by the Earth Institute at Columbia University to inform policy-makers in the Gulf region in preparationfor the United Nations Cancun Climate Summit.
References
Allison I, Bindoff N, Bindschadler R, Cox P, de Noblet N, England M, Francis J, Gruber N, Haywood A, KarolyD, et al (2009) The Copenhagen Diagnosis, 2009: Updating the World on the Latest Climate Science. TheUniversity of New South Wales Climate Change Research Centre (CCRC), Sydney, Australia p 60
Bamber JL, Alley RB, Joughin I (2007) Rapid response of modern day ice sheets to external forcing. Earth PlanetSc Lett 257:1–13, DOI 10.1016/j.epsl.2007.03.005
Battisti DS, Naylor (2009) Historical warnings of future food insecurity with unprecedented seasonal heat. Sci-ence 323:doi: 10.1126/science.1164,363
Blanchon P, Eisenhauer A, Fietzke J, Liebetrau V (2009) Rapid sea-level rise and reef back-stepping at the closeof the last interglacial highstand. Nature 458:881–885, DOI 10.1038/nature07933
Bueno R, Herzfeld C, Stanton E, Ackerman F (2008) The Caribbean and Climate Change: The Costs of Inaction.Tech. rep., Stockholm Environment Institute — US Center, Global Development and Environment Institute,Tufts University, Somerville, MA
Cazenave A, Dominh K, Guinehut S, Berthier E, Llovel W, Ramillien G, Ablain M, Larnicol G (2007) Sea levelbudget over 2003-2008: a reevaluation from GRACE space gravimetry, satellite altimetry and Argo. GlobalPlanet Change 65(1–2):83–88, DOI 10.1016/j.gloplacha.2008.10.004
Chang EK, Guo MY (2007) Is the number of north atlantic tropical cyclones significantly underestimated priorto the availability of satellite observations? Geophys Res Lett 34:L14,801
Church JA, White NJ (2006) A 20th century acceleration in global sea-level change. Geophys Res Lett33:L01602, DOI 10.1029/2005GL024826
Diffenbaugh N, Ashfaq M (2010) Intensification of hot extremes in the united states. Geophys Res Lett DOI10.1029/2010GL043888, in press
DiNezio PN, Clement AC, Vecchi GA, Soden BJ (2009) Climate response of the equatorial pacific to globalwarming. J Climate 22:4873–4892
Dube SK, Chittibabu P, Sinha PC, Rao AD, Murty TS (2004) Numerical modelling of stormsurge in the Head Bay of Bengal using location specific model. Nat Hazards 31:437–453, doi:10.1023/B:NHAZ.0000023,361.94,609.4a
Dube SK, Jain I, Rao AD, Murty TS (2009) Storm surge modelling for the Bay of Bengal and Arabian Sea. NatHazards 51:3–27, doi: 10.1007/s11,069–009–9397–9
Elsner JB, Jagger TH, Dickinson M, Rowe D (2008) Improving multiseason forecasts of north atlantic hurricaneactivity. J Climate 21:1209–1219
Emanuel K (2005) Increasing destructiveness of tropical cyclones over the past 30 years. Nature 436:686–688,doi:10.1038/nature03906
Emanuel K (2007) Environmental factors affecting tropical cyclone power dissipation. J Climate 20:5497–5509Emanuel KA (1987) The dependence of hurricane intensity on climate. Nature 326:483–485
21
Evan AT, Vimont DJ, Heidinger AK, nand R Bennartz JPK (2009) The role of aerosols in the evolution of tropicalNorth Atlantic Ocean temperature anomalies. Science 324:778–781
Goldenberg SB, Landsea CW, Mestas-Nunez AM, Gray WM (2001) The recent increase in Atlantic hurricaneactivity: Causes and implications. Science 293:474–479
Gray WM (1979) Meteorology over the tropical oceans, Roy. Meteor. Soc., chap Hurricanes: Their formation,structure and likely role in the tropical circulation, pp 155–218
Grinsted A, Moore JC, Jefrejeva S (2009) Reconstructing sea level from paleo and projected temperatures 200 to2100 ad. Clim Dyn 34:461–472
Grinsted A, Moore JC, Jefrejeva S (2010) How will sea level respond to changes in natural and anthropogenicforcings by 2100? Geophys Res Lett 37:doi:10.1029/2010GL042,947
Held IM, Soden BJ (2006) Robust responses of the hydrological cycle to global warming. J Climate 19:5686–5699
Holland GJ (1997) The maximum potential intensity of tropical cyclones. J Atmos Sci 54:2519–2541Horton R, Herweijer C, Rosenzweig C, Liu J, Gornitz V, Ruane AC (2008) Sea level rise projections for current
generation cgcms based on the semi-empirical method. Geophys Res Lett 35:doi:10.1029/2007GL032,486IPCC (2001) Climate Change 2001: The Scientific Basis. Contribution of Working Group I to the Third Assess-
ment Report of the Intergovernmental Panel on Climate Change. Cambridge University PressIPCC (2007) Climate Change 2007: The Physical Science Basis. Contribution of Working Group I to the Fourth
Assessment Report of the IPCC. Cambridge University PressKarl TR, Melillo JM, Peterson TC, Hassol SJ (2009) Global Climate Change Impacts in the United States. Cam-
bridge University PressKharin V, Zwiers F, Zhang X, Hegerl G (2007) Changes in temperature and precipitation extremes in the IPCC
ensemble of global coupled model simulations. Journal of Climate 20(8):1419–1444, DOI 10.1175/JCLI4066.1Knutson TR, McBride J, Chan J, Emanuel KA, Holland G, Landsea C, Held I, Kossin J, Srivastava AK, Sugi M
(2010) Tropical cyclones and climate change. Nature Geoscience 3:157–163, doi:10.1038/ngeo779Kopp R, Simons F, Mitrovica J, Maloof A, Oppenheimer M (2009) Probabilistic assessment of sea level during
the last interglacial stage. Nature 462(7275):863–867Kossin JP, Knapp KR, Vimont DJ, Murnane RJ, Harper BA (2007) A globally consistent reanalysis of hurricane
variability and trends. Geophys Res Lett 34:L04,815Landsea CW (2005) Hurricanes and global warming. Nature 438:E11–13, doi:10.1038/nature04477Landsea CW (2007) Counting atlantic tropical cyclones back to 1900. EOS Trans AGU 88(18),
doi:10.1029/2007EO180001Landsea CW, Harper BA, Horau K, Knaff JA (2006) Can we detect trends in extreme tropical cyclones? Science
313:452–454, doi:10.1126/science.1128448Landsea CW, Vecchi GA, Bengtsson L, Knutson TR (2010) Impact of duration thresholds on atlantic tropical
cyclone counts. J Climate Doi: 10.1175/2009JCLI3034.1Leloup J, Clement A (2009) Why is there a minimum in projected warming in the tropical North Atlantic Ocean?
Geophys Res Lett 36:doi:10.1029/2009GL038,609Mann ME, Emanuel KA (2006) Atlantic hurricane trends linked to climate change. EOS 87:233,238,241Mann ME, Sabbatelli TA, Neu U (2007) Evidence for a modest undercount bias in early historical Atlantic
tropical cyclone counts. Geophys Res Lett 36:L22,707Meehl G, Covey C, Delworth T, Latif M, McAvaney B, Mitchell J, Stouffer R, Taylor K (2007) The WCRP
CMIP3 multimodel dataset: A new era in climate change research. Bull Amer Meteor Soc 88:1383?1394Milliken KT, Anderson JB, Rodriguez AB (2008) A new composite Holocene sea-level curve for the northern
Gulf of Mexico. In: Response of Upper Gulf Coast estuaries to Holocene climate change and sea-level rise,Special Paper 443, Geological Society of America, Boulder, CO, pp 1–11, DOI 10.1130/2008.2443(01)
Mitrovica J, Gomez N, Clark P (2009) The sea-level fingerprint of West Antarctic collapse. Science323(5915):753
Philander SGH (1990) El Nino, La Nina and the Southern Oscillation. Academic PressPollard D, DeConto R (2009) Modelling West Antarctic ice sheet growth and collapse through the past five
million years. Nature 458(7236):329–332Prandi P, Cazenave A, Becker M (2009) Is coastal mean sea level rising faster than the global mean? a com-
parison between tide gauges and satellite altimetry over 1993–2007. Geophys Res Lett 36:L05602, DOI10.1029/2008GL036564
Pritchard HD, Arthern RJ, Vaughan DG, Edwards LA (2009) Extensive dynamic thinning on the margins of theGreenland and Antarctic ice sheets. Nature 461(7266):971–975, DOI doi:10.1038/nature08471
Rahmstorf S (2010) A new view on sea level rise. Nature 4:doi:10.1038/climate.2010.29
22
Rao AD, Jain I, Murthy MVR, Murty TS, Dube SK (2008) Impact of cyclonic wind field on interaction ofsurge?wave computations using finite-element and finite-difference models. Nat Hazards 49:225–239, doi:10.1007/s11,069–008–9284–9
Rignot E, Kanagaratnam P (2006) Changes in the velocity structure of the Greenland Ice Sheet. Science311(5763):986–990, DOI 10.1126/science.1121381
Rignot E, Bamber JL, Broeke MRVD, Davis C, Li YH, Berg WJVD, Meijgaard EV (2008) Recent Antarcticice mass loss from radar interferometry and regional climate modelling. Nature Geoscience 1(2):106–110,DOI 10.1038/ngeo102
Sarachik ES, Cane MA (2010) The El Nino - Southern Oscillation Phenomenon. Cambridge University PressSchoof C (2007) Ice sheet grounding line dynamics: Steady states, stability, and hysteresis. J Geophys Res
112(F3):1–19Sobel AH (2007) Simple models of ensemble-averaged tropical precipitation and surface wind. In: Schneider T,
Sobel AH (eds) The Global Circulation of the Atmosphere, Princeton University Press, T. Schneider and A. H.Sobel, eds.
Sobel AH, Held IM, Bretherton CS (2002) The ENSO signal in tropical tropospheric temperature. J Climate15:2702–2706
Swanson KL (2008) Nonlocality of atlantic tropical cyclone intensity. Geochem Geophys Geosyst 9:Q04V01Ting M, Kushnir Y, Seager R, Li C (2009) Forced and natural 20th Century SST trends in the north atlantic. J
Climate 22:1469–1481Titus JG, Richman C (2001) Maps of lands vulnerable to sea level rise: modeled elevations along the us atlantic
and gulf coasts. Clim Res 18:205–228Vecchi GA, Knutson TR (2008) On estimates of historical north atlantic tropical cyclone activity. J Climate
21:3580–3600, doi: 10.1175/2008JCLI2178.1Vecchi GA, Soden BJ (2007a) Effect of remote sea surface temperature change on tropical cyclone potential
intensity. Nature 450:1066–1070Vecchi GA, Soden BJ (2007b) Global warming and the weakening of the tropical circulation. J Climate 20:4316–
4340Vecchi GA, Soden BJ, Wittenberg AT, Held IM, Leetmaa A, Harrison MJ (2006) Weakening of tropical pacific
atmospheric circulation due to anthropogenic forcing. Nature 441:”doi:10.1038/nature04,744”Vecchi GA, Swanson KL, Soden BJ (2008) Whither hurricane activity? Science 322:687,
doi:10.1126/science.1164,396Vermeer M, Rahmstorf S (2009) Global sea level linked to global temperature. Proc Natl Acad Sci
106:21,527?21,532Waelbroeck C, Labeyrie L, Michel E, Duplessy JC, McManus JF, Lambeck K, Balbon E, Labracherie M (2002)
Sea-level and deep water temperature changes derived from benthic foraminifera isotopic records. QuaternarySci Rev 21:295–305
Webster PJ, Holland GJ, Curry JA, Chang HR (2005) Changes in tropical cyclone number, duration, and intensityin a warming environment. Science 309:1844–1846, doi: 10.1126/science.1116448
Wingham DJ, Wallis DW, Shepherd A (2009) Spatial and temporal evolution of Pine Island Glacier thinning.Geophys Res Lett 36:L17501, DOI 10.1029/2009GL039126
Xie SP, Deser C, Vecchi GA, Ma J, Teng H, Wittenberg AT (2010) Global warming pattern formation: Sea surfacetemperature and rainfall. J Climate DOI: 10.1175/2009JCLI3329.1, early online
23