Embed Size (px)
Citation preview
Climatic Change (2012) 112:819–845DOI 10.1007/s10584-011-0254-y
Projected changes in the physical climateof the Gulf Coast and Caribbean
Michela Biasutti · Adam H. Sobel ·Suzana J. Camargo · Timothy T. Creyts
Received: 12 July 2010 / Accepted: 10 September 2011 / Published online: 8 October 2011© Springer Science+Business Media B.V. 2011
Abstract As the global climate warms due to increasing greenhouse gases, theregional climate of the Gulf of Mexico and Caribbean region will also change.This study presents the latest estimates of the expected changes in temperature,precipitation, tropical cyclone activity, and sea level. Changes in temperature andprecipitation are derived from climate model simulations produced for the FourthAssessment Report of the Intergovernmental Panel on Climate Change (IPCCAR4), by comparing projections for the mid- and late-21st century to the late 20thcentury and assuming a “middle-of-the-road” scenario for future greenhouse gasemissions. Regional simulations from the North America Regional Climate ChangeProgram (NARCCAP) are used to corroborate the IPCC AR4 rainfall projectionsover the US portion of the domain. Changes in tropical cyclones and sea level aremore uncertain, and our understanding of these variables has changed more sinceIPCC AR4 than in the case of temperature and precipitation. For these quantities,the current state of knowledge is described based on the recent peer-reviewedliterature.
1 Introduction
The nations of the Gulf Coast and Caribbean lie in the region comprised by the Gulfof Mexico, Caribbean Sea, and the tropical portion of the western Atlantic ocean; thecoastal portions of the North, Central, and South American land masses that enclosethem on three sides; and the Caribbean islands. This is a low-latitude region of the
M. Biasutti (B) · A. H. Sobel · S. J. Camargo · T. T. CreytsLamont–Doherty Earth Observatory of Columbia University, Palisades, NY 10964, USAe-mail: [email protected]
A. H. SobelDepartments of Applied Physics and Applied Mathematics & Earth and EnvironmentalSciences, Columbia University, Palisades, NY 10964, USA
820 Climatic Change (2012) 112:819–845
earth, whose proximity to the equator and maritime geography render its climategenerally warm and humid.
Rainfall is present throughout the year, evenly distributed between the seasonsin the Gulf region but more concentrated during the summer and fall rainy seasonin the Caribbean, and nearly the whole region is threatened (to varying degrees) byhurricanes during the months between May and October. Yet much of the region liesin the subtropical latitudes which, elsewhere on the earth, feature deserts, and partsof the Gulf Coast and Caribbean region can also be threatened by drought.
As the global climate changes, the regional climate of the Gulf Coast andCaribbean will change as well. Some of the ways in which it will change are fairlycertain, while others are much less so. We cannot predict with precision all the waysin which the nations, people, and economies of the region will be harmed (or willbenefit) from climate change. Some of the vulnerabilities are clear, however.
In a region that is already warm, increases in temperature—accompanied almostinevitably by increases in specific humidity—may constitute the most obvious andpredictable hazard. Precipitation is a more subtle matter, predicted to increase insome places and decrease in others, and in any case predicted with less certaintythan temperature. Whether an increase or a decrease in precipitation is consideredharmful or beneficial may also vary across the region. Hurricanes may be the mostfeared hazard in the present climate. How they will change as the climate warms isrelatively uncertain, but very focused research from the last several years suggeststhey will be fewer, but more intense. Sea level rise is a major threat to this region ofcoasts and islands, both on its own and when coupled with hurricane-induced stormsurge; it is inexorable, but the speed with which it will occur is very difficult to predict,depending not only on the rate of global warming but also on the subtle dynamics ofpolar ice sheets far away.
In this paper, we review the most recent state of knowledge about what changesin climate are expected in the Gulf Coast and Caribbean. We focus on temperature,precipitation, hurricanes, and sea level. We do not attempt to characterize what theimpacts of these changes will be, instead limiting ourselves to a discussion of thephysical climate alone. We do describe the changes in terms that we expect to berelevant to a variety of societal impacts.
Some regional assessment reports based on the same climate simulations havebeen produced, e.g., for the US (Karl et al. 2009) or the Caribbean (Bueno et al.2008). Our treatment here differs in focusing on the Gulf coast and Caribbeantogether, in our focus on the projected physical changes (as opposed to on recentclimatic trends or on the economic impact of future climatic trends), in our use ofregional simulations, and in our treatment of tropical cyclones and sea level, andperhaps in some other aspects of our interpretation. The essential elements of ourdiscussion are, however, consistent with the broad scientific consensus reflected inIPCC AR4, particularly regarding temperature and precipitation.
2 Data and methodology
For temperature and precipitation, we make use of the global climate model simula-tions performed under the Third Coupled Model Intercomparison Project (CMIP3;Meehl et al. 2007) for the purpose of the Fourth Assessment Report (AR4; IPCC
Climatic Change (2012) 112:819–845 821
2007) of the Intergovernmental Panel on Climate Change (IPCC). These simulations,and the models used to produce them, are described in greater detail in IPCC AR4(and the peer-reviewed literature on which that report is based). For the US, wesupplement the AR4 simulations with more recent high-resolution (about a third of adegree) regional simulations from the North America Regional Climate Change As-sessment Program (NARCCAP). In these simulations, different regional models areintegrated with boundary conditions provided from coupled models from the IPCCAR4 archives; at this time, four such simulations are available, using a combinationof three regional and three global models. More information on the NARCCAPsimulations can be found here: http://www.narccap.ucar.edu/about/index.html.
The large set of global climate model simulations done for IPCC offers the bestscientific basis we have for making detailed projections about how climate willchange in a specific region. They are not predictions, but scenarios, contingent onassumptions about how anthropogenic emissions of greenhouse gases, as well asother factors which are external to the climate system but which influence it, willevolve in the future. It is virtually certain that anthropogenic emissions of greenhousegases have been warming the global climate for some time and will continue to do so(most likely at a greater rate) in the future. The precise rate of warming we expect inthe future is somewhat more uncertain. One source of uncertainty is our incompleteunderstanding of the climate system, as manifest by the fact that different climatemodels project different rates of global mean warming even for the same increases ingreenhouse gas concentrations. Another—probably greater—source of uncertaintyis that due to our uncertainty about future greenhouse gas emissions. This resultsfrom our inability to predict economic and political developments rather than thephysics of the climate system.
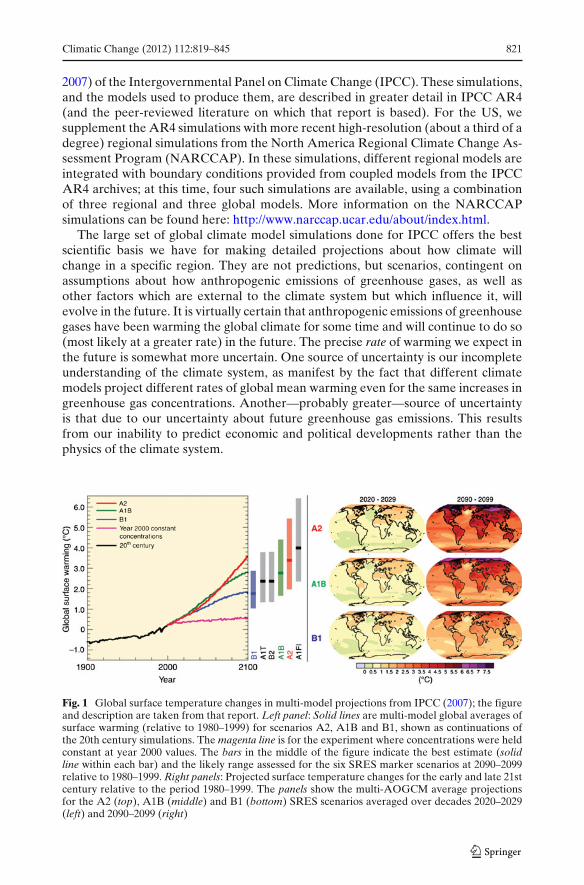
Fig. 1 Global surface temperature changes in multi-model projections from IPCC (2007); the figureand description are taken from that report. Left panel: Solid lines are multi-model global averages ofsurface warming (relative to 1980–1999) for scenarios A2, A1B and B1, shown as continuations ofthe 20th century simulations. The magenta line is for the experiment where concentrations were heldconstant at year 2000 values. The bars in the middle of the figure indicate the best estimate (solidline within each bar) and the likely range assessed for the six SRES marker scenarios at 2090–2099relative to 1980–1999. Right panels: Projected surface temperature changes for the early and late 21stcentury relative to the period 1980–1999. The panels show the multi-AOGCM average projectionsfor the A2 (top), A1B (middle) and B1 (bottom) SRES scenarios averaged over decades 2020–2029(left) and 2090–2099 (right)
822 Climatic Change (2012) 112:819–845
In this report we use results from the A1B scenario of the IPCC AR4. This isconsidered a “middle-of-the-road” scenario, neither worst-case nor best-case (seeFig. 1). It is possible (though it seems unlikely in the short term) that reductions inemissions will cause the rate at which greenhouse gases increase to be less than that inA1B, leading to less warming. It is also quite possible that the increases in greenhousegases will be significantly more rapid than in A1B, leading to faster warming thanthat in the A1B projections. Many (though not all) of the results are to some degreelinearly proportional to the global mean surface temperature change: if the rate ofglobal warming is less or greater than that in A1B by some factor, the change in localtemperature or precipitation in the A1B projections is also likely to be less or greaterby a similar factor.
The changes we show are computed by averaging the physical quantity (e.g., tem-perature, precipitation) for a future period in the A1B projections, and subtractingthe same quantity averaged over a period of the same duration in the 20th century.1
We subtract the 20th century average values as computed by the models, rather thanthe observed values, so that any imperfections in the models’ representations of thepast climate2 are not misinterpreted as projections of climate changes.
All results we present are multi-model ensemble means, or averages over thelarge set of model simulations, using 24 different climate models,3 submitted to theIPCC for the A1B scenario. Ensemble averaging is the most straightforward way tohandle the uncertainties in both the global climate sensitivity and the ways in whichglobal climate change will be manifest differently in different regions. Some modelspredict greater changes (both globally and regionally) than the ensemble mean, whilesome predict smaller ones. The degree to which different models agree on specificaspects of the projected climate change is one measure of our confidence in thelikelihood that that specific change will occur in response to increasing greenhousegas concentrations. If different models differ widely, our confidence is low. If mostor all of them agree closely, we are still not entirely certain that they are correct(because the models are not perfect representations of the real climate system), butour confidence is substantially greater.
Tropical cyclones and sea level are important facets of climate for the Gulf Coastand Caribbean. The combination of the two—rising sea level leading to greaterflooding from storm surge when hurricanes make landfall—is potentially one of the
1Due to the variations in the availability of data, slightly different periods are used for thecomputation of some different statistics. For time-averaged fields, the period 2075–2099 is comparedto 1975–1999. For extremes (Figs. 3, 4, 8 and 9) the normals are defined over 30 years, so thoseare compared to 30-year averages for the models, 2020–2049 and 2070–2099. The NARCCAP 21stcentury simulations are forced with a more aggressive scenario (A2), but are run for an earlier period:2040–2070. In the paper we will label the reference period in the simulation of the 20th Century as20C and the simulations of the 21st century as 21C, regardless of the scenario used.2The CMIP3 models reproduce the seasonal evolution of temperature and rainfall fairly well,but fail to capture some regional detail. For example, they simulate colder than observed surfacetemperature in the Caribbean sea, especially in spring and summer, which leads to less rainfall overthe Islands in the early rainy season (Rauscher et al. 2008). The coarse resolution prevents a faithfulsimulation of orographic features, such as maxima in rainfall along the Caribbean coast of CentralAmerica and the cold summertime temperatures over the Sierra.3For extremes, as shown in Figs. 3, 4, 8 and 9, data were not available for all models; results shownare computed from the nine models for which these data were available.
Climatic Change (2012) 112:819–845 823
most serious long-term risks for the region. Unfortunately, current climate models,such as those from the CMIP3 ensemble from which we derive projections oftemperature and precipitation change, are not up to the task of making quantitativeprojections of regional changes in either tropical cyclones or sea level. In the case oftropical cyclones, the coarse grid resolution of the models prevents the models fromsimulating tropical cyclones adequately even in the present climate; thus changesin tropical cyclones in model projections of the future are not reliable. In the caseof sea level, any projection depends critically on the dynamics of ice sheets onland, something not yet simulated well (or not simulated at all) by the models.Thus, our discussions of tropical cyclones and sea level are not based directly onclimate model projections of these quantities. Rather, we summarize results fromthe recent literature, including that written after IPCC AR4. Both topics are subjectsof intense research, and understanding of both has evolved considerably even sincethe release of IPCC AR4 a few years ago. Nonetheless there are still very substantialuncertainties in both these areas and our discussion characterizes that.
In summary, this report presents what current science has to tell us about therisks for the US Gulf coast and the Caribbean under climate change. To quantify thisrisk, we use climate model-based projections produced for the IPCC AR4, under oneparticular scenario for increases in greenhouse gases, comparing the projected late-
Winter (DJF)
90W 60W
20N
Spring (MAM)
90W 60W
20N
Summer (JJA)
90W 60W
20N
Fall (SON)
90W 60W
20N
1
1.5
2
2.5
3
3.5
4
1
1.5
2
2.5
3
3.5
4
1
1.5
2
2.5
3
3.5
4
1
1.5
2
2.5
3
3.5
4
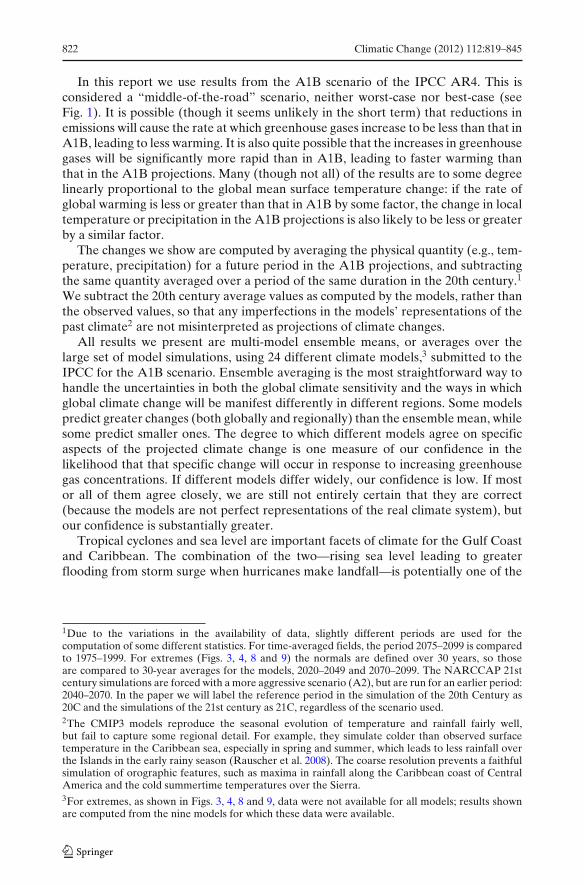
Fig. 2 Multi-Model mean of seasonal temperature anomalies A1B (2075–2099) minus 20C (1975–1999). The anomalies are positive and statistically significant everywhere for all models. The hatchingindicates regions where 75% of the models agree that warming will be larger than 2◦C (3.6◦F). Theshading interval is 1/4◦C (about half ◦F)
824 Climatic Change (2012) 112:819–845
21st century climate to that in the late 20th century. For the US, we supplement theIPCC simulations with the four NARCCAP simulations, in order to assess if there isqualitative agreement between the coarse-resolution and the fine-resolution models.Because of uncertainty in future greenhouse gas emissions, uncertainties associatedwith the models’ imperfect representations of the climate system, and the differenttime horizons which may be of interest for different applications, the results belowshould not be interpreted as precise quantitative predictions. Rather, they should betaken as broadly indicative of the kinds of changes that are likely to occur as theclimate warms. Our discussions of changes in tropical cyclones and sea level are, dueto the nature of the subject, more qualitative than our discussions of temperature andprecipitation, and are based on surveys of the recent peer-reviewed literature ratherthan directly on the climate model projections from IPCC AR4.
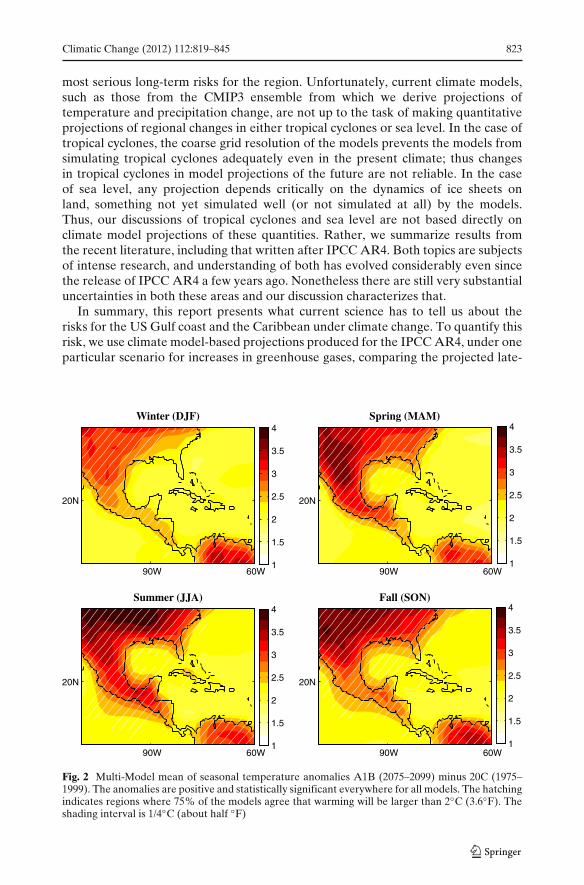
Fig. 3 Average heat waveduration index (HWDI, indays) as simulated by nineclimate models. The yearlyvalue of HWDI measures themaximum period (over thecourse of that year) withmaximum temperature morethan 5◦C above the 1961–1990daily normal, subject to therestriction that such periodmust be longer than fiveconsecutive days. Top:1961–1990 average in the 20thcentury integrations. Middle:2020–2049 average in the 21C(A1B) integrations. Bottom:2070–2099 average in the 21C(A1B) integrations. Hatchingin the bottom panels indicatesareas in the increase withrespect to the climate normalis statistically significant at the95% level for at least 2/3 of themodels. The shading interval isfive days
HWDI 20C normal
90W 60W
20N
HWDI mid 21C
90W 60W
20N
HWDI late 21C
90W 60W
20N
0
50
100
0
50
100
0
50
100
Climatic Change (2012) 112:819–845 825
3 The regional climate
3.1 Temperature
The most robust response to increased greenhouse gases in the Gulf and Caribbeanregion, as elsewhere, is a marked warming. This is manifest in increases in seasonalmean surface temperature, in the number of warm nights, in record high temper-ature, in the duration of heat waves, and a corresponding decrease in days belowfreezing, record lows, and cold snaps.
Figure 2 shows the differences, or “anomalies” in seasonal mean surface airtemperature between the late 21st century and the late 20th century. As discussedabove, the results from both periods are computed from the ensemble mean ofthe 24 climate models used in IPCC AR4. The warming is statistically significanteverywhere if computed for each model individually, as well as for the ensemblemean. In all seasons, the continent warms more than the ocean, and 75% of themodels project more than 2◦C (3.6◦F) of mean warming. The details of the warmingvary with the seasons. During spring, the maximum warming follows the topographyand is likely associated with earlier snow-melt. During summer and fall the land-sea contrast is maximum, and the warmest temperatures are in the interior of thecontinent.
Figure 3 show the maximum duration of a heat wave as simulated by 9 climatemodels for the 20th century climate normal period (1961–1990), early in the 21stcentury (2020–2049) and late in the 21st century (2070–2099). Here a heat wave isdefined as a period of at least five days when temperatures exceed the normal for
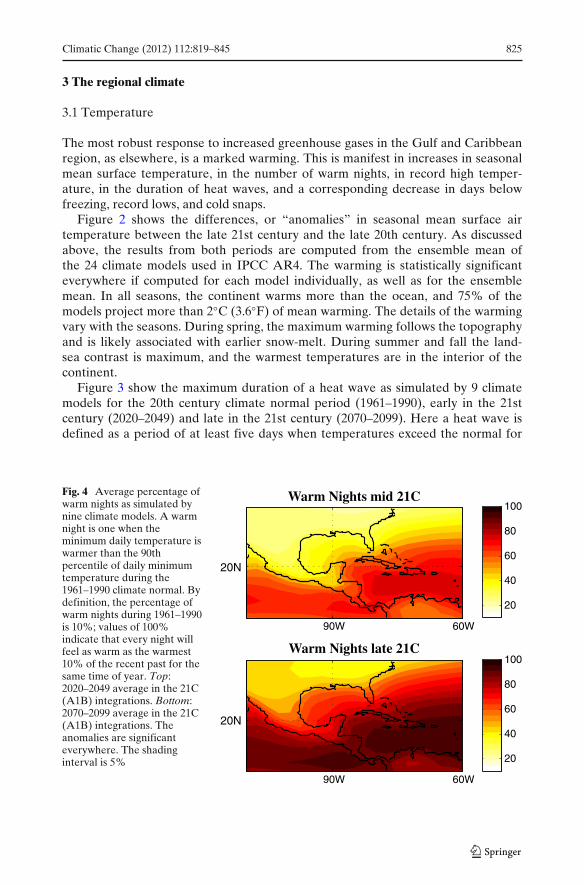
Fig. 4 Average percentage ofwarm nights as simulated bynine climate models. A warmnight is one when theminimum daily temperature iswarmer than the 90thpercentile of daily minimumtemperature during the1961–1990 climate normal. Bydefinition, the percentage ofwarm nights during 1961–1990is 10%; values of 100%indicate that every night willfeel as warm as the warmest10% of the recent past for thesame time of year. Top:2020–2049 average in the 21C(A1B) integrations. Bottom:2070–2099 average in the 21C(A1B) integrations. Theanomalies are significanteverywhere. The shadinginterval is 5%
Warm Nights mid 21C
90W 60W
20N
Warm Nights late 21C
90W 60W
20N
20
40
60
80
100
20
40
60
80
100
826 Climatic Change (2012) 112:819–845
that calendar day by 5◦C (9◦F). In the US interior, by the end of the century, entireseasons will be as warm as what we now consider a heat wave. The increase is notso dramatic for more maritime regions, but even along the Gulf we can expect “heatwaves” of more than two months. This increase in occurrence of heat waves will ofcourse happen gradually, but is expected to be already noticeable in the near future(Diffenbaugh and Ashfaq 2010).
The increase in the number of warm nights (Fig. 4) is also widespread, but isexpected to be greater in the deep tropics and Caribbean, less so over the US. Nightsas warm as the 10% warmest nights of a typical year in the 60s, 70s, or 80s will befour times as frequent in the Gulf states (eight times, in Hispaniola) by the end ofthis century. Warm nights and heat wave duration are both relevant to the visceralhuman experience of climate, and also likely related to energy use in regions whereair conditioning is widespread.
5 0 5 100
10
20
30
40
50
60
70
Seasonal Anomalies (oC)
Freq
uenc
y (%
)
Summer
(JJA)
5 0 5 100
10
20
30
40
Seasonal Anomalies (oC)
Freq
uenc
y (%
)Caribbean Temperature Distribution
Winter(DJF)
5 0 5 100
5
10
15
20
25
30
35
Seasonal Anomalies (oC)
Freq
uenc
y (%
)
Summer
(JJA)20C21C
5 0 5 100
5
10
15
Seasonal Anomalies (oC)
Freq
uenc
y (%
)
Gulf States Temperature Distribution
Winter(DJF)
20C21C
20C21C
20C21C
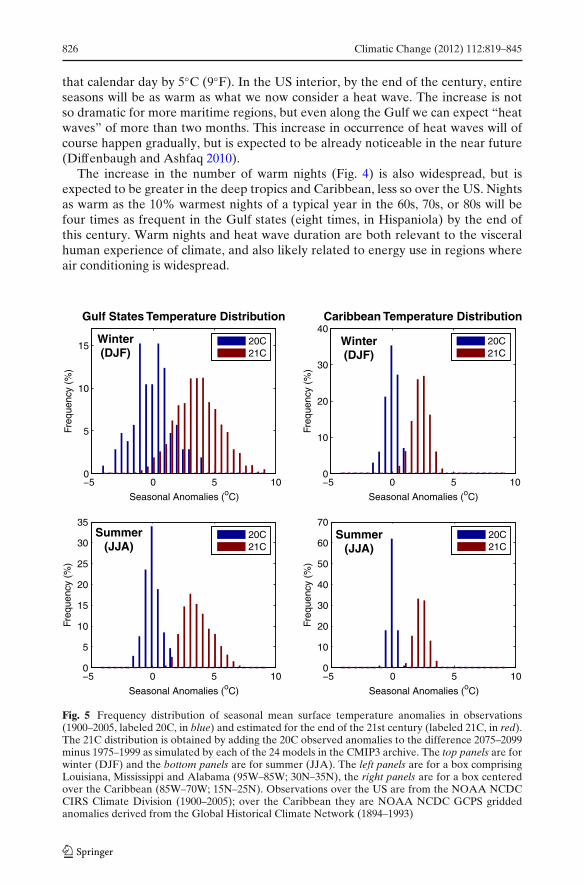
Fig. 5 Frequency distribution of seasonal mean surface temperature anomalies in observations(1900–2005, labeled 20C, in blue) and estimated for the end of the 21st century (labeled 21C, in red).The 21C distribution is obtained by adding the 20C observed anomalies to the difference 2075–2099minus 1975–1999 as simulated by each of the 24 models in the CMIP3 archive. The top panels are forwinter (DJF) and the bottom panels are for summer (JJA). The left panels are for a box comprisingLouisiana, Mississippi and Alabama (95W–85W; 30N–35N), the right panels are for a box centeredover the Caribbean (85W–70W; 15N–25N). Observations over the US are from the NOAA NCDCCIRS Climate Division (1900–2005); over the Caribbean they are NOAA NCDC GCPS griddedanomalies derived from the Global Historical Climate Network (1894–1993)
Climatic Change (2012) 112:819–845 827
Winter (DJF)
90W 60W
20N
Spring (MAM)
90W 60W
20N
Summer (JJA)
90W 60W
20N
Fall (SON)
90W 60W
20N
40
20
0
20
40
40
20
0
20
40
40
20
0
20
40
40
20
0
20
40
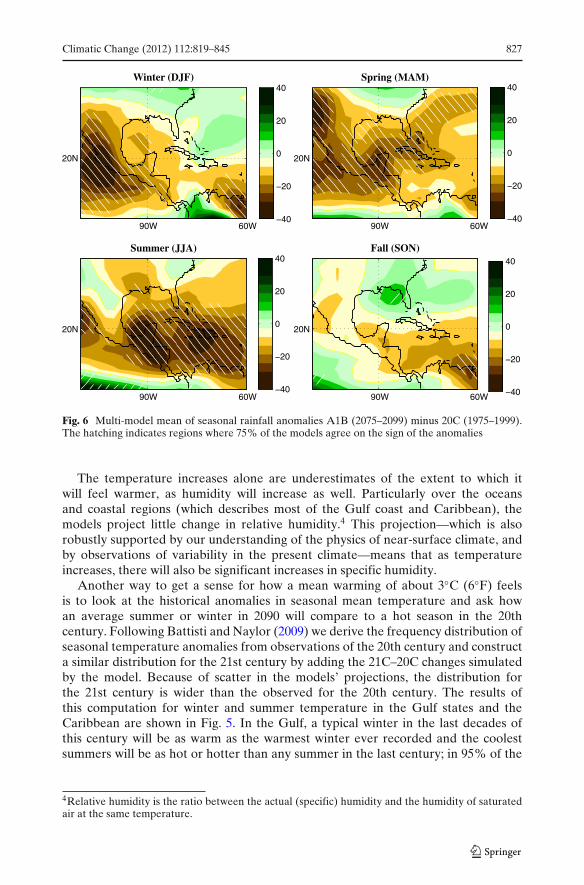
Fig. 6 Multi-model mean of seasonal rainfall anomalies A1B (2075–2099) minus 20C (1975–1999).The hatching indicates regions where 75% of the models agree on the sign of the anomalies
The temperature increases alone are underestimates of the extent to which itwill feel warmer, as humidity will increase as well. Particularly over the oceansand coastal regions (which describes most of the Gulf coast and Caribbean), themodels project little change in relative humidity.4 This projection—which is alsorobustly supported by our understanding of the physics of near-surface climate, andby observations of variability in the present climate—means that as temperatureincreases, there will also be significant increases in specific humidity.
Another way to get a sense for how a mean warming of about 3◦C (6◦F) feelsis to look at the historical anomalies in seasonal mean temperature and ask howan average summer or winter in 2090 will compare to a hot season in the 20thcentury. Following Battisti and Naylor (2009) we derive the frequency distribution ofseasonal temperature anomalies from observations of the 20th century and constructa similar distribution for the 21st century by adding the 21C–20C changes simulatedby the model. Because of scatter in the models’ projections, the distribution forthe 21st century is wider than the observed for the 20th century. The results ofthis computation for winter and summer temperature in the Gulf states and theCaribbean are shown in Fig. 5. In the Gulf, a typical winter in the last decades ofthis century will be as warm as the warmest winter ever recorded and the coolestsummers will be as hot or hotter than any summer in the last century; in 95% of the
4Relative humidity is the ratio between the actual (specific) humidity and the humidity of saturatedair at the same temperature.
828 Climatic Change (2012) 112:819–845
years, summer temperatures will be unprecedented. A similar picture emerges forthe Caribbean: here the interannual variability is much smaller (reflecting both thetropical location and the maritime climate), making all summers and 90% of wintersat the end of the century warmer than ever in the past.
3.2 Rainfall
The mean rainfall response to greenhouse gas increases in the Gulf and Caribbeancan be broadly described as a drying of the latitude band between 10◦N and 30◦N,with wetting to the south and to the north (Fig. 6 and also Fig. 12). Looking morecarefully at the seasonal evolution and the spatial detail of the anomalies, we areconfronted with much more uncertainty than for the temperature response. In themean, models project moderate drying along the Gulf coast for most of the year,except the fall, but because the Gulf states are located at the latitude where weexpect rainfall anomalies to switch from negative to positive, the outlook is uncertain.We have compared the projections of Fig. 6 with those obtained by four regionalprojections by the North American Regional Climate Change Assessment Program
Winter (DJF)
90W 60W
20N
30N
40
20
0
20
40Spring (MAM)
90W 60W
20N
30N
40
20
0
20
40
Summer (JJA)
90W 60W
20N
30N
40
20
0
20
40Fall (SON)
90W 60W
20N
30N
40
20
0
20
40
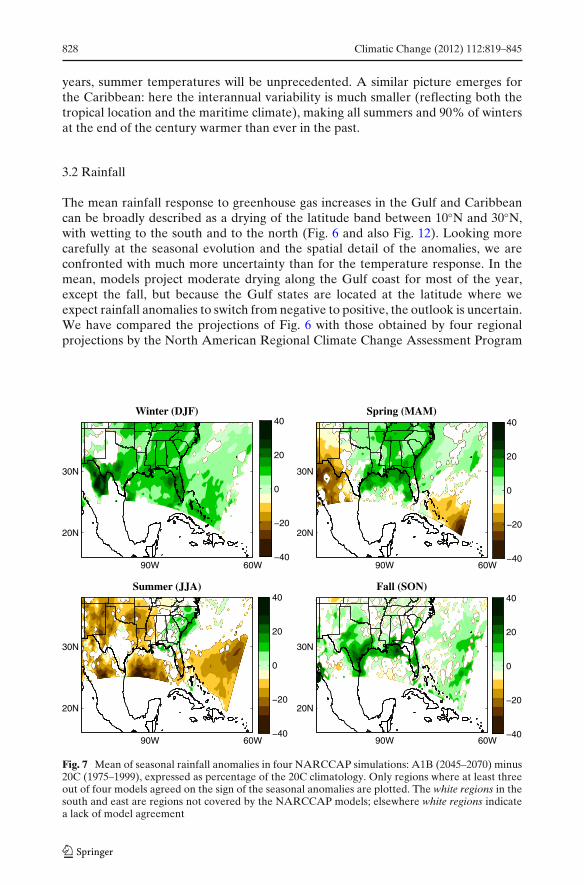
Fig. 7 Mean of seasonal rainfall anomalies in four NARCCAP simulations: A1B (2045–2070) minus20C (1975–1999), expressed as percentage of the 20C climatology. Only regions where at least threeout of four models agreed on the sign of the seasonal anomalies are plotted. The white regions in thesouth and east are regions not covered by the NARCCAP models; elsewhere white regions indicatea lack of model agreement
Climatic Change (2012) 112:819–845 829
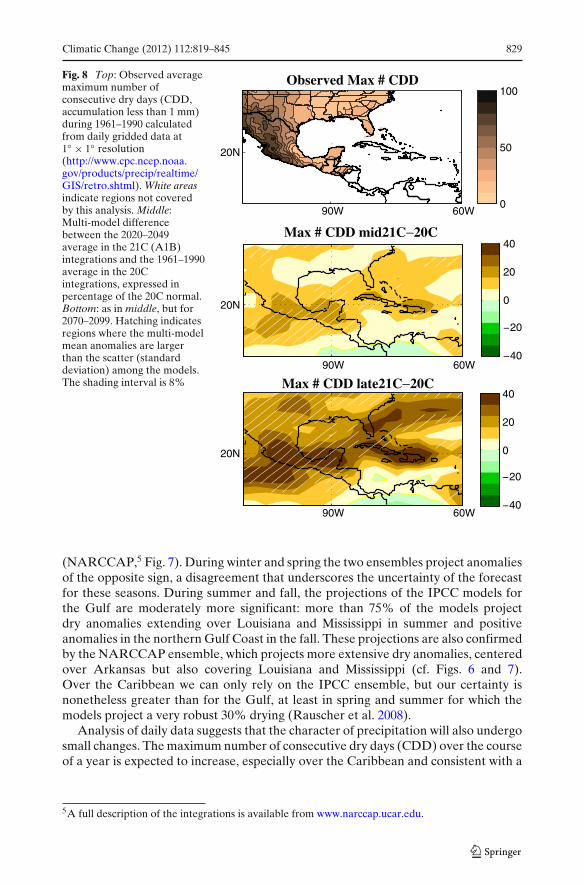
Fig. 8 Top: Observed averagemaximum number ofconsecutive dry days (CDD,accumulation less than 1 mm)during 1961–1990 calculatedfrom daily gridded data at1◦ × 1◦ resolution(http://www.cpc.ncep.noaa.gov/products/precip/realtime/GIS/retro.shtml). White areasindicate regions not coveredby this analysis. Middle:Multi-model differencebetween the 2020–2049average in the 21C (A1B)integrations and the 1961–1990average in the 20Cintegrations, expressed inpercentage of the 20C normal.Bottom: as in middle, but for2070–2099. Hatching indicatesregions where the multi-modelmean anomalies are largerthan the scatter (standarddeviation) among the models.The shading interval is 8%
Observed Max # CDD
Max # CDD mid21C−20C
Max # CDD late21C−20C
90W 60W
90W 60W
90W 60W
20N
0
50
100
20N
20N
40
20
0
20
40
40
20
0
20
40
(NARCCAP,5 Fig. 7). During winter and spring the two ensembles project anomaliesof the opposite sign, a disagreement that underscores the uncertainty of the forecastfor these seasons. During summer and fall, the projections of the IPCC models forthe Gulf are moderately more significant: more than 75% of the models projectdry anomalies extending over Louisiana and Mississippi in summer and positiveanomalies in the northern Gulf Coast in the fall. These projections are also confirmedby the NARCCAP ensemble, which projects more extensive dry anomalies, centeredover Arkansas but also covering Louisiana and Mississippi (cf. Figs. 6 and 7).Over the Caribbean we can only rely on the IPCC ensemble, but our certainty isnonetheless greater than for the Gulf, at least in spring and summer for which themodels project a very robust 30% drying (Rauscher et al. 2008).
Analysis of daily data suggests that the character of precipitation will also undergosmall changes. The maximum number of consecutive dry days (CDD) over the courseof a year is expected to increase, especially over the Caribbean and consistent with a
5A full description of the integrations is available from www.narccap.ucar.edu.
830 Climatic Change (2012) 112:819–845
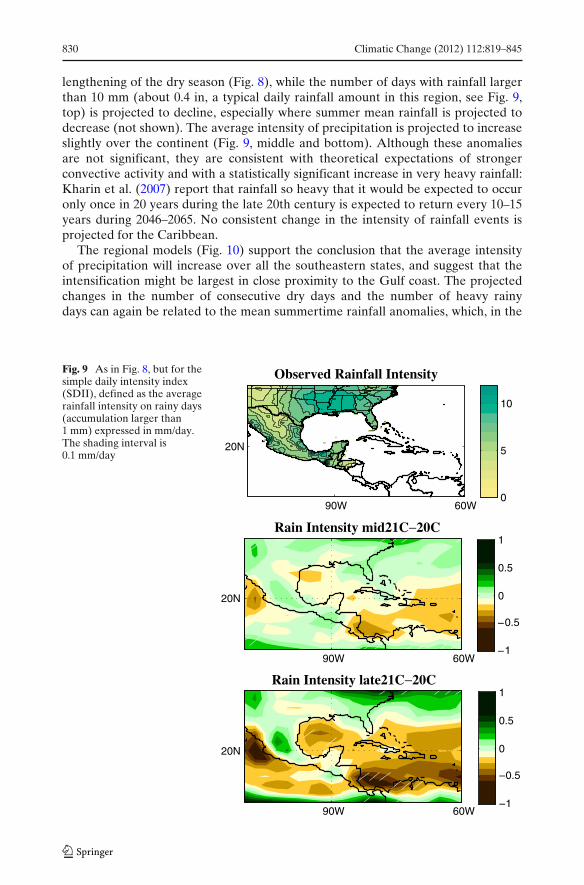
lengthening of the dry season (Fig. 8), while the number of days with rainfall largerthan 10 mm (about 0.4 in, a typical daily rainfall amount in this region, see Fig. 9,top) is projected to decline, especially where summer mean rainfall is projected todecrease (not shown). The average intensity of precipitation is projected to increaseslightly over the continent (Fig. 9, middle and bottom). Although these anomaliesare not significant, they are consistent with theoretical expectations of strongerconvective activity and with a statistically significant increase in very heavy rainfall:Kharin et al. (2007) report that rainfall so heavy that it would be expected to occuronly once in 20 years during the late 20th century is expected to return every 10–15years during 2046–2065. No consistent change in the intensity of rainfall events isprojected for the Caribbean.
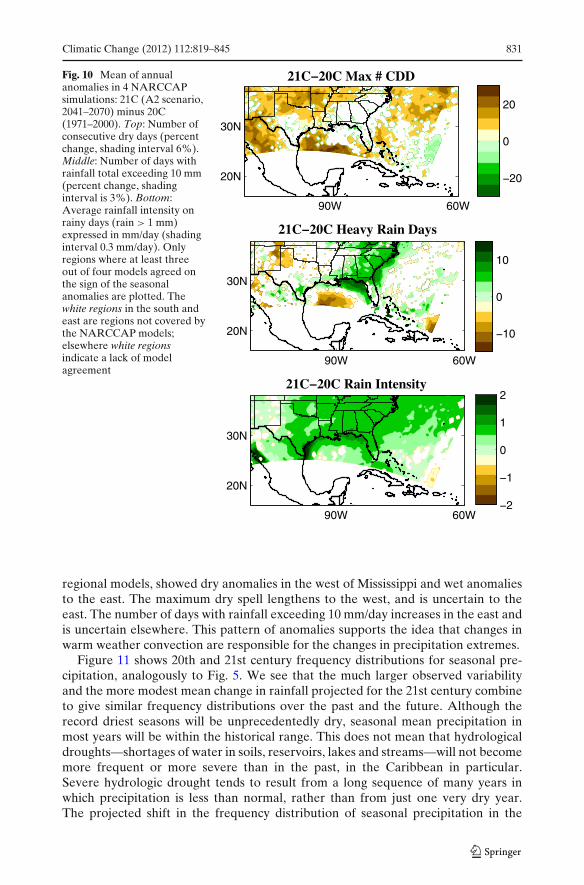
The regional models (Fig. 10) support the conclusion that the average intensityof precipitation will increase over all the southeastern states, and suggest that theintensification might be largest in close proximity to the Gulf coast. The projectedchanges in the number of consecutive dry days and the number of heavy rainydays can again be related to the mean summertime rainfall anomalies, which, in the
Fig. 9 As in Fig. 8, but for thesimple daily intensity index(SDII), defined as the averagerainfall intensity on rainy days(accumulation larger than1 mm) expressed in mm/day.The shading interval is0.1 mm/day
Observed Rainfall Intensity
Rain Intensity mid21C−20C
Rain Intensity late21C−20C
90W 60W
20N
0
5
10
90W 60W
20N
90W 60W
20N
1
0.5
0
0.5
1
1
0.5
0
0.5
1
Climatic Change (2012) 112:819–845 831
Fig. 10 Mean of annualanomalies in 4 NARCCAPsimulations: 21C (A2 scenario,2041–2070) minus 20C(1971–2000). Top: Number ofconsecutive dry days (percentchange, shading interval 6%).Middle: Number of days withrainfall total exceeding 10 mm(percent change, shadinginterval is 3%). Bottom:Average rainfall intensity onrainy days (rain > 1 mm)expressed in mm/day (shadinginterval 0.3 mm/day). Onlyregions where at least threeout of four models agreed onthe sign of the seasonalanomalies are plotted. Thewhite regions in the south andeast are regions not covered bythe NARCCAP models;elsewhere white regionsindicate a lack of modelagreement
90W 60W
20N
30N
20
0
20
90W 60W
20N
30N
10
0
10
90W 60W
20N
30N
2
1
0
1
2
regional models, showed dry anomalies in the west of Mississippi and wet anomaliesto the east. The maximum dry spell lengthens to the west, and is uncertain to theeast. The number of days with rainfall exceeding 10 mm/day increases in the east andis uncertain elsewhere. This pattern of anomalies supports the idea that changes inwarm weather convection are responsible for the changes in precipitation extremes.
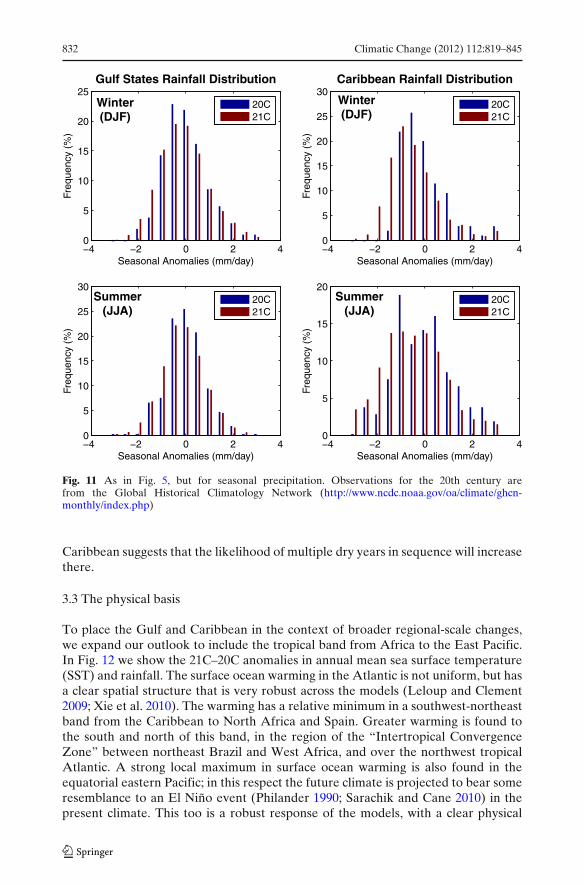
Figure 11 shows 20th and 21st century frequency distributions for seasonal pre-cipitation, analogously to Fig. 5. We see that the much larger observed variabilityand the more modest mean change in rainfall projected for the 21st century combineto give similar frequency distributions over the past and the future. Although therecord driest seasons will be unprecedentedly dry, seasonal mean precipitation inmost years will be within the historical range. This does not mean that hydrologicaldroughts—shortages of water in soils, reservoirs, lakes and streams—will not becomemore frequent or more severe than in the past, in the Caribbean in particular.Severe hydrologic drought tends to result from a long sequence of many years inwhich precipitation is less than normal, rather than from just one very dry year.The projected shift in the frequency distribution of seasonal precipitation in the
832 Climatic Change (2012) 112:819–845
4 2 0 2 40
5
10
15
20
25
30
Seasonal Anomalies (mm/day)
Freq
uenc
y (%
)
Summer
(JJA)20C21C
4 2 0 2 40
5
10
15
20
25
Seasonal Anomalies (mm/day)
Freq
uenc
y (%
)Gulf States Rainfall Distribution
Winter(DJF)
20C21C
4 2 0 2 40
5
10
15
20
Seasonal Anomalies (mm/day)
Freq
uenc
y (%
)
Summer
(JJA)20C21C
4 2 0 2 40
5
10
15
20
25
30
Seasonal Anomalies (mm/day)
Freq
uenc
y (%
)
Caribbean Rainfall Distribution
Winter(DJF)
20C21C
Fig. 11 As in Fig. 5, but for seasonal precipitation. Observations for the 20th century arefrom the Global Historical Climatology Network (http://www.ncdc.noaa.gov/oa/climate/ghcn-monthly/index.php)
Caribbean suggests that the likelihood of multiple dry years in sequence will increasethere.
3.3 The physical basis
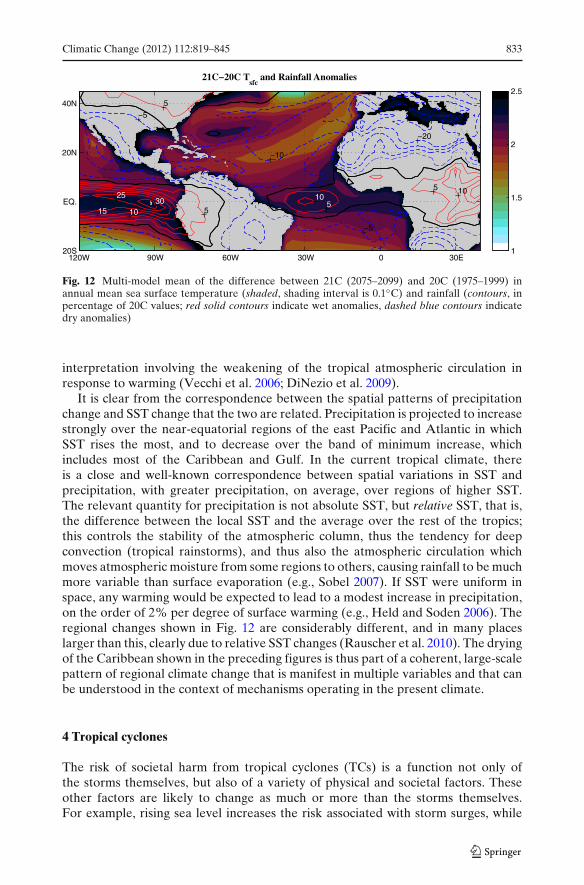
To place the Gulf and Caribbean in the context of broader regional-scale changes,we expand our outlook to include the tropical band from Africa to the East Pacific.In Fig. 12 we show the 21C–20C anomalies in annual mean sea surface temperature(SST) and rainfall. The surface ocean warming in the Atlantic is not uniform, but hasa clear spatial structure that is very robust across the models (Leloup and Clement2009; Xie et al. 2010). The warming has a relative minimum in a southwest-northeastband from the Caribbean to North Africa and Spain. Greater warming is found tothe south and north of this band, in the region of the “Intertropical ConvergenceZone” between northeast Brazil and West Africa, and over the northwest tropicalAtlantic. A strong local maximum in surface ocean warming is also found in theequatorial eastern Pacific; in this respect the future climate is projected to bear someresemblance to an El Niño event (Philander 1990; Sarachik and Cane 2010) in thepresent climate. This too is a robust response of the models, with a clear physical
Climatic Change (2012) 112:819–845 833
sfc
and Rainfall Anomalies
20
10
5
5
5
5
5
5
5
1010
1015
2530
120W 90W 60W 30W 0 30E20S
EQ.
20N
40N
1
1.5
2
2.5
Fig. 12 Multi-model mean of the difference between 21C (2075–2099) and 20C (1975–1999) inannual mean sea surface temperature (shaded, shading interval is 0.1◦C) and rainfall (contours, inpercentage of 20C values; red solid contours indicate wet anomalies, dashed blue contours indicatedry anomalies)
interpretation involving the weakening of the tropical atmospheric circulation inresponse to warming (Vecchi et al. 2006; DiNezio et al. 2009).
It is clear from the correspondence between the spatial patterns of precipitationchange and SST change that the two are related. Precipitation is projected to increasestrongly over the near-equatorial regions of the east Pacific and Atlantic in whichSST rises the most, and to decrease over the band of minimum increase, whichincludes most of the Caribbean and Gulf. In the current tropical climate, thereis a close and well-known correspondence between spatial variations in SST andprecipitation, with greater precipitation, on average, over regions of higher SST.The relevant quantity for precipitation is not absolute SST, but relative SST, that is,the difference between the local SST and the average over the rest of the tropics;this controls the stability of the atmospheric column, thus the tendency for deepconvection (tropical rainstorms), and thus also the atmospheric circulation whichmoves atmospheric moisture from some regions to others, causing rainfall to be muchmore variable than surface evaporation (e.g., Sobel 2007). If SST were uniform inspace, any warming would be expected to lead to a modest increase in precipitation,on the order of 2% per degree of surface warming (e.g., Held and Soden 2006). Theregional changes shown in Fig. 12 are considerably different, and in many placeslarger than this, clearly due to relative SST changes (Rauscher et al. 2010). The dryingof the Caribbean shown in the preceding figures is thus part of a coherent, large-scalepattern of regional climate change that is manifest in multiple variables and that canbe understood in the context of mechanisms operating in the present climate.
4 Tropical cyclones
The risk of societal harm from tropical cyclones (TCs) is a function not only ofthe storms themselves, but also of a variety of physical and societal factors. Theseother factors are likely to change as much or more than the storms themselves.For example, rising sea level increases the risk associated with storm surges, while
834 Climatic Change (2012) 112:819–845
increasing coastal development increases economic damage for a given storm. Toprovide a baseline for considering these issues, we first briefly describe the presentclimatology of tropical cyclones in the Gulf and Caribbean, before continuing todiscuss the current state of the science regarding how tropical cyclones in this regionmay change in the future as the climate warms.
4.1 Present climatology
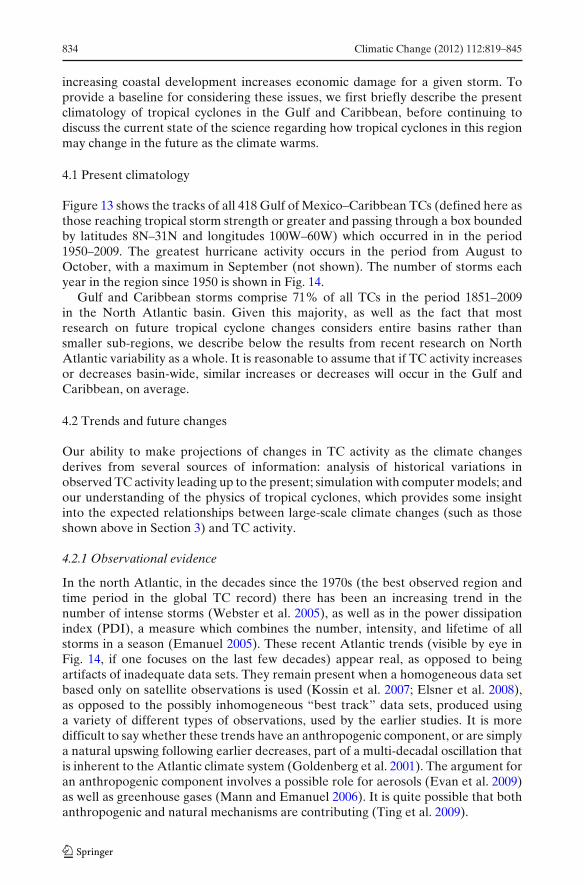
Figure 13 shows the tracks of all 418 Gulf of Mexico–Caribbean TCs (defined here asthose reaching tropical storm strength or greater and passing through a box boundedby latitudes 8N–31N and longitudes 100W–60W) which occurred in in the period1950–2009. The greatest hurricane activity occurs in the period from August toOctober, with a maximum in September (not shown). The number of storms eachyear in the region since 1950 is shown in Fig. 14.
Gulf and Caribbean storms comprise 71% of all TCs in the period 1851–2009in the North Atlantic basin. Given this majority, as well as the fact that mostresearch on future tropical cyclone changes considers entire basins rather thansmaller sub-regions, we describe below the results from recent research on NorthAtlantic variability as a whole. It is reasonable to assume that if TC activity increasesor decreases basin-wide, similar increases or decreases will occur in the Gulf andCaribbean, on average.
4.2 Trends and future changes
Our ability to make projections of changes in TC activity as the climate changesderives from several sources of information: analysis of historical variations inobserved TC activity leading up to the present; simulation with computer models; andour understanding of the physics of tropical cyclones, which provides some insightinto the expected relationships between large-scale climate changes (such as thoseshown above in Section 3) and TC activity.
4.2.1 Observational evidence
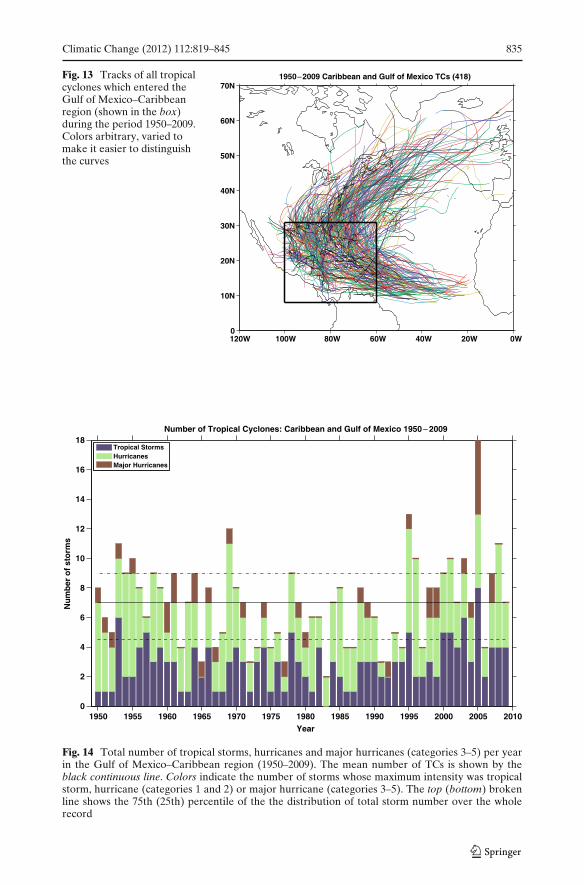
In the north Atlantic, in the decades since the 1970s (the best observed region andtime period in the global TC record) there has been an increasing trend in thenumber of intense storms (Webster et al. 2005), as well as in the power dissipationindex (PDI), a measure which combines the number, intensity, and lifetime of allstorms in a season (Emanuel 2005). These recent Atlantic trends (visible by eye inFig. 14, if one focuses on the last few decades) appear real, as opposed to beingartifacts of inadequate data sets. They remain present when a homogeneous data setbased only on satellite observations is used (Kossin et al. 2007; Elsner et al. 2008),as opposed to the possibly inhomogeneous “best track” data sets, produced usinga variety of different types of observations, used by the earlier studies. It is moredifficult to say whether these trends have an anthropogenic component, or are simplya natural upswing following earlier decreases, part of a multi-decadal oscillation thatis inherent to the Atlantic climate system (Goldenberg et al. 2001). The argument foran anthropogenic component involves a possible role for aerosols (Evan et al. 2009)as well as greenhouse gases (Mann and Emanuel 2006). It is quite possible that bothanthropogenic and natural mechanisms are contributing (Ting et al. 2009).
Climatic Change (2012) 112:819–845 835
Fig. 13 Tracks of all tropicalcyclones which entered theGulf of Mexico–Caribbeanregion (shown in the box)during the period 1950–2009.Colors arbitrary, varied tomake it easier to distinguishthe curves
120W 100W 80W 60W 40W 20W 0W 0
10N
20N
30N
40N
50N
60N
70N1950−2009 Caribbean and Gulf of Mexico TCs (418)
1950 1955 1960 1965 1970 1975 1980 1985 1990 1995 2000 2005 20100
2
4
6
8
10
12
14
16
18
Year
Nu
mb
er o
f st
orm
s
Number of Tropical Cyclones: Caribbean and Gulf of Mexico 1950 − 2009
Tropical StormsHurricanesMajor Hurricanes
Fig. 14 Total number of tropical storms, hurricanes and major hurricanes (categories 3–5) per yearin the Gulf of Mexico–Caribbean region (1950–2009). The mean number of TCs is shown by theblack continuous line. Colors indicate the number of storms whose maximum intensity was tropicalstorm, hurricane (categories 1 and 2) or major hurricane (categories 3–5). The top (bottom) brokenline shows the 75th (25th) percentile of the the distribution of total storm number over the wholerecord
836 Climatic Change (2012) 112:819–845
One approach to quantify the anthropogenic trend would be to look at the entiredata record since the mid-19th century: presumably trends over this longer periodwould be more likely to be anthropogenic in origin than would shorter-term trends.Unfortunately, attempts to identify trends over these longer periods are renderedinconclusive by the greater inhomogeneity of the data in the early record (Landsea2005, 2007; Landsea et al. 2006). It is quite possible that storms occurring at sea couldhave gone unobserved in the 19th or early 20th centuries. In more recent years thisis less likely due to increased ship traffic and, since 1970, satellites. These changesin observational capacity may be expected to introduce an artificial upward trend,potentially as large as those actually found in the data (Chang and Guo 2007; Mannet al. 2007; Vecchi and Knutson 2008; Landsea et al. 2010).
4.2.2 Inf luence of SST and other environmental changes
We can use our physical understanding of the mechanisms by which specific aspectsof the climate influence the formation and intensification of TCs, together withhistorical relationships between TC formation and intensification and climate atinterannual time scales, to inform our expectations of the response of TC activitiesto a given change in climate. Tropical cyclones form only in regions of relatively highsea surface temperature (SST). SST has long been recognized as one of the factorsthat influences both TC formation (Gray 1979) and the maximum intensity attainableby a mature TC (Emanuel 1987; Holland 1997). This relationship has spurred theconcern that future SST increases in response to increased greenhouse gases willbe associated with increases in the number and intensity of TCs. Yet, much of theobserved relationship between SST and TC activity in the historical record can beexplained as well or better by relative SST—the difference between the local SSTat a given location and the tropical mean—than by absolute SST (Vecchi and Soden2007b; Vecchi et al. 2008). There are also good physical reasons to expect relativeSST to be the more important quantity for TC activity, as was the case for meanprecipitation, discussed above (Sobel et al. 2002; Vecchi and Soden 2007b; Swanson2008). This is true for the the north Atlantic in particular. Recent increases in TCactivity have been simultaneous with SST warming there (Emanuel 2005, 2007), butthe more important fact may be that the tropical north Atlantic SST has increasedmore than the northern hemispheric average in this period.
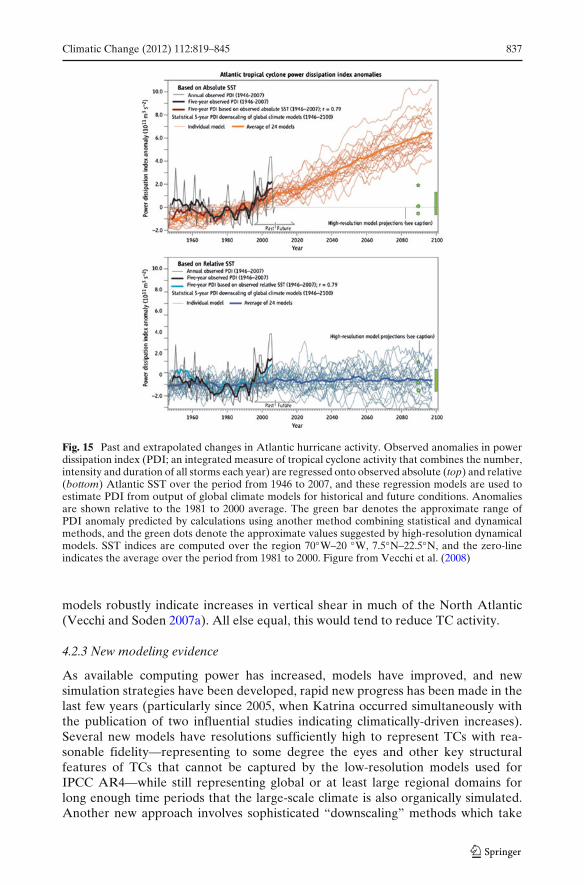
If the absolute value of SST were considered the primary variable controlling TCactivity, one would expect dramatic increases in TC activity as the climate warms. Onthe other hand, the picture is very different if one considers relative SST to be themore relevant variable. There is no reason to expect that future changes in relativeSST will be anywhere near as large as changes in absolute SST. Future SST patternsare projected to be broadly similar to those today (with changes in spatial structurethat are significant, but still small compared to the mean change, as can be seen fromFig. 12), except warmer. If one were to assume that statistical relationships betweenrelative SST and TC activity from the present will continue to hold in the future, onewould then expect relatively little change in TC activity, as shown in Fig. 15 (Vecchiand Soden 2007b; Vecchi et al. 2008).
Other environmental factors besides SST also play a role in controlling TCactivity. One important one is the vertical wind shear, (the difference in the winds atlow and high levels in the atmosphere). Future climate projections with the CMIP3
Climatic Change (2012) 112:819–845 837
Fig. 15 Past and extrapolated changes in Atlantic hurricane activity. Observed anomalies in powerdissipation index (PDI; an integrated measure of tropical cyclone activity that combines the number,intensity and duration of all storms each year) are regressed onto observed absolute (top) and relative(bottom) Atlantic SST over the period from 1946 to 2007, and these regression models are used toestimate PDI from output of global climate models for historical and future conditions. Anomaliesare shown relative to the 1981 to 2000 average. The green bar denotes the approximate range ofPDI anomaly predicted by calculations using another method combining statistical and dynamicalmethods, and the green dots denote the approximate values suggested by high-resolution dynamicalmodels. SST indices are computed over the region 70◦W–20 ◦W, 7.5◦N–22.5◦N, and the zero-lineindicates the average over the period from 1981 to 2000. Figure from Vecchi et al. (2008)
models robustly indicate increases in vertical shear in much of the North Atlantic(Vecchi and Soden 2007a). All else equal, this would tend to reduce TC activity.
4.2.3 New modeling evidence
As available computing power has increased, models have improved, and newsimulation strategies have been developed, rapid new progress has been made in thelast few years (particularly since 2005, when Katrina occurred simultaneously withthe publication of two influential studies indicating climatically-driven increases).Several new models have resolutions sufficiently high to represent TCs with rea-sonable fidelity—representing to some degree the eyes and other key structuralfeatures of TCs that cannot be captured by the low-resolution models used forIPCC AR4—while still representing global or at least large regional domains forlong enough time periods that the large-scale climate is also organically simulated.Another new approach involves sophisticated “downscaling” methods which take
838 Climatic Change (2012) 112:819–845
information about the large-scale climate from low-resolution global climate modelsand use it as input for higher-resolution simulations of tropical cyclones to produceprojections incorporating advantages of both elements.
Results from studies with both of these new methodologies show considerablediversity, but also an emerging consensus on the broad outlines of the changes inglobal TC activity that are expected in the warming climate. On average across theglobe, assuming global climate changes within the range deemed most likely, theaverage intensity of tropical cyclones is expected to increase by 2–11% while thefrequency of TC occurrence is expected to decrease by 6–34% (Knutson et al. 2010).This projected decrease in frequency of all storms (from tropical storm up to category5 hurricane strength) is not comforting, because the frequency of the most intensestorms in particular is projected to increase. The most intense storms produce by farthe greatest damage.
These projections are considerably more robust than those of just a few yearsago, but they apply only to global average TC activity. We are not able to makeprojections with any confidence for individual regions such as the North Atlantic:when applied to individual regions, the available methodologies give results whichvary too widely. Similarly, we cannot make with confidence any statements aboutchanges in other aspects of tropical cyclone activity, such as genesis location, dura-tion, and tracks.
5 Sea level
Worldwide, sea level rise is driven by processes occurring in the ocean and by transferof water currently on land into the oceans (IPCC 2007). The two specific processesthat contribute most are thermal expansion of ocean water and melting of land ice.6
Because seawater density depends on temperature, with warmer water having lowerdensity, water in the ocean basins will expand as global mean temperature increases.The amount of expansion varies with location because warmer water expands moreper unit temperature increase than does colder water, and the temperature of theocean currently varies greatly with both depth and geography. Nonetheless, thecontribution to sea level rise from thermal expansion is both well-understood andrelatively small. The much larger and less-constrained contribution is the addition ofwater to the ocean from melting ice sheets and glaciers on land. Presently, the largeice sheets contain a total sea level equivalent of approximately 70 m (Bamber et al.2007), meaning that sea level would rise by that much if the large ice sheets wereto melt completely. While complete melting of all land ice is unlikely in the nearfuture, this number gives a sense of the magnitude of the potential problem in thevery long term.
The rate at which land ice is lost to the oceans ultimately depends on temperature,but not in a simple or obvious way. Simple melting of the ice on land is only onefactor; the greater one is the possibility for large portions of marine-based ice sheets(ice resting on land whose base is below sea level but with a surface above sea level)
6Melting of sea ice—ice currently floating on the surface of the ocean—does not increase sea level,because the floating ice already displaces its weight in liquid water by Archimedes’ principle, andthat weight does not change when the ice melts.
Climatic Change (2012) 112:819–845 839
to become unstable and retreat rapidly (Schoof 2007). Globally averaged sea levelrises by an amount of water equal to the volume of ice above an equivalent sea level.However, meltwater from rapid retreats is not distributed equally across the globe.Large changes in ice volume in Antarctica, for example, yield sea level changes 15–30% higher than the global average for the Gulf of Mexico and Caribbean (Mitrovicaet al. 2009). The likelihood that a collapse will happen for any given ice sheetdepends on ice sheet surface snow accumulation rates, magnitude of sea level riseto date, ocean temperature along a marine margin of an ice sheet, and both icesheet configuration and sub-ice topography. The first three of these processes arelinked intimately to temperature. Large scale ice sheet models that incorporate thesefeatures show tendency for rapid retreat (Pollard and DeConto 2009). However, atpresent no climate models incorporate these processes.
New semi-empirical approaches provide an alternative way for climate modelsto estimate sea level rise. These are based on the idea that the rate of sea levelrise is proportional to the amount of global warming—the warmer it gets, the fasterice melts—and they use past sea level and temperature data to quantify this effect.Extrapolating into the future, these models suggest global sea level rises of aboutone meter by 2100 under the A1B scenario, about three times that projected by IPCCmodels (a 21–48 cm range for the same scenario; IPCC 2007; Vermeer and Rahmstorf2009; Horton et al. 2008; Grinsted et al. 2009; Jevrejeva et al. 2010; summarized inRahmstorf 2010). Yet, while these models take into account contributions from landice of the kind recently observed, they still do not directly include the possibility ofthe non-linear ice dynamics described above producing extreme future changes insea level.
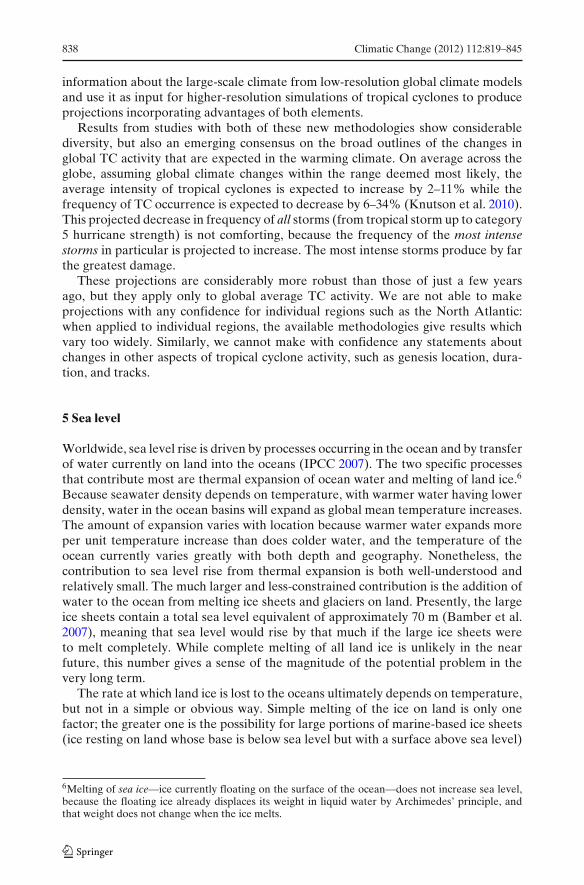
Fig. 16 Sea level change during 1970–2010. The tide gauge data are indicated in red (Church andWhite 2006) and satellite data in blue (Cazenave et al. 2009). The grey band shows the projections ofthe IPCC Third Assessment report (IPCC 2001) for comparison. Figure from Allison et al. (2009)
840 Climatic Change (2012) 112:819–845
The average rate of sea level rise over the 20th century was 1.7 ± 0.3 mm yr−1
from analysis of tide-gauge data (Church and White 2006). The rate has increasedin recent years, however. From 1993 to 2003, the average rate of sea level rise wasapproximately 3.1 mm yr−1 with approximately half that rate coming from thermalexpansion (IPCC 2007, Chapter 5). Sea level is presently rising at a rate of 3.4–3.5 mm yr−1 based on satellite-based sea-surface altimetry, tide gauges, and globalgravity measurements (Fig. 16, Cazenave et al. 2009; Prandi et al. 2009). Since 2003,contributions from thermal expansion have reached a plateau and acceleration ofsea level rise has increased as water is moved from storage in land ice to the ocean(Cazenave et al. 2009).
Information about the dependence of sea level on climate can be gained bystudying evidence of sea level changes associated with fluctuations in climate in thedistant past, especially the cycles of ice ages and deglaciations of the late Pleistoceneand Holocene (roughly, the last million years). A recent compilation of rates of sealevel rise for the northern Gulf of Mexico region gives rates over for the past fourmillenia as 0.4–0.6 mm yr−1 (Milliken et al. 2008). From 4,000 to 7,000 years beforethe present time (BP), this rate was about 1.4 mm yr−1, and for 7,000–10,000 yr BP,the rate of sea level rise was 4.2 mm yr−1. Data from other areas of the Gulf ofMexico show much the same rates (Milliken et al. 2008) and these rates correspondreasonably well to the IPCC synthesis for the same time period (IPCC 2007). Duringthe most recent highstand, approximately 115,000–125,000 years BP, sea level was3–8 m higher than present (Blanchon et al. 2009; Kopp et al. 2009). Rates of sea-levelrise entering this time period could have been as high as 36 mm yr−1 for brief episodes(Blanchon et al. 2009; Waelbroeck et al. 2002), but were likely near 5 mm yr−1 (Koppet al. 2009).
Within their sea-level curves, Milliken et al. (2008) note large jumps above theaverage rate during the period 7,000–10,000 years BP that account for as much as4 m of sea level rise. While there is no direct evidence, these jumps are consistent
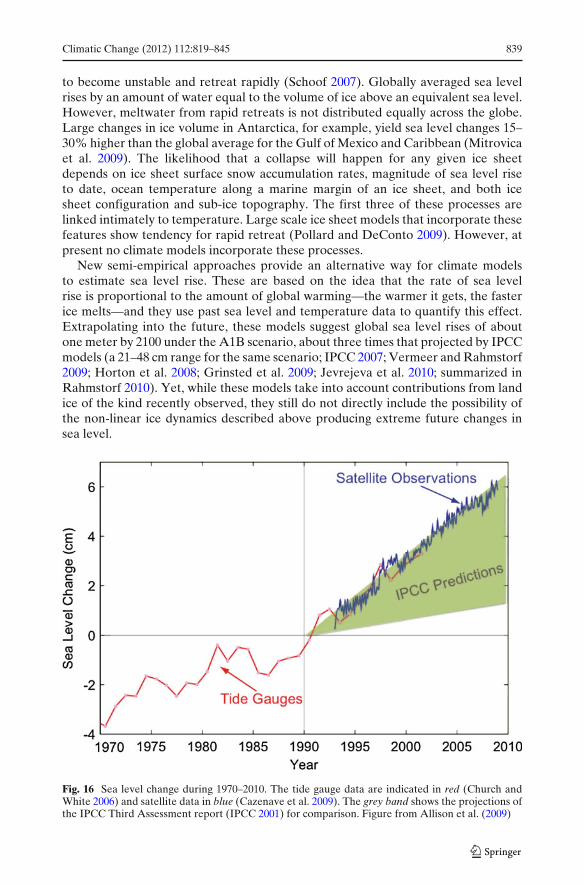
Fig. 17 Lands vulnerable to sea level rise. Regions shown in red are some of the areas that couldbe flooded at high tide if global warming causes sea level to rise 60 cm (2 ft) by 2100. Theindicated areas account not only for the effects of global warming, but also for other effects suchas tidal variations and land subsidence. This figure and the details about how it was producedwere originally published in Titus and Richman (2001) and are available from the EPA website:http://epa.gov/climatechange/effects/coastal/slrmaps.html
Climatic Change (2012) 112:819–845 841
with episodic deglaciation of either the remaining and now gone Laurentide IceSheet (the one which covered much of North America in the last ice age) or regionsof the modern ice Sheets (Greenland, West Antarctica, East Antarctica). Becausemodern sea-level rise is now dominated by land ice loss, it is possible that similarrapid increases in sea level could occur in the future. Presently, outlets of Greenlandand Antarctica in contact with warm ocean water are losing mass at extremely highrates (e.g., Pritchard et al. 2009; Rignot et al. 2008; Rignot and Kanagaratnam 2006).For sea level to inundate low lying areas of the Caribbean or Gulf coast, loss of massfrom only one of a few sensitive basins in an ice sheet would be necessary, such asPine Island Glacier in West Antarctica (Wingham et al. 2009). Indeed, the US Gulfcoast and Florida, for example, have large areas no more than a meter or two abovesea level which are already considered at risk of being flooded even for a relativelylow sea level rise of 60 cm by 2100 (Fig. 17).
Besides direct inundation, sea level rise increases the risk to coastal areas fromstorm surge associated with tropical cyclones (even if the risk that a storm of a givenintensity will strike does not increase). A large part of the damage due to hurricanesin many coastal areas results from storm surge, as the tropical cyclone winds blowingover a large surface of water bounded by a shallow basin cause the water to pileup and move onshore. The total water elevation that can occur at particular coastallocation associated with tropical cyclones is due to the combined effects of stormsurge, the astronomical tide, and breaking waves (Rao et al. 2008). The magnitudeof the storm surge is dependent on the track, intensity, speed of movement and sizeof the hurricane, as well as coastal characteristics such as bathymetry (the depth andtopography of the ocean floor) and the presence of rivers and deltas, and the level ofthe astronomical tide (Dube et al. 2004, 2009). These factors vary greatly from placeto place and storm to storm. Nonetheless, in all cases increases in sea level raise thebaseline to which storm surge adds to create the total water level experienced whena hurricane makes landfall or passes sufficiently close offshore. Thus coastal areassufficiently high to avoid outright inundation will still be affected by sea level rise inthat it will increase their risk of flooding due to storm surge.
6 Conclusions
We have described the changes in the climate of the Gulf of Mexico and Caribbeanregion that are expected to occur in the 21st century, assuming continued increasesin greenhouse gas concentrations in the middle of the range considered in the FourthAssessment Report of the Intergovernmental Panel on Climate Change (IPCCAR4). We have considered changes in temperature, precipitation, tropical cyclones(hurricanes) and sea level. We showed projections for temperature and precipitationbased on the ensemble of climate model simulations performed for the IPCC AR4.Our discussions of tropical cyclones and sea level were based on surveys of the recentliterature, including much that postdates IPCC AR4. The most certain and well-understood threat to the Gulf and Caribbean region from climate change is simplythe increase in temperature. The region is already warm, but by the end of the 21stcentury, the typical summer will be warmer than any summer, even the most extreme,experienced in the past. The warming will be manifest not only on average but inthe extremes (such as heat waves and warm nights) which will also be outside theexperience of those living in the region today.
842 Climatic Change (2012) 112:819–845
Projected changes in precipitation are more varied geographically than those intemperature. The Caribbean is projected to become significantly drier. The reductionin precipitation, unlike the increase in temperature, is not expected to be so large asto make the mean season outside the range of conditions experienced in the past.However, water resources at a given time can be sensitive to rainfall over longerperiods, so there can be serious consequences from multiple consecutive drier-than-normal years even if one such year would not be particularly harmful. Projectedprecipitation changes in the Gulf are small, but also highly uncertain.
The latest modeling evidence suggests that on a global basis, tropical cycloneswill become less frequent, but more intense. The most intense storms, which arerelatively infrequent at present but which do by far the most damage, are projectedto become more frequent. Even on a global basis, these projected changes to the riskfrom tropical cyclones are considerably more uncertain than those in temperature orprecipitation. For a single region such as the Gulf and Caribbean, the uncertainty isgreater still. Some factors, such as projected changes in wind shear, may be expectedto reduce the number and intensity of tropical cyclones in the region. Nonetheless,given the expected global tendency towards more of the most severe storms, there islittle reason for complacency.
Sea level rise may ultimately be the greatest threat to the coasts and islands ofthe Gulf and Caribbean. The loss of even a small fraction of either the Greenlandor Antarctica ice sheets would raise sea level enough to inundate significant areasof the region, and place larger areas at increased risk of storm surge from tropicalcyclones (even if there were no change in the risk of tropical cyclone occurrenceitself). The likelihood that such rapid ice loss and sea level rise will occur in the 21stcentury is very difficult to estimate, but there is evidence from the geologic recordthat they have occurred in the past in periods of warming. The probability becomesgreater as the time horizon one considers increases, assuming continued warming.If greenhouse gas increases continue, the question over the long term becomes notwhether sea level will rise greatly, but simply how soon it will do so.
Acknowledgements We are grateful to the researchers that produced Figs. 1, 12, 16, and 17 andto the publishers that granted permission to use them; to the modeling groups that provided climatesimulations to the CMIP3 project; to the Program for Climate Model Diagnosis and Intercomparison(PCMDI) and the World Climate Research Programme’s (WCRP’s) Working Group on CoupledModelling (WGCM) for their roles in making available the WCRP CMIP3 multi-model dataset(support of this dataset is provided by the Office of Science, U.S. Department of Energy); and toNARCCAP for the regional simulations (NARCCAP is funded by the National Science Foundation(NSF), the U.S. Department of Energy (DoE), the National Oceanic and Atmospheric Administra-tion (NOAA), and the U.S. Environmental Protection Agency Office of Research and Development(EPA)).
This work was supported by the Earth Institute at Columbia University to inform policy-makersin the Gulf region in preparation for the United Nations Cancun Climate Summit.
References
Allison I, Bindoff N, Bindschadler R, Cox P, de Noblet N, England M, Francis J, Gruber N, HaywoodA, Karoly D et al (2009) The Copenhagen Diagnosis, 2009: updating the world on the latestclimate science. The University of New South Wales Climate Change Research Centre (CCRC),Sydney, Australia, p 60
Climatic Change (2012) 112:819–845 843
Bamber JL, Alley RB, Joughin I (2007) Rapid response of modern day ice sheets to external forcing.Earth Planet Sci Lett 257:1–13. doi:10.1016/j.epsl.2007.03.005
Battisti DS, Naylor (2009) Historical warnings of future food insecurity with unprecedented seasonalheat. Science 323. doi:10.1126/science.1164363
Blanchon P, Eisenhauer A, Fietzke J, Liebetrau V (2009) Rapid sea-level rise and reef back-steppingat the close of the last interglacial highstand. Nature 458:881–885. doi:10.1038/nature07933
Bueno R, Herzfeld C, Stanton E, Ackerman F (2008) The Caribbean and climate change: the costsof inaction. Tech. rep., Stockholm Environment Institute—US Center, Global Development andEnvironment Institute, Tufts University, Somerville, MA
Cazenave A, Dominh K, Guinehut S, Berthier E, Llovel W, Ramillien G, Ablain M, Larnicol G(2009) Sea level budget over 2003–2008: a reevaluation from GRACE space gravimetry, satellitealtimetry and Argo. Global Planet Change 65(1–2):83–88. doi:10.1016/j.gloplacha.2008.10.004
Chang EK, Guo MY (2007) Is the number of north atlantic tropical cyclones significantly underesti-mated prior to the availability of satellite observations? Geophys Res Lett 34:L14,801
Church JA, White NJ (2006) A 20th century acceleration in global sea-level change. Geophys ResLett 33:L01602. doi:10.1029/2005GL024826
Diffenbaugh N, Ashfaq M (2010) Intensification of hot extremes in the united states. Geophys ResLett 37:L15701. doi:10.1029/2010GL043888
DiNezio PN, Clement AC, Vecchi GA, Soden BJ (2009) Climate response of the equatorial pacificto global warming. J Climate 22:4873–4892
Dube SK, Chittibabu P, Sinha PC, Rao AD, Murty TS (2004) Numerical modelling of stormsurge in the Head Bay of Bengal using location specific model. Nat Hazards 31:437–453.doi:10.1023/B:NHAZ.0000023361.94609.4a
Dube SK, Jain I, Rao AD, Murty TS (2009) Storm surge modelling for the Bay of Bengal andArabian Sea. Nat Hazards 51:3–27. doi:10.1007/s11069-009-9397-9
Elsner JB, Jagger TH, Dickinson M, Rowe D (2008) Improving multiseason forecasts of NorthAtlantic hurricane activity. J Climate 21:1209–1219
Emanuel K (2005) Increasing destructiveness of tropical cyclones over the past 30 years. Nature436:686–688. doi:10.1038/nature03906
Emanuel K (2007) Environmental factors affecting tropical cyclone power dissipation. J Climate20:5497–5509
Emanuel KA (1987) The dependence of hurricane intensity on climate. Nature 326:483–485Evan AT, Vimont DJ, Heidinger AK, nand R Bennartz JPK (2009) The role of aerosols in
the evolution of tropical North Atlantic Ocean temperature anomalies. Science 324:778–781
Goldenberg SB, Landsea CW, Mestas-Nuñez AM, Gray WM (2001) The recent increase in Atlantichurricane activity: causes and implications. Science 293:474–479
Gray WM (1979) Hurricanes: their formation, structure and likely role in the tropical circulation. In:Meteorology over the tropical oceans. Royal Meteorological Society, pp 155–218
Grinsted A, Moore JC, Jefrejeva S (2009) Reconstructing sea level from paleo and projected tem-peratures 200 to 2100 AD. Clim Dyn 34:461–472
Grinsted A, Moore JC, Jefrejeva S (2010) How will sea level respond to changes in natural andanthropogenic forcings by 2100? Geophys Res Lett 37. doi:10.1029/2010GL042947
Held IM, Soden BJ (2006) Robust responses of the hydrological cycle to global warming. J Climate19:5686–5699
Holland GJ (1997) The maximum potential intensity of tropical cyclones. J Atmos Sci 54:2519–2541
Horton R, Herweijer C, Rosenzweig C, Liu J, Gornitz V, Ruane AC (2008) Sea level rise projectionsfor current generation CGCMS based on the semi-empirical method. Geophys Res Lett 35.doi:10.1029/2007GL032.486
IPCC (2001) Climate change 2001: the scientific basis. Contribution of working group I to the thirdassessment report of the Intergovernmental Panel on Climate Change. Cambridge UniversityPress, Cambridge
IPCC (2007) Climate change 2007: the physical science basis. Contribution of working group I to thefourth assessment report of the IPCC. Cambridge University Press, Cambridge
Karl TR, Melillo JM, Peterson TC, Hassol SJ (2009) Global climate change impacts in the UnitedStates. Cambridge University Press, Cambridge
Kharin V, Zwiers F, Zhang X, Hegerl G (2007) Changes in temperature and precipitation ex-tremes in the IPCC ensemble of global coupled model simulations. J Climate 20(8):1419–1444.doi:10.1175/JCLI4066.1
844 Climatic Change (2012) 112:819–845
Knutson TR, McBride J, Chan J, Emanuel KA, Holland G, Landsea C, Held I, Kossin J,Srivastava AK, Sugi M (2010) Tropical cyclones and climate change. Nature Geoscience 3:157–163. doi:10.1038/ngeo779
Kopp R, Simons F, Mitrovica J, Maloof A, Oppenheimer M (2009) Probabilistic assessment of sealevel during the last interglacial stage. Nature 462(7275):863–867
Kossin JP, Knapp KR, Vimont DJ, Murnane RJ, Harper BA (2007) A globally consistent reanalysisof hurricane variability and trends. Geophys Res Lett 34:L04,815
Landsea CW (2005) Hurricanes and global warming. Nature 438:E11–E13. doi:10.1038/nature04477Landsea CW (2007) Counting atlantic tropical cyclones back to 1900. EOS Trans AGU 88(18).
doi:10.1029/2007EO180001Landsea CW, Harper BA, Horau K, Knaff JA (2006) Can we detect trends in extreme tropical
cyclones? Science 313:452–454. doi:10.1126/science.1128448Landsea CW, Vecchi GA, Bengtsson L, Knutson TR (2010) Impact of duration thresholds on atlantic
tropical cyclone counts. J Climate. doi:10.1175/2009JCLI3034.1Leloup J, Clement A (2009) Why is there a minimum in projected warming in the tropical North
Atlantic Ocean? Geophys Res Lett 36. doi:10.1029/2009GL038609Mann ME, Emanuel KA (2006) Atlantic hurricane trends linked to climate change. EOS 87:233, 238,
241Mann ME, Sabbatelli TA, Neu U (2007) Evidence for a modest undercount bias in early historical
Atlantic tropical cyclone counts. Geophys Res Lett 36:L22,707Meehl G, Covey C, Delworth T, Latif M, McAvaney B, Mitchell J, Stouffer R, Taylor K (2007) The
WCRP CMIP3 multimodel dataset: a new era in climate change research. Bull Am Meteorol Soc88:1383–1394
Milliken KT, Anderson JB, Rodriguez AB (2008) A new composite Holocene sea-level curve for thenorthern Gulf of Mexico. In: Anderson JB, Rodriguez AB (eds) Response of upper Gulf Coastestuaries to Holocene climate change and sea-level rise. Geological Society of America, Boulder,CO, special paper 443, pp 1–11. doi:10.1130/2008.2443(01)
Mitrovica J, Gomez N, Clark P (2009) The sea-level fingerprint of West Antarctic collapse. Science323(5915):753
Philander SGH (1990) El Niño, La Niña and the southern oscillation. Academic, New YorkPollard D, DeConto R (2009) Modelling West Antarctic ice sheet growth and collapse through the
past five million years. Nature 458(7236):329–332Prandi P, Cazenave A, Becker M (2009) Is coastal mean sea level rising faster than the global mean?
A comparison between tide gauges and satellite altimetry over 1993–2007. Geophys Res Lett36:L05602. doi:10.1029/2008GL036564
Pritchard HD, Arthern RJ, Vaughan DG, Edwards LA (2009) Extensive dynamic thinning onthe margins of the Greenland and Antarctic ice sheets. Nature 461(7266):971–975. doi:10.1038/nature08471
Rahmstorf S (2010) A new view on sea level rise. Nature 4. doi:10.1038/climate.2010.29Rao AD, Jain I, Murthy MVR, Murty TS, Dube SK (2008) Impact of cyclonic wind field on
interaction of surge?wave computations using finite-element and finite-difference models. NatHazards 49:225–239. doi:10.1007/s11069-008-9284-9
Rauscher S, Giorgi F, Diffenbaugh N, Seth A (2008) Extension and Intensification of the Meso-American mid-summer drought in the twenty-first century. Clim Dyn 31:551–571. doi:10.1007/s00382-007-0359-1
Rauscher SA, Kucharski F, Enfield DB (2010) The role of regional sst warming variationsin the drying of meso-america in future climate projections*. J Climate 24(7):2003–2016.doi:10.1175/2010JCLI3536.1
Rignot E, Kanagaratnam P (2006) Changes in the velocity structure of the Greenland Ice Sheet.Science 311(5763):986–990. doi:10.1126/science.1121381
Rignot E, Bamber JL, Broeke MRVD, Davis C, Li YH, Berg WJVD, Meijgaard EV (2008) Re-cent Antarctic ice mass loss from radar interferometry and regional climate modelling. NatureGeoscience 1(2):106–110. doi:10.1038/ngeo102
Sarachik ES, Cane MA (2010) The El Niño—southern oscillation phenomenon. Cambridge Univer-sity Press, Cambridge
Schoof C (2007) Ice sheet grounding line dynamics: steady states, stability, and hysteresis. J GeophysRes 112(F3):1–19
Sobel AH (2007) Simple models of ensemble-averaged tropical precipitation and surface wind. In:Schneider T, Sobel AH (eds) The global circulation of the atmosphere. Princeton UniversityPress, Princeton

Climatic Change (2012) 112:819–845 845
Sobel AH, Held IM, Bretherton CS (2002) The ENSO signal in tropical tropospheric temperature.J Climate 15:2702–2706
Swanson KL (2008) Nonlocality of atlantic tropical cyclone intensity. Geochem Geophys Geosyst9:Q04V01
Ting M, Kushnir Y, Seager R, Li C (2009) Forced and natural 20th century SST trends in the northatlantic. J Climate 22:1469–1481
Titus JG, Richman C (2001) Maps of lands vulnerable to sea level rise: modeled elevations along theUS Atlantic and Gulf Coasts. Clim Res 18:205–228
Vecchi GA, Knutson TR (2008) On estimates of historical north atlantic tropical cyclone activity.J Climate 21:3580–3600. doi:10.1175/2008JCLI2178.1
Vecchi GA, Soden BJ (2007a) Effect of remote sea surface temperature change on tropical cyclonepotential intensity. Nature 450:1066–1070
Vecchi GA, Soden BJ (2007b) Global warming and the weakening of the tropical circulation.J Climate 20:4316–4340
Vecchi GA, Soden BJ, Wittenberg AT, Held IM, Leetmaa A, Harrison MJ (2006) Weaken-ing of tropical pacific atmospheric circulation due to anthropogenic forcing. Nature 441.doi:10.1038/nature04744
Vecchi GA, Swanson KL, Soden BJ (2008) Whither hurricane activity? Science 322:687.doi:10.1126/science.1164396
Vermeer M, Rahmstorf S (2009) Global sea level linked to global temperature. Proc Natl Acad Sci106:21527–21532
Waelbroeck C, Labeyrie L, Michel E, Duplessy JC, McManus JF, Lambeck K, Balbon E,Labracherie M (2002) Sea-level and deep water temperature changes derived from benthicforaminifera isotopic records. Quat Sci Rev 21:295–305
Webster PJ, Holland GJ, Curry JA, Chang HR (2005) Changes in tropical cyclone number, duration,and intensity in a warming environment. Science 309:1844–1846. doi:10.1126/science.1116448
Wingham DJ, Wallis DW, Shepherd A (2009) Spatial and temporal evolution of Pine Island Glacierthinning. Geophys Res Lett 36:L17501. doi:10.1029/2009GL039126
Xie SP, Deser C, Vecchi GA, Ma J, Teng H, Wittenberg AT (2010) Global warming pattern forma-tion: sea surface temperature and rainfall. J Climate, early online. doi:10.1175/2009JCLI3329.1