Embed Size (px)
Citation preview
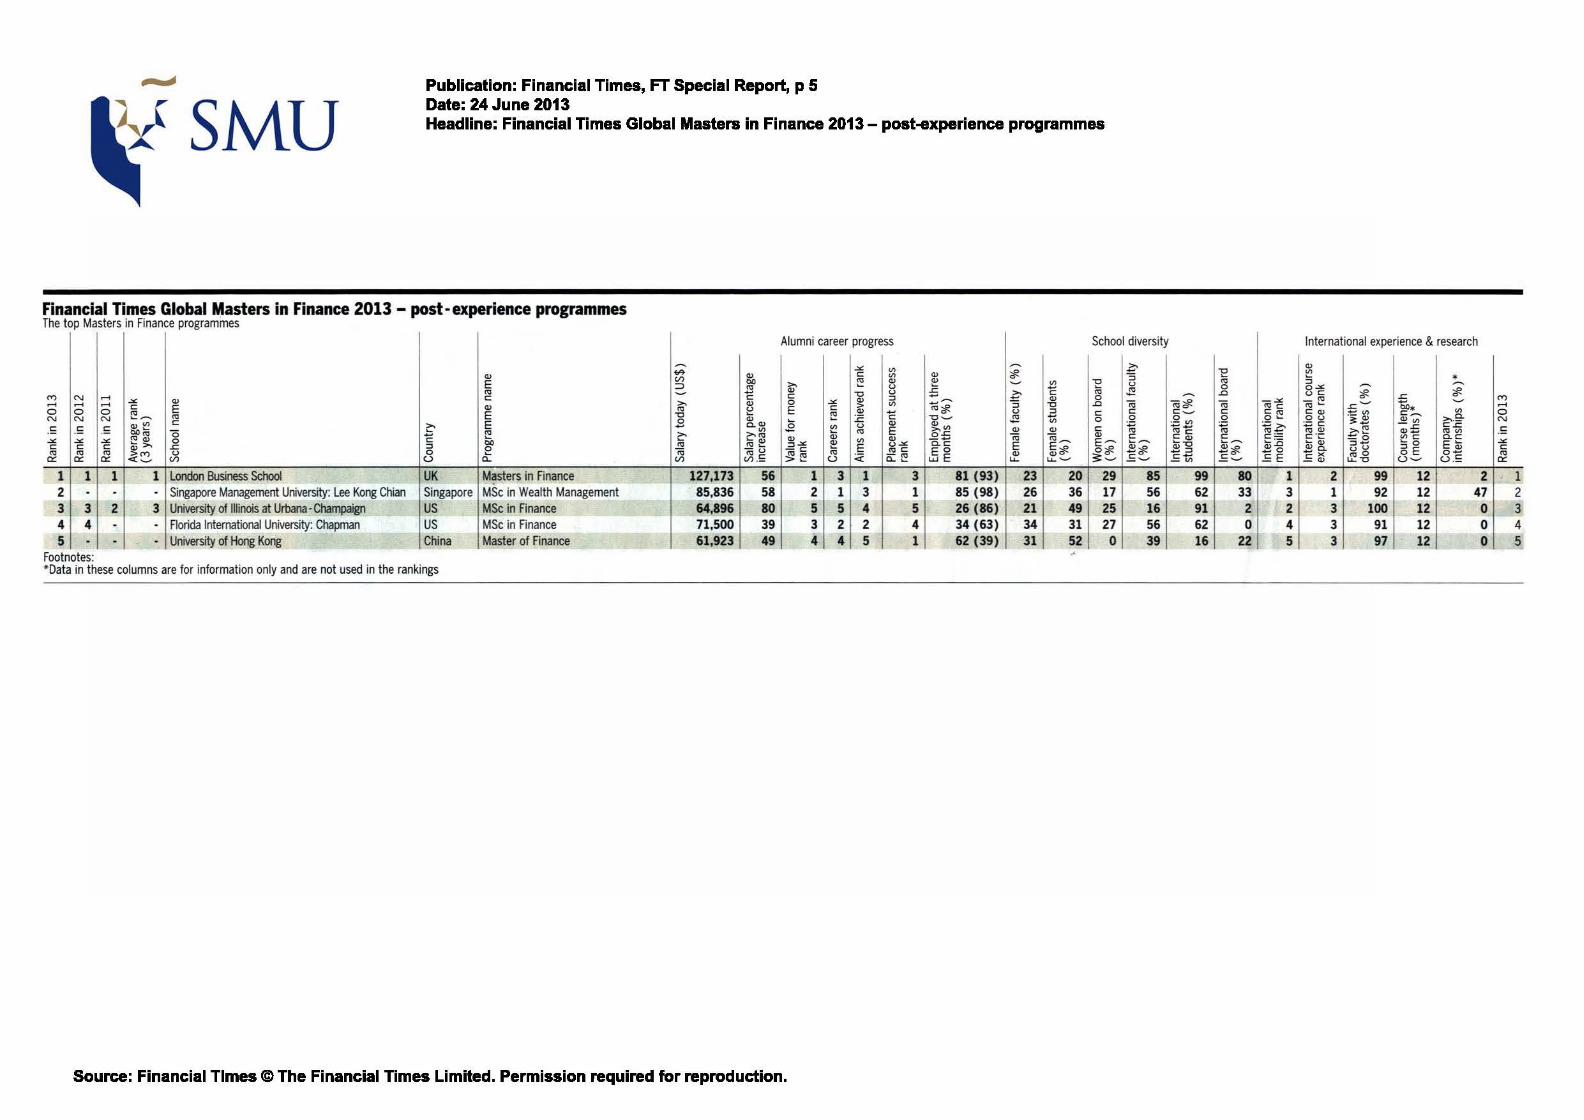
Publication: Financial Times, FT Special Report, p 5 Date: 24 June 2013
SMU Headline: Financial Times Global Masters in Finance 2013- post-experience programmes
Financial Times Global Masters in Finance 2013 - post-experience programmes The top Masters in Finance programmes
cv E ro
('f) N - c: - - - -"' cv c: E cv
0 0 0 (Q E N N N ...__ (Q cvVI c: E .!: .!: .!: >. oo'- 0 ....
~ ~~ ..... -"' -"' -"' 0 c: 00 c: c: c: cv>- .s= ::J 0 (Q ro ro >('f) (.) 0 ..... a:: a:: a:: < ........ (/) (..) a...
1 1 1 1 London Business School UK Masters in Finance 2 . . . Singapore Management University: Lee Kong Chian Singapore MSc in Wealth Management 3 3 2 3 University of Illinois at Urbana· Champaign us MSc in Finance 4 4 . . Florida International University: Chapman us MSc in Finance 5 . . . University of Hong Kong China Master of Finance
Footnotes: *Data in these columns are for information only and are not used in the rankings
Alumni career progress
- -"' V) tA (/) cv c: VI
00 ~
(Q cv ::> rtf .... (.) ........ ..... "'0 (.)
c: c: ::J >. cv 0 -"' cv
VI ro ~ E c: >
"'0 ~ cv .....
cv :c c: .B o.cv ..... cv 0 VI (.) E VI - .... (Q t:' t:'rtr cv
cv-"' VI cv ro (Q~ cv U-"' Iii -u ..:!c: .... E rtrC: (Qc: ~~
(Q < - (Q
(/) (/) ·- (..) a... ....
127,173 56 1 3 1 85,836 58 2 1 3
~
64,896 80 5 5 4 71,500 39 3 2 2
- I-61,923 49 4 4 5 ,_
Source: Financial Times @The Financial Times Limited. Permission required for reproduction.
School diversity
- ~ :::R cv 0 ::J ~ ........ VI "'0 (.) ..... £ ;::;. c: (Q ~
cv 0 ..... - ::; "'0 ..c Iii nl~ (.) ::J c: c: -o- (Q .....
0 0
~~ - VI :;::: c: cv cv ro
.2....- Iii Iii_ cv c: E-o.c: E .... .--. EO ~~ o:::R ~~ cv 3~ wE _!: ........ LL. LL. ........
3 81 (93) 23 20 29 85 1 85 (98) 26 36 17 56 5 26 (86) 21 49 25 16 4 34 (63) 34 31 27 56 1 62 (39) 31 52 0 39
International experience & research
cv "'0 VI ..... ::; * ro - -0 0-"' - ..c uc: :::R :::R
CQE 0 .s= 0 ('f) n;~ Iii -..><: .s='-' ..... ........ -roc: 00* c: ......... c: C:rc:r c:cv ~(/) c:.-. VI 0 .2 <I) 0 0'- ou ~.2:! ~VI >..e. N :;::: :.;::;~ :;:;c c:.s= ..........
;::;.~ cv£ .!: rtrc (Q rtr+- rtrCV IQVI c:cv c: c:= c:·~ VIC: o.c: -0 -"' '--o ...__ a;:o '-CV ::J+- '-O E~ .2:l:::J ~~ ...... o eva. uu SE c:
+-X ~.g o+- (Q c: ..... _s ........ EE <...>.!: - V) Ecv U'-' a::
99 80 1 2 99 12 2 1 62 33 3 1 92 12 47 2 91 2 2 3 100 12 0 3 62 0 4 3 91 12 0 4 16 22 5 3 97 12 0 5
SMU Publication: Financial Times, FT Special Report, p 5 Date: 24 June 2013 Headline: Financial Times Global Masters in Finance 2013- post-experience programmes
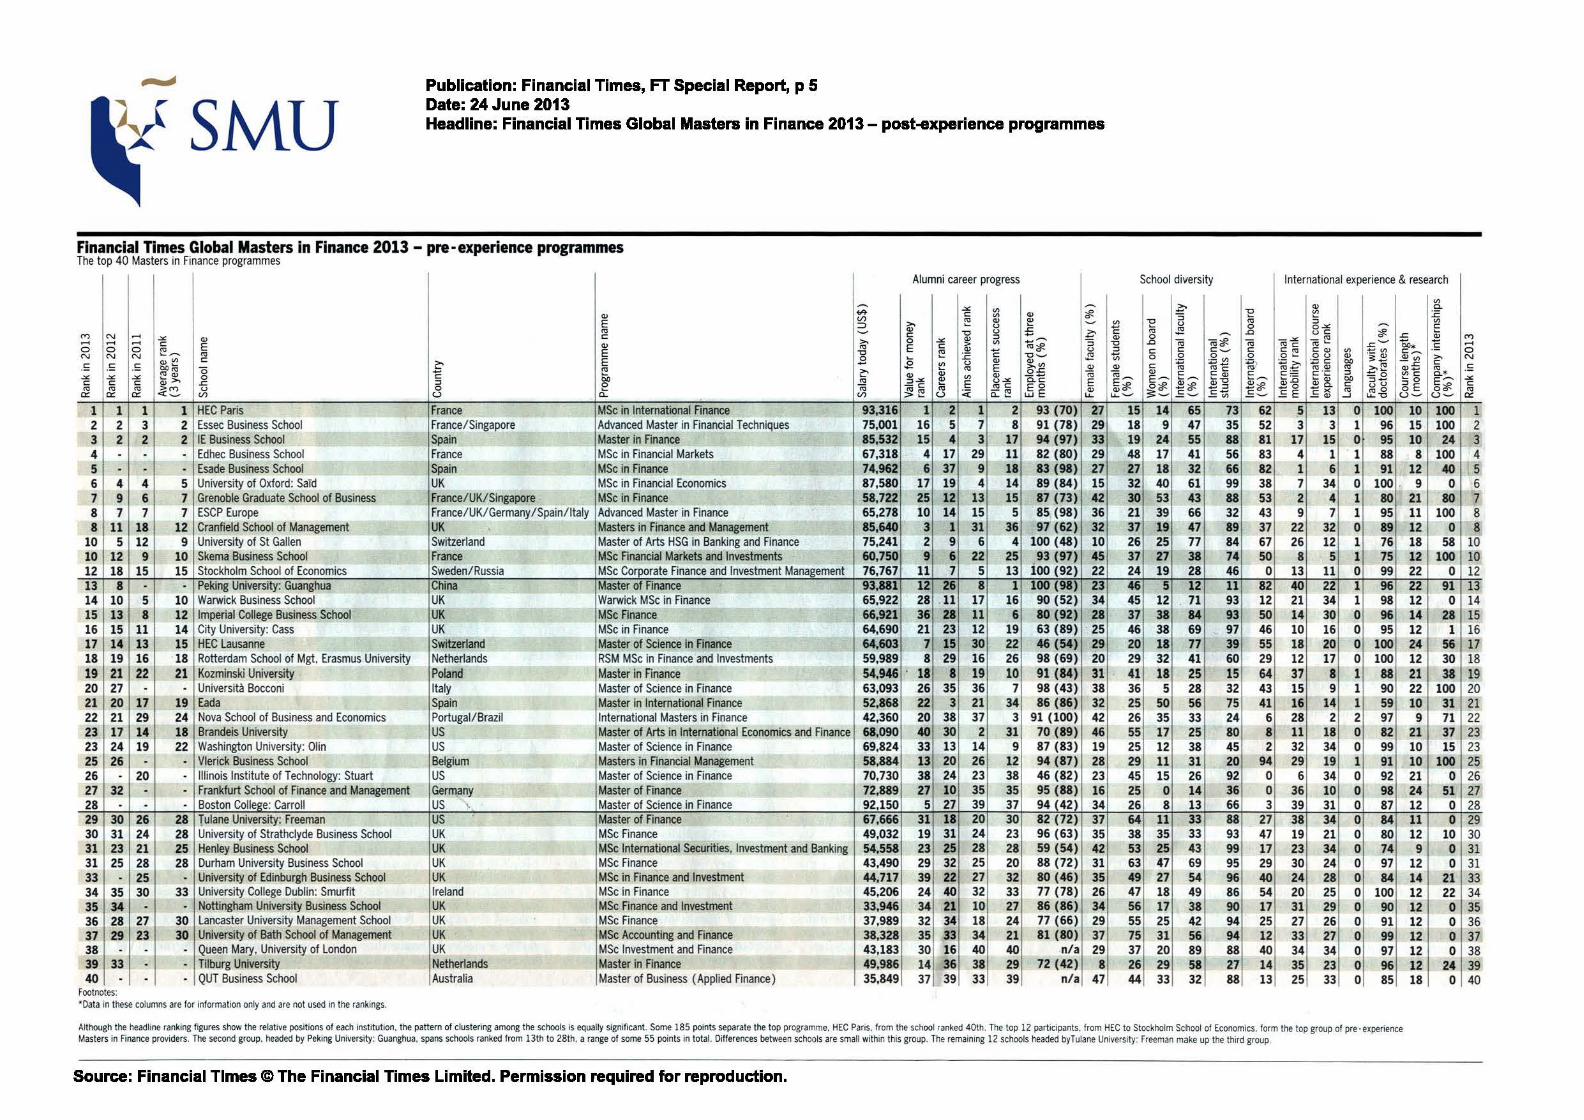
Financial Times Global Masters in Finance 2013 - pre · experience programmes The top 40 Masters in Finance programmes
Alumni career progress School diversity International experience & research
~ ~ .:.:. V> :;:;. Q) ~ ~ "E ~ Q) (/)
c: V> Q) 0 :; E ~ Q) ~ '-" .!1 "E "' ::;J
::::> >. (.) (.) 0 o.:.:. ~
"' '-" Q) -o (.)
£ :;:;. c: "' ~ ~ .c uc: ~ ....., N ...... .:.:. Q) c: c: Q) ::;J Q) 0 - .:.< - "' 0 .c
...... ...... ...... c: >. 0 .:.:. > V> ...... ~ :; -o .c (ij «;~ (ij "'C: "' .... .c'-" ~ E Q) "' E c: co~ 0 0 0 "' E -o ~ Q) - (.) ::;J c: c: c: '-" c: c:"' C:Q) V>
~~ N N N .... ~ "' .B .... :2 c: -o '-" ~ ih 0 0 .Q V> 0 0'- 0<..> Q) ~V> Q)V> c: E Q)
~11 :;:: ~] :.;:#~ :;:;c bO .!: .=: .=: bO'- ~ .$2 V> (.)
E Q) Q) c: "' ttiC "'Q) "' »"' Q)£ 0 ~ .... "' "' ...... ~~ ;::- Q) Q) Q) E ..... (ij (ij~ Q) c: C:Q) c: c:= c:·c ::;J ::0 V>C: .:.:. .:.:. .:.:. 0 c: bO "' ::;J.:.! ~
V> (.).:.! a.c: E E~ .... ~ '--o .... ~ -:o '-Q) bO ::;J ..... '-o c: c: c: Q)>. .c ::;J E E ~~ 0~ ~~ ~::;J ~~ ~0 Qla. c: u<-> gE "' "' "' ~~ (.) 0 (ij - c: "' "'c: EO
~~ ~~ :.;: -"' wE Q) 3: ~ £..__. c: ...... £..__. EE "' ~.g 0::: 0::: 0::: (/) u a... (/) u a... .... u... u... '-" -<I> -I U'-"
1 1 1 1 HEC Paris France MSc in International Finance 93,316 1 2 1 2 93 (70) 27 15 14 65 73 62 .5 13 0 100 10 2 2 3 2 Essec Business School France/Singapore Advanced Master in Financial Techniques 75,001 16 5 7 8 91 (78) 29 18 9 47 35 52 3 3 1 96 15 3 2 2 2 IE Business School Spain Master in Finance 85,532 15 4 3 17 94 (97) 33 19 24- 55 88 81 17 15 0 95 10 4 - - - Edhec Business School France MSc in Financial Markets 67,318 4 17 29 11 82 (80) 29 48 17 41 56 83 4 1 1 88 8 5 - - - Esade Business School Spain MSc in Finance 74,962 6 37 9 18 83 (98) 27 27 18 32 66 82 1 6 1 91 12 6 4 4 5 University of Oxford: Sard UK MSc in Financial Economics 87,580 17 19 4 14 89 (84) 15 32 40 61 99 38 7 34 0 100 . 9 7 9 6 7 Grenoble Graduate School of Business France/UK/Singapore MSc in Finance 58,722 25 12 13 15 87 (73) 42 30 53 43 88 53 2 4 1 80 21 8 7 7 7 ESCP Europe France/UK/Germany/Spain/ltaly Advanced Master in Finance 65,278 10 14 15 5 85 (98) 36 21 39 66 32 43 9 7 1 95 11 8 11 18 12 Cranfield School of Management UK Masters in Finance and Management 85,640 3 1 31 36 97 (62) 32 37 19 47 89 37 22 32 0 89 12
10 5 12 9 University of St Gallen Switzerland Master of Arts HSG in Banking and Finance 75,241 2 9 6 4 100 (48) 10 26 25 77 84 67 26 12 1 76 18 10 12 9 10 Skema Business School France MSc Financial Markets and Investments 60,750 9 6 22 25 93 (97 ) 45 37 27 38 74 50 8 5 1 75 12 12 18 15 15 Stockholm School of Economics Sweden/Russia MSc Corporate Finance and Investment Management 76,767 11 7 5 13 100 (92) 22 24 19 28 46 0 13 11 0 99 22 13 8 - - Peking University: Guanghua China Master of Finance 93,881 12 26 8 1 100 (98) 23 46 5 12 11 82 40 22 1 96 22 14 10 5 10 Warwick Business School UK Warwick MSc in Finance 65,922 28 11 17 16 90 (52) 34 45 12 71 93 12 21 34 1 98 12 15 13 8 12 Imperial College Business School UK MSc Finance 66,921 36 28 11 6 80 (92) 28 37 38 84 93 50 14 30 0 96 14 16 15 11 14 City University: Cass UK MSc in Finance 64,690 21 23 12 19 63 (89) . 25 46 38 69 97 46 10 16 0 95 12 17 14 13 15 HEC Lausanne Switzerland Master of Science in Finance 64,603 7 15 30 22 46 (54) 29 20 18 77 39 55 18 20 0 100 24 18 19 16 18 Rotterdam School of Mgt. Erasmus University Netherlands RSM MSc in Finance and Investments 59,989 8 29 16 26 98 (69) 20 29 32 41 60 29 12 17 0 100 12 19 21 22 21 Kozminski University Poland Master in Finance 54.946 . 18 8 19 10 91 (84) 31 41 18 25 15 64 37 8 1 88 21 20 27 - - Universita Bocconi Italy Master of Science in Finance 63,093 26 35 36 7 98 (43) 38 36 5 28 32 43 15 9 1 90 22 21 20 17 19 Eada Spain Master in International Finance 52,868 22 3 21 34 86 (86) 32 25 50 56 75 41 16 14 1 59 10 22 21 29 24 Nova School of Business and Economics Portugal/Brazil International Masters in Finance 42,360 20 38 37 3 91 (100) 42 26 35 33 24 6 28 2 2 97 9 23 17 14 18 Brandeis University us Master of Arts in International Economics and Finance 68,090 40 30 2 31 70 (89) 46 55 17 25 80 8 11 18 0 82 21 23 24 19 22 Washington University: Olin us Master of Science in Finance 69,824 33 13 14 9 87 (83) 19 25 12 38 45 2 32 34 0 99 10 25 26 - - Vlerick Business School Belgium Masters in Financial Management 58,884 13 20 26 12 94 (87) 28 29 11 31 20 94 29 19 1 91 10 26 - 20 - Illinois Institute of Technology: Stuart us Master of Science in Finance 70,730 38 24 23 38 46 (82) 23 45 15 26 92 0 6 34 0 92 21 27 32 - - Frankfurt School of Finance and Management Germany Master of Finance 72,889 27 10 35 35 95 (88) 16 25 0 14 36 0 36 10 0 98 24 28 - - - Boston College: Carroll us ~ Master of Science in Finance 92,150 5 27 39 37 94 (42) 34 26 8 13 66 3 39 31 0 87 12 29 30 26 28 Tulane University: Freeman us Master of Finance 67,666 31 18 20 30 82 (72) 37 64 11 33 88 27 38 34 0 84 11 30 31 24 28 University of Strathclyde Business School UK MSc Finance 49,032 19 31 24 23 96 (63) 35 38 35 33 93 47 19 21 0 80 12 31 23 21 25 Henley Business School UK MSc International Securities, Investment and Banking 54,558 23 25 28 28 59 (54) 42 53 25 43 99 17 23 34 0 74 9 31 25 28 28 Durham University Business School UK MSc Finance 43,490 29 32 25 20 88 (72) 31 63 47 69 95 29 30 24 0 97 12 33 - 25 - University of Edinburgh Business School UK MSc in Finance and Investment 44,717 39 22 27 32 80 (46) 35 49 27 54 96 40 24 28 0 84 14 34 35 30 33 University College Dublin: Smurfit Ireland MSc in Finance 45,206 24 40 32 33 77 (78) 26 47 18 49 86 54 20 25 0 100 12 35 34 - - Nottingham University Business School UK MSc Finance and Investment 33,946 34 21 10 27 86 (86) 34 56 17 38 90 17 31 29 0 90 12 36 28 27 30 Lancaster University Management School UK MSc Finance 37,989 32 34 18 24 77 (66) 29 55 25 42 94 25 27 26 0 91 12 37 29 23 30 University of Bath School of Management UK MSc Accounting and Finance 38,328 35 33 34 21 81 (80) 37 75 31 56 94 12 33 27 0 99 12 38 - - - Queen Mary, University of London UK MSc Investment and Finance 43,183 30 16 40 40 .n/a 29 37 20 89 88 40 34 34 0 97 12 39 33 - 1- - Tilburg University Netherlands Master in Finance 49,986 14 36 38 29 72 (42) 8 26 29 58 27 14 35 23 0 96 12 40 - - - QUT Business School Australia Master of Business (Applied Finance) 35,849 37 39 33 39 n/a 47 44 33 32 88 13 25 33 0 85 18
Footnotes: •oata in these columns are for information only and are not used in the rankings.
Although the headline ranking figures show the relative positions of each institution. the pattern of clustering among the schools is equally significant. Some 185 points separate the top programme. HEC Pans. from the school ranked 40th. The top 12 participants. from HEC to Stockholm School of Economics. form the top group of pre. experience Masters in Finance providers. The second group. headed by Peking University: Guanghua. spans schools ranked from 13th to 28th. a range of some 55 points in total. Differences between schools are small within this group. The remaining 12 schools headed by Tulane University: Freeman make up the third group.
Source: Financial Times @The Financial Times Limited. Permission required for reproduction.
V> a. :2 V> c: .... Q) -.!: >. c: ::i* §~ U'-"
100 100
24 100
40 0
80 100
0 58
100 0
91 0
28 1
56 30 38
100 31 71 37 15
100 0
51 0 0
10 0 0
21 22 0 0 0 0
24 0
....., ...... 0 N
.=:
.:.:. c: "' 0:::
1 2 3 4 5 6 7 8 8
10 10 12 13 14 15 16 17 18 19 20 21 22 23 23 25 26 27 28 29 30 31 31 33 34 35 36 37 38 39 40
SMU
r . ::-
Key to weighting of ranking factors
Weights for ranking criteria are shown in brackets - (pre· experience) [post-experience] -as a percentage of the overall ranking. Salary today US$ (20) [20] : average alumnus salary three years after graduation. US$ PPP equivalent (purchasing power parity. allowing comparison between countries). Includes data for the current year and
the one or two preceding years where available.* Salary Increase (n/a) [20]: average difference in alumnus salary between before the masters to today. Half of this figure is calculated according to the absolute salary increase, and
half according to the percentage increase relative to pre-masters
salary - the figure published in the post-experience table.* Value for money (5) [3]: calculated according to alumni salaries today. course length.
fees and other costs. including the opportunity cost of not working during the programme.* Careers (10) [7]: calculated
according to the career status of alumni three years after graduation. Progression is measured according to seniority and size of company today.* Alms achieved (5) [3]: the extent to which alumni fulfilled their goals or reasons for doing
a masters.* Placemerrt success (5) [3]: effectiveness of the careers service in supporting student recruitment. as rated by alumni.* Employed at three months % (5) [3]: percentage of the most recent graduating class that found employment within three
monthS. The figure in brackets is the percentage of the class for
which the school was able to provide data.
Female faculty% (4 ) [3]: percentage of female faculty. For gender-related criteria. schools with 50:50 (male/female) composition receive the highest possible score. Female studen~ OJil (4 ) [3] : percentage of female students on the masters. Women on board % (1) [2] : percentage of female members on the school advisory board. International faculty % (5) [5] : calculated according to faculty diversity by citizenship and the percentage whose citizenship differs from their country of employment - the figure published in the table. Internat ional students OJil (5) [5]: calculated according to the diversity of current masters
students by citizenship and the percentage whose citizenship differs from country of study -
the figure published in the table. International board % (2) [3]: percentage of the board whose citizenship differs from the school"s home country. Faculty with doctorates % (6) [6]: percentage of full·time faculty with doctoral degrees. International mobility (10) [7]: calculated according to changes in the country of employment of alumni between graduation and
today.* International course experience (10) [7]: calculated according to four criteria that measure international exposure
during the masters programme Languages (3) [n/a]: number of extra languages required on graduat ion. Course length (months) : minimum length of the masters programme
* Includes data for the current and one or two preceding years where available.
Methodology For details of how the table was compiled. go to www.ft.com/business·education/finance-2013
Publication: Financial Times, FT Special Report, p 5 Date: 24 June 2013 Headline: Financial Times Global Masters in Finance 2013- post-experience programmes
HEC and LBS hold their top spots Analysis
Anglophone countries are over-represented in lower table, says LauTent Ortrrwns
The top business schools have held off their rivals in the 2013 FT Masters in Finance rankings. In the third edition of the tables, London Busi·
ness School retains the top spot in the post-experience ranldng, while HEC Paris remains number one for pre-experience programmes. Both schools have topped their rankings since the list was established in 2011.
The FT ranks masters in finance programmes separately for those with little or no background in the finan· cial industry (pre-experience) and for professionals who have already worked in the sector (post-experience).
Five post-experience programmes and 40 pre-experience courses are ranked in 2013. The rankings are based on criteria including alumni salary three years after graduation, seniority, international mobility and international course experience. The post-experience ranking also meas· ures salary increase, comparing pay before and after the programme.
In the post-experience ranking, Lon· don Business School was top for value for money, aims achieved and interna· tional mobility, and graduates earned the highest average salary at $127,000.
In the pre-experience ranking, HEC Paris was first for value for money and aims achieved. Its graduates also had the second-highest average salary ($93,000) behind Peking's Guanghua at ($94,000). The school also came second for seniority and placement success.
"Beyond the excellent training," says Aurelien Roelens, an investment manager at Cube Infrastructure Fund, "there is this empowering 'learn to
dare' spirit at HEC. The programme offers future-proof skills useful in your professional and personal life."
Other schools that performed well in the pre-experience ranking include Edhec in France, fourth this year after coming sixth in 2012 with a dif. ferent programme; and Esade in Spain, ranked fifth on its first partici· pation. Cranfield Business School in the UK rises to eighth, while Stockholm School of Economics climbs to 12th. Graduates from Carroll School of Management at Boston College in the
US averaged the third-highest salary at $92,000 and those from Sai:d Busi· ness School in Oxford had the highest average salary in Europe (and fourth overall) at $88,000.
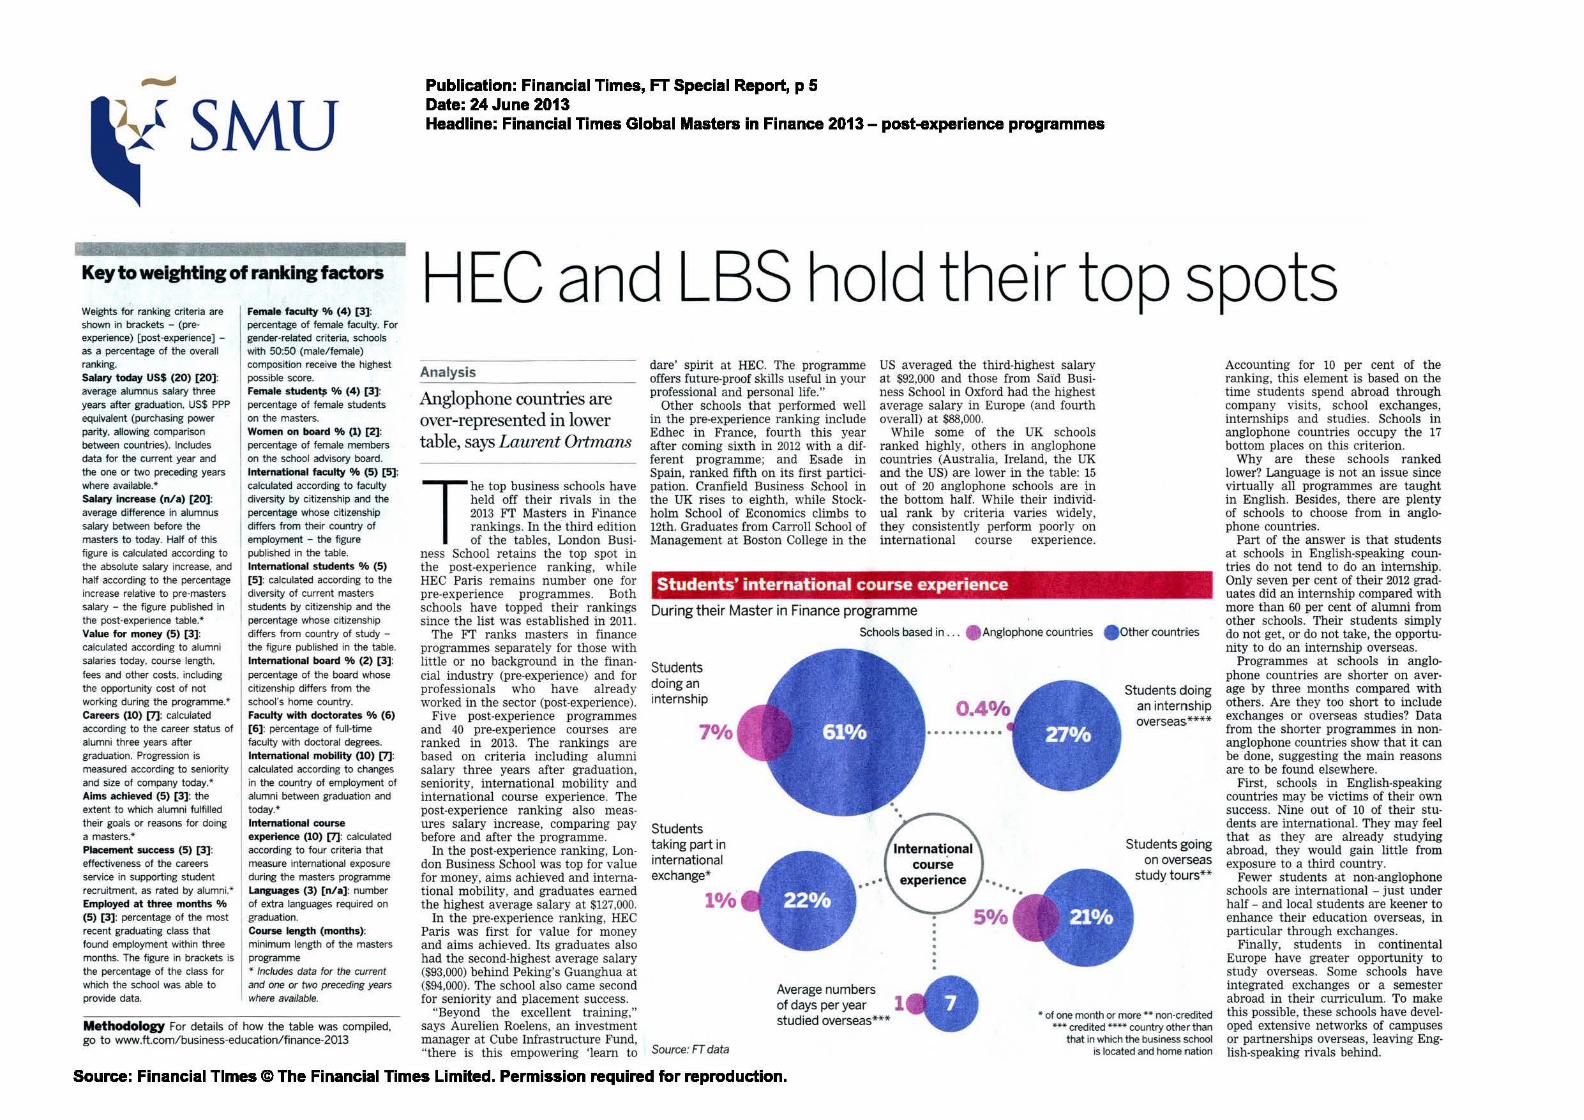
While some of the UK schools ranked highly, others in anglophone countries (Australia, Ireland, the UK and the US) are lower in the table: 15 out of 20 anglophone schools are in the bottom half. While their indiv1aual rank by criteria varies widely, they consistently perform poorly on international course experience.
Students' international course experience
During their Master in Finance programme
Schools based in ... • Anglophone countries . Other countries
Students doing an internship
70/o
Students taking part in international exchange*
Source: FT data
Average numbers .. of days per year 1 studied overseas***
Students doing an internship overseas.****
Students going on overseas
study tours**
*of one month or more ** non·credited *** credited **** country other than
that in which the business school is located and home nation
Accounting for 10 per cent of the ranking, this element is based on the time students spend abroad through company visits, school exchanges, internships and studies. Schools in anglophone countries occupy the 17 bottom places on this criterion.
Why are these schools ranked lower? Language is not an issue since virtually all programmes are taught in English. Besides, there are plenty of schools to choose from in anglephone countries.
Part of the answer is that students at schools in English-speaking coun· tries do not tend to do an internship. Only seven per cent of their 2012 graduates did an internship compared with more than 60 per cent of alumni from other schools. Their students simply do not get, or do not take, the opportu· nity to do an internship overseas.
Programmes at schools in anglo· phone countries are shorter on average by three months compared with others. Are they too short to include exchanges or overseas studies? Data from the shorter programmes in non· anglophone countries show that it can be done, suggesting the main reasons are to be found elsewhere.
First, schools in English-speaking countries may be victims of their own success. Nine out of 10 of their stu· dents are international. They may feel that as they are already studying abroad, they would gain little from exposure to a third country.
Fewer students at non-anglophone schools are international - just under half - and local students are keener to enhance their education overseas, in particular through exchanges.
Finally, students in continental Europe have greater opportunity to study overseas. Some schools have integrated exchanges or a semester abroad in their curriculum. To make this possible, these schools have developed extensive networks of campuses or partnerships overseas, leaving English-speaking rivals behind.
Source: Financial Times @The Financial Times Limited. Permission required for reproduction.