Embed Size (px)
Citation preview

Purification of monoclonal antibodies by phenyl boronate
chromatography
Núria Catarina Mendes da Silva Lopes
Dissertação para obtenção de Grau de Mestre em
Biotecnologia
Júri
Presidente: Professor Arsénio do Carmo Sales Mendes Fialho
Orientadora: Doutora Ana Margarida Nunes da Mata Pires de Azevedo
Co-orientadora: Professora Maria Raquel Murias dos Santos Aires Barros
Vogal: Professor Duarte Miguel de Franca Teixeira dos Prazeres
Outubro 2011


I
Acknowledgements
In the master's thesis, as any other type of dissertation, although the solitary process that any
researcher is intended, there are several contributions from various people.
Since the start of the Masters, I had the confidence and support of numerous people. Without this
contribution, this research would not have been possible.
I am grateful to Professor Maria Raquel Aires-Barros for giving me the opportunity to work in this
thesis, for her motivation and support
Doctor Ana Margarida Nunes da Mata Pires de Azevedo, the dissertation advisor, I appreciate all
support, the sharing of knowledge and valuable contributions to the work. Above all, thanks for letting
me continue to follow this path and for stimulating my interest in knowledge and academic life.
I am very grateful to all my family for encouragement received over the years. My parents, brother and
sister-in-law, thanks for the love, joy and attention without reservation.
To my friends i would like to thanks for their solidarity and friendship.
I would also like to thank all the people from the Bioengineering Research Group for help.
II
Abstract
This thesis focus on the feasibility of using aminophenyl boronate (APB) chromatography as the first
step in the downstream processing of antibodies in order to reduce manufacturing costs, either by
replacing Protein A chromatography or by reducing the loading of impurities before the Protein A step.
The first step was to study the interaction of human immunoglobulin G (IgG) with the different
components of the ligand. For this the binding of IgG and typical protein impurities (albumin and
insulin) to the following resins was studied and compared: controlled pore glass (CPG); aminopropyl-
CPG; aniline-CPG and APB-CPG. The chromatograms obtained showed that when the adsorption
buffer was supplemented with 150 mM NaCl, electrostatic interactions were minimized, and most of
the impurity proteins were collected in the flow-through while IgG was selectively recovered after
elution with a competitive compound. These studies identified 20 mM HEPES, 150mM NaCl at pH 8.5
as the best binding buffer. In the next step, different elution buffers supplemented with competitive
diols (sorbitol and mannitol) were evaluated in order to find an alternative to the standard elution buffer
(1.5 M Tris-HCl, pH 8.5) and 50 mM Tris-HCl, 200 mM Sorbitol, 200 mM NaCl at pH 8.5 was found a
viable alternative.
The efficiency of the APB ligand was then compared with protein A, and a purification process
combining two consecutive chromatographic steps on APB-CPG and protein A-CPG, respectively,
was evaluated. The recovery of IgG was considerably lower than what was expected thus suggesting
that more optimizations are required.
Keywords: monoclonal antibodies, aminophenyl boronate, affinity chromatography, purification,
protein A

III
Resumo
Esta tese tem como objectivo estudar a viabilidade do uso da resina boronato aminofenílico (APB)
como primeiro passo a jusante na purificação de anticorpos a fim de reduzir os custos de produção,
seja através da substituição da cromatografia de proteína A ou reduzindo a carga de impurezas antes
desta etapa.
O primeiro passo foi estudar a interacção da imunoglobulina humana G (IgG) com os diferentes
componentes do ligante. Foi estudado a ligação do IgG e das típicas impurezas proteicas (albumina e
insulina) às resinas: contas de vidro (CPG), CPG-aminopropil, CPG-anilina e CPG-APB. Os
cromatogramas obtidos mostraram que quando o tampão de ligação é suplementado com 150 mM
NaCl, as interacções electrostáticas são minimizadas. A maioria das impurezas proteicas não ligam à
resina, tendo o IgG sido recuperado na eluição através de um componente competitivo. Estes
estudos identificaram 20 mM HEPES, 150 mM NaCl, pH 8.5 como o melhor tampão de adsorção. Na
etapa seguinte, diferentes tampões de eluição suplementados com grupos diols (sorbitol e manitol)
foram avaliados a fim de encontrar uma alternativa para o tampão de eluição padrão (1.5 M Tris-HCl,
pH 8.5), tendo sido encontrado como alternativa viável o tampão 50 mM Tris-HCl, 200 mM Sorbitol,
200mM NaCl, pH 8.5.
A eficiência do ligante APB foi então comparada com a proteína A, e um processo de purificação
combinando os dois passos cromatográficos consecutivos, CPG-APB e CPG-proteína A,
respectivamente, foi avaliada. A recuperação de IgG foi consideravelmente menor do que o esperado,
sugerindo que será necessário optimizar o processo.
Palavras-chave: anticorpos monoclonais, aminofenil boronato, cromatografia de afinidade,
purificação, proteína A.

IV
Table of Contents
Acknowledgements I
Abstract II
Resumo III
Table of Contents IV
List of Figures VI
List of Tables IX
List of Abbreviations XI
1. Introduction 1
1.1. Background 1
1.2. Aim of studies 1
2. Literature Review 2
2.1. Immune System 2
2.2. Brief history of Antibodies 2
2.3. Antibodies 3
2.4. Brief history of Monoclonal Antibodies (mAbs) 5
2.5. Production of Monoclonal Antibodies (mAbs) 6
2.6. Current approaches in purification process 8
2.7. Typical unit operations and processing alternatives 12
2.8. Protein A affinity chromatography 14
2.9. Non-Protein A strategies 16
2.10. Boronate Ligands 17
3. Material and Methods 19
3.1. Materials and biologics 19
3.2. Chromatographic Study of interactions between IgG and the various constituents of the column 19
3.3. Chromatography on phenyl boronate resin 20
3.4. Chromatography on protein A resin 20

V
3.5. Purification of IgG in CHO cells 21
3.6. IgG quantification 21
3.7. Protein gel electrophoresis 21
3.8. Protein Quantification 22
4. Results and Discussion 23
4.1. Chromatographic Study of interactions between IgG and the various constituents of the column 23
4.1.1. Binding buffer: 20mM HEPES, pH 8.5 23
4.1.2. Binding Buffer: 20mM HEPES, 150mM NaCl, pH 8.5 26
4.2. Chromatography on phenyl boronate resin 29
4.3. Purification of IgG with PA CPG resin 37
4.4. Purification of IgG in CHO cells 39
5. Conclusion and Future Trends 41
Bibliography 42

VI
List of Figures
Figure 1 - Schematic structure of an antibody (remove from the website, in 13/01/2011:
http://4.bp.blogspot.com/_6lpOFr_o5sM/RgVigvoS4AI/AAAAAAAAAGE/xBpQGBiWQhk/s1600-
h/anticorpo.bmp) .............................................................................................................................. 4
Figure 2 – Composition of five immunoglobulin’s classes (remove in the website, in 12/01/2011:
http://4.bp.blogspot.com/_-Uzu0xg5lh0/R2F06LXIC8I/AAAAAAAAAG8/DLpH6XZYH00/s1600-
h/Antibodies-Ig.jpg) .......................................................................................................................... 4
Figure 3 – Production of monoclonal antibodies ..................................................................................... 6
Figure 4 – From murine to human antibodies. ........................................................................................ 7
Figure 5 – Typical purification process of mAbs ..................................................................................... 9
Figure 6 – Emerging two-column platforms ........................................................................................... 14
Figure 7 - Ribbon diagram of one Fc chain co-crystallized with a fragment of an IgG-binding bacterial
protein (Staphylococcus aureus protein A) (remove from the website, in 12/10/2011:
http://www.tulane.edu/~biochem/med/1fc2_igg.gif) ....................................................................... 15
Figure 8 – A typical Protein A chromatogram (Gottschalk, Process Scale Purification of Antibodies,
2009). ............................................................................................................................................. 16
Figure 9 – The proposed mechanism of esterification between a phenylboronic acid and a cis-diol in
aqueous solution. ........................................................................................................................... 18
Figure 10- Schematic representation of the CPG-aminophenylboronate resin .................................... 20
Figure 11 - Graphic representation of the absorbance of each solution (Insulin, IgG and HSA) as a
function of volume, with retention times of each peak and their names. Using the CPG column
and binding buffer 20mM HEPES pH 8.5 and elution buffer 1.5M Tris pH 8.5. The blue line
represents the injection of insulin solution, the red line injection of IgG and the green line injection
of HSA. ........................................................................................................................................... 23
Figure 12 - Graphic representation of the absorbance of each solution (Insulin, IgG and HSA) as a
function of volume, with retention times of each peak and their names. Using the CPG - Aniline
column and binding buffer 20mM HEPES pH 8.5 and elution buffer 1.5M Tris pH 8.5. The blue
line represents the injection of insulin solution, the red line injection of IgG and the green line
injection of HSA. ............................................................................................................................. 24
Figure 13 - Graphic representation of the absorbance of each solution (Insulin, IgG and HSA) as a
function of volume, with retention times of each peak and their names. Using the CPG -
Aminopropyl column and binding buffer 20mM HEPES pH 8.5 and elution buffer 1.5M Tris pH 8.5.
The blue line represents the injection of insulin solution, the red line injection of IgG and the green
line injection of HSA. ...................................................................................................................... 25
Figure 14 - Graphic representation of the absorbance of each solution (Insulin, IgG and HSA) as a
function of volume, with retention times of each peak and their names. Using the CPG-APB
column and binding buffer 20mM HEPES pH 8.5 and elution buffer 1.5M Tris pH 8.5. The blue
line represents the injection of insulin solution, the red line injection of IgG and the green line
injection of HSA. ............................................................................................................................. 25

VII
Figure 15 - Graphic representation of the absorbance of each solution (Insulin, IgG and HSA) as a
function of volume, with retention times of each peak and their names. Using the CPG column
and binding buffer 20mM HEPES with 150mM NaCl pH 8.5 and elution buffer 1.5M Tris pH 8.5.
The blue line represents the injection of IgG solution, the red line injection of insulin and the green
line injection of HSA. The huge peak of insulin is probably due to a air bubble ............................ 26
Figure 16 - Graphic representation of the absorbance of each solution (Insulin, IgG and HSA) as a
function of volume, with retention times of each peak and their names. Using the CPG – Aniline
column and binding buffer 20mM HEPES with 150mM NaCl pH 8.5 and elution buffer 1.5M Tris
pH 8.5. The blue line represents the injection of IgG solution, the red line injection of HSA and the
green line injection of insulin. The huge peak of albumin is probably due air trapped in the column
or UV detector. ............................................................................................................................... 27
Figure 17 - Graphic representation of the absorbance of each solution (Insulin, IgG and HSA) as a
function of volume, with retention times of each peak and their names. Using the CPG -
Aminopropyl column and binding buffer 20mM HEPES with 150mM NaCl pH 8.5 and elution
buffer 1.5M Tris pH 8.5. The blue line represents the injection of IgG solution, the red line injection
of HSA and the green line injection of insulin. ............................................................................... 28
Figure 18 - Graphic representation of the absorbance of each solution (Insulin, IgG and HSA) as a
function of volume, with retention times of each peak and their names. Using the CPG-APB
column and binding buffer 20mM HEPES with 150mM NaCl pH 8.5 and elution buffer 1.5M Tris
pH 8.5. The blue line represents the injection of IgG solution, the red line injection of HSA and the
green line injection of insulin. ......................................................................................................... 28
Figure 19 – Silver stained SDS-PAGE of the different fractions collected during purification of IgG from
CHO cell supernatant by PB chromatography using HEPES at pH 8.5 as adsorption buffer. Lanes
ID: 1, molecular weight standards (from bottom to top: 10, 15, 20, 25, 37, 50, 75, 100, 150, and
200kDa); 2, CHO cell supernatant; 3, FT fraction of the run with 200 mM Tris-HCl, 200 mM
Sorbitol at pH 8.5 elution buffer; 4, E1 fraction of the run with 200 mM Tris-HCl, 200 mM Sorbitol
at pH 8.5 elution buffer; 5, E2 fraction of the run with 200 mM Tris-HCl, 200 mM Sorbitol at pH 8.5
elution buffer; 6, FT fraction of the run with 200 mM Tris-HCl, 200 mM Mannitol at pH 8.5 elution
buffer; 7, E1 fraction of the run with 200 mM Tris-HCl, 200 mM Mannitol at pH 8.5 elution buffer;
8, E2 fraction of the run with 200 mM Tris-HCl, 200 mM Mannitol at pH 8.5 elution buffer. .......... 33
Figure 20 - Silver stained SDS-PAGE of the different fractions collected during purification of IgG from
CHO cell supernatant by PB chromatography using HEPES at pH 8.5 as adsorption buffer in
samples 2 to 7, and HEPES with 150 mM NaCl at pH 8.5 in the samples 8 to 10. Lanes ID: 1,
molecular weight standards (from bottom to top: 10, 15, 20, 25, 37, 50, 75, 100, 150, and
200kDa); 2, FT fraction of the run with 50 mM Tris-HCl, 200 mM Sorbitol, 200 mM NaCl at pH 8.5
elution buffer; 3, E1 fraction of the run with 50 mM Tris-HCl, 200 mM Sorbitol, 200 mM NaCl at pH
8.5 elution buffer; 4, E2 fraction of the run with 50 mM Tris-HCl, 200 mM Sorbitol, 200 mM NaCl
at pH 8.5 elution buffer; 5, FT fraction of the run with 50 mM Tris-HCl, 200 mM Mannitol, 200 mM
NaCl at pH 8.5 elution buffer; 6, E1 fraction of the run with 50 mM Tris-HCl, 200 mM Mannitol,
200 mM NaCl at pH 8.5 elution buffer; 7, E2 fraction of the run with 50 mM Tris-HCl, 200 mM
Mannitol, 200 mM NaCl at pH 8.5 elution buffer; 8, FT fraction of the run with 200 mM Tris-HCl,

VIII
200 mM Sorbitol at pH 8.5 elution buffer; 9, E1 fraction of the run with 200 mM Tris-HCl, 200 mM
Sorbitol at pH 8.5 elution buffer; 10, E2 fraction of the run with 200 mM Tris-HCl, 200 mM Sorbitol
at pH 8.5 elution buffer. .................................................................................................................. 33
Figure 21 – Silver stained SDS-PAGE of the different fractions collected during purification of IgG from
CHO cell supernatant by PB chromatography using HEPES with150 mM NaCl at pH 8.5. Lanes
ID: 1, molecular weight standards (from bottom to top: 10, 15, 20, 25, 37, 50, 75, 100, 150, and
200kDa); 2, FT fraction of the run with 200 mM Tris-HCl, 200 mM Mannitol at pH 8.5 elution
buffer; 3, E1 fraction of the run with 200 mM Tris-HCl, 200 mM Mannitol at pH 8.5 elution buffer;
4, E2 fraction of the run with 200 mM Tris-HCl, 200 mM Mannitol at pH 8.5 elution buffer; 5, FT
fraction of the run with 50 mM Tris-HCl, 200 mM Sorbitol, 200 mM NaCl at pH 8.5 elution buffer;
6, E1 fraction of the run with 50 mM Tris-HCl, 200 mM Sorbitol, 200 mM NaCl at pH 8.5 elution
buffer; 7, E2 fraction of the run with 50 mM Tris-HCl, 200 mM Sorbitol, 200 mM NaCl at pH 8.5
elution buffer; 8, FT fraction of the run with 50 mM Tris-HCl, 200 mM Mannitol, 200 mM NaCl at
pH 8.5 elution buffer; 9, E1 fraction of the run with 50 mM Tris-HCl, 200 mM Mannitol, 200 mM
NaCl at pH 8.5 elution buffer; 10, E2 fraction of the run with 50 mM Tris-HCl, 200 mM Mannitol,
200 mM NaCl at pH 8.5 elution buffer. ........................................................................................... 34
Figure 22 - Silver stained SDS-PAGE of the different fractions collected during purification of IgG from
CHO cell supernatant by PA chromatography. Lanes ID: 1, molecular weight standards (from
bottom to top: 10, 15, 20, 25, 37, 50, 75, 100, 150, and 200kDa); 2, CHO cells; 3, FT fraction of
the run with 50 mM NaH2PO4, 150 mM NaCl pH 7.4 binding buffer; 4, E fraction of the run with
50 mM NaH2PO4, 150 mM NaCl pH 7.4 binding buffer; 5, FT fraction of the run with 0.01 M PBS
pH 7.4 binding buffer; 6, E fraction of the run with 0.01 M PBS pH 7.4 binding buffer; 7, FT
fraction of the run with 20 mM HEPES, 150 mM NaCl pH 8.5 binding buffer; 8, E fraction of the
run with 20 mM HEPES, 150 mM NaCl pH 8.5 binding buffer; 9, FT fraction of the run with 50 mM
Tris-HCl, 200 mM Sorbitol, 200 mM NaCl pH 8.5 binding buffer; 10, E fraction of the run with 50
mM Tris-HCl, 200 mM Sorbitol, 200 mM NaCl pH 8.5 binding buffer. ........................................... 38

IX
List of Tables
Table 1 - Table of % recovery of IgG in all four columns, in Flow-through and elution steps. With two
different binding buffer.................................................................................................................... 29
Table 2 - Table of % recovery of IgG in CPG-APB column, in Flow-through and elution steps. With two
different binding buffer, and 1.5 M Tris-HCl at pH 8.5 elution buffer. ............................................ 29
Table 3 - Table of % recovery of IgG in CPG-APB column, in Flow-through and elution steps. With 20
mM HEPES, 150 mM NaCl at pH 8.5 binding buffer, and six elution buffer. ................................. 30
Table 4 - Table of % recovery of IgG in CPG-APB column, in Flow-through and elution steps. With 20
mM HEPES, 150 mM NaCl at pH 8.5 binding buffer, and four elution buffer. ............................... 31
Table 5 - Table of % recovery of IgG in CPG-APB column, in Flow-through and elution steps. With
20mM HEPES at pH 8.5 binding buffer, and four elution buffer. ................................................... 31
Table 6 - Table of % recovery of IgG in CPG-APB column, in Flow-through and elution steps. With
20mM HEPES, 150mM NaCl at pH 8.5 as binding buffer, and four elution buffer. ....................... 32
Table 7 - Table of protein purity of IgG, in Flow-through and elution steps after purification from a CHO
cell supernatant using CPG-APB column. With 20mM HEPES at pH 8.5 binding buffer, and four
elution buffer. .................................................................................................................................. 35
Table 8 - Table of protein purity of IgG, in Flow-through and elution steps after purification from a CHO
cell supernatant using CPG-APB column. With 20mM HEPES with 150 mM at pH 8.5 binding
buffer, and four elution buffer. ........................................................................................................ 35
Table 9 - Table of purification factor of IgG in CPG-APB column, in Flow-through and elution steps.
With 20mM HEPES at pH 8.5 bniding buffer, and four elution buffers. ......................................... 36
Table 10 - Table of purification of IgG in CPG-APB column, in Flow-through and elution steps. With
20mM HEPES with 150mM NaCl at pH 8.5 binding buffer, and four elution buffers. .................... 36
Table 11 – Retention time and areas of a of the elution peak, for the different loading buffers
evaluated, in PA CPG resin. .......................................................................................................... 37
Table 12 - Table of % recovery of IgG in PA CPG column, in Flow-through and elution steps. With
different binding buffer, and with 0.1 M citric acid at pH 3.0 as elution buffer. .............................. 37
Table 13 - Protein purity in the fractions collected form PA-CPG column: flow-through and elution
steps, using four binding buffer, and 0.1 M citric acid at pH 3.0 as elution buffer. ........................ 38
Table 14 - Table of protein factor in PA CPG column, in Flow-through and elution steps. With four
binding buffer, and 0.1 M citric acid at pH 3.0 elution buffer. ......................................................... 39
Table 15 - Table of % recovery in CPG-APB column, in Flow-through and elution steps. With 20 mM
HEPES, 150 mM NaCl at pH 8.5 binding buffer, and 50 mM Tris-HCl, 200 mM Sorbitol, 200 mM
NaCl at pH 8.5 elution buffer. ......................................................................................................... 39
Table 16 - Table of % protein purity and protein factor in CPG-APB column, in Flow-through and
elution steps. With 20 mM HEPES, 150 mM NaCl at pH 8.5 binding buffer, and 50 mM Tris-HCl,
200 mM Sorbitol, 200 mM NaCl at pH 8.5 elution buffer. .............................................................. 39
Table 17 - Table of % recovery in PA CPG column, in Flow-through and elution steps. With 0.01 M
PBS at pH 7.4 binding buffer, and 0.1 M citric acid at pH 3.0 as elution buffer. ............................ 40

X
Table 18 - Table of % protein purity and protein factor in PA CPG column, in Flow-through and elution
steps. With 0.01 M PBS at pH 7.4 binding buffer, and 0.1 M citric acid at pH 3.0 as elution buffer.
........................................................................................................................................................ 40
XI
List of Abbreviations
AC Affinity Chromatography
AEX anion enhance chromatography
APB Aminophenyl boronate
BCR B cell receptors
cCCS Clarified cell culture supernatant
cDNA Complementary DNA
CEX cation enhance chromatography
ELISAs Enzyme-Linked Immunoabsorbent Assay
HAS Human serum albumin
HEPES 4-(2-hydroxyethyl)-1-piperazineethanesulfonic acid
HPLC High-performance liquid chromatography
IgG Immunoglobulin G
IST Instituto Superior Técnico
mAb Monoclonal Antibody
NaCl Sodium chloride
PB Phenyl Boronate
PBS Phosphate Buffer Saline
PF Purification Factor
pI Isoelectric Point
RNA Ribonucleic acid
SDS-PAGE Sodium Dodecyl Sulphate - Polyacrylamide Gel Electrophoresis
TCR T-cell receptors
Tris-HCl Tris(hydroxylmetrhyl)aminomethane

1
1. Introduction
1.1. Background
Monoclonal antibodies (mAbs) hold great promise as new therapeutic agents against numerous
diseases in an aging society, including the treatment of different type of cancers. Recent advances
have led to remarkable improvements in cell culture productivities, with antibody titres exceeding 10
g/l. With capacity bottlenecks moving towards downstream purification areas, the need for a broader
strategic approach for the purification of mAbs is being increasingly recognized as the key to improve
the overall process performance. Although several alternatives to the established downstream
processing platform have been proposed, newer and more economic methods are still being pursued.
With this work, the feasibility of using phenyl boronate (PB) as an affinity ligand for the purification of
mAbs has been investigated. The PB ligands are a useful tool for the specific capture and isolation of
cis-diol molecules, such carbohydrates, glycoproteins, enzymes, RNA, nucleotides, etc. The ligand
interacts with cis-diol groups by forming reversible covalent ester bounds.
1.2. Aim of studies
The present work focus on the feasibility of using aminophenyl boronate (APB) chromatography as the
first step in the downstream processing of antibodies in order to reduce manufacturing costs, either by
replacing Protein A chromatography or by reducing the loading of impurities before the Protein A step
In this master thesis was attempted to define the best conditions to perform the CPG-APB
chromatography. The first step was to study the interaction of IgG and typical protein impurities
(albumin and insulin) with the following resins: controlled pore glass (CPG); aminopropyl-CPG; aniline-
CPG and APB-CPG. Next were execute several studies with two different binding buffers, with or
without NaCl and different elution buffers supplemented with competitive diols (sorbitol and mannitol)
in order to find an alternative to the standard elution buffer (1.5 M Tris-HCl, pH 8.5). The last step was
to evaluate the efficiency of the APB ligand, then compare with protein A. A purification process
combining two consecutive chromatographic steps on APB-CPG and protein A-CPG, respectively,
was evaluated.

2
2. Literature Review
2.
2.1. Immune System
The immune system comprises all the mechanisms by which a multicellular organism defends itself
from foreign invaders such as bacteria, viruses, protozoa and fungi. This is the first line of defence
against these invaders (1) (2).
There are two types of defence mechanisms: the innate or nonspecific system, and the adaptive
immune system, which includes the selective action of lymphocytes and the production of specific
antibodies (1) (2).
Innate Mechanisms or Nonspecific:
This system comprises the non-specific mechanisms of defence, which constitutes an undifferentiated
response to the invading agents; these may include mechanisms to protect the skin, stomach acid, the
phagocyte cells or the secretion of tears. These constitute the most ancient defence strategies, some
of these forms can be found in most primitive multicellular organisms like plants and fungi (1) (2).
Adaptive immune system or specific:
The whole system focuses specifically on the ability of immune cells to distinguish proteins produced
by the body's own cells (antigen "self"- that is the body itself), and proteins produced by intruders or by
human cells under the control of virus (antigen "non -self "- which is not recognized as the organization
itself) (1) (2).
This distinction is made through receptors, the TCR (T-cell receptors) or BCR (B cell receptors are
antibodies that bound to the membrane). These receptors, TCR or BCR are produce in millions of
conformations to be effective. Otherwise would not bind to so many kinds of proteins from invaders,
and not recognize it. This diversity of receptors would not fit in the genome of the cell, and millions of
genes, each one for each possible receiver would not be practical. What happens is that there are
some families of genes, each having a slightly different number of members. Through a special and
unique process in human cells, these genes recombine in lymphocytes, one for each family, a single
gene, in a totally random (1) (2).
2.2. Brief history of Antibodies
In the late of nineteenth century, the German army physician Emil von Behring (1854-1917), who later
became the first Nobel Prize for Medicine, pioneered the application of antibodies to the therapeutic
level, using blood serum for the treatment of tetanus and diphtheria (Blutserumtherapie). Upon
publication of their data, very little was known about the factors or mechanisms involved in immune
response. Being the first time it was concluded that the human body should have some defence
mechanisms to combat toxic substances, and these "mechanisms" are present in the blood. Therefore
it was possible to get prepared from whey and used to fight against infections and toxins (3) (4).

3
With this study, it was possible to this doctor to establish the first company "biotech" in 1904, based on
treatment using antibodies (3).
In 1908, Paul Ehrlich father of Hematology (Ehrlich, 1880) and the first consistent concepts of
immunology, won the second Nobel Prize for Medicine. Laying the foundation for antibody production
through research on vaccination schedules, and their efficiency. Paul Ehrlich was the first to describe
the different subclasses of immunoglobulins. Without knowledge of the molecular structure or
biochemical link mechanisms Ehrlich anticipated many of the knowledge that today is known about the
formation of immunoglobulin and antibody-antigen interactions (3) (4).
Much has been learned about the structure of antibodies and their function. Cesar Milstein and
George Köhler showed that monoclonal antibodies could be produced in cultured of mouse cells,
raising hopes for therapy. But in late of 1970, that hope faded due to almost all first generation mAbs
have failed in clinical trials. This left only one of these products that was approved in 1984 by the FDA
(Food and Drug Administration) - Orthoclone. However, this was a special case because the type of
patient, who received this antibody CD3, was already immunosuppressed by disease, a condition that
is unusual in patients with cancer or autoimmune diseases. (3) (4).
2.3. Antibodies
The antibodies rarely lead directly to the destruction of the infectious organisms whose antigen
recognize, they acting as markers, enhancers of other defence responses in the body. The formation
of antigen-antibody complex causes an increase of inflammatory response by increasing
vasodilatation and capillary permeability, which allows migration of phagocytic cells, increasing their
activity when detect the antigen-antibody complex. These glycoprotein’s also act causing agglutination
and precipitation of the antigen, neutralize viruses and bacterial toxins and cause the activation of the
complement system, in which proteins can cause the appearance of pores in the membrane lining the
invaders, leading to their lyses and subsequent destruction (1) (2).
Antibodies are host proteins produced in response to the presence of foreign molecules in the body.
They are synthesized primarily by plasma cells, a terminally differentiated cell of the B-lymphocyte
lineage, and circulate throughout the blood and lymph where they bind to foreign antigens. Antibodies,
also known as immunoglobulin’s (Ig) are globular proteins (glycoprotein’s) formed by four
interconnected polypeptide chains with Y shaped (two heavy and two light chains) (1) (2).
Its primary structure (amino acid sequence) reveals a variable region and constant region. The
constant region is located in the stem of the “Y”, which interacts with other elements of the immune
system and is identical in all types of antibodies, within the same class. The variable region is formed
by the two upper arms of the "Y". It has a variable chemical response, unique to each antibody, and is
complementary to a specific antigen, conferring specificity to the antibody (1) (2) (5).

Figure 1 - Schematic structure of an antibody (remove from the website, in 13/01/2011: http://4.bp.blogspot.com/_6lpOFr_o5sM/RgVigvoS4AI/AAAAAAAAAGE/xBpQGBiWQhk/s1600
The constant region of the heavy chains defines the antibody class. There are five immunoglobulin
classes: IgG, IgA, IgM, IgD e IgE, taking into account their size, charge, amino acid composition and
carbohydrate content (1) (2).
Figure 2 – Composition of five immunoglobulin’s classes (remove in the website, in 12/01/2011: http://4.bp.blogspot.com/_-Uzu0xg5lh0/R2F06LXIC8I/AAAAAAAAAG8/DLpH6XZYH00/s1600
When an antibody binds o an antigen, it triggers several biological effects/responses in the body; the
most important are: (1)
- Inhibition of the antigen from an invader agent, such as toxins, drugs, viruses, bacteria and parasites.
The binding of the antibody neutralizes the toxicity or infection
- Opsonization: mononuclear phagocytes and neutrophils express receptors for the Fc portion of IgG
molecules by facilitating the action of these cells to the binding of antibodies
Schematic structure of an antibody (remove from the website, in 13/01/2011: http://4.bp.blogspot.com/_6lpOFr_o5sM/RgVigvoS4AI/AAAAAAAAAGE/xBpQGBiWQhk/s1600-h/anticorpo.bmp)
The constant region of the heavy chains defines the antibody class. There are five immunoglobulin
classes: IgG, IgA, IgM, IgD e IgE, taking into account their size, charge, amino acid composition and
Composition of five immunoglobulin’s classes (remove in the website, in 12/01/2011: Uzu0xg5lh0/R2F06LXIC8I/AAAAAAAAAG8/DLpH6XZYH00/s1600-h/Antibodies
When an antibody binds o an antigen, it triggers several biological effects/responses in the body; the
invader agent, such as toxins, drugs, viruses, bacteria and parasites.
The binding of the antibody neutralizes the toxicity or infection (1).
ocytes and neutrophils express receptors for the Fc portion of IgG
molecules by facilitating the action of these cells to the binding of antibodies (1).
4
Schematic structure of an antibody (remove from the website, in 13/01/2011: h/anticorpo.bmp)
The constant region of the heavy chains defines the antibody class. There are five immunoglobulin
classes: IgG, IgA, IgM, IgD e IgE, taking into account their size, charge, amino acid composition and
Composition of five immunoglobulin’s classes (remove in the website, in 12/01/2011: h/Antibodies-Ig.jpg)
When an antibody binds o an antigen, it triggers several biological effects/responses in the body; the
invader agent, such as toxins, drugs, viruses, bacteria and parasites.
ocytes and neutrophils express receptors for the Fc portion of IgG

5
- Activation of complement factors: these serum proteins initiate enzymatically activated cascade,
which may promote osmotic lyses of the target cell. Generally, IgG and IgM can initiate this process
(1).
- Antibodies of B-lymphocyte membrane are receptors for antigens: this link initiates cell proliferation
and secretion of antibodies by B-cells. In the membrane of B–lymphocytes it can be found different
isotypes of Ig heavy chains. For example, immature B-cells express IgM and IgD, immune memory
cells can express any isotype (1).
- Dependent cell-mediated cytotoxicity of antibodies: diverse populations of leukocytes besides the
cytotoxic T-lymphocytes, including neutrophils, eosinophils and natural killer cells (NK), are able to
lyse target cells. Often it is necessary that these cells are coated with IgG in antibody-dependent
process called antibody dependent cell mediated citotoxicity (ADCC) (1).
The region of antigen that interacts with the antibody is the epitope. There are two types of antibody
populations based on the way of interaction with the antigen: the monoclonal antibodies that recognize
only one epitope on the surface of antigen, and polyclonal antibodies that recognize different epitopes
on the surface of antigen (1) (2).
Polyclonal antibodies derived from different lineages of B cells. They are a mixture of immunoglobulin
molecules secreted against a specific antigen but each recognizing a different epitope. These
antibodies are one of the most widely used research reagents, for several applications, including (6):
• Western blotting
• Immunohistochemistry
• Immunocytochemistry
• Flow cytometry
• Immunoprecipitation
• Neutralization assays
• ELISAs
The production of polyclonal antibodies is relatively simple compared with the production of mAbs.
This production is done through the binding of antigen to carrier protein, which is introduced into the
animal, generating antibodies. Then it is collected and purified it from serum antibodies using a
chromatographic affinity column with the antigen immobilized on its surface. The selection of the
animal is based on the need of the amount of antibodies (7).
Monoclonal antibodies (mAb) arise from a single B-lymphocyte, which is always producing the same
antibodies in response to a pathogen (7).
2.4. Brief history of Monoclonal Antibodies (mAbs)
In 1975, Kohler and Milstein published a revolutionary technique for producing monoclonal antibodies
(mAbs) by hybridoma technology. With this new technology, mAbs have had a profound impact on
medicine, giving an almost unlimited range of therapeutic or diagnostic reagents. Therapies using
mAbs have become a major part of treatments in various diseases including transplantation, oncology,

6
and autoimmune, cardiovascular and infectious diseases. The limitation of murine mAbs due to
immunogenicity was overcome by replacement of the murine sequences with their human counterpart
leading to the development of chimeric a humanized therapeutic antibodies. Incredible progresses
were made in the development of display technologies, enabling not only the production of fully human
antibodies but also the engineering of antibodies with altered properties such as molecular size,
affinity and specificity. Furthermore, antibody engineering technologies are constantly advancing,
allowing further adjustment of effectors function and serum half life. Optimal delivery of antibody to the
target tissue remains to be addressed to avoid unwanted collateral damage as a result of systemic
treatment, reaching a significant therapeutic effect (8).
2.5. Production of Monoclonal Antibodies (mAbs)
The technology for the production of mAbs was developed in 1975 by Georges Kohler and Cesar
Milstein, and quickly became one of the key tools of immunology. It started with the cloning of an
immortalized cell line that secreted the antibody Sp1, a mouse IgM antibody. The original process is
based on injection of an antigen in the mouse to induce a specific immune response. B-lymphocytes
differentiate were isolated from the spleen and fused with immortalized myeloma cells. The resulting
hybridoma cells are then selected by their growth potential and immortalization, and then screened for
the production of specific antibodies. The development of MAbs started from a single cell clones that,
after propagation, are kept in a cell bank and assigned to a routine production (7) (9) (10).
Figure 3 – Production of monoclonal antibodies
7
MAbs are established as the most significant class of recombinant proteins. They can be expressed at
high levels in cell culture, are typically very soluble, and are relatively stable during processing. MAbs
represent a unique group of biological products. They accommodate rapid process development time
lines, can be produced in large quantities and can be manufactured in numerous facilities throughout
their life cycle as a result of its common process flow diagram. As a result, they have relatively low
production cost and benefit of production flexibility in different places (10).
In contrast, the traditional method of production of MAbs had a number of disadvantages and
limitations. First, these antibodies are of murine origin. Despite the similarities and structural
homologies, the possibility for therapeutic uses are quite limited as there serum half-life is short in
humans. Furthermore, they are "foreign" proteins, of murine origin, and thus can causes an immune
response in humans after repeated administration. The generation of human anti-mouse antibodies
(HAMA), a potentially fatal immune event that is directed against the idiotype and isotype of mices, is
the most discouraging aspect of murine antibodies (9). For this reason, new strategies were devised to
produce less immunogenic mAbs and finally fully human. There are a variety of possibilities to reduce
the risk of immunogenicity of a therapeutic antibody that have been employed (9).
Generation of Human Antibodies
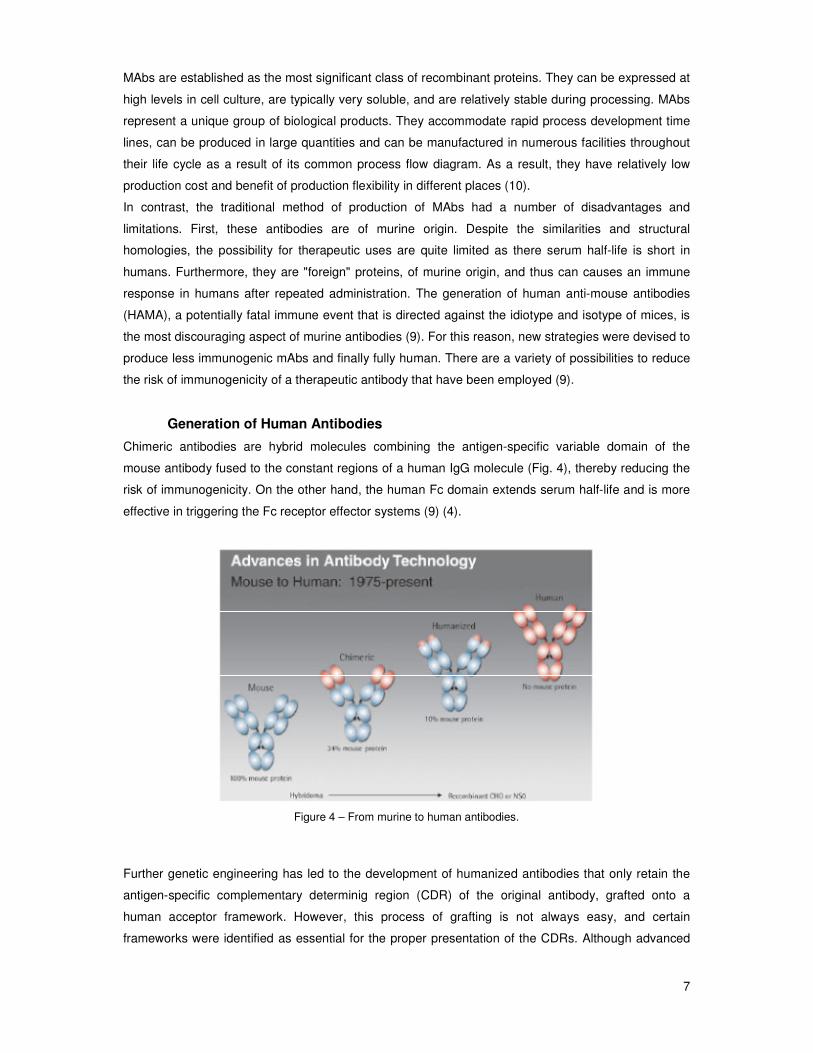
Chimeric antibodies are hybrid molecules combining the antigen-specific variable domain of the
mouse antibody fused to the constant regions of a human IgG molecule (Fig. 4), thereby reducing the
risk of immunogenicity. On the other hand, the human Fc domain extends serum half-life and is more
effective in triggering the Fc receptor effector systems (9) (4).
Figure 4 – From murine to human antibodies.
Further genetic engineering has led to the development of humanized antibodies that only retain the
antigen-specific complementary determinig region (CDR) of the original antibody, grafted onto a
human acceptor framework. However, this process of grafting is not always easy, and certain
frameworks were identified as essential for the proper presentation of the CDRs. Although advanced

8
molecular modelling efforts, grafting still requires experimental validation to arrive at a molecule that
maintains the same specificity and affinity of the original antibody. Therefore, more efforts have been
made in alternative technologies that enable the generation of fully human antibodies (4) (9).
Transgenic Mice
A powerful technology is the development of transgenic mice in which the mouse antibody genes have
been functionally replaced with human equivalents. This was made possible through technologies that
allowed the insertion of large fragments of yeast artificial chromosome (YAC) in the germline of mice.
These mice increased the immune response after vaccination, generating fully human antibodies,
which can then be isolated with traditional hybridoma technology (4) (9).
Recombinant Libraries
Another approach for the generation of fully human antibodies employs large combinatorial libraries
based on the human VH and VL genes. These libraries have the advantage that clonal selection
against self antigen does not take place; this can be a problem when raising an antibody against a
highly conserved epitope in an animal (4) (9).
With recombinant libraries, the challenge is to link the phenotype (the physical connection between the
antibody protein with antigen) to genotype, the cDNA encoding the protein. The method usually used
to isolate novel ligands from a library of recombinant antibodies is phage display (4) (9).
Phage display technology
This method has been used to isolate scFvs from libraries of new naive as well as for affinity
maturation. To select scFvs binding to a particular antigen, the scFv is fused to a minor coat protein,
typically PIII (G3P) of filamentous phage M13. During phage panning the scFv in phage is bound to
the immobilized antigen and enriched during consecutive binding, elution and amplification cycles after
infection of bacteria. However, a disproportionate expansion of links of non-specific phage can occur,
since it links the nonspecific and specific phage can infect a bacterial cell.The method of selectively
infective phage (SIP) addresses this problem. In the SIP procedure, the antigen-antibody interaction is
essential to restore the infectivity of an otherwise non-infectious phage displaying scFv. In the PIII coat
protein (G3P) is missing the N-terminal domain responsible for infectivity. The fusion between the
antigen and the areas where lack of coat protein restores infectivity, thus binding the ligand and
infectivity. In contrast to phage display, where the binding of scFvs to an antigen interacts on a surface
of solid phase (eg, an affinity column), the SIP is not necessary interactions in the solid phase, thus
avoiding the problem of non-specific interactions. In addition, SIP is a one-step procedure (binding and
infection are coupled, making unnecessary the elution), and through it easier and faster to perform.
Phage display - as well as SIP - is a powerful tool used to select and isolate new antibodies by
increasing their affinity (4) (9)
2.6. Current approaches in purification process
Despite the high degree of homology between the humanized mAbs, the variations of complementarily
in some regions and sequences framework makes it difficult to define a truly generic purification

9
process capable of purifying different mAbs exist without changes on process conditions in question.
Despite these variations, many companies have well defined purification processes based on a
common follow-up of unit operations. This follow-up that is often used for purification of mAbs is
shown in the figure 5 (10) (11).
Figure 5 – Typical purification process of mAbs
After fermentation the cell culture is clarified by centrifugation followed by depth filtration. Protein A
affinity chromatography provides an excellent step of purification and concentration, capturing the
product directly from solution obtained from the centrifugation process. The elution buffer of low pH
used in this step also provides the inactivation of viruses. The following two chromatography steps are
used to reduce host cells proteins from the medium, and also for cleansing of impurities related to the
product, this process can be called polishing stages. These two steps are also useful for removal of
additional virus. One of these steps is almost invariably ion exchange chromatography (AEX), usually
in flow-through mode. The second chromatography step is typically a cation exchange
chromatography (CEX), although occasionally it can be used hydrophobic interaction chromatography
(HIC) chromatography or hydroxyapatite ceramics. The last process steps include filtration of viruses
(FV) and ultrafiltration / diafiltration (UF / DF) for the formulation and concentration of the product, now
called the bulk drug substance. The efficiency, robustness and scalability of this process resulted in
the standardization in this industry and development groups (10).
Cell Culture
Centrifuge
Protein A
Cation-exchange
chromatography
Anion-exchange
chromatography
Virus filter
UF / DF

10
The creation of a platform in the manufacturing process of mAbs had an enormous impact on the
development of strategies in the purification process, and being only just beginning to affect the world
of commercial production. At the moment, few companies have two or more mAbs commercial
products that are purified by a common process. Many products mAbs are in clinical trials, although
they are being manufactured by a process similar to standard process shown in Figure 5 (10).
The gradual evolution in the early phase of clinical processes for commercial production provides
additional gains in production efficiency that will reduce the cost of goods and accelerate the response
to a surge in product demand. The benefits of efficient management of facilities (eg, reductions in
transit time and the use of raw materials and common equipment) and flexibility of commercial
production (eg production schedules balanced between facilities) will be run more slowly than gains
seen today with product candidates in earlier stages of clinical development. The combination of
processing platforms, multiproduct facilities, rapid product change, flexible supply contract between
the organizations of manufacturing and production facilities "home" range of mAbs production at
industrial level, which will reach unprecedented in the field of recombinant protein biological never
seen before. The antibodies may become a therapeutic class of products that support the biological
treatment of large patient populations, keeping costs competitive with small molecules. To one day be
able to achieve this idea, the biopharmaceutical industry must seize the opportunities presented by the
ease of development, validation and production provided by the convention process (10).
Given the value and broad adoption of processing platforms, combined with an installed base of
production facilities for them, there is enormous pressure to conform these platforms to future
products. As a result, the options for the unit operations, raw materials, control systems and
algorithms, and processing equipment are limited. Thus requiring to address other challenges, eg, the
establishment of highly efficient work processes to quickly define processing conditions suitable for
every new mAb product, and defining a set of approaches for optimization and characterization
studies process that will expedite the final stages of development of medical products (10).
Clarification operations as centrifugation vary slightly from product to product, since the cell culture
process is not radically different. Major changes in the concentration or viability of the cells in the cell
culture bioreactor affect the clarification, but since the unit operations are designed for the worst case,
few if any changes are necessary for new products. The depth filters can vary significantly, depending
on the feed stream, and should be optimized for greater robustness, while the cost of raw materials is
minimized. The ulltrafiltration steps should be little affected by the change of mAbs. The unit
operations that are more likely to require an adjustment are chromatographic steps. Given that the
standardization of many elements in chromatography will simplify the development over time, the
focus should be put on the product characteristics that could influence key factors in chromatographic.
Since the variables in this process many times are the selection of resins and membranes, the height
of the column bed, the volume of wash load capacity, the membrane flow and the concentration of the
bulk. This effort simplifies and accelerates the initial phase of the development process (10).
The step of Protein A is generally a very robust operation, which can withstand changes in harvest
conditions in the bioreactor and the characteristics of the product. The variables that can be influenced
by product variations or feed stream are the ability of dynamic binding, the ideal combination of
binding solution from the column and elution conditions. Variations in these process parameters

11
resulting from the difference in protein A affinity to the mAbs, the steric hindrance between molecules,
and variations in the levels of impurities in the feed stream and species, probably caused by strain and
management of the bioreactor or by the properties of mAbs (10).
The most common variables for the ion exchange chromatography step include the load and
composition of the solution (eg pH concentration) and compositions for binding and elution. In some
cases there may be major changes to the platform, such as when a highly acidic mAb has a strong
affinity with resin AEX, this operation must be changed in favor of a step bind-elute. Affinities of
various ion exchange resins have been described, highlighting an area where the diversity of
properties of mAbs has an impact on the purification process (10).
Variables of chromatography can be optimized independently for each mAb, there are choices to be
made in relation to investment in the initial phase of process development. The adjustment is given by
two extremes, one in relation to generic process of chromatography, and the other in relation to the
processing conditions. An example of this adjustment is try to optimize the step of AEX. Just as
screening studies using gradient bind-elute could be used to adjust the elution conditions in the CEX
step. A more generic approach to the development process would use a fixed pH value for the step of
AEX adjusting only the concentration of counter-charge just by dilution. This minimum concentration
would be different for different mAbs. An even more flexible approach would use a single
concentration that allows successful treatment of most mAbs without significant losses of more acidic
products. Likewise in the generic approach to CEX, the stage can be designed with a low conductivity
for charge combined with a wide gradient elution, which could potentially include the successful
treatment of a large number of monoclonal antibodies. The trade-offs of both approaches would be
influenced by the interaction of resources in the development process and time (more for the
personalized approach, less for the generic approach), manufacturing efficiency and other factors,
such as the characteristics of the mAbs (10).
After Phase I of the process development, companies usually engage in at least one additional cycle
of the development process (commonly referred to as the final stage of development), which defines
the Phase III of the process later being used to launch the product. This second cycle often involves
changes in the process of cell culture media including reformulations, changes in feeding strategy,
optimizing the time of culture and even the introduction of a new bank of cells or cell line. Changes in
the process of purification during this second cycle will probably have little impact compared to the
regulatory impact of changes in cell lines, eliminating one step (eg, the elimination of one of the two
chromatography steps) can cause a problematic change in the purity of the product. Because several
years may pass between the development of Phase I and Phase III, the considerations should be
taken into account to improve the purification process including separation media which have recently
been introduced. Studies shall go further to define the optimum control interval of the final process for
the key parameters of process and their weak points and will investigate the process parameters that
are unique to each mAb (for example, the capacity of the column, the lifetime of resins and
membranes, etc.) (10).
If considered the implementation of new radical technologies, these options are typically pondered in
the final phase of the development cycle rather than early (10).

12
The replacement of platform technologies requires sustained and significant efforts to define
processing parameters, to establish the robustness of the process, to acquire and test new raw
materials, to purchase and validate new equipment. These factors strongly support an approach
where the application of new technologies in Phase I would be used only if the new process
technology is the only way to permit the clinical production. The speed that businesses use to launch a
product almost always supersedes the benefits that new technology might bring to this stage of
development. The new technologies only are considered during the following two development cycles
of the process, both for the definition of phase III or as an amendment to post–license (10).
This argument may seem to establish a new puzzle for the introduction of platforms on unit operations.
If these are not entered in Phase I of the process due to market pressures and the speed should be
deferred to Phase III. However, the introduction of significant changes in processes (especially those
that could adversely affect the impurity profile of the product) after Phase I is a major obstacle that
may require additional clinical trials, increasing the cost of drug development and potentially delaying
product launch. The introduction of new technology after licensing may be even more difficult even if
the process changes have very low side effects risk. The U: S. Food and Drug Administration (FDA)
allows process changes without having to repeat the clinical trials if the process of change has no
impact on product safety, potency or effectiveness, and whether the product is well characterized (10).
A major benefit of creating a platform of purification processes is that there may be a fairly long period
without significant changes that alter the development operations of the manufacturing process.
Taking an approach of process improvements are introduced through a revision controlled internally
and a decision process (10).
2.7. Typical unit operations and processing alternatives
Centrifugation is currently the most widely used method for harvesting cells from a bioreactor.
Continuous-flow centrifuge (e.g. disk-stack) is robust, easily scaled to different volumes, and use a
relatively generic set of processing parameters. This step typically does not provide a sufficient degree
of solids removal to allow the solution to be directly processed by the initial capture chromatography,
so an additional step of filtration is needed. Alternatives, like flocculation processing can offer a
significant reduction in the filtration area required. Depth filters are also commonly used but they can
remove protein [host cell protein or product] during the filtration; and so changes in this step have to
be thoroughly evaluated. The rotation parameters can affect the filter area that is required and may
influence the colloidal properties of the feed stream. Therefore it is necessary to take into account the
parameters of both centrifugation and filtration steps to improve the performance and the integration of
these steps. Since centrifugation is commonly chosen for large-scale operations, small scale (≤ 400L
cell culture) can be used depth and size filtration. New technologies, such as units of harvesting pods,
make filtration a more attractive option at small scales (10).
Most processes use, as the initial capture step, protein A affinity chromatography. There are two
potential problems with this type of chromatography: protein A leaching from the resin and the higher
costs of this resin as compared with nonaffinity resins. There are alternatives to protein ligands that
are small molecules or protein A mimetic peptides, which do not normally increase the load capacity
while maintaining selectivity. There are alternatives to Protein A chromatography as capture step,

13
which may include ion exchange chromatography, and like most mAbs have a pI higher than 7 the
choice rests with CEX. With this type of chromatography the pH and / or the conductivity of the fluid
cell culture may have to be adjusted, and in some cases the product in the feed stream should be
concentrated by ultrafiltration getting better capacity and throughput. This operation of conditioning
should be evaluated when the overall costs of affinity capture are compared with the nonaffinity
alternative. The lower pH and conductivity can cause problems in the stability of the antibody
(because of the protease activated by acid) or protein precipitation (product or host cell protein),
requiring more filtration area. However, the precipitation of host cell protein during conditioning may
contribute to its removal during the process, but this precipitation can cause complications during
ultrafiltration (10).
The type and amount of polishing steps will be determined depending on the nature of product
impurities and of the product itself. In general, the Protein A pool will be more pure than the nonaffinity
pool. Changes in culture conditions that increase cellular expression may also result in higher levels of
aggregate or loaded variants which may influence the choice of the process of affinity or nonaffinity or
may require additional stages of polishing. A nonaffinity process is generally less favourable to a
platform approach, because not all the antibodies bind well to the column without some prior
modifications in the feed stream, as in the case of CEX resins. Furthermore, the process of capture by
protein A offers more freedom to match the processing step further, without adjustments in the feed
stream. If the pool of affinity is relatively pure, only one additional step of polishing is required. There
are platforms that use only two chromatographic steps, where the AEX step is performed under
conditions of weak partitioning, as shown in Figure 6. The existence of only two steps offers
advantages in reducing costs. The use of mixed-mode chromatography also can help minimizing the
number of polishing steps, increasing the separation performance for each resin. Impurities related to
the product with minimum loads or different sizes may be the biggest challenge for the purification
process due to its similarity with the product. Controlling these impurities to acceptable levels during
cell culture facilitates the mixed-mode chromatography (10).

14
Figure 6 – Emerging two-column platforms
Future platforms may build in continuous processing, two column processes (figure 6) and alternative
unit operations. Finding alternatives to chromatographic steps can simplify the purification process,
reducing costs and facilitating the processing of large batches. Currently, the binding capacity of
membranes for adsorption is lower than the corresponding bead-resin, making them more suitable for
operations in the flow-through mode when relatively low amounts of impurities are present. Membrane
absorbers may replace the step of ion exchange chromatography, and can offer lower consumption of
buffer pool and reduced volumes when compared to the packed-bed chromatography. For antibodies,
these technologies can provide a benefit in productivity and cost reduction. However, due to the
variability of mAbs, these are unlikely to have a process platform, requiring an investment of additional
resources during the development process. There are factors that must be considered in the
evaluation of process options, including the requirement of annual production, the expression levels
and production costs (10) (12).
2.8. Protein A affinity chromatography
Despite the wide range of preparative chromatography modes that can be used for the purification of
monoclonal antibodies (mAbs), most purification schemes use protein A affinity chromatography as
the capture step, which is due to its specificity for the region (Fc) of antibodies, their physical and
chemical stability, and the ease and simplicity for the development process. The degree of purification
achieved in this step is high, helping to simplify the rest of the purification process. Usually small
amounts of contaminants, mainly high molecular weight aggregates, remaining host cell proteins and
leached protein A, are still present after this step, and will be further removed in one or two
Cell Culture
Centrifuge
Protein A
Cation-exchange
chromatography
Anion-exchange
chromatography
Virus filter
UF / DF

15
subsequent polishing step. The protein A chromatography has been used for purification of antibodies,
even though its high cost, and there are concerns about leaching of the ligand. Over time, this
technique has been optimized for high capacity, high yields, cleaning and re-use, and is the basis of
the "platform manufacturing" process in the purification of antibodies in the final stages of development
(10) (5) (13).
The protein structure
The protein A is a polypeptide anchored in the cell wall of Staphylococcus aureus. It is encoded by the
spa gene and its regulation is controlled by DNA topology, cellular osmolarity, and the regulatory
system ArlS-ArlR. The architecture of this molecule is characterized by a C-terminal that starts with an
association with the cell wall / membrane region, and after a series of five linear binding domains
homologous to the antibody. These areas are designated as E, D, A, B, C (in order from N terminal)
and share about 65% to 90% homology between them. The molecular weight of an intact molecule is
54 kDa, whereas the one without the cell wall-binding domain is approximately 42 kDa. The molecular
weight of each antibody binding domain is 6.6 kDa, and each consists of a bundle of three antiparallel
helices with two laps interhelical that have about the same ability to bind to the antibody (10). Protein
A is widely used as a tool in immunochemical and related studies and his biological function is
unknown (14) (5).
Protein A - Immunoglobulin G (IgG) Interaction
The IgG binds to individual domains of protein A through the Fc region (figure 7), at the junction
between the CH2 and CH3 domains. All the contacts seen in X-ray complex protein A - IgG derived
from residues in the first two helices but helix 3 is critical for the stability of the interaction protein A -
IgG, which consists mainly of hydrophobic interactions with some hydrogen bonds and two salt
bridges. Studies have revealed a highly conserved histidyl residue in the center of the IgG binding site
for protein A, which align with a also conserved complementary histidyl residue on protein A (10).
Figure 7 - Ribbon diagram of one Fc chain co-crystallized with a fragment of an IgG-binding bacterial protein (Staphylococcus aureus protein A) (remove from the website, in 12/10/2011:
http://www.tulane.edu/~biochem/med/1fc2_igg.gif)

16
Protein A Chromatography step development
As stated earlier, Protein A affinity chromatography is used for capturing mAbs from clarified cell
culture supernatant (cCCS), allowing simultaneously the removal of HCP, DNA, potential
contaminants such as virus and impurities related the process. This step also serves to reduce the
volume of process, 5 to 10 times.
Figure 7 is represented a typical chromatogram of protein A. The cCCS is injected directly into the
column (at neutral pH) and the product is eluted from the column at low pH. A washing step is
introduced between injection and elution of the column for removal of weakly adsorbed HCP and other
contaminants. Finally, the column is regenerated for further use (3) (10).
Figure 8 – A typical Protein A chromatogram (10).
The affinity capture step relies on the specific interaction of the antibody Fc part with the immobilized
protein A. This can originate purities higher than 95% with high yields, but is also very flexible in
requisites of conductivity and pH of the feed stream, allowing the capture of antibodies directly of the
clarified cell culture. However, this step in downstream process of mAbs is the most expensive
accounting for 50% of the total coast (3) (10).
2.9. Non-Protein A strategies
Economic non-protein A alternatives that have been tested in the process of production of antibodies
include affinity ligands and the uniquely designed resin MEP HyperCel for selective binding to
antibodies. Mimetic resins, composed of synthetic affinity ligands, have been employed as capture or
polishing steps. One of the most significant advantages of these synthetic ligands compared with
protein A resin is related with their considerably lower cost, but there are more benefits including
undetectable leaching, convenient cleaning, extended lifetime, and suitability for different mAbs. The
binding capacity of these resins is a function of ligand density and spacer arm length, and is also
influenced by the concentration of antibody. In most cases, the binding capacity is comparable to that

17
of Protein A resin. But, the frequently used mammalian cell culture shear protectant Pluronic F-68
interferes with the binding of mAbs to mimetic resin due the hydrophobic moieties in the ligand itself,
because of this a cation exchange step before is recommended to remove this pluronic F-68, which is
a major disadvantage (10).
Unique resins have been introduced that can capture antibodies from high - ionic - strength feed
streams, and these are based on hydrophobic charge induction chromatography (HCIC). MEP
HyperCel is an effective polishing step for removing host cell contaminants and provides an excellent
viral removal strategy for short purification schemes (10).
2.10. Boronate Ligands
In 1874, L. Vignon and G. Bouchardat attempted to titrate the boric acid (H3BO3), finding it impossible
unless there was a second compound in solution, such as glycerol in equal concentrations. Other
studies by these scientists and others over the following fifty years have shown that titration of borate
depends on the interaction of covalent bonds with the 1,2-cis-diol group (figure 9) (15).
During the year 50´s and 60´s, two important methods were developed using interaction borate / diol
in the separation of molecules: ion exchange chromatography and zone electrophoresis in borate
buffer. In 70´s, the affinity chromatography using boronate ligands was developed by Gilham and
colleagues, and several immobilized ligands have been developed for use in purification of
carbohydrates, nucleic acids, glycoproteins and other biological molecules (15).
Boron will react chemically under some conditions with virtually any element able to donate electrons.
Its chemistry with nitrogen, carbon, sulphur, phosphorus, and oxygen is particularly rich.But in
aqueous solution, most of boron degrade forming variations of B(OH)3, boric acid. Only a few boron
compounds are stable to this hydrolysis (15).
Boric acid is an unusual Lewis acid. Rather than simply donating a proton to the solution, boric acid
undergoes the reaction (15):
B(OH)3 + 2H2O ↔ B(OH)4- + H3O
+
The earliest and still most widely used boronate ligand is 3-aminophenylboronic acid, which has a pKa
of 8.8 In all applications using immobilized 3-aminophenylboronic acid, the pH should be as high as
reasonably possible, usually above 8.5. But in some cases analytes can lose their biological activities
at such high pH (16) (17).
Although boronate/cis-diol ester formation is the basis for boronate affinity chromatography, secondary
interactions can play an important role. This secondary interactions can been described as follows:
Hydrophobic interactions: Almost all boronate ligands used so far are aromatic boronate ligands,
they have a phenyl ring that gives rise to this interactions. In order to reduce these interactions, the
ionic strength should be low, usually about 50mM (16) (17).
Ionic interactions: the negative charge of the active tetrahedral boronate can cause ionic attraction
or repulsion. To decrease this interaction, the ionic strength should be high, but lower than 500mM to
avoid hydrophobic interactions. A good compromise is between 50 and 500mM (16) (17).

18
Hydrogen bonding: Boronic acid has two hydroxyls, which offer sites for hydrogen bonding.
However, these interactions were usually small, but in some cases hydrogen bonding is an important
factor for chromatography separations (16) (17).
Charge transfer interaction: In trigonal uncharged boronate the boron atom has an empty orbital, it
can serve as an electron receptor for charge transfer interaction. Amines are good electron donors
and when an amine donates a pair of electrons to boron, the boron atom becomes tetrahedral. This
can explain why amines may serve to promote boronate/cis-diol esterification. But, if there is a
hydroxyl group adjacent to the amine, this can block boronate/cis-diol esterification (16) (17).
Figure 9 – The proposed mechanism of esterification between a phenylboronic acid and a cis-diol in aqueous solution.

19
3. Material and Methods
3. Ss
3.1. Materials and biologics
Tris(hydroxylmetrhyl)aminomethane (Tris base) was obtained from Eurobio (Les Ulis, France). Sodium
chloride was obtained from Panreac Quimica Sau (Barcelona, Spain). Sodium phosphate monobasic
anhydrous (NaH2PO4), D-sorbitol, D-mannitol, phosphate buffered saline, and 4-(2-hydroxyethyl)-1-
piperazineethanesulfonic acid (HEPES) was obtained from Sigma-Aldrich (St. Louis, MO, USA). Citric
acid monohydrate and Hydrochloride acid were obtained from Merck (Darmstadt, Gemany). All other
chemicals were of analytical or HPLC grade. Water used in all experiments was obtained from Milli-Q
purification system (Millipore, Bedford, MA, USA).
Human immunoglobulin G (IgG) for therapeutic administration (product name: Gammanorm) was
obtained from Octapharma (Lachen, Switzerland). Human serum albumin (HSA) and insulin were
purchased from Sigma. A CHO clarified cell culture supernatants (cCCS) (37mg IgG/l; 1.1% protein
purity, 2.2% HPLC purity) was used to evaluate the feasibility of the PB resin. A serum-free medium
was used for production and was supplemented with HAS and insulin.
3.2. Chromatographic Study of interactions between IgG and the various
constituents of the column
All chromatography experiments were carried out in AKTA Purifier system from Amersham
Biosciences (Uppsala, Sweden) equipped with a Unicorn 5.1 data acquisition and processing
software. Conductivity, pH, and UV absorbance at 280nm of the outlet stream was continuously
monitored. Two different binding buffers were screened, namely (i) 20mM HEPES, pH 8.5, and (ii)
20mM HEPES with 150mM NaCl, pH 8.5. The elution buffer was 1.5M Tris-HCl, pH 8.5.
Prior to feed injection, the columns were equilibrated with fourteen point three column volumes (CVs)
of adsorption buffer ate a flow rate of 1.0 ml/min. Pure protein samples (500µl, 1 mg IgG/ml, 2 mg
HSA/ml, and 1 mg insulin/ml all prepared in adsorption buffer) were injected at 0.5 ml/min. The sample
loop was emptied with at least three-times its volume. After washing the unbound or weakly retained
molecules with five column volumes of the adsorption buffer at 1 ml/min, bound material was eluted
following a 10 min linear gradient with the elution buffer at 1 ml/min. Flow-through and eluted fractions
were collected on a Frac-950 fraction collector, from Amersham Biosciences and analyzed for IgG
content. The chromatograms obtained with different adsorption buffers were recorded and compared
in terms of peak area and retention time.
The columns CPG, CPG-Aniline, and CPG-aminopropyl were provided by doctoral researcher
Rimenys Carvalho Jr. The CPG-Phenyl Boronate (CPG-APB) (figure 10) and CPG-Protein A (CPG-
PA) were obtained from Millipore (Billerica, MA).

3.3. Chromatography on phenyl boronate resin
All chromatography experiments were carried out in AKTA Pu
Conductivity, pH, and UV absorbance at 280nm of the outlet stream was continuously monitored. Two
different binding buffers and eleven elution buffers were screened to determine the best conditions for
IgG adsorption. The binding buffers tested were: (i) 20mM HEPES, pH 8.5, and (ii) 20mM HEPES with
150mM NaCl, pH 8.5. The tested elution buffers were: (i) 1.5M Tris
100mM Sorbitol pH 8.5, (iii) 50mM Tris
Sorbitol pH 8.5, (v) 50mM Tris-HCl, 100mM Mannitol pH 8.5, (vi) 50mM Tris
8.5, (vii) 50mM Tris-HCl, 250mM Mannitol pH 8.5, (viii) 50mM Tris
pH 8.5, (ix) 50mM Tris-HCl, 200mM Mannito
Sorbitol pH 8.5, (xi) 200mM Tris-HCl, 200mM Mannitol pH 8.5.
Prior to feed injection, columns were equilibrated with fourteen point three column volumes (CVs) of
adsorption buffer ate a flow rate of 1.0 ml/mi
adsorption buffer) and CHO cCCS (2 ml CHO cCCS, 37µg IgG/ml) were injected at 0.5 ml/min. The
sample loop was emptied with at least three
retained molecules with five column volumes of the adsorption buffer, bound material was eluted
following a 5 min linear gradient with the elution buffer. Flow
collected and analyzed for IgG and protein content. The chromatogram
adsorption buffers were recorded and compared in terms of peak area and retention time.
Figure 10- Schematic representation of the
3.4. Chromatography on protein A resin
All chromatography experiments were carried out in AKTA Purifier system as previously described.
Conductivity, pH, and UV absorbance at 280nm of the outlet stream was continuously monitored. Four
different binding buffers and one elution buffer were screened t
adsorption. The binding buffers tested were: (i) 50mM NaH
PBS, pH 7.4; (iii) 20mM HEPES, 150mM NaCl, pH 8.5; and (iv) 50mM Tris
200mM NaCl, pH 8.5. The elution buffer was 0.1 M citric acid, pH 3.0.
Prior to feed injection, columns were equilibrated with fourteen point three column volumes (CVs) of
adsorption buffer ate a flow rate of 1.0 ml/min.
Pure protein samples (2 ml, 1 mg IgG/ml, prepared in adsorption bu
cCCS, 37µg IgG/ml) were injected at 0.5 ml/min. The sample loop was emptied with at least three
times its volume. After washing the unbound or weakly retained molecules with five column volumes of
the adsorption buffer, bound material was eluted following a 10 min linear gradient with the elution
buffer. Flow-through and eluted fractions were collected and analyzed for IgG and protein content. The
Chromatography on phenyl boronate resin
All chromatography experiments were carried out in AKTA Purifier system as previously described.
Conductivity, pH, and UV absorbance at 280nm of the outlet stream was continuously monitored. Two
different binding buffers and eleven elution buffers were screened to determine the best conditions for
buffers tested were: (i) 20mM HEPES, pH 8.5, and (ii) 20mM HEPES with
150mM NaCl, pH 8.5. The tested elution buffers were: (i) 1.5M Tris-HCl, pH 8.5, (ii) 50mM Tris
100mM Sorbitol pH 8.5, (iii) 50mM Tris-HCl, 200mM Sorbitol pH 8.5, (iv) 50mM Tris
HCl, 100mM Mannitol pH 8.5, (vi) 50mM Tris-HCl, 200mM Mannitol pH
HCl, 250mM Mannitol pH 8.5, (viii) 50mM Tris-HCl, 200mM Sorbitol, 200mM NaCl
HCl, 200mM Mannitol, 200mM NaCl pH 8.5, (x) 200mM Tris
HCl, 200mM Mannitol pH 8.5.
Prior to feed injection, columns were equilibrated with fourteen point three column volumes (CVs) of
adsorption buffer ate a flow rate of 1.0 ml/min. Pure protein samples (2 ml, 250 mg IgG/ml, prepared in
adsorption buffer) and CHO cCCS (2 ml CHO cCCS, 37µg IgG/ml) were injected at 0.5 ml/min. The
sample loop was emptied with at least three-times its volume. After washing the unbound or weakly
ed molecules with five column volumes of the adsorption buffer, bound material was eluted
following a 5 min linear gradient with the elution buffer. Flow-through and eluted fractions were
collected and analyzed for IgG and protein content. The chromatograms obtained with different
adsorption buffers were recorded and compared in terms of peak area and retention time.
Schematic representation of the CPG-aminophenyl boronate resin
Chromatography on protein A resin
chromatography experiments were carried out in AKTA Purifier system as previously described.
Conductivity, pH, and UV absorbance at 280nm of the outlet stream was continuously monitored. Four
different binding buffers and one elution buffer were screened to determine the best conditions for IgG
buffers tested were: (i) 50mM NaH2PO4, 150mM NaCl, pH 7.4; (ii) 0.01M
PBS, pH 7.4; (iii) 20mM HEPES, 150mM NaCl, pH 8.5; and (iv) 50mM Tris-HCl, 200mM Sorbitol,
buffer was 0.1 M citric acid, pH 3.0.
Prior to feed injection, columns were equilibrated with fourteen point three column volumes (CVs) of
adsorption buffer ate a flow rate of 1.0 ml/min.
Pure protein samples (2 ml, 1 mg IgG/ml, prepared in adsorption buffer and CHO cCCS (2 ml CHO
cCCS, 37µg IgG/ml) were injected at 0.5 ml/min. The sample loop was emptied with at least three
times its volume. After washing the unbound or weakly retained molecules with five column volumes of
terial was eluted following a 10 min linear gradient with the elution
through and eluted fractions were collected and analyzed for IgG and protein content. The
20
rifier system as previously described.
Conductivity, pH, and UV absorbance at 280nm of the outlet stream was continuously monitored. Two
different binding buffers and eleven elution buffers were screened to determine the best conditions for
buffers tested were: (i) 20mM HEPES, pH 8.5, and (ii) 20mM HEPES with
HCl, pH 8.5, (ii) 50mM Tris-HCl,
0mM Tris-HCl, 250mM
HCl, 200mM Mannitol pH
HCl, 200mM Sorbitol, 200mM NaCl
l, 200mM NaCl pH 8.5, (x) 200mM Tris-HCl, 200mM
Prior to feed injection, columns were equilibrated with fourteen point three column volumes (CVs) of
n. Pure protein samples (2 ml, 250 mg IgG/ml, prepared in
adsorption buffer) and CHO cCCS (2 ml CHO cCCS, 37µg IgG/ml) were injected at 0.5 ml/min. The
times its volume. After washing the unbound or weakly
ed molecules with five column volumes of the adsorption buffer, bound material was eluted
through and eluted fractions were
s obtained with different
adsorption buffers were recorded and compared in terms of peak area and retention time.
chromatography experiments were carried out in AKTA Purifier system as previously described.
Conductivity, pH, and UV absorbance at 280nm of the outlet stream was continuously monitored. Four
o determine the best conditions for IgG
, 150mM NaCl, pH 7.4; (ii) 0.01M
HCl, 200mM Sorbitol,
Prior to feed injection, columns were equilibrated with fourteen point three column volumes (CVs) of
ffer and CHO cCCS (2 ml CHO
cCCS, 37µg IgG/ml) were injected at 0.5 ml/min. The sample loop was emptied with at least three-
times its volume. After washing the unbound or weakly retained molecules with five column volumes of
terial was eluted following a 10 min linear gradient with the elution
through and eluted fractions were collected and analyzed for IgG and protein content. The

21
chromatograms obtained with different adsorption buffers were recorded and compared in terms of
peak area and retention time.
3.5. Purification of IgG in CHO cells
A 2-step purification process was evaluated for the purification of IgG from the CHO cCCS, using in
first step the CPG-APB chromatography and in the second step CPG-PA (protein A) chromatography.
All chromatographic experiments were carried out in AKTA Purifier as described before. Conductivity,
pH, and UV absorbance at 280nm of the outlet stream was continuously monitored. For the CPG-APB
chromatography the binding buffer used was 20mM HEPES with 150mM NaCl pH 8.5, and the elution
buffer was 50mM Tris-HCl, 200mM Sorbitol, 200mM NaCl pH 8.5. For the CPG-PA chromatography
the binding buffer used was 0.01 M PBS, pH 7.4, and the elution buffer was 0.1 M citric acid pH 3.0.
Prior to feed injection, columns were equilibrated with fourteen point three column volumes (CVs) of
adsorption buffer ate a flow rate of 1.0 ml/min.
CHO cCCS were injected at 0.5 ml/min first in column CPG-APB (2 ml CHO cCCS, 37µg IgG/ml).
Flow-through and eluted fractions were collected and the pool of the eluted fractions containing IgG
was injected in column CPG-PA (500 µl PB eluted pool, 28.96 mg IgG/ml). As always, the sample loop
was emptied with at least three-times its volume. After washing the unbound or weakly retained
molecules with five column volumes of the adsorption buffer, bound material was eluted following a 10
min linear gradient with the elution buffer.. The chromatograms obtained with different adsorption
buffers were recorded and compared in terms of peak area and retention time. The fractions both
columns were analyzed for the IgG and protein content.
3.6. IgG quantification
The concentration of IgG was determined by analitycal protein A chromatograph using a PA
ImmunoDetection sensor cartridge from Applied Biosystems (Foster City, CA, USA) as described in
(18). In the initial experiments the binding buffer was composed by 10mM phosphate, 150mM NaCl
pH 7.4, and the elution buffer was composed by 12mM HCl, 150mM NaCl pH 2-3. In further
experiments the binding buffer was changed to 50mM NaH2PO4, 150mM NaCl pH 7,4. Samples were
previously diluted four times with binding buffer.
3.7. Protein gel electrophoresis
Sodium dodecyl sulfate-polyacrylamide gel electrophoresis (SDS-PAGE) was performed to evaluate
the fractions purity collected from the purification experiments. The buffer sample composition was
62.5mM Tris-HCl, pH 6.2, 2% SDS, 0.01% bromophenol blue, 10% glycerol and 0.1 M DTT. All
samples collected were diluted prior to denaturation at 100ºC for 10 min. Samples were applied in a
12% acrylamide gel, prepared from a 40% acrylamide/bis stock solution (29:1) from Bio-Rad
(Hercules, CA, USA), and ran at 90mV using a running buffer that contained 192mM glycine, 25mM
Tris, and 0.1% SDS, pH 8.3. Gels were firstly stained with Coomassie Brilliant Blue for 1h, and then
destained in a solution of 30% of ethanol and 10% of acetic acid for one more hour. Repeat the last
step one more time.

22
3.8. Protein Quantification
The quantification of total protein in CHO cells and in the samples collected in the AKTA Purifier was
performed with the Bradford method using a Coomassie assay reagent provided by Pierce (Rockford,
IL, USA). The protein standard used was bovine serum albumin (BSA). Absorbance was measured at
595 nm in a microplate reader from Molecular Devices (Sunnyvale, CA, USA). Protein purity was
determined by dividing the concentration of IgG determined by Protein A HPLC by the concentration of
total protein determined using the Bradford method.

23
4. Results and Discussion
4. A
4.1. Chromatographic Study of interactions between IgG and the various
constituents of the column
In order to use phenyl boronate as an alternative capture step to protein A affinity chromatography in
the purification process of monoclonal antibodies, it is necessary to test the affinity of typical protein
impurities that are typically present in cell culture supernatants. Towards the new ligand, aminophenyl
boronic acid.
Initially tests were performed only with three typical protein components found in the cell culture
supernatant, the insulin, antibody (IgG) and human serum albumin (HSA). A mock/control run will also
be performed in order the see the changes input in the chromatogram baselines due to both
adsorption and elution buffers. Four types of columns (CPG, CPG-aminopropyl, CPG-Aniline, and
CPG phenyl boronate) were used to understand the binding of the proteins to the different groups of
the resin. In each of these columns, the solutions are injected with two different adsorption buffers, 20
mM HEPES, pH 8.5 and 20 mM HEPES, 150 mM NaCl, pH 8.5 and only one elution buffer, 1.5 M
Tris-HCl, pH 8.5. The following results were obtained by processing data through the program
UNICORN 5.1. The chromatograms represented below were subtracted by the control run, canceling
any interference of the buffer constituents.
4.1.1. Binding buffer: 20mM HEPES, pH 8.5
Figure 11 - Graphic representation of the absorbance of each solution (Insulin, IgG and HSA) as a function of volume, with retention times of each peak and their names. Using the CPG column and binding buffer 20mM
HEPES pH 8.5 and elution buffer 1.5M Tris pH 8.5. The blue line represents the injection of insulin solution, the red line injection of IgG and the green line injection of HSA.
According to figure 11 we can see that the chromatograms of insulin and HSA exhibit only one peak
located in the flow-through of the column, showing that there is no affinity between these proteins and
-50
0
50
100
150
200
250
300
350
mAU
0.0 2.0 4.0 6.0 8.0 10.0 12.0 ml
Insulina
HSA
IgG

24
the stationary phase. The chromatogram of IgG, however, reveals two peaks, one in the flow-through
and another in the elution, showing that there is a considerable affinity towards the CPG matrix. This
result can be explained by the isoelectric point (pI) of each compound. When a protein is at pH below
its pI, it has an overall positive charge; on the other hand, when the pH is above pI, the molecule has
an overall negative charge (19). The stationary phase (CPG) is rich in silanol groups that bear a
negative charge at the working pH (Si-OH � Si-O- + H
+ pKa = 6.7); both insulin (pI = 5.3) (19) and
HSA (pI = 4.9) (20) are negatively charged at pH 8.5 and so do not adsorbed to the CPG. However,
since the IgG has a pI about 9, close to the working pH, and therefore most clones will be positively
charged, and will adsorbed to the CPG, while more acidic clones will be negatively charged and will
not bind.
Figure 12 - Graphic representation of the absorbance of each solution (Insulin, IgG and HSA) as a function of volume, with retention times of each peak and their names. Using the CPG - Aniline column and binding buffer
20mM HEPES pH 8.5 and elution buffer 1.5M Tris pH 8.5. The blue line represents the injection of insulin solution, the red line injection of IgG and the green line injection of HSA.
The chromatogram of Figure 12 represents the elution of samples in the column CPG-Aniline has the
same profile of the chromatogram of Figure 11. In this type of resin however the most important
interactions are of hydrophobic nature. IgG has been reported to be more hydrophobic than albumin
and thus has the most affinity towards the resin. However, due to the low ionic strength of the
adsorption buffer, hydrophobic interactions are not properly promoted. Probably the interactions occur
with free silanol groups that were not modified by aniline.
-300
-200
-100
0
100
200
300
mAU
0.0 2.0 4.0 6.0 8.0 10.0 12.0 ml
Insulina
HSA
IgG

25
Figure 13 - Graphic representation of the absorbance of each solution (Insulin, IgG and HSA) as a function of volume, with retention times of each peak and their names. Using the CPG - Aminopropyl column and binding
buffer 20mM HEPES pH 8.5 and elution buffer 1.5M Tris pH 8.5. The blue line represents the injection of insulin solution, the red line injection of IgG and the green line injection of HSA.
The column CPG-aminopropyl bears a positive charge after a 3-carbon arm. With this positive charge
on the stationary phase, as can be seen in figure 13, insulin (pI = 5.3) and HSA (pI = 4.9) at pH 8.5
exhibit negative charge and can absorb to the column matrix, with different affinities. Since the IgG
has a pI of about 9, it is therefore near to the pH of the buffer and the fraction that is negative will bind,
while the other part that is positive, will not bind. Interactions with the silanol groups may still occur.
Figure 14 - Graphic representation of the absorbance of each solution (Insulin, IgG and HSA) as a function of volume, with retention times of each peak and their names. Using the CPG-APB column and binding buffer 20mM
HEPES pH 8.5 and elution buffer 1.5M Tris pH 8.5. The blue line represents the injection of insulin solution, the red line injection of IgG and the green line injection of HSA.
Figure 14 shows the chromatograms obtained for the phenyl boronate column, which exhibits a similar
profile as the ones shown in Figure 11 and 12. The biggest difference here is that all IgG bound to the
0
50
100
150
200
250
mAU
0.0 2.0 4.0 6.0 8.0 10.0 12.0 ml
Insulina
HSA
IgG
0
100
200
300
400
mAU
0.0 2.0 4.0 6.0 8.0 10.0 12.0 ml
Insulina
HSA
IgG

26
column due to the high affinity of IgG for the phenyl boronate. Binding of insulin and albumin is
negligible.
4.1.2. Binding Buffer: 20mM HEPES, 150mM NaCl, pH 8.5
The chromatographic runs shown in the previous section (4.1.1) were repeated but the adsorption
buffer was supplemented with 150 mM NaCl in order to avoid the presence of electrostatic
interactions. The chromatograms obtained for the CPG, CPG-aminopropyl and CPG-aniline (Figures
15, 16, 17) are now quite different with most of the proteins coming up in the flow-through. This shows
that electrostatic interactions were in the base of the adsorptions seen previously. The only column
that maintained its profile was the CPG-APB, which corroborates that there is a specific interaction
between IgG and the ligand, phenyl boronate.
Figure 15 - Graphic representation of the absorbance of each solution (Insulin, IgG and HSA) as a function of
volume, with retention times of each peak and their names. Using the CPG column and binding buffer 20mM
HEPES with 150mM NaCl pH 8.5 and elution buffer 1.5M Tris pH 8.5. The blue line represents the injection of IgG
solution, the red line injection of insulin and the green line injection of HSA. The huge peak of insulin is probably
due to a air bubble
0
1000
2000
3000
4000
mAU
0.0 2.0 4.0 6.0 8.0 10.0 12.0 ml
Insulina
HSA
IgG

27
Figure 16 - Graphic representation of the absorbance of each solution (Insulin, IgG and HSA) as a function of volume, with retention times of each peak and their names. Using the CPG – Aniline column and binding buffer
20mM HEPES with 150mM NaCl pH 8.5 and elution buffer 1.5M Tris pH 8.5. The blue line represents the injection of IgG solution, the red line injection of HSA and the green line injection of insulin. The huge peak of
albumin is probably due air trapped in the column or UV detector.
-2000
-1000
0
1000
2000
3000
4000
mAU
0.0 2.0 4.0 6.0 8.0 10.0 12.0 ml
Insulina
IgG
HSA

28
Figure 17 - Graphic representation of the absorbance of each solution (Insulin, IgG and HSA) as a function of volume, with retention times of each peak and their names. Using the CPG - Aminopropyl column and binding
buffer 20mM HEPES with 150mM NaCl pH 8.5 and elution buffer 1.5M Tris pH 8.5. The blue line represents the injection of IgG solution, the red line injection of HSA and the green line injection of insulin.
Figure 18 - Graphic representation of the absorbance of each solution (Insulin, IgG and HSA) as a function of volume, with retention times of each peak and their names. Using the CPG-APB column and binding buffer 20mM HEPES with 150mM NaCl pH 8.5 and elution buffer 1.5M Tris pH 8.5. The blue line represents the injection of IgG
solution, the red line injection of HSA and the green line injection of insulin.
0
500
1000
1500
2000
2500
mAU
0.0 2.0 4.0 6.0 8.0 10.0 12.0 ml
HSA
Insulina
IgG
0
200
400
600
800
1000
mAU
0.0 2.0 4.0 6.0 8.0 10.0 12.0 ml
HSA
Insulina
IgG

29
Next table present a summary of the recovery of IgG (quantified by analytical Protein A HPLC) for
each column.
Table 1 - Table of % recovery of IgG in all four columns, in Flow-through and elution steps. With two different binding buffer.
% Recovery of IgG
Column 20mM HEPES pH 8.5 20mM HEPES with 150mM NaCl pH 8.5
Flow-through Elution Flow-through Elution
CPG 16.6 72.2 65.0 15.7
CPG-Aniline 23.1 67.2 82.0 7.0
CPG-aminopropyl 30.5 49.6 91.6 1.8
CPG-APB 0 93.7 0 94.0
The recovery of IgG is different comparing the different columns and the two binding buffers. When
the binding buffer was supplemented with NaCl (20 mM HEPES, 150mM NaCl, pH 8.5) the recovery
of IgG in flow-through increased with a concomitant decrease in the elution step, for the three first
columns. These results show that the NaCl eliminates the non-specific binding of IgG to the
constitutes of the column CPG-APB. In this column the recovery is the same in both binding buffers,
showing that the NaCl does not influence the affinity of IgG towards the APB lingand.
These results thus suggest that 20mM HEPES with 150mM NaCl at pH 8.5 is the best binding buffer,
because it eliminates the unspecific binding of the IgG to the column.
4.2. Chromatography on phenyl boronate resin
The next step of this thesis was to evaluate different elution buffers for CPG-APB column, in order to
find an alternative to the 1.5 M Tris-HCl buffer at pH 8.5, which is too concentrated and too expensive
for the downstream process. The tested elution buffers were: (i) 1.5 M Tris-HCl, pH 8.5, (ii) 50 mM
Tris-HCl, 100 mM Sorbitol, pH 8.5, (iii) 50 mM Tris-HCl, 200 mM Sorbitol, pH 8.5, (iv) 50 mM Tris-HCl,
250 mM Sorbitol pH 8.5, (v) 50 mM Tris-HCl, 100 mM Mannitol pH 8.5, (vi) 50 mM Tris-HCl, 200 mM
Mannitol pH 8.5, (vii) 50 mM Tris-HCl, 250 mM Mannitol pH 8.5, (viii) 50 mM Tris-HCl, 200 mM
Sorbitol, 200 mM NaCl pH 8.5, (ix) 50 mM Tris-HCl, 200 mM Mannitol, 200 mM NaCl pH 8.5, (x) 200
mM Tris-HCl, 200 mM Sorbitol pH 8.5, (xi) 200 mM Tris-HCl, 200mM Mannitol pH 8.5.
Table 2 - Table of % recovery of IgG in CPG-APB column, in Flow-through and elution steps. With two different binding buffer, and 1.5 M Tris-HCl at pH 8.5 elution buffer.
% Recovery of IgG in CHO cells
20 mM HEPES pH 8.5 20 mM HEPES, 150 mM NaCl,
pH 8.5
Flow-through Elution Flow-through Elution
CPG-APB 25 75.8 51.9 48.3

30
Table 2 shows the experiment conducted to test the best binding buffer to use. These results were
very different comparing to the article (21).
Table 3 - Table of % recovery of IgG in CPG-APB column, in Flow-through and elution steps. With 20 mM HEPES, 150 mM NaCl at pH 8.5 binding buffer, and six elution buffer.
% Recovery of IgG from CHO cell supernatant
Elution Buffer Flow-through Elution
50 mM Tris-HCl, 100 mM Sorbitol pH 8.5 21.9 6.5
50 mM Tris-HCl, 200 mM Sorbitol pH 8.5 14.9 4.0
50 mM Tris-HCl, 250 mM Sorbitol pH 8.5 12.5 4.6
50 mM Tris-HCl, 100 mM Mannitol pH 8.5 82.2 9.7
50 mM Tris-HCl, 200 mM Mannitol pH 8.5 153.3 15.3
50 mM Tris-HCl, 250 mM Mannitol pH 8.5 55.5 7.8
The first tests were carried out with 20 mM HEPES, 150 mM NaCl binding buffer at pH 8.5 and elution
buffers (ii) to (vii), i.e., 50 mM Tris-HCl supplemented with increasing concentrations of sorbitol and
mannitol (from 100 to 250 mM, in both cases).It would be expected a high recovery of IgG in the
elution step, with only a residual percentage in flow-through. This was however not the case, as
shown in table 3, as the percentage of recovery of IgG for all the tested elution buffers did not reach
16%. In the case of sorbitol, the amount recovered in the flow-through was low, leading us to believe
that a large part of the antibody remained bounded to the CPG-APB resin. And thus that the elution
buffer did not have enough strength to break the binding of IgG to the ligand. One possible solution is
to increase the concentration of Tris-HCl.
The results obtained with the elution buffer containing mannitol were even stranger as most of the IgG
was found in flow-through. This is probably due to the fact that the column was saturated with IgG, as
all previous runs were run consecutively, and most of the IgG loaded in the column was not eluting (in
the runs with elution buffers containing sorbitol).
These results have shown that 50 mM Tris-HCl does not has the required strength to elute bound IgG
even when supplemented with up to 250 mM of competitive diols (sorbitol and mannitol). In the next
set of experiments, elutions buffers containing a higher concentration of Tris (200 mM) were
evaluated.

31
Table 4 - Table of % recovery of IgG in CPG-APB column, in Flow-through and elution steps. With 20 mM HEPES, 150 mM NaCl at pH 8.5 binding buffer, and four elution buffer (initial protein A chromatography
conditions).
% Recovery of IgG from CHO cell supernatant
Elution Buffer Flow-
through
Elution
Tested Buffer 1.5M Tris-HCl pH 8.5
200 mM Tris-HCl, 200 mM Sorbitol pH 8.5 55.1 4.0 78.3
200 mM Tris-HCl, 200 mM Mannitol pH 8.5 7.2 70.9 14.0
50 mM Tris-HCl, 200 mM Sorbitol, 200 mM NaCl
pH 8.5 214.9 63.3
5.4
50 mM Tris-HCl, 200 mM Mannitol, 200 mM NaCl
pH 8.5 178.6 19.3
26.0
The elution buffers (viii) to (xi) were then studied, and to avoid column saturation, as in previous
experience, after elution with the buffer under studied, a second elution step is performed with 1.5 M
Tris-HCl at pH 8.5, to ensure that all IgG is eluted. Elutions buffers supplemented with NaCl were also
tested to prevent non-specific binding to the resin.
According to the data present in table 4, the results were still inconsistent, with recoveries of IgG over
100%. These results may be due to problems in the quantification of IgG by protein A HPLC due to the
very low concentrations of IgG. To overcome this limitation some changes were made in the standard
method, namely: (i) the concentrations of IgG used to obtain a calibration line were reduced from 250
to 10 mg/ml, to 12 to 0.2mg/ml, since the concentration of antibody in the CHO cCCS is in the later
range; (ii) the wavelength was decreased from 280 to 215 nm in order to have peaks with higher
heights and areas, and thus more sensitivity; however at 215 nm there is more interference from other
compounds; (iii) the static mixer in the AKTA purifier was changed to one with a lower volume
chamber, in order to enhance the mixing of the mobile phases, and finally (iv) the phosphate
concentration in the binding buffer was increased from 10 to 50 mM NaH2PO4. The previous
experiment was then repeated using the same four elution buffers, and using both binding buffers
under study.
Table 5 - Table of % recovery of IgG in CPG-APB column, in Flow-through and elution steps. With 20mM HEPES at pH 8.5 binding buffer, and four elution buffer.
% Recovery of IgG from CHO cell supernatant
Elution Buffer Flow-
through
Elution
Tested Buffer 1.5M Tris-HCl pH 8.5
200 mM Tris-HCl, 200 mM Sorbitol pH 8.5 25.1 13.8 62.8
200 mM Tris-HCl, 200 mM Mannitol pH 8.5 25.4 13.0 70.5
50 mM Tris-HCl, 200 mM Sorbitol, 200 mM
NaCl pH 8.5 25.1 88.3 7.0
50 mM Tris-HCl, 200 mM Mannitol, 200 mM
NaCl pH 8.5 25.1 25.0 36.9

32
Table 6 - Table of % recovery of IgG in CPG-APB column, in Flow-through and elution steps. With 20mM HEPES, 150mM NaCl at pH 8.5 as binding buffer, and four elution buffer.
% Recovery of IgG from CHO cell supernatant
Elution Buffer Flow-
through
Elution
Tested Buffer 1.5M Tris-HCl pH 8.5
200 mM Tris-HCl, 200 mM Sorbitol pH 8.5 33.0 18.4 111.2
200 mM Tris-HCl, 200 mM Mannitol pH 8.5 31.0 13.6 97.0
50 mM Tris-HCl, 200 mM Sorbitol, 200 mM
NaCl pH 8.5 33.8 93.3 7.7
50 mM Tris-HCl, 200 mM Mannitol, 200 mM
NaCl pH 8.5 30.8 29.4 47.7
The results obtained for the two binding buffers (table 5 and 6) were very similar. The elution buffer
composed by 50 mM Tris-HCl, 200 mM NaCl, 200 mM sorbitol, pH 8.5 originated the highest
percentage of IgG recovery of 88% for the 20 mM HEPES, pH 8.5 binding buffer and 93% for the 20
mM HEPES, 150mM NaCl, pH 8.5 binding buffer. These results have lead to select this elution buffer
for further purification studies of IgG.
Nevertheless, some results remain inconsistent, with an overall yield (flow-through, and two steps of
elution) greater than 100%, this is mainly due to recovery percentage in flow-through that is very high
and only a residual percentage should appear in this phase. This can be explained with the all
components that are in the sample that can be affecting the binding to the protein A column. To
confirm these results and to evaluate the purity of the different pool of fractions, a protein gel
electrophoresis (SDS-PAGE) was run.
The protein gel represented in figure 19 shows the compositions of the fractions collected during the
runs performed using 20 mM HEPES, pH 8.5, as adsorption buffer, namely the MW marker, the CHO
cCCS, the bands corresponding to the flow-through (FT), the first elution (E1) buffer (i.e. using the
buffer understudy) and the second elution (E2) (with 1.5M Tris-HCl pH 8.5), respectively for the
elutions buffers 200 mM Tris-HCl, 200 mM sorbitol, pH 8.5 and 200 mM Tris-HCl, 200 mM mannitol,
pH 8.5.

Figure 19 – Silver stained SDS-PAGE of the different fractions collected during purification of IgG from CHO cell supernatant by PB chromatography using HEPES at pH 8.5 as adsorption buffer. Lanes ID: 1, molecular weight standards (from bottom to top: 10, 15, 20, 25, 37, 50, fraction of the run with 200 mM Tris-HCl, 200 mM Sorbitol at pH 8.5 elution buffer; 4, E1 fraction of the run with 200 mM Tris-HCl, 200 mM Sorbitol at pH 8.5 elution buffer; 5, E2 fraction of the rumM Sorbitol at pH 8.5 elution buffer; 6, FT fraction of the run with 200 mM Triselution buffer; 7, E1 fraction of the run with 200 mM Tris
fraction of the run with 200 mM Tris
Figure 20 - Silver stained SDS-PAGE of the different fractions collected during purification of supernatant by PB chromatography using HEPES at pH 8.5 as adsorption buffer
with 150 mM NaCl at pH 8.5 in the samples 8 to 1010, 15, 20, 25, 37, 50, 75, 100, 150, and 200kDa); 2,
200 mM NaCl at pH 8.5 elution buffer; 3NaCl at pH 8.5 elution buffer; 4, E2 fraction of the run with 508.5 elution buffer; 5, FT fraction of the run with 50buffer; 6, E1 fraction of the run with 50
E2 fraction of the run with 50 mM Tris-HCl,of the run with 200 mM Tris-HCl, 200 mM Sorbitol at pH 8.5 elution buffer; 9,
Tris-HCl, 200 mM Sorbitol at pH 8.5 elution buff
PAGE of the different fractions collected during purification of IgG from CHO cell supernatant by PB chromatography using HEPES at pH 8.5 as adsorption buffer. Lanes ID: 1, molecular weight standards (from bottom to top: 10, 15, 20, 25, 37, 50, 75, 100, 150, and 200kDa); 2, CHO cell supernatant; 3, FT
HCl, 200 mM Sorbitol at pH 8.5 elution buffer; 4, E1 fraction of the run with HCl, 200 mM Sorbitol at pH 8.5 elution buffer; 5, E2 fraction of the run with 200 mM Tris
mM Sorbitol at pH 8.5 elution buffer; 6, FT fraction of the run with 200 mM Tris-HCl, 200 mM Mannitol at pH 8.5 elution buffer; 7, E1 fraction of the run with 200 mM Tris-HCl, 200 mM Mannitol at pH 8.5 elution buffer; 8, E2
tion of the run with 200 mM Tris-HCl, 200 mM Mannitol at pH 8.5 elution buffer.
PAGE of the different fractions collected during purification of IgG from CHO cell using HEPES at pH 8.5 as adsorption buffer in samples 2 to 7, and HEPES
NaCl at pH 8.5 in the samples 8 to 10. Lanes ID: 1, molecular weight standards (from bottom to top: 10, 15, 20, 25, 37, 50, 75, 100, 150, and 200kDa); 2, FT fraction of the run with 50 mM Tris-HCl, 200
mM NaCl at pH 8.5 elution buffer; 3, E1 fraction of the run with 50 mM Tris-HCl, 200 mM Sorbitolfraction of the run with 50 mM Tris-HCl, 200 mM Sorbitol, 200
fraction of the run with 50 mM Tris-HCl, 200 mM Mannitol, 200 mM NaCl at pH 8.5 mM Tris-HCl, 200 mM Mannitol, 200 mM NaCl at pH 8.5 e
HCl, 200 mM Mannitol, 200 mM NaCl at pH 8.5 elution buffer;mM Sorbitol at pH 8.5 elution buffer; 9, E1 fraction of the run with 20
mM Sorbitol at pH 8.5 elution buffer; 10, E2 fraction of the run with 200 mM Tris-Sorbitol at pH 8.5 elution buffer.
33
PAGE of the different fractions collected during purification of IgG from CHO cell supernatant by PB chromatography using HEPES at pH 8.5 as adsorption buffer. Lanes ID: 1, molecular weight
75, 100, 150, and 200kDa); 2, CHO cell supernatant; 3, FT HCl, 200 mM Sorbitol at pH 8.5 elution buffer; 4, E1 fraction of the run with
n with 200 mM Tris-HCl, 200 HCl, 200 mM Mannitol at pH 8.5
HCl, 200 mM Mannitol at pH 8.5 elution buffer; 8, E2 HCl, 200 mM Mannitol at pH 8.5 elution buffer.
IgG from CHO cell n samples 2 to 7, and HEPES
. Lanes ID: 1, molecular weight standards (from bottom to top: 200 mM Sorbitol,
mM Sorbitol, 200 mM 200 mM NaCl at pH
mM NaCl at pH 8.5 elution mM NaCl at pH 8.5 elution buffer; 7,
mM NaCl at pH 8.5 elution buffer; 8, FT fraction E1 fraction of the run with 200 mM
-HCl, 200 mM

The gel represented in figure 20 contain
bands correspond to the flow-through, and
8.5) obtained with the elution buffers
mM Tris-HCl, 200 mM mannitol, 200 mM
8.5, and 200 mM Tris-HCl, 200 mM
the binding buffer.
Figure 21 – Silver stained SDS-PAGE of the different fractions collected during purification of IgG from CHO cell supernatant by PB chromatography using HEPES withstandards (from bottom to top: 10, 15, 20, 25, 37, 50, 75, 100, 150, and 200kDa); 2,
200 mM Tris-HCl, 200 mM Mannitol at pH 8.5 elution buffer;mM Mannitol at pH 8.5 elution buffer; 4,
elution buffer; 5, FT fraction of the run with 50buffer; 6, E1 fraction of the run with 50
E2 fraction of the run with 50 mM Tris-HClof the run with 50 mM Tris-HCl, 200 mM Mannitolwith 50 mM Tris-HCl, 200 mM Mannitol
mM Tris-HCl, 200
The figure 21 is represented a gel
remaining bands correspond to the
Tris-HCl pH 8.5), corresponding to the elution buffers
mM Tris-HCl, 200 mM Sorbitol, 200
NaCl at pH 8.5, with 20 mM HEPES
According to the SDS-PAGE analysis performed (Figures 19
show any of the bands corresponding to the antibody
corresponding to albumin and to some host cell proteins
obtained in the quantification of antibody does not correspond to the antibody, but can correspond to
other interfering components that can be
The CHO cCCS has several bands correspondin
corresponding to the antibody and several minor bands corresponding to host cell proteins
Using 20 mM HEPES ate pH 8.5 as the adsorption buffer
of the first elution (elution buffer understudy
mannitol, the antibody bands are not present. One can easily identify the albumin band, an impurity
contains the bands respectively of the MW marker, and
through, and the two elution fractions (test buffer and 1.5
the elution buffers 50 mM Tris-HCl, 200 mM sorbitol, 200 mM NaCl, pH
200 mM NaCl, pH 8.5, with the binding buffer 20 mM
200 mM sorbitol, pH 8.5, with 20 mM HEPES, 150 mM NaCl
PAGE of the different fractions collected during purification of IgG from CHO cell chromatography using HEPES with150 mM NaCl at pH 8.5. Lanes ID: 1, molecular weight
standards (from bottom to top: 10, 15, 20, 25, 37, 50, 75, 100, 150, and 200kDa); 2, FT fraction of the run with mM Mannitol at pH 8.5 elution buffer; 3, E1 fraction of the run with 200 mM Tris
mM Mannitol at pH 8.5 elution buffer; 4, E2 fraction of the run with 200 mM Tris-HCl, 200 mM Mannitol at pH 8.5 fraction of the run with 50 mM Tris-HCl, 200 mM Sorbitol, 200 mM NaCl at pH 8.5 elution
fraction of the run with 50 mM Tris-HCl, 200 mM Sorbitol, 200 mM NaCl at pH 8.5 elution buffer; 7, HCl, 200 mM Sorbitol, 200 mM NaCl at pH 8.5 elution buffer; 8,
mM Mannitol, 200 mM NaCl at pH 8.5 elution buffer; 9, E1 fraction of the run mM Mannitol, 200 mM NaCl at pH 8.5 elution buffer; 10, E2 fraction of the run with 50
mM Mannitol, 200 mM NaCl at pH 8.5 elution buffer.
gel containing the bands respectively to the molecular marker
correspond to the flow-through, and the two elution fractions (test buffer
ng to the elution buffers 200 mM Tris-HCl, 200 mM Manitol
200 mM NaCl, pH 8.5, and 50 mM Tris-HCl, 200 mM Manitol
HEPES, 150 mM NaCl, pH 8.5 as binding buffer.
E analysis performed (Figures 19-21), the flow-through fractions
bands corresponding to the antibody (50 and 25kDa), showing generally
and to some host cell proteins. Thus one can conclude that t
obtained in the quantification of antibody does not correspond to the antibody, but can correspond to
can be in the sample that is being analysed at 215nm wavelength.
several bands corresponding to albumin (more intense band), the
and several minor bands corresponding to host cell proteins
as the adsorption buffer (Figure 19), one can see that in
understudy) using either 200 mM Tris-HCl and 200 mM sorbitol or
the antibody bands are not present. One can easily identify the albumin band, an impurity
34
and the remaining
M Tris-HCl, pH
pH 8.5, then 50
20 mM HEPES at pH
, 150 mM NaCl at pH 8.5 as
PAGE of the different fractions collected during purification of IgG from CHO cell NaCl at pH 8.5. Lanes ID: 1, molecular weight
fraction of the run with mM Tris-HCl, 200
mM Mannitol at pH 8.5 at pH 8.5 elution
mM NaCl at pH 8.5 elution buffer; 7, mM NaCl at pH 8.5 elution buffer; 8, FT fraction
fraction of the run fraction of the run with 50
molecular marker, the
buffer and 1.5 M
mM Manitol, pH 8.5, 50
mM Manitol, 200mM
fractions do not
generally the band
conclude that the recovery
obtained in the quantification of antibody does not correspond to the antibody, but can correspond to
at 215nm wavelength.
albumin (more intense band), the two bands
and several minor bands corresponding to host cell proteins
can see that in the samples
HCl and 200 mM sorbitol or
the antibody bands are not present. One can easily identify the albumin band, an impurity

35
with a molecular weight slightly lower than the antibody heavy chain and an impurity with the same
molecular weight of the light chain. In the second elution, with 1.5 M Tris-HCl at pH 8.5, it is only
present the two bands corresponding to the antibody, showing that the tested elution buffers were not
strong enough to break the antibody binding to the resin CPG-APB. Adding NaCl to the elution buffers,
allowed the elution of the antibody using 50 mM Tris-HCl, 200 mM sorbitol and 200 mM NaCl
(although the light chain is not visible, in any lane). Interesting, the use of mannitol instead of sorbitol
was not that efficient as the heavy chain light is still visible during the elution with 1.5 M Tris-HCl. The
analyses are in accordance with the recovery yields obtained.
Using 20 mM Tris-HCl at pH 8.5 as the adsorption buffer, the protein profile of the samples analysed
are also in agreement with the quantification with protein A HPLC. In the absence of NaCl, the bands
of IgG are detected only in the second elution. However, in the presence of NaCl and sorbitol, the
antibody bands are detected in the first elution step. Using mannitol instead of sorbitol, does not allow
the same recovery, with the antibody bands only visible during the second elution step.
The protein content was also analyzed by the Bradford method, and used to calculate the purity of the
antibody in the different samples. It was observed that the samples from the flow-through fractions had
a considerable higher amount of protein content than the elution fractions.
Table 7 - Table of protein purity of IgG, in Flow-through and elution steps after purification from a CHO cell supernatant using CPG-APB column. With 20mM HEPES at pH 8.5 binding buffer, and four elution buffer.
% protein purity in CHO cells
Elution Buffer Flow-
through
Elution
Tested Buffer 1.5 M Tris-HCl pH 8.5
200 mM Tris-HCl, 200 mM Sorbitol pH 8.5 0.29 0.47 58.86
200 mM Tris-HCl, 200 mM Mannitol pH 8.5 0.90 0.49 74.35
50 mM Tris-HCl, 200 mM Sorbitol, 200 mM
NaCl pH 8.5 0.30 11.36 2.46
50 mM Tris-HCl, 200 mM Mannitol, 200 mM
NaCl pH 8.5 1.11 3.98 37.10
Table 8 - Table of protein purity of IgG, in Flow-through and elution steps after purification from a CHO cell supernatant using CPG-APB column. With 20mM HEPES with 150 mM at pH 8.5 binding buffer, and four elution
buffer.
% protein purity in CHO cells
Elution Buffer Flow-
through
Elution
Tested Buffer 1.5 M Tris-HCl pH 8.5
200 mM Tris-HCl, 200 mM Sorbitol pH 8.5 0.36 11.02 124.26
200 mM Tris-HCl, 200 mM Mannitol pH 8.5 1.46 0.48 95.59
50 mM Tris-HCl, 200 mM Sorbitol, 200 mM
NaCl pH 8.5 0.93 15.51 3.21
50 mM Tris-HCl, 200 mM Mannitol, 200 mM
NaCl pH 8.5 0.84 1.55 38.33

36
We can see that from all the elution buffers tested, only the 50 mM Tris-HCl, 200 mM sorbitol, 200 mM
NaCl at pH 8.5 leads to a higher purity in the first elution, even though this is low, although the starting
purity of the feed solution was even more lower (0.96%). The remaining samples had a higher purity in
the second elution, being unfavourable for the purpose of this work, which is the replacement of the
elution buffer,1.5 M Tris-HCl at pH 8.5. Apart from a few values, most of the results were low, and that
can be due to the low concentrations of IgG.
Finally the purification factor was calculated by the ratio between the initial and final protein purity of
the different antibody samples. The purity of IgG in the CHO cell supernatant was about 0.96%.
Table 9 - Table of purification factor of IgG in CPG-APB column, in Flow-through and elution steps. With 20mM HEPES at pH 8.5 binding buffer, and four elution buffers.
% Purification factor of IgG in CHO cells
Elution Buffer Flow-
through
Elution
Tested Buffer 1.5 M Tris-HCl pH 8.5
200 mM Tris-HCl, 200 mM Sorbitol pH 8.5 0.30 0.49 61.12
200 mM Tris-HCl, 200 mM Mannitol pH 8.5 0.94 0.51 77.20
50 mM Tris-HCl, 200 mM Sorbitol, 200 mM
NaCl pH 8.5 0.31 11.79 2.56
50 mM Tris-HCl, 200 mM Mannitol, 200 mM
NaCl pH 8.5 1.15 4.13 38.52
Table 10 - Table of purification of IgG in CPG-APB column, in Flow-through and elution steps. With 20mM HEPES with 150mM NaCl at pH 8.5 binding buffer, and four elution buffers.
% Purification factor of IgG in CHO cells
Elution Buffer Flow-
through
Elution
Tested Buffer 1.5 M Tris-HCl pH 8.5
200 mM Tris-HCl, 200 mM Sorbitol pH 8.5 0.38 11.44 129.02
200 mM Tris-HCl, 200 mM Mannitol pH 8.5 1.52 0.50 99.25
50 mM Tris-HCl, 200 mM Sorbitol, 200 mM
NaCl pH 8.5 0.96 16.10 3.3
50 mM Tris-HCl, 200 mM Mannitol, 200 mM
NaCl pH 8.5 0.87 1.61 39.80
With these results, one can conclude that for the purification of the antibodies with CPG-APB it should
be used a binding buffer composed by 20 mM HEPES, 150 mM NaCl at pH 8.5 and an elution buffer
composed by 50 mM Tris-HCl, 200 mM Sorbitol and 200 mM NaCl at pH 8.5.
After these experiments, the next step was to test the purification of IgG on protein A CPG resin (CPG
PA), then test the purification process using first the resin CPG-APB then the PA CPG resin.

37
4.3. Purification of IgG with PA CPG resin
First, the behaviour of IgG, diluted in different buffers, in the PA CPG column. The buffers used to
dilute the IgG were: i) 1.5 M Tris-HCl pH 8.5, ii) 50 mM Tris-HCl, 200 mM Sorbitol, 200 mM NaCl at pH
8.5, iii) 20 mM HEPES, 150 mM NaCl at pH 8.5 and iv) 0.01 M PBS at pH 7.4. The first three buffers
were tested to observe if the buffers used to purify the antibody in the CPG-APB resin interfered with
the binding of IgG to the protein A column. This analysis was compared only in terms of areas. In table
11, one see that the dilution buffer has no interference with the binding of IgG to protein A, since the
areas of the elution peaks that are very close.
Table 11 – Retention time and areas of a of the elution peak, for the different loading buffers evaluated, in PA CPG resin.
Loading Buffer Retention Time Area
0.01 M PBS pH 7.4 6.62 235.9
1.5 M Tris-HCl pH 8.5 6.61 238.0
50 mM Tris-HCl, 200 mM Sorbitol, 200 mM NaCl pH 8.5 6.61 248.8
20 mM HEPES, 150 mM NaCl pH 8.5 6.63 241.7
To test the recovery of IgG from a CHO cell supernatant using the PA CPG resin, four bniding buffers:
i) 50 mM phosphate buffer, 150 mM NaCl at pH 7.4 ii) 0.01 M PBS at pH 7.4; iii) 20mM HEPES,
150mM NaCl buffer at pH 8.5 and iv) 50 mM Tris-HCl, 200 mM Sorbitol, 200 mM NaCl at pH 8.5. The
first two buffers are commonly used in the purification of antibodies by Protein A chromatography,
while the later buffers were used in the purification of antibody in the CPG-APB resin, found in this
study, to test if this buffers have any interference with the protein A resin. Using as the elution buffer
the 0.1M citric acid buffer at pH 3.0.
Table 12 - Table of % recovery of IgG in PA CPG column, in Flow-through and elution steps. With different binding buffer, and with 0.1 M citric acid at pH 3.0 as elution buffer.
% Recovery of IgG from the CHO cell supernatant
Binding Buffer Flow-
through Elution
50 mM phosphate buffer, 150 mM NaCl pH 7.4 6.14 82.74
0.01 M PBS pH 7.4 7.81 81.70
20 mM HEPES, 150 mM NaCl pH 8.5 6.16 82.67
50 mM Tris-HCl, 200 mM Sorbitol, 200 mM NaCl pH 8.5 6.07 84.54
According to table 12, the recovery for all binding buffers was identical, and can see that there is no
interference of the buffers used in purification of the antibody in the CPG-APB resin. Almost all the
antibody bound to the PA CPG resin, with only a small percentage in the flow-through.
As in the previous study, a protein gel and quantification of total protein (Bradford method) were
performed.

Figure 22 - Silver stained SDS-PAGE of the different fractions collected during purification of IgGsupernatant by PA chromatography. Lanes ID: 1, molecular weight standards (from bottom to top: 10, 15, 20, 25, 37, 50, 75, 100, 150, and 200kDa); 2, CHOpH 7.4 binding buffer; 4, E fraction of the run with 50
fraction of the run with 0.01 M PBS pH 7.4 buffer; 7, FT fraction of the run with 20with 20 mM HEPES, 150 mM NaCl pH 8.5Sorbitol, 200 mM NaCl pH 8.5 binding buffer; 10,
In the figure 22 is represented a protein gel, from left to right
marker, the CHO cell supernatant,
respectively, the flow-through and elution.
quantification of IgG.
According to the total protein quantification, it
than 90% of total protein had been eliminated
Table 13 - Protein purity in the fractions collected form PAfour binding buffer, and 0.1 M citric acid at pH 3.0 as elution buffer.
Binding
50 mM phosphate buffer
0.01 M PBS pH 7.4
20 mM HEPES, 150
50 mM Tris-HCl, 200 mM Sorbitol,
While calculating the purity of the antibody
the samples have a purity greater than 100%, this is due to the
with the protein A is greater than the value obtained with the Bradford method, this can due to
experimental errors, since no method is 100% robust.
PAGE of the different fractions collected during purification of IgGPA chromatography. Lanes ID: 1, molecular weight standards (from bottom to top: 10, 15, 20, 25,
37, 50, 75, 100, 150, and 200kDa); 2, CHO cells; 3, FT fraction of the run with 50 mM NaH2PO4fraction of the run with 50 mM NaH2PO4, 150 mM NaCl pH 7.4 bindingM PBS pH 7.4 binding buffer; 6, E fraction of the run with 0.01 M PBS pH 7.4
mM HEPES, 150 mM NaCl pH 8.5 binding buffer; 8, E fraction of the run mM NaCl pH 8.5 binding buffer; 9, FT fraction of the run with 50 mM Tris
buffer; 10, E fraction of the run with 50 mM Tris-HCl, 200 mM SorbitolmM NaCl pH 8.5 binding buffer.
is represented a protein gel, from left to right, each lane represents the molecular
, and the remaining lanes are the samples of each binding buffer,
through and elution. As one can see, the bands in the samples support the
According to the total protein quantification, it was observed that after purification with protein A, more
eliminated (eluted in the flow-through).
Protein purity in the fractions collected form PA-CPG column: flow-through and elutiofour binding buffer, and 0.1 M citric acid at pH 3.0 as elution buffer.
Protein Purity (%)
Buffer Flow-
through Elution
mM phosphate buffer, 150 mM NaCl pH 7.4 0.12
M PBS pH 7.4 0.24
150 mM NaCl pH 8.5 0.14
mM Sorbitol, 200 mM NaCl pH 8.5 0.19
the purity of the antibody (table 13) in the final samples, it was observed that most of
greater than 100%, this is due to the fact that the quantification obtained
with the protein A is greater than the value obtained with the Bradford method, this can due to
experimental errors, since no method is 100% robust.
38
PAGE of the different fractions collected during purification of IgG from CHO cell PA chromatography. Lanes ID: 1, molecular weight standards (from bottom to top: 10, 15, 20, 25,
mM NaH2PO4, 150 mM NaCl binding buffer; 5, FT
M PBS pH 7.4 binding fraction of the run
mM Tris-HCl, 200 mM mM Sorbitol, 200
represents the molecular
are the samples of each binding buffer,
bands in the samples support the
that after purification with protein A, more
through and elution steps, using
Elution
109
74
122
141
observed that most of
quantification obtained
with the protein A is greater than the value obtained with the Bradford method, this can due to

39
Table 14 - Table of protein factor in PA CPG column, in Flow-through and elution steps. With four binding buffer, and 0.1 M citric acid at pH 3.0 elution buffer.
Purification Factor
Elution Buffer Flow-
through Elution
50 mM phosphate buffer, 150 mM NaCl pH 7.4 0.04 32.28
0.01 M PBS pH 7.4 0.07 22.14
20 mM HEPES, 150 mM NaCl pH 8.5 0.04 36.08
50 mM Tris-HCl, 200 mM Sorbitol, 200 mM NaCl pH 8.5 0.06 41.81
4.4. Purification of IgG in CHO cells
The last work of this thesis was to test a purification process using first APB-CPG resin and then the
PA-CPG resin.
In the purification CPG-APB resin used the binding buffer was composed by 20 mM HEPES, 150 mM
NaCl, pH 8.5 and the elution buffer by 50 mM Tris-HCl, 200 mM Sorbitol, 200 mM NaCl, 8.5. Three
CHO cCCS samples (2 ml) were injected; these three injections were made to see if the process
would be robust and reproducible. In each run fractions of 1 ml were collected during the flow-through
and of 0.5 ml during the elution.
Table 15 - Table of % recovery in CPG-APB column, in Flow-through and elution steps. With 20 mM HEPES, 150 mM NaCl at pH 8.5 binding buffer, and 50 mM Tris-HCl, 200 mM Sorbitol, 200 mM NaCl at pH 8.5 elution buffer.
% Recovery of IgG from the CHO cell supernatant
Run Flow-through Elution
A1 14.0 45.68
A2 14.0 75.8
A3 14.0 66.2
The percentage of recovery of IgG in this resin for the three samples was not reproducible, with the
first run exhibiting a considerably lower recovery yield of IgG in the elution pool. This low percentage
may have been due to an operation error, so for the remaining analysis we will withdraw the samples
collected from the first run. Table 16 shows the protein purity and purification factor.
Table 16 - Table of % protein purity and protein factor in CPG-APB column, in Flow-through and elution steps. With 20 mM HEPES, 150 mM NaCl at pH 8.5 binding buffer, and 50 mM Tris-HCl, 200 mM Sorbitol, 200 mM NaCl
at pH 8.5 elution buffer.
Protein Purity (%) Purification Factor
Run Flow-through Elution Flow-through Elution
A2 0.36 10.34 0.11 3.27
A3 0.12 2.89 0.12 2.89

40
After analysis of chromatograms of purification of the antibody with the CPG-APB resin, it was found
the pool of flow-through and elution fractions that have peaks, injecting this samples in CPG protein A
column (500ul) using as binding buffer 0.01 M PBS pH 7.4, and as elution buffer, 0.1 M citric acid pH
3.0. The recovery of IgG, the protein purity and the purification factor are presented in tables 17-18.
Table 17 - Table of % recovery in PA CPG column, in Flow-through and elution steps. With 0.01 M PBS at pH 7.4 binding buffer, and 0.1 M citric acid at pH 3.0 as elution buffer.
% Recovery of IgG from the CHO cell supernatant
Run Flow-through Elution
A2 7.8 17.21
A3 8.73 21.35
Table 18 - Table of % protein purity and protein factor in PA CPG column, in Flow-through and elution steps. With 0.01 M PBS at pH 7.4 binding buffer, and 0.1 M citric acid at pH 3.0 as elution buffer.
Protein Purity (%) Purification Factor
Sample Flow-through Elution Flow-through Elution
A2 3.68 13.44 1.17 4.26
A3 3.75 14.10 1.19 4.47
The recovery of IgG was considerable lower than what was expected; one would expect to obtain
recoveries above 80%. There may have been several problems for these results, problems with the
resin, and problems in the low injection volume in the PA CPG column, among others. It is necessary
optimize the process with additional tests.

41
5. Conclusion and Future Trends
The first step was test the binding of human immunoglobulin G (IgG) to the various constitutes of
CPG-amino phenyl boronate The chromatographic runs shown in the section 3.1.1 were repeated but
the adsorption buffer was supplemented with 150 mM NaCl in order to avoid the presence of
electrostatic interactions. The chromatograms obtained for the CPG, CPG-aminopropyl and CPG-
aniline for the adsorption buffer 20 mM HEPES, 150 mM NaCl ate pH 8.5 are different with most of the
proteins coming up in the flow-through. This shows that electrostatic interactions were in the base of
the adsorptions. The only column that maintained its profile was the CPG-APB, which corroborates
that there is a specific interaction between IgG and the ligand, phenyl boronate. These results suggest
that 20mM HEPES with 150mM NaCl at pH 8.5 is the best binding buffer.
The next step was to evaluate different elution buffers for CPG-APB column, in order to find an
alternative to the 1.5 M Tris-HCl buffer at pH 8.5, which is too concentrated and too expensive for the
downstream process. Were tested eleven elution buffers, decreasing the concentration of Tris-HCl
and supplemented with competitive diols (sorbitol and mannitol). With all results obtained, was
conclude that for the purification of the antibodis with CPG-APB it should be used a binding buffer
composed by 20 mM HEPES, 150 mM NaCl at pH 8.5 and an elution buffer composed by 50 mM Tris-
HCl, 200 mM Sorbitol and 200 mM NaCl at pH 8.5.
After these, the next step was to test the purification of IgG on protein A CPG resin (CPG PA), then
test the purification process using first the resin CPG-APB then the PA CPG resin. The recovery of
IgG for all loading buffer were identical, and can see that there is no interference of the buffers used in
purification with CPG-APB resin.
The last step was test the purification process using first the resin CPG-APB then the PA CPG resin.
The recovery of IgG was considerable lower than what was expected; one would expect to obtain
recoveries above 80%. There may have been several problems for these results.
With all this results there are future work that need to be done. First there is necessary repeat the
elution studies, to confirm the results obtained in this thesis, and if the method is robust. And then it is
necessary optimize the last step of this work to achieve high recoveries.

42
Bibliography
1. Girello, Ana Lúcia e Kuhn, Telma Ingrid B. de Bellis. Fundamentos da imuno-hematologia
eritrocitária. Brasil : SENAC, 2002.
2. Harlow, Ed e Lane, David. Antibodies A laboratory Manual. U.S.A. : Cold Spring Harbor, 1998.
3. Dubel, Stefan (Ed.). Handbook of Therapeutic Antibodies. Germany : WILEY-VCH, 2007. Vol. I.
4. An, Zhiqiang (Ed.). Therapeutic Monoclonal Antibodies - From Bench to Clinic. Canada : WILEY,
2009.
5. Roque, Ana C.A., Silva, cláudia S.O. and Taipa, M. Ângela. Affinity-based methodologies and
ligands for antibody purification: Advances and perspectives. Jornal of Cgromatography A -
ScienceDirect, 2007. pp. 44-55.
6. Beck, Patricia Araújo. Caracterização de Anticorpos Monoclonais contra Rotavírus Bovino e suas
Aplicações como Ferramenta de Diagnóstico. Programa de Pós-Graduação em Imunologia. Salvador
- Bahia - Brasil : Universidade Federal da Bahia, 2005.
7. —. Caracterização de Anticorpos Monoclonais contra Rotavírus Bovino e suas Aplicações como
ferramenta de diagnóstico. Brasil : Universidade Federal da BAhia, 2005.
8. Chernajovsky, Yuti e Nissim, Ahuva. Therapeutic Antibodies. Berlin : Springer, 2008. Vol. 181.
9. Knablein, Jorg (Ed.). Modern Biopharmaceuticals. Weinheim : WILEY-VCH, 2005. Vol. I.
10. Gottschalk, Uwe. Process Scale Purification of Antibodies. New Jersey : WILEY, 2009.
11. Kelley, B., Blank, G., Lee, A. Downstream processing of monoclonal antibodies: current practices
and future opportunities. [autor do livro] U. Gottschalk (ed.). Process Scale Purification of Antibodies.
New Jersey : John Wiley & Sons, 2009.
12. Vunnum S., Vedantham, G., Hubbard, B. Protein A - Based Affinity Chromatography . [autor do
livro] U. Gottschalk (ed.). Process Scale Purification of Antibodies. New Jersey : John Wiley & Sons,
2009.
13. Roque, A. Cecília A., Lowe, Christopher R. e Taipa, M. Ângela. Antibodies and Genetically
Engineered Related Molecules: Production and Purification. Biotechnol Prog. 2004, Vol. 20, pp. 639-
654.
14. Deisenhofer, Johann. Crystallographic Refinement and Atomica Models of a Human Fc
Fragment and Its Complex with Fragment B of Protein A from Staphylococcus aureus at 2.9- and 2.8-
A Resolution. Biochemistry. s.l. : American Chemical Society, 1981, Vol. 20, 9, pp. 2361 - 2370.
15. MILLIPORE. Boronate Ligands In Biochemical Separations Applications-Method-Theory of Matrex
Gell PBA. s.l. : Millipore Corporation, 2005.
16. Liu, X. C. e Scouten, W. H. New ligands for boronate affinity chromatography. J. Chromatogr. A.
1994, Vol. 687, pp. 61-69.
17. Singhal, R.P., et al. New ligands for boronate affinity chromatography. Synthesis and properties.
J. Chromatogr. 1991, Vol. 543, pp. 17-38.
18. Azevedo, AM, et al. Integrated process for the purification of antibodies combining aqueous two-
phase extraction, hydrophobic interaction crhomatography and size-exclusion chromatography. J.
Chromatogr. A. 2008, Vol. 1213, pp. 154-161.

43
19. Remião, José Oscar dos Reis, Siqueira, Antônio João Sá de e Azevedo, Ana MAria Ponzio
de. Bioquimica - Guia de aulas práticas. Brasil : EDIPUCRS, 2003.
20. I, Bioquímica. Ensino Prático e Teorico-Prático, Electroforese de proteinas plasmáticas.
Coimbra : Faculdade de Medecina da Universidade de Coimbra, 2007/2008.
21. Azevedo, Ana M., et al. Capture of human monoclonal antibodies from a clarified cell culture
supernatant by phenyl boronate chromatography. Wiley InterScience. 2010.
22. Girello, Ana lúcia and Kuhn, Telma Ingrid B. de Bellis. Fundamentos da imuno-hematologia
eritrocitária. São Paulo : Editora senac, 2002.
23. Knublein, Jorg (Ed.). Modern Biopharmaceuticals volume 1. Weinheim : WILEY-VCH, 2005.
24. Azevedo, Ana M., et al. Capture of human monoclonal antibodies from a clarified cell culture
supernatant by phenyl boronate chromatography.. Wiley InterScience, 2010. pp. 1-8.
25. Gottschalk, Uwe. Process Scale Purification of Antibodies. New Jersey : WILEY, 2009.
26. Lucas, Elizabete F., Soares, Bluma G. e Monteiro, Elisabeth. Caracterização de Polímeros:
Determinação de Peso Molecular e Análise Térmica . Rio de Janiro - Brasil : E-papers Serviços
Editoriais, 2001.