Embed Size (px)
Citation preview

This document is Vistaprint’s second quarter fiscal 2014 earnings commentary. This document contains slides and accompanying comments in the “notes” section below each slide.
1Vistaprint N.V. Q2 FY2014 Earnings Presentation

2
Please read the above safe harbor statement. Additionally, a detailed reconciliation of GAAP and non‐GAAP measures is posted in the appendix of the Q2 fiscal 2014 earnings presentation that accompanies these remarks.
Vistaprint N.V. Q2 FY2014 Earnings Presentation

3
This presentation is organized into the categories shown on the left hand of this slide.
Robert Keane, CEO, and Ernst Teunissen, CFO, will host a live question and answer conference call at 5:15 p.m. US Eastern time which you can access through a link on the investor relations section of www.vistaprint.com.
Vistaprint N.V. Q2 FY2014 Earnings Presentation

Q2 earnings results were strong. GAAP earnings per share were $1.18 and non‐GAAP earnings per share were $1.50, reflecting significant year‐over‐year growth. Q2 revenue results were consistent with our own range of expectations, albeit at the lower end of those expectations. Revenue was $370.8 million, reflecting 6% growth year over year in both reported and constant currency terms. Our GAAP net income margin was 11.0%, and non‐GAAP net income margin was 14.2%, compared to 6.6% and 10.3%, respectively, in Q2 2013. This is an illustration of the profit that we can drive during a peak capacity quarter (even as we continue to invest in strategic initiatives).
We continue to roll out initiatives related to improving our customer value proposition, such as pricing transparency and more consistent customer messaging, and we continue to see short‐term revenue headwinds related to these initiatives. We are pleased with our progress against these initiatives, and are patient regarding the resulting near‐term revenue headwinds. We are confident we are making positive changes to our business that support our ability to drive customer retention and lifetime value, and that create foundations to unlock market opportunity in new areas such as emerging geographies and higher expectations customers. At the same time we continue to invest in these strategic initiatives, we have been able to deliver significant earnings growth and margin expansion, as past investments have begun to bear fruit and we have gained efficiencies in advertising and leverage in other operating expenses. Importantly, we believe the combination of investments, initiatives and efficiencies we are implementing will yield strong long‐term cash flow per share and shareholder value.
What do we mean by “patient regarding revenue headwinds”? We are measuring our execution in FY14 against multiple factors. As described at our investor day in August, key multi‐year objectives we are pursuing include strengthening our customer value proposition, optimizing our advertising investments based on the criteria of COCA relative to the discounted value of lifetime cash flow, driving strong manufacturing‐based efficiencies, quality improvements and scale advantages, and significantly improving our EPS and profit margins after two years of heavy investment. We believe we are executing well across these priorities. As we entered FY 2014, we expected our revenue growth rates to decline this fiscal year and so far they have – we grew 7% year over year in constant currencies for the first half of the year. We believe our company is much stronger today because we are executing against our strategic priorities, despite delivering revenue at the lower end of our initial FY14 expectations.
4Vistaprint N.V. Q2 FY2014 Earnings Presentation
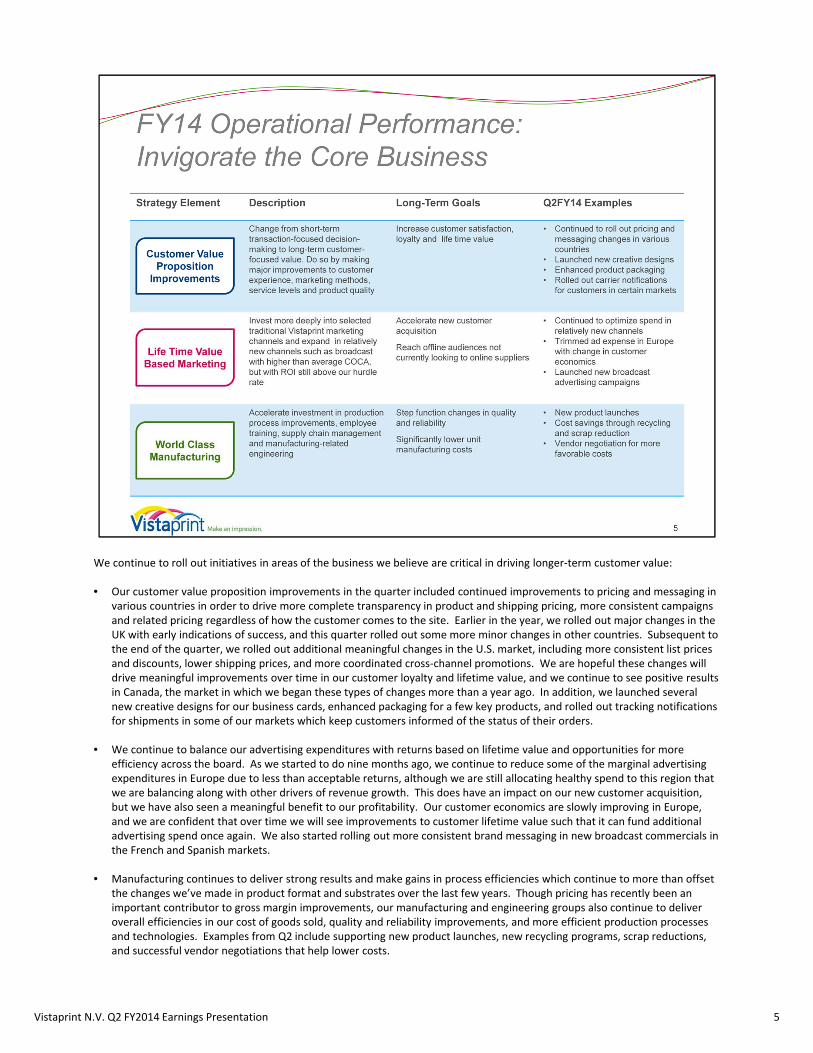
We continue to roll out initiatives in areas of the business we believe are critical in driving longer‐term customer value:
• Our customer value proposition improvements in the quarter included continued improvements to pricing and messaging in various countries in order to drive more complete transparency in product and shipping pricing, more consistent campaigns and related pricing regardless of how the customer comes to the site. Earlier in the year, we rolled out major changes in the UK with early indications of success, and this quarter rolled out some more minor changes in other countries. Subsequent to the end of the quarter, we rolled out additional meaningful changes in the U.S. market, including more consistent list pricesand discounts, lower shipping prices, and more coordinated cross‐channel promotions. We are hopeful these changes will drive meaningful improvements over time in our customer loyalty and lifetime value, and we continue to see positive results in Canada, the market in which we began these types of changes more than a year ago. In addition, we launched several new creative designs for our business cards, enhanced packaging for a few key products, and rolled out tracking notificationsfor shipments in some of our markets which keep customers informed of the status of their orders.
• We continue to balance our advertising expenditures with returns based on lifetime value and opportunities for more efficiency across the board. As we started to do nine months ago, we continue to reduce some of the marginal advertising expenditures in Europe due to less than acceptable returns, although we are still allocating healthy spend to this region that we are balancing along with other drivers of revenue growth. This does have an impact on our new customer acquisition, but we have also seen a meaningful benefit to our profitability. Our customer economics are slowly improving in Europe, and we are confident that over time we will see improvements to customer lifetime value such that it can fund additional advertising spend once again. We also started rolling out more consistent brand messaging in new broadcast commercials in the French and Spanish markets.
• Manufacturing continues to deliver strong results and make gains in process efficiencies which continue to more than offset the changes we’ve made in product format and substrates over the last few years. Though pricing has recently been an important contributor to gross margin improvements, our manufacturing and engineering groups also continue to deliver overall efficiencies in our cost of goods sold, quality and reliability improvements, and more efficient production processesand technologies. Examples from Q2 include supporting new product launches, new recycling programs, scrap reductions, and successful vendor negotiations that help lower costs.
Vistaprint N.V. Q2 FY2014 Earnings Presentation 5

We also continue make steady progress in our adjacencies:
• The combined digital marketing business delivered $20 million, or approximately 5% of revenue during Q2, flat with last year’s digital revenue. When we acquired Webs two years ago, we initially had expected to make the cross sale of Vistaprint’s printed products into the Webs customer base a near‐term priority. As we began to integrate, our near‐term priority shifted to digital product integration and new product development by the talented team of designers and engineers at Webs. We believe that this priority shift will serve us well in the increasingly competitive digital market by strengtheningour Vistaprint‐branded digital offering, which is an important revenue and profit stream for the company. We have completed the integration of the Webs site builder technology into the heart of our product, but it is too early to see an impact in our revenue results. We launched this in North America in Q1, and Europe in Q2. Based on early indications, we believe this integrated offering is stronger than our prior offering and that it will help us improve customer loyalty. We continue to develop new capabilities in our offerings to add value for our customers.
• In our home and family business, we continue to roll out additional holiday themed designs which helped us drive good holiday results during the quarter. We also launched new lay flat photo books in our Albumprinter business. These books are high quality and are well received by the customers who purchase them.
• We continue to believe long‐term opportunities outside of our established markets are significant. We are investing significant resources in growing our capabilities and offerings in India, Japan and, through our minority equity investment, China. During the quarter, we announced a definitive agreement to enter into a joint venture with Plaza Create, a Japanese provider of photo‐based products and services. We expect this joint venture to close in our third fiscal quarter.
Vistaprint N.V. Q2 FY2014 Earnings Presentation 6

No notes here – transition slide
Vistaprint N.V. Q2 FY2014 Earnings Presentation 7

8
The quarterly financial snapshot is noted above. Revenue was $370.8 million, GAAP earnings per share was $1.18, and non‐GAAP earnings per share was $1.50.
During the quarter, three items impacted our earnings results:
• Restructuring costs ‐ as previously disclosed, during Q2 we closed our Singapore operations in order to improve efficiency and effectiveness of the operations, and to enable the deployment of more resources into our customer‐facing markets. The closure resulted in a one‐time expense of $3.0 million, or approximately $0.08 in earnings. The majority of this expense hit the G&A line. We expect total FY14 expenses for managing our emerging markets businesses to be in line with our initial targets, as the Q2 restructuring costs are largely offset by savings in the back half of the year. We have not excluded these charges from our non‐GAAP results, because the intent of the restructuring is to deploy our resources more effectively, not to cut costs.
• Gains and losses on currency hedges ‐ Before fiscal 2014, we elected hedge accounting for our currency hedges, which kept the fluctuations of unrealized gains and losses on the balance sheet, until the underlying currency exposure impacted our net income. As described on our Q1 call, we did not elect hedge accounting for the currency contracts executed for FY14. At the time of that call, we were evaluating our ability to apply hedge accounting to new contracts for FY15 and beyond in light of certain changes in our legal entity cash flows. We considered the benefits of hedge accounting relative to the additional economic cost of trade execution and administrative burden and our belief is that it is more important to hedge our cash flows using an approach that is economically efficient than it is to reduce the resulting volatility on our GAAP income statement. We decided to continue to execute currency forward contracts that do not qualify for hedge accounting and, as a result, we may experience increased volatility within other expense, net in GAAP net income due to unrealized gains and losses on the mark‐to‐market of outstanding currency forward contracts. We expect this volatility to continue in future periods. In Q2, we had a net unrealized gain of $1.2 million, or approximately $0.03 in EPS, and for the first half of the year, we had a net unrealized loss of $3.7M, or $0.10 in EPS. We have decided to exclude these changes in unrealized gains and losses from our non‐GAAP earnings results in order to aid investor understanding, and have recast our Q1 non‐GAAP earnings number to reflect this decision. When these unrealized gains and losses become realized in future quarters, we expect them to be offset at least partially by the revenues or costs elsewhere in the P&L that we are economically hedging.
• Currency gains and losses on intercompany loan – since our October 1, 2013 change in our corporate entity operating structure, some of our intercompany transactional and financing activities have changed. In particular, we now have an intercompany loan between our principal corporate entity and our parent company that results in non‐operational, non‐cash currency gains and losses. In Q2, this was a loss of $1.2M, or approximately $0.03 in EPS, also in the Other expense, net line on our GAAP income statement. We expect these fluctuations will be ongoing and have decided to exclude these gains and losses from our non‐GAAP earnings as well, as they reflect adjustments that do not have current or long‐term cash implications.
Vistaprint N.V. Q2 FY2014 Earnings Presentation

9
Cash and cash equivalents were approximately $62.3 million as of December 31, 2013. During the quarter, Vistaprint generated $95.0 million in cash from operations, compared with $88.5 million in the second quarter of fiscal 2013. Free cash flow was $67.8 million in the second quarter compared to $58.7 million in the same period a year ago.
On a trailing twelve‐month basis, return on invested capital (or ROIC) as of December 31, 2013 increased slightly‐‐including share based compensation expense, it was approximately 15%, and excluding share based compensation expense, it was approximately 24%. We expect ROIC to improve significantly over time, as we expect our margins to expand in FY14 and we expect FY12 and FY13 investments to bear fruit later in FY14 and beyond.
The company did not repurchase shares during the quarter.
Vistaprint N.V. Q2 FY2014 Earnings Presentation
10
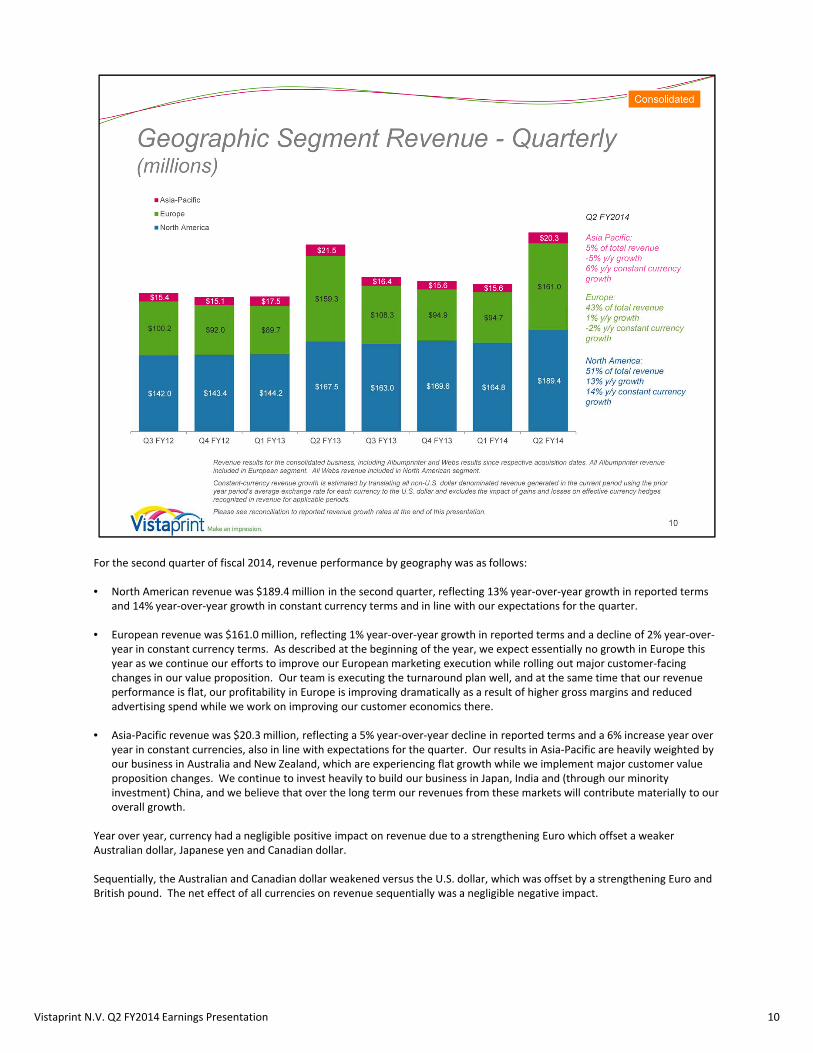
For the second quarter of fiscal 2014, revenue performance by geography was as follows:
• North American revenue was $189.4 million in the second quarter, reflecting 13% year‐over‐year growth in reported terms and 14% year‐over‐year growth in constant currency terms and in line with our expectations for the quarter.
• European revenue was $161.0 million, reflecting 1% year‐over‐year growth in reported terms and a decline of 2% year‐over‐year in constant currency terms. As described at the beginning of the year, we expect essentially no growth in Europe this year as we continue our efforts to improve our European marketing execution while rolling out major customer‐facing changes in our value proposition. Our team is executing the turnaround plan well, and at the same time that our revenue performance is flat, our profitability in Europe is improving dramatically as a result of higher gross margins and reduced advertising spend while we work on improving our customer economics there.
• Asia‐Pacific revenue was $20.3 million, reflecting a 5% year‐over‐year decline in reported terms and a 6% increase year over year in constant currencies, also in line with expectations for the quarter. Our results in Asia‐Pacific are heavily weighted by our business in Australia and New Zealand, which are experiencing flat growth while we implement major customer value proposition changes. We continue to invest heavily to build our business in Japan, India and (through our minority investment) China, and we believe that over the long term our revenues from these markets will contribute materially to our overall growth.
Year over year, currency had a negligible positive impact on revenue due to a strengthening Euro which offset a weaker Australian dollar, Japanese yen and Canadian dollar.
Sequentially, the Australian and Canadian dollar weakened versus the U.S. dollar, which was offset by a strengthening Euro and British pound. The net effect of all currencies on revenue sequentially was a negligible negative impact.
Vistaprint N.V. Q2 FY2014 Earnings Presentation

Vistaprint’s business metrics, which have now been consolidated to include Albumprinter and Webs metrics, were as follows:
• Total orders processed in the quarter were approximately 9.1 million reflecting a decrease of 7% year over year. The decrease was due primarily to lower European orders year over year.
• Average order value in Q2 was $40.92, up 15% from an average order value of $35.72 in Q2 of last fiscal year. Both new and repeat AOV grew year over year. This quarter, AOV was up year over year in Europe and North America, and down in Asia Pacific.
We believe our AOV and order trends are changing as the result of our customer value proposition changes. For example, as we continue our strategy of reducing the frequency of free and deep discount promotions as a customer acquisition and retention tool, we have seen a resulting decline in the number of new customers that purchase from us and short‐term repeat ordering. However, those who are purchasing are doing so with a higher AOV. This is particularly evident in Europe this quarter, as home and family revenue is highest in Europe, and this was the first holiday season in Europe in which we actively stopped deep discount promotions that we relied on in years past. We remain confident that this is the right direction for our business.
The operational metrics above have been updated to include the impact of our acquired companies starting in the period ended March 31, 2012, or Q3 FY2012. Generally speaking, the impact is reflected in higher total orders processed during these periods and lower AOV than previously reported for the Vistaprint‐branded business only.
These metrics should be viewed together and not individually, as factors such as currency, product mix, marketing campaigns, partner performance, seasonality, and the like, can impact them.
Vistaprint N.V. Q2 FY2014 Earnings Presentation 11

Additional customer metrics for our business, which now include Albumprinter and Webs, for the period ended December 31, 2013, were as follows:
• Quarterly new customer additions were approximately 2.9 million, down from the 3.3 million new customer adds in Q2 of last fiscal year. New customer orders grew in North America, but declined year over year in Europe and Asia‐Pacific due to changes to marketing practices and a deliberate trimming of planned advertising expense.
• Vistaprint uses the term “implied cost of customer acquisition” or “implied COCA” to describe total advertising expense in a period divided by the number of unique first time customers in that period. The second chart illustrates our implied COCA, at approximately $28.14, was down slightly from last quarter and the second quarter of last fiscal year.
• Advertising costs were $81.6 million, or 22.0% of revenue in the quarter. This is lower on an absolute dollar basis and in percentage terms than the 27.0% of revenue one year ago, and lower than the 22.9% of revenue last quarter. Similar to last quarter, this is lower than recent quarters as we optimize spend as a result of applying what we learned from past investments to our spending plans, as well as trim the least efficient spend in Europe.
These Q2 metrics illustrate a dynamic we discussed when we launched our strategy: that we could see increasing or flat COCA even as advertising as a percent of revenue declines. This quarter’s dynamic was consistent with what we have seen as we optimize our channel mix within our advertising portfolio: lower new customer adds brought about by a change in the type of customer we are acquiring through offers that rely much less frequently on “free” products.
Vistaprint N.V. Q2 FY2014 Earnings Presentation 12
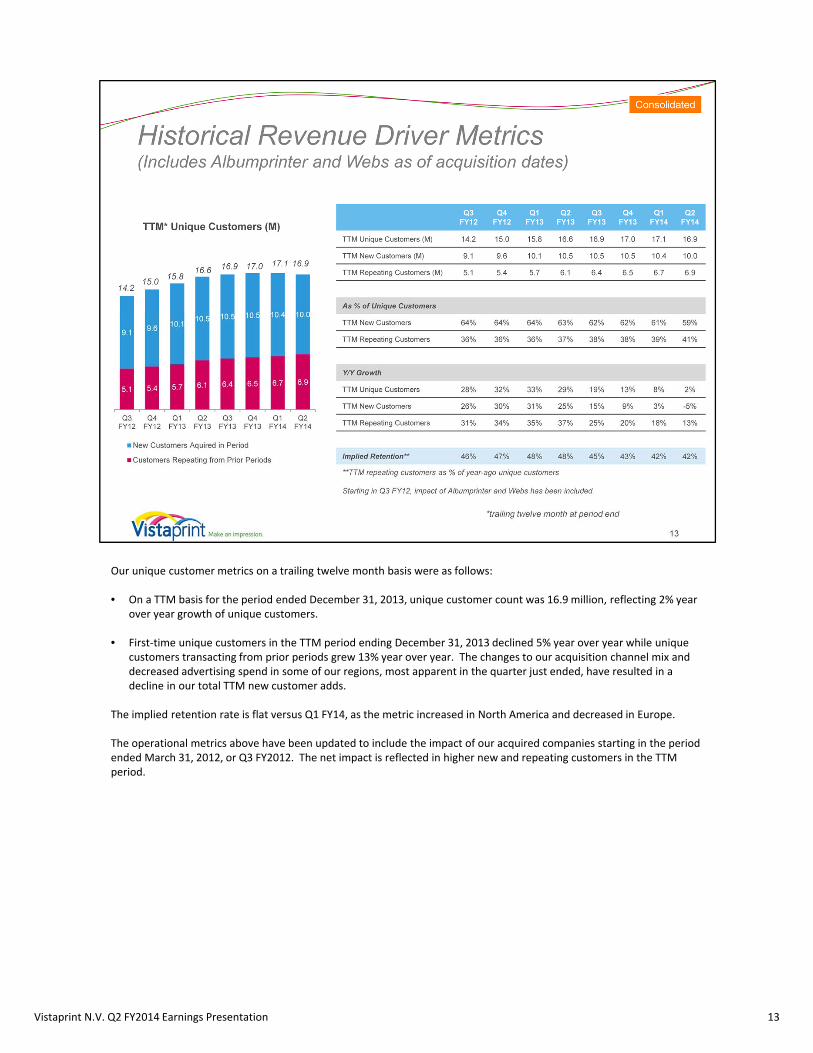
Our unique customer metrics on a trailing twelve month basis were as follows:
• On a TTM basis for the period ended December 31, 2013, unique customer count was 16.9 million, reflecting 2% year over year growth of unique customers.
• First‐time unique customers in the TTM period ending December 31, 2013 declined 5% year over year while unique customers transacting from prior periods grew 13% year over year. The changes to our acquisition channel mix and decreased advertising spend in some of our regions, most apparent in the quarter just ended, have resulted in a decline in our total TTM new customer adds.
The implied retention rate is flat versus Q1 FY14, as the metric increased in North America and decreased in Europe.
The operational metrics above have been updated to include the impact of our acquired companies starting in the period ended March 31, 2012, or Q3 FY2012. The net impact is reflected in higher new and repeating customers in the TTM period.
Vistaprint N.V. Q2 FY2014 Earnings Presentation 13
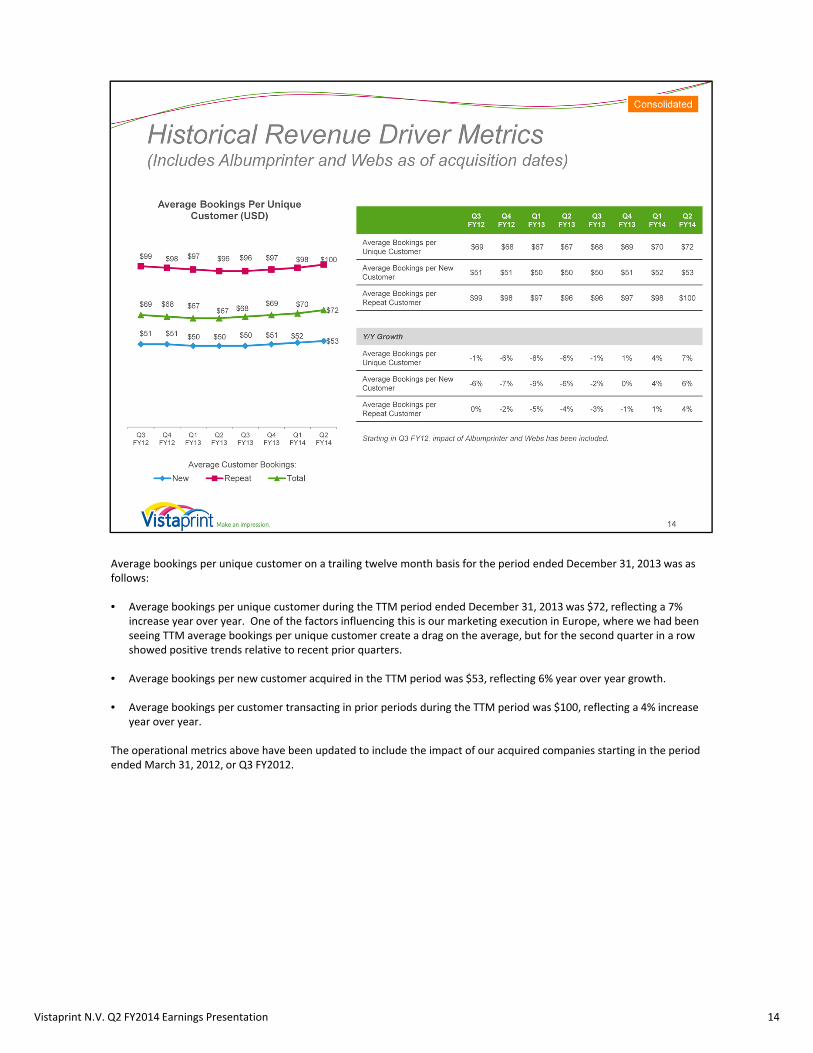
Average bookings per unique customer on a trailing twelve month basis for the period ended December 31, 2013 was as follows:
• Average bookings per unique customer during the TTM period ended December 31, 2013 was $72, reflecting a 7% increase year over year. One of the factors influencing this is our marketing execution in Europe, where we had been seeing TTM average bookings per unique customer create a drag on the average, but for the second quarter in a row showed positive trends relative to recent prior quarters.
• Average bookings per new customer acquired in the TTM period was $53, reflecting 6% year over year growth.
• Average bookings per customer transacting in prior periods during the TTM period was $100, reflecting a 4% increase year over year.
The operational metrics above have been updated to include the impact of our acquired companies starting in the period ended March 31, 2012, or Q3 FY2012.
14Vistaprint N.V. Q2 FY2014 Earnings Presentation

No notes here – transition slide
Vistaprint N.V. Q2 FY2014 Earnings Presentation 15

Halfway through the fiscal year, with our seasonally challenging second quarter behind us, we are updating our revenue outlook for the full year:
• Revenue expectations, excluding the impact of currency – As described earlier, our revenue performance in the first half of the year is consistent with our previously announced range of expectations, but at the low end. Therefore, we are narrowing our revenue guidance range around the former low end of the range. We are patient regarding our revenue performance given the many changes we are making to our customer value proposition. The reduced revenue guidance implies 6% to 8% constant currency growth, with low double digit growth in North America and roughly flat revenues in Europe.
• Currency movements – recent currency movements have resulted in minimal impact to our revenue outlook versus rates in October.
Though we are narrowing our revenue guidance toward the lower end of our prior range, we continue to expect very strong earnings growth and margin expansion in FY14. In fact, given our performance to date, we believe we have opportunity to deliver EPS upside versus our original guidance at the high end of the prior range. As mentioned earlier in this presentation, there are two currency‐related items that will impact other income in our GAAP net income statement, which will be challenging to predict. We expect to exclude these items from our non‐GAAP EPS results. The EPS guidance that we are providing today estimates these impacts using the same currency rates that we use to set our revenue guidance.
Vistaprint N.V. Q2 FY2014 Earnings Presentation 16

17
The table above is Vistaprint’s revenue and EPS guidance as of January 29, 2014. This guidance reflects our expected market opportunity and planned investments for growth and competitive advantage. Vistaprint specifically disclaims any obligation to update any forward‐looking statements, which should not be relied upon as representing our expectations or beliefs as of any date subsequent to January 29, the date of this presentation.
Our expectations for the full fiscal year ending June 30, 2014 are as follows:
• If exchange rates stay the same as they were for the 30‐day average in mid‐January 2014, we would expect consolidated full year 2014 revenue to be $1,235 million to $1,265 million, an increase of 6% to 8% year over year in U.S. dollars and in constant currencies. Of course, actual revenue will depend in part on currency exchange rate developments throughout the remainder of the fiscal year.
• Full fiscal year GAAP EPS, on a diluted basis, is expected to be between $1.55 and $1.80 based on about 34.5 million weighted average shares outstanding. This would reflect EPS growth of 82% to 112%, and at the revenue guidance midpoint, implies net income margins of roughly 4% to 5%, versus net income margins of 2.5% in fiscal 2013.
We are also providing the assumptions noted on our guidance slide to facilitate comparisons with non‐GAAP adjusted net income per diluted share.
• Based on these assumptions, for the full fiscal year 2014, non‐GAAP adjusted EPS is expected to be between $2.68 and $2.93, and excludes expected acquisition‐related amortization of intangible assets of approximately $8.9 million; share‐based compensation expense and its related tax effect of approximately $28.4 million; charges related to the alignment of acquisition‐related intellectual property with global operations of approximately $2.3 million; and 35.0 million shares outstanding. Based on recent currency exchange rates, we expect the two currency‐related items that we exclude from non‐GAAP EPS to have a minimal effect for the full year, despite more meaningful quarterly fluctuations.
• This would reflect non‐GAAP EPS growth of 25% to 36%, and at the revenue guidance midpoint, implies non‐GAAP net income margins of roughly 7% to 8%, versus non‐GAAP net income margins of 6.5% in fiscal 2013.
Vistaprint N.V. Q2 FY2014 Earnings Presentation

This chart shows capital expenditures in dollars and as a percentage of revenue for the past several years, and also shows our expectations for fiscal 2014 at the midpoint of our revenue guidance range. For fiscal 2014, we expect capital expenditures of $80 to $90 million, or 6% to 7% of our revenue guidance midpoint, which is roughly flat in absolute dollars with capital expenditures in fiscal 2013. This is a reduction to our prior guidance, as we now have more visibility into expected spend and timing of capital expenditures. Our planned capital expenditures in the year will be spread across investments in facilities, manufacturing equipment and IT equipment. While we have no major production facility expansions planned for FY14, we are making some changes to the layout in some of our facilities, building out a new manufacturing engineering center in Switzerland, investing in new manufacturing technologies, and making other capital investments to improve efficiency.
Our capital expenditures will play a significant role in our free cash flow in fiscal 2014. Though we expect significant net income growth in fiscal 2014, spending at the high end of our cap ex range could result in limited free cash flow growth.
18Vistaprint N.V. Q2 FY2014 Earnings Presentation

In summary, halfway through the fiscal year, we are executing very well against strategic and operational objectives. We are patient with our slower revenue growth as we make progress on our strategic priorities, especially a much improved marketing approach when viewed from the perspective of our customers that dampens near term revenue while positively impacting profitability. We continue to believe that we can drive longer‐term healthy revenue growth with disciplined and balanced growth in profits, which will continue to build our long‐term shareholder value through our drive toward increased cash flow pershare and competitive advantage.
19Vistaprint N.V. Q2 FY2014 Earnings Presentation

Vistaprint N.V. Q2 FY2014 Earnings Presentation
Q&A SessionPlease go to theInvestor Relations section of www.vistaprint.comfor the live Q&A call at 5:15 pm EST on January 29, 2014
Q2 Fiscal Year 2014Financial and Operating Results Supplement

Vistaprint N.V. Q2 FY2014 Earnings Presentation
0%
5%
10%
15%
20%
25%
30%
Q3 FY11 Q4 FY11 Q1 FY12 Q2 FY12* Q3 FY12 Q4 FY12 Q1 FY13 Q2 FY13 Q3 FY13 Q4 FY13 Q1 FY14 Q2 FY14
Constant-Currency
Reported
Total Company Growth Rates*
*Starting in Q2FY2012, revenue from acquired companies included.
Note: Constant-currency revenue growth is estimated by translating all non-U.S. dollar denominated revenue generated in the current period using the prior year period’s average exchange rate for each currency to the U.S. dollar and excludes the impact of gains and losses on effective currency hedges recognized in revenue for applicable periods.
Please see reconciliation to reported revenue growth rates at the end of this presentation.
6%reported
6% constant-currency
22
22% constant-currency growthFY11 FY12
25% constant-currency growthFY13
16% constant-currency growth
Consolidated
YTD FY147% constant-currency growth
21%
18%17%
20%
23%21% 22%
20%
15%
18%
15%
14%
-10%
0%
10%
20%
30%
40%
50%
North America
Segment Revenue Growth Rates*Constant Currency
23
35%
39%
45%
37%40%
33%
29%
24%
10%8%
2%
6%
-10%
0%
10%
20%
30%
40%
50%
APAC
21%22% 21%
37%
34%
30%
23%
14%
8%
2% 2%
-2%
-10%
0%
10%
20%
30%
40%
50%
Europe
*Starting in Q2FY2012, revenue from acquired companies included.
Note: Constant-currency revenue growth is estimated by translating all non-U.S. dollar denominated revenue generated in the current period using the prior year period’s average exchange rate for each currency to the U.S. dollar and excludes the impact of gains and losses on effective currency hedges recognized in revenue for applicable periods.
Please see reconciliation to reported revenue growth rates at the end of this presentation.
Consolidated

Vistaprint N.V. Q2 FY2014 Earnings Presentation
$133 $133 $134
$200
$169 $162 $163
$234
$189
$181
$179
$250
65.3% 63.9% 63.2%66.8% 65.5% 64.6% 65.0%
67.2%65.5%
64.6%65.2%
67.4%
Q3 FY11 Q4 FY11 Q1 FY12 Q2 FY12 Q3 FY12 Q4 FY12 Q1 FY13 Q2 FY13 Q3 FY13 Q4 FY13 Q1 FY14 Q2 FY14
Gross Profit (millions) GM %
Gross Margin and Gross Profit
24
FY11 64.8% FY12 65.2%
Consolidated
FY13 65.7% YTD FY14 66.5%
GAAP Net Income (Loss) and Net Margin
$23
$14
$8
$32
$0 $4
$(2)
$23
$6
$2 $0
$41
11.3%
6.9%
3.8%
10.6%
0.1%
1.5%
-0.7%
6.6%
2.0%
0.8% 0.1%
11.0%
-1.5%
0.5%
2.5%
4.5%
6.5%
8.5%
10.5%
12.5%
14.5%
$(4)
$1
$6
$11
$16
$21
$26
$31
$36
$41
$46
$51
$56
Q3 FY11 Q4 FY11 Q1 FY12 Q2 FY12 Q3 FY12 Q4 FY12 Q1 FY13 Q2 FY13 Q3 FY13 Q4 FY13 Q1 FY14 Q2 FY14
GAAP Net Income (loss), in millions GAAP Net Margin
25
FY11 $82 FY12 $44
Consolidated
FY13 $29 YTD FY14 $41

Vistaprint N.V. Q2 FY2014 Earnings Presentation
Non-GAAP Adjusted Net Income* and Non-GAAP Adjusted Net Margin
$28
$20
$13
$38
$11 $15
$9
$36
$17 $14
$16
$53
13.8%
9.4%
6.1%
12.6%
4.4%5.9%
3.5%
10.3%
5.9% 5.0%5.9%
14.2%
Q3 FY11 Q4 FY11 Q1 FY12 Q2 FY12 Q3 FY12 Q4 FY12 Q1 FY13 Q2 FY13 Q3 FY13 Q4 FY13 Q1 FY14 Q2 FY14
Non-GAAP Adjusted Net Income (millions) Non-GAAP Adjusted Net Margin
*Non-GAAP adjusted net income for all periods presented excludes the impact of share-based compensation expense and its related tax effect, amortization of acquired intangibles, charges related to the alignment of Webs IP with our global structure, changes in unrealized gains and losses on currency forward contracts, and unrealized currency transaction gains and losses on intercompany financing arrangements and the related tax effect. Please see reconciliation to GAAP net income at the end of this presentation.
26
FY11 $105 FY12 $77
Consolidated
FY13 $76 YTD FY14 $69
Q2 Income Statement Comparison to Prior Year(as a percentage of revenue)
14.2%9.5%
8.2%7.6%
11.5%11.5%
33.5%38.6%
32.6% 32.8%
Q2 FY2014 Q2 FY2013
Cost of revenue
Marketing and selling
Technology and development
General and administrative
Income from operations
27
Consolidated

Vistaprint N.V. Q2 FY2014 Earnings Presentation
Q2 Income Statement Comparison to Prior Quarter(as a percentage of revenue)
14.2%
3.1%
8.2%
9.5%
11.5%
15.4%
33.5%37.2%
32.6% 34.8%
Q2 FY2014 Q1 FY2014
Cost of revenue
Marketing and selling
Technology and development
General and administrative
Income from operations
28
Consolidated
$5.3 $5.1 $4.9 $5.0
$7.6
$8.6 $8.4 $8.5 $8.4 $8.3 $8.6 $8.1
Q3 FY11 Q4 FY11 Q1 FY12 Q2 FY12 Q3 FY12 Q4 FY12 Q1 FY13 Q2 FY13 Q3 FY13 Q4 FY13 Q1 FY14 Q2 FY14
Share-Based Compensation* (millions)
* Share-based compensation (SBC) expense includes SBC-related tax adjustment.
29
FY11 $22.4 FY12 $26.1
Consolidated
FY13 $33.7 YTD FY14 $16.6

Vistaprint N.V. Q2 FY2014 Earnings Presentation
$204$209 $212
$300
$258 $250 $251
$348
$288 $280 $275
$371
Q3 FY11 Q4 FY11 Q1 FY12 Q2 FY12 Q3 FY12 Q4 FY12 Q1 FY13 Q2 FY13 Q3 FY13 Q4 FY13 Q1 FY14 Q2 FY14
Small Business Marketing* Home and Family*
Revenue Seasonality(Includes Albumprinter and Webs as of the dates of acquisition)
* Home and family revenue is calculated using a product format-based approach; all Albumprinterrevenue is included in home and family and all Webs revenue is included in Small business marketing 30
Consolidated
Balance Sheet Highlights
Balance Sheet highlights, in millions, at period end 12/31/13 09/30/2013 06/30/13 03/31/13 12/31/12
Total assets $674.6 $638.7 $601.6 $616.4 $653.7
Cash and cash equivalents $62.3 $64.7 $50.1 $51.3 $64.7
Total current assets $135.5 $121.8 $100.2 $104.4 $132.3
Goodwill and intangible assets $171.6 $171.5 $171.2 $174.3 $179.2
Total liabilities $414.4 $432.0 $412.0 $414.7 $443.8
Current liabilities $197.9 $144.3 $155.0 $154.0 $182.4
Long-term debt $189.3 $262.5 $230.0 $229.0 $230.5
Shareholders’ Equity $260.3 $206.7 $189.6 $201.7 $209.9
Treasury shares (in millions) 10.9 11.0 11.3 10.9 16.4
31
Consolidated

Vistaprint N.V. Q2 FY2014 Earnings Presentation
Total Debt as of December 31, 2013
Availability under our credit facility ($ millions)* 12/31/13
Maximum aggregate available borrowing amounts 496.3
Outstanding borrowings of credit facility (204.5)
Remaining amount 291.8
Limitations to borrowing due to debt covenants and other obligations** (2.1)
Amount available for borrowing as of December 31, 2013 $289.7
32
Consolidated
• Aggregate loan commitments of $496.3M • Interest rate of LIBOR plus 1.50% - 2.0%, depending on leverage• Currently in compliance with all covenants. Key financial covenants are:
o Total leverage ratio not to exceed 3.5x TTM EBITDA (reducing to 3.25x on 3/31/14 and 3.0x on 3/31/15).o Interest coverage ratio of at least 3.0x TTM EBITDA.
• Purchases of our ordinary shares, payments of dividends, and mergers and acquisitions are subject to more restrictive consolidated leverage ratio thresholds than those listed above when calculated on a proforma basis in certain scenarios. Also the credit agreement limits the amount of purchases of our ordinary shares, payments of dividends, mergers and acquisitions, investments in joint ventures or minority interests, and consolidated capital expenditures that we may make. These limitations can include annual limits that vary from year-to-year and aggregate limits over the term of the credit facility. Therefore, our ability to make desired investments may be limited during the term of our revolving credit facility.
* As announced in our Form 8-K filed on January 22, 2014, we entered into an amendment to our credit agreement on January 17, 2014 resulting in an increase to aggregate loan commitments under the credit agreement by $303.75 million, to a total of $800.0 million by addingnew lenders and increasing the commitments of several existing lenders. The loan commitments consist of revolving loans of $640.0 million and a term loan of $160.0 million. Key covenants, pricing, and maturity date have remained the same. ** Our borrowing ability can be limited by our debt covenants each quarter. These covenants may limit our borrowing capacity depending on our leverage, other indebtedness, such as installment obligations and letters of credit, and other factors that are outlined in our credit agreement filed as an exhibit in our Form 8-Ks filed on February 13, 2013 and January 22, 2014.
17%
61%
22%
Land/Facilities
Mfg & AutomationEquipment
Other
Q2 FY14 Capital Expenditure Breakdown
1
3
2
1 Land, building and construction, leasehold improvements, and furniture and fixtures
2 All manufacturing and automation equipment, including offset and digital print lines, other printing equipment, pre-press and post-press equipment such as cutters, and automation equipment
3 IT infrastructure, software and office equipment
33
Consolidated
Q2 FY14 CapEx: $24.6M

Vistaprint N.V. Q2 FY2014 Earnings Presentation
AppendixIncluding a Reconciliation of GAAP to Non-GAAP Financial Measures
About non-GAAP financial measuresTo supplement Vistaprint’s consolidated financial statements presented in accordance with U.S. generally accepted accounting principles, or GAAP, Vistaprint has used the following measures defined as non-GAAP financial measures by Securities and Exchange Commission, or SEC, rules: non-GAAP adjusted net income, non-GAAP adjusted net income per diluted share, free cash flow and constant-currency revenue growth. The items excluded from the non-GAAP adjusted net income measurements are share-based compensation expense and its related tax effect, amortization of acquisition-related intangibles, tax charges related to the alignment of acquisition-related intellectual property with global operations, changes in unrealized gains and losses on currency forward contracts, and unrealized currency transaction gains and losses on intercompany financing arrangements and the related tax effect. Free cash flow is defined as net cash provided by operating activities less purchases of property, plant and equipment, purchases of intangible assets not related to acquisitions, and capitalization of software and website development costs. Constant-currency revenue growth is estimated by translating all non-U.S. dollar denominated revenue generated in the current period using the prior year period’s average exchange rate for each currency to the U.S. dollar and excludes the impact of gains and losses on effective currency hedges recognized in revenue in the prior year periods.
The presentation of non-GAAP financial information is not intended to be considered in isolation or as a substitute for the financial information prepared and presented in accordance with GAAP. For more information on these non-GAAP financial measures, please see the tables captioned “Reconciliations of Non-GAAP Financial Measures” included at the end of this release. The tables have more details on the GAAP financial measures that are most directly comparable to non-GAAP financial measures and the related reconciliation between these financial measures.
Vistaprint’s management believes that these non-GAAP financial measures provide meaningful supplemental information in assessing our performance and liquidity by excluding certain items that may not be indicative of our recurring core business operating results, which could be non-cash charges or discrete cash charges that are infrequent in nature. These non-GAAP financial measures also have facilitated management’s internal comparisons to Vistaprint’shistorical performance and our competitors’ operating results.
35

Vistaprint N.V. Q2 FY2014 Earnings Presentation
Reconciliation: GAAP to Non-GAAP Results
FY 2003 FY 2004 FY 2005* FY 2006 FY 2007 FY 2008 FY 2009 FY2010 FY2011 FY2012 FY2013
GAAP Net Income $473 $3,440 ($16,218) $19,234 $27,143 $39,831 $55,686 $67,741 $82,109 $43,994 $29,435
Share-based compensation and related tax effect
$0 $0 $0 $4,850 $8,765 $15,275 $20,177 $23,156 $22,400 $26,060 $33,662
Amortization of acquired intangible
assets- - - - - - - - - $5,754 $10,361
Tax Impact of Webs IP transfer
- - - - - - - - - $1,235 $2,387
Non-GAAPAdjusted Net Income
$473 $3,440 $4,782 $23,146 $35,908 $55,106 $75,863 $90,897 $104,509 $77,043 $75,845
Net Income (Loss) – Annual($ in thousands)
*Fiscal 2005 non-GAAP results exclude a contract termination payment of $21mm
36
Reconciliation: GAAP to Non-GAAP ResultsNet Income (Loss) – Quarterly($ in thousands)
. Fiscal Year 2011 Fiscal Year 2012 Fiscal Year 2013 FY2014
Q3 Q4 Q1 Q2 Q3 Q4 Q1 Q2 Q3 Q4 Q1 Q2
GAAP Net Income $22,917 $14,397 $8,172 $31,697 $274 $3,851 $(1,696) $22,960 $5,866 $2,305 $412 $40,875
Share-based compensation and related tax effect
$5,285 $5,129 $4,876 $5,021 $7,566 $8,596 $8,445 $8,540 $8,353 $8,324 $8,576 $8,062
Amortization of acquired intangible
assets- - - $1,148 $2,381 $2,225 $2,178 $2,243 $2,275 $3,665 $2,200 $2,249
Tax Impact of Webs IP Transfer - - - - $1,017 $218 - $2,164 $431 ($208) $63 $1,468
Changes in unrealized (gain) loss on currency forward contracts
included in net income
$4,856 $(1,155)
Unrealized currency transaction loss on intercompany loan and the related tax
effect
- $1,163
Non-GAAPAdjusted Net
Income$28,202 $19,526 $13,048 $37,866 $11,238 $14,890 $8,927 $35,907 $16,925 $14,086 $16,107 $52,662
37

Vistaprint N.V. Q2 FY2014 Earnings Presentation
Reconciliation: GAAP to Non-GAAP ResultsDiluted Earnings Per Share - Annual
38
FY 2006 FY 2007 FY 2008 FY 2009 FY2010 FY2011 FY2012 FY2013
GAAP Net Income per share $0.45 $0.60 $0.87 $1.25 $1.49 $1.83 $1.13 $0.85
Share-based Compensation and related tax effect per
share$0.09 $0.18 $0.31 $0.43 $0.49 $0.47 $0.65 $0.95
Amortization of acquired intangible assets per share
- - - - - - $0.14 $0.29
Tax Impact of Webs IP Transfer per share
- - - - - - $0.03 $0.06
Non-GAAP Adjusted Net Income per share
$0.54 $0.78 $1.18 $1.68 $1.98 $2.30 $1.95 $2.15
Weighted average shares used in computing Non-
GAAP EPS
(millions)
42.651 45.825 46.780 45.099 45.989 45.448 39.426 35.201
Reconciliation: GAAP to Non-GAAP ResultsEarnings Per Diluted Share - Quarterly
. Fiscal Year 2011 Fiscal Year 2012 Fiscal Year 2013 FY2014
Q3 Q4 Q1 Q2 Q3 Q4 Q1 Q2 Q3 Q4 Q1 Q2
GAAP Net Income per share
$0.51 $0.32 $0.19 $0.82 $0.01 $0.10 $(0.05) $0.66 $0.17 $0.07 $0.01 $1.18
Share-based Compensation and related tax effect per
share$0.12 $0.11 $0.12 $0.12 $0.20 $0.23 $0.24 $0.24 $0.24 $0.24 $0.25 $0.22
Amortization of acquired intangible assets per share
- - - $0.03 $0.06 $0.06 $0.06 $0.06 $0.06 $0.11 $0.06 $0.06
Tax impact of Webs IP Transfer per share
- - - - $0.02 $0.01 - $0.06 $0.01 $(0.01) $0.00 $0.04
Changes in unrealized (gain) loss on currency
forward contracts included in net income per share
$0.13 $(0.03)
Unrealized currency transaction loss on
intercompany loan and the related tax effect per share
$0.00 $0.03
Non-GAAP Adjusted Net Income per share
$0.63 $0.43 $0.31 $0.97 $0.29 $0.40 $0.25 $1.02 $0.48 $0.41 $0.45 $1.50
Weighted average shares used in computing Non-
GAAP EPS
(millions)
45.079 45.156 42.569 39.041 38.346 37.620 35.793 35.156 35.217 34.633 35.005 35.118
39

Vistaprint N.V. Q2 FY2014 Earnings Presentation
Reconciliation: Free Cash Flow(in thousands)
40
Three Months Ended Six Months EndedDecember 31, December 31,
2013 2012 2013 2012
Net cash provided by operating activities $ 95,027 $ 88,533 $ 94,904 $ 95,183
Purchases of property, plant and equipment
(24,592) (27,609) (42,169) (55,368)
Purchases of intangibles assets (44) (361) (119) (370)
Capitalization of software and website development costs
(2,605) (1,839) (4,419) (3,140)
Free cash flow $ 67,786 $ 58,724 $ 48,197 $ 36,305
Reconciliation:Constant-Currency Revenue Growth RatesQuarterly
41
ASIA-PACIFIC Q3 FY11 Q4 FY11 Q1 FY12 Q2 FY12 Q3 FY12 Q4 FY12 Q1 FY13 Q2 FY13 Q3 FY13 Q4 FY13 Q1 FY14 Q2 FY14
Reported revenue growth 50% 65% 67% 41% 47% 28% 28% 26% 6% 4% (11%) (5%)
Currency impact (15%) (26%) (22%) (4%) (7%) 5% 2% (3%) 4% 4% 13% 11%
Revenue growth in constant currency
35% 39% 45% 37% 40% 33% 29% 24% 10% 8% 2% 6%
Note: Constant-currency revenue growth is estimated by translating all non-U.S. dollar denominated revenue generated in the current period using the prior year period’s average exchange rate for each currency to the U.S. dollar and excludes the impact of gains and losses on effective currency hedges recognized in revenue for applicable periods.
EUROPE Q3 FY11 Q4 FY11 Q1 FY12 Q2 FY12 Q3 FY12 Q4 FY12 Q1 FY13 Q2 FY13 Q3 FY13 Q4 FY13 Q1 FY14 Q2 FY14
Reported revenue growth 22% 38% 31% 36% 29% 18% 12% 11% 8% 3% 6% 1%
Currency impact (1%) (15%) (10%) 1% 5% 12% 11% 2% 0% (1%) (4%) (3%)
Revenue growth in constant currency
21% 22% 21% 37% 34% 30% 23% 14% 8% 2% 2% (2%)

Vistaprint N.V. Q2 FY2014 Earnings Presentation
Reconciliation:Constant-Currency Revenue Growth RatesQuarterly
42
NORTH AMERICA Q3 FY11 Q4 FY11 Q1 FY12 Q2 FY12 Q3 FY12 Q4 FY12 Q1 FY13 Q2 FY13 Q3 FY13 Q4 FY13 Q1 FY14 Q2 FY14
Reported revenue growth 21% 18% 17% 20% 23% 20% 22% 20% 15% 18% 14% 13%
Currency impact 0% 0% 0% 0% 0% 0% 0% 0% 0% 0% 1% 1%
Revenue growth in constant currency
21% 18% 17% 20% 23% 21% 22% 20% 15% 18% 15% 14%
Note: Constant-currency revenue growth is estimated by translating all non-U.S. dollar denominated revenue generated in the current period using the prior year period’s average exchange rate for each currency to the U.S. dollar and excludes the impact of gains and losses on effective currency hedges recognized in revenue for applicable periods.
TOTAL COMPANY Q3 FY11 Q4 FY11 Q1 FY12 Q2 FY12 Q3 FY12 Q4 FY12 Q1 FY13 Q2 FY13 Q3 FY13 Q4 FY13 Q1 FY14 Q2 FY14
Reported revenue growth 23% 27% 25% 28% 26% 20% 18% 16% 12% 12% 9% 6%
Currency impact (1%) (7%) (5%) 0% 2% 5% 5% 1% 0% 0% 0% 0%
Revenue growth in constant currency
22% 20% 20% 28% 28% 25% 23% 17% 12% 12% 9% 6%