Embed Size (px)
Citation preview
TIMSS AND PIRLS 2011 RELATIONSHIPS REPORT TECHNICAL APPENDIX A—READING DEMANDS 1
Technical Appendix A Quantifying the Reading Demands of the TIMSS 2011 Fourth Grade Mathematics and Science Items
Overview
This document presents the coding guide that was used in order to quantify the readability information of TIMSS 2011 mathematics and science items in preparation for the reading demands analysis found in the Impact of Reading Ability on TIMSS Mathematics and Science Achievement at the Fourth Grade: An Analysis by Item Reading Demands (Mullis, Martin, & Foy, 2013). This information was used in order to consider reading achievement at the fourth grade in PIRLS 2011 in relation to the level of reading demands in the fourth grade TIMSS 2011 mathematics and science items. This document presents an overview of the methodology used in order to code items from the TIMSS 2011 mathematics and science assessments, followed by sample mathematics and science items and their coding.
Components of Reading Demands in TIMSS 2011 Items at Fourth Grade
In order to quantify the readability information of the TIMSS fourth grade items, each individual item was coded for reading demands according to the following four dimensions: 1. Length;
2. Subject-specific Vocabulary;
3. Symbolic Language; and
4. Visual Displays.
In order to facilitate the abovementioned analysis on the impact on reading ability on TIMSS 2011 mathematics and science achievement, staff at the TIMSS & PIRLS International Study Center at Boston College generated a coding guide. This guide is presented in the following pages and provides instruction for quantifying each of these dimensions with example TIMSS mathematics and science items.
TIMSS AND PIRLS 2011 RELATIONSHIPS REPORT2 TECHNICAL APPENDIX A—READING DEMANDS
2
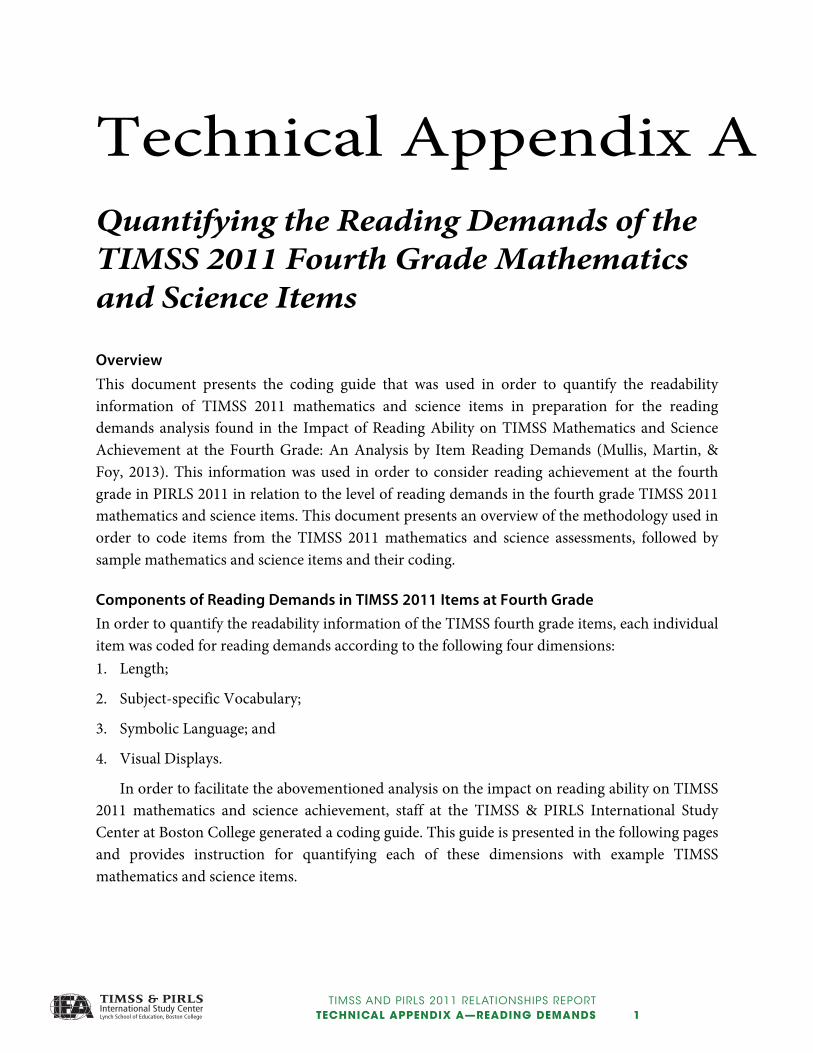
An Introduction to the TIMSS 2011 Items The TIMSS 2011 fourth grade mathematics and science items comprise three parts: the stem, stimulus, and response. The stimulus presents context information relevant to the item. The stem presents the question or prompt the student must answer. The response presents response options or provides a location for students to provide an answer. Exhibit 1 presents an example TIMSS mathematics item with each of these three components identified.
Exhibit A.1: Sample TIMSS Mathematics Item, Grade 4, with Components Identified
Coding Instructions The first step in coding items for the reading demands analysis entailed identifying the item stimulus, stem, and response. The following additional instructions were used in order to assist coders when reviewing items: 1. When multiple items are related to a single stimulus (referred to as multi-part items), the
stimulus should be counted separately for each item.
2. When evaluating items, do not include the directive phrases “Turn the page” or “Answer.” Also, do not include multiple choice option letters. While this is text that students are expected to read, such phrases are familiar to students and are used throughout the TIMSS 2011 assessment. Therefore, it is not expected to contribute significantly to the linguistic complexity of the item.
Stimulus
Stem
Response
TIMSS AND PIRLS 2011 RELATIONSHIPS REPORT TECHNICAL APPENDIX A—READING DEMANDS 3
3
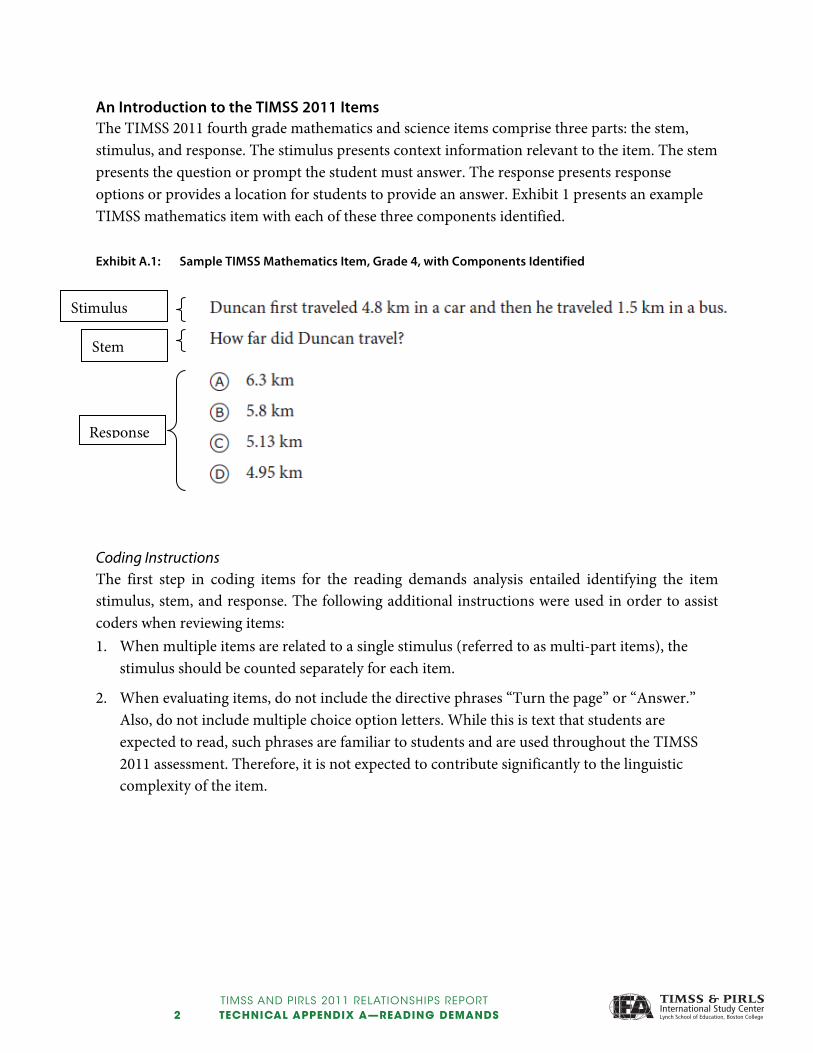
Component 1: Length1 Definition: The number of words in an item. Indicator: Count the total number of words appearing anywhere in the item, including visual displays. Do not include numerals, labels (e.g., the “A” in “Angle A”), signs of operation, units (e.g., oC), variables, or abbreviations—these are considered symbolic language.2 Exhibit A.2 presents an example TIMSS mathematics item.
Exhibit A.2: Sample TIMSS Mathematics Item, Grade 4
Number of Words: 17 Note: The directive text (“Answer”) in the response section should not be counted.
1 See Chall & Dale (1995). 2 Symbolic language is described in more detail in the Component 3 section of this guide.
TIMSS AND PIRLS 2011 RELATIONSHIPS REPORT4 TECHNICAL APPENDIX A—READING DEMANDS
4
Component 2: Subject-specific Vocabulary 3
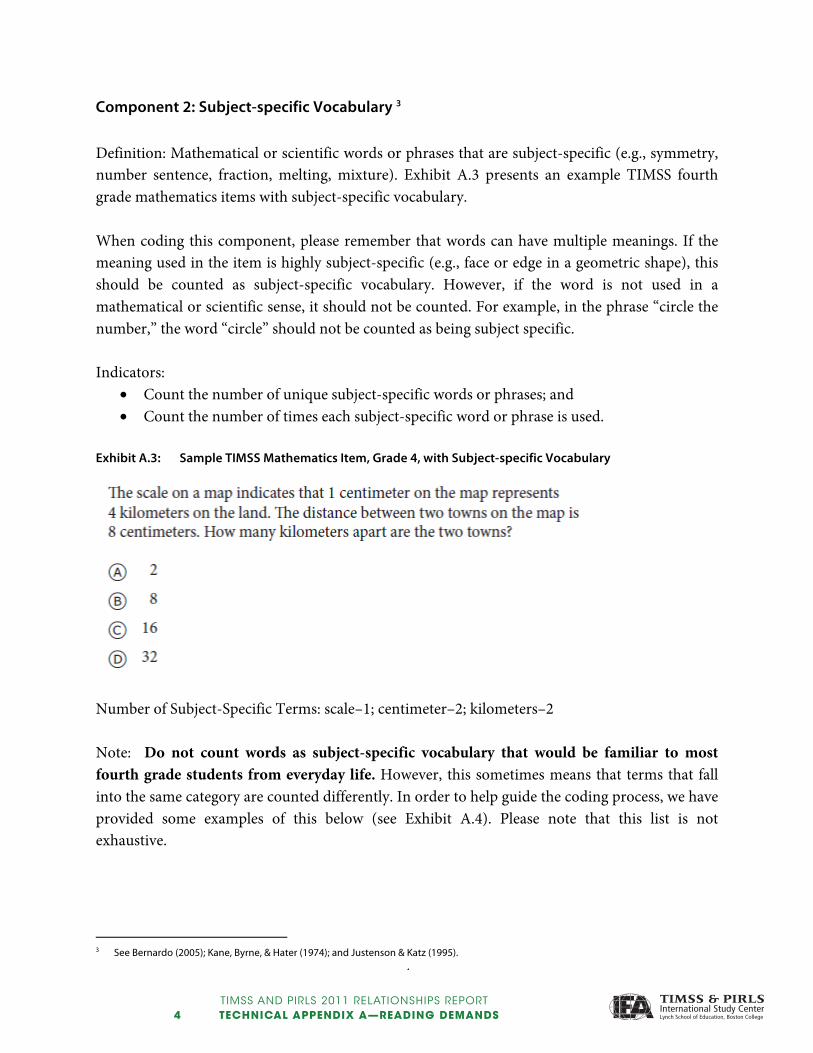
Definition: Mathematical or scientific words or phrases that are subject-specific (e.g., symmetry, number sentence, fraction, melting, mixture). Exhibit A.3 presents an example TIMSS fourth grade mathematics items with subject-specific vocabulary. When coding this component, please remember that words can have multiple meanings. If the meaning used in the item is highly subject-specific (e.g., face or edge in a geometric shape), this should be counted as subject-specific vocabulary. However, if the word is not used in a mathematical or scientific sense, it should not be counted. For example, in the phrase “circle the number,” the word “circle” should not be counted as being subject specific. Indicators:
Count the number of unique subject-specific words or phrases; and Count the number of times each subject-specific word or phrase is used.
Exhibit A.3: Sample TIMSS Mathematics Item, Grade 4, with Subject-specific Vocabulary
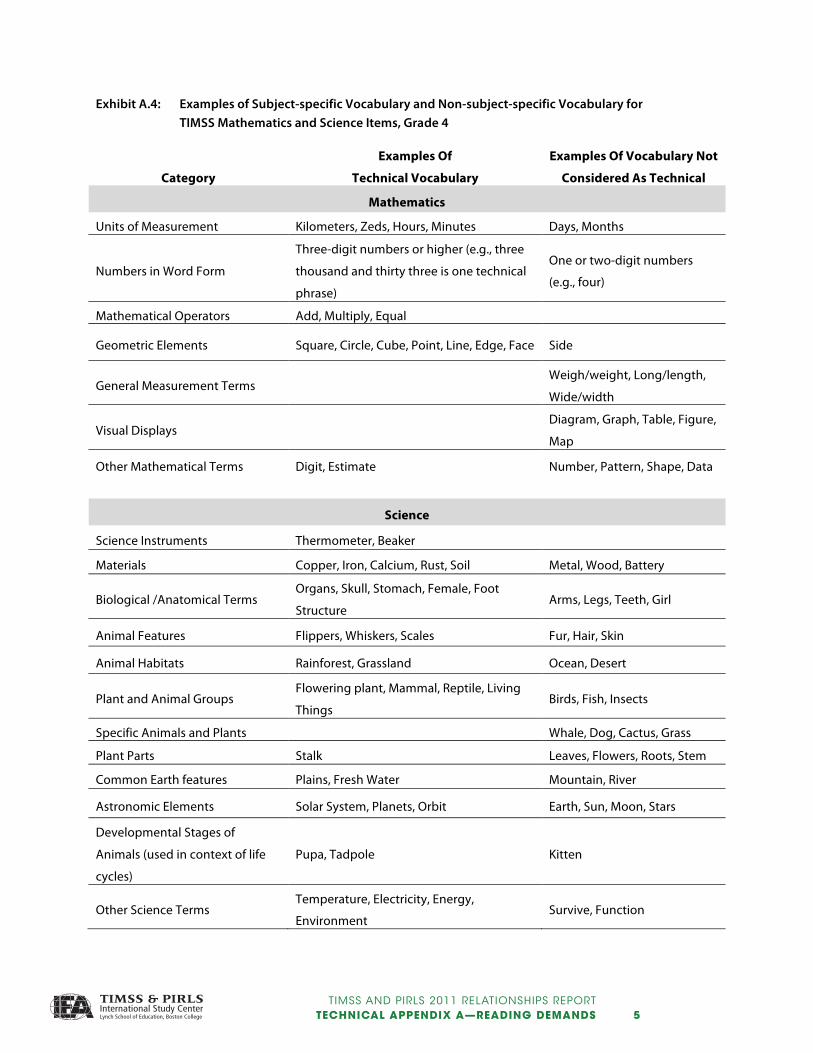
Number of Subject-Specific Terms: scale–1; centimeter–2; kilometers–2 Note: Do not count words as subject-specific vocabulary that would be familiar to most fourth grade students from everyday life. However, this sometimes means that terms that fall into the same category are counted differently. In order to help guide the coding process, we have provided some examples of this below (see Exhibit A.4). Please note that this list is not exhaustive.
3 See Bernardo (2005); Kane, Byrne, & Hater (1974); and Justenson & Katz (1995).
TIMSS AND PIRLS 2011 RELATIONSHIPS REPORT TECHNICAL APPENDIX A—READING DEMANDS 5
5
Exhibit A.4: Examples of Subject-specific Vocabulary and Non-subject-specific Vocabulary for
TIMSS Mathematics and Science Items, Grade 4
Category
Examples Of
Technical Vocabulary
Examples Of Vocabulary Not
Considered As Technical
Mathematics
Units of Measurement Kilometers, Zeds, Hours, Minutes Days, Months
Numbers in Word Form
Three-digit numbers or higher (e.g., three
thousand and thirty three is one technical
phrase)
One or two-digit numbers
(e.g., four)
Mathematical Operators Add, Multiply, Equal
Geometric Elements Square, Circle, Cube, Point, Line, Edge, Face Side
General Measurement Terms Weigh/weight, Long/length,
Wide/width
Visual Displays Diagram, Graph, Table, Figure,
Map
Other Mathematical Terms Digit, Estimate Number, Pattern, Shape, Data
Science
Science Instruments Thermometer, Beaker
Materials Copper, Iron, Calcium, Rust, Soil Metal, Wood, Battery
Biological /Anatomical Terms Organs, Skull, Stomach, Female, Foot
Structure Arms, Legs, Teeth, Girl
Animal Features Flippers, Whiskers, Scales Fur, Hair, Skin
Animal Habitats Rainforest, Grassland Ocean, Desert
Plant and Animal Groups Flowering plant, Mammal, Reptile, Living
Things Birds, Fish, Insects
Specific Animals and Plants Whale, Dog, Cactus, Grass
Plant Parts Stalk Leaves, Flowers, Roots, Stem
Common Earth features Plains, Fresh Water Mountain, River
Astronomic Elements Solar System, Planets, Orbit Earth, Sun, Moon, Stars
Developmental Stages of
Animals (used in context of life
cycles)
Pupa, Tadpole Kitten
Other Science Terms Temperature, Electricity, Energy,
Environment Survive, Function
TIMSS AND PIRLS 2011 RELATIONSHIPS REPORT6 TECHNICAL APPENDIX A—READING DEMANDS
6
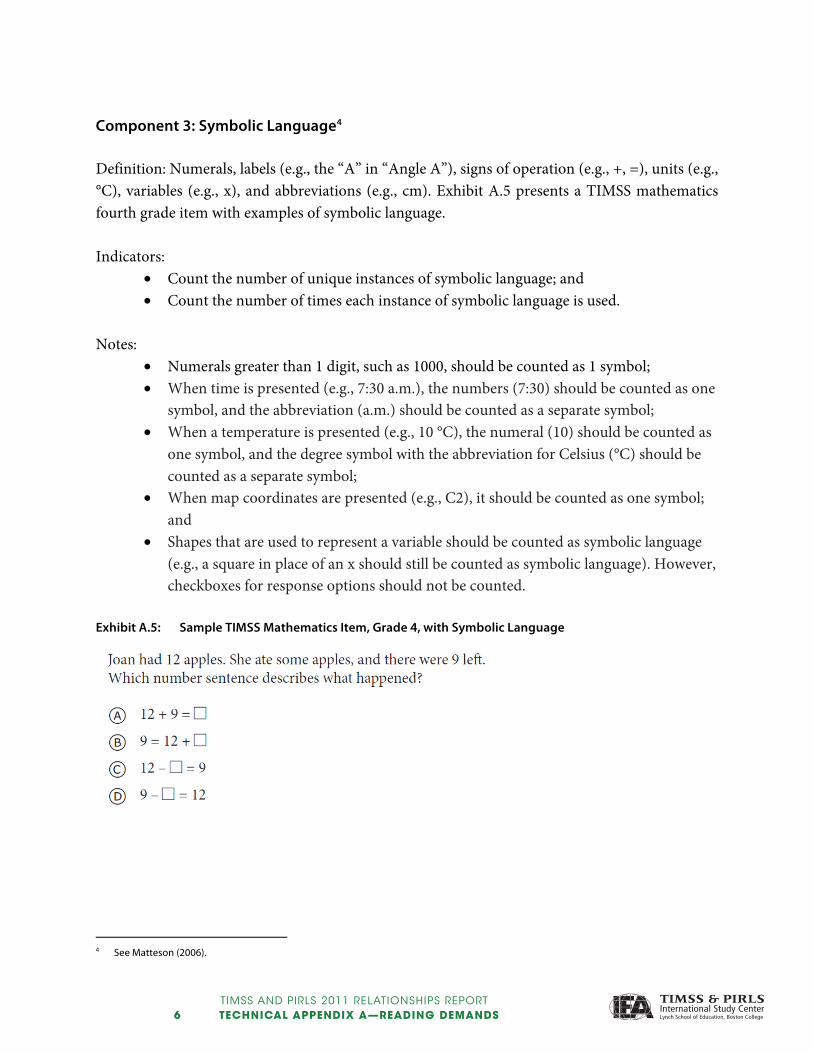
Component 3: Symbolic Language4 Definition: Numerals, labels (e.g., the “A” in “Angle A”), signs of operation (e.g., +, =), units (e.g., °C), variables (e.g., x), and abbreviations (e.g., cm). Exhibit A.5 presents a TIMSS mathematics fourth grade item with examples of symbolic language. Indicators:
Count the number of unique instances of symbolic language; and Count the number of times each instance of symbolic language is used.
Notes:
Numerals greater than 1 digit, such as 1000, should be counted as 1 symbol; When time is presented (e.g., 7:30 a.m.), the numbers (7:30) should be counted as one
symbol, and the abbreviation (a.m.) should be counted as a separate symbol; When a temperature is presented (e.g., 10 °C), the numeral (10) should be counted as
one symbol, and the degree symbol with the abbreviation for Celsius (°C) should be counted as a separate symbol;
When map coordinates are presented (e.g., C2), it should be counted as one symbol; and
Shapes that are used to represent a variable should be counted as symbolic language (e.g., a square in place of an x should still be counted as symbolic language). However, checkboxes for response options should not be counted.
Exhibit A.5: Sample TIMSS Mathematics Item, Grade 4, with Symbolic Language
4 See Matteson (2006).
TIMSS AND PIRLS 2011 RELATIONSHIPS REPORT TECHNICAL APPENDIX A—READING DEMANDS 7
7
Number of Instances of Symbolic Language: 12 (5 instances) 9 (5 instances) + (2 instances) - (2 instances) = (4 instances) ☐ (4 instances)
TIMSS AND PIRLS 2011 RELATIONSHIPS REPORT8 TECHNICAL APPENDIX A—READING DEMANDS
8
Component 4: Visual Displays
There are three steps to evaluating visual displays in the TIMSS mathematics and science fourth grade achievement items: 1. Identify the type of representation;
2. Quantify the density of the visual display; and
3. Classify whether the visual display was integral to successfully completing the item.
Note: An item may contain multiple visual displays, and these three pieces will need to be evaluated for each of them. Each of these three pieces is described separately in the following sections.
1) Type of Representation5 When coding visual displays, identify the type of visual display presented in the item. Each visual display can only be coded as one type of representation.
The 5 different types of representation, with examples of each, are defined below: Pictorial Representations; Geometric Shapes; Models; Tables; and Graphs.
Indicator: Count the number of each type of visual display.
5 Matteson, 2006; Mosenthal & Kirsch, 1998
TIMSS AND PIRLS 2011 RELATIONSHIPS REPORT TECHNICAL APPENDIX A—READING DEMANDS 9
9
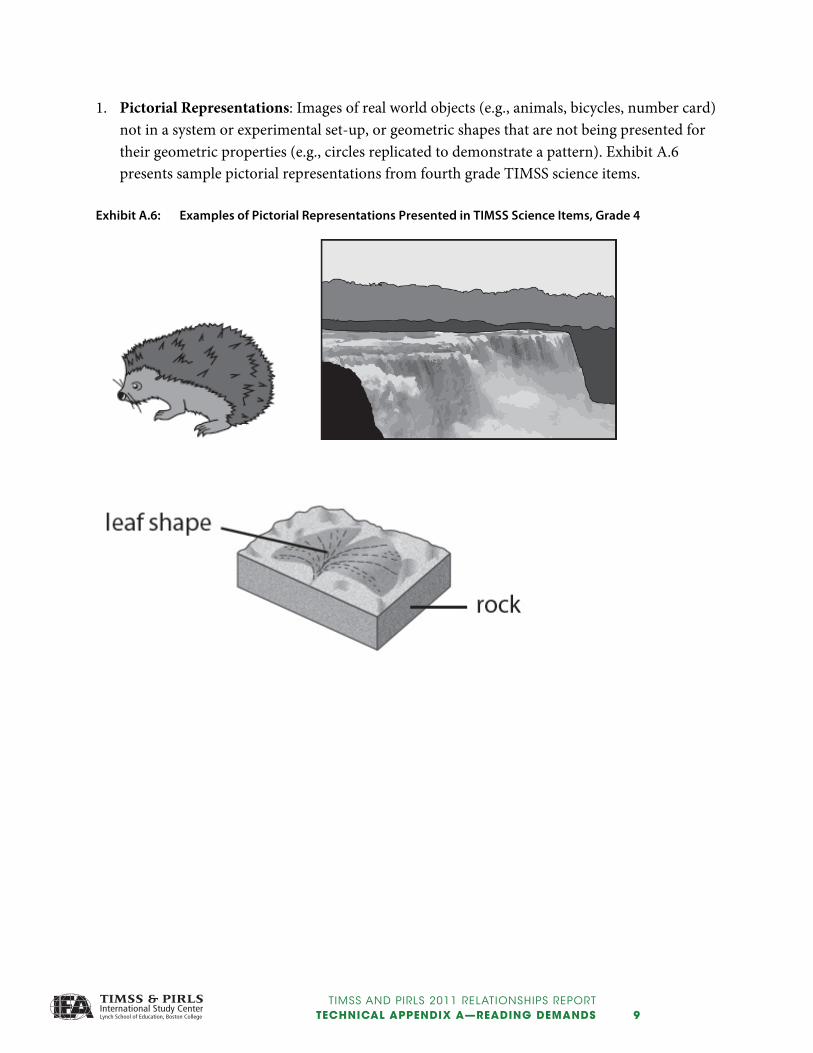
1. Pictorial Representations: Images of real world objects (e.g., animals, bicycles, number card) not in a system or experimental set-up, or geometric shapes that are not being presented for their geometric properties (e.g., circles replicated to demonstrate a pattern). Exhibit A.6 presents sample pictorial representations from fourth grade TIMSS science items.
Exhibit A.6: Examples of Pictorial Representations Presented in TIMSS Science Items, Grade 4
TIMSS AND PIRLS 2011 RELATIONSHIPS REPORT10 TECHNICAL APPENDIX A—READING DEMANDS
10
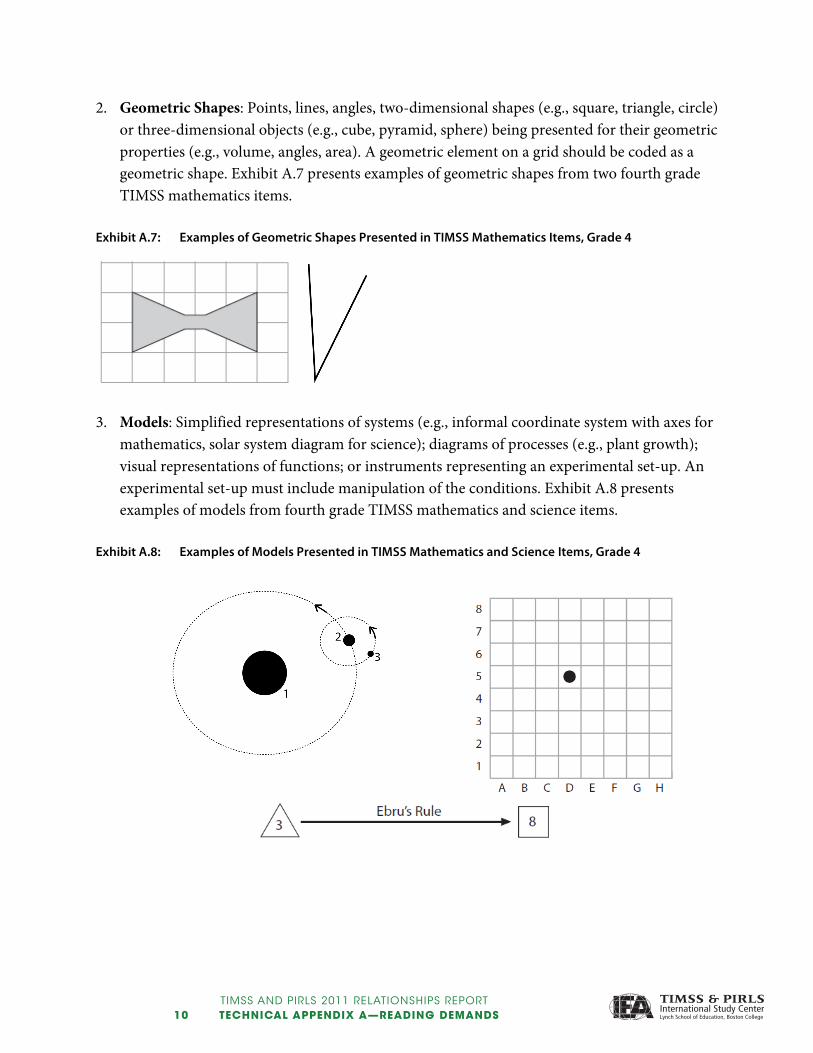
2. Geometric Shapes: Points, lines, angles, two-dimensional shapes (e.g., square, triangle, circle) or three-dimensional objects (e.g., cube, pyramid, sphere) being presented for their geometric properties (e.g., volume, angles, area). A geometric element on a grid should be coded as a geometric shape. Exhibit A.7 presents examples of geometric shapes from two fourth grade TIMSS mathematics items.
Exhibit A.7: Examples of Geometric Shapes Presented in TIMSS Mathematics Items, Grade 4
3. Models: Simplified representations of systems (e.g., informal coordinate system with axes for
mathematics, solar system diagram for science); diagrams of processes (e.g., plant growth); visual representations of functions; or instruments representing an experimental set-up. An experimental set-up must include manipulation of the conditions. Exhibit A.8 presents examples of models from fourth grade TIMSS mathematics and science items.
Exhibit A.8: Examples of Models Presented in TIMSS Mathematics and Science Items, Grade 4
TIMSS AND PIRLS 2011 RELATIONSHIPS REPORT TECHNICAL APPENDIX A—READING DEMANDS 11
11
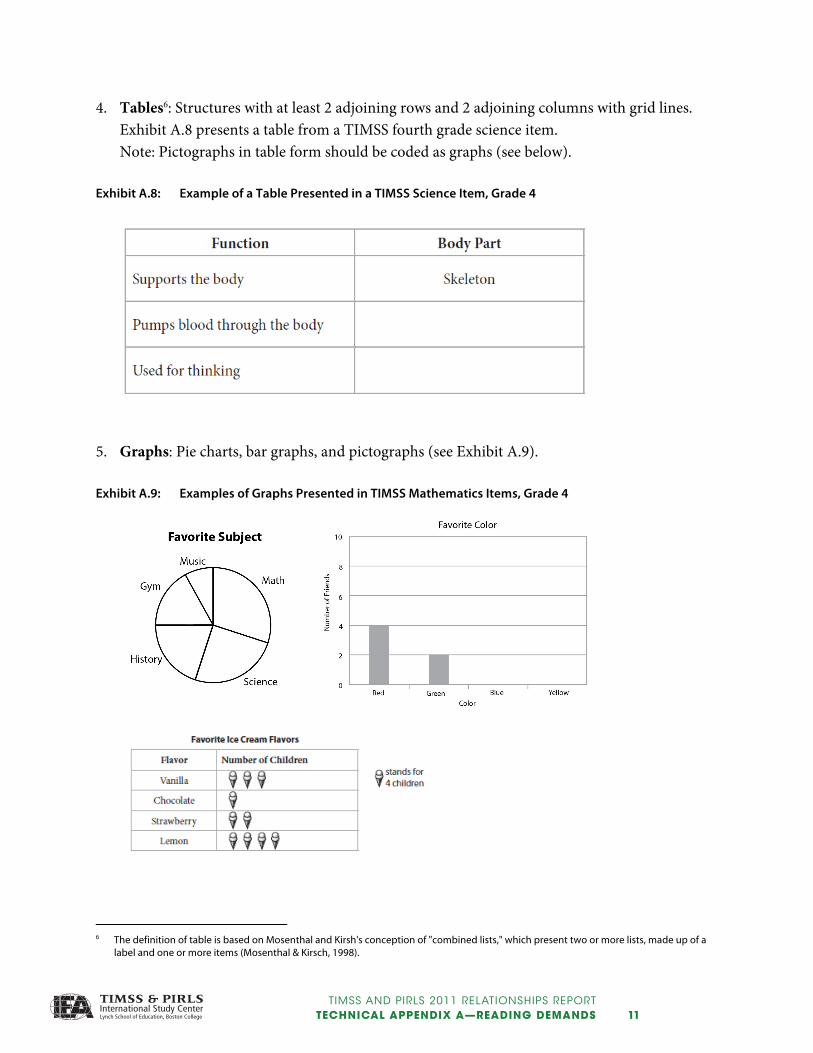
4. Tables6: Structures with at least 2 adjoining rows and 2 adjoining columns with grid lines. Exhibit A.8 presents a table from a TIMSS fourth grade science item. Note: Pictographs in table form should be coded as graphs (see below).
Exhibit A.8: Example of a Table Presented in a TIMSS Science Item, Grade 4
5. Graphs: Pie charts, bar graphs, and pictographs (see Exhibit A.9).
Exhibit A.9: Examples of Graphs Presented in TIMSS Mathematics Items, Grade 4
6 The definition of table is based on Mosenthal and Kirsh's conception of "combined lists," which present two or more lists, made up of a
label and one or more items (Mosenthal & Kirsch, 1998).
TIMSS AND PIRLS 2011 RELATIONSHIPS REPORT12 TECHNICAL APPENDIX A—READING DEMANDS
12
2) Density7 When coding visual displays, identify the density, or number of elements, a student encounters in each visual display, not including any parts of the visual display that are hidden or implied. Each visual display can only be coded as one type of representation.
The 5 different types of representation, with examples of each, are defined below: Pictorial Representations; Geometric Shapes; Models; Tables; and Graphs.
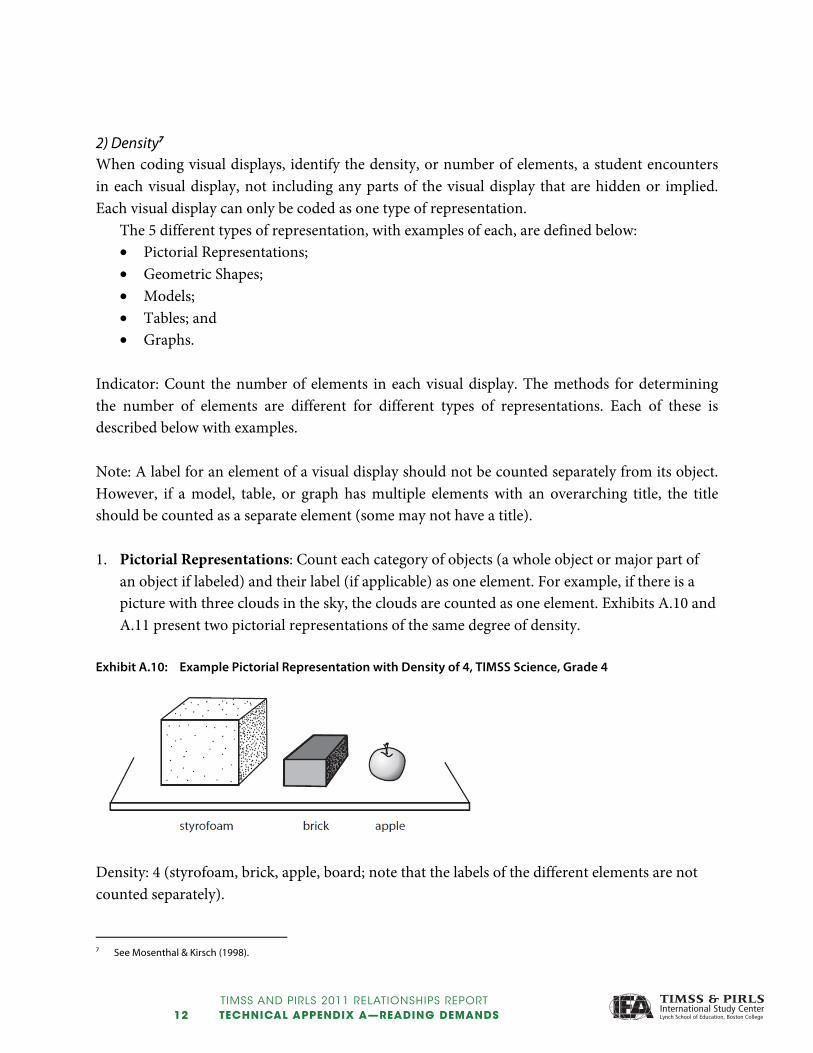
Indicator: Count the number of elements in each visual display. The methods for determining the number of elements are different for different types of representations. Each of these is described below with examples. Note: A label for an element of a visual display should not be counted separately from its object. However, if a model, table, or graph has multiple elements with an overarching title, the title should be counted as a separate element (some may not have a title). 1. Pictorial Representations: Count each category of objects (a whole object or major part of
an object if labeled) and their label (if applicable) as one element. For example, if there is a picture with three clouds in the sky, the clouds are counted as one element. Exhibits A.10 and A.11 present two pictorial representations of the same degree of density.
Exhibit A.10: Example Pictorial Representation with Density of 4, TIMSS Science, Grade 4
Density: 4 (styrofoam, brick, apple, board; note that the labels of the different elements are not counted separately).
7 See Mosenthal & Kirsch (1998).

TIMSS AND PIRLS 2011 RELATIONSHIPS REPORT TECHNICAL APPENDIX A—READING DEMANDS 13
13
Exhibit A.11: Example Pictorial Representation with Density of 4, TIMSS Science, Grade 4
Density: 4 (flower, stem, leaves, roots; note that the labels 1–4 are not counted separately).
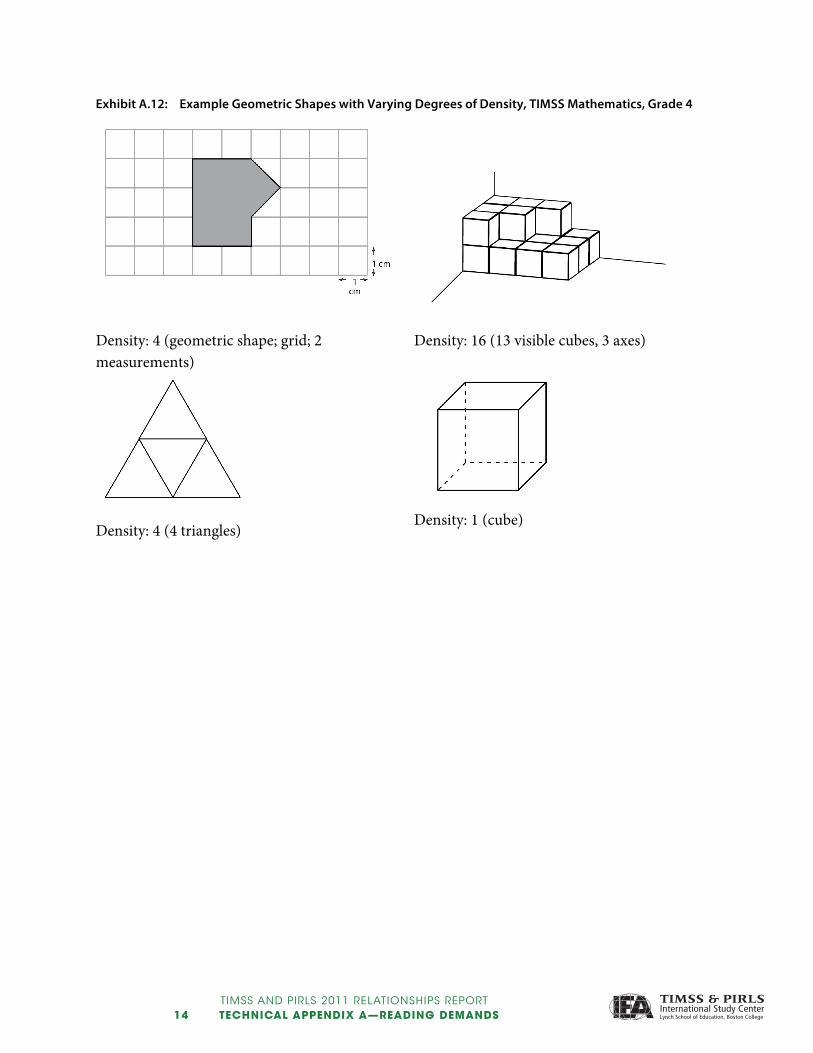
2. Geometric Shapes: Count each major geometric shape (e.g., point, line, square, or cube) and its label (if applicable) as one element. Exhibit A.12 presents examples of geometric shapes of varying density from TIMSS fourth grade mathematics items. Notes:
If a geometric shape is shown on a grid, both the shape and the grid should be counted as separate elements.
For 2-dimensional compound shapes, count each shape as a separate element (see second example below). However, for 3-dimensional objects (e.g., pyramid), count each object as one element (see third example below).
If a line has labeled endpoints, the endpoints should not be counted as elements separate from the line.
Count all right angle indicators as one element. Count all equal length or equal angle indicators as one element. Count scales, measurements, or axes as one element each.
TIMSS AND PIRLS 2011 RELATIONSHIPS REPORT14 TECHNICAL APPENDIX A—READING DEMANDS
14
Exhibit A.12: Example Geometric Shapes with Varying Degrees of Density, TIMSS Mathematics, Grade 4
Density: 4 (geometric shape; grid; 2 measurements)
Density: 16 (13 visible cubes, 3 axes)
Density: 4 (4 triangles)
Density: 1 (cube)

TIMSS AND PIRLS 2011 RELATIONSHIPS REPORT TECHNICAL APPENDIX A—READING DEMANDS 15
15
3. Models – Count each major component; that is, 1) a whole object, or 2) major part of an object that is labeled. A label is counted with its object, not separately. If there are grids or axes in the model, these should each be counted as separate elements. Exhibit A.13 and A.14 present examples of models of varying density from TIMSS fourth grade items.
Exhibit A.13: Example Model with High Density, TIMSS Mathematics, Grade 4
Density: 12 (4 labeled streets; 5 labeled locations; 2 axes; 1 grid)
Exhibit A.14: Example Model with Low Density, TIMSS Science, Grade 4
Density: 3 (1 light bulb; 1 battery; 1 wire)
TIMSS AND PIRLS 2011 RELATIONSHIPS REPORT16 TECHNICAL APPENDIX A—READING DEMANDS
16
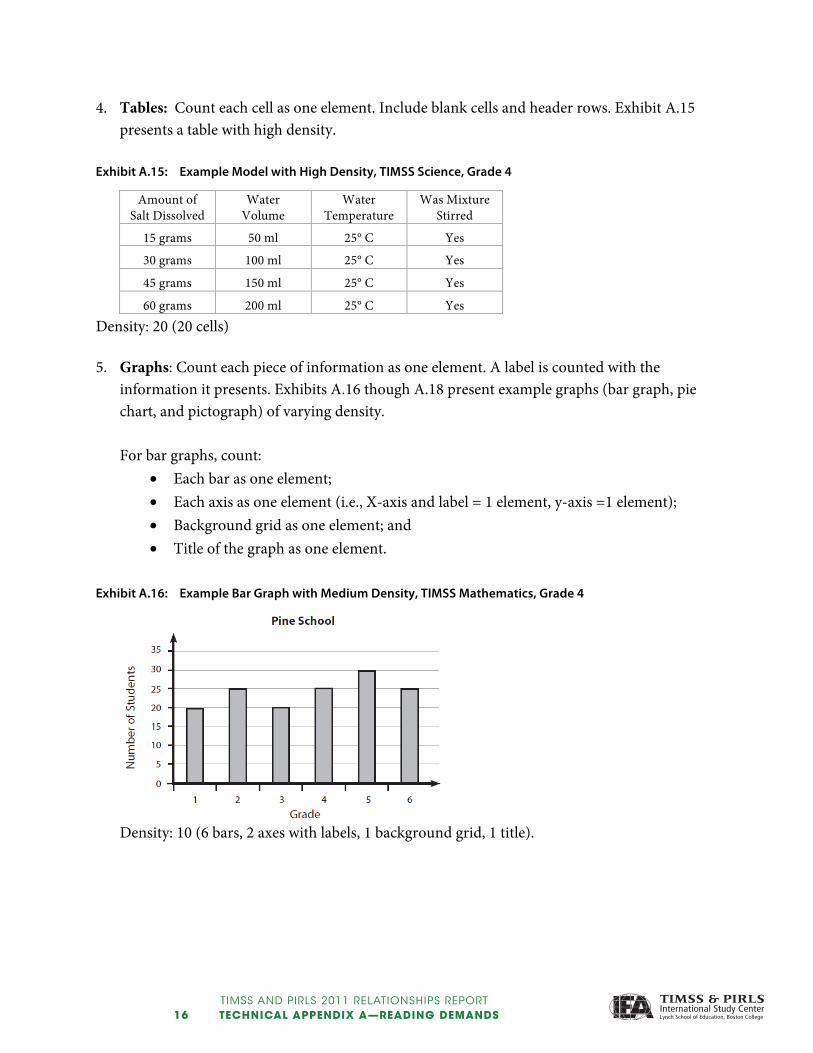
4. Tables: Count each cell as one element. Include blank cells and header rows. Exhibit A.15 presents a table with high density.
Exhibit A.15: Example Model with High Density, TIMSS Science, Grade 4
Amount of Salt Dissolved
Water Volume
Water Temperature
Was Mixture Stirred
15 grams 50 ml 25° C Yes
30 grams 100 ml 25° C Yes
45 grams 150 ml 25° C Yes
60 grams 200 ml 25° C Yes Density: 20 (20 cells) 5. Graphs: Count each piece of information as one element. A label is counted with the
information it presents. Exhibits A.16 though A.18 present example graphs (bar graph, pie chart, and pictograph) of varying density. For bar graphs, count:
Each bar as one element; Each axis as one element (i.e., X-axis and label = 1 element, y-axis =1 element); Background grid as one element; and Title of the graph as one element.
Exhibit A.16: Example Bar Graph with Medium Density, TIMSS Mathematics, Grade 4
Density: 10 (6 bars, 2 axes with labels, 1 background grid, 1 title).
TIMSS AND PIRLS 2011 RELATIONSHIPS REPORT TECHNICAL APPENDIX A—READING DEMANDS 17
17
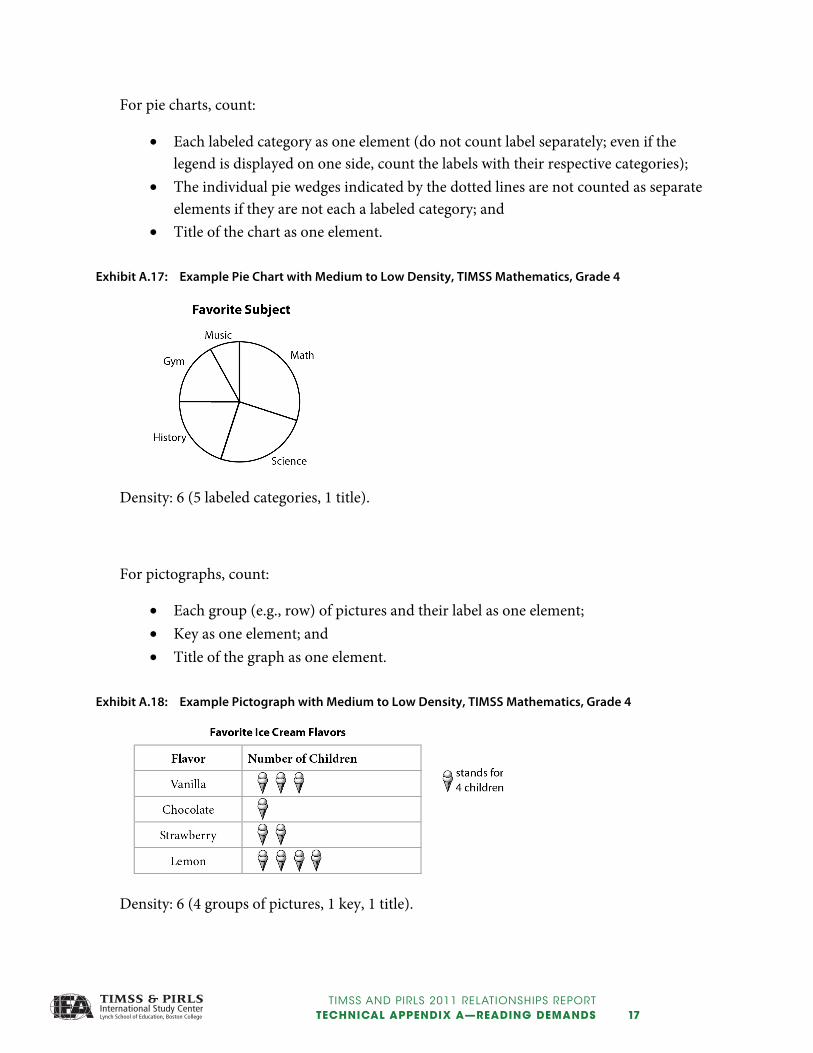
For pie charts, count:
Each labeled category as one element (do not count label separately; even if the legend is displayed on one side, count the labels with their respective categories);
The individual pie wedges indicated by the dotted lines are not counted as separate elements if they are not each a labeled category; and
Title of the chart as one element.
Exhibit A.17: Example Pie Chart with Medium to Low Density, TIMSS Mathematics, Grade 4
Density: 6 (5 labeled categories, 1 title).
For pictographs, count:
Each group (e.g., row) of pictures and their label as one element; Key as one element; and Title of the graph as one element.
Exhibit A.18: Example Pictograph with Medium to Low Density, TIMSS Mathematics, Grade 4
Density: 6 (4 groups of pictures, 1 key, 1 title).

TIMSS AND PIRLS 2011 RELATIONSHIPS REPORT18 TECHNICAL APPENDIX A—READING DEMANDS
18
3) Interaction Definition: A measure of whether or not a student must interact with visual displays in an item. Interactions include retrieving information from the display (e.g., from graphs, tables, or other sources), and interpreting relevant textual, tabular, or graphical information in light of a mathematics or science principle. Indicator: Classify each visual display as supportive or necessary.
Supportive: the item can be successfully completed without the visual display (see Exhibit A.19).
Necessary: a student must use information presented in the display to successfully complete the item (see Exhibit A.20).
Exhibit A.19: Example of a Supportive Visual Display, TIMSS Science, Grade 4
Interaction: Supportive (This item could be successfully completed using only the text).

TIMSS AND PIRLS 2011 RELATIONSHIPS REPORT TECHNICAL APPENDIX A—READING DEMANDS 19
19
Exhibit A.20: Example of a Necessary Visual Display, TIMSS Mathematics, Grade 4
Interaction: Necessary (If the display were removed, the student could not successfully complete the item.)

TIMSS AND PIRLS 2011 RELATIONSHIPS REPORT20 TECHNICAL APPENDIX A—READING DEMANDS
20
Sample Coding Items
This section contains several examples of TIMSS items and the coding values that they would receive for each reading demand component (see Exhibits A.21 and A.22).
Exhibit A.21: Example TIMSS Mathematics Coding Item, Grade 4
Length: 18 words Subject-specific Vocabulary: 0 Symbolic Language: cm (5 instances); 1, 2, 3, 4, 6, 9 (1 instance each); 5, 7, 8, 10
(2 instances each) Visual Displays: Type of Visual Display: Pictorial Representation
Density: 2 (1 ruler; 1 string) Interaction: Necessary
TIMSS AND PIRLS 2011 RELATIONSHIPS REPORT TECHNICAL APPENDIX A—READING DEMANDS 21
21
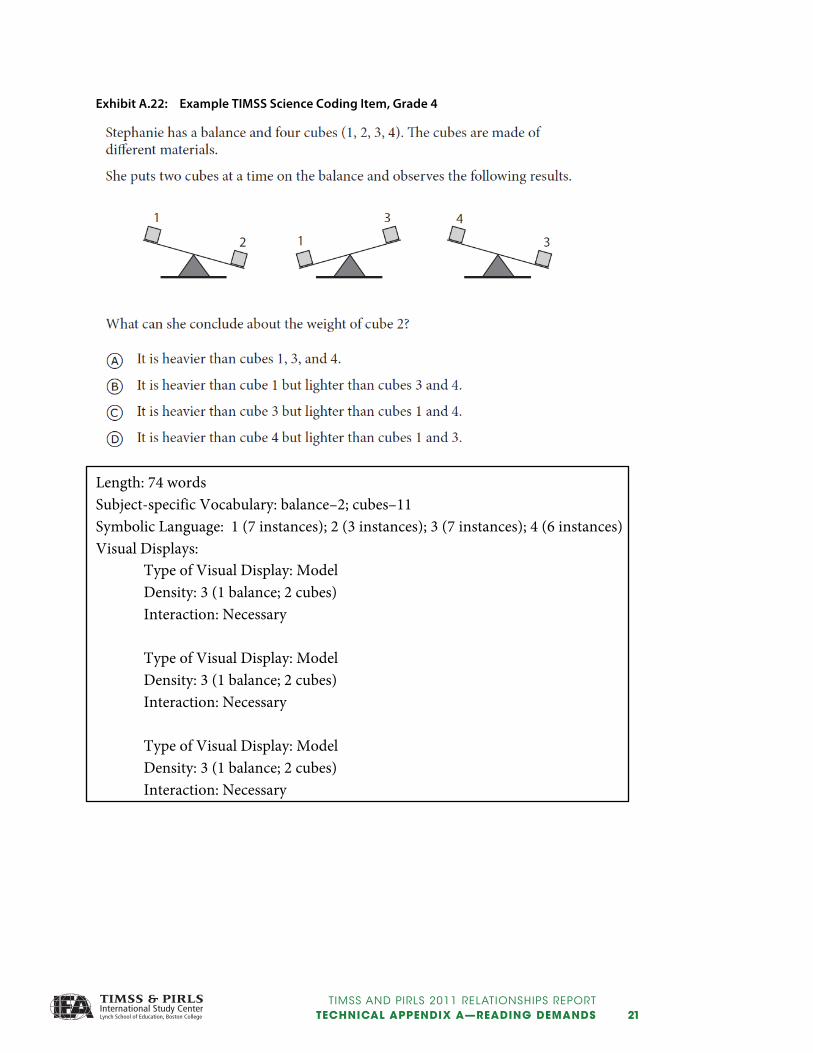
Exhibit A.22: Example TIMSS Science Coding Item, Grade 4
Length: 74 words Subject-specific Vocabulary: balance–2; cubes–11 Symbolic Language: 1 (7 instances); 2 (3 instances); 3 (7 instances); 4 (6 instances) Visual Displays: Type of Visual Display: Model
Density: 3 (1 balance; 2 cubes) Interaction: Necessary
Type of Visual Display: Model Density: 3 (1 balance; 2 cubes) Interaction: Necessary
Type of Visual Display: Model Density: 3 (1 balance; 2 cubes) Interaction: Necessary

TIMSS AND PIRLS 2011 RELATIONSHIPS REPORT22 TECHNICAL APPENDIX A—READING DEMANDS
22
Sample Item Coding Rationales
Exhibits A.23 through A.27 present items that illustrate some of the finer points of the reading demands coding guide, discussed above, and that raised some discussion during the coding process. To aid researchers in understanding the application of the reading demands coding guide to these items, rationales explaining the coding decisions have been provided.
Exhibit A.23: Item M03_08 (TIMSS Mathematics, Grade 4)
Length: 10 words Subject-specific Vocabulary: 0 Symbolic Language: A (2 instances); B (2 instances); C (2 instances) Visual Displays: Type of Visual Display: Pictorial Representation
Density: 4 (bus; window; wheel; sign) Interaction: Necessary
This visual display is considered a pictorial representation, even though it contains some geometric shapes. Each visual display must be categorized as one type and the display is predominantly a real-world object. However, each geometric shape within the bus is labeled, and therefore each is considered as a unique element of density.
TIMSS AND PIRLS 2011 RELATIONSHIPS REPORT TECHNICAL APPENDIX A—READING DEMANDS 23
23
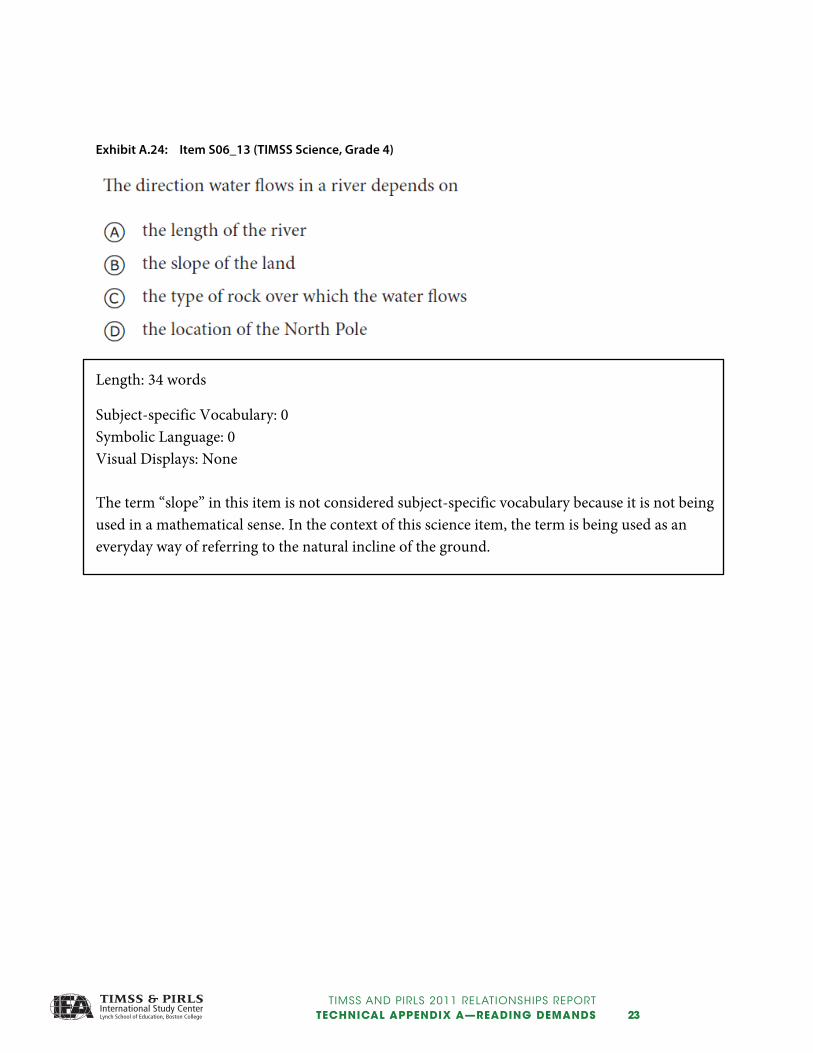
Exhibit A.24: Item S06_13 (TIMSS Science, Grade 4)
Length: 34 words
Subject-specific Vocabulary: 0 Symbolic Language: 0 Visual Displays: None
The term “slope” in this item is not considered subject-specific vocabulary because it is not being used in a mathematical sense. In the context of this science item, the term is being used as an everyday way of referring to the natural incline of the ground.
TIMSS AND PIRLS 2011 RELATIONSHIPS REPORT24 TECHNICAL APPENDIX A—READING DEMANDS
24
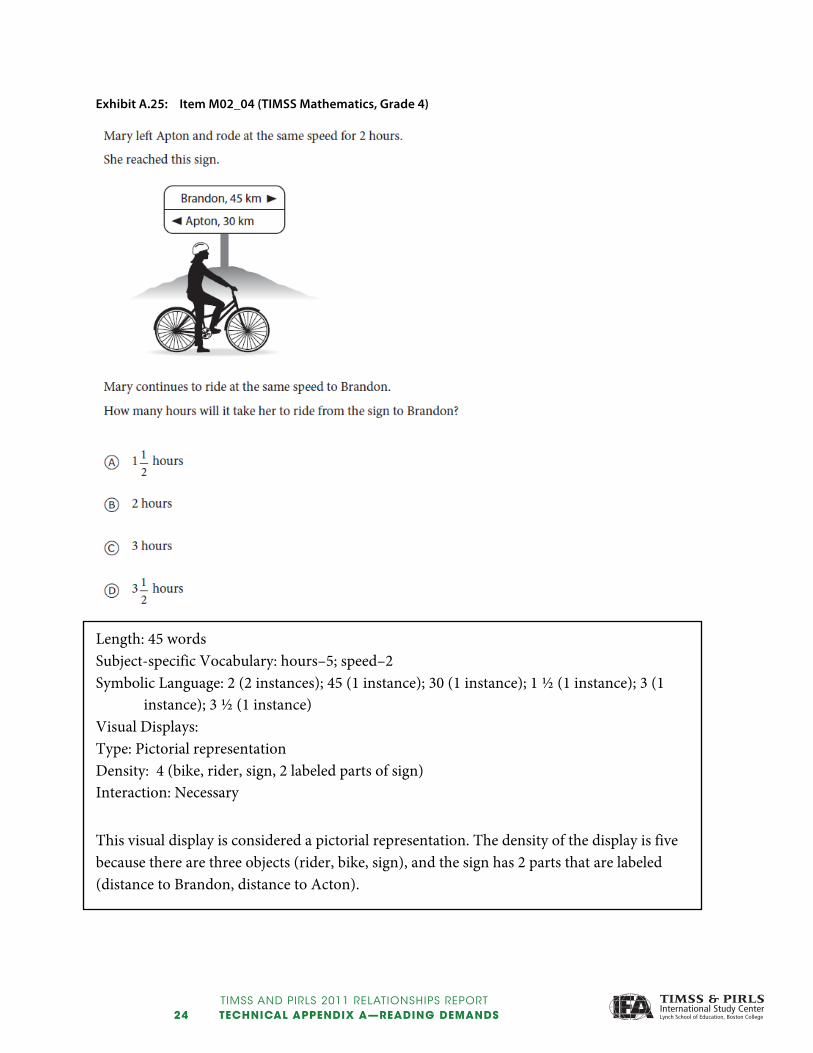
Exhibit A.25: Item M02_04 (TIMSS Mathematics, Grade 4)
Length: 45 words Subject-specific Vocabulary: hours–5; speed–2 Symbolic Language: 2 (2 instances); 45 (1 instance); 30 (1 instance); 1 ½ (1 instance); 3 (1
instance); 3 ½ (1 instance)Visual Displays: Type: Pictorial representation Density: 4 (bike, rider, sign, 2 labeled parts of sign) Interaction: Necessary This visual display is considered a pictorial representation. The density of the display is five because there are three objects (rider, bike, sign), and the sign has 2 parts that are labeled (distance to Brandon, distance to Acton).
TIMSS AND PIRLS 2011 RELATIONSHIPS REPORT TECHNICAL APPENDIX A—READING DEMANDS 25
25
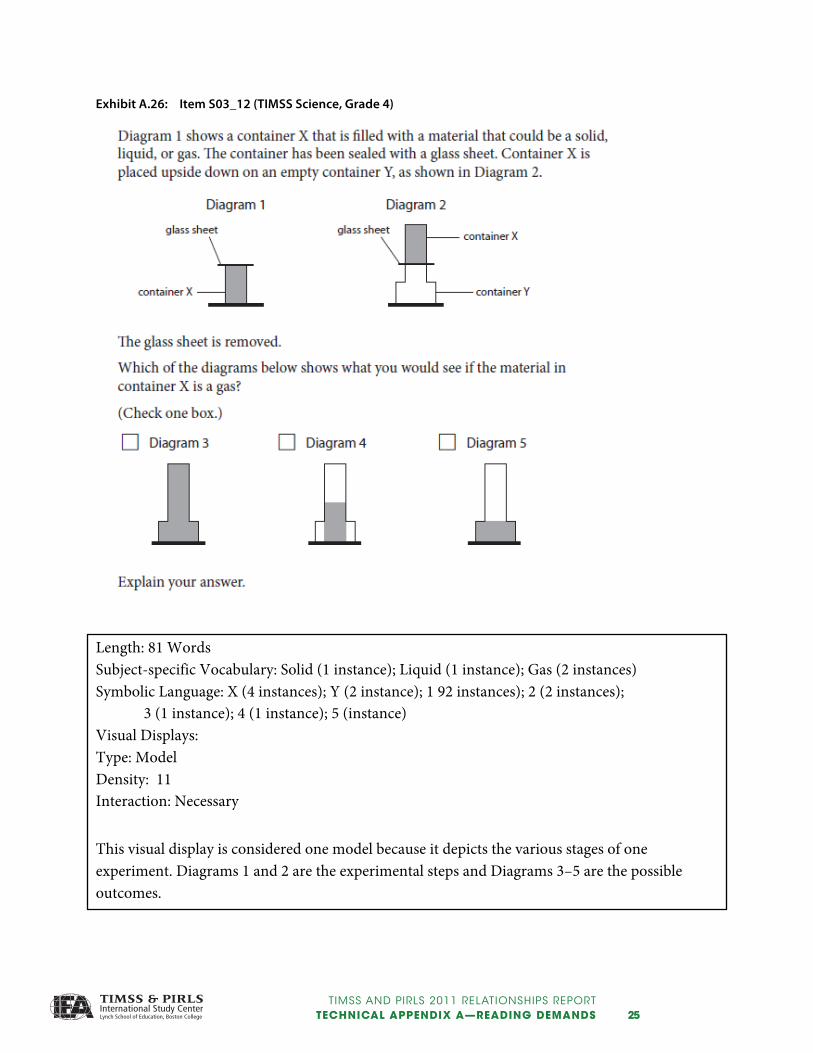
Exhibit A.26: Item S03_12 (TIMSS Science, Grade 4)
Length: 81 Words Subject-specific Vocabulary: Solid (1 instance); Liquid (1 instance); Gas (2 instances) Symbolic Language: X (4 instances); Y (2 instance); 1 92 instances); 2 (2 instances);
3 (1 instance); 4 (1 instance); 5 (instance)Visual Displays: Type: Model Density: 11 Interaction: Necessary This visual display is considered one model because it depicts the various stages of one experiment. Diagrams 1 and 2 are the experimental steps and Diagrams 3–5 are the possible outcomes.

TIMSS AND PIRLS 2011 RELATIONSHIPS REPORT26 TECHNICAL APPENDIX A—READING DEMANDS
26
Exhibit A.27: Item S05_04 (TIMSS Science, Grade 4)
Length: 43 Subject-specific Vocabulary: 0 Symbolic Language: 1 (5 instances); 2 (5 instances) Visual Displays: Type: Model
Density: 4 (2 pairs of eyes, 2 pairs of eyebrows) Interaction: Necessary
This visual display is considered a model because it shows the change in the eyes when the light conditions are altered. There are four elements of density because each pair of eyes is counted as an object, as are each pair of eyebrows. Please note that the labels are not counted separately from the eyes that they are labeling, and that the noses are not counted because the entire nose is not shown.
TIMSS AND PIRLS 2011 RELATIONSHIPS REPORT TECHNICAL APPENDIX A—READING DEMANDS 27
27
References Berardo, A.B.I. (2005). Language and modeling word problems in mathematics among bilinguals. The Journal of
Psychology, 139(5), 413-425.
Chall, J.S. & Dale, E. (1995). Readability revisited: The new Dale–Chall readability formula. Cambridge, MA: Brookline Books.
Hunt, K.W. (1970). Syntactic maturity in school children and adults. Monographs of the Society for Research in Child Development, 35 (1, Serial No. 134).
Justenson, J.S. & Katz, S.M. (1995). Technical terminology: Some linguistic properties and an algorithm for identification in text. Natural Language Engineering, 1(1), 9–27.
Kane, R.B., Byrne, M.A., & Hater, M.A. (1974). Helping children read mathematics. New York, NY: American Book Company.
Matteson, S.M. (2006). Mathematical literacy and standardized mathematics assessments. Reading Psychology, 27(2–3), 205–233.
Mosenthal, P.B. & Kirsch, I.S. (1998). A new measure for assessing document complexity: The PMOSE/IKIRSCH document readability formula. Journal of Adolescent & Adult Literacy, 41(8), 638–657.
Mullis, I.V.S., Martin, M.O., & Foy, P. (2013). The impact of reading ability on TIMSS mathematics and science achievement at the fourth grade: An analysis by item reading demands. In M.O. Martin & I.V.S. Mullis (Eds.), TIMSS and PIRLS 2011: Relationships Among Reading, Mathematics, and Science Achievement at the Fourth Grade—Implications for Early Learning. Chestnut Hill, MA: TIMSS & PIRLS International Study Center at Boston College.