Embed Size (px)
Citation preview

1
Ragnar Tveteras University of Stavanger Norway Professor Ragnar Tveteras is a business economist at the University of Stavanger’s Department for Industrial Economics, Risk Management and Planning. His research focuses primarily on aquaculture and seafood markets. As a writer and lecturer, he maintains relationships with authorities and private decision makers at the regional, national and international levels.
Fish Production Estimates & Trends, 2013-2014
Ragnar Nystoyl Ragnar Tveteras

Acknowledgements • Organizations: GAA, Urner Barry, Norwegian
Seafood Council, Eurostat, FAO, Apromar, IMF.
• Darryl Jory, Paul S. Valle, Apostolos Tzoumas, Brian O’Hanlon, Chris Calogeras , Dr. P.E.Vijay Anand , Jack Zhang Chunbin, Kevin Fitzsimmons, Liu Liping, M Siva Prasad, Mauricio Castro, Philip Shin, Ronald Cheong, Sergio Zimmermann, Tzyh-Chung Miaw, Sigbjorn Tveteras, and many anonymous sources.
3
4
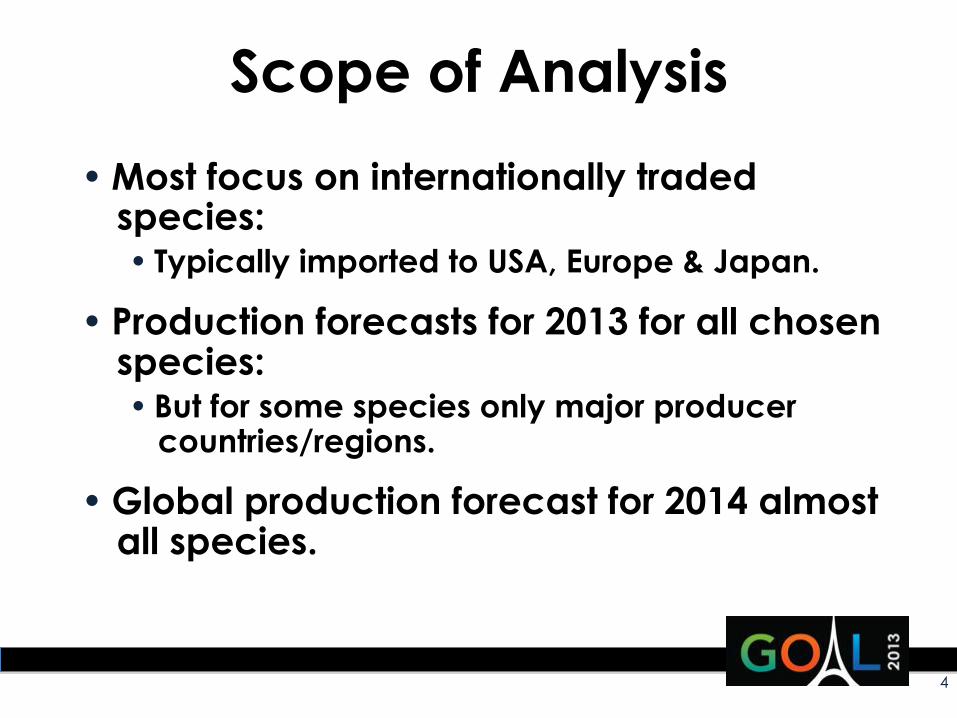
Scope of Analysis • Most focus on internationally traded
species: • Typically imported to USA, Europe & Japan.
• Production forecasts for 2013 for all chosen species: • But for some species only major producer
countries/regions.
• Global production forecast for 2014 almost all species.
5
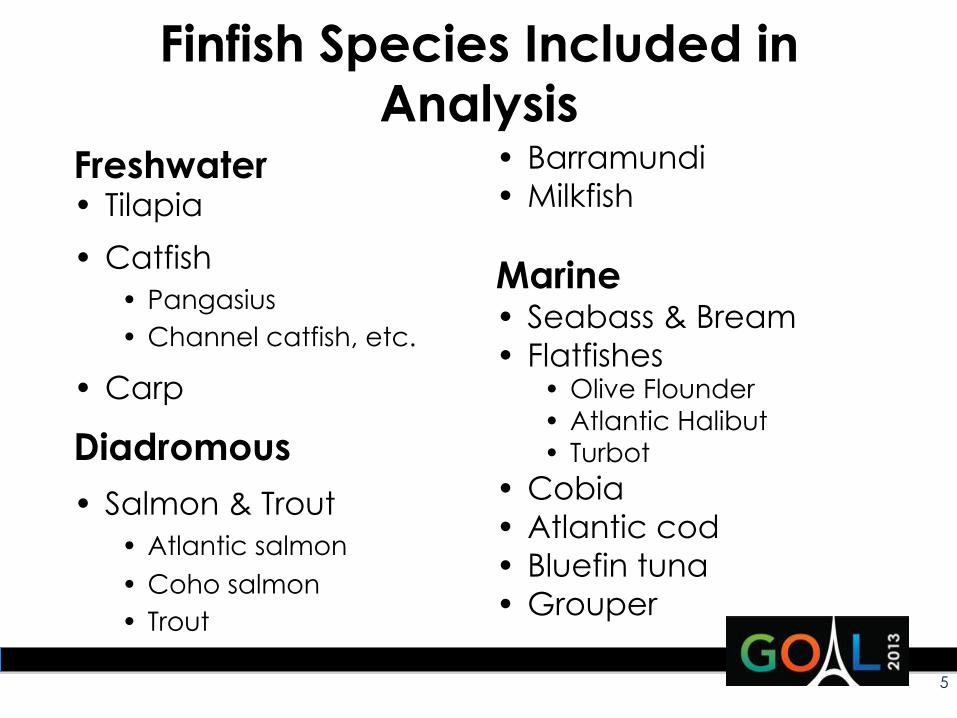
Finfish Species Included in Analysis
Freshwater • Tilapia • Catfish
• Pangasius • Channel catfish, etc.
• Carp
Diadromous • Salmon & Trout
• Atlantic salmon • Coho salmon • Trout
• Barramundi • Milkfish Marine • Seabass & Bream • Flatfishes
• Olive Flounder • Atlantic Halibut • Turbot
• Cobia • Atlantic cod • Bluefin tuna • Grouper

FRESHWATER
6
TILAPIA
8
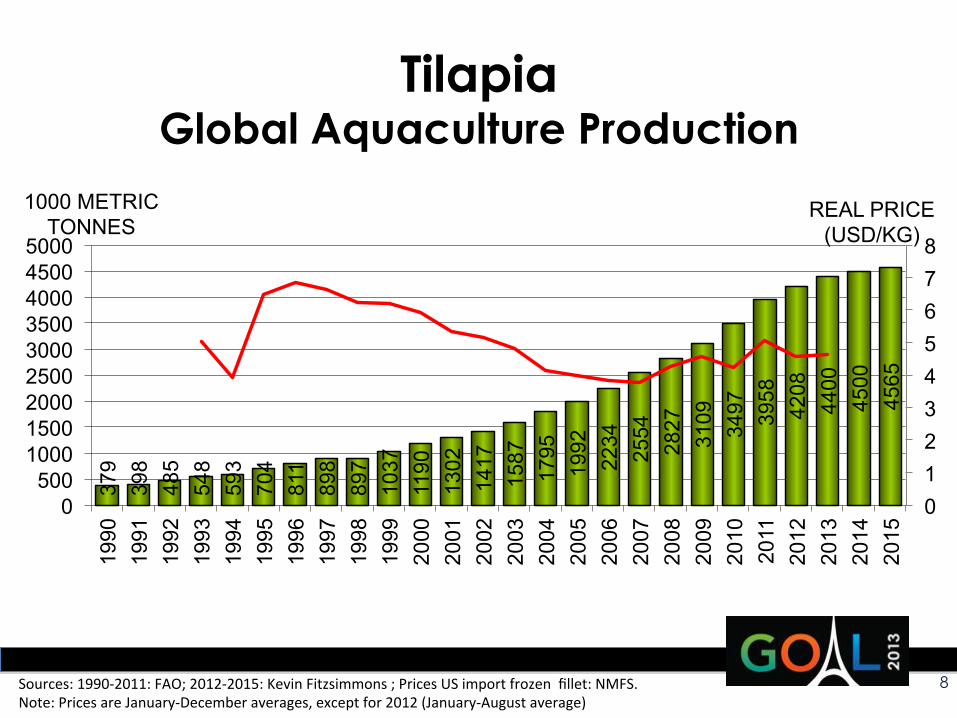
Tilapia Global Aquaculture Production
379
398
485
548
593
704
811
898
897
1037
11
90
1302
14
17
1587
17
95
1992
22
34
2554
28
27
3109
34
97
3958
42
08
4400
45
00
4565
0 1 2 3 4 5 6 7 8
0 500
1000 1500 2000 2500 3000 3500 4000 4500 5000
1990
19
91
1992
19
93
1994
19
95
1996
19
97
1998
19
99
2000
20
01
2002
20
03
2004
20
05
2006
20
07
2008
20
09
2010
20
11
2012
20
13
2014
20
15
REAL PRICE (USD/KG)
1000 METRIC TONNES
Sources: 1990-‐2011: FAO; 2012-‐2015: Kevin Fitzsimmons ; Prices US import frozen fillet: NMFS. Note: Prices are January-‐December averages, except for 2012 (January-‐August average)
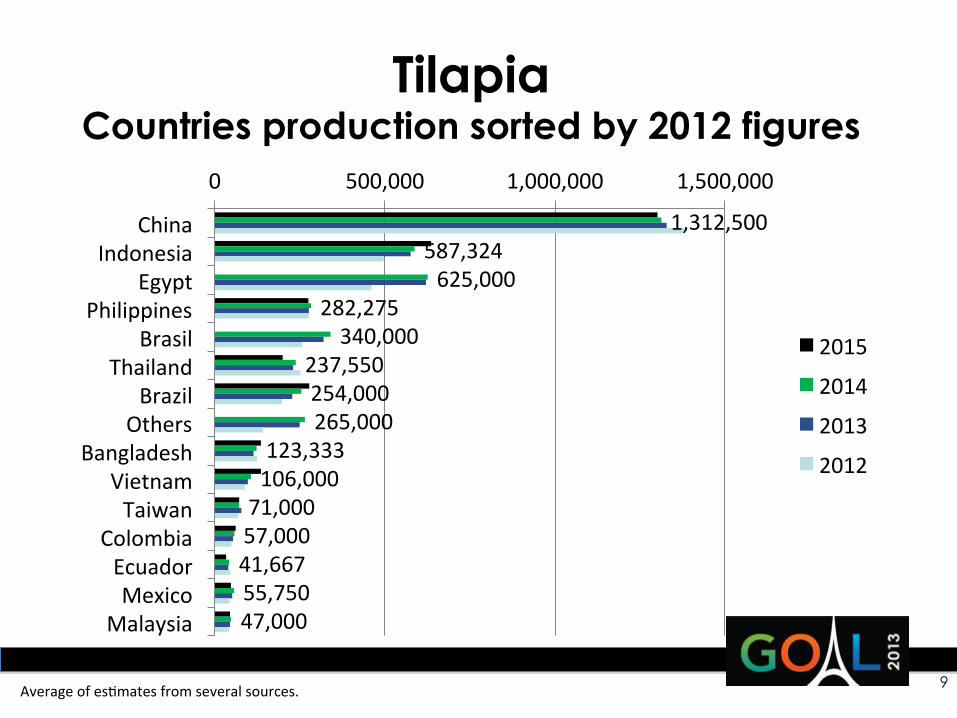
Tilapia Countries production sorted by 2012 figures
1,312,500 587,324 625,000
282,275 340,000
237,550 254,000 265,000
123,333 106,000 71,000 57,000 41,667 55,750 47,000
0 500,000 1,000,000 1,500,000
China Indonesia
Egypt Philippines
Brasil Thailand
Brazil Others
Bangladesh Vietnam Taiwan
Colombia Ecuador Mexico
Malaysia
2015
2014
2013
2012
9 Average of es\mates from several sources.
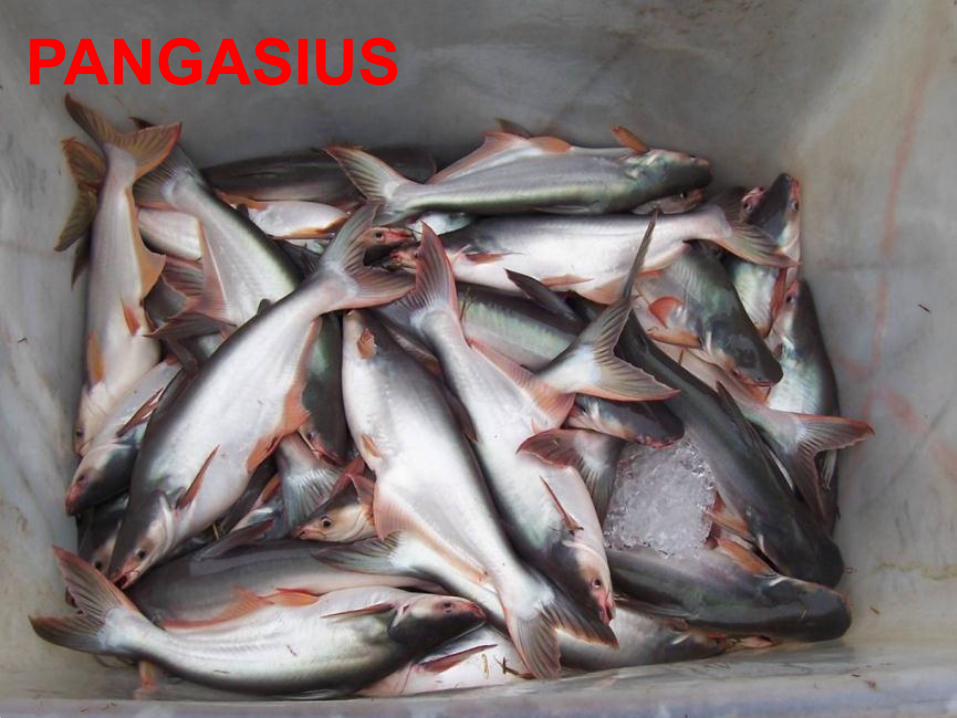
PANGASIUS
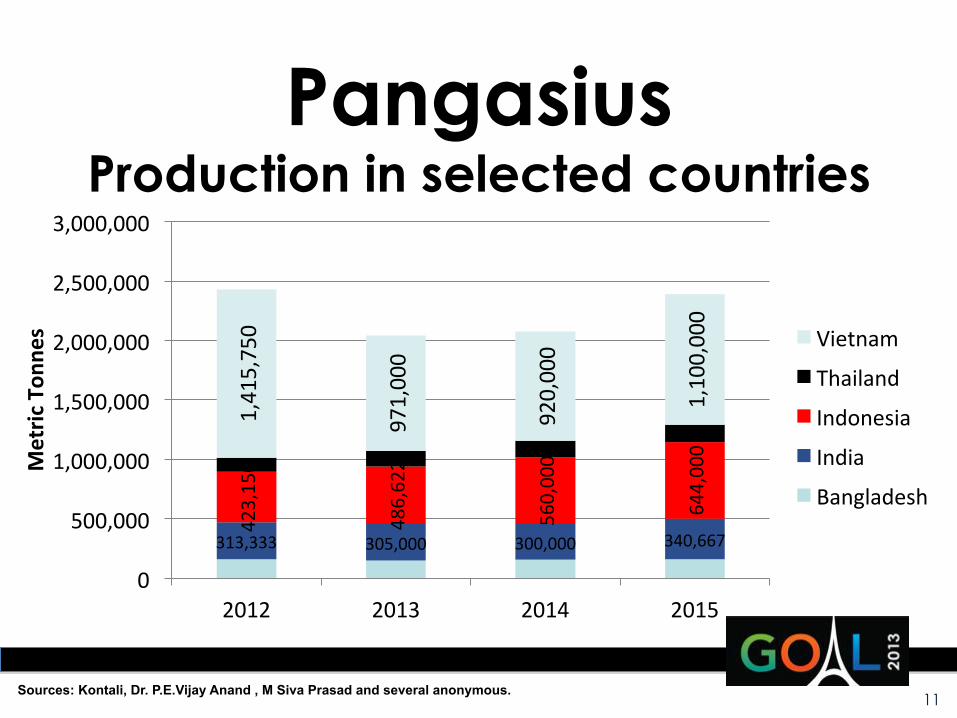
Pangasius Production in selected countries
313,333 305,000 300,000 340,667
423,150
486,622
560,000
644,000
1,415,750
971,000
920,000
1,100,000
0
500,000
1,000,000
1,500,000
2,000,000
2,500,000
3,000,000
2012 2013 2014 2015
Metric
Ton
nes Vietnam
Thailand
Indonesia
India
Bangladesh
11 Sources: Kontali, Dr. P.E.Vijay Anand , M Siva Prasad and several anonymous.
12
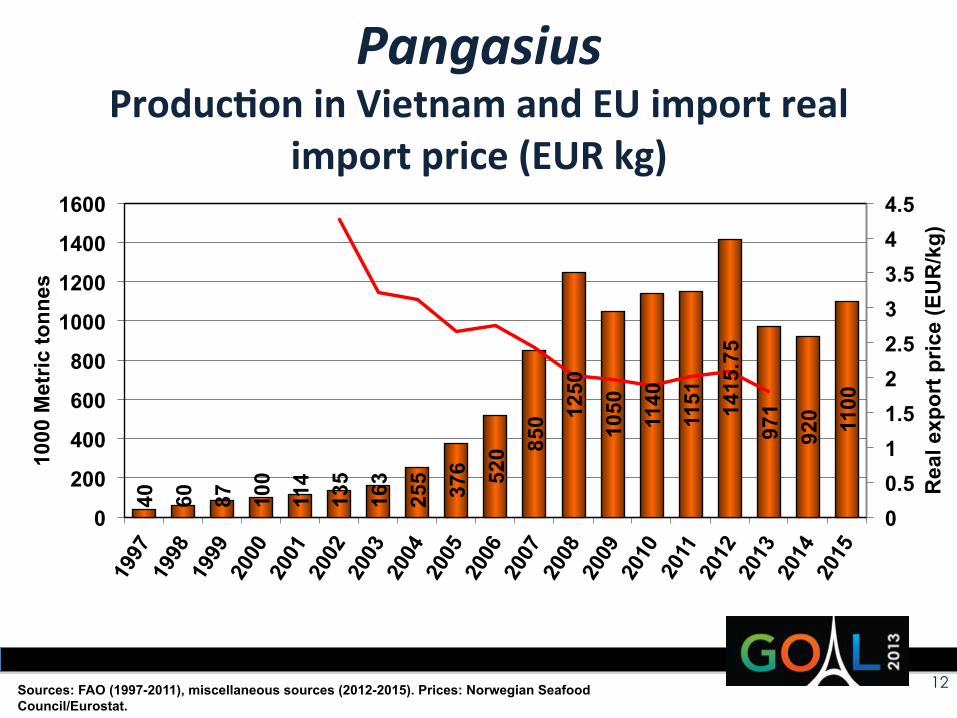
40
60
87
100
114
135
163
255 376 52
0 85
0 12
50
1050
1140
1151
1415
.75
971
920 1100
0 0.5 1 1.5 2 2.5 3 3.5 4 4.5
0
200
400
600
800
1000
1200
1400
1600
Rea
l exp
ort p
rice
(EU
R/k
g)
1000
Met
ric to
nnes
Sources: FAO (1997-2011), miscellaneous sources (2012-2015). Prices: Norwegian Seafood Council/Eurostat.
Pangasius Produc/on in Vietnam and EU import real
import price (EUR kg)
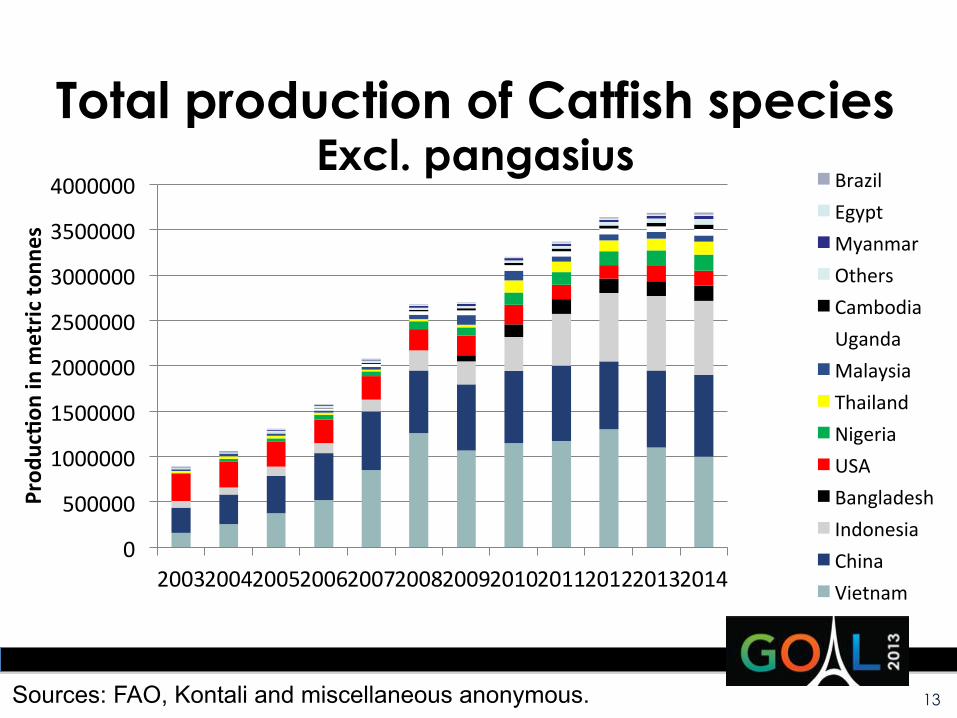
Total production of Catfish species Excl. pangasius
0
500000
1000000
1500000
2000000
2500000
3000000
3500000
4000000
2003 2004 2005 2006 2007 2008 2009 2010 2011 2012 2013 2014
Prod
uc/o
n in m
etric
tonn
es
Brazil Egypt Myanmar Others Cambodia Uganda Malaysia Thailand Nigeria USA Bangladesh Indonesia China Vietnam
13 Sources: FAO, Kontali and miscellaneous anonymous.
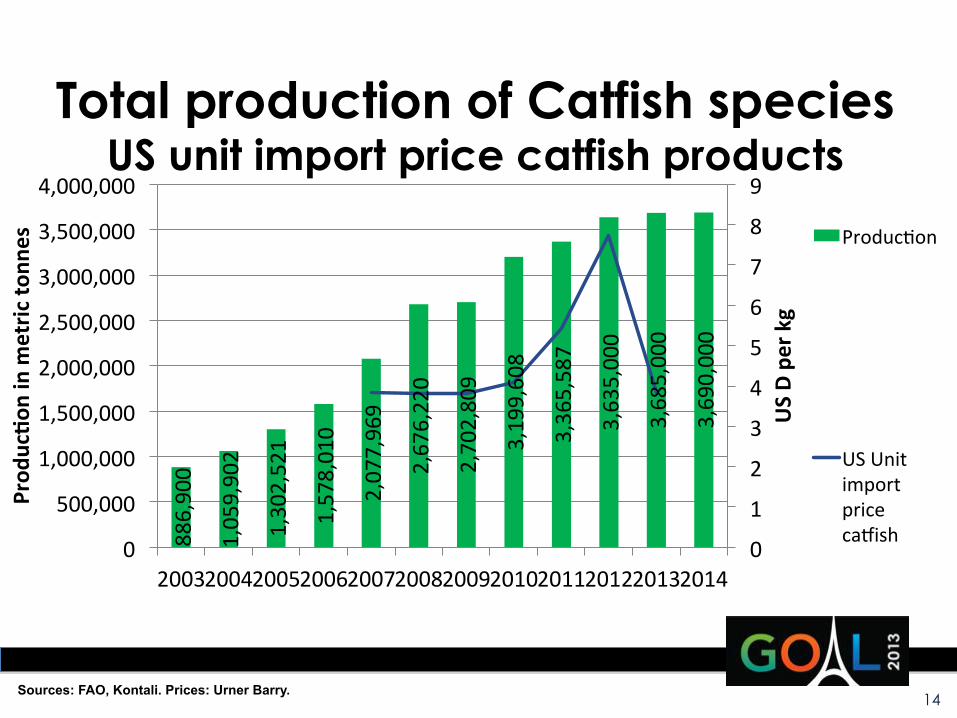
Total production of Catfish species US unit import price catfish products
886,900
1,059,902
1,302,521
1,578,010
2,077,969
2,676,220
2,702,809
3,199,608
3,365,587
3,635,000
3,685,000
3,690,000
0
1
2
3
4
5
6
7
8
9
0
500,000
1,000,000
1,500,000
2,000,000
2,500,000
3,000,000
3,500,000
4,000,000
2003 2004 2005 2006 2007 2008 2009 2010 2011 2012 2013 2014
US D pe
r kg
Prod
uc/o
n in m
etric
tonn
es
Produc\on
US Unit import price ca]ish
14 Sources: FAO, Kontali. Prices: Urner Barry.

DIADROMOUS
15
SALMONIDS

17
Atlantic Salmon Production and EU15 real import price fresh
gutted from Norway
646,
516
68
8,17
6
803,
837
89
3,70
4
1,03
2,71
2
1,08
0,89
7
1,13
2,99
4
1,24
4,63
7
1,25
2,00
0
1,27
2,10
0
1,39
9,70
0
1,49
7,50
0
1,46
8,90
0
1,44
6,20
0
1,62
2,90
0
1,98
0,40
0
2,01
3,30
0
2,07
4,00
0
0
2
4
6
8
10
12
0
500000
1000000
1500000
2000000
2500000
1990
19
91
1992
19
93
1994
19
95
1996
19
97
1998
19
99
2000
20
01
2002
20
03
2004
20
05
2006
20
07
2008
20
09
2010
20
11
2012
20
13
2014
EU real import price (EUR/kg)
Production in metric tonnes
Sources: FAO, Kontali, NSEC/Eurostat (prices). Note: Prices 1991-‐2012 are annual averages. Price in 2013 is January-‐July average.
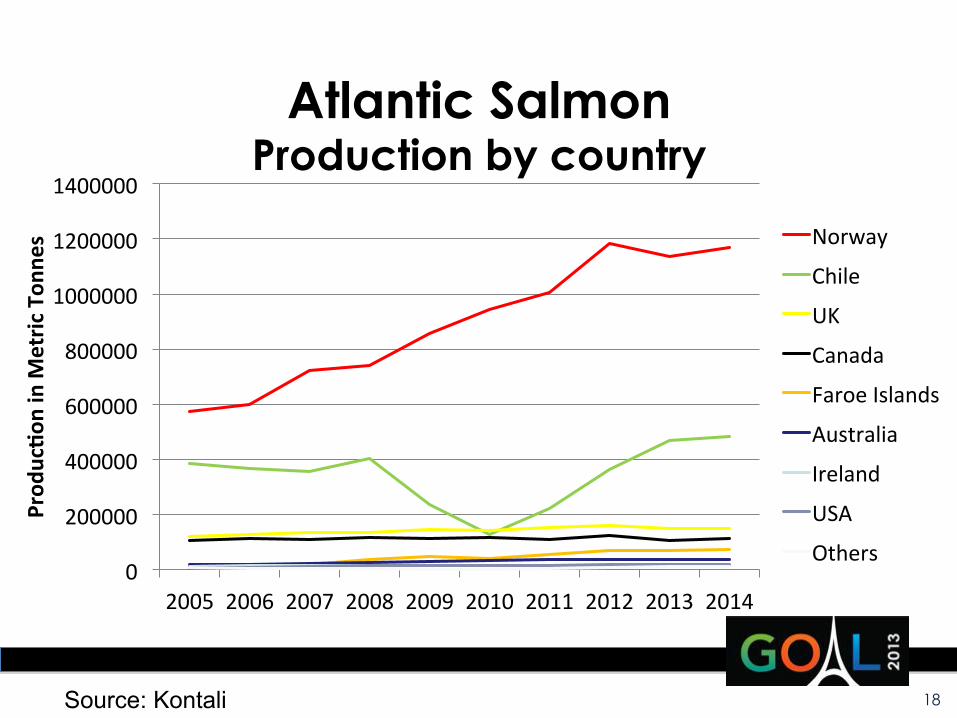
Atlantic Salmon Production by country
0
200000
400000
600000
800000
1000000
1200000
1400000
2005 2006 2007 2008 2009 2010 2011 2012 2013 2014
Prod
uc/o
n in M
etric
Ton
nes Norway
Chile
UK
Canada
Faroe Islands
Australia
Ireland
USA
Others
18 Source: Kontali
19
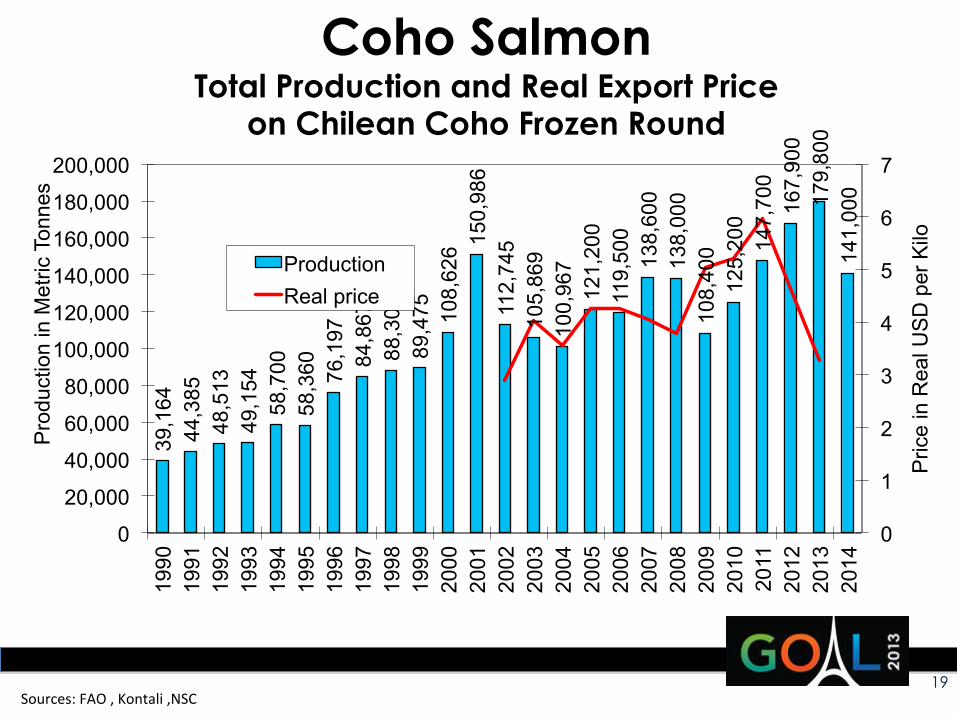
Coho Salmon Total Production and Real Export Price
on Chilean Coho Frozen Round 39
,164
44
,385
48
,513
49
,154
58
,700
58
,360
76
,197
84
,867
88
,302
89
,475
10
8,62
6 150,
986
112,
745
105,
869
100,
967
121,
200
119,
500
138,
600
138,
000
108,
400
125,
200
147,
700
167,
900
179,
800
141,
000
0
1
2
3
4
5
6
7
0
20,000
40,000
60,000
80,000
100,000
120,000
140,000
160,000
180,000
200,000 19
90
1991
19
92
1993
19
94
1995
19
96
1997
19
98
1999
20
00
2001
20
02
2003
20
04
2005
20
06
2007
20
08
2009
20
10
2011
20
12
2013
20
14
Pric
e in
Rea
l US
D p
er K
ilo
Pro
duct
ion
in M
etric
Ton
nes
Production Real price
Sources: FAO , Kontali ,NSC
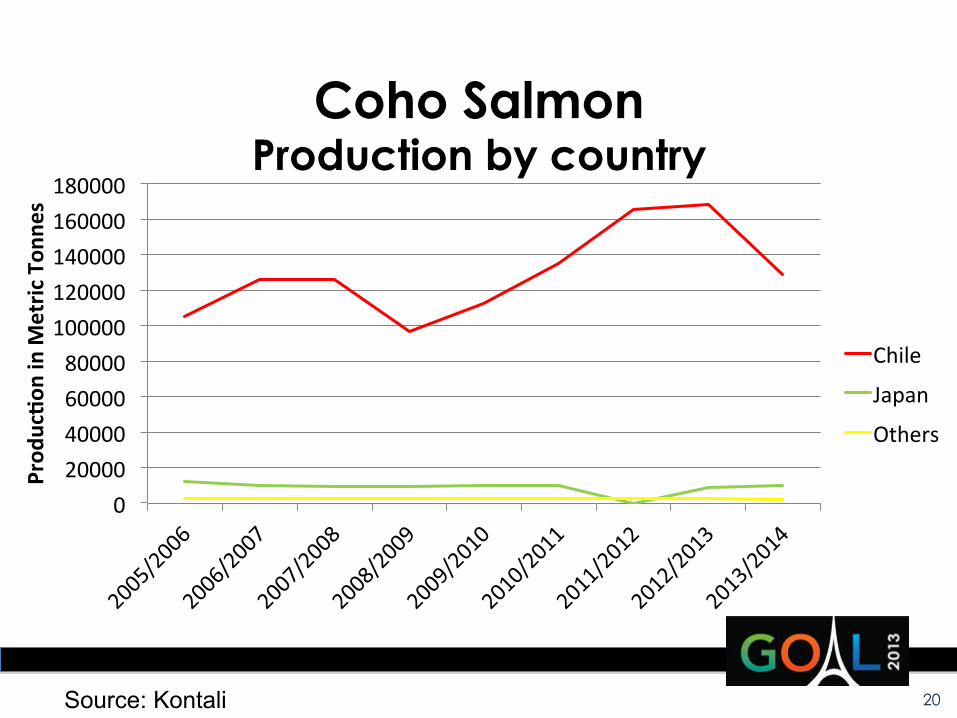
Coho Salmon Production by country
0 20000 40000 60000 80000
100000 120000 140000 160000 180000
Prod
uc/o
n in M
etric
Ton
nes
Chile
Japan
Others
20 Source: Kontali
21
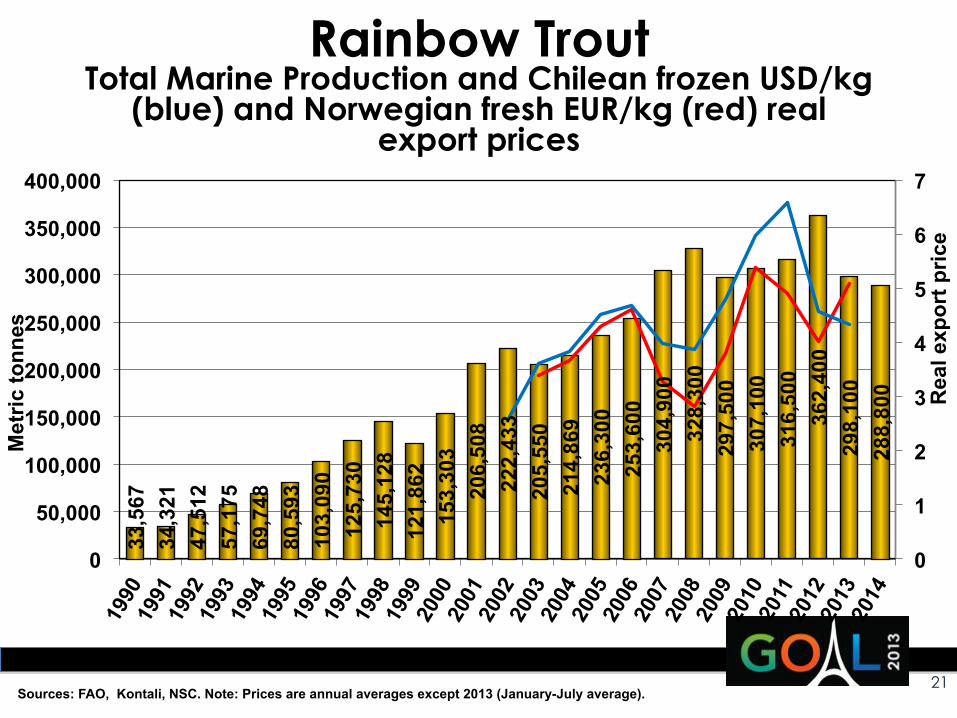
Rainbow Trout Total Marine Production and Chilean frozen USD/kg
(blue) and Norwegian fresh EUR/kg (red) real export prices
Sources: FAO, Kontali, NSC. Note: Prices are annual averages except 2013 (January-July average).
33,5
67
34,3
21
47,5
12
57,1
75
69,7
48
80,5
93
103,
090
125,
730
145,
128
121,
862
153,
303
206,
508
222,
433
205,
550
214,
869
236,
300
253,
600
304,
900
328,
300
297,
500
307,
100
316,
500
362,
400
298,
100
288,
800
0
1
2
3
4
5
6
7
0
50,000
100,000
150,000
200,000
250,000
300,000
350,000
400,000
Rea
l exp
ort p
rice
Met
ric to
nnes
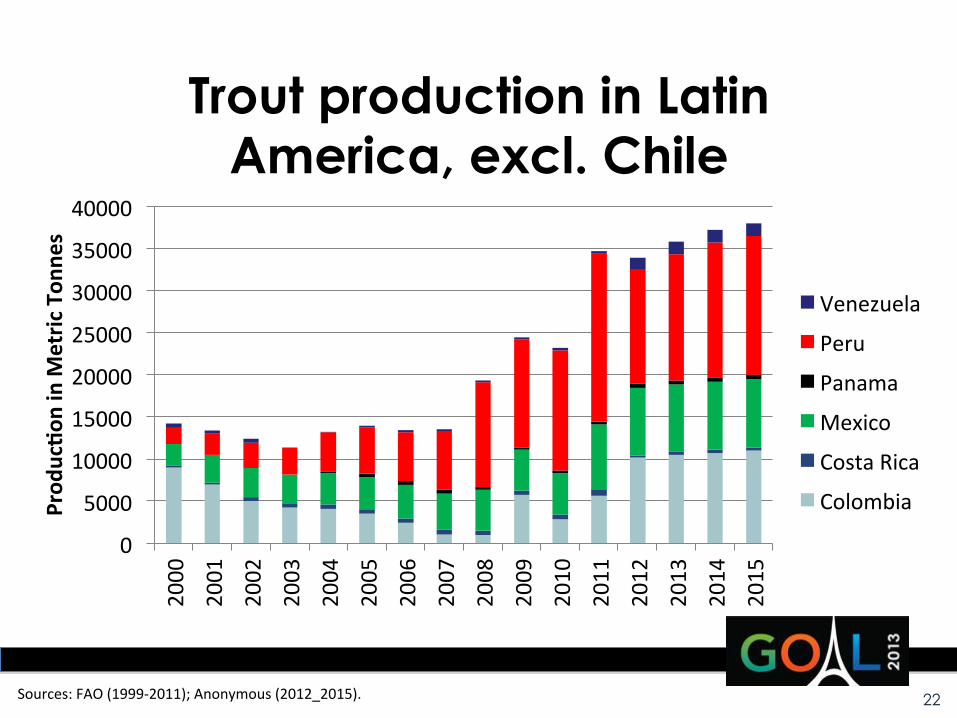
Trout production in Latin America, excl. Chile
0
5000
10000
15000
20000
25000
30000
35000
40000 2000
2001
2002
2003
2004
2005
2006
2007
2008
2009
2010
2011
2012
2013
2014
2015
Prod
uc/o
n in M
etric
Ton
nes
Venezuela
Peru
Panama
Mexico
Costa Rica
Colombia
22 Sources: FAO (1999-‐2011); Anonymous (2012_2015).
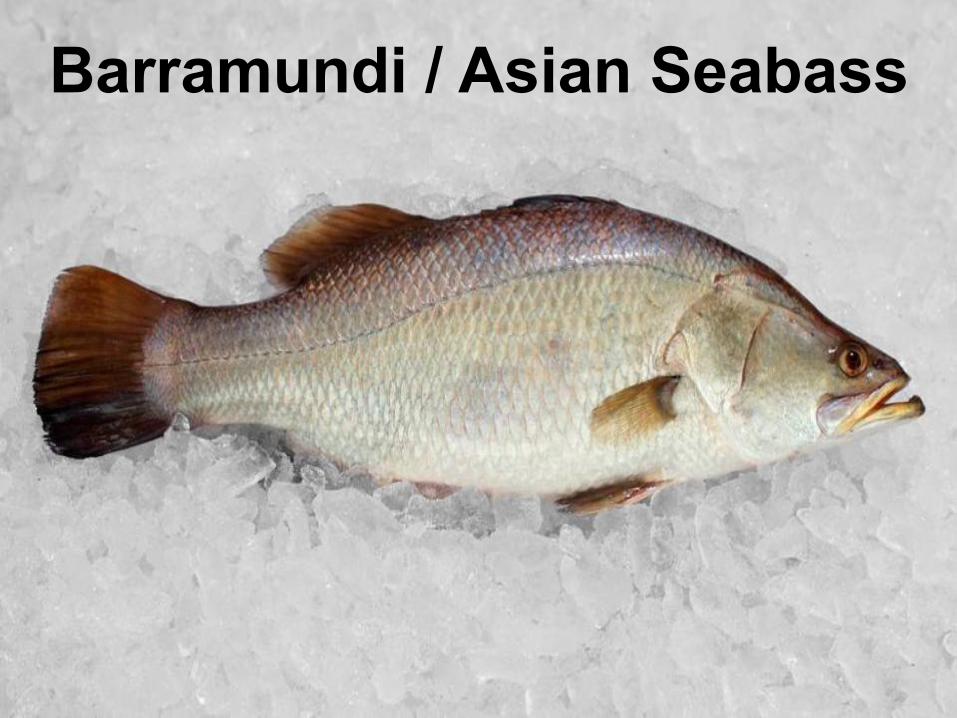
Barramundi / Asian Seabass
24
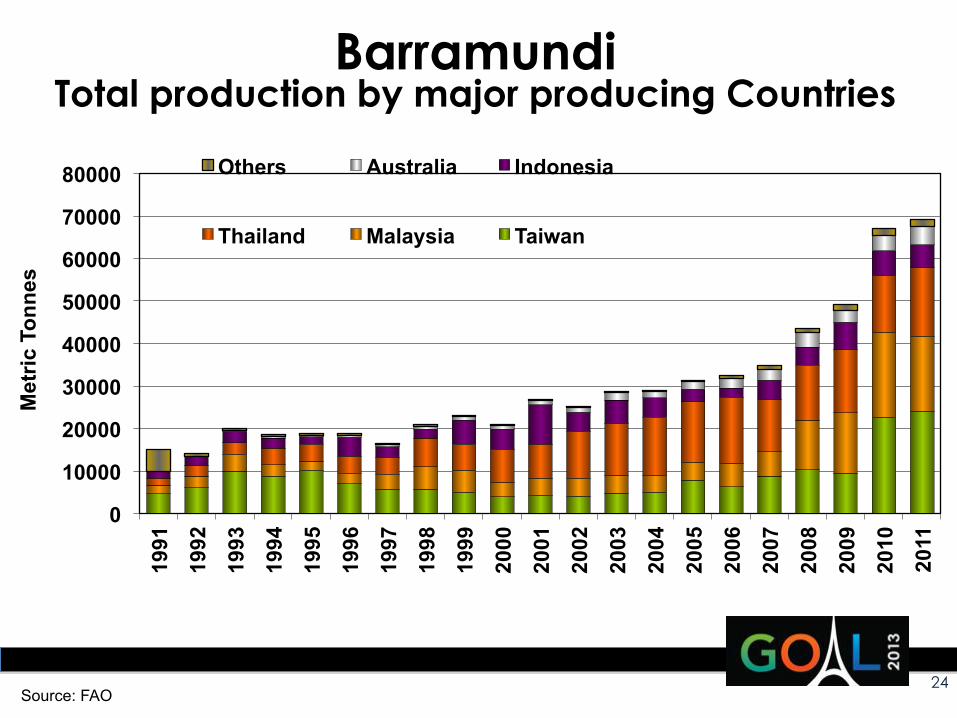
Barramundi Total production by major producing Countries
0
10000
20000
30000
40000
50000
60000
70000
80000 19
91
1992
1993
1994
1995
1996
1997
1998
1999
2000
2001
2002
2003
2004
2005
2006
2007
2008
2009
2010
2011
Met
ric T
onne
s
Others Australia Indonesia
Thailand Malaysia Taiwan
Source: FAO
25
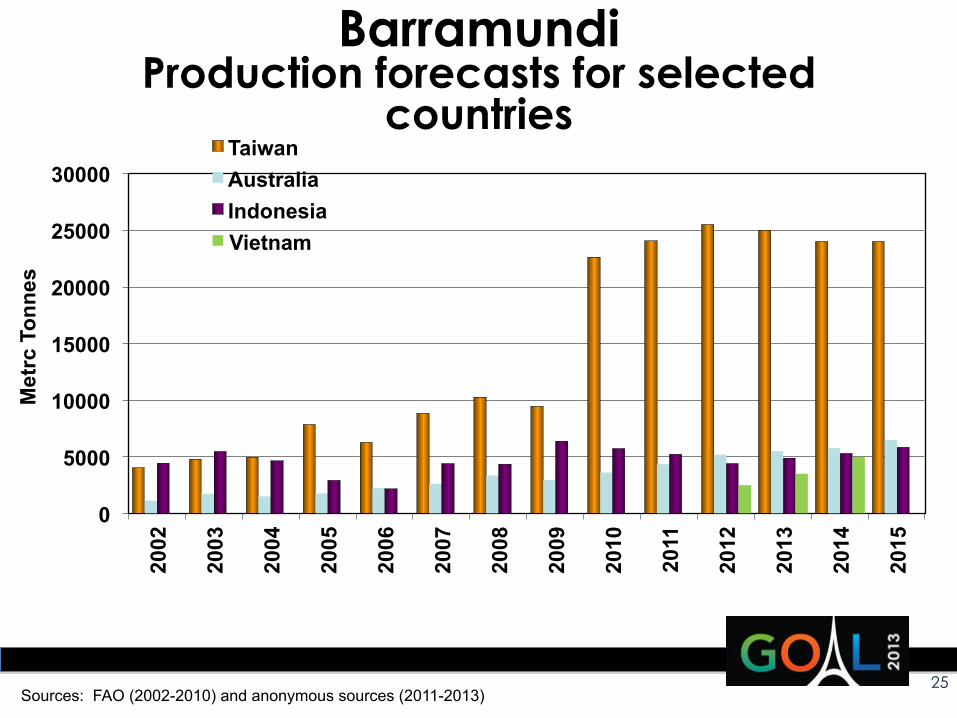
Barramundi Production forecasts for selected
countries
Sources: FAO (2002-2010) and anonymous sources (2011-2013)
0
5000
10000
15000
20000
25000
30000 20
02
2003
2004
2005
2006
2007
2008
2009
2010
2011
2012
2013
2014
2015
Met
rc T
onne
s
Taiwan Australia Indonesia Vietnam
MARINE
26
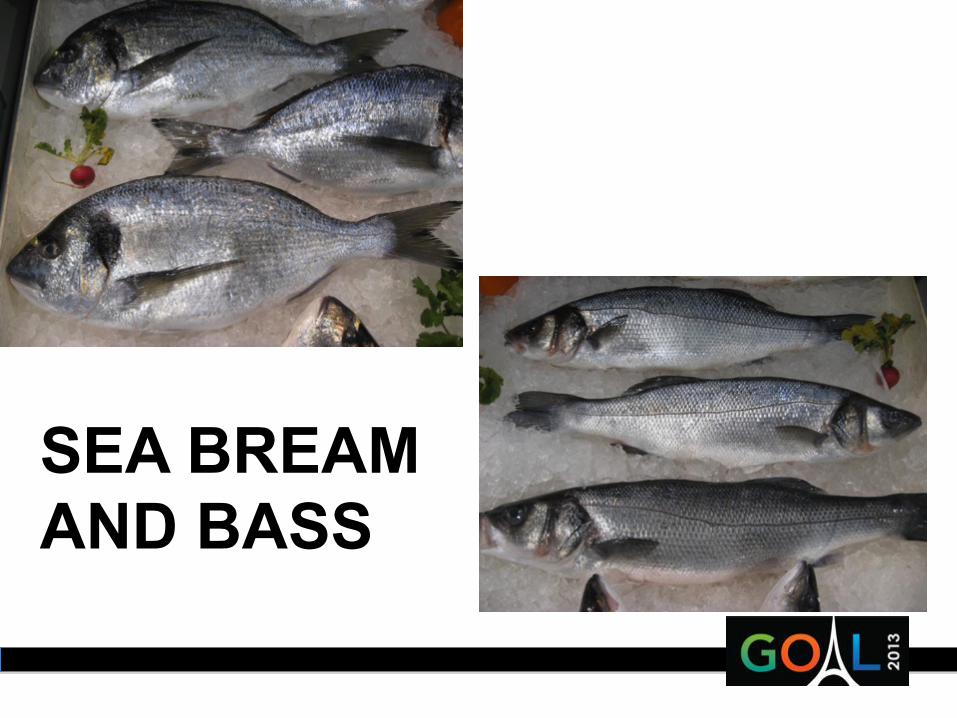
SEA BREAM AND BASS

28
Seabass & Sea Bream Meditteranean Production
4595
7
5781
1
5616
2
6109
3
6206
0
6867
9
8270
6
113,
200
123,
500
120,
700
124,
700
127,
700
129,
700
142,
800
147,
500
154,
200
5883
1
7323
2
7700
3
7976
7
8834
0
8892
2
9926
5
141,
500
160,
700
169,
200
170,
300
166,
200
161,
100
177,
400
195,
200
180,
500
0
50000
100000
150000
200000
250000
300000
350000
400000
Production in metric tonnes
Sea Breams Sea Basses
Source: FEAP, Kontali (2006-‐2013)
29
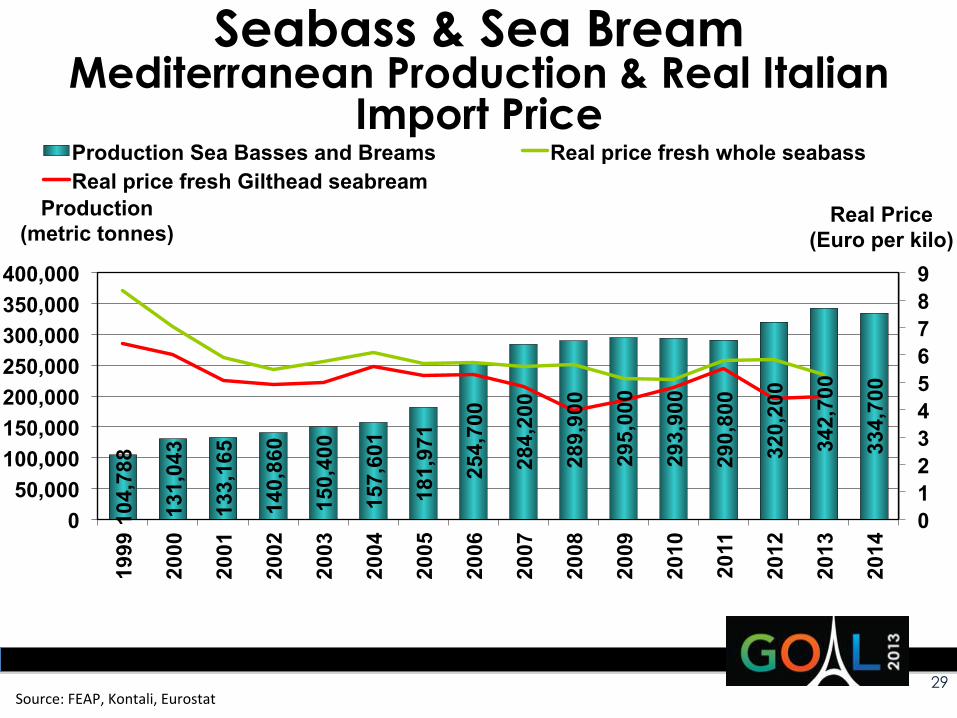
Seabass & Sea Bream Mediterranean Production & Real Italian
Import Price 10
4,78
8
131,
043
133,
165
140,
860
150,
400
157,
601
181,
971
254,
700
284,
200
289,
900
295,
000
293,
900
290,
800
320,
200
342,
700
334,
700
0 1 2 3 4 5 6 7 8 9
0 50,000
100,000 150,000 200,000 250,000 300,000 350,000 400,000
1999
2000
2001
2002
2003
2004
2005
2006
2007
2008
2009
2010
2011
2012
2013
2014
Real Price (Euro per kilo)
Production (metric tonnes)
Production Sea Basses and Breams Real price fresh whole seabass Real price fresh Gilthead seabream
Source: FEAP, Kontali, Eurostat
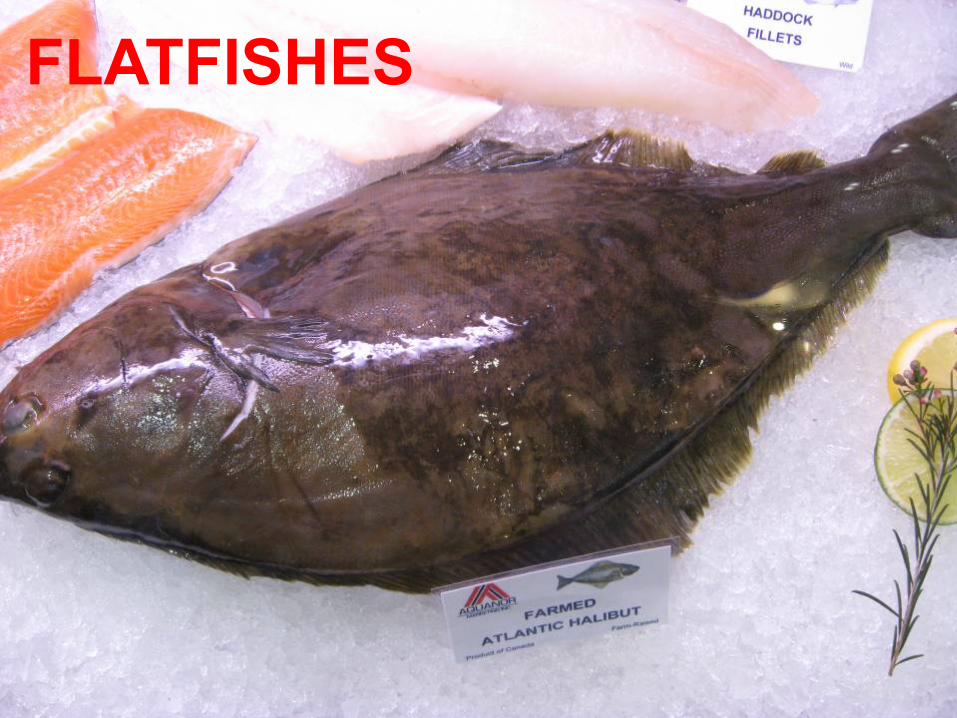
FLATFISHES

31
Olive Flounder Production and real farmgate price
4029
52
70
6733
88
61
2627
4 22
277
2136
8 14
127
1642
6 23
348 34
533
3214
1 4007
5 43
852
4117
1 46
432 54
674
4092
5 40
805
3955
3 39
500
4050
0 41
000
0
5
10
15
20
25
30
0
10000
20000
30000
40000
50000
60000
1993
19
94
1995
19
96
1997
19
98
1999
20
00
2001
20
02
2003
20
04
2005
20
06
2007
20
08
2009
20
10
2011
20
12
2013
20
14
2015
Real price (USD/kg)
Production in metric tonnes Japan Rep. of Korea Real price Rep. of Korea (USD/kg)
Sources: FAO (1993-2011), Philip Shin and anonymous (2012-2015)
32
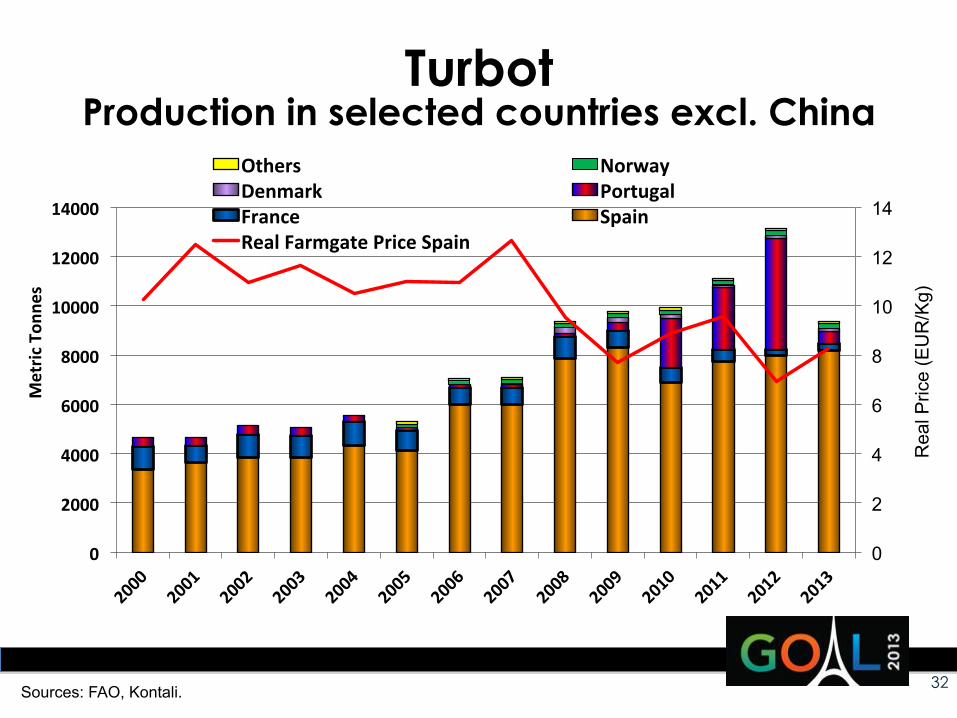
Turbot Production in selected countries excl. China
0
2
4
6
8
10
12
14
0
2000
4000
6000
8000
10000
12000
14000
Rea
l Pric
e (E
UR
/Kg)
Metric
Ton
nes
Others Norway Denmark Portugal France Spain Real Farmgate Price Spain
Sources: FAO, Kontali.
33
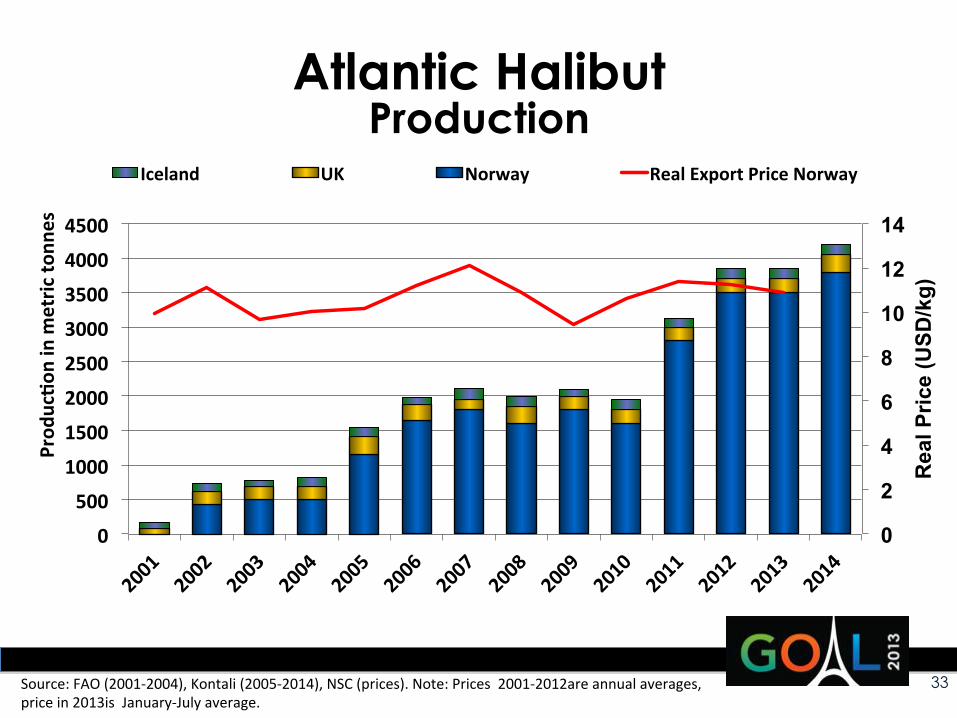
Atlantic Halibut Production
0
2
4
6
8
10
12
14
0
500
1000
1500
2000
2500
3000
3500
4000
4500
Rea
l Pric
e (U
SD/k
g)
Prod
uc/o
n in m
etric
tonn
es
Iceland UK Norway Real Export Price Norway
Source: FAO (2001-‐2004), Kontali (2005-‐2014), NSC (prices). Note: Prices 2001-‐2012are annual averages, price in 2013is January-‐July average.
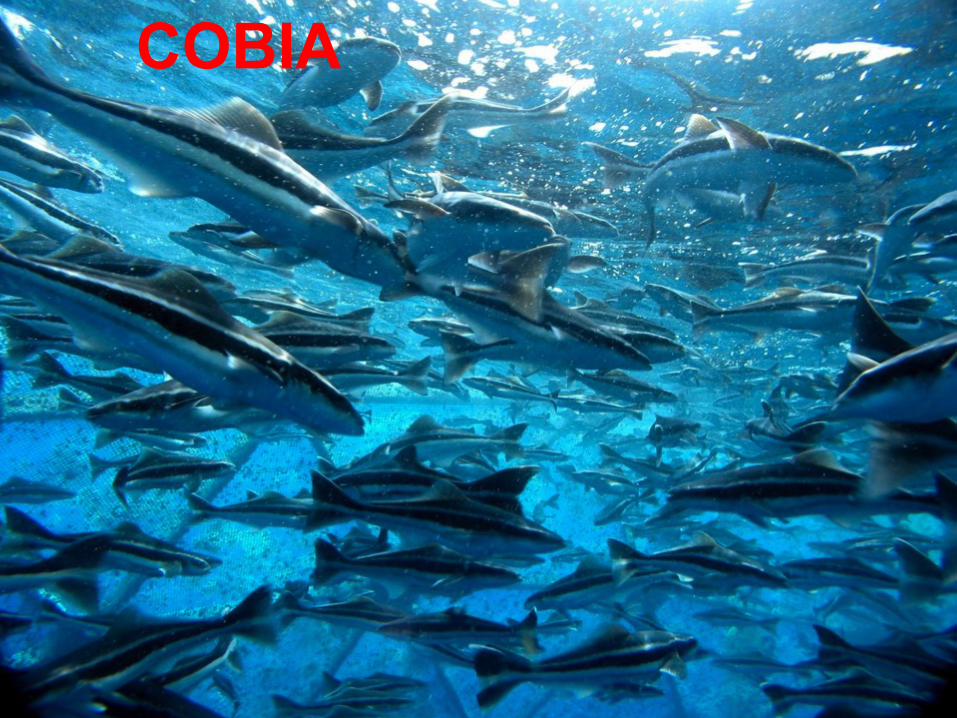
COBIA
35
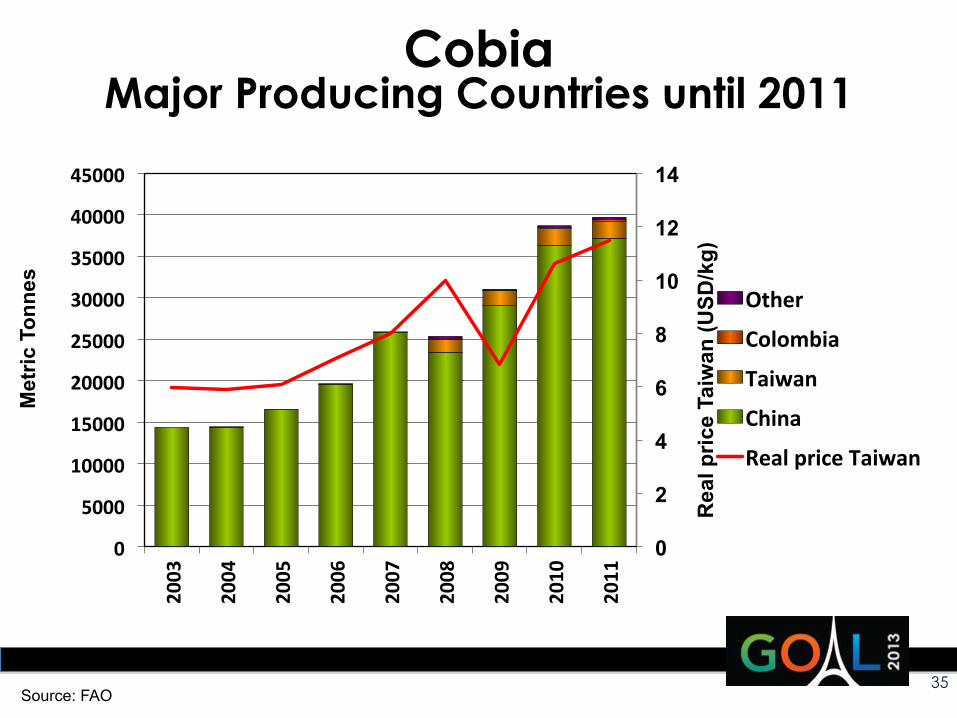
Cobia Major Producing Countries until 2011
0
2
4
6
8
10
12
14
0
5000
10000
15000
20000
25000
30000
35000
40000
45000 2003
2004
2005
2006
2007
2008
2009
2010
2011
Rea
l pric
e Ta
iwan
(USD
/kg)
Met
ric T
onne
s
Other
Colombia
Taiwan
China
Real price Taiwan
Source: FAO
36
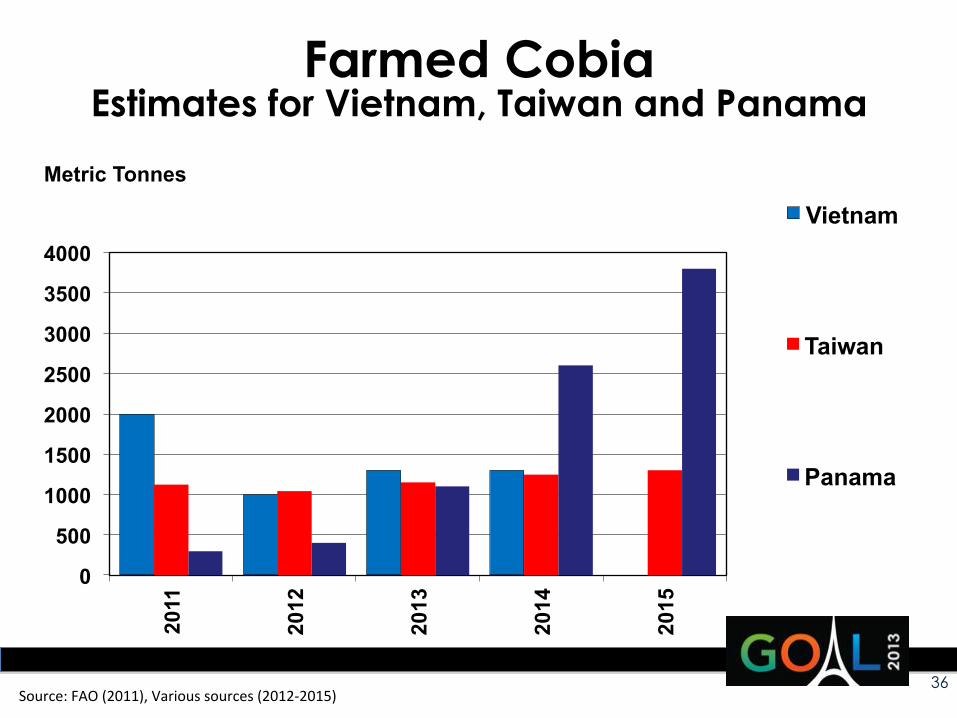
Farmed Cobia Estimates for Vietnam, Taiwan and Panama
0
500
1000
1500
2000
2500
3000
3500
4000
2011
2012
2013
2014
2015
Metric Tonnes
Vietnam
Taiwan
Panama
Source: FAO (2011), Various sources (2012-‐2015)
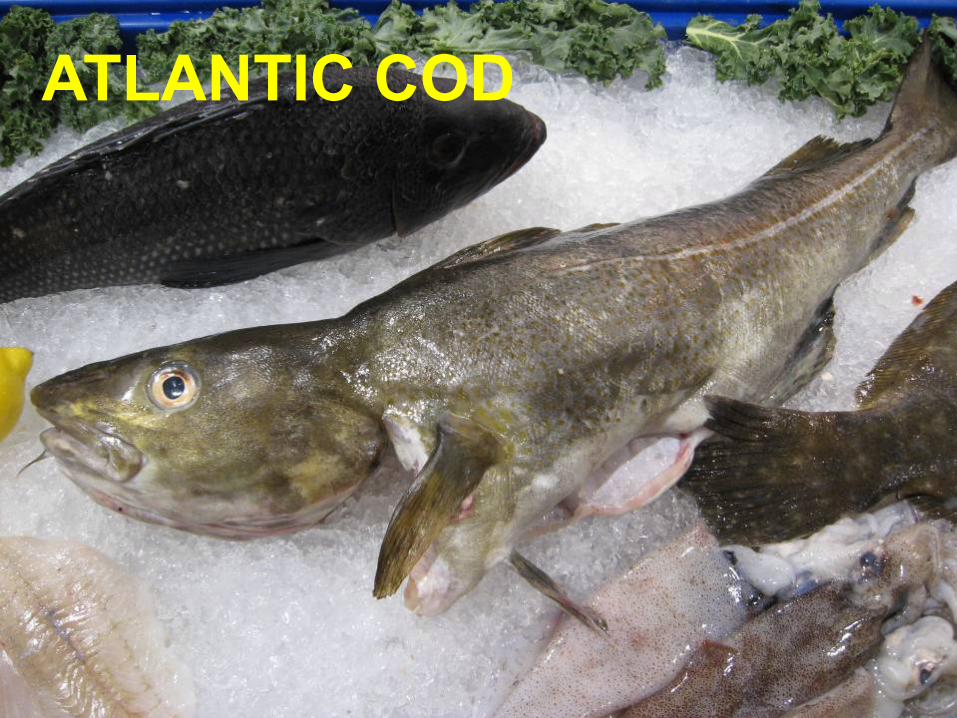
ATLANTIC COD
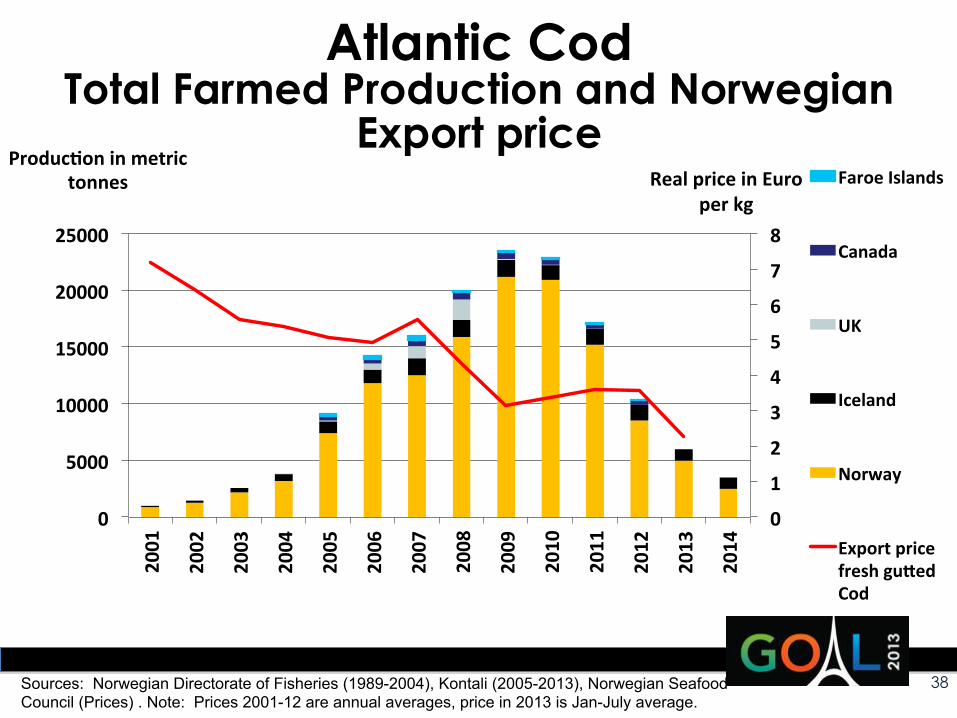
38
Atlantic Cod Total Farmed Production and Norwegian
Export price
0
1
2
3
4
5
6
7
8
0
5000
10000
15000
20000
25000
2001
2002
2003
2004
2005
2006
2007
2008
2009
2010
2011
2012
2013
2014
Real price in Euro per kg
Produc/on in metric tonnes Faroe Islands
Canada
UK
Iceland
Norway
Export price fresh guTed Cod
Sources: Norwegian Directorate of Fisheries (1989-2004), Kontali (2005-2013), Norwegian Seafood Council (Prices) . Note: Prices 2001-12 are annual averages, price in 2013 is Jan-July average.
TUNAS

40
Bluefin Tuna Total Produc/on and US real import price fresh
23800
30700 29700 34300
43800
34500 33500 29100 29000
26500 30300 31000
0
5
10
15
20
25
30
0 5000 10000 15000 20000 25000 30000 35000 40000 45000 50000
Rea
l pric
e (U
SD/k
g)
Metric
tonn
es
Production US import price fresh
Sources: Produc\on -‐ Apostolos Tzoumas; import price-‐ NMFS. Note: Prices 2002-‐2011 are annual averages, price in 2012 is January-‐August average.
MUSSELS
42
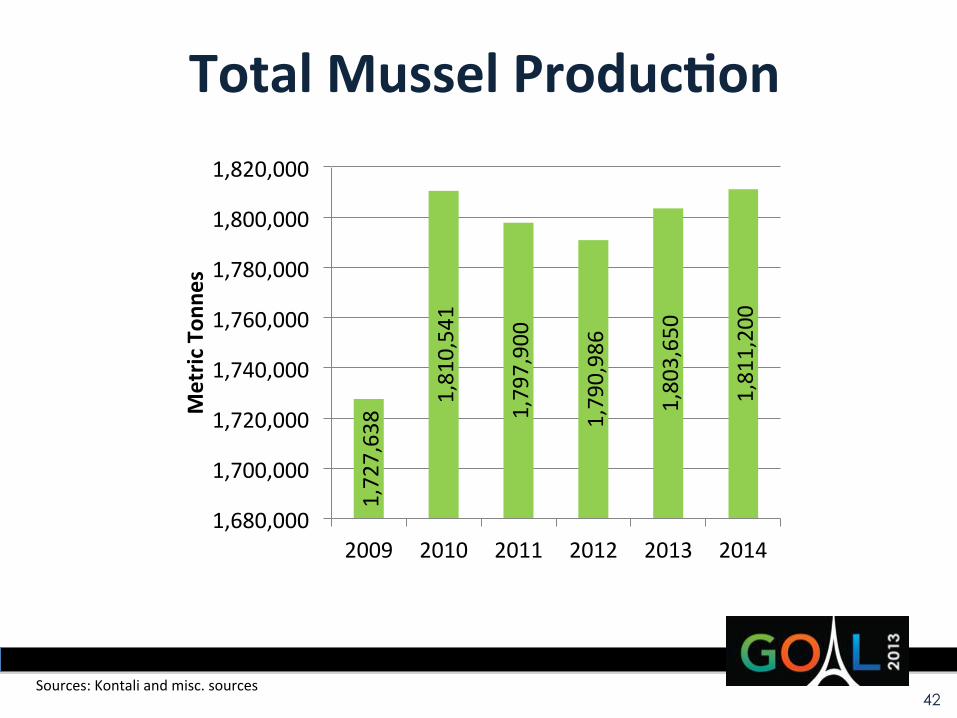
Total Mussel Produc/on
Sources: Kontali and misc. sources
1,727,638
1,810,541
1,797,900
1,790,986
1,803,650
1,811,200
1,680,000
1,700,000
1,720,000
1,740,000
1,760,000
1,780,000
1,800,000
1,820,000
2009 2010 2011 2012 2013 2014
Metric
Ton
nes

43
Summary Finfish
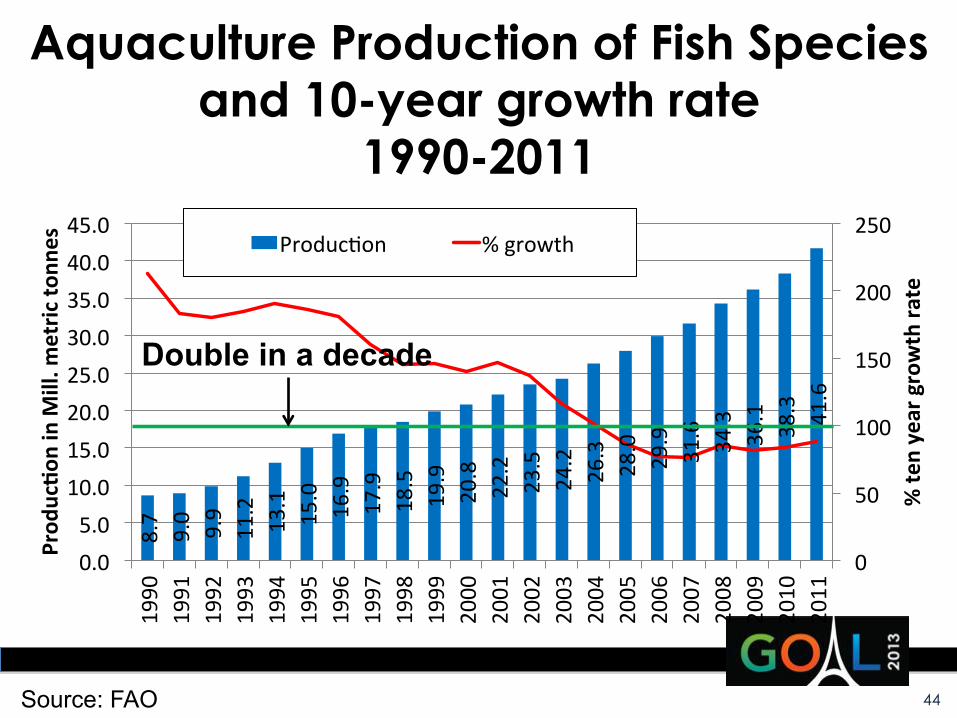
Aquaculture Production of Fish Species and 10-year growth rate
1990-2011 8.7
9.0 9.9
11.2
13.1
15.0
16.9
17.9
18.5
19.9
20.8
22.2
23.5
24.2
26.3
28.0
29.9
31.6
34.3
36.1
38.3
41.6
0
50
100
150
200
250
0.0 5.0
10.0 15.0 20.0 25.0 30.0 35.0 40.0 45.0
1990
1991
1992
1993
1994
1995
1996
1997
1998
1999
2000
2001
2002
2003
2004
2005
2006
2007
2008
2009
2010
2011
% te
n year growth ra
te
Prod
uc/o
n in M
ill. m
etric
tonn
es
Produc\on % growth
44 Source: FAO
Double in a decade

Aquaculture Production of Fish Species and Seafood Price Indices
1990-2011
60 70 80 90 100 110 120 130 140 150 160
0
5
10
15
20
25
30
35
40
45
1990
1991
1992
1993
1994
1995
1996
1997
1998
1999
2000
2001
2002
2003
2004
2005
2006
2007
2008
2009
2010
2011
Seafoo
d price inde
x
(200
2-‐20
04=100
)
Prod
uc/o
n in M
ill. m
etric
tonn
es Produc\on
Total price index Aquaculture price index
45 Source: FAO
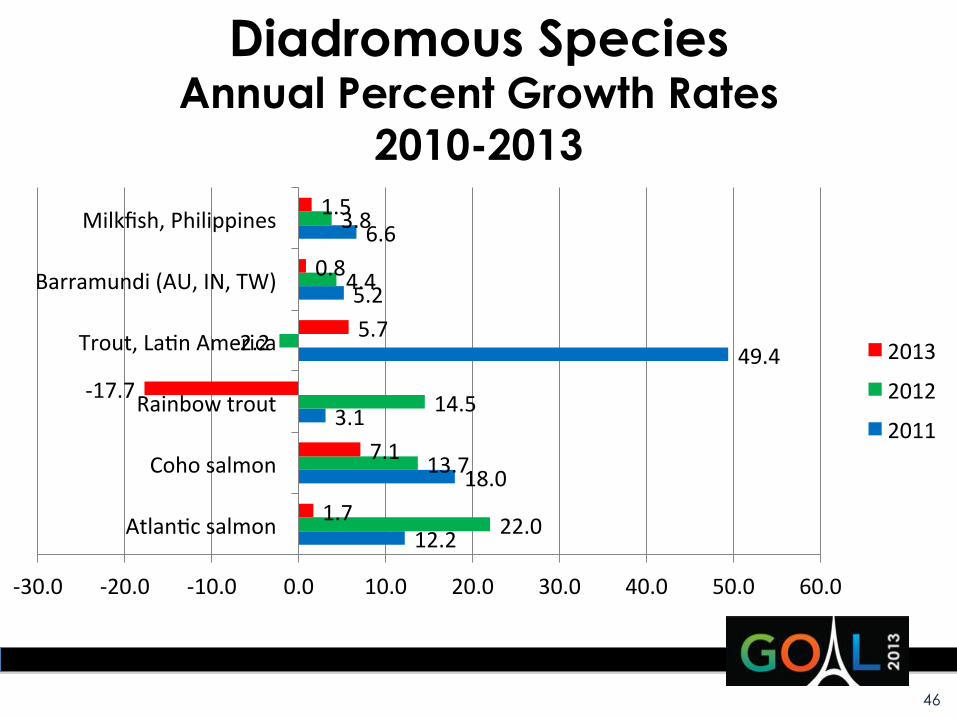
Diadromous Species Annual Percent Growth Rates
2010-2013
12.2
18.0
3.1
49.4
5.2
6.6
22.0
13.7
14.5
-‐2.2
4.4
3.8
1.7
7.1
-‐17.7
5.7
0.8
1.5
-‐30.0 -‐20.0 -‐10.0 0.0 10.0 20.0 30.0 40.0 50.0 60.0
Atlan\c salmon
Coho salmon
Rainbow trout
Trout, La\n America
Barramundi (AU, IN, TW)
Milkfish, Philippines
2013
2012
2011
46
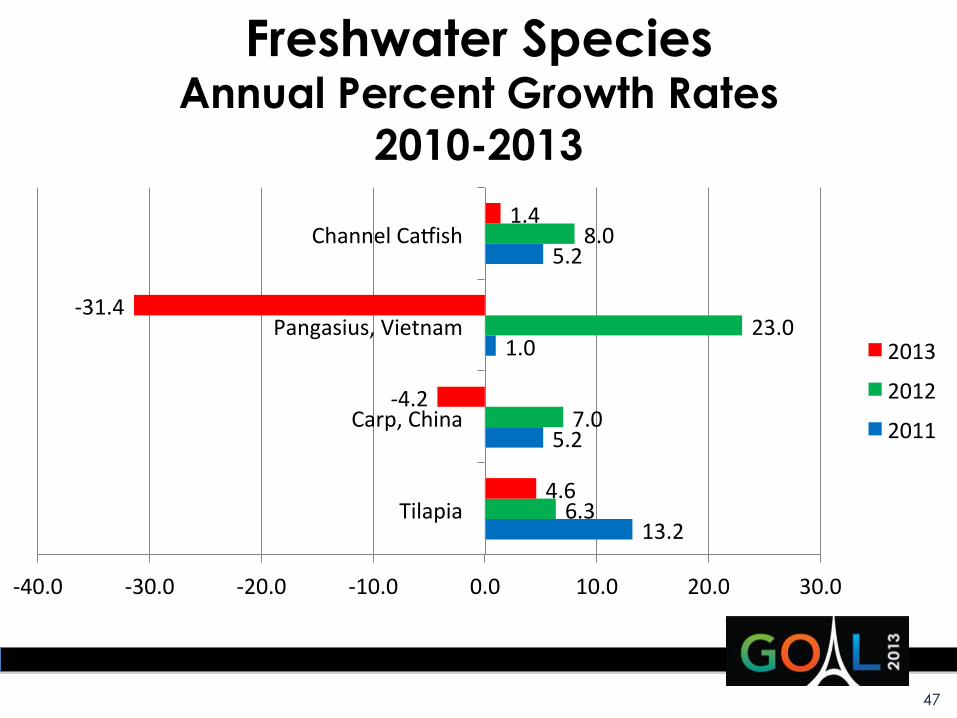
Freshwater Species Annual Percent Growth Rates
2010-2013
13.2
5.2
1.0
5.2
6.3
7.0
23.0
8.0
4.6
-‐4.2
-‐31.4
1.4
-‐40.0 -‐30.0 -‐20.0 -‐10.0 0.0 10.0 20.0 30.0
Tilapia
Carp, China
Pangasius, Vietnam
Channel Ca]ish
2013
2012
2011
47
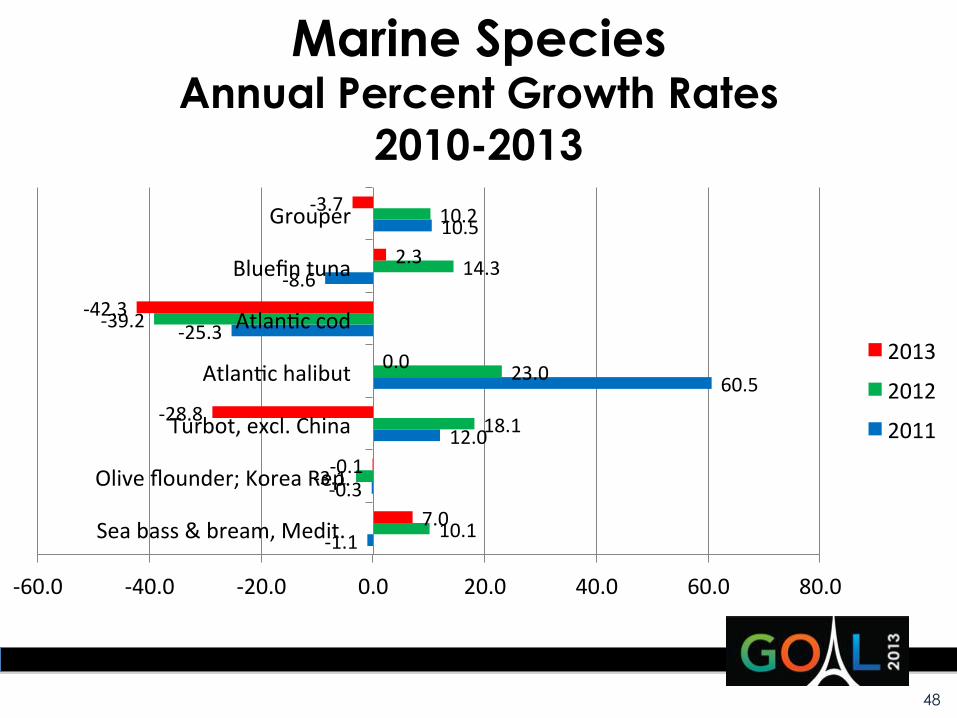
Marine Species Annual Percent Growth Rates
2010-2013
-‐1.1
-‐0.3
12.0
60.5
-‐25.3
-‐8.6
10.5
10.1
-‐3.1
18.1
23.0
-‐39.2
14.3
10.2
7.0
-‐0.1
-‐28.8
0.0
-‐42.3
2.3
-‐3.7
-‐60.0 -‐40.0 -‐20.0 0.0 20.0 40.0 60.0 80.0
Sea bass & bream, Medit.
Olive flounder; Korea Rep.
Turbot, excl. China
Atlan\c halibut
Atlan\c cod
Bluefin tuna
Grouper
2013
2012
2011
48
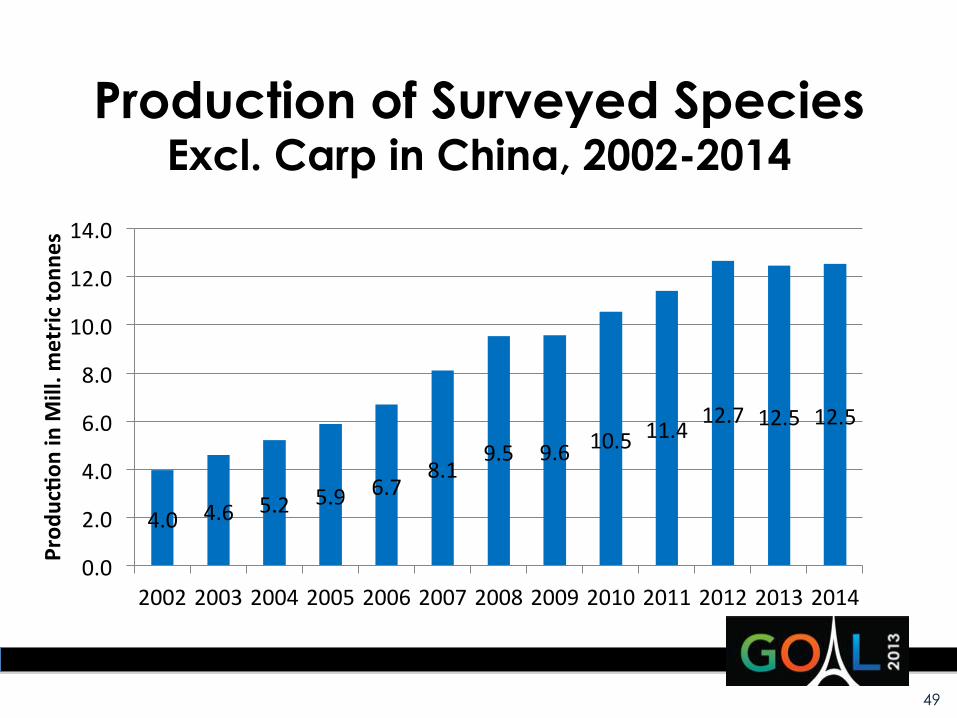
Production of Surveyed Species Excl. Carp in China, 2002-2014
4.0 4.6 5.2 5.9 6.7 8.1
9.5 9.6 10.5 11.4 12.7 12.5 12.5
0.0
2.0
4.0
6.0
8.0
10.0
12.0
14.0
2002 2003 2004 2005 2006 2007 2008 2009 2010 2011 2012 2013 2014
Prod
uc/o
n in M
ill. m
etric
tonn
es
49

Production of Surveyed Species Excl. Carp in China, 2002-2014
15.6 13.5 12.9 13.7
21.2
17.4
0.4
10.2 8.3
11.0
-‐1.6 0.5
-‐5.0
0.0
5.0
10.0
15.0
20.0
25.0
0.0
2.0
4.0
6.0
8.0
10.0
12.0
14.0
2002 2003 2004 2005 2006 2007 2008 2009 2010 2011 2012 2013 2014
% growth
Prod
uc/o
n in M
ill. m
etric
tonn
es Produc\on % growth
50
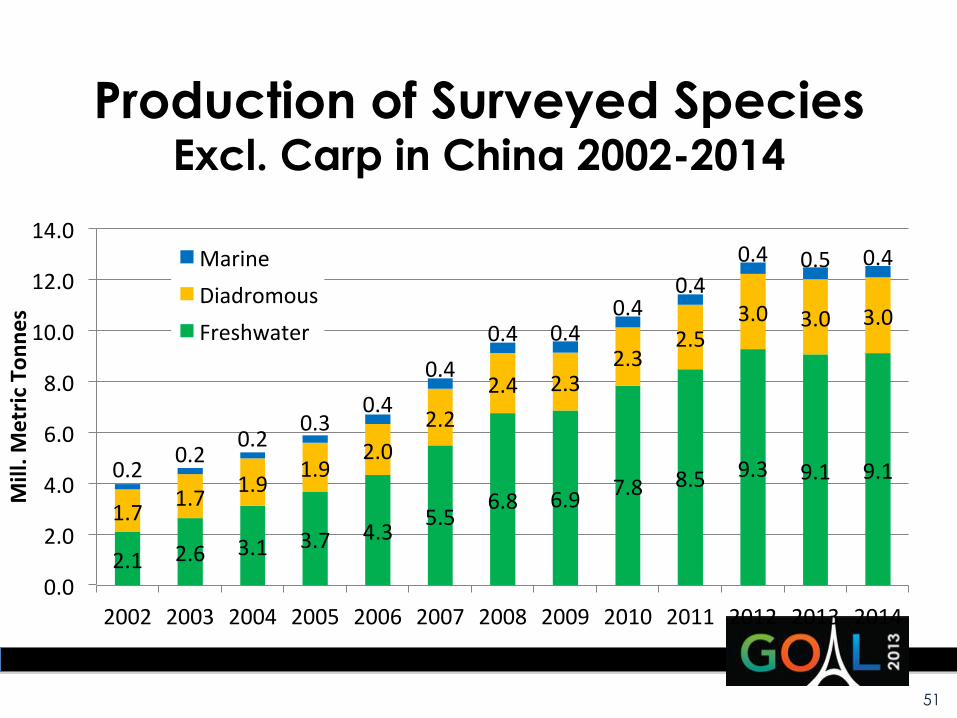
Production of Surveyed Species Excl. Carp in China 2002-2014
2.1 2.6 3.1 3.7 4.3 5.5 6.8 6.9 7.8 8.5 9.3 9.1 9.1
1.7 1.7 1.9 1.9 2.0
2.2 2.4 2.3
2.3 2.5
3.0 3.0 3.0
0.2 0.2 0.2
0.3 0.4
0.4 0.4 0.4
0.4 0.4
0.4 0.5 0.4
0.0
2.0
4.0
6.0
8.0
10.0
12.0
14.0
2002 2003 2004 2005 2006 2007 2008 2009 2010 2011 2012 2013 2014
Mill. M
etric
Ton
nes
Marine Diadromous Freshwater
51
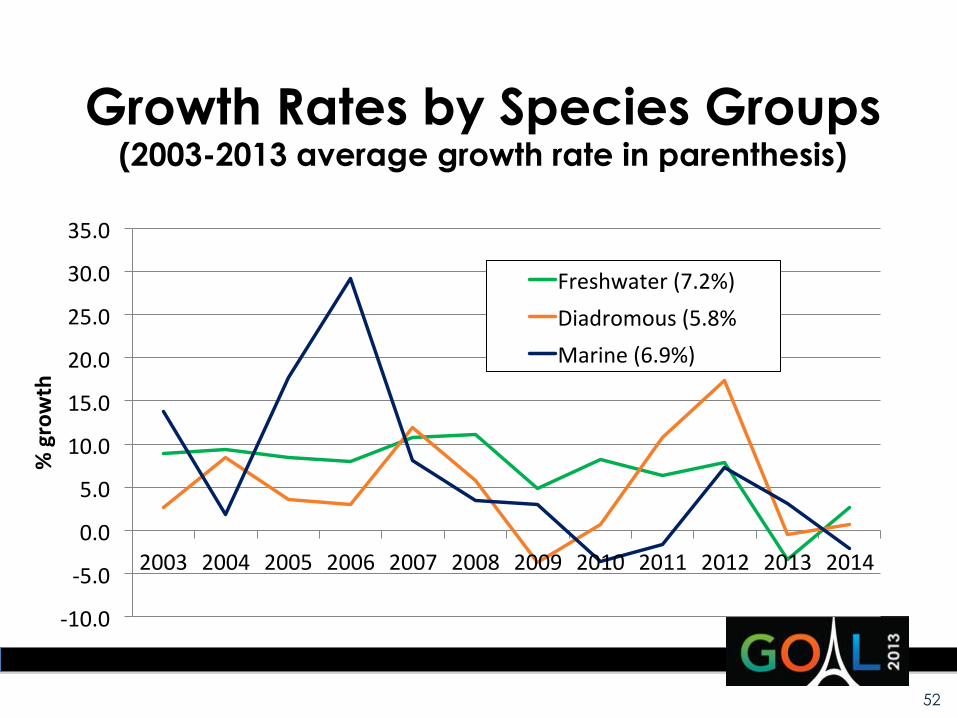
Growth Rates by Species Groups (2003-2013 average growth rate in parenthesis)
-‐10.0
-‐5.0
0.0
5.0
10.0
15.0
20.0
25.0
30.0
35.0
2003 2004 2005 2006 2007 2008 2009 2010 2011 2012 2013 2014
% growth
Freshwater (7.2%) Diadromous (5.8% Marine (6.9%)
52
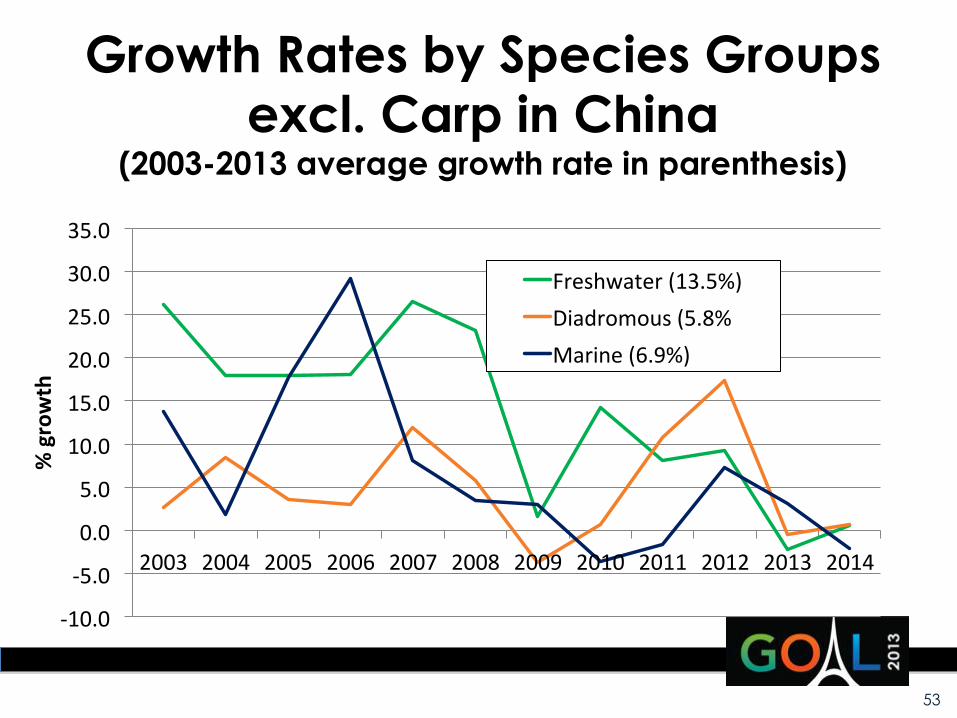
Growth Rates by Species Groups excl. Carp in China
(2003-2013 average growth rate in parenthesis)
-‐10.0
-‐5.0
0.0
5.0
10.0
15.0
20.0
25.0
30.0
35.0
2003 2004 2005 2006 2007 2008 2009 2010 2011 2012 2013 2014
% growth
Freshwater (13.5%) Diadromous (5.8% Marine (6.9%)
53
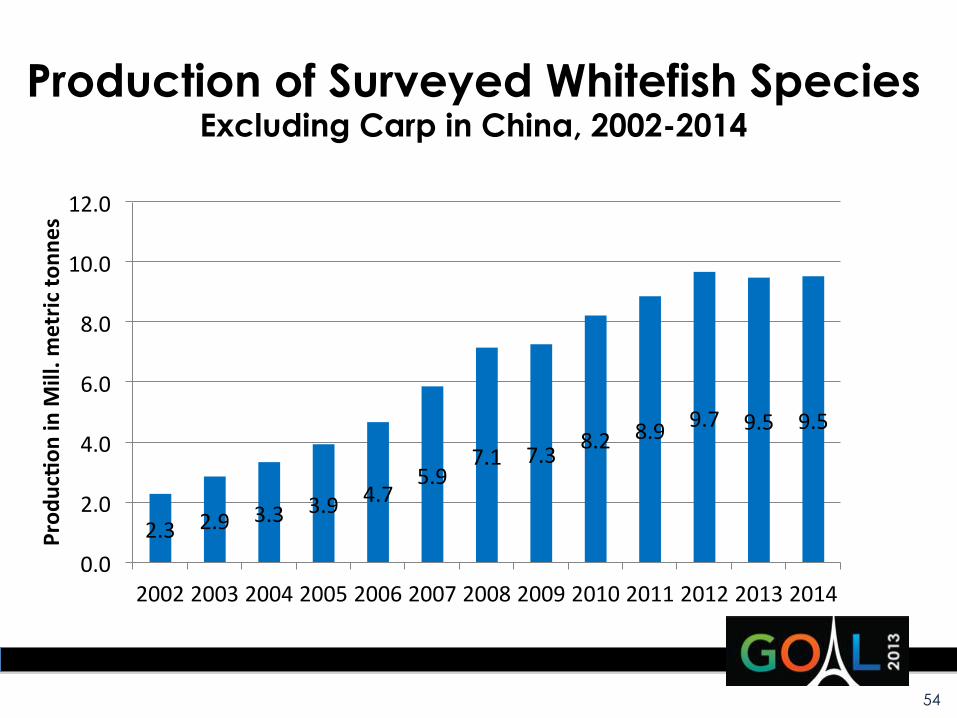
Production of Surveyed Whitefish Species Excluding Carp in China, 2002-2014
2.3 2.9 3.3 3.9 4.7 5.9
7.1 7.3 8.2 8.9 9.7 9.5 9.5
0.0
2.0
4.0
6.0
8.0
10.0
12.0
2002 2003 2004 2005 2006 2007 2008 2009 2010 2011 2012 2013 2014
Prod
uc/o
n in M
ill. m
etric
tonn
es
54
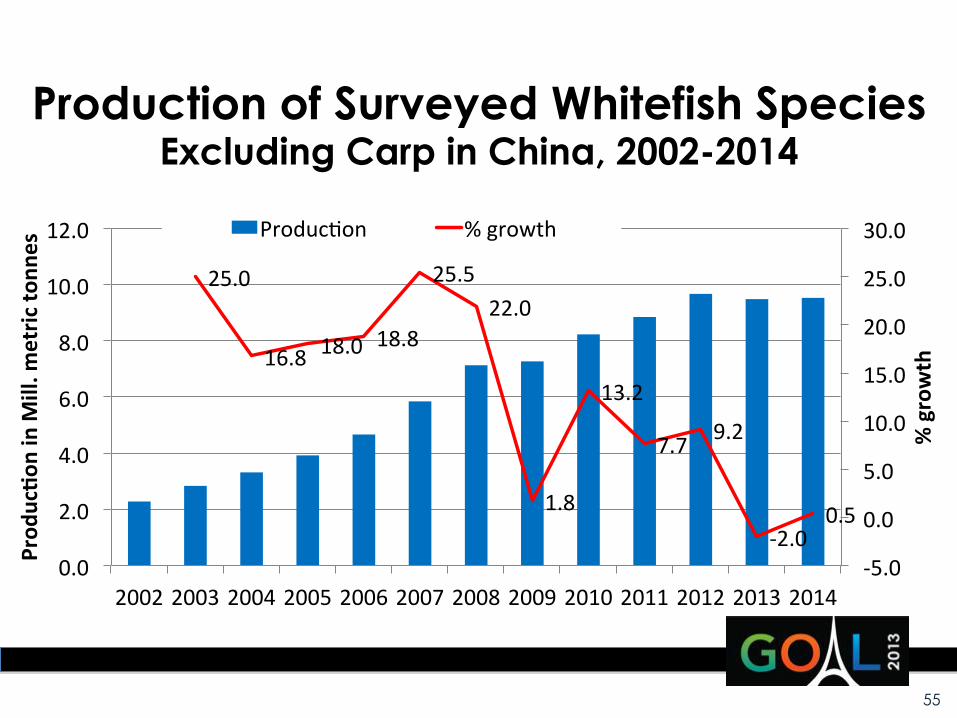
Production of Surveyed Whitefish Species Excluding Carp in China, 2002-2014
25.0
16.8 18.0 18.8
25.5 22.0
1.8
13.2
7.7 9.2
-‐2.0 0.5
-‐5.0
0.0
5.0
10.0
15.0
20.0
25.0
30.0
0.0
2.0
4.0
6.0
8.0
10.0
12.0
2002 2003 2004 2005 2006 2007 2008 2009 2010 2011 2012 2013 2014
% growth
Prod
uc/o
n in M
ill. m
etric
tonn
es Produc\on % growth
55
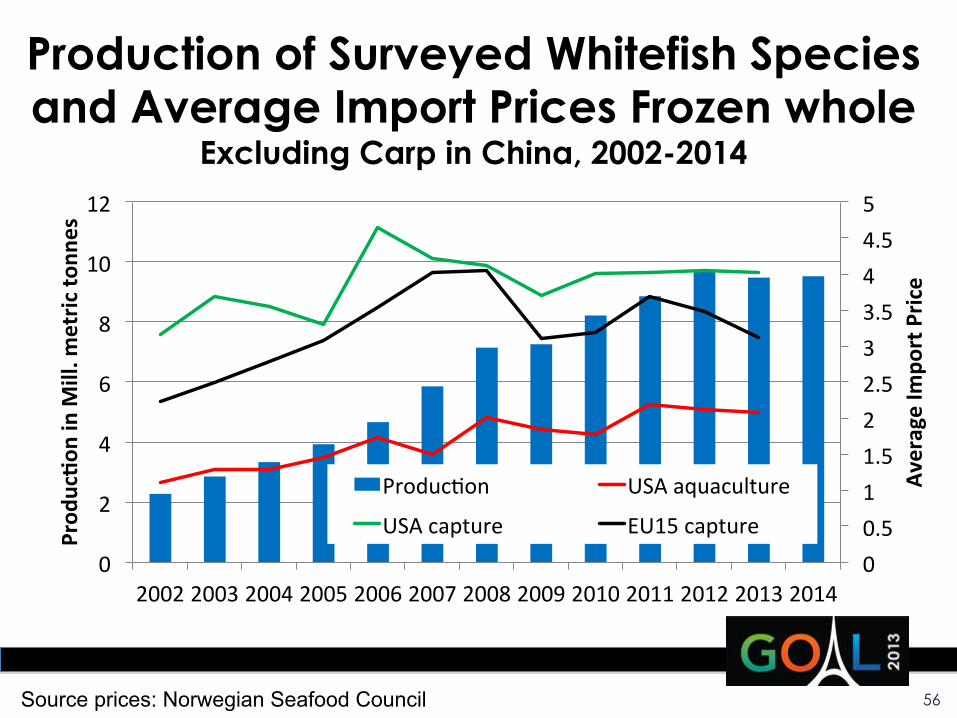
Production of Surveyed Whitefish Species and Average Import Prices Frozen whole
Excluding Carp in China, 2002-2014
0 0.5 1 1.5 2 2.5 3 3.5 4 4.5 5
0
2
4
6
8
10
12
2002 2003 2004 2005 2006 2007 2008 2009 2010 2011 2012 2013 2014
Average Im
port Pric
e
Prod
uc/o
n in M
ill. m
etric
tonn
es
Produc\on USA aquaculture
USA capture EU15 capture
56 Source prices: Norwegian Seafood Council

57
Did they double in a decade? Percentage growth 2003-‐2013
1.0 14.4 26.2
45.0 52.1 59.2 69.8 77.7 83.9
127.9 133.9
177.3 194.0
214.4 315.5
392.3 495.7
0 100 200 300 400 500 600
Bluefin tuna Olive flounder; Korea Rep.
Grouper Rainbow trout
Carp, China Milkfish, Philippines
Coho salmon Atlantic salmon
Turbot, excl. China Sea bass & bream, Medit.
Atlantic cod Tilapia
Barramundi (AU, IN, TW) Trout, Latin America
Channel Catfish Atlantic halibut
Pangasius, Vietnam
Percent
58
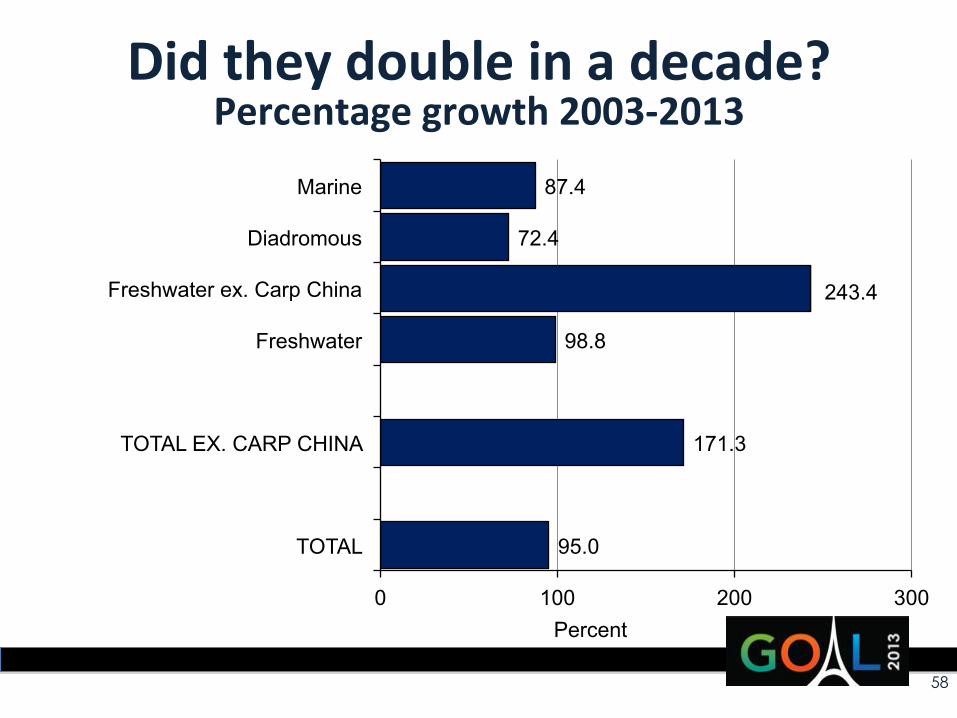
Did they double in a decade? Percentage growth 2003-‐2013
95.0
171.3
98.8
243.4
72.4
87.4
0 100 200 300
TOTAL
TOTAL EX. CARP CHINA
Freshwater
Freshwater ex. Carp China
Diadromous
Marine
Percent

Thank You!
59