Embed Size (px)
Citation preview
RDECOM TR 18-D-76 U.S. ARMY RESEARCH, DEVELOPMENT &
ENGINEERING COMMAND TITLE: Advanced Variable Speed Power Turbine AUTHOR(s) Michael Bonacum and Paul Vitt COMPANY NAME: General Electric COMPANY ADDRESS: One Neumann Way, Cincinnati, OH 45215 DATE (MONTH YEAR): August 01, 2019 FINAL REPORT: W911W6-12-2-0012
DISTRIBUTION: UNLIMITED
Prepared for: AVIATION DEVELOPMENT DRIECTORATE – EUSTIS
FORT EUSTIS, VA 23604-5577
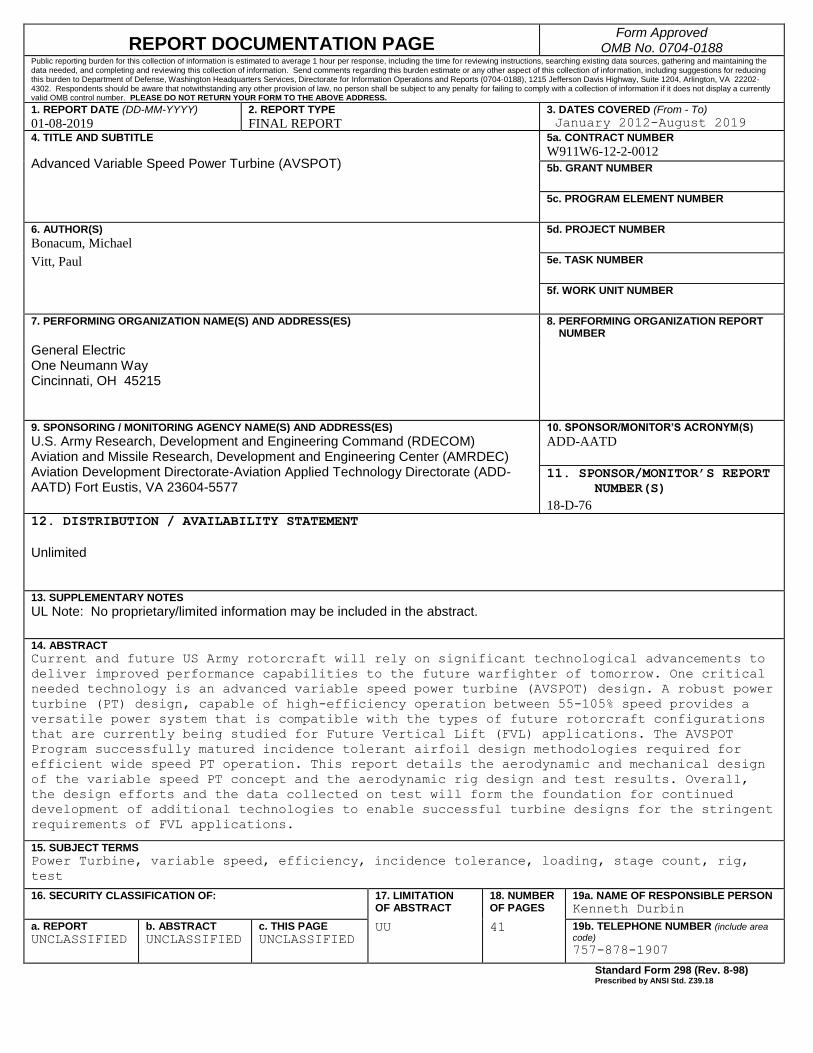
REPORT DOCUMENTATION PAGE Form Approved
OMB No. 0704-0188 Public reporting burden for this collection of information is estimated to average 1 hour per response, including the time for reviewing instructions, searching existing data sources, gathering and maintaining the data needed, and completing and reviewing this collection of information. Send comments regarding this burden estimate or any other aspect of this collection of information, including suggestions for reducing this burden to Department of Defense, Washington Headquarters Services, Directorate for Information Operations and Reports (0704-0188), 1215 Jefferson Davis Highway, Suite 1204, Arlington, VA 22202-4302. Respondents should be aware that notwithstanding any other provision of law, no person shall be subject to any penalty for failing to comply with a collection of information if it does not display a currently valid OMB control number. PLEASE DO NOT RETURN YOUR FORM TO THE ABOVE ADDRESS.
1. REPORT DATE (DD-MM-YYYY)
01-08-2019 2. REPORT TYPE
FINAL REPORT 3. DATES COVERED (From - To) January 2012-August 2019
4. TITLE AND SUBTITLE
Advanced Variable Speed Power Turbine (AVSPOT)
5a. CONTRACT NUMBER
W911W6-12-2-0012
5b. GRANT NUMBER
5c. PROGRAM ELEMENT NUMBER
6. AUTHOR(S)
Bonacum, Michael
5d. PROJECT NUMBER
Vitt, Paul
5e. TASK NUMBER
5f. WORK UNIT NUMBER
7. PERFORMING ORGANIZATION NAME(S) AND ADDRESS(ES)
General Electric One Neumann Way Cincinnati, OH 45215
8. PERFORMING ORGANIZATION REPORT NUMBER
9. SPONSORING / MONITORING AGENCY NAME(S) AND ADDRESS(ES) 10. SPONSOR/MONITOR’S ACRONYM(S)
U.S. Army Research, Development and Engineering Command (RDECOM) Aviation and Missile Research, Development and Engineering Center (AMRDEC) Aviation Development Directorate-Aviation Applied Technology Directorate (ADD-AATD) Fort Eustis, VA 23604-5577
ADD-AATD
11. SPONSOR/MONITOR’S REPORT
NUMBER(S)
18-D-76
12. DISTRIBUTION / AVAILABILITY STATEMENT
Unlimited
13. SUPPLEMENTARY NOTES
UL Note: No proprietary/limited information may be included in the abstract.
14. ABSTRACT Current and future US Army rotorcraft will rely on significant technological advancements to
deliver improved performance capabilities to the future warfighter of tomorrow. One critical
needed technology is an advanced variable speed power turbine (AVSPOT) design. A robust power
turbine (PT) design, capable of high-efficiency operation between 55-105% speed provides a
versatile power system that is compatible with the types of future rotorcraft configurations
that are currently being studied for Future Vertical Lift (FVL) applications. The AVSPOT
Program successfully matured incidence tolerant airfoil design methodologies required for
efficient wide speed PT operation. This report details the aerodynamic and mechanical design
of the variable speed PT concept and the aerodynamic rig design and test results. Overall,
the design efforts and the data collected on test will form the foundation for continued
development of additional technologies to enable successful turbine designs for the stringent
requirements of FVL applications.
15. SUBJECT TERMS Power Turbine, variable speed, efficiency, incidence tolerance, loading, stage count, rig,
test
16. SECURITY CLASSIFICATION OF:
17. LIMITATION OF ABSTRACT
18. NUMBER OF PAGES
19a. NAME OF RESPONSIBLE PERSON Kenneth Durbin
a. REPORT
UNCLASSIFIED b. ABSTRACT UNCLASSIFIED
c. THIS PAGE UNCLASSIFIED
UU 41 19b. TELEPHONE NUMBER (include area
code) 757-878-1907
Standard Form 298 (Rev. 8-98) Prescribed by ANSI Std. Z39.18

AVSPOT Final Report – Unlimited Rights TIA: W911W6-12-2-0012
Document #: RDECOM TR 18-D-76 Date: 01 August 2019
Distribution: UNLIMITED
Page i
Revision History
Revision No. Date Description
Original 9/13/18 Initial Submittal
1 8/1/19 Address USG Comments
AVSPOT Final Report – Unlimited Rights TIA: W911W6-12-2-0012
Document #: RDECOM TR 18-D-76 Date: 01 August 2019
Distribution: UNLIMITED
Page ii
Table of Contents
1 Summary ............................................................................................................................................... 1 2 Conclusions, Key Learnings, and Recommendations ........................................................................... 5 3 Aerodynamic Design ............................................................................................................................ 6
3.1 Design Procedure ......................................................................................................................... 7 3.2 Baseline Design Space Evaluation .............................................................................................. 7 3.3 Final Advanced Design ............................................................................................................. 10
3.3.1 1D Design.............................................................................................................................. 10 3.3.2 2D Design.............................................................................................................................. 11 3.3.3 3D Design.............................................................................................................................. 12
4 Engine Design ..................................................................................................................................... 13 4.1 Cycle Design ............................................................................................................................. 14 4.2 Component Design .................................................................................................................... 14
4.2.1 Airfoils .................................................................................................................................. 14 4.2.2 Rotor Structure ...................................................................................................................... 15 4.2.3 Static Structure ...................................................................................................................... 15 4.2.4 Advanced Material Technology ............................................................................................ 15 4.2.5 Component Durability ........................................................................................................... 16
4.3 System Design ........................................................................................................................... 17 5 Rig Design and Predictions ................................................................................................................. 19
5.1 Rig Mechanical Design ............................................................................................................. 19 5.2 Rig Pre-Test Predictions ............................................................................................................ 20
6 Rig Test ............................................................................................................................................... 20 6.1 Set-up ......................................................................................................................................... 21 6.2 Test Operations .......................................................................................................................... 23 6.3 Summary of Completed Testing ................................................................................................ 24
7 Rig Test Results .................................................................................................................................. 26 7.1 Key Mechanical Results ............................................................................................................ 26 7.2 Aerodynamic Data Summary .................................................................................................... 27 7.3 Rig Aerodynamic Validation ..................................................................................................... 28
7.3.1 Inlet condition characterization and stability for Aero Design Point .................................... 28 7.3.2 Exit Contours and Profiles .................................................................................................... 29 7.3.3 Airfoil Loading Measurement ............................................................................................... 31 7.3.4 Flow Visualization ................................................................................................................ 31
7.4 Derivatives and Reynolds Effects .............................................................................................. 32 7.4.1 Clearance Derivatives ........................................................................................................... 32 7.4.2 Purge Derivatives .................................................................................................................. 32 7.4.3 Reynolds Effects ................................................................................................................... 33
7.5 Turbine Aerodynamic Design Validation .................................................................................. 33 7.5.1 Aero Design Point Performance ............................................................................................ 33 7.5.2 Prediction Models Comparison to Test Data for the Design PR Speedline .......................... 34
7.6 Turbine Maps ............................................................................................................................. 35 7.7 Rig Test Results Conclusion...................................................................................................... 36
8 Performance vs Program Goals ........................................................................................................... 36 9 References & Definitions .................................................................................................................... 39
9.1 References ................................................................................................................................. 39 9.2 Acronyms and Definitions ......................................................................................................... 39
AVSPOT Final Report – Unlimited Rights TIA: W911W6-12-2-0012
Document #: RDECOM TR 18-D-76 Date: 01 August 2019
Distribution: UNLIMITED
Page iii
Figures
Figure 1-1: AVSPOT technology enables next-gen rotorcraft concepts to meet FVL goals. ........ 1
Figure 1-2: AVSPOT PT rig installed at NDTL ............................................................................. 2 Figure 1-3: AVSPOT altitude performance map of efficiency plotted as a function of turbine
speed from 55%-105% .................................................................................................................... 3 Figure 1-4: Product design incorporates learnings from AVSPOT rig test and other relevant GE
development efforts. ....................................................................................................................... 4
Figure 3-1: Vector diagrams and the definition of incidence on the airfoil (left), and the loss
bucket as a function of incidence angle (right) ............................................................................... 7 Figure 3-2: Comparison of %Delta Efficiency as a Function of Speed (%N) for 1D (solid, blue
circles) and 3D CFD Models (dashed, red squares) ....................................................................... 8 Figure 3-3: Comparison of %Delta Flow Function as a Function of Speed (%N) for 1D (solid,
blue circles) and 3D CFD Models (dashed, red squares) ................................................................ 9 Figure 3-4: NASA research shows the impact of incidence loss on one type of airfoil design
considered for variable speed operation (Reference 2)................................................................. 10
Figure 3-5: Flowpath with 2D through-flow solution streamlines used to complete airfoil design
(Bottom) ........................................................................................................................................ 11 Figure 3-6: Example of multipoint optimization on a simple airfoil. ........................................... 12
Figure 3-7: Multistage CFD Efficiency Contour Comparison to Baseline................................... 13 Figure 4-1: Additive manufacturing process. .............................................................................. 16
Figure 5-1: Rig Test Vehicle ......................................................................................................... 19 Figure 6-1: NDTL facility overview ............................................................................................. 21 Figure 6-2: AVSPOT PT Rig installed at NDTL.......................................................................... 22
Figure 7-1: AVSPOT test data validates intended performance improvements at low speed
relative to the base design ............................................................................................................. 28
Figure 7-2: PL45 5-hole vs. CFD Swirl Match behind Pre-Swirler ............................................. 29 Figure 7-3: Absolute Total Pressure (psia) measurements show good agreement with CFD
predictions. .................................................................................................................................... 30
Figure 7-4: Absolute Total Temperature (°R) measurements agree with CFD predictions ......... 30
Figure 7-5: Swirl (°) measurements show very good agreement with CFD predictions .............. 31
Figure 7-6: Measured delta efficiency vs. average clearance closure. ......................................... 32
Figure 7-7: AVSPOT design speed line efficiency lapse test data compared to CFD and 1D
model predictions. ......................................................................................................................... 34 Figure 7-8: AVSPOT performance map. Lines of constant Pressure Ratio. ................................ 35 Figure 7-9: AVSPOT flow function map. Lines of Constant Speed. ........................................... 36 Figure 8-1: Product design incorporates learnings from AVSPOT rig test and other relevant GE
development efforts. ..................................................................................................................... 38
Tables
Table 2-1: AVSPOT Program Scorecard ........................................................................................ 5 Table 9-1: Acronyms and Definitions........................................................................................... 39
Table 9-2: Turbine Descriptive Parameters .................................................................................. 41
AVSPOT Final Report – Unlimited Rights TIA: W911W6-12-2-0012
Document #: RDECOM TR 18-D-76 Date: 01 August 2019
Distribution: UNLIMITED
Page 1
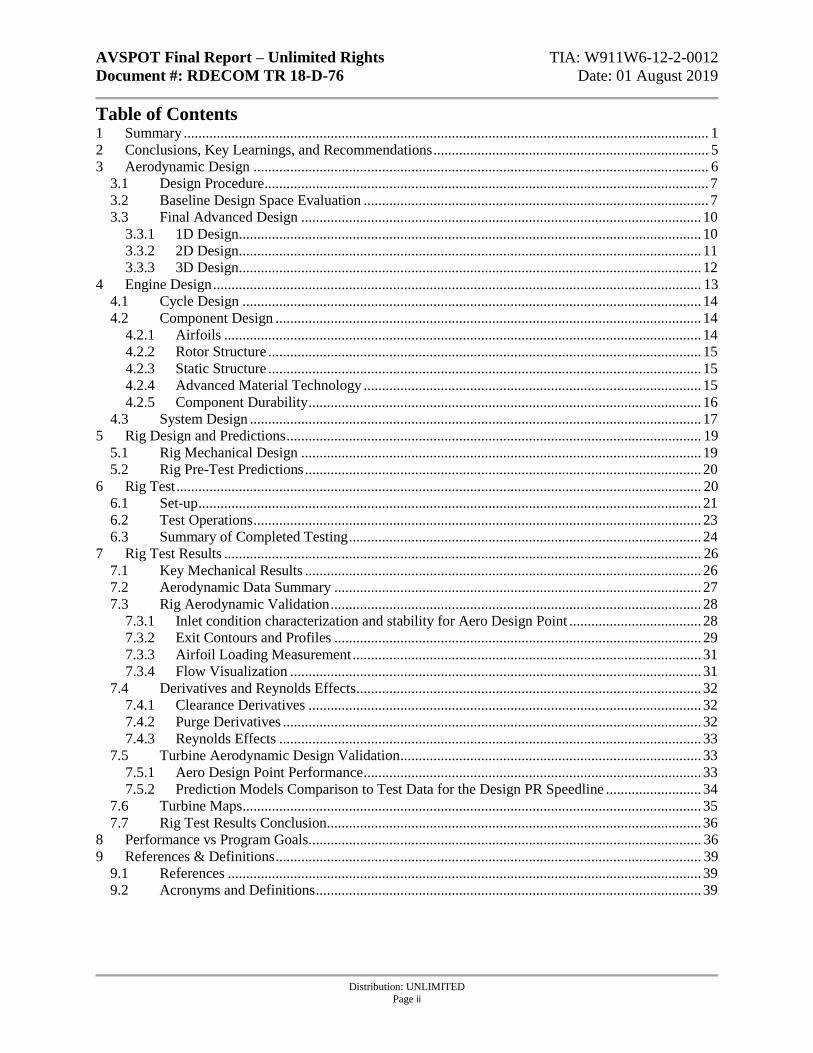
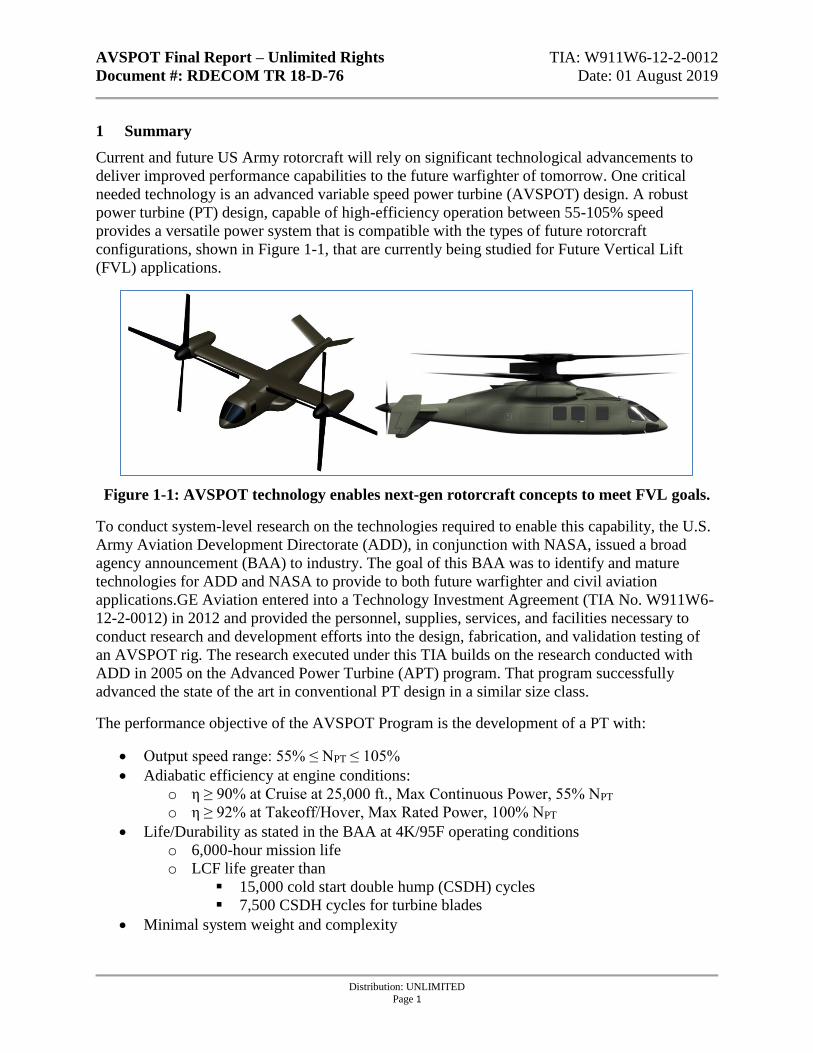
1 Summary
Current and future US Army rotorcraft will rely on significant technological advancements to
deliver improved performance capabilities to the future warfighter of tomorrow. One critical
needed technology is an advanced variable speed power turbine (AVSPOT) design. A robust
power turbine (PT) design, capable of high-efficiency operation between 55-105% speed
provides a versatile power system that is compatible with the types of future rotorcraft
configurations, shown in Figure 1-1, that are currently being studied for Future Vertical Lift
(FVL) applications.
Figure 1-1: AVSPOT technology enables next-gen rotorcraft concepts to meet FVL goals.
To conduct system-level research on the technologies required to enable this capability, the U.S.
Army Aviation Development Directorate (ADD), in conjunction with NASA, issued a broad
agency announcement (BAA) to industry. The goal of this BAA was to identify and mature
technologies for ADD and NASA to provide to both future warfighter and civil aviation
applications.GE Aviation entered into a Technology Investment Agreement (TIA No. W911W6-
12-2-0012) in 2012 and provided the personnel, supplies, services, and facilities necessary to
conduct research and development efforts into the design, fabrication, and validation testing of
an AVSPOT rig. The research executed under this TIA builds on the research conducted with
ADD in 2005 on the Advanced Power Turbine (APT) program. That program successfully
advanced the state of the art in conventional PT design in a similar size class.
The performance objective of the AVSPOT Program is the development of a PT with:
• Output speed range: 55% ≤ NPT ≤ 105%
• Adiabatic efficiency at engine conditions:
o η ≥ 90% at Cruise at 25,000 ft., Max Continuous Power, 55% NPT
o η ≥ 92% at Takeoff/Hover, Max Rated Power, 100% NPT
• Life/Durability as stated in the BAA at 4K/95F operating conditions
o 6,000-hour mission life
o LCF life greater than
▪ 15,000 cold start double hump (CSDH) cycles
▪ 7,500 CSDH cycles for turbine blades
• Minimal system weight and complexity
AVSPOT Final Report – Unlimited Rights TIA: W911W6-12-2-0012
Document #: RDECOM TR 18-D-76 Date: 01 August 2019
Distribution: UNLIMITED
Page 2
The final AVSPOT design is a simple, compact configuration incorporating advanced airfoil
technology coupled with an optimal primary aero design point (ADP). This design approach
accommodates the blade incidence angle and other aerodynamic changes across the speed range
and delivers significant performance improvement at 55% speed relative to a baseline
conventional design. The notional application (vision system) for this technology is an engine
with a state of the art (SOA) conventional PT developed by GE using Advanced Affordable
Turbine Engine (AATE) Program learnings. This is used as the baseline for all comparisons to
the AVSPOT results.
A component test rig was designed for the aerodynamic equivalent full-scale size of the final
AVSPOT design. The rig configuration and instrumentation package were defined to collect
steady state data across the operating range to generate a performance map, as well as steady
traverse data at the stage exit locations, and unsteady traverse data at the turbine exit to better
understand the complex flow physics both on and off design.
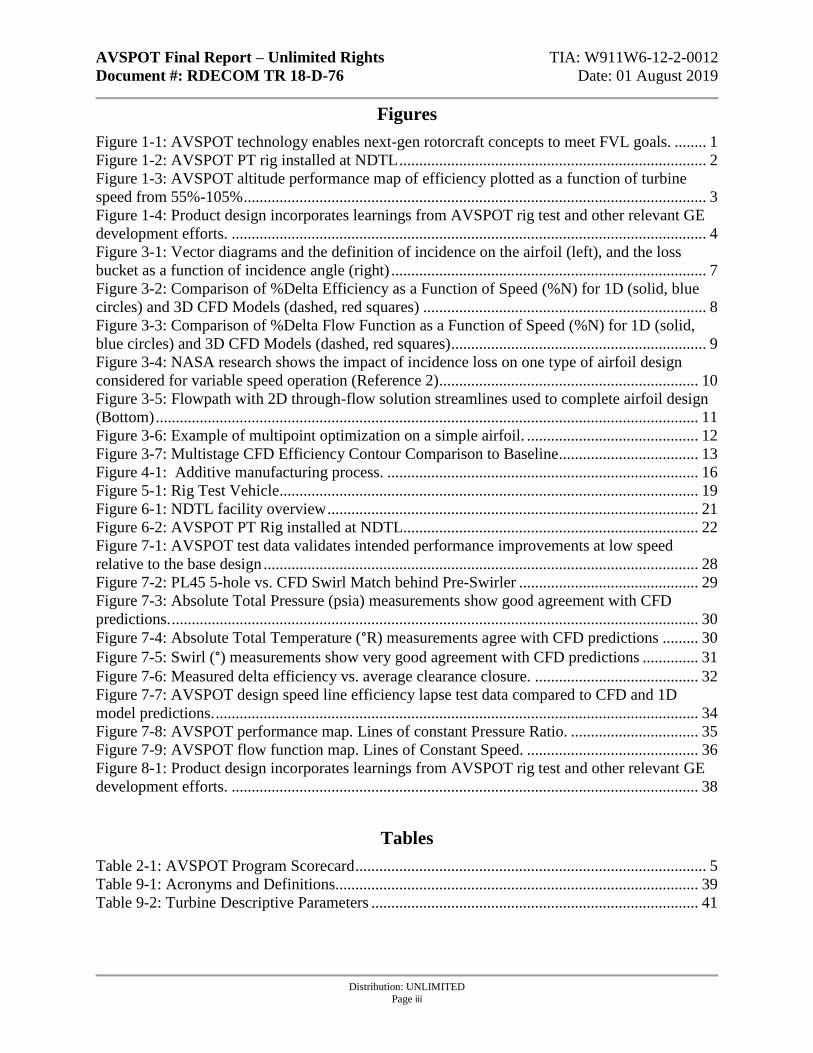
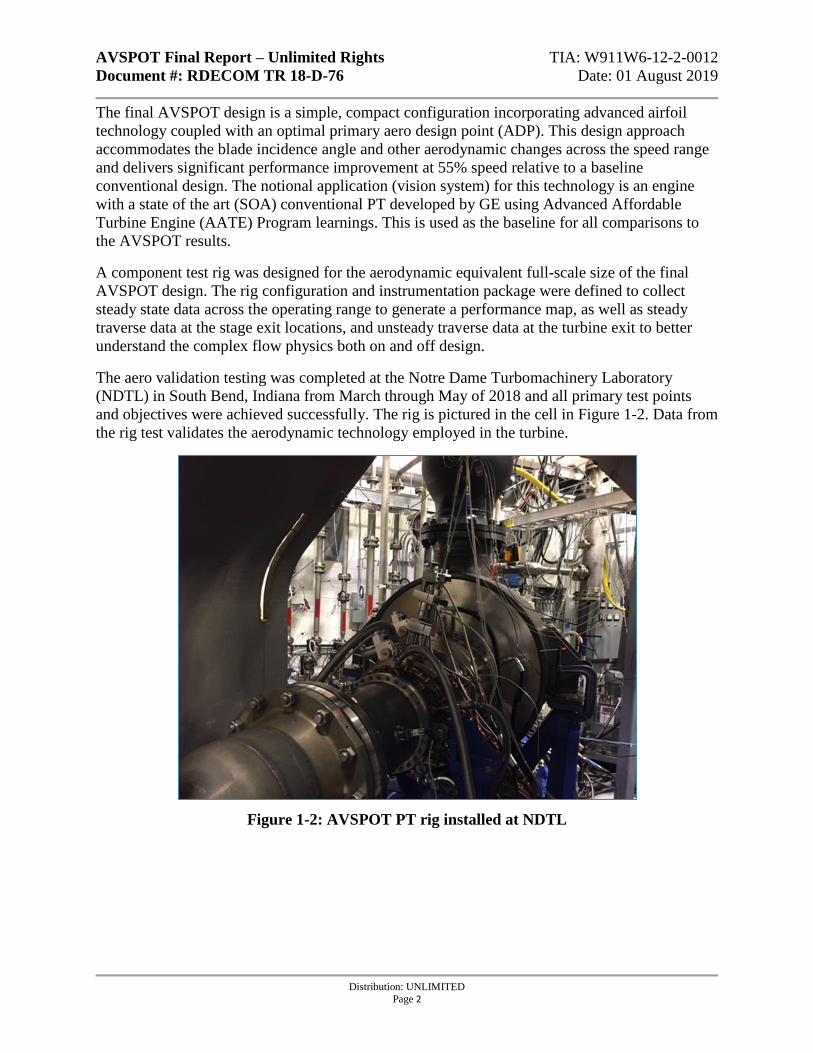
The aero validation testing was completed at the Notre Dame Turbomachinery Laboratory
(NDTL) in South Bend, Indiana from March through May of 2018 and all primary test points
and objectives were achieved successfully. The rig is pictured in the cell in Figure 1-2. Data from
the rig test validates the aerodynamic technology employed in the turbine.
Figure 1-2: AVSPOT PT rig installed at NDTL
AVSPOT Final Report – Unlimited Rights TIA: W911W6-12-2-0012
Document #: RDECOM TR 18-D-76 Date: 01 August 2019
Distribution: UNLIMITED
Page 3
The AVSPOT power turbine aero rig test successfully achieved all main objectives:
✓ Understood key performance derivatives, including Reynolds number, purge flows, and
tip clearances ✓ Measured PT performance trends vs. speed at multiple pressure ratios (PR) to produce
PT map and validate analytical trends. ✓ Measured airfoil static pressures on two vanes to validate airfoil design and analytical
tools.
✓ Completed flow visualization.
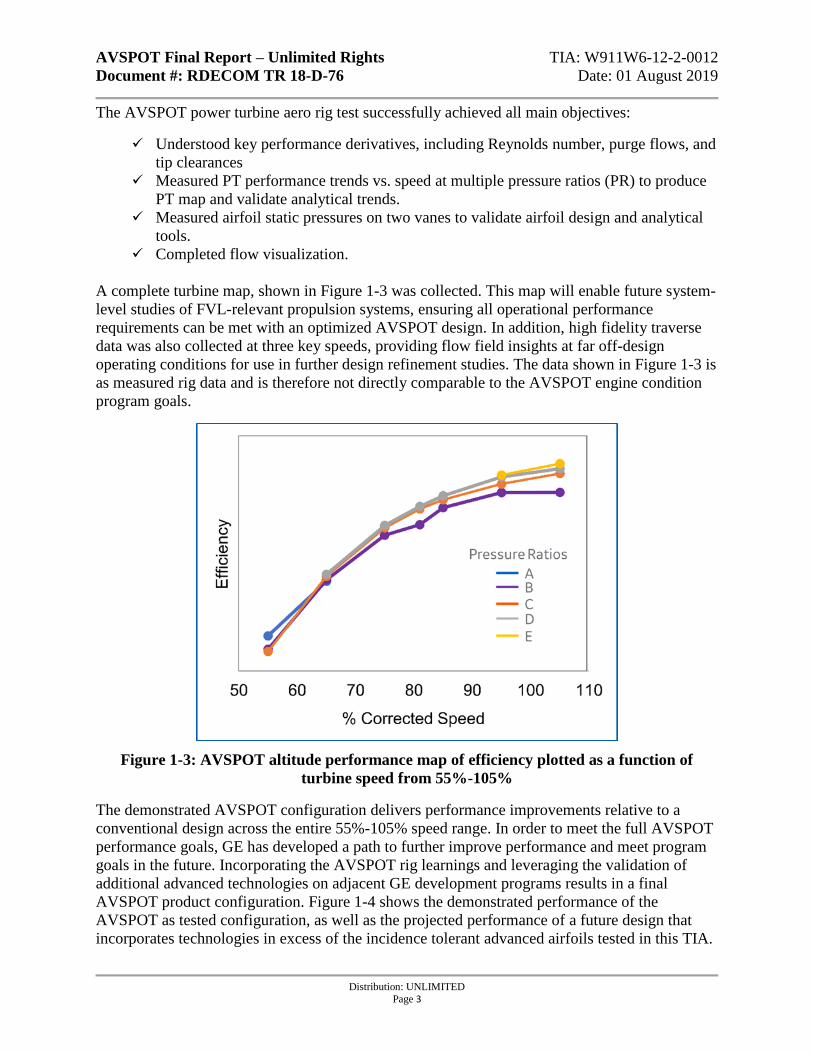
A complete turbine map, shown in Figure 1-3 was collected. This map will enable future system-
level studies of FVL-relevant propulsion systems, ensuring all operational performance
requirements can be met with an optimized AVSPOT design. In addition, high fidelity traverse
data was also collected at three key speeds, providing flow field insights at far off-design
operating conditions for use in further design refinement studies. The data shown in Figure 1-3 is
as measured rig data and is therefore not directly comparable to the AVSPOT engine condition
program goals.
Figure 1-3: AVSPOT altitude performance map of efficiency plotted as a function of
turbine speed from 55%-105%
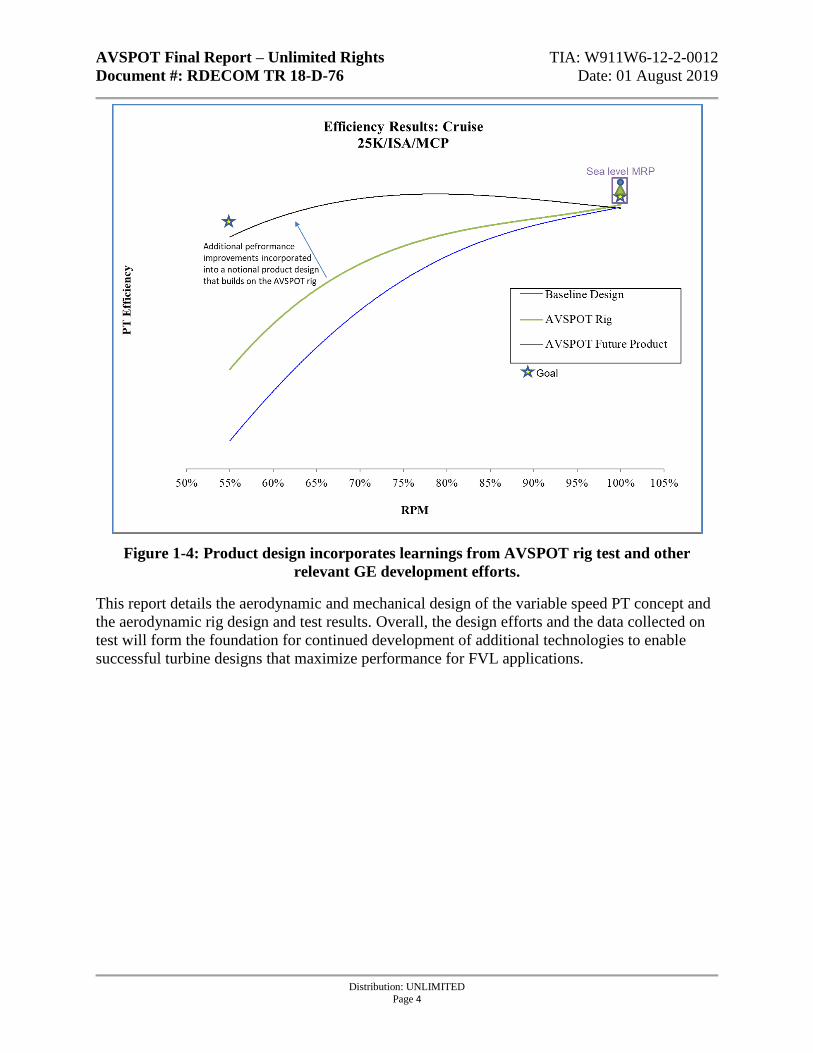
The demonstrated AVSPOT configuration delivers performance improvements relative to a
conventional design across the entire 55%-105% speed range. In order to meet the full AVSPOT
performance goals, GE has developed a path to further improve performance and meet program
goals in the future. Incorporating the AVSPOT rig learnings and leveraging the validation of
additional advanced technologies on adjacent GE development programs results in a final
AVSPOT product configuration. Figure 1-4 shows the demonstrated performance of the
AVSPOT as tested configuration, as well as the projected performance of a future design that
incorporates technologies in excess of the incidence tolerant advanced airfoils tested in this TIA.
AVSPOT Final Report – Unlimited Rights TIA: W911W6-12-2-0012
Document #: RDECOM TR 18-D-76 Date: 01 August 2019
Distribution: UNLIMITED
Page 4
Figure 1-4: Product design incorporates learnings from AVSPOT rig test and other
relevant GE development efforts.
This report details the aerodynamic and mechanical design of the variable speed PT concept and
the aerodynamic rig design and test results. Overall, the design efforts and the data collected on
test will form the foundation for continued development of additional technologies to enable
successful turbine designs that maximize performance for FVL applications.
AVSPOT Final Report – Unlimited Rights TIA: W911W6-12-2-0012
Document #: RDECOM TR 18-D-76 Date: 01 August 2019
Distribution: UNLIMITED
Page 5
2 Conclusions, Key Learnings, and Recommendations
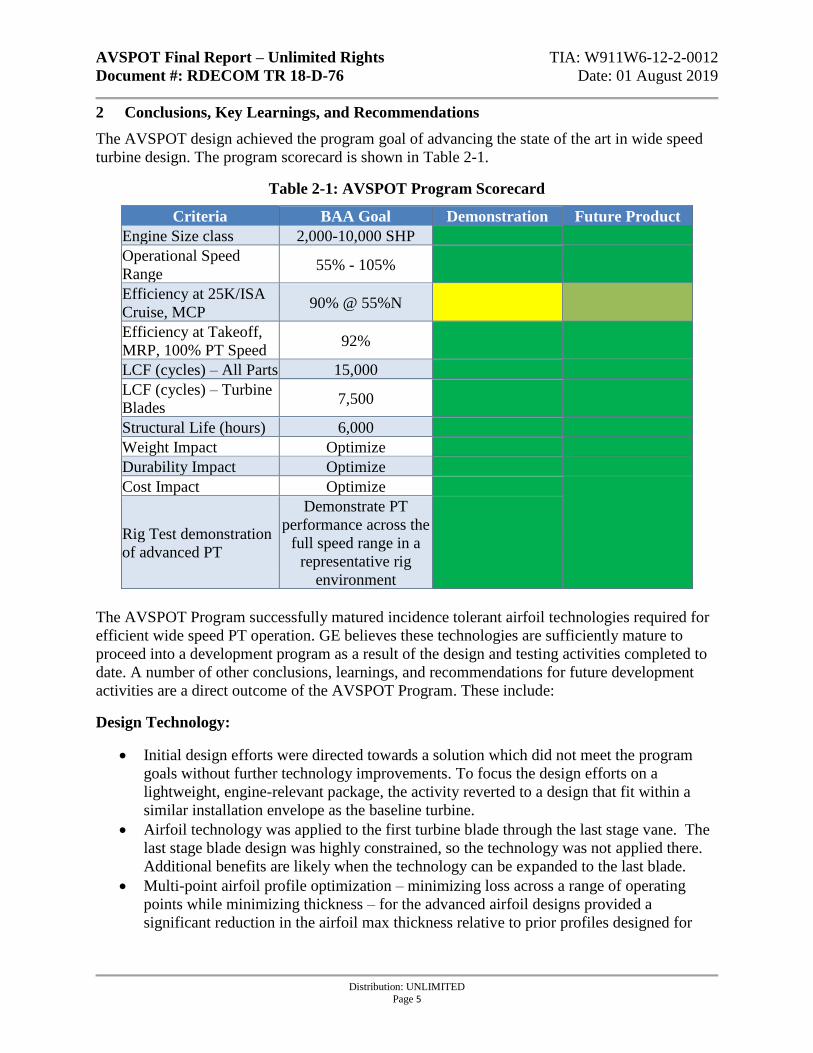
The AVSPOT design achieved the program goal of advancing the state of the art in wide speed
turbine design. The program scorecard is shown in Table 2-1.
Table 2-1: AVSPOT Program Scorecard
Criteria BAA Goal Demonstration Future Product
Engine Size class 2,000-10,000 SHP
Operational Speed
Range 55% - 105%
Efficiency at 25K/ISA
Cruise, MCP 90% @ 55%N
Efficiency at Takeoff,
MRP, 100% PT Speed 92%
LCF (cycles) – All Parts 15,000
LCF (cycles) – Turbine
Blades 7,500
Structural Life (hours) 6,000
Weight Impact Optimize
Durability Impact Optimize
Cost Impact Optimize
Rig Test demonstration
of advanced PT
Demonstrate PT
performance across the
full speed range in a
representative rig
environment
The AVSPOT Program successfully matured incidence tolerant airfoil technologies required for
efficient wide speed PT operation. GE believes these technologies are sufficiently mature to
proceed into a development program as a result of the design and testing activities completed to
date. A number of other conclusions, learnings, and recommendations for future development
activities are a direct outcome of the AVSPOT Program. These include:
Design Technology:
• Initial design efforts were directed towards a solution which did not meet the program
goals without further technology improvements. To focus the design efforts on a
lightweight, engine-relevant package, the activity reverted to a design that fit within a
similar installation envelope as the baseline turbine.
• Airfoil technology was applied to the first turbine blade through the last stage vane. The
last stage blade design was highly constrained, so the technology was not applied there.
Additional benefits are likely when the technology can be expanded to the last blade.
• Multi-point airfoil profile optimization – minimizing loss across a range of operating
points while minimizing thickness – for the advanced airfoil designs provided a
significant reduction in the airfoil max thickness relative to prior profiles designed for

AVSPOT Final Report – Unlimited Rights TIA: W911W6-12-2-0012
Document #: RDECOM TR 18-D-76 Date: 01 August 2019
Distribution: UNLIMITED
Page 6
wide speed operation. Minimizing weight while optimizing performance is a key factor
for a product relevant design.
• The ADP was set to balance the off-design performance characteristic between cruise
condition and sea level takeoff condition.
• Future engine system evaluations with a variable speed power turbine need to consider
the flow function change with shaft speed.
Test Design:
• Use of “stabbed and brazed” rig vane designs results in excessive manufacturing
complexities.
• Designing “engine-like” seals and rotors on the rig eliminates the need for complex
corrections back to the engine configuration, since leakages and associated windage
losses are consistent from rig to engine.
• Incorporating a rigorous balance plan leveraging successful engine experience into the rig
design results in very low levels of imbalance on test.
• Designing the instrumentation package and associated routing features in parallel with
the rest of the rig reduces costly and risky part re-work and ensures that there are no
unexpected clashes during assembly.
Test:
• The area traverse data collected were very high quality and compared well with the more
traditional exit rake measurements.
• Surface flow visualization was conducted, and qualitative results highlighted the flow
conditions on the critical surfaces.
• Losses in the rig exhaust scroll need to be modeled more effectively.
Tools:
• Rig data indicated that the design was less sensitive than expected based on the 1D
models. 3D CFD was more effective at capturing the measured trends, but still
underpredicted the performance. The rig captured the complete interaction of all the loss
mechanisms.
• Reynolds lapse was measured at a range of incidence angles – this data is not currently
available in literature, so it will provide a key calibration dataset for the design tools.
3 Aerodynamic Design
The three main aerodynamic challenges in designing a variable speed PT optimized for high
altitude flight are off-design incidence effects, Reynolds number losses, and stage loading
impacts. Airfoil incidence angle swings across a wide range, from negative at high speed to
positive at low speed. Reynolds numbers are low at very high altitudes on small turbomachines
such as those designed for AVSPOT and begin to approach the transitional flow range. Stage
loading, a function of work extraction and pitchline speed, increases as the PT slows down,
increasing secondary flow and profile losses. The AVSPOT design incorporates aerodynamic
technologies focused on minimizing these effects. Below is a brief summary of the aerodynamic
AVSPOT Final Report – Unlimited Rights TIA: W911W6-12-2-0012
Document #: RDECOM TR 18-D-76 Date: 01 August 2019
Distribution: UNLIMITED
Page 7
tools and methods used in the program, the trade studies completed, and the final aerodynamic
design of the turbine.
3.1 Design Procedure
The design procedure consisted of the following steps:
1. Preliminary Design: A 1-D meanline code was used to develop the preliminary turbine
flowpath and free-vortex vector diagram.
2. Flowpath and Vector Diagram: An axisymmetric streamline curvature solver was used
to develop the 2-D vector diagram.
3. Detailed Airfoil Geometry: The airfoils were designed on surfaces defined by the 2-D
code streamlines using a parametric airfoil design tool.
4. Flow Field and Performance Evaluation: Multi-row CFD models were used to evaluate
the advanced design.
3.2 Baseline Design Space Evaluation
Several aerodynamic design iterations were completed early in the program. First, a
configuration utilizing conventional airfoil technologies was designed in order to establish a
performance baseline for a concept that used existing technologies to address PT operational
efficiency across a wide speed range. These studies were completed early in the program to
better understand the design space for the AVSPOT technologies. The 1-D model was used to
evaluate trades on stage count, flowpath geometry, design speed, worksplit, airfoil counts, and
overall PT performance. The AVSPOT inlet was constrained to align with the APT to allow
reuse of the existing rig inlet section. The exit case radius was constrained by the max allowable
tip speed and the AN2 constraint then set the hub radius.
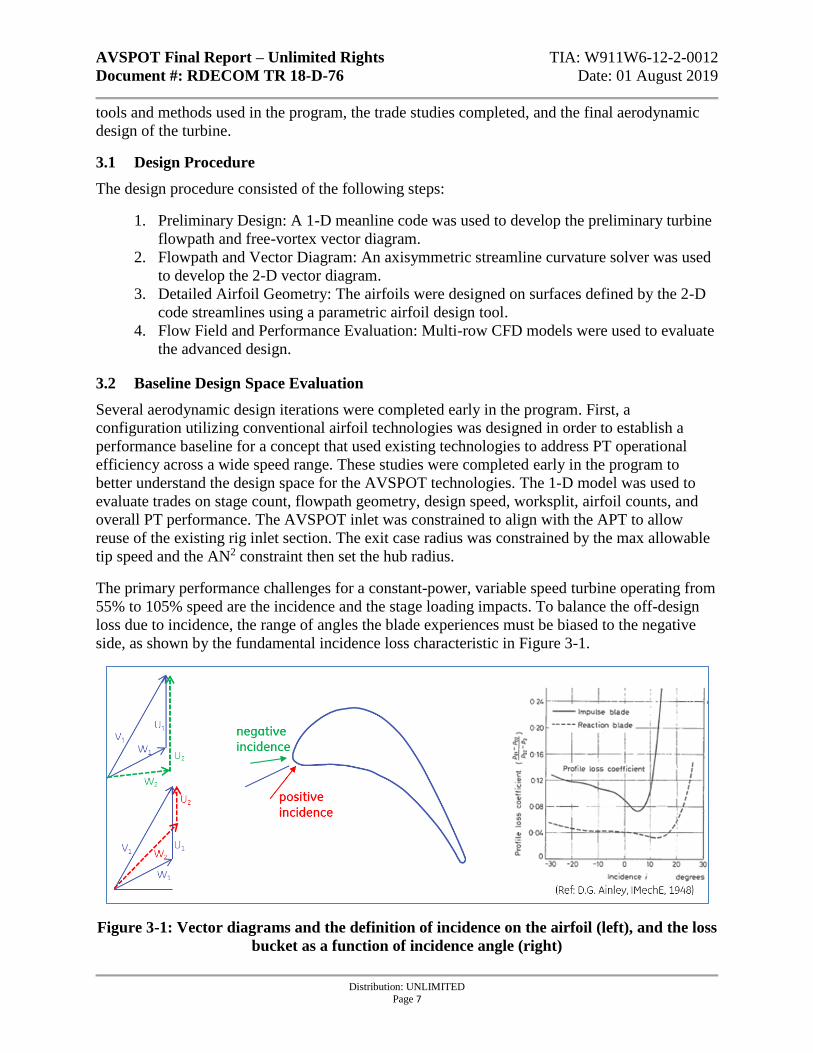
The primary performance challenges for a constant-power, variable speed turbine operating from
55% to 105% speed are the incidence and the stage loading impacts. To balance the off-design
loss due to incidence, the range of angles the blade experiences must be biased to the negative
side, as shown by the fundamental incidence loss characteristic in Figure 3-1.
Figure 3-1: Vector diagrams and the definition of incidence on the airfoil (left), and the loss
bucket as a function of incidence angle (right)
AVSPOT Final Report – Unlimited Rights TIA: W911W6-12-2-0012
Document #: RDECOM TR 18-D-76 Date: 01 August 2019
Distribution: UNLIMITED
Page 8
The stage loading variation with speed shows that at 55% speed the stage loading increases by
more than 3x compared to 100% speed. The impact of the stage loading level on performance
can be shown on the industry standard Smith chart, which clearly shows the performance
challenge operating at the 55% speed condition.
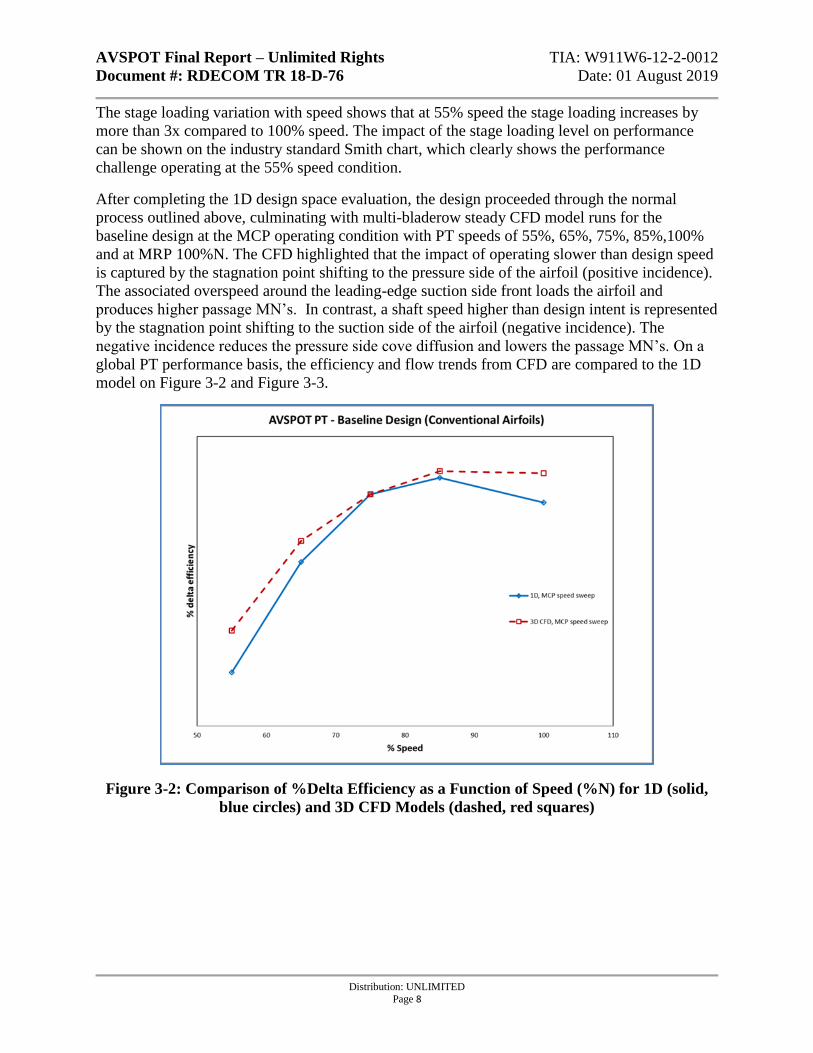
After completing the 1D design space evaluation, the design proceeded through the normal
process outlined above, culminating with multi-bladerow steady CFD model runs for the
baseline design at the MCP operating condition with PT speeds of 55%, 65%, 75%, 85%,100%
and at MRP 100%N. The CFD highlighted that the impact of operating slower than design speed
is captured by the stagnation point shifting to the pressure side of the airfoil (positive incidence).
The associated overspeed around the leading-edge suction side front loads the airfoil and
produces higher passage MN’s. In contrast, a shaft speed higher than design intent is represented
by the stagnation point shifting to the suction side of the airfoil (negative incidence). The
negative incidence reduces the pressure side cove diffusion and lowers the passage MN’s. On a
global PT performance basis, the efficiency and flow trends from CFD are compared to the 1D
model on Figure 3-2 and Figure 3-3.
Figure 3-2: Comparison of %Delta Efficiency as a Function of Speed (%N) for 1D (solid,
blue circles) and 3D CFD Models (dashed, red squares)
AVSPOT Final Report – Unlimited Rights TIA: W911W6-12-2-0012
Document #: RDECOM TR 18-D-76 Date: 01 August 2019
Distribution: UNLIMITED
Page 9
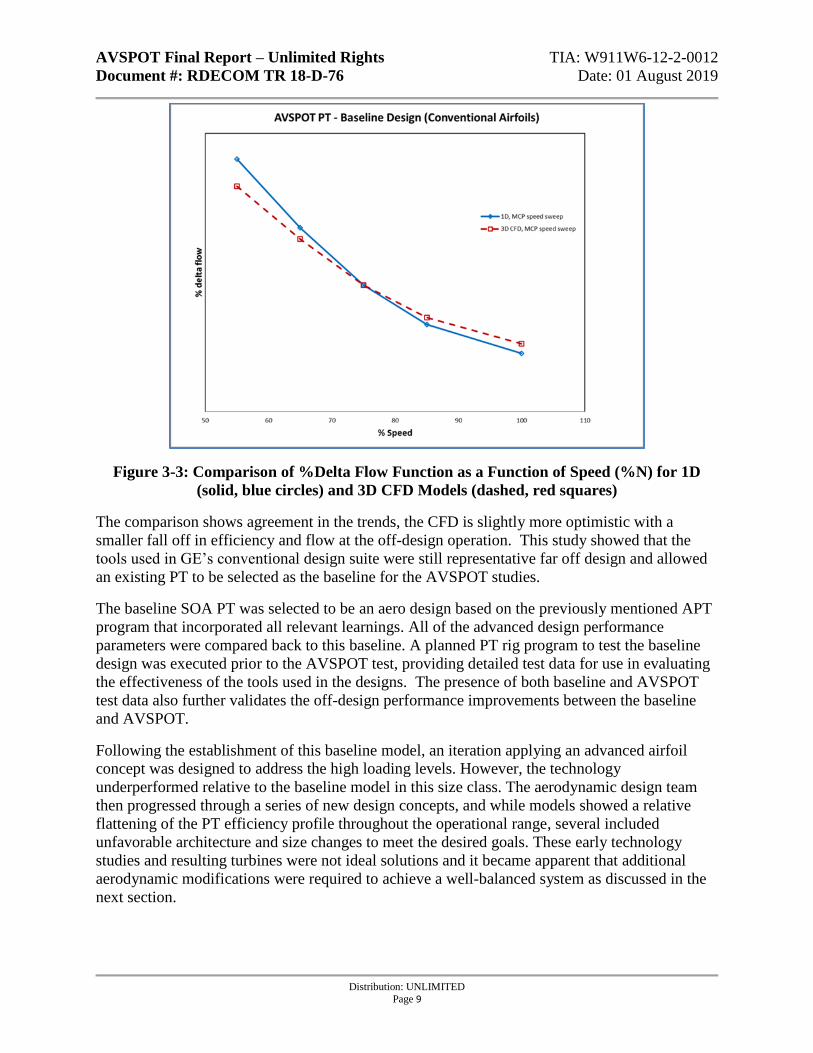
Figure 3-3: Comparison of %Delta Flow Function as a Function of Speed (%N) for 1D
(solid, blue circles) and 3D CFD Models (dashed, red squares)
The comparison shows agreement in the trends, the CFD is slightly more optimistic with a
smaller fall off in efficiency and flow at the off-design operation. This study showed that the
tools used in GE’s conventional design suite were still representative far off design and allowed
an existing PT to be selected as the baseline for the AVSPOT studies.
The baseline SOA PT was selected to be an aero design based on the previously mentioned APT
program that incorporated all relevant learnings. All of the advanced design performance
parameters were compared back to this baseline. A planned PT rig program to test the baseline
design was executed prior to the AVSPOT test, providing detailed test data for use in evaluating
the effectiveness of the tools used in the designs. The presence of both baseline and AVSPOT
test data also further validates the off-design performance improvements between the baseline
and AVSPOT.
Following the establishment of this baseline model, an iteration applying an advanced airfoil
concept was designed to address the high loading levels. However, the technology
underperformed relative to the baseline model in this size class. The aerodynamic design team
then progressed through a series of new design concepts, and while models showed a relative
flattening of the PT efficiency profile throughout the operational range, several included
unfavorable architecture and size changes to meet the desired goals. These early technology
studies and resulting turbines were not ideal solutions and it became apparent that additional
aerodynamic modifications were required to achieve a well-balanced system as discussed in the
next section.
AVSPOT Final Report – Unlimited Rights TIA: W911W6-12-2-0012
Document #: RDECOM TR 18-D-76 Date: 01 August 2019
Distribution: UNLIMITED
Page 10
3.3 Final Advanced Design
A key factor in the engine design for VTOL applications is engine weight and package size. The
ultimate objective is to provide the variable speed aerodynamic performance benefit in the most
compact package. Therefore, the AVSPOT design applied the learnings from the early studies
and optimized them into a compact configuration that delivers a significant improvement in
performance at 55% speed compared to a conventional design. The final AVSPOT ADP power
class, operating condition, and speed is sized specifically for FVL applications. The optimization
studies focused on biasing performance to the points where preliminary studies have shown
certain future rotorcraft will likely cruise. Advanced blading is used to accommodate flow angle
and other aerodynamic parameter swings across the speed range. The airfoils are designed using
multi-objective design optimization, which adjusts the individual blade shape to achieve the
optimal performance across the speed range. Testing this configuration provided detailed
performance insights into the behavior of the design at high loading levels and forms a new
baseline to advance the technology and fulfil mission requirements. The final AVSPOT ADP
power, operating condition, and speed are sized specifically for FVL applications that GE
identified with other industry members.
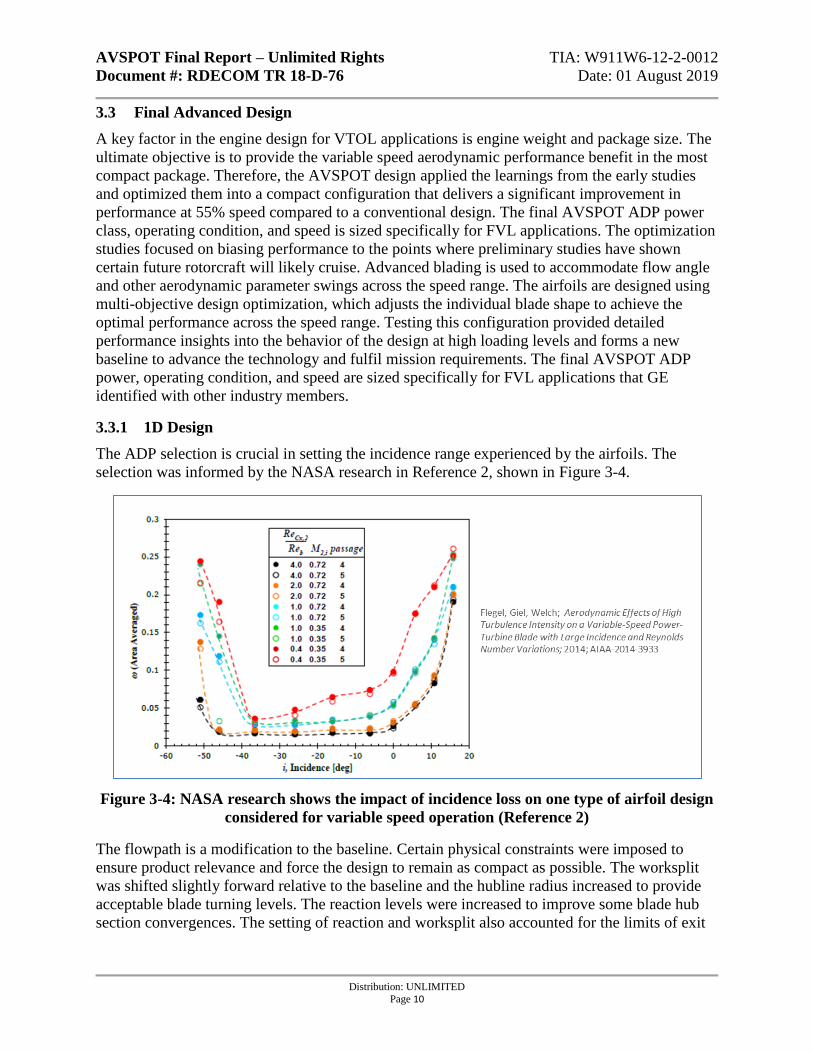
3.3.1 1D Design
The ADP selection is crucial in setting the incidence range experienced by the airfoils. The
selection was informed by the NASA research in Reference 2, shown in Figure 3-4.
Figure 3-4: NASA research shows the impact of incidence loss on one type of airfoil design
considered for variable speed operation (Reference 2)
The flowpath is a modification to the baseline. Certain physical constraints were imposed to
ensure product relevance and force the design to remain as compact as possible. The worksplit
was shifted slightly forward relative to the baseline and the hubline radius increased to provide
acceptable blade turning levels. The reaction levels were increased to improve some blade hub
section convergences. The setting of reaction and worksplit also accounted for the limits of exit
AVSPOT Final Report – Unlimited Rights TIA: W911W6-12-2-0012
Document #: RDECOM TR 18-D-76 Date: 01 August 2019
Distribution: UNLIMITED
Page 11
swirl and MN. The airfoil count and chord were then set to provide acceptable Zweifel loading
levels at low speed operation.
The 1D model efficiency prediction for the altitude speed sweep shows that AVSPOT design
provides a significant benefit in the low shaft speed region relative to the baseline design,
however the 1D efficiency is short of the goal at 55%N. An itemization of the loss accounting
from the 1D model guided the technologies leveraged from the early studies and applied in the
detailed design to improve performance. The 1D loss accounting also shows that running this
size class PT at 25K ft altitude results in low Reynolds number conditions and the shaft speed
range produces high MN levels. The combination of the high exit MN and low Reynolds number
pushes the AVSPOT PT outside of typical GE engine experience. The 1D model identified this
as a potential performance risk and important conditions to replicate and collect data in the rig
test program.
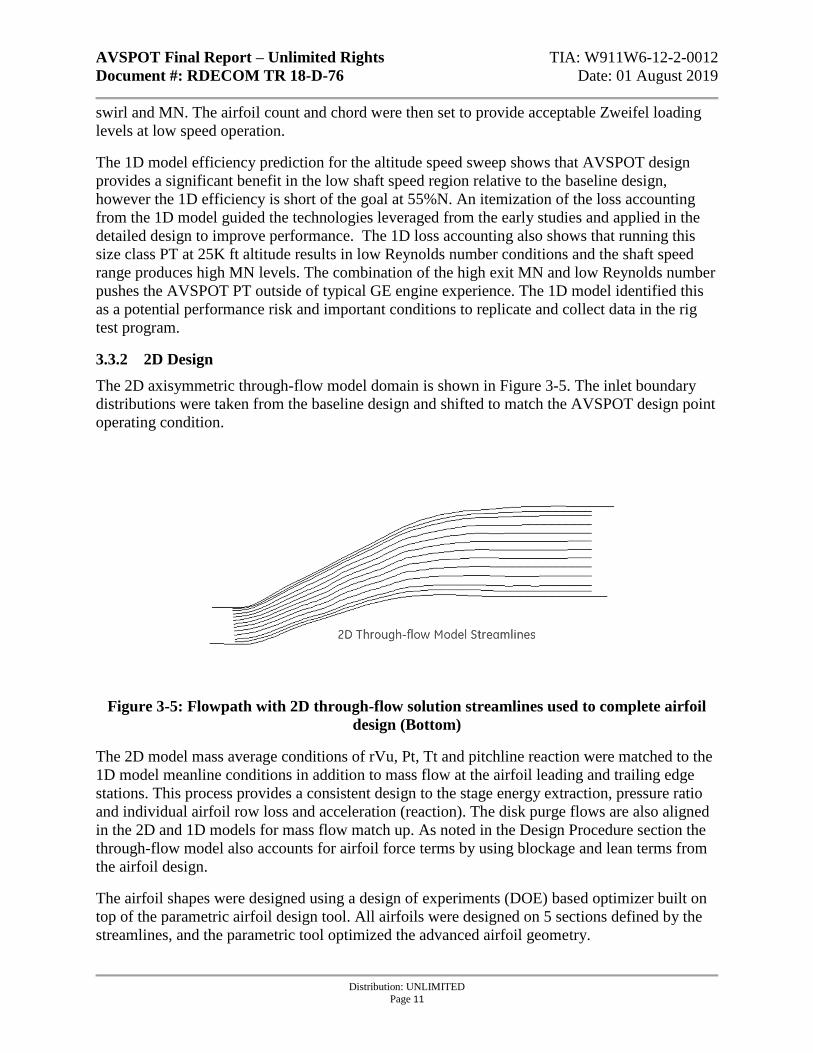
3.3.2 2D Design
The 2D axisymmetric through-flow model domain is shown in Figure 3-5. The inlet boundary
distributions were taken from the baseline design and shifted to match the AVSPOT design point
operating condition.
Figure 3-5: Flowpath with 2D through-flow solution streamlines used to complete airfoil
design (Bottom)
The 2D model mass average conditions of rVu, Pt, Tt and pitchline reaction were matched to the
1D model meanline conditions in addition to mass flow at the airfoil leading and trailing edge
stations. This process provides a consistent design to the stage energy extraction, pressure ratio
and individual airfoil row loss and acceleration (reaction). The disk purge flows are also aligned
in the 2D and 1D models for mass flow match up. As noted in the Design Procedure section the
through-flow model also accounts for airfoil force terms by using blockage and lean terms from
the airfoil design.
The airfoil shapes were designed using a design of experiments (DOE) based optimizer built on
top of the parametric airfoil design tool. All airfoils were designed on 5 sections defined by the
streamlines, and the parametric tool optimized the advanced airfoil geometry.
AVSPOT Final Report – Unlimited Rights TIA: W911W6-12-2-0012
Document #: RDECOM TR 18-D-76 Date: 01 August 2019
Distribution: UNLIMITED
Page 12
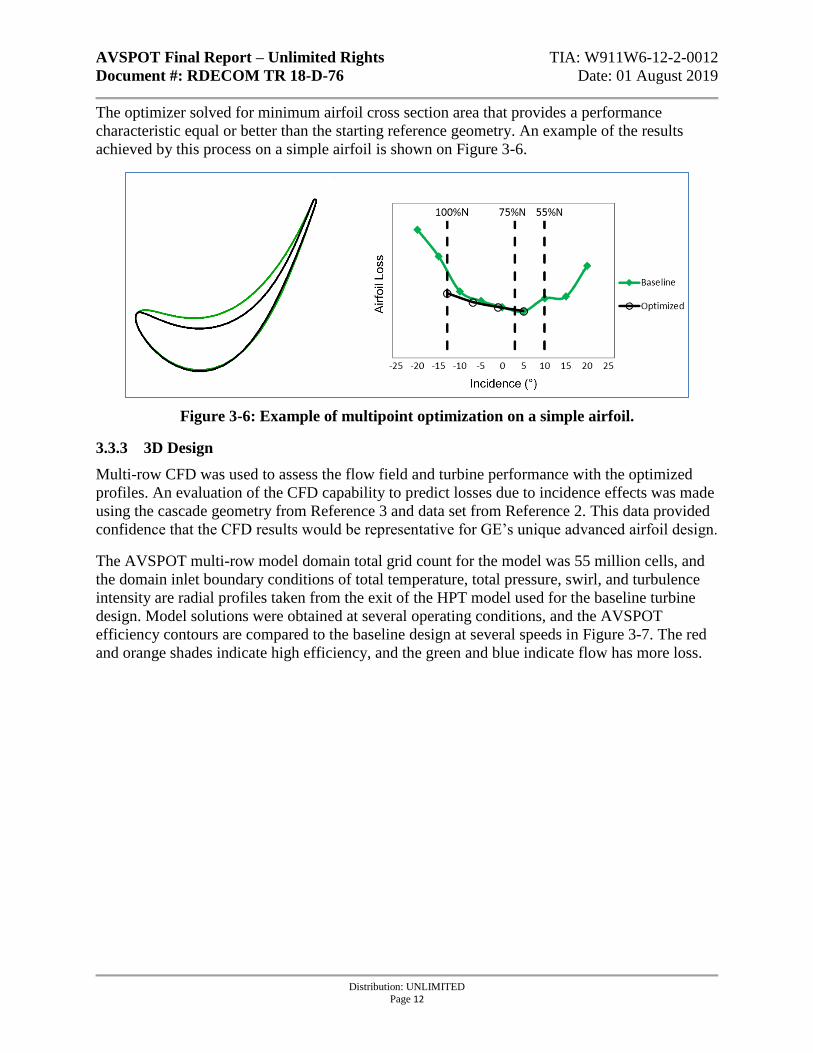
The optimizer solved for minimum airfoil cross section area that provides a performance
characteristic equal or better than the starting reference geometry. An example of the results
achieved by this process on a simple airfoil is shown on Figure 3-6.
Figure 3-6: Example of multipoint optimization on a simple airfoil.
3.3.3 3D Design
Multi-row CFD was used to assess the flow field and turbine performance with the optimized
profiles. An evaluation of the CFD capability to predict losses due to incidence effects was made
using the cascade geometry from Reference 3 and data set from Reference 2. This data provided
confidence that the CFD results would be representative for GE’s unique advanced airfoil design.
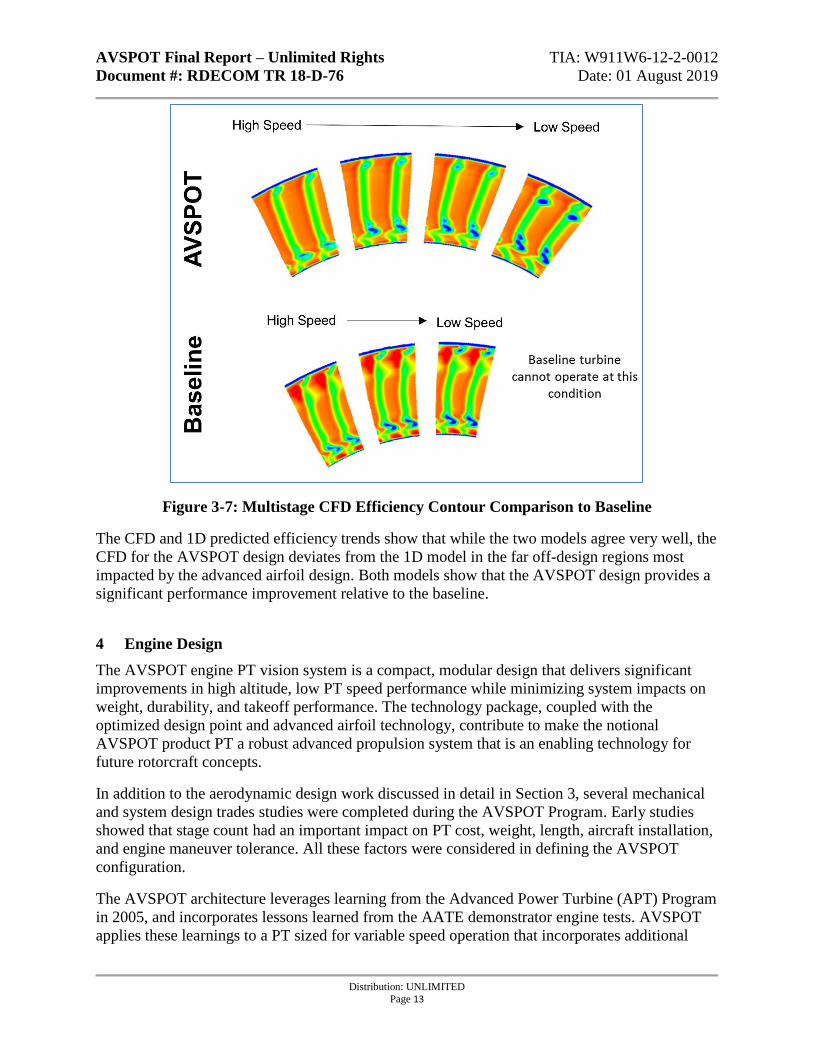
The AVSPOT multi-row model domain total grid count for the model was 55 million cells, and
the domain inlet boundary conditions of total temperature, total pressure, swirl, and turbulence
intensity are radial profiles taken from the exit of the HPT model used for the baseline turbine
design. Model solutions were obtained at several operating conditions, and the AVSPOT
efficiency contours are compared to the baseline design at several speeds in Figure 3-7. The red
and orange shades indicate high efficiency, and the green and blue indicate flow has more loss.
AVSPOT Final Report – Unlimited Rights TIA: W911W6-12-2-0012
Document #: RDECOM TR 18-D-76 Date: 01 August 2019
Distribution: UNLIMITED
Page 13
Figure 3-7: Multistage CFD Efficiency Contour Comparison to Baseline
The CFD and 1D predicted efficiency trends show that while the two models agree very well, the
CFD for the AVSPOT design deviates from the 1D model in the far off-design regions most
impacted by the advanced airfoil design. Both models show that the AVSPOT design provides a
significant performance improvement relative to the baseline.
4 Engine Design
The AVSPOT engine PT vision system is a compact, modular design that delivers significant
improvements in high altitude, low PT speed performance while minimizing system impacts on
weight, durability, and takeoff performance. The technology package, coupled with the
optimized design point and advanced airfoil technology, contribute to make the notional
AVSPOT product PT a robust advanced propulsion system that is an enabling technology for
future rotorcraft concepts.
In addition to the aerodynamic design work discussed in detail in Section 3, several mechanical
and system design trades studies were completed during the AVSPOT Program. Early studies
showed that stage count had an important impact on PT cost, weight, length, aircraft installation,
and engine maneuver tolerance. All these factors were considered in defining the AVSPOT
configuration.
The AVSPOT architecture leverages learning from the Advanced Power Turbine (APT) Program
in 2005, and incorporates lessons learned from the AATE demonstrator engine tests. AVSPOT
applies these learnings to a PT sized for variable speed operation that incorporates additional
AVSPOT Final Report – Unlimited Rights TIA: W911W6-12-2-0012
Document #: RDECOM TR 18-D-76 Date: 01 August 2019
Distribution: UNLIMITED
Page 14
advanced materials and manufacturing processes to minimize weight and improve both
performance and durability.
This section details the engine system and mechanical implementation of the final aerodynamic
design in a notional engine environment, and demonstrates how the configuration balances
performance, cost, weight, and engine complexity while meeting all durability and dynamics
requirements. While the configuration of this notional product PT design was explored under
AVSPOT, none of the technologies identified in this notional design, aside from the
aerodynamic design of the turbine airfoils, was completed directly under the AVSPOT program.
4.1 Cycle Design
To provide boundary conditions relevant to an FVL application, GE generated the cycle
conditions used in the AVSPOT design from its state of the art demonstrator programs. The
AVSPOT cycle incorporates several features specifically focused on variable speed PT platform
performance to ensure the design has product relevance. The final AVSPOT ADP SHP,
operating condition, and speed is sized specifically for FVL applications that GE identified with
industry members.
One major point of focus was the selection of the physical RPM range of operation. The final
speed selection strategy is consistent with a design optimized for wide speed range operation.
When operating at CRP, MRP, and IRP the engine is assumed to run at 105% PT speed.
Operation at these power settings will likely occur for takeoff/hover type maneuvers that need a
high main rotor speed for lift. For MCP and lower power conditions, the PT speed is set at a
realistically conservative upper bound on PT speed for cruise. The incorporation of the
conservative cruise speed assumption in the durability assessments lets the overall speed range to
be set at an appropriate physical RPM while still delivering a light weight, durable mechanical
solution.
All mechanical assessments of the product design utilized a “lifing cycle” that includes data at
key points in the durability missions. It is also run as a 2/3rd deteriorated engine with field
margin and production margin included, ensuring all life results are generated at representative
temperatures for a product application.
4.2 Component Design
4.2.1 Airfoils
AVSPOT consists of blades and vanes that balance the performance, creep/rupture, low cycle
fatigue (LCF) and aeromechanic requirements. The airfoils incorporate proven materials to
improve upon conventional, fielded turbine airfoil technology and achieve US Army goals. The
trailing edges on all stages are designed to minimize flowpath blockage, improving stage
efficiency.
The PT blades are made from materials used in other current production engines combined with
successfully manufacturing approaches to deliver a robust product. One of the challenges of the
AVSPOT designs is increased weight and chord length of some airfoils. The increase in low-
speed performance makes this weight trade acceptable, and future advances in advanced casting
AVSPOT Final Report – Unlimited Rights TIA: W911W6-12-2-0012
Document #: RDECOM TR 18-D-76 Date: 01 August 2019
Distribution: UNLIMITED
Page 15
technologies will eventually lead to approaches that can minimize the weight penalty of the
advanced designs.
4.2.2 Rotor Structure
The PT disks are sized to deliver a lightweight and highly capable design. The PT disks are
generally sized by burst with consideration for LCF at bolt holes and air holes and dovetail creep
capability. The chosen material offers the highest ultimate tensile strength for materials that meet
the other requirements and therefore is the lightest weight solution. The rotor meets all US Army
burst and durability goals. The PT blade retainers are designed not only to locate the blades, but
also to meter the flow through the system and control cavity purge temperatures.
The PT shaft interfaces with the output drive assembly and is optimized to limit PT dynamic
clearance closures throughout the operating range for maximum performance. The PT shaft is
also sized to meet the US Army max torque goals. The shaft thickness is set to deliver the torque
and tune the PT bending critical speed so that it falls outside of the operating range.
4.2.3 Static Structure
The AVSPOT architecture optimizes bearing and frame placements to enables a simple, light-
weight flowpath transition between the GGT and PT. The stator utilizes targeted cooling flow,
advanced materials, and cutting-edge manufacturing processes to deliver a light weight, high
performing and durable configuration. The case is sized for containment and buckling and
provides anti-rotation features for the shrouds and vanes. The duct material selection allows for
the implementation of a design that reduces weight, improves durability, and creates a clean,
simple aerodynamic flowpath between the GGT and PT. The frame and sump are designed to
reduce part count, weight, and leakage while delivering the required system stiffness. The frame
supports the bearing structure and the PT speed sensor and provides rotor cooling flow and sump
oil services through the hollow struts.
4.2.4 Advanced Material Technology
Additive manufacturing is an enabling technology for the AVSPOT stator. Additive
manufacturing enables light weight designs by eliminating manufacturing constraints of
traditional casting and machining methods, and by allowing advanced system designs that
replace traditional multiple part assemblies. Additive manufacturing allows the minimum
thickness of non-load bearing walls on structural components to be reduced compared to
traditional sand or investment casting processes. Further, since it eliminates casting cores,
additive manufacturing allows for the design of the more complex internal passages that can
reduce overall part weight without incurring additional cost. Multi-part assemblies can be
combined into one additively manufactured part, eliminating the fasteners and reducing interface
wall thicknesses. Additive manufacturing also enables production of optimized weight reduction
features, including scallops, without the cost and cycle time of final machining operations.
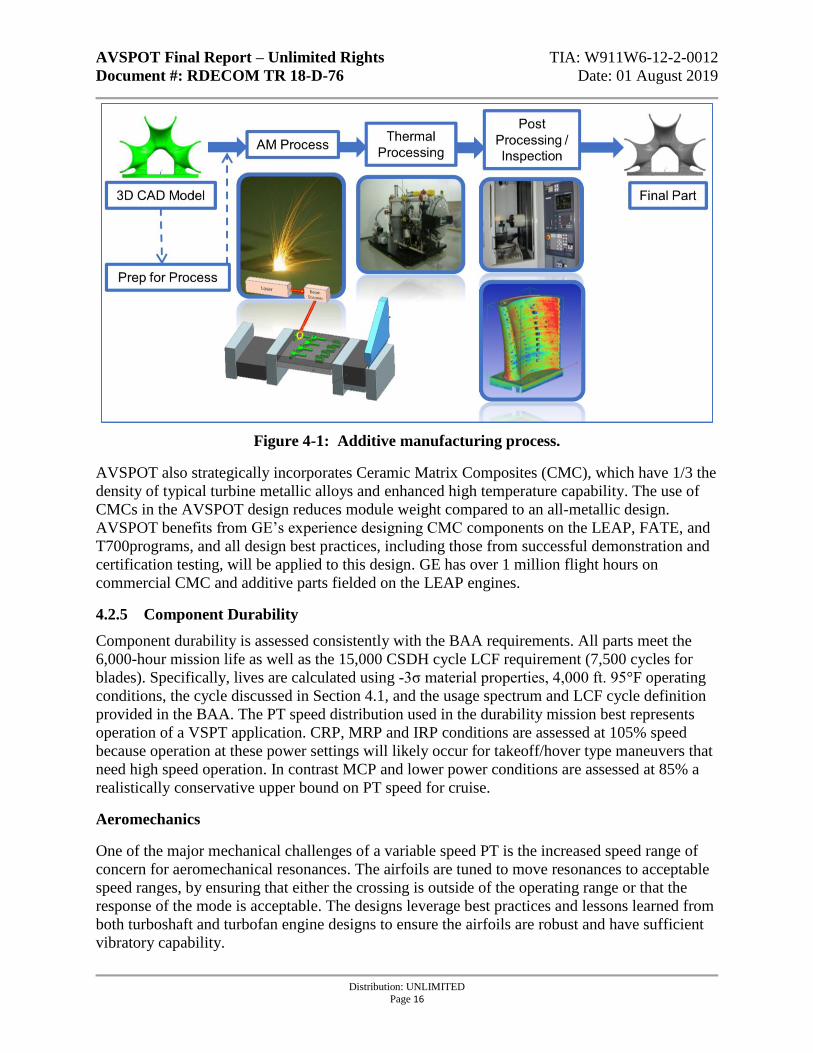
GE uses the Direct Metal Laser Melting (DMLM) additive manufacturing process in production
on the commercially certified turbofan LEAP engine fuel nozzle. The process used to
manufacture the AVSPOT hardware, shown in Figure 4-1, is the same as the LEAP production
process.
AVSPOT Final Report – Unlimited Rights TIA: W911W6-12-2-0012
Document #: RDECOM TR 18-D-76 Date: 01 August 2019
Distribution: UNLIMITED
Page 16
Figure 4-1: Additive manufacturing process.
AVSPOT also strategically incorporates Ceramic Matrix Composites (CMC), which have 1/3 the
density of typical turbine metallic alloys and enhanced high temperature capability. The use of
CMCs in the AVSPOT design reduces module weight compared to an all-metallic design.
AVSPOT benefits from GE’s experience designing CMC components on the LEAP, FATE, and
T700programs, and all design best practices, including those from successful demonstration and
certification testing, will be applied to this design. GE has over 1 million flight hours on
commercial CMC and additive parts fielded on the LEAP engines.
4.2.5 Component Durability
Component durability is assessed consistently with the BAA requirements. All parts meet the
6,000-hour mission life as well as the 15,000 CSDH cycle LCF requirement (7,500 cycles for
blades). Specifically, lives are calculated using -3σ material properties, 4,000 ft. 95°F operating
conditions, the cycle discussed in Section 4.1, and the usage spectrum and LCF cycle definition
provided in the BAA. The PT speed distribution used in the durability mission best represents
operation of a VSPT application. CRP, MRP and IRP conditions are assessed at 105% speed
because operation at these power settings will likely occur for takeoff/hover type maneuvers that
need high speed operation. In contrast MCP and lower power conditions are assessed at 85% a
realistically conservative upper bound on PT speed for cruise.
Aeromechanics
One of the major mechanical challenges of a variable speed PT is the increased speed range of
concern for aeromechanical resonances. The airfoils are tuned to move resonances to acceptable
speed ranges, by ensuring that either the crossing is outside of the operating range or that the
response of the mode is acceptable. The designs leverage best practices and lessons learned from
both turboshaft and turbofan engine designs to ensure the airfoils are robust and have sufficient
vibratory capability.
AVSPOT Final Report – Unlimited Rights TIA: W911W6-12-2-0012
Document #: RDECOM TR 18-D-76 Date: 01 August 2019
Distribution: UNLIMITED
Page 17
Airfoil Stress and Life
A stress and life assessment was completed on the critical airfoil and rotating components of the
AVSPOT product, and all parts meet the BAA goals. The airfoils and rotor were selected for
these assessments as they are typically the limiting components in PT durability.
Blade bulk creep life fraction used (LFU) results are tabulated for 5 airfoil span locations at each
point in the BAA specified lifting mission. Creep is typically the limiting failure mode for PT
blades, and assessments show that the blades meet requirements as stated in the BAA. 1D stress
models and accompanying LCF assessments were also completed for each blade, and the life
results all meet BAA goals.
The vanes were also assessed for durability. Due to the complexity of analyzing PT vanes, which
have boundary conditions that are highly dependent on system architecture details, durability
assessments. These conservative assessments show that the vanes are capable of meeting BAA
life goals. Again, boundary conditions were not optimized for the AVSPOT-specific cycle and
configuration, and since the vane bands are very sensitive to small changes, an AVSPOT product
would be optimized to meet durability requirements using more refined analysis.
Rotor Sizing
The disks are sized to match the bulk average and maximum unconcentrated stresses of a
baseline design that meets all durability goals in the BAA. The AVSPOT product would have
similar rotor bulk temperatures and uses the same materials as this baseline, and the architecture
and stress concentrations are similar between the two designs. Using this sizing approach, the
AVSPOT design will maintain similar LCF, overspeed, and burst capability as the baseline
design. Sizing the AVSPOT rotors to match maximum unconcentrated and disk average stress of
a configuration that meets the applicable durability requirements reduces risk of durability
shortfalls.
4.3 System Design
Several system level design studies were also completed as part of the product design. In
addition to the dynamics, clearances and weight studies detailed below, consideration was given
to the control system required for variable speed operation.
Since future vertical lift aircraft require significant improvement in vertical lift, range, speed,
payload, survivability, and reliability, they must be able to seamlessly utilize the AVSPOT-
provided capabilities. To maximize the impact of an efficient variable speed PT, it must be
coupled with variable main rotor speed (NR) control system capabilities. With variable NR
controls, future vertical lift aircraft will be able to set NR through the PT speed to any level
between 55% and 105% to optimize the specified leg of the mission flown. High speed
operation, increased range and increased endurance may require low speed PT operation, while
mission legs requiring high maneuverability and increased hover payload may require high speed
PT operation. Variable NR control was studied as part of the RAEICS Program, which GE
conducted in collaboration with ADD.
Dynamics
AVSPOT Final Report – Unlimited Rights TIA: W911W6-12-2-0012
Document #: RDECOM TR 18-D-76 Date: 01 August 2019
Distribution: UNLIMITED
Page 18
A baseline dynamics model was modified to capture the AVSPOT geometry and predict PT
critical speeds. The model is used to predict critical speeds, imbalance, maneuver, and blade-out
loads and clearance closures, inter-shaft clearances, and external excitation/vehicle induced
vibration responses. Model outputs from a variety of these loading cases serve as boundary
conditions for the mechanical design of the frames, sumps, bearings, carcass bolted joints, and
rotor structural flanges to ensure capability to requirements.
The AVSPOT rotor system dynamic response is acceptable throughout the entire speed range.
The PT Shaft 1st bending mode frequency is optimized to avoid the 55% speed operating point.
In addition to critical speed assessments, the response of the system under maneuver loading was
assessed. The maneuver closures are more severe for AVSPOT compared to a conventional PT,
as expected given the increased weight and inertia of the AVSPOT rotor. However, the bearing
and PT shaft stiffness can be optimized to reduce these deflections and the clearances can be
sized to ensure the performance impact of a maneuver is the same or better than a conventional
PT.
Clearances
One of the challenges inherent in variable speed PT operation is the increased tip clearances
associated with low speed operation. Tip clearances are typically sized to achieve optimal
performance at the aerodynamic design point. In a conventional engine the PT mechanical
deflections are fixed, and the tip clearance is a function of the thermal environment of the
turbine. However, in a VSPT application the speed of the PT is varied independent of the turbine
inlet temperature, creating conditions where the stator thermal deflections are near their
maximum and the rotor mechanical deflections are significantly reduced. This mechanical
deflection reduction correlates directly with clearance increase, which negatively impacts
performance.
Blade tip clearances have a strong impact on the performance of the PT. Increased clearances
allow more bypass flow around the blade tips, which also introduces a mixing loss when it re-
enters the flowpath downstream of the seal. A robust product design must consider and address
this clearance challenge.
Weight
The AVSPOT design adds a modest amount of weight compared to a conventional design,
driven mainly by the airfoils, which are thicker and have a longer chord than those in a single
speed PT. Because of this, several other engine components have an increased weight to
accommodate the new flowpath and to meet product durability requirements with more airfoil
weight. To mitigate this, a number of weight reductions are incorporated into the AVSPOT
design, and several future technologies could further reduce product weight, but they are not
included in the current study. Technology trades of weight vs. risk would be a major part of a
follow-on engine program.
AVSPOT Final Report – Unlimited Rights TIA: W911W6-12-2-0012
Document #: RDECOM TR 18-D-76 Date: 01 August 2019
Distribution: UNLIMITED
Page 19
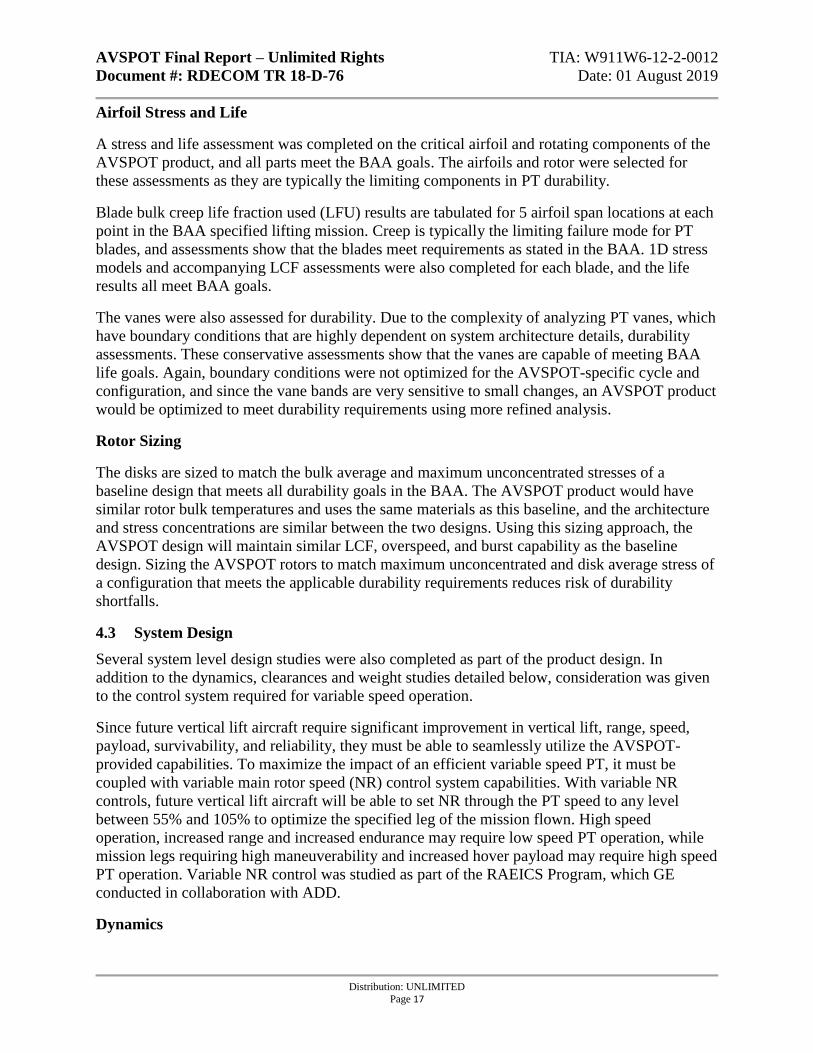
5 Rig Design and Predictions
The AVSPOT rig is a full scale aero rig designed to demonstrate variable speed PT capability for
future rotorcraft propulsion applications. The warm air rig is aerodynamically equivalent to the
engine design presented in Section 3. The rig design enables a single-build test to effectively
quantify performance across a matrix of speeds, pressure ratios, clearances, Reynolds numbers,
and purge flows, with minimal configuration changes on the associated instrumentation package
between air periods. The overall test vehicle borrows heavily from the APT and FATE GGT rig
set ups, including the skid, frames, and water brake. Figure 5-1 shows the full rig assembly
model.
Figure 5-1: Rig Test Vehicle
5.1 Rig Mechanical Design
The AVSPOT rig architecture leverages the successful APT design, but incorporates targeted
changes to improve producibility, control costs, and ultimately deliver higher quality test results.
One improvement is the use of “engine-like” rotors, which provide more realistic purge flow
interactions by preserving real features. Other improvements include an integral shroud and
exhaust case to allow for clearance probes. In addition to leveraging the basic architecture of
APT, AVSPOT also reused some of the as-run APT hardware.
The expansive speed and pressure ratio ranges of the AVSPOT map require some points to be
tested at higher inlet temperatures. The higher inlet temperature allows a higher physical speed to
be used to capture an equivalent corrected speed and helps keep the test points within the
allowable water brake load map. However, this inlet temperature change adds complexity to the
mechanical design of the rig hardware. Certain criteria are now limited by different points based
on the speed/temperature combinations. To account for this, 4 unique conditions were assessed,
allowing the full design space to be evaluated and ensuring safe operation at all points.
AVSPOT Final Report – Unlimited Rights TIA: W911W6-12-2-0012
Document #: RDECOM TR 18-D-76 Date: 01 August 2019
Distribution: UNLIMITED
Page 20
The major requirements imposed on the rig mechanical design were derived from GE’s
component test design practice and have proven effective for recent successful test campaigns on
similar commercial programs. To ensure safe operation, robust analysis methods were applied to
the rig design. The compliance approaches employed on the AVSPOT program were consistent
with GE’s rig design best practices.
5.2 Rig Pre-Test Predictions
A series of pretest measurements and inspections were completed to accurately capture the
pedigree and geometry of the as-tested hardware.
Dynamics
Rotor balance was completed using the same balance machine and software used for production
rotors. The final imbalances are well within the 1 gr-in limit specified on the rotor assembly
drawing and had no impact on the predicted dynamic response of the vehicle.
Clearances and flows
Cold build clearances were measured and compared to nominal to calculate an associated hot
running clearance change at ADP. The deviations from nominal are captured in the pre-test
prediction and verified on test via clearanceometers on one stage. No direct measurements were
taken on the lab seal clearances, and therefore there was no change to the predicted secondary
flows in the rig.
Aerodynamics
Prior to executing the rig, a pre-test prediction was completed to assess the efficiency and flow
function for where the rig was expected to run. This analysis includes losses due instrumentation,
flowpath geometry features not accounted for in the 1D model, and manufacturing variation that
deviates from the hardware design intent. The efficiency walk was discussed at the test readiness
review (TRR).
The starting prediction is a model updated from engine conditions to rig conditions (inlet
conditions, purge flows and temperatures, fuel to air ratio, etc.). The stack from initial rig model
to predicted rig conditions yields an expected rig efficiency that can be compared to actual test
results. The flow function was also evaluated pre-test and shown at the customer TRR.
6 Rig Test
The AVSPOT PT aero rig test successfully achieved all main objectives:
✓ Understand key performance derivatives, including Reynolds Number, purge flows,
and tip clearances
✓ Measure performance trends of PT vs. speed at multiple PRs to produce PT map and
validate analytical trends. ✓ Measure airfoil static pressures to validate airfoil design and analytical tools. ✓ Flow visualization ✓ Determine the efficiency of the PT at the ADP and other key rating points
AVSPOT Final Report – Unlimited Rights TIA: W911W6-12-2-0012
Document #: RDECOM TR 18-D-76 Date: 01 August 2019
Distribution: UNLIMITED
Page 21
✓ Identify opportunities for refinement for future engine applications.
This testing was performed on an aerodynamically equivalent, full scale turbine rig and was
conducted in Notre Dame Turbomachinery Laboratory (NDTL) Test cell number 0400. GE
generated the assembly and instrumentation drawings, and GE Aviation Lynn shipped the fully
assembled and instrumented rig to NDTL. The NDTL test team assembled plugs, terminated
instrumentation leads, and conducted the test procedure with engineering support. The testing
was to be completed in 12 air periods, 2 of which were for mechanical checkout.
6.1 Set-up
To ensure a successful test campaign, the AVSPOT rig leveraged all relevant lessons learned
from GE’s extensive recent rig test experience. The rig was tested at Notre Dame
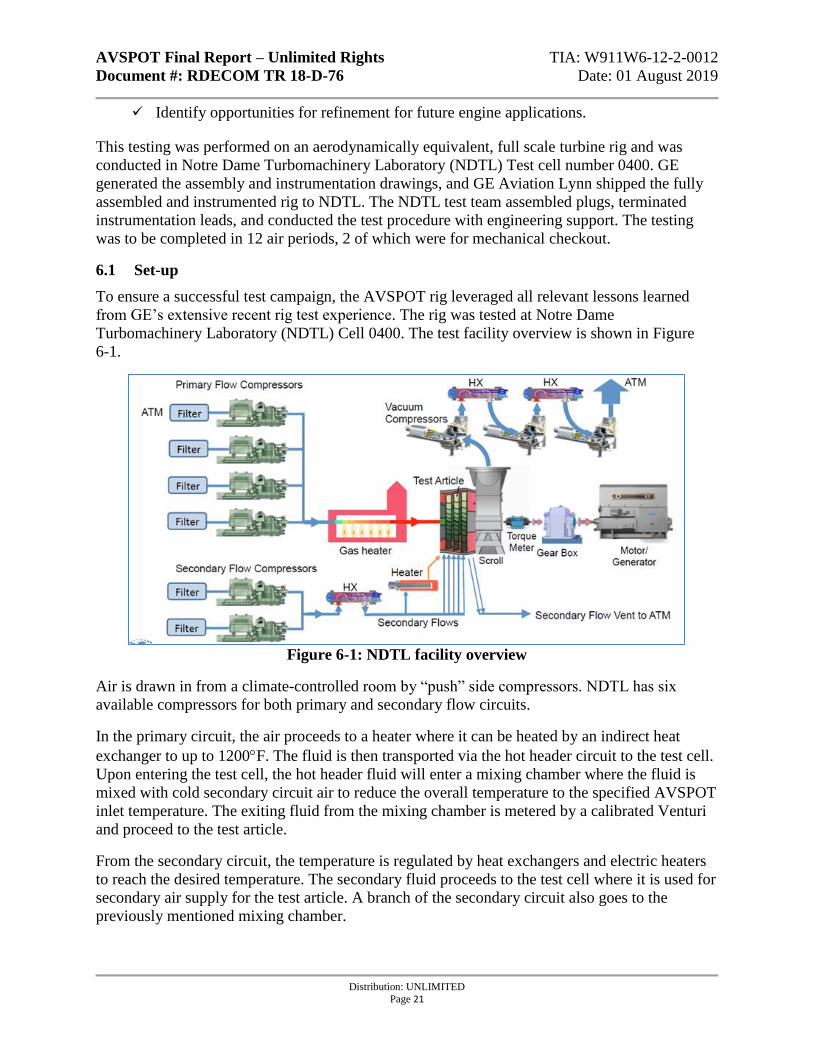
Turbomachinery Laboratory (NDTL) Cell 0400. The test facility overview is shown in Figure
6-1.
Figure 6-1: NDTL facility overview
Air is drawn in from a climate-controlled room by “push” side compressors. NDTL has six
available compressors for both primary and secondary flow circuits.
In the primary circuit, the air proceeds to a heater where it can be heated by an indirect heat
exchanger to up to 1200F. The fluid is then transported via the hot header circuit to the test cell.
Upon entering the test cell, the hot header fluid will enter a mixing chamber where the fluid is
mixed with cold secondary circuit air to reduce the overall temperature to the specified AVSPOT
inlet temperature. The exiting fluid from the mixing chamber is metered by a calibrated Venturi
and proceed to the test article.
From the secondary circuit, the temperature is regulated by heat exchangers and electric heaters
to reach the desired temperature. The secondary fluid proceeds to the test cell where it is used for
secondary air supply for the test article. A branch of the secondary circuit also goes to the
previously mentioned mixing chamber.
AVSPOT Final Report – Unlimited Rights TIA: W911W6-12-2-0012
Document #: RDECOM TR 18-D-76 Date: 01 August 2019
Distribution: UNLIMITED
Page 22
After passing through the test article, the fluid is collected in a collector scroll before going to the
pull side compressors. Three pull compressors are arranged in series. Upon exiting the third
compressor, the fluid is ejected to the atmosphere.
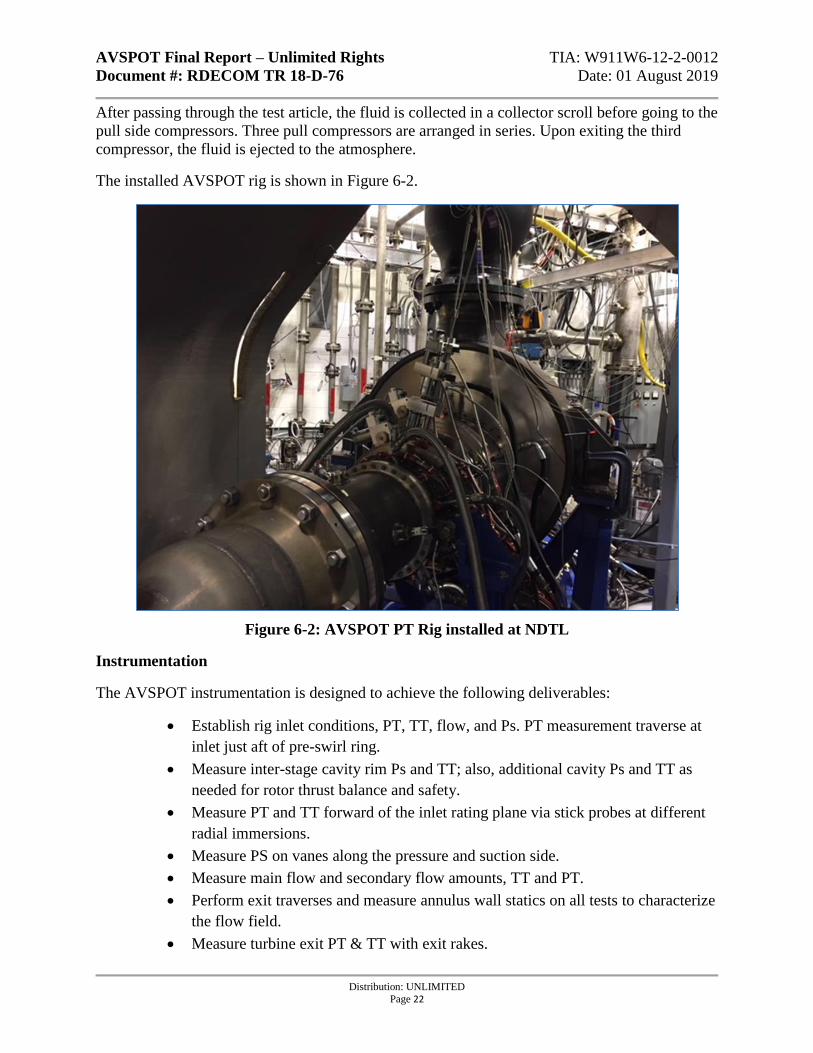
The installed AVSPOT rig is shown in Figure 6-2.
Figure 6-2: AVSPOT PT Rig installed at NDTL
Instrumentation
The AVSPOT instrumentation is designed to achieve the following deliverables:
• Establish rig inlet conditions, PT, TT, flow, and Ps. PT measurement traverse at
inlet just aft of pre-swirl ring.
• Measure inter-stage cavity rim Ps and TT; also, additional cavity Ps and TT as
needed for rotor thrust balance and safety.
• Measure PT and TT forward of the inlet rating plane via stick probes at different
radial immersions.
• Measure PS on vanes along the pressure and suction side.
• Measure main flow and secondary flow amounts, TT and PT.
• Perform exit traverses and measure annulus wall statics on all tests to characterize
the flow field.
• Measure turbine exit PT & TT with exit rakes.
AVSPOT Final Report – Unlimited Rights TIA: W911W6-12-2-0012
Document #: RDECOM TR 18-D-76 Date: 01 August 2019
Distribution: UNLIMITED
Page 23
• Measure clearances at one stage.
• Measure torque and RPM.
• Measure static pressures on the hub and case of the flowpath.
Planned Test Procedure
In general, the test procedure was developed to balance technical risk and prioritize key data
collection early in testing. Initial testing will be completed at the nominal inlet temperatures to
ensure successful data collection early in testing. Key turbine performance data is prioritized
over derivative testing to ensure a minimum viable data set is collected as early in testing as
possible.
6.2 Test Operations
The test team consisted of a minimum of eight people to staff each of the test stations. The eight
stations were:
• Test Director – issues the test commands by directing each test personnel of their
required actions to bring the test article to operating point as defined by the test matrix.
The test commands are standardized so that there is no confusion in the intent of the
command. For example, the commands include, but are not limited to: return to idle,
back-off, hold, and stop. The director is also responsible for all personnel, test article, and
lab safety.
• Pilot – commands all the test cell and test article related valves at the direction of the test
director.
• Air Plant Operator – commands all air plant related valves at the direction of the test
director.
• Water Brake Operator – controls the water brake as needed. The operator will alert the
test director of any unsafe limits as they are neared.
• Mechanical Drive Train Monitor – monitors the mechanical drive train related variables.
This monitor is responsible for ensure adequate oil flow and temperatures are being
provided to the test article and water brake bearings. The monitor will ensure that
sufficient oil scavenge levels are being attained to avoid an oversupply of oil.
• Low Speed Data Acquisition System Operator – acquires low frequency data at the
direction of the test director and aerodynamics monitor. The operator is also responsible
for operating the traverse system.
• High Speed Data Acquisition System Operator – acquires high frequency data at the
direction of the test director and aerodynamics monitor. The operator will monitor
vibrations and relay critical “no-spin” zones to the test director.
• Aerodynamics Monitor – monitors the aerodynamic operating points. The aerodynamics
monitor will identify when the desired operating point has been achieved and when to
acquire data.
Log Files
AVSPOT Final Report – Unlimited Rights TIA: W911W6-12-2-0012
Document #: RDECOM TR 18-D-76 Date: 01 August 2019
Distribution: UNLIMITED
Page 24
Log files were created for documentation. Logs were maintained during all phases of testing
(before, during, and after). The log files are detailed and archived in such a way to assist in
future discussions of any AVSPOT related testing. Main log files include:
• Change Log: Configuration changes were logged using a change log. Logged changes
include any changes to the rig configuration not controlled by the drawing specification.
This includes all instrumentation, facility, test article, and data acquisition system related
changes. Logs were maintained and updated on a regular basis to ensure accurateness.
• Test Log: A daily test log was also kept. Test logs detailed date, time, data description,
file name, reading number, and transient type. The rig rotation start and end times were
also recorded on the same document. The test logs are also used for instrumentation fault
tracking in the comments section. Upon a note being made, the GE/NDTL team will
determine if that fault is a “fix immediately,” “fix before next run,” or “fix when able”
based on criticality to safety, performance, and availability of redundant measurements.
• IOI: A daily Items of Interest (IOI) was documented by NDTL and distributed by the GE
Test Focal.
Data Processing and Handling
A sequence of test data processing and handling occurs from the time the data is physically
measured at the test article. Those physical measurements are converted to an analog or digital
signal as appropriate by a transducer. Any analog measurement is eventually converted to a
digital signal. A data acquisition system is used to collect the data. NDTL used Safran Test Cells
Cyres software for low frequency and Apex for high frequency data acquisition.
6.3 Summary of Completed Testing
The AVSPOT test campaign began with first roll over on March 27, 2018. All required testing
was completed on May 17, 2018. The test campaign included first roll-over session, two
mechanical check-out sessions, and a combined total of 10 air periods. The 10 air periods
included 9 full day air periods and 2 half day air periods.
The run summary of the rig is shown below:
• Total AVSPOT Bearing Time: 125 hours 54 minutes
• Total AVSPOT Air Plant Time: 174.5 hours
• Total Rig Starts: 21
• Maximum Speed Range Cleared: 105%
The main test objectives were accomplished as shown below:
AVSPOT Final Report – Unlimited Rights TIA: W911W6-12-2-0012
Document #: RDECOM TR 18-D-76 Date: 01 August 2019
Distribution: UNLIMITED
Page 25
✓ System safety integration prove out - COMPLETE
✓ Mechanical check out - COMPLETE
✓ Initial performance data collection - COMPLETE
✓ Spec point traverses - COMPLETE
✓ Exit Traverses - COMPLETE
✓ Reynolds effect map - COMPLETE
✓ Mapping - COMPLETE
✓ Purge flow and clearance derivatives - COMPLETE
✓ High T_in points - COMPLETE
o ADDED: High P_in points - LIMITED BASED ON RIG/CELL CAPABILITY
✓ Flow Visualization - COMPLETE
Due to facility, water brake, and personnel availability limitations, the executed rig test plan
migrated from the planned testing procedure discussed at TRR. The inlet condition
characterization and aero design point data was collected followed by the altitude map points as
intended. Due to personnel availability, some exit traverses could not be completed as early as
planned and they were moved later in the testing schedule. The purge and tip clearance
derivative testing moved forward due to the low risk and ease of completion. The heated
conditions for the low speed points remained at the end. All the key points and most of the map
points were collected, resulting in a successful rig test campaign.
Test Lessons Learned
While testing was completed smoothly and overall successful in hitting all key objectives, a
number of issues were identified throughout the course of the test campaign. The issues were
addressed at the time of occurrence to mitigate risk and impact, allowing the team to proceed to
close out the test campaign. As such, all required data and objectives were met.
Some of the issues that were discovered during the test campaign include:
• Vacuum Capability
• Minimum exhaust pressure was higher than expected from analysis at rig
exit. It was determined that losses were mainly in the rig scroll due to an
oversimplified analysis of the exit conditions. Including deswirlers may
have helped in static pressure recovery to help reduce losses through the
rig collector scroll.
• Inlet Pressure
• Cold and hot header mixing chamber introduced losses that capped inlet
pressure. The mixing chamber was required to reach the desired inlet
temperature condition. Using the hot header only was not possible because
the heater in the hot header circuit could not deliver a stable temperature at
the required AVSPOT mass flow rate. As a result, the hot header heater
output a higher temperature fluid. That warmer fluid was then mixed with
the cold header fluid in the mixing chamber to achieve the desired
AVSPOT inlet temperature.
• A maximum inlet pressure of the mixed flow would have been sufficient
for the original test plan. However, with the discovered vacuum capability
issue that resulted in a fixed, obtainable minimum back pressure,
AVSPOT Final Report – Unlimited Rights TIA: W911W6-12-2-0012
Document #: RDECOM TR 18-D-76 Date: 01 August 2019
Distribution: UNLIMITED
Page 26
AVSPOT was not able to achieve some ratio operating points. Therefore,
raising the inlet pressure would have assisted in getting closer to those
operating points.
• A modification to reduce the pressure loss through the mixing chamber
was implemented obtain a higher inlet pressure but running at the elevated
inlet pressure resulted in other limits being hit.
• With all modifications and safe limits in place, all mapped speed lines
included a number of points sufficient to generate a full map.
As the issues were discovered, the test team addressed them as required. Required lessons
learned were documented and shared across GE and NDTL.
7 Rig Test Results
7.1 Key Mechanical Results
Dynamics
During mechanical check out, a GE rotor dynamics engineer was on site to verify high-speed
data acquisition setup and to monitor dynamics instrumentation consisting of 18 accelerometers,
3 DC clearanceometers, and 4 proximity probes. During the mechanical checkout period, rig
demonstrated stable operation well within limits at all test speeds up to 105%. The rig traversed
sub-idle rotor critical with less than 0.2 ips peak vibration on all vibes and less than 0.5 mils peak
1/rev closure on the clearance probes, indicative of a well-balanced and straight rotor assembly.
Maximum vibratory response was 0.5 ips peak at forward cartridge bearing vertical plane
accelerometer at the 105% speed point. Following mechanical checkouts, a daily health check
data recording was transferred for offsite review by GE rotor dynamics; the dynamic behavior of
the rig did not substantially change at any point during testing, and all instrumentation remained
well within limits through test completion.
Clearances
The blade tip clearances were monitored during test using clearance probes. A clearance model
that makes an estimate of the blade tip clearances based on the test condition and rig
instrumentation readings was developed to validate the clearance probe readings. The variables
in the clearance model include cold clearance, rotor speed, inlet and exit temperature, case metal
temperature, and purge flow temperature. The blade and disk metal temperatures are calculated
using thermal effectiveness scaling from the inlet and exit temperatures. The model and
clearance probe matched pre-test predictions at all operating points.
Leak Check
A leak check was performed prior to testing the rig in order to identify the location and size of
leaks in the rig to determine the impact to the overall flow rate and efficiency. The rig was
sprayed with soap and inspected the formation of bubbles or jets. Leaks that were present were
then sealed as effectively as possible using RTV prior to testing. The leak check and sealing
process was repeated several times to confirm mitigation of the leaks. A final step was to
quantify the total remaining leakage magnitude using an effective area calculation. The leakage
AVSPOT Final Report – Unlimited Rights TIA: W911W6-12-2-0012
Document #: RDECOM TR 18-D-76 Date: 01 August 2019
Distribution: UNLIMITED
Page 27
was found to be small and therefore the rig flow measured did not require a flow measurement
correction and there was no impact to flow function or efficiency measurements.
7.2 Aerodynamic Data Summary
The AVSPOT turbine rig ran successfully over the course of 2 months at NDTL. The overall
speed lapse results show an improvement at low speeds over a traditional baseline turbine
design. Several data sets were collected during the rig test campaign to support this result. The
following sections show that the vehicle performed consistently and as intended over the course
of the 2 months. ADP inlet conditions were as expected, the results of collecting the same point
over the course of 2 months was repeatable, and the exit conditions were as expected for both
ADP and the key off design speed conditions. The map results trends were similar to
expectations, but showed a wider range of performance than predicted at off design conditions.
Finally, the collection and understanding of the key derivatives were critical in order to generate
a physically correct and consistent map.
Single Speed Line Lapse
The key outcome from the AVSPOT test data was quantifying the performance impact of the
advanced airfoils. Test results exhibited an improved lapse rate with speed compared to the
baseline turbine. The baseline results were measured in a PT rig that was tested with a similar
set-up and instrumentation package. It was designed for peak efficiency at its respective design
point at its 100% speed. As with most traditional designs, the performance starts to decrease as
the turbine migrates off-design and speed is reduced. The AVSPOT design optimization traded a
relatively lower efficiency at the 100% speed point to improve performance at off-design, lower
speed conditions. This fundamental design philosophy, trading peak efficiency at a single design
point for improved off-design performance by setting ADP at a part-speed condition was
validated by the test data.
Figure 7-1 below shows the tested AVSPOT efficiency lapse as a function of speed. The test data
validates the efficiency improvement of the AVSPOT configuration at low speed. Traverse data
collected at the last stage blade exit is also shown at three key speeds, demonstrating the type of
detailed flowfield data gathered during the rig test campaign. This data provides high-fidelity
understanding of the flow field at the far off-design operating conditions and will be covered more
in depth in Section 7.3.3. The data shown in Figure 7-1 is a comparison of as measured rig data
for 2 rigs corrected to a common point and is therefore not directly comparable to the AVSPOT
pre-test prediction or engine condition program goals.
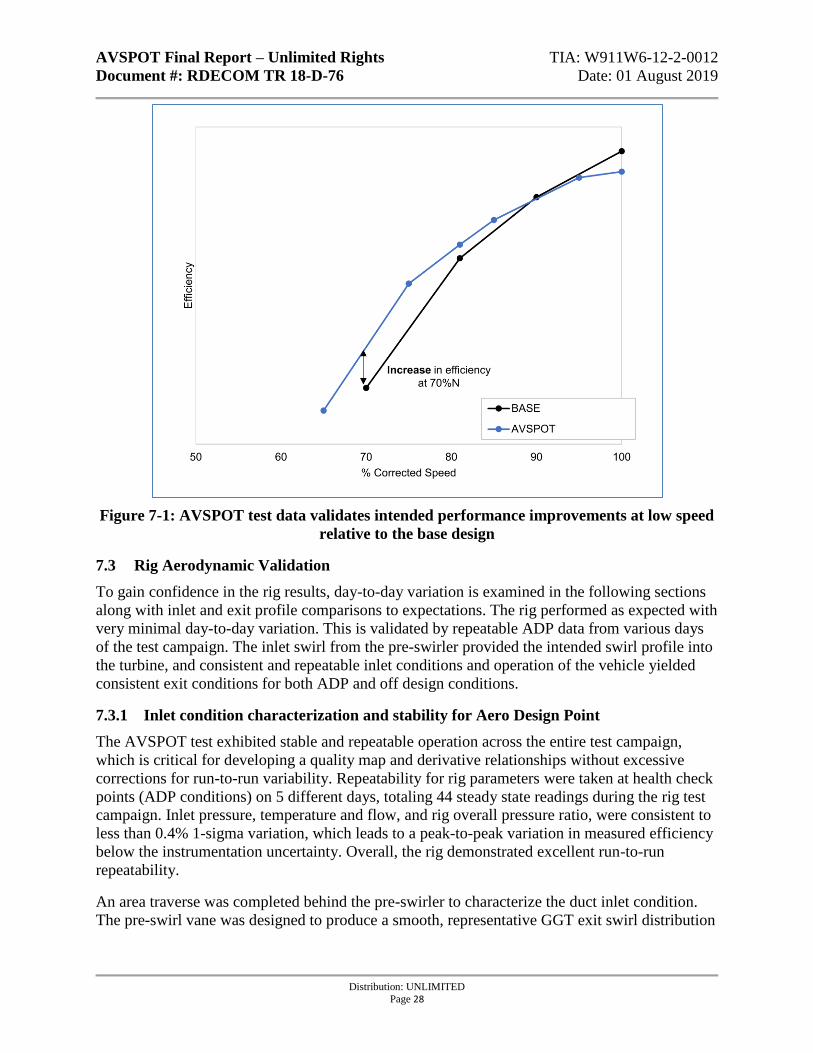
AVSPOT Final Report – Unlimited Rights TIA: W911W6-12-2-0012
Document #: RDECOM TR 18-D-76 Date: 01 August 2019
Distribution: UNLIMITED
Page 28
Figure 7-1: AVSPOT test data validates intended performance improvements at low speed
relative to the base design
7.3 Rig Aerodynamic Validation
To gain confidence in the rig results, day-to-day variation is examined in the following sections
along with inlet and exit profile comparisons to expectations. The rig performed as expected with
very minimal day-to-day variation. This is validated by repeatable ADP data from various days
of the test campaign. The inlet swirl from the pre-swirler provided the intended swirl profile into
the turbine, and consistent and repeatable inlet conditions and operation of the vehicle yielded
consistent exit conditions for both ADP and off design conditions.
7.3.1 Inlet condition characterization and stability for Aero Design Point
The AVSPOT test exhibited stable and repeatable operation across the entire test campaign,
which is critical for developing a quality map and derivative relationships without excessive
corrections for run-to-run variability. Repeatability for rig parameters were taken at health check
points (ADP conditions) on 5 different days, totaling 44 steady state readings during the rig test
campaign. Inlet pressure, temperature and flow, and rig overall pressure ratio, were consistent to
less than 0.4% 1-sigma variation, which leads to a peak-to-peak variation in measured efficiency
below the instrumentation uncertainty. Overall, the rig demonstrated excellent run-to-run
repeatability.
An area traverse was completed behind the pre-swirler to characterize the duct inlet condition.
The pre-swirl vane was designed to produce a smooth, representative GGT exit swirl distribution
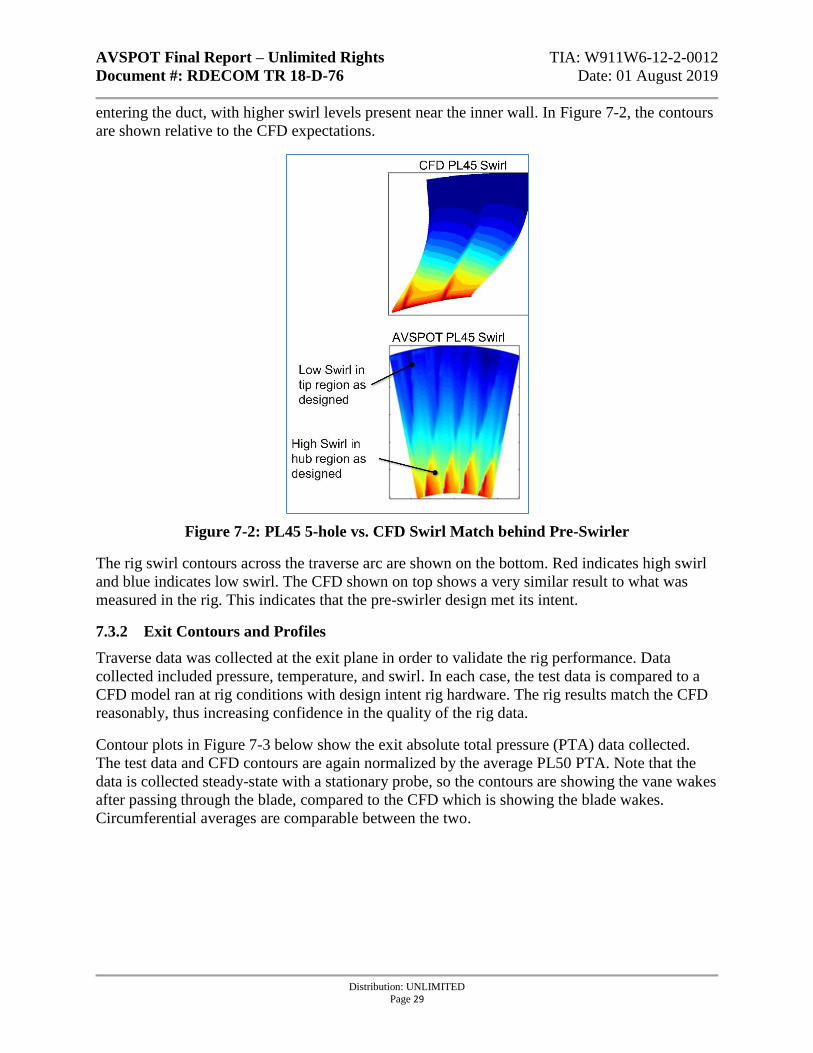
AVSPOT Final Report – Unlimited Rights TIA: W911W6-12-2-0012
Document #: RDECOM TR 18-D-76 Date: 01 August 2019
Distribution: UNLIMITED
Page 29
entering the duct, with higher swirl levels present near the inner wall. In Figure 7-2, the contours
are shown relative to the CFD expectations.
Figure 7-2: PL45 5-hole vs. CFD Swirl Match behind Pre-Swirler
The rig swirl contours across the traverse arc are shown on the bottom. Red indicates high swirl
and blue indicates low swirl. The CFD shown on top shows a very similar result to what was
measured in the rig. This indicates that the pre-swirler design met its intent.
7.3.2 Exit Contours and Profiles
Traverse data was collected at the exit plane in order to validate the rig performance. Data
collected included pressure, temperature, and swirl. In each case, the test data is compared to a
CFD model ran at rig conditions with design intent rig hardware. The rig results match the CFD
reasonably, thus increasing confidence in the quality of the rig data.
Contour plots in Figure 7-3 below show the exit absolute total pressure (PTA) data collected.
The test data and CFD contours are again normalized by the average PL50 PTA. Note that the
data is collected steady-state with a stationary probe, so the contours are showing the vane wakes
after passing through the blade, compared to the CFD which is showing the blade wakes.
Circumferential averages are comparable between the two.
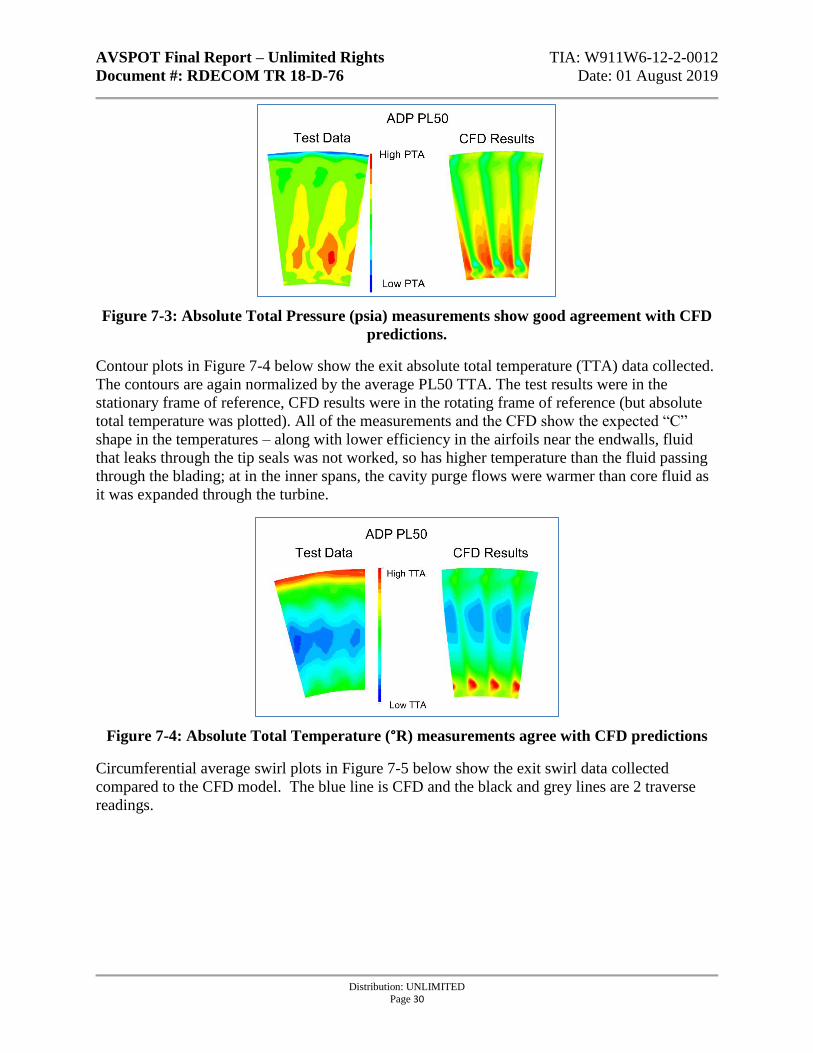
AVSPOT Final Report – Unlimited Rights TIA: W911W6-12-2-0012
Document #: RDECOM TR 18-D-76 Date: 01 August 2019
Distribution: UNLIMITED
Page 30
Figure 7-3: Absolute Total Pressure (psia) measurements show good agreement with CFD
predictions.
Contour plots in Figure 7-4 below show the exit absolute total temperature (TTA) data collected.
The contours are again normalized by the average PL50 TTA. The test results were in the
stationary frame of reference, CFD results were in the rotating frame of reference (but absolute
total temperature was plotted). All of the measurements and the CFD show the expected “C”
shape in the temperatures – along with lower efficiency in the airfoils near the endwalls, fluid
that leaks through the tip seals was not worked, so has higher temperature than the fluid passing
through the blading; at in the inner spans, the cavity purge flows were warmer than core fluid as
it was expanded through the turbine.
Figure 7-4: Absolute Total Temperature (°R) measurements agree with CFD predictions
Circumferential average swirl plots in Figure 7-5 below show the exit swirl data collected
compared to the CFD model. The blue line is CFD and the black and grey lines are 2 traverse
readings.
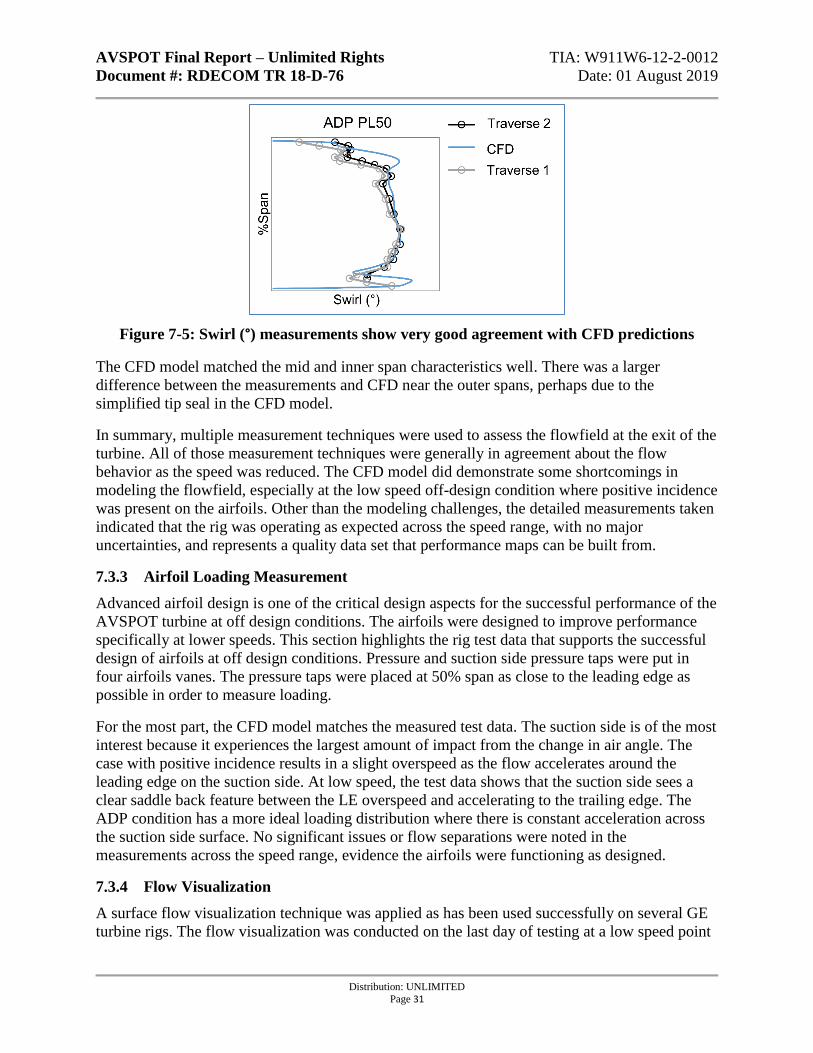
AVSPOT Final Report – Unlimited Rights TIA: W911W6-12-2-0012
Document #: RDECOM TR 18-D-76 Date: 01 August 2019
Distribution: UNLIMITED
Page 31
Figure 7-5: Swirl (°) measurements show very good agreement with CFD predictions
The CFD model matched the mid and inner span characteristics well. There was a larger
difference between the measurements and CFD near the outer spans, perhaps due to the
simplified tip seal in the CFD model.
In summary, multiple measurement techniques were used to assess the flowfield at the exit of the
turbine. All of those measurement techniques were generally in agreement about the flow
behavior as the speed was reduced. The CFD model did demonstrate some shortcomings in
modeling the flowfield, especially at the low speed off-design condition where positive incidence
was present on the airfoils. Other than the modeling challenges, the detailed measurements taken
indicated that the rig was operating as expected across the speed range, with no major
uncertainties, and represents a quality data set that performance maps can be built from.
7.3.3 Airfoil Loading Measurement
Advanced airfoil design is one of the critical design aspects for the successful performance of the
AVSPOT turbine at off design conditions. The airfoils were designed to improve performance
specifically at lower speeds. This section highlights the rig test data that supports the successful
design of airfoils at off design conditions. Pressure and suction side pressure taps were put in
four airfoils vanes. The pressure taps were placed at 50% span as close to the leading edge as
possible in order to measure loading.
For the most part, the CFD model matches the measured test data. The suction side is of the most
interest because it experiences the largest amount of impact from the change in air angle. The
case with positive incidence results in a slight overspeed as the flow accelerates around the
leading edge on the suction side. At low speed, the test data shows that the suction side sees a
clear saddle back feature between the LE overspeed and accelerating to the trailing edge. The
ADP condition has a more ideal loading distribution where there is constant acceleration across
the suction side surface. No significant issues or flow separations were noted in the
measurements across the speed range, evidence the airfoils were functioning as designed.
7.3.4 Flow Visualization
A surface flow visualization technique was applied as has been used successfully on several GE
turbine rigs. The flow visualization was conducted on the last day of testing at a low speed point
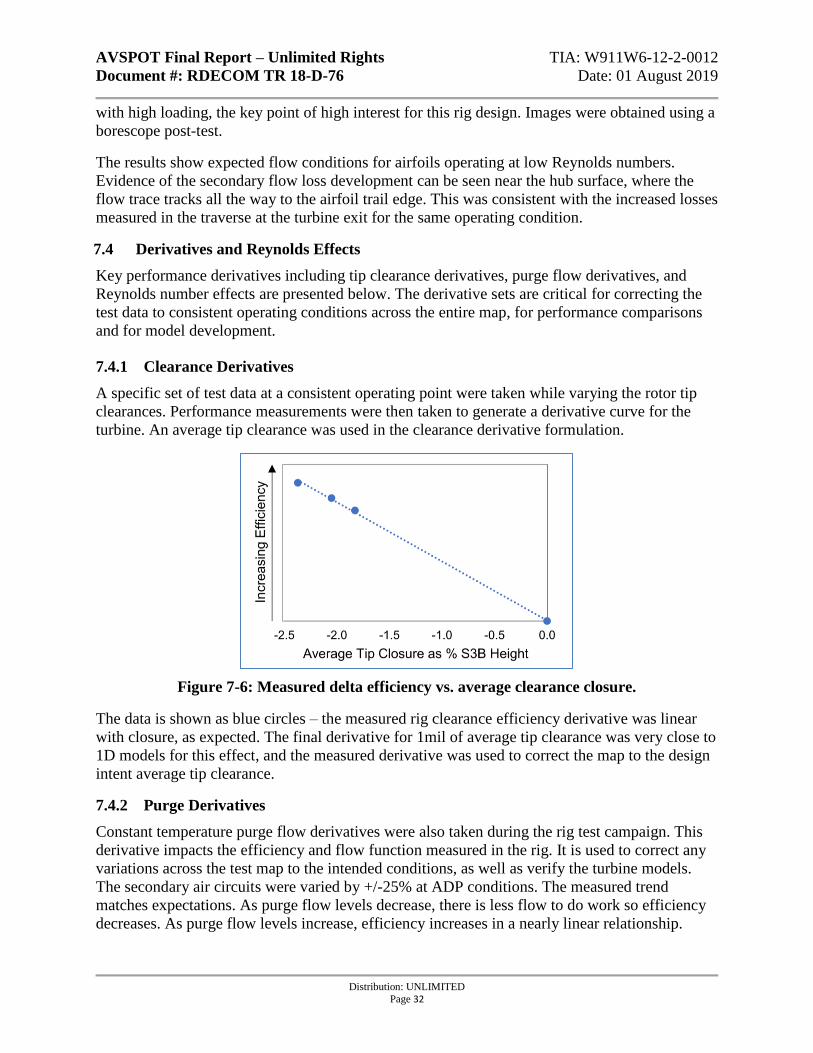
AVSPOT Final Report – Unlimited Rights TIA: W911W6-12-2-0012
Document #: RDECOM TR 18-D-76 Date: 01 August 2019
Distribution: UNLIMITED
Page 32
with high loading, the key point of high interest for this rig design. Images were obtained using a
borescope post-test.
The results show expected flow conditions for airfoils operating at low Reynolds numbers.
Evidence of the secondary flow loss development can be seen near the hub surface, where the
flow trace tracks all the way to the airfoil trail edge. This was consistent with the increased losses
measured in the traverse at the turbine exit for the same operating condition.
7.4 Derivatives and Reynolds Effects
Key performance derivatives including tip clearance derivatives, purge flow derivatives, and
Reynolds number effects are presented below. The derivative sets are critical for correcting the
test data to consistent operating conditions across the entire map, for performance comparisons
and for model development.
7.4.1 Clearance Derivatives
A specific set of test data at a consistent operating point were taken while varying the rotor tip
clearances. Performance measurements were then taken to generate a derivative curve for the
turbine. An average tip clearance was used in the clearance derivative formulation.
Figure 7-6: Measured delta efficiency vs. average clearance closure.
The data is shown as blue circles – the measured rig clearance efficiency derivative was linear
with closure, as expected. The final derivative for 1mil of average tip clearance was very close to
1D models for this effect, and the measured derivative was used to correct the map to the design
intent average tip clearance.
7.4.2 Purge Derivatives
Constant temperature purge flow derivatives were also taken during the rig test campaign. This
derivative impacts the efficiency and flow function measured in the rig. It is used to correct any
variations across the test map to the intended conditions, as well as verify the turbine models.
The secondary air circuits were varied by +/-25% at ADP conditions. The measured trend
matches expectations. As purge flow levels decrease, there is less flow to do work so efficiency
decreases. As purge flow levels increase, efficiency increases in a nearly linear relationship.
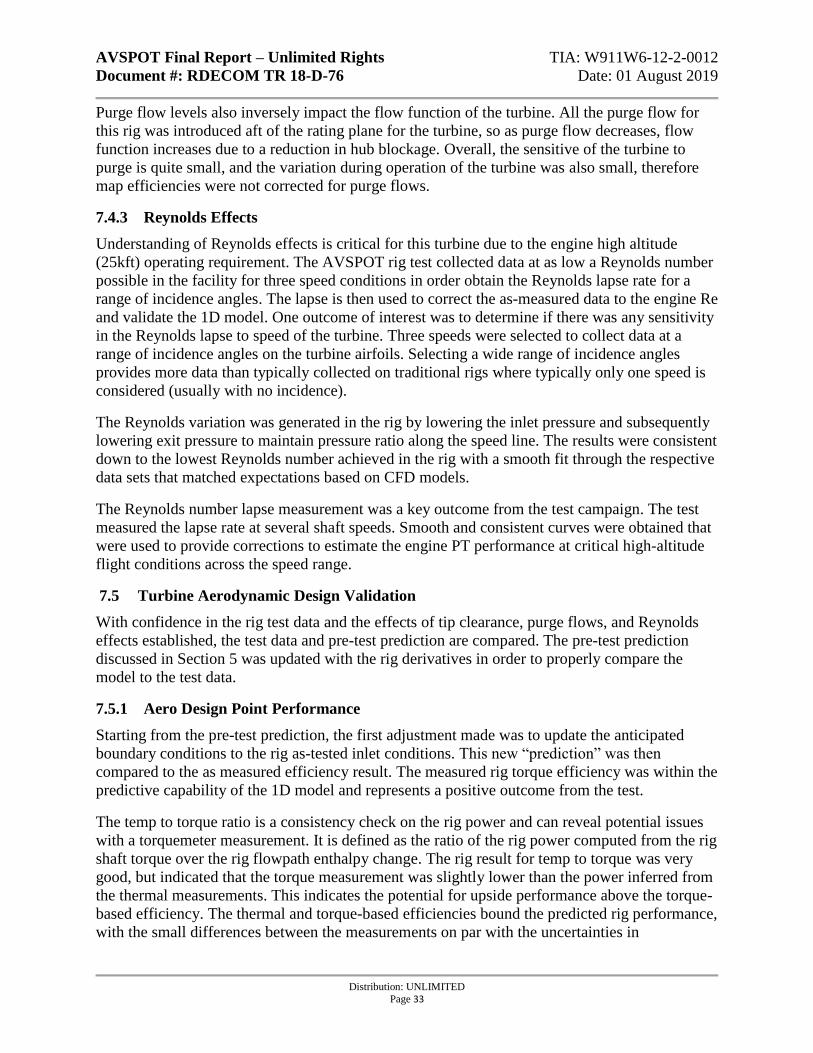
AVSPOT Final Report – Unlimited Rights TIA: W911W6-12-2-0012
Document #: RDECOM TR 18-D-76 Date: 01 August 2019
Distribution: UNLIMITED
Page 33
Purge flow levels also inversely impact the flow function of the turbine. All the purge flow for
this rig was introduced aft of the rating plane for the turbine, so as purge flow decreases, flow
function increases due to a reduction in hub blockage. Overall, the sensitive of the turbine to
purge is quite small, and the variation during operation of the turbine was also small, therefore
map efficiencies were not corrected for purge flows.
7.4.3 Reynolds Effects
Understanding of Reynolds effects is critical for this turbine due to the engine high altitude
(25kft) operating requirement. The AVSPOT rig test collected data at as low a Reynolds number
possible in the facility for three speed conditions in order obtain the Reynolds lapse rate for a
range of incidence angles. The lapse is then used to correct the as-measured data to the engine Re
and validate the 1D model. One outcome of interest was to determine if there was any sensitivity
in the Reynolds lapse to speed of the turbine. Three speeds were selected to collect data at a
range of incidence angles on the turbine airfoils. Selecting a wide range of incidence angles
provides more data than typically collected on traditional rigs where typically only one speed is
considered (usually with no incidence).
The Reynolds variation was generated in the rig by lowering the inlet pressure and subsequently
lowering exit pressure to maintain pressure ratio along the speed line. The results were consistent
down to the lowest Reynolds number achieved in the rig with a smooth fit through the respective
data sets that matched expectations based on CFD models.
The Reynolds number lapse measurement was a key outcome from the test campaign. The test
measured the lapse rate at several shaft speeds. Smooth and consistent curves were obtained that
were used to provide corrections to estimate the engine PT performance at critical high-altitude
flight conditions across the speed range.
7.5 Turbine Aerodynamic Design Validation
With confidence in the rig test data and the effects of tip clearance, purge flows, and Reynolds
effects established, the test data and pre-test prediction are compared. The pre-test prediction
discussed in Section 5 was updated with the rig derivatives in order to properly compare the
model to the test data.
7.5.1 Aero Design Point Performance
Starting from the pre-test prediction, the first adjustment made was to update the anticipated
boundary conditions to the rig as-tested inlet conditions. This new “prediction” was then
compared to the as measured efficiency result. The measured rig torque efficiency was within the
predictive capability of the 1D model and represents a positive outcome from the test.
The temp to torque ratio is a consistency check on the rig power and can reveal potential issues
with a torquemeter measurement. It is defined as the ratio of the rig power computed from the rig
shaft torque over the rig flowpath enthalpy change. The rig result for temp to torque was very
good, but indicated that the torque measurement was slightly lower than the power inferred from
the thermal measurements. This indicates the potential for upside performance above the torque-
based efficiency. The thermal and torque-based efficiencies bound the predicted rig performance,
with the small differences between the measurements on par with the uncertainties in
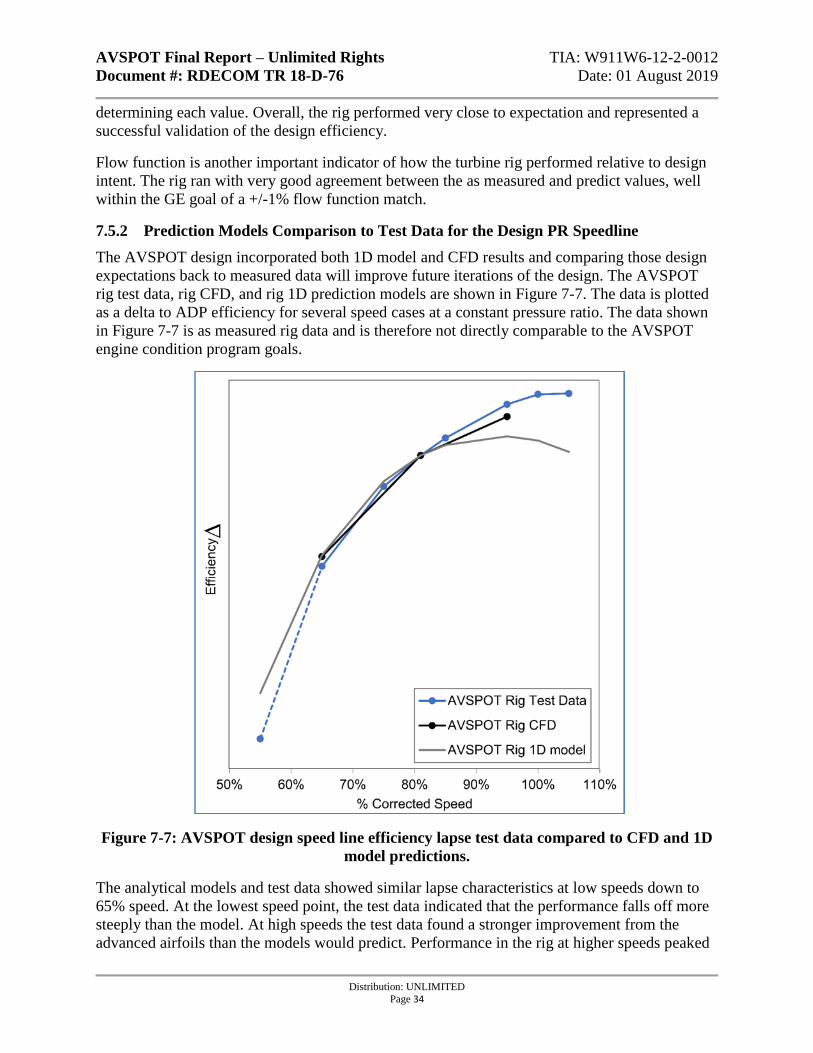
AVSPOT Final Report – Unlimited Rights TIA: W911W6-12-2-0012
Document #: RDECOM TR 18-D-76 Date: 01 August 2019
Distribution: UNLIMITED
Page 34
determining each value. Overall, the rig performed very close to expectation and represented a
successful validation of the design efficiency.
Flow function is another important indicator of how the turbine rig performed relative to design
intent. The rig ran with very good agreement between the as measured and predict values, well
within the GE goal of a +/-1% flow function match.
7.5.2 Prediction Models Comparison to Test Data for the Design PR Speedline
The AVSPOT design incorporated both 1D model and CFD results and comparing those design
expectations back to measured data will improve future iterations of the design. The AVSPOT
rig test data, rig CFD, and rig 1D prediction models are shown in Figure 7-7. The data is plotted
as a delta to ADP efficiency for several speed cases at a constant pressure ratio. The data shown
in Figure 7-7 is as measured rig data and is therefore not directly comparable to the AVSPOT
engine condition program goals.
Figure 7-7: AVSPOT design speed line efficiency lapse test data compared to CFD and 1D
model predictions.
The analytical models and test data showed similar lapse characteristics at low speeds down to
65% speed. At the lowest speed point, the test data indicated that the performance falls off more
steeply than the model. At high speeds the test data found a stronger improvement from the
advanced airfoils than the models would predict. Performance in the rig at higher speeds peaked
AVSPOT Final Report – Unlimited Rights TIA: W911W6-12-2-0012
Document #: RDECOM TR 18-D-76 Date: 01 August 2019
Distribution: UNLIMITED
Page 35
near 105%. This result indicated that the design was much more tolerant of negative incidence
than expected – additional evidence was found in the detailed flow surveys, where there were
limited changes in the loss distributions between mid and a high speed points. The CFD model
was between the 1D model and the test result, indicating that some of the physics was being
captured in the CFD, but capturing the complex loss interactions requires higher-fidelity models.
7.6 Turbine Maps
The map data generated from the rig test campaign is an important input for performance models
of future engine development efforts. Multiple speed points along lines of constant delta-H/T
were taken during testing, and those results were converted to both efficiency and flow function
maps.
The turbine map was completed at a rig Reynolds number and then corrected for Reynolds
number and tip clearance effects using measured derivatives. All the map was corrected to the
design intent tip clearance and Reynolds. Figure 7-8 shows the map data plotted as an efficiency
delta from design point. The map shows the performance lapse with speed as a function of
pressure ratio. Pressure ratio had a mild impact on performance, with lower pressure ratios
reducing the performance slightly (due to the differential unloading of the turbine stages).
Figure 7-8: AVSPOT performance map. Lines of constant Pressure Ratio.
Figure 7-9 is the rig flow function map, corrected using the same methodology as described
above. Overall, the flow function is a stronger function of speed than pressure ratio. The
measured data showed only a slight sensitivity to pressure ratio at the low and high ends of the
speed lines.
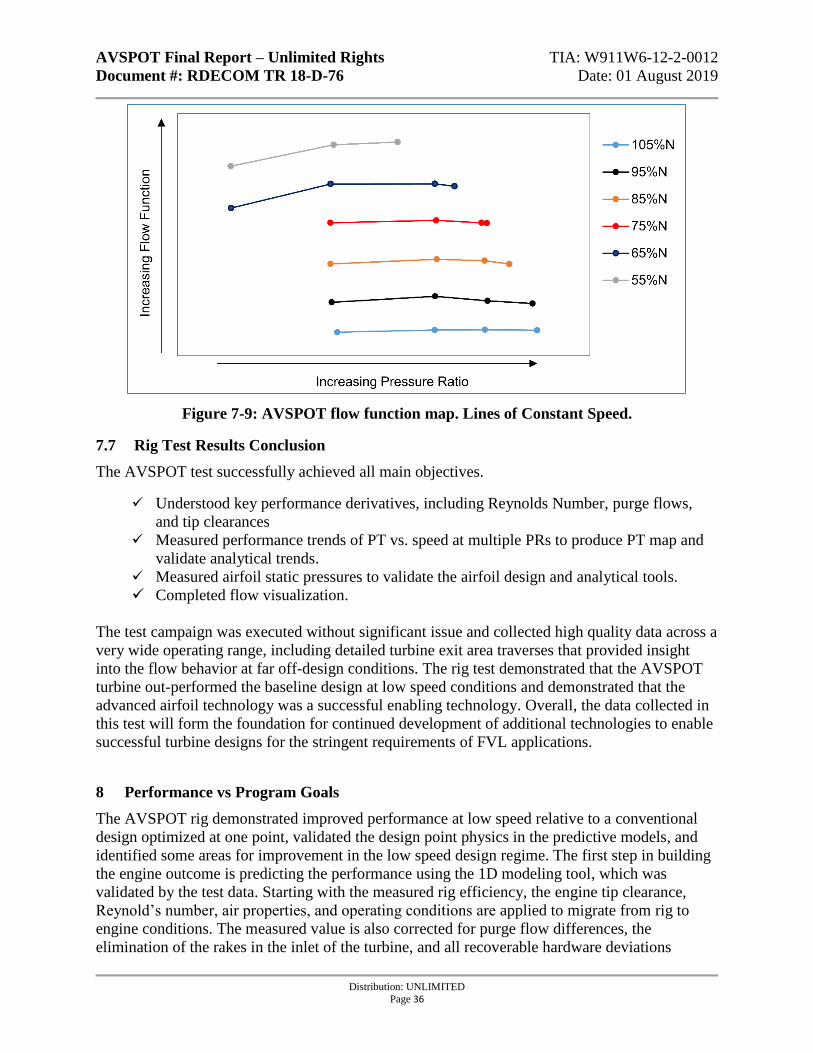
AVSPOT Final Report – Unlimited Rights TIA: W911W6-12-2-0012
Document #: RDECOM TR 18-D-76 Date: 01 August 2019
Distribution: UNLIMITED
Page 36
Figure 7-9: AVSPOT flow function map. Lines of Constant Speed.
7.7 Rig Test Results Conclusion
The AVSPOT test successfully achieved all main objectives.
✓ Understood key performance derivatives, including Reynolds Number, purge flows,
and tip clearances ✓ Measured performance trends of PT vs. speed at multiple PRs to produce PT map and
validate analytical trends. ✓ Measured airfoil static pressures to validate the airfoil design and analytical tools.
✓ Completed flow visualization.
The test campaign was executed without significant issue and collected high quality data across a
very wide operating range, including detailed turbine exit area traverses that provided insight
into the flow behavior at far off-design conditions. The rig test demonstrated that the AVSPOT
turbine out-performed the baseline design at low speed conditions and demonstrated that the
advanced airfoil technology was a successful enabling technology. Overall, the data collected in
this test will form the foundation for continued development of additional technologies to enable
successful turbine designs for the stringent requirements of FVL applications.
8 Performance vs Program Goals
The AVSPOT rig demonstrated improved performance at low speed relative to a conventional
design optimized at one point, validated the design point physics in the predictive models, and
identified some areas for improvement in the low speed design regime. The first step in building
the engine outcome is predicting the performance using the 1D modeling tool, which was
validated by the test data. Starting with the measured rig efficiency, the engine tip clearance,
Reynold’s number, air properties, and operating conditions are applied to migrate from rig to
engine conditions. The measured value is also corrected for purge flow differences, the
elimination of the rakes in the inlet of the turbine, and all recoverable hardware deviations
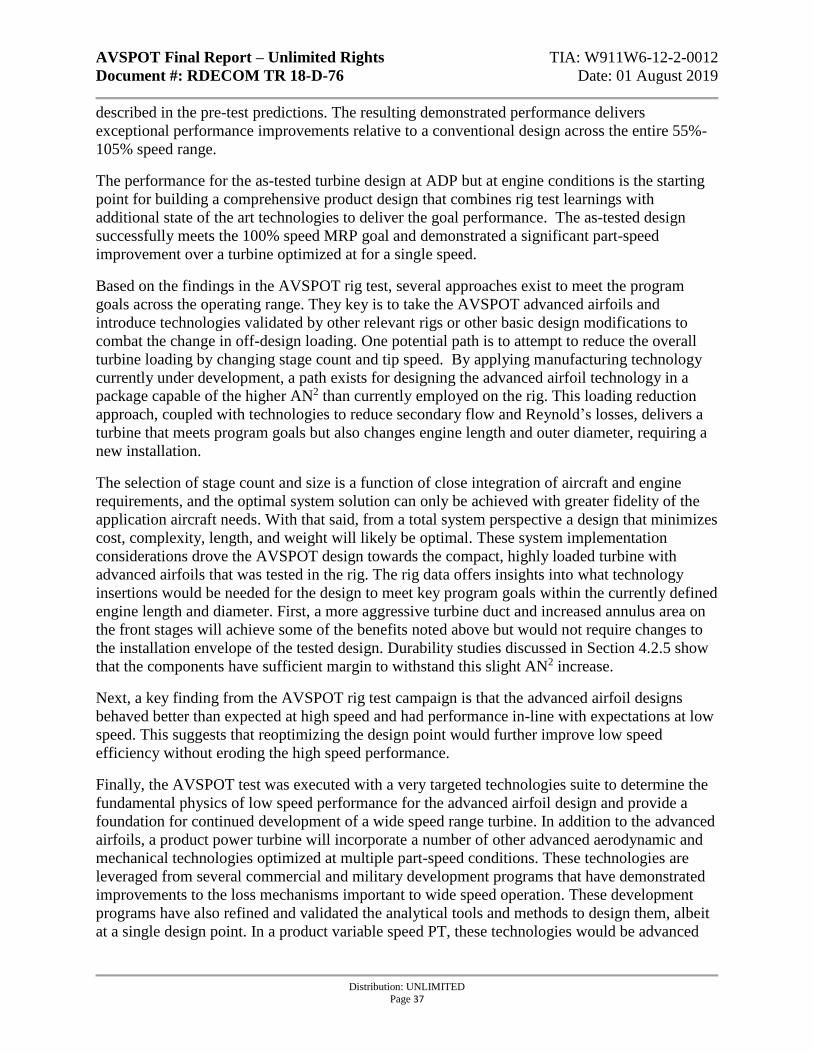
AVSPOT Final Report – Unlimited Rights TIA: W911W6-12-2-0012
Document #: RDECOM TR 18-D-76 Date: 01 August 2019
Distribution: UNLIMITED
Page 37
described in the pre-test predictions. The resulting demonstrated performance delivers
exceptional performance improvements relative to a conventional design across the entire 55%-
105% speed range.
The performance for the as-tested turbine design at ADP but at engine conditions is the starting
point for building a comprehensive product design that combines rig test learnings with
additional state of the art technologies to deliver the goal performance. The as-tested design
successfully meets the 100% speed MRP goal and demonstrated a significant part-speed
improvement over a turbine optimized at for a single speed.
Based on the findings in the AVSPOT rig test, several approaches exist to meet the program
goals across the operating range. They key is to take the AVSPOT advanced airfoils and
introduce technologies validated by other relevant rigs or other basic design modifications to
combat the change in off-design loading. One potential path is to attempt to reduce the overall
turbine loading by changing stage count and tip speed. By applying manufacturing technology
currently under development, a path exists for designing the advanced airfoil technology in a
package capable of the higher AN2 than currently employed on the rig. This loading reduction
approach, coupled with technologies to reduce secondary flow and Reynold’s losses, delivers a
turbine that meets program goals but also changes engine length and outer diameter, requiring a
new installation.
The selection of stage count and size is a function of close integration of aircraft and engine
requirements, and the optimal system solution can only be achieved with greater fidelity of the
application aircraft needs. With that said, from a total system perspective a design that minimizes
cost, complexity, length, and weight will likely be optimal. These system implementation
considerations drove the AVSPOT design towards the compact, highly loaded turbine with
advanced airfoils that was tested in the rig. The rig data offers insights into what technology
insertions would be needed for the design to meet key program goals within the currently defined
engine length and diameter. First, a more aggressive turbine duct and increased annulus area on
the front stages will achieve some of the benefits noted above but would not require changes to
the installation envelope of the tested design. Durability studies discussed in Section 4.2.5 show
that the components have sufficient margin to withstand this slight AN2 increase.
Next, a key finding from the AVSPOT rig test campaign is that the advanced airfoil designs
behaved better than expected at high speed and had performance in-line with expectations at low
speed. This suggests that reoptimizing the design point would further improve low speed
efficiency without eroding the high speed performance.
Finally, the AVSPOT test was executed with a very targeted technologies suite to determine the
fundamental physics of low speed performance for the advanced airfoil design and provide a
foundation for continued development of a wide speed range turbine. In addition to the advanced
airfoils, a product power turbine will incorporate a number of other advanced aerodynamic and
mechanical technologies optimized at multiple part-speed conditions. These technologies are
leveraged from several commercial and military development programs that have demonstrated
improvements to the loss mechanisms important to wide speed operation. These development
programs have also refined and validated the analytical tools and methods to design them, albeit
at a single design point. In a product variable speed PT, these technologies would be advanced
AVSPOT Final Report – Unlimited Rights TIA: W911W6-12-2-0012
Document #: RDECOM TR 18-D-76 Date: 01 August 2019
Distribution: UNLIMITED
Page 38
from the current single-point optimization to a multi-point design optimization and applied to the
AVSPOT design.
In order to project performance for this future product AVSPOT with all of the technologies
discussed above, estimated performance improvements from each individual technology are
added to the rig-based performance of the as-tested AVSPOT configuration at the 3 points
specified in the BAA. Based on the AVSPOT test findings, the design point will be shifted,
which significantly improves the turbine performance at low speed with minimal roll-off at the
high-speed conditions. The individual technologies being integrated target specific loss
mechanisms, the magnitudes of which vary with speed and altitude. Therefore, the magnitudes of
the efficiency impact of these technologies also change with speed and altitude. For example,
low Reynolds technology is designed to maximize impact at points where Reynolds losses are
the most severe.
The resulting final product projected performance is shown in Figure 8-1. This design includes
the multi-point design optimization of aero technologies validated on recent GE rigs, coupled
with an optimized ADP a small flowpath flair compared to the rig tested configuration.
Figure 8-1: Product design incorporates learnings from AVSPOT rig test and other
relevant GE development efforts.
In conclusion, a plan has been created for a compact, lightweight VSPT to meet the FVL needs
of the Army. A foundational first step was taken by testing a product-representative rig that
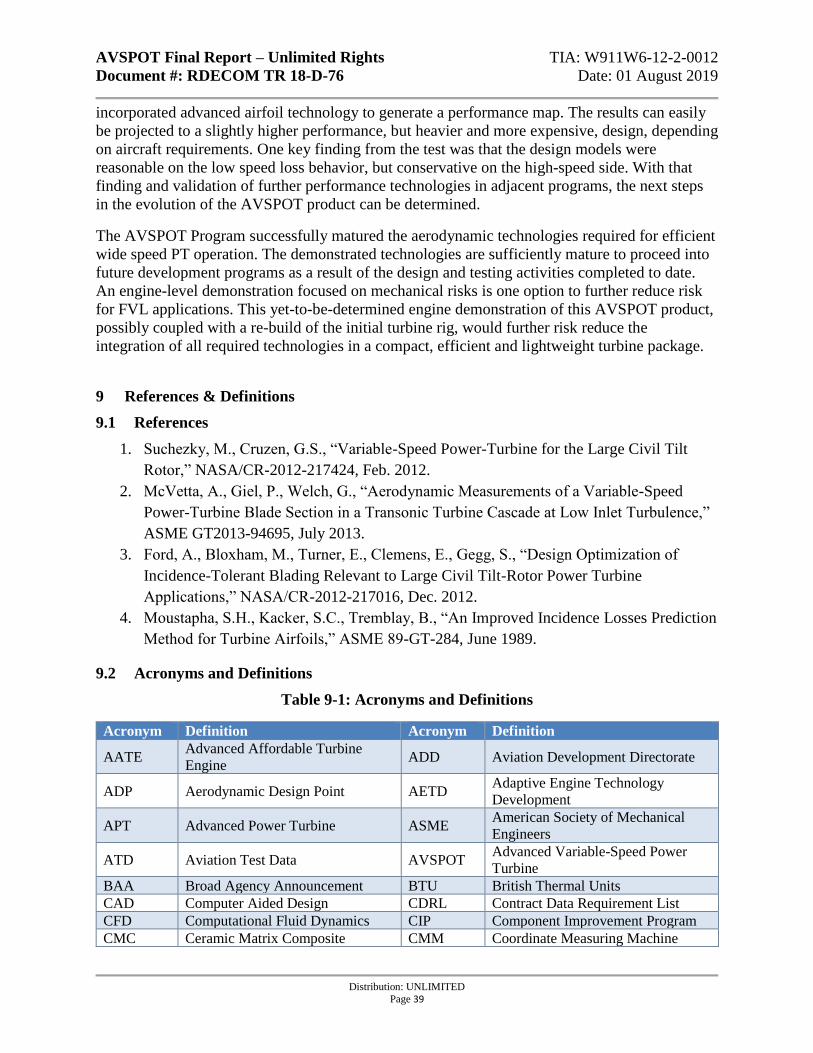
AVSPOT Final Report – Unlimited Rights TIA: W911W6-12-2-0012
Document #: RDECOM TR 18-D-76 Date: 01 August 2019
Distribution: UNLIMITED
Page 39
incorporated advanced airfoil technology to generate a performance map. The results can easily
be projected to a slightly higher performance, but heavier and more expensive, design, depending
on aircraft requirements. One key finding from the test was that the design models were
reasonable on the low speed loss behavior, but conservative on the high-speed side. With that
finding and validation of further performance technologies in adjacent programs, the next steps
in the evolution of the AVSPOT product can be determined.
The AVSPOT Program successfully matured the aerodynamic technologies required for efficient
wide speed PT operation. The demonstrated technologies are sufficiently mature to proceed into
future development programs as a result of the design and testing activities completed to date.
An engine-level demonstration focused on mechanical risks is one option to further reduce risk
for FVL applications. This yet-to-be-determined engine demonstration of this AVSPOT product,
possibly coupled with a re-build of the initial turbine rig, would further risk reduce the
integration of all required technologies in a compact, efficient and lightweight turbine package.
9 References & Definitions
9.1 References
1. Suchezky, M., Cruzen, G.S., “Variable-Speed Power-Turbine for the Large Civil Tilt
Rotor,” NASA/CR-2012-217424, Feb. 2012.
2. McVetta, A., Giel, P., Welch, G., “Aerodynamic Measurements of a Variable-Speed
Power-Turbine Blade Section in a Transonic Turbine Cascade at Low Inlet Turbulence,”
ASME GT2013-94695, July 2013.
3. Ford, A., Bloxham, M., Turner, E., Clemens, E., Gegg, S., “Design Optimization of
Incidence-Tolerant Blading Relevant to Large Civil Tilt-Rotor Power Turbine
Applications,” NASA/CR-2012-217016, Dec. 2012.
4. Moustapha, S.H., Kacker, S.C., Tremblay, B., “An Improved Incidence Losses Prediction
Method for Turbine Airfoils,” ASME 89-GT-284, June 1989.
9.2 Acronyms and Definitions
Table 9-1: Acronyms and Definitions
Acronym Definition Acronym Definition
AATE Advanced Affordable Turbine
Engine ADD Aviation Development Directorate
ADP Aerodynamic Design Point AETD Adaptive Engine Technology
Development
APT Advanced Power Turbine ASME American Society of Mechanical
Engineers
ATD Aviation Test Data AVSPOT Advanced Variable-Speed Power
Turbine
BAA Broad Agency Announcement BTU British Thermal Units
CAD Computer Aided Design CDRL Contract Data Requirement List
CFD Computational Fluid Dynamics CIP Component Improvement Program
CMC Ceramic Matrix Composite CMM Coordinate Measuring Machine
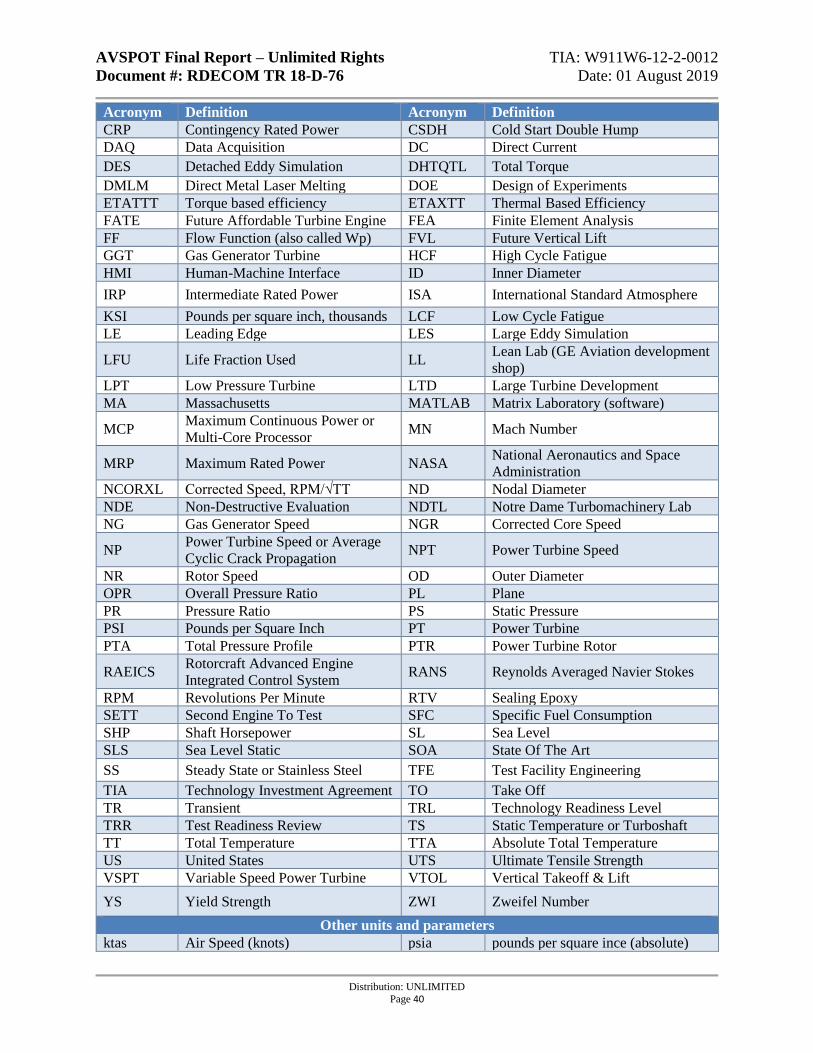
AVSPOT Final Report – Unlimited Rights TIA: W911W6-12-2-0012
Document #: RDECOM TR 18-D-76 Date: 01 August 2019
Distribution: UNLIMITED
Page 40
Acronym Definition Acronym Definition
CRP Contingency Rated Power CSDH Cold Start Double Hump
DAQ Data Acquisition DC Direct Current
DES Detached Eddy Simulation DHTQTL Total Torque
DMLM Direct Metal Laser Melting DOE Design of Experiments
ETATTT Torque based efficiency ETAXTT Thermal Based Efficiency
FATE Future Affordable Turbine Engine FEA Finite Element Analysis
FF Flow Function (also called Wp) FVL Future Vertical Lift
GGT Gas Generator Turbine HCF High Cycle Fatigue
HMI Human-Machine Interface ID Inner Diameter
IRP Intermediate Rated Power ISA International Standard Atmosphere
KSI Pounds per square inch, thousands LCF Low Cycle Fatigue
LE Leading Edge LES Large Eddy Simulation
LFU Life Fraction Used LL Lean Lab (GE Aviation development
shop)
LPT Low Pressure Turbine LTD Large Turbine Development
MA Massachusetts MATLAB Matrix Laboratory (software)
MCP Maximum Continuous Power or
Multi-Core Processor MN Mach Number
MRP Maximum Rated Power NASA National Aeronautics and Space
Administration
NCORXL Corrected Speed, RPM/√TT ND Nodal Diameter
NDE Non-Destructive Evaluation NDTL Notre Dame Turbomachinery Lab
NG Gas Generator Speed NGR Corrected Core Speed
NP Power Turbine Speed or Average
Cyclic Crack Propagation NPT Power Turbine Speed
NR Rotor Speed OD Outer Diameter
OPR Overall Pressure Ratio PL Plane
PR Pressure Ratio PS Static Pressure
PSI Pounds per Square Inch PT Power Turbine
PTA Total Pressure Profile PTR Power Turbine Rotor
RAEICS Rotorcraft Advanced Engine
Integrated Control System RANS Reynolds Averaged Navier Stokes
RPM Revolutions Per Minute RTV Sealing Epoxy
SETT Second Engine To Test SFC Specific Fuel Consumption
SHP Shaft Horsepower SL Sea Level
SLS Sea Level Static SOA State Of The Art
SS Steady State or Stainless Steel TFE Test Facility Engineering
TIA Technology Investment Agreement TO Take Off
TR Transient TRL Technology Readiness Level
TRR Test Readiness Review TS Static Temperature or Turboshaft
TT Total Temperature TTA Absolute Total Temperature
US United States UTS Ultimate Tensile Strength
VSPT Variable Speed Power Turbine VTOL Vertical Takeoff & Lift
YS Yield Strength ZWI Zweifel Number
Other units and parameters
ktas Air Speed (knots) psia pounds per square ince (absolute)
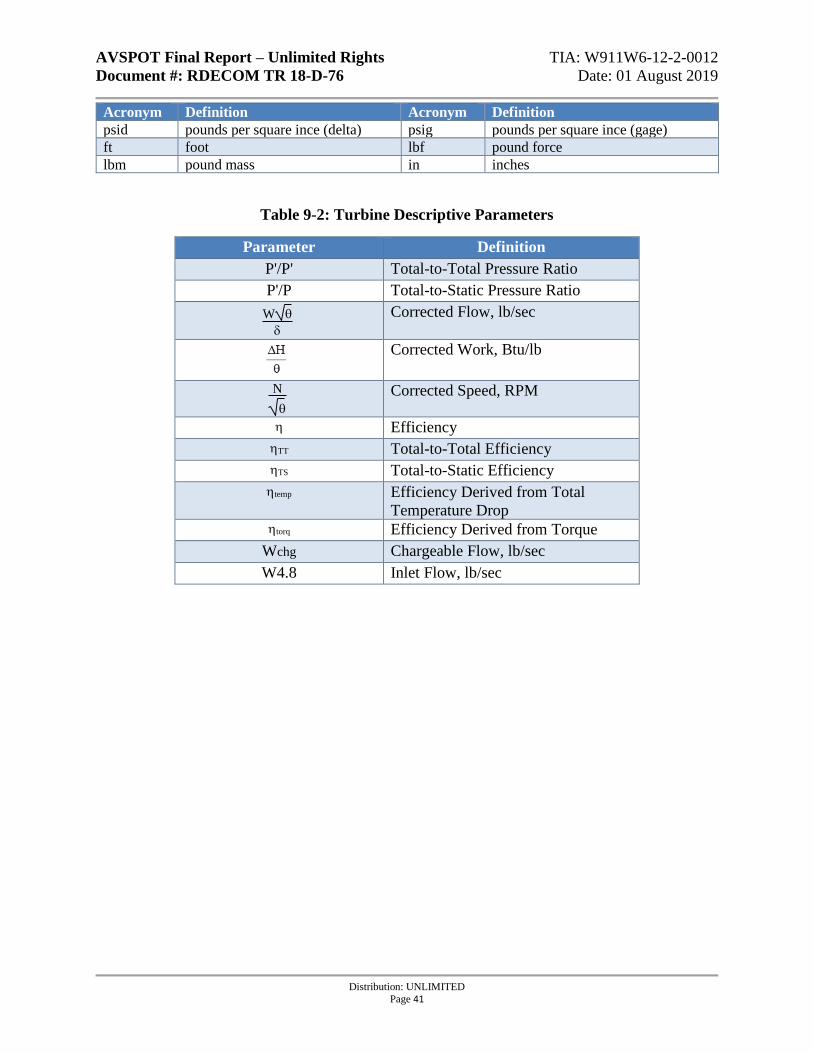
AVSPOT Final Report – Unlimited Rights TIA: W911W6-12-2-0012
Document #: RDECOM TR 18-D-76 Date: 01 August 2019
Distribution: UNLIMITED
Page 41
Acronym Definition Acronym Definition
psid pounds per square ince (delta) psig pounds per square ince (gage)
ft foot lbf pound force
lbm pound mass in inches
Table 9-2: Turbine Descriptive Parameters
Parameter Definition
P'/P' Total-to-Total Pressure Ratio
P'/P Total-to-Static Pressure Ratio
W
Corrected Flow, lb/sec
Corrected Work, Btu/lb
N
Corrected Speed, RPM
Efficiency
TT Total-to-Total Efficiency
TS Total-to-Static Efficiency
temp Efficiency Derived from Total
Temperature Drop torq Efficiency Derived from Torque
Wchg Chargeable Flow, lb/sec
W4.8 Inlet Flow, lb/sec