Embed Size (px)
Citation preview

Report No. 12849-VE
VenezuelaCEM: Living with Oil(In Two Volumes) Volume I
June 21, 1995
Country Operations DivisionCountry Department 11Latin America and the Caribbean Region
.wA. .
_*. ~ s - -,
Pub
lic D
iscl
osur
e A
utho
rized
Pub
lic D
iscl
osur
e A
utho
rized
Pub
lic D
iscl
osur
e A
utho
rized
Pub
lic D
iscl
osur
e A
utho
rized
Pub
lic D
iscl
osur
e A
utho
rized
Pub
lic D
iscl
osur
e A
utho
rized
Pub
lic D
iscl
osur
e A
utho
rized
Pub
lic D
iscl
osur
e A
utho
rized

COUNTRY DATA SHEET1993 unless otherwise indicated
General
Area (square kilometers) 912,050Population 20,875,000
Growth Rate from 1980 to 1991 2.6%1992 2.3%
Density (per square kilometer) 21.7 (1991)
Social Indicators
Population CharacteristicsBirth Rate (per 1,000 people) 26.9Death Rate (per 1,000 people) 4.7
HealthInfant Mortality (per 1,000 live births) 22.7Physicians per 1,000 People 1.7 (1989)Hospital Beds per 1,000 People 2.6 (1992)
Househole Labor Income DistributionHighest Quintile 49.5%Lowest Quintile 4.8%
Access to Safe WaterPercent of Urban Population 89%Percent of Rural Population 89%
NutritionCalcrie Intake as a Percent of Requirements 99% (1990)Per Capita Protein Intake (grams per day) 62 grams
EducationAdult Literacy Rate 93% (1992)Primary School Enrollment (percent of relative age group) 92% (1990)
Gross Domestic Product in 1993Average Annual Growth Rate (%)
USS BILLION GDP Shares (%) 1980-85 1985-90 1990-93GDP at Market Prices $60.0 100.0 -1.4 2.4 5.5Gross Domestic Investment $12.2 18.7 -7.0 -4.3 23.1Gross National Savings $ 8.8 14.7 -5.9 -3.7 6.4Current Account Balance $-2.2 -3.7 1.5 2.4 -24.9Exports of Goods $14.0 23.3 -3.4 5.3 3.6Imports of Goods $11.1 18.5 -3.3 -13.1 13.8
Rate of Exchange (Bolivars per US$)
End of May, 1995 169.57Annual Average 1994 148.90Annual Average 1993 90.86Annual Average 1992 68.38

LISI OF ACRONYMS
ALCASA Aluminio del Caroni, S.A.(Caroni Aluminum Company)
BANAP Banco Nacional de Ahorro y Prestamos(National Bank of Savings and Loans)
BAUXIVEN Bauxita de Venezuela(Venezuelan Bauxite Company)
BCV Banco Central de Venezuela(Central Bank of Venezuela)
BITOR Bitumenes del Orinoco S.A.(Orinoco Bitumen Company)
BDT Bank Debit TaxBPD Barrels Per DayCADAFE Compania Anonima de Administracion de Fomento Electrico
(Electric Company)CAMETRO Compania Anonima Metro de Caracas
(Caracas Metro Company)CANTV Compania Anonima Nacional Telefonos de Venezuela
(Venezuelan National Telephone Company)CAT Corporate Asset TaxCNG Compressed Natural GasCORDIPLAN Oficina Central de Coordinacion y Planificacion
(Central Office of Coordination and Planning)CPI Consumer Price IndexCSB Centro Simon Bolivar
(Simon Bolivar Center)CVG Corporacion Venezolana de Guayana
(Venezuelan Guayana Corporation)CVP Corporacion Venezolana de PetroleoDGSVT Oficina de Transporte por Carretera
(Road Transportation Bureau)EAP Economically Active PopulationEDELCA Electrificacion del Caroni, C.A.
(Caromni Electric Company)EERC Electric Energy Regulatory CommissionENELBAR Energia Electrica de Barquisimeto
(Barquisimeto Electric Company)ENELVEN Energia Electrica de Venezuela, C.A.
(Venezuelan Electric Company)FESILVEN Venezolana de Ferrosilicio
(Venezuelan Ferrosilicon Company)FIV Fondo de Inversiones de Venezuela
(Venezuelan Investment Fund)FOGADE Fondo de Garantia de Depositos
(Deposit Guarantee Fund)FUNDELEC Technical Support Agency for the EERCFYIP Five Year Investment PlanGDP Gross Domestic ProductGST General Sales and Luxury TaxIESA lstituto de Estudios Superiores en Administracion
(Institute for Graduate Studies in Administration)

LIST OF ACRONYMS (Cont'd.)
IMF International Monetary FundINTERALUMINA Interamericana de Alumina, C.A.
(Inter-American Aluminum Company)INTEVEP Instituto de Technologia Venezolano de Petroleo
(Center for Petroleum Research)IRR Internal Rate of Returnivss Instituto Venezolano de los Seguros Sociales
(Venezuelan Social Security Institute)LNG Liquified Natural GasMOE Ministry of EducationMEM Ministry of Energy and MinesMSAS Ministerio de Sanidad y Asistencia Social
(Ministry of Health and Social Assistance)OCEPRE Oficina Central de Presupuesto
(Central Budget Office)OPEC Organization of Petroleum Exporting CountriesPALMAVEN Filial de Petroleos de Venezuela para Fertilizantes y
Desarrollo de Cultivos(Venezuelan Fertilizer Company)
PAS Public Administration SectorPDVSA Petroleos de Venezuela, S.A.
(Venezuelan Petroleum Company)PEQUIVEN Petroquimica de Venezuela, S.A.
(Venezuelan Petrochemical Company)RIF Registro de [nformacion Fiscal
(Fiscal Information Register)SENIAT Servicio Nacional de Administracion Tributaria
(National Tax Administration Service)SIDOR Siderurgica del Orinoco, C.A.
(Orinoco Steel Company)SOE State-Owned EnterpriseTCF Trillion Cubic FeetTFPG Total Factor Productivity GrowthVAT Value Added TaxVENALUM Venezolana de Aluminio
(Venezuelan Aluminum Company)VFE Valor Fiscal de Exportacion
(Export Reference Price)VIASA Venezolana Internacional de Aviacion, S.A.
(Venezuelan International Airline Company)VTV Venezolana de Television
(Venezuelan Television Company)

VENEZUELACEM: LIVING WITH OIL
CONTENTS
Volume I(In two volumes)
PREFACE
EXECUTIVE SUMMARY . ................................... i
Chapter 1. Economic Overview
1.A Introduction ................................... 111.B Historical Background . .............................. 5
i .B. 1 Economic Policy and Performance Beforethe Oil Shocks . ....................... 6
1.B.2 Economic Policy and Performance in 1973-82:The Oil Shocks .......... ............. 7
1.B.3 Economic Policy and Performance afterthe Oil Shocks .......... .............. 8
1.B.4 Economic Policy and Performance after 1988:The Reform Years ......................... 8
1=C Political Economy and 1994 Developments ..... ............ 14
Chapter 2. The Strategy
2.A Introduction ................................... 162.B Stabilization ................................... 222.C Growth ................................... 22
2.C.1 Government Revenue ........... .............. 232.C.1.1 Non-Oil Taxes ...... .............. 232. C. 1.2 Oil Sector Taxation ..... ............ 272.C.1.3 Pricing Policy ...... .............. 27
2.C.2 Government Spending ......................... 302.D Poverty Reduction ................................. 332.E Economic Outlook ................................ 37
2.E.1 Assumptions ................................ 372.E.2 Results .. 39

-2-
Chapter 3. Government Revenue
3.A Introduction .................................... 463.B Main Characteristics of Fiscal Revenue .................... 46
3.B. 1 Oil Revenue Dependency ........ .. ............. 463.B.2 Non-Oil Taxation .......... .. ............... 473.B.3 Relationship between Oil and Non-oil Taxes .... ....... 533.B.4 Relationship Between Fiscal Revenues and Expenditures .... 54
3.C Fiscal Policy: Venezuela and Mexico ..................... 563.D Recommendations ................................. 58
Chapter 4. Government Expenditures
4.A Introduction .................................... 594.B Main Causes of Public Spending Inefficiency ................. 59
4. B. 1 The Size of the Public Sector ........ .. ........... 594.B.2 Public Spending Trends and Composition ..... ........ 604.B.3 Public Administration Performance ....... .......... 664.B.4 Sectoral Performance ......... .. .............. 68
4.C Recommendations ........ ......................... 72
Chapter 5. Savings and Investment
5.A Introduction .................................... 745.B Main Causes of Low Investment Returns ................... 74
5.B. 1 Savings and Investment: Level and Variability .... ...... 745.B.2 Total Factor Productivity Growth ...... .. .......... 785.B.3 Public Investments .......... .. ............... 78
5.C Recommendations . ................ ............. 86
Chapter 6. New Non-Oil Taxes
6.A Introduction .................................... 876.B Changes in the Legal Framework: 1991 and 1992 . . .87
6.B.1 The 1991 Reform of the Income Tax . .876.B.2 The 1992 Reform of the Tax Code. 896.B.3 Impact of the 1991-92 Reforms on Revenue
and Income Distribution .. 906.C The Sosa Plan ................... .............. 92
6.C. 1 The Income Tax Reform Bill . .926.C.2 The General Sales (GST) and Luxury Tax Bill . .956.C.3 The Bank Debit Tax (BDT) Bill ................. 96

-3-
6.D The VAT and CAT: Strengthening the Sosa Plan ............. 976.D. 1 Impact of the VAT and CAT on Revenue
Collection and Other Variables ................... 996.E Recommendations ................................. 103
Chapter 7. Oil Sector Investment Program
7.A Intemational Market Prospects .. 1047.B The Government's Investment Program ............. 105
7.B. 1 Investments in Exploration ...................... 1057.B.2 Investments in Crude Oil, Condensate,
and Natural Gas Production ..................... 1087.B.3 Investments in Orimulsion Production ............... 1097.B.4 Investments in Refining Operations ................. 1107.B.5 Investments in the Domestic Market ................ 1117.B.6 Other Investments ........................... 111
7.C Assessment of the Proposed Investment Program .... .. ........ 1127.C. I Investments in Exploration, Production, and Refinery ...... 1127.C.2 Investments in the Domestic Market ................ 1127.C.3 Investments in Other Areas ....... . . . . . . . . . . . . . . . 112
7.D Recommendations ................................ . 113
Chapter 8: Oil Sector Legal Framework
8.A Introduction ................................... . 1158.B International Changes in Ownership ..................... . 1158.C The Legal Framework of Venezuela's Oil Sector ...... . . . . . . . . 1158.D Characteristics of an Efficient Legal Framework
for the Oil Sector ............. .. .. .. .. .. .. .. .. .. . . 1178.E Recommendations ................................ . 118
Chapter 9: Oil Sector Taxation
9.A Introduction ................................... . 1209.B Characteristics of an Efficient Oil Fiscal Framework ..... . . . . . . 1209.C Venezuela's Oil Fiscal System ........................ . 1219.D International Comparison of Oil Taxation Incidence ..... . . . . . . . 1229.E New Taxation System for Venezuela .................... . 1239.F Impact of the New System on Central Government Revenues ..... . 1269.G Recommendations . . . . . . . . . . . . . . . . . . . . . . . . . . . . . . . . . 126

-4-
Chapter Tables
1.1 Oil as a Share of Exports, GDP, and Fiscal Revenuein Selected Countries; 1970-91 .............. 2
1.2 Macroeconomic Indicators; 1983-93 (GDP Shares) ...... ....... 121.3 Key Economic Variables; 1983-93 ......... .. ............ 132.1 Fiscal Impact of a Real Devaluation ........ .. ............ 202.2 Output, Factor Input and Productivity Growth in Venezuela; 1921-92 . .232.3 Comparison of Domestic Prices and Opportunity Costs .... ....... 282.4 Average Energy Prices in Selected LAC Countries During 1992 ... 292.5 A Comparison of Poverty Estimates from Different Studies .. ..... 342.6 Public Spending in Social Programs ........ .. ............ 352.7 Fiscal Accounts - Reform Case; 1989-98 (GDP Shares) .... ...... 412.8 Fiscal Accounts - Low Case; 1989-98 (GDP Shares) .... ...... 422.9 Trade Assumptions; 1994-98 ............ .............. 432.10 Macroeconomic Indicators; 1989-98 (Reform Case) ..... ........ 442.11 Macroeconomic Indicators; 1989-98 (Low Case) ...... ......... 454.1 Venezuela: The Non-Military Public Sector; 1992 ..... ........ 604.2 Central Government's Spending Allocation (GDP Shares) ... ...... 644.3 Composition of the Five Year (1989-93) Investment Program .. ..... 655.1 Proven Reserves ................ ................... 765.2 International Comparison of GDP: Average Annual Growth Rate
and Its Variability; 1970-91 ............ ................ 775.3 International Comparison of Savings and
Investment Variability; 1970-91 ......... .. .............. 775.4 Output Growth and TFPG, Selected Regions and Countries; 1960-87
(in Percent) .. 795.5 Output, Factor Input and Productivity Growth in Venezuela; 1921-92
(in Percent) ...................................... 795.6 Crude Oil and Refining Production and Exports; 1985-92 ... ...... 855.7 PDVSA's Domestic Sales, Volume and Prices; 1982-91 .... ....... 855.8 PDVSA's Domestic Market Losses; 1982-91 ....... .......... 866.1 Effective Tax Rates on Individuals; 1992 ......... ........... 937.1 Venezuela: 1993-1998 Investment Program ....... .......... 1067.2 Venezuela: Exploration Investments in Billions
of Bolivars ..................................... 1067.3 Venezuela: Comparison of Reserves by Type of Crude Oil ... ..... 1077.4 Venezuela: Natural Gas Proven Reserves ....... ........... 1077.5 Venezuela: Proven Reserves in Billions ....... .. ........... 1087.6 Venezuela: Comparison of Production with Types of Crude Oil ..... 1097.7 Venezuela: Crude Oil Disposition and Refining ...... ......... 1107.8 Venezuela: Investments in Refining (Bls/d) ....... 11.......... Il

- 5 -
9.1 Substance Royalty Rate (Indicative) .................... . 1249.2 R-Factors and Surtax Rates ........................... 125
Chapter Flgures
1.1 Oil and Non-oil Real GDP Growth; 1971-93 (in Percent). 11.2 Spot Average Price of OPEC Crude Oil; 1970-93
(Constant 1990 US$ and Current US$). 32.1 Ratio of Revenues from Base Creation to GDP; 1985-93 ... ..... 172.2 Growth of Nominal MI and Inflation; 1988-93 .... ......... 182.3 Inflation Rate; 1981-93 ............................ 182.4 Real Exchange Rate; 1981-93 ........................ 193.1 Central Government Revenues; 1970-93 (GDP Shares) ... ...... 473.2 Central Government Non-oil Revenues; 1983-93 (GDP Shares) .... 483.3 Income and Payroll Taxes; 1970-93 (GDP Shares) .... ........ 493.4 Gasoline Tax Revenues; 1970-93 - (GDP Shares) .... ........ 493.5 Revenues from Import Duties; 1970-93 - (GDP Shares) ... ..... 503.6 Oil and Non-oil Tax Revenues; 1970-93 - (GDP Shares) ... ..... 543.7 Central Government Total Revenues and
Total Expenditures; 1970-93 (GDP Shares) .553.8 Central Government Total Revenues and Expenditures;
1970-93 (GDP Shares) .563.9 Venezuela and Mexico: Total Fiscal Expenditures;
1970-93 (GDP Shares) .573.10 Venezuela and Mexico: Total Fiscal Revenues;
1970-93 (GDP Shares) ............................. 573.11 Venezuela and Mexico: Non-oil Fiscal Revenues;
1982-92 (GDP Shares) ............................. 584.1 Central Government Expenditures; 1970-93 (GDP Shares) ... .... 614.2 Central Government Spending by Sector;
1970-93 (GDP Shares) ............................. 614.3 SOEs Expenditures; 1970-93 (GDP Shares) ................ 624.4 Petroleum Sector Expenditures; 1976-93 (GDP Shares) ... ...... 634.5 Current/Operating Expenditures; 1970-92 (GDP Shares) ... ..... 644.6 Capital Expenditures; 1970-93 (GDP Shares) ............... 665.1 Gross Domestic Savings; 1970-91 (GDP Shares) .............. 755.2 Gross Domestic Investments; 1970-91 (GDP Shares) .... ....... 755.3 Per Capita Oil Income in Venezuela; 1980-2000
(Constant 1985 US$) .766.1 Effective Tax Rates on Individuals; 1992 ................. 94

PREFACE
This report includes information gathered during two main missions toVenezuela led by Mayra Zermenlo, task manager and principal author of this report. Thefirst one took place in November 1992 and the second one in March 1993. This report hasbeen possible thanks to the continuous collaboration and valuable comments of manyGovernment officials and PDVSA staff and management. The preliminary findings and mostof the recommendations of this report were discussed with the Government at an informalworkshop on June 11, 1994 in Caracas. The discussion was led by Mr. Luis X. Grisanti(then Director General, Hacienda), and it was attended by Government officials from manydifferent areas, including the social sectors. The green cover report was discussed in a seriesof meetings in Caracas, during March 27-31, 1995. These were led by Ram6n Espinasa(Chief Economist, PDVSA), Manuel Lago (Vice-President, BCV), Jose Manuel Tineo(Director General, Hacienda), Edgar Paredes Pisani (Minister, Cordiplan) and Luis X.Grisanti (FIV). This report incorporates their valuable comments.
Many staff and consultants provided major inputs for this report, includingTercan Baysan, Cecilia Bricefio (Consultant), Stijn Claessen, Valeriano Garcia, GustavoGarcia (Consultant), Ted Gorton (Consultant), Nicole Mammoser (Consultant), Uwe Richter,Jose Valera (Consultant), Panos Varangis and Fernando ZTniiiga-Rivero (Consultant).Marlene Sims was responsible for the production of this draft.
Chapter 2 incorporates the findings and recommendations of several Bankreports prepared in parallel to this one: Venezuela-Efficiency Repricing of Energy,Report No. 13581-VE, Venezuela-Labor Markets Study, Report No. 12449-VE, Venezuela-AStrategy for Monetary Stability, mimeo, May 1994, and Venezuela-Social Security Study,Report No. 13207-VE. The discussion on public sector expenditure and performance on thebasic sectors is mostly based on other Bank reports. Appendices 3 and 4 are based on papersprepared for this report by the Petroleum and Economic Consultants at the EconomicsDepartment of Aberdeen University (AUPEC) in Scotland.
This report incorporates comments on previous drafts provided by DonnaDowsett-Coirolo, Frank Lysy, Demetris Papageorgiou, Homi Kharas, Sebastian Edwards,Suman Bery, Paul Meo, Miguel Rodrigues (Peer Reviewer), and Lorenzo Perez and RobertoRosales (IMF).
The Management Team in LA2 includes: Edilberto L. Segura (Director),Donna Dowsett-Coirolo (Division Chief), and Frank Lysy (Lead Economist).

VENEZUELA CEM: LIVING WITH OILEXECUTIVE SUMMARY
1. This report analyzes economic policy and perfonnance in Venezuela since 1970,focusing on the influence of international oil markets on government policies andmacroeconomic performance. Today, oil GDP is about 22 percent of Venezuela's totalGDP, oil exports are about 78 percent of all merchandise exports, and oil taxes and revenuesare about 61 percent of total revenues. The report suggests various policy options tostrengthen macroeconomic management to stabilize the economy, support sustained growth,and reduce the incidence of poverty, in the context of a development strategy which woulddepend less heavily on the vagaries of the world oil market.
Part I. The Past: Economic Policy and Performance
2. Economic policy for decades has had two distinctive features: spending rosewith transitory increases in oil prices and oil tax revenues; and the government intervenedextensively in the economy through direct participation in productive activities and extensivecontrols and regulations. At different times there have been controls on investment, domesticprices, interest rates, and imports; and in some sectors the government determined the levelsof industrial production.
3. This policy generated fiscal deficits, as higher levels of spending frequently weremaintained even after oil revenues could no longer support them. Economic growth sufferedand inflation increased. Per capita real GDP fell every year from 1978 to 1985, and by thelate 1980s, a large proportion of Venezuelans were living in poverty and income distributionhad become highly skewed.
4. The level of savings and investment Mr se has not been at the core of theproblem. Quite the contrary, Venezuela's savings and investment rates have been higherthan in many other developing countries, but these investmnents have not supported higheconomic growth. The increase in overall annual GDP averaged only 2.5 percent from 1970to 1991 and per capita GDP declined. This poor performance to a large extent is due to thenature of the investments and the environment in which they were made, as well as to labormarket, social security, and energy pricing policies, which were responsible for a decline intotal factor productivity and economic growth.
5. Public spending in Venezuela has been highly inefficient, partly due to the largesize of the public sector itself. Public institutions are further weakened by deficiencies in theorganization and structure of the budget, by excessive centralization in decision-making, andby inadequate coordination among units. These problems make it extremely difficult for thegovernment to meet increasing demands for public services and poverty alleviation. Sectoralperformance has suffered as a result of inefficient resource use, causing deterioration inhealth and education services and in maintenance of basic infrastructure.

- ii -
6. Public investments and government transfers have supported state-ownedenterprises (SOEs) during the last 20 years. Large investments for the expansion of manysectors, including steel, aluminum, and petrochemicals, were an attempt to diversifyproduction away from oil. However, most of these investments have yielded poor returnsand Venezuela's economy is still highly dependent on oil. Public investments in the oilsector have averaged 6 percent of GDP from 1975-93.
7. To halt this decline, the government changed the composition of expendituresafter 1988, restructuring ministries and SOEs, and moving towards greater privatization anddecentralization. Together with the liberalization of domestic prices, trade, and finance anda more favorable foreign investment regime, these changes facilitated private participation insome sectors.
8. On the revenue side, oil continues to be the main source of financing for bothcurrent and capital government expenditures in Venezuela. Taxes and royalties imposed onthe oil sector have averaged 68 percent of all revenues since 1973, but this is not likely to besustainable over the medium-term, because world oil prices have fallen in real terms to levelsbelow those of 1973, and PDVSA, the national oil company, faced with a decline in the ratioof operational revenue to expenses, is finding it increasingly difficult to transfer such aproportion of funds to the central govermnent. At the same time, non-oil tax revenues havebeen decreasing. Tax receipts from non-oil activity peaked at 11 percent of GDP in 1983and decreased to 4.4 percent in 1990, principally because of income tax evasion and theerosion of the tax base by inflation.
9. In 1989, the Perez government introduced a stabilization and adjustmentprogram, predicated on the assumption that oil exports could no longer be so heavily reliedon to finance economic growth. From 1990-92, these reforms produced positive economicresults. After an 8 percent decline in GDP in 1989, the economy grew at an average annualrate of 8 percent, inflation stabilized at an annual rate of about 30-32 percent, and theincidence of poverty declined. However, two attempted military coups in 1992 and theremoval from office of the President in 1993 on corruption charges slowed action on thereform agenda. Despite some progress in 1993 in implementing new non-oil taxes and a newbanking law, the agenda was essentially left unfinished. By end-year 1993, the economy hadcontracted about 1 percent vis-a-vis 1992, the central government's fiscal deficit reached 3.3percent of GDP, and inflation rose to 45 percent.
Part H. The Present: Recent Developments and Main Outstanding Issues
10. The new Government which took office in February 1994 was elected with only30 percent of the electoral vote, and the President's party holds only a small number of seatsin Congress. Nevertheless, the President enjoys widespread popularity and his administrationdid win passage of an Enabling Law in April 1994 that allowed it to start implementing anew tax package to deal with the serious economic conditions which it had inherited, and the

- iii -
prospect of a sharp increase in the fiscal deficit associated with a major crisis in the bankingsystem in early 1994.
11. General macro-economic difficulties in 1993, compounded by bad managementand inadequate regulatory oversight, led to the collapse of Banco Latino--the country'ssecond largest bank--in early January 1994. Following this, the Central Bank found itnecessary in the spring to provide financial assistance to eight other mid-size banks throughFOGADE, the deposit insurance agency. Total emergency assistance to the banking systemin 1994 amounts to about US$6.1 billion and has led to a 1994 fiscal deficit of theconsolidated public sector, of about 17 percent of GDP.
12. By mid-1994, Venezuela was heading for record levels of inflation, the result ofthe fiscal imbalance, the banking crisis, and the management of monetary and exchange ratepolicy. The Central Bank found it difficult to accommodate a large decline in moneydemand early in the year, causing the inflation rate to increase and the Bolivar to appreciatethrough March. The crawling-peg foreign exchange system was replaced by two differentauction systems in April and May 1994. Through these auctions the nominal exchange ratechanged from 117 Bs per US$ at end-April to 165 Bs per US$ at end-May, 1994, leading toa more competitive real exchange rate.
13. On June 27, 1994, further policy changes took place, including fixing theexchange rate at Bs 170 per US$, foreign exchange allocations, and price controls on a largenumber of food and services. The Government's rationale for these measures were to protectthe stock of foreign exchange reserves and reduce inflation and interest rates. Inflation hadreached an annualized rate of 181 percent in June.
14. The central administration deficit was only 2.6 percent of GDP in 1994, but thedeficit of the consolidated public sector was much larger (15.4 percent of GDP) because ofthe SOEs' continuing losses, the Central Bank's assistance to the banking sector, and theGovernment's outstanding arrears with the private sector from the 1993 budget. Aggregateoutput contracted for the second year in a row and inflation reached an annual rate of 71percent by year-end 1994. In 1993, higher inflation rates and the decline in money demandled to higher nominal and real interest rates on BCV zero-coupon bonds, used as referencefor other market-determined rates. However, since April 1994, real interest rates have beensignificantly negative; because of the Govermnent's monetary policy after the implementationof the foreign exchange and price controls. Unfortunately, while higher real interest ratesearlier in 1993 probably depressed economic activity, negative real interest rates since mid-1994 discourage savings and foster inflationary expectations.

- iv -
Part m. The Future: A Strategy and Economic Outlook
15. The Government's broad objectives of creating productive employment in theformal sector and reducing poverty through sustained growth and a more diversifiedeconomy, can be attained with policy changes to achieve a balanced budget, lower inflation,and a market-determined and more competitive real exchange rate.
16. In September 1994, the Govermment announced the "Corrales Plan", a neweconomic plan for the short- and medium-term. The main components of the plan's short-term strategy aimed at resolving the problems left by the banking crisis and reducinginflation. If fully and promptly implemented, the Corrales Plan would have reduced thedeficit of the consolidated public deficit to about 1 percent of GDP in 1995. It would havealso reduced excess liquidity in the financial system, which in turn would lead to lowerinflation rates and higher but moderate real interest rates.
17. Today, the Corrales Plan has not been fully implemented. The Plan includedincreases in the general sale tax from 10 to 15 percent, increases in domestic fuel pricesincluding gasoline to export opportunity levels, and new long-term bonds (10-years maturity)to be placed in the domestic market. Until these measures are fully implemented, theGovernment's stabilization objectives will be seriously jeopardized. The economic outlook inChapter 2 discusses specific policy targets and their projected economic impact over themedium-term.
18. The Government recognizes that a better fiscal stance would change thepublic's expectations of high inflation. That is why it plans to increase non-oil taxes, raisegasoline prices and avoid unwarranted salary increases and subsidies to interest groups. Inparticular, the 1995 fiscal budget--approved by Congress in early December 1994--includesan increase in the general sales tax rate from 10 to 12.5 percent. It also includes smallgasoline price increases; unfortunately, these will not be enough to fully eliminate domesticgasoline subsidies, which amount to at least 3.4 percent of GDP. Moreover, before anygasoline price increases take place, the Government wants to implement a new program ofdirect subsidies to lower income groups. Although, this program is welcome, itsimplementation details and timetable have not been announced yet.
19. Monetary policy would also play a key role in the stabilization effort. Inparticular, the path of monetary aggregates that can be controlled, such as the monetary base,needs to be consistent with a permanent decline of inflation to single digit levels. (This alsoimplies that there would be no need for the monetary authority to try to control interestrates.) The proposed new domestic long-term bonds will have a longer maturity than thezero-coupon bonds. By issuing these new bonds, the Govermnent hopes to reduce excessliquidity generated by the banking crisis, and facilitate the Central Bank's management ofmonetary policy.

- v -
20. To complement these stabilization measures, and prevent further disruptions inthe banking sector, the Government should continue its financial assessment of the non-intervened banks. It will also be important to encourage these banks to accept a three-yearrecapitalization plan as necessary and to comply in full with the new Banking Law. Inaddition, FOGADE, the Government's deposit insurance agency, needs to be suitablysupported to make the guarantee system credible; and FOGADE needs to start selling thebanking sector assets it recently acquired, as soon as possible. The proceeds of these salescould be used to recapitalize FOGADE and would reduce the Government losses from thebanking sector crisis.
21. Finally, for stabilization to succeed, fiscal and monetary improvement needto be accompanied by a return to a floating exchange rate. With a floating exchange rate, aCentral Bank policy to accumulate net foreign reserves would support a higher real exchangerate, promote export diversification, and avert a deterioration of the fiscal situation. The realappreciation of the Bolivar in the first half of 1995 has not helped to restore stability, and ifsustained, it would damage growth in non-oil activities and much needed productiveemployment.
22. To resume sustained growth, Venezuela needs to increase factor productivity,and encourage domestic savings, investment, and employment in the formal sector. This, inturn, will depend on a prompt return to foreign exchange and price liberalization, a strongcommitment to an open trade and financial environment, and action to change the legal,taxation, and institutional aspects of the oil, electricity, and mining sectors. It is alsonecessary to increase tax collection. To this end, implementation of the corporate asset tax(CAT) that became effective in January 1994 with a rate of 1 percent as a minimum incometax should be accelerated. By taking the average value of corporate assets and a tax rateequivalent to the income tax rate, the CAT is expected to close the loopholes typically usedby corporations to avoid the income tax, particularly during periods of high inflation. A taxrate of about 1 percent on gross assets would not exceed what the private sector actually payson the income tax in the aggregate. Hence, there would be no impact on those corporationsthat currently pay the income tax, but those that have evaded the income tax would beaffected. The Ministry of Finance would start collecting CAT revenues only in 1995,because it did not ask for a "declaraci6n preliminar" during 1994.
Medium Term Policies
23. The Government's medium-term policies aim at reducing inflation, promotingsustained growth, and reducing poverty. An appropriate combination of fiscal, monetary andexchange rate policy, would lead to lower levels of inflation, a more competitive realexchange rate, and higher levels of domestic savings and investment. These policies andchanges in public spending from oil and industrial sectors to social sectors and basicinfrastructure will promote non-oil growth. The expansion of the non-oil sectors and the
- vi -
greater emphasis on good-quality basic education and health, would promote employment inthe formal sector and reduce poverty.
24. The Govermment's program considers that non-oil revenues would increasethrough greater reliance on non-oil taxes and efficient energy pricing policies. Currentspending needs would decline, if the Government promotes spending efficiency throughdecentralization and privatization. This would require policy changes in labor market andsocial security regulations, and in the legal and institutional arrangements of several sectors.
25. The Government may want to consider the re-introduction of a VAT at alldistribution levels because this tax has revenue potential and is both neutral and non-discretionary. The rate can be changed as necessary to adjust revenues to spending needs.Other advantages of the VAT are that its application is progressive, increasing with income,and that a full-scale VAT with debits and credits at all distribution levels will help preventtax evasion. In this sense it would represent an improvement over the new GST.
26. In 1994, there was some progress in reducing the minimum income subject to theincome tax and in eliminating many exemptions. However, the excessive exemptions foreducation and medical expenses remain, and the Government is planning to ask Congress toeliminate them in 1995. At the same time, payroll taxes must decline to make themcompatible with other income taxes. Other fiscal reforms on the revenue side may includeixnproving customs administration to increase import tariff collection and adding transparencyto the trade regime.
27. The proposed tax changes are likely to be effective because the taxadministration is now being modernized; an independent tax administration unit with its ownpersonnel recruitment and compensation practices is helping in this process. Simultaneously,the judicial system must be able to enforce the collection of tax penalties.
28. The Govermment needs a program to cover its losses from the banking sectorcrisis; this could include privatization and additional non-oil taxes. However, theadministration has first to assess the extent of the losses to develop the specifics of itsfinancing plan. Additional fiscal revenues are required to strengthen and modernizeFOGADE and the Banks Supervision Agency.
29. To increase the efficiency of public spending, the Government may want toreduce the downward rigidities in spending. The budget should also include a mechanism toprevent over-spending when unexpected increases in oil prices occur. To this end, theannual budget might be based on multi-year projections that take into account the expectedchanges in international oil markets. The ex-post reviews of the budget should be morethorough.

- vii -
30. There is a need to adjust the structure of expenditure within many sectors, asbetween wages and salaries, and other inputs. This would mean reducing total public sectoremployment and changing the present recruitment and compensation practices, as well asreforming the social security system. The pattern of allocations among sectors should alsobe revised. Privatizing SOEs and allowing large private investment in the oil sector wouldlead to more efficient resource use, and will increase the Government's resources availablefor its priority areas such as education, health, poverty alleviation programs, and basicinfrastructure.
31. Improvements in the institutional, legal, and economic environments of thepetroleum and other sectors are necessary to encourage private investment. A profitableprivate sector would promote efficient, sustainable economic growth, and raise governmentrevenues from corporate income taxes.
32. Today, oil production- and profit-sharing agreements with private sectorparticipants are being pursued for fields containing heavier crudes-'. Private investment inthe oil sector will soon be encouraged in all areas. PDVSA has prepared a new legalframework (now under discussion at Congress) which would allow it to engage in jointventures with private (domestic and foreign) investors in the exploration and production oflight and medium crudes. The technically and financially qualified private investors willparticipate in a bidding process, and the winners will be determined on the basis of howmuch they are willing to contribute to the public finances through profit-sharing. This newframework would no doubt be a step in the right direction to open up the oil sector to privateparticipation.
33. The recommendations of this section go a step further, to make the oil legal andtaxation systems more flexible than already envisaged by PDVSA. These measures arenecessary to make the best out of Venezuela's natural resources and provide the population atlarge, the largest benefits.
34. Oil Sector Investment Program. Many of the new projects proposed in thePDVSA's 1993-98 Five Year Investment Plan would benefit substantially from privatefinancing and participation. PDVSA would benefit from concentrating on areas where lightand medium crude oil reserves are likely to be sizable, and on fields with a history of higherper well productivity. Consolidating several fields into one large area, for example, wouldoffer a private operator a significant crude oil production base, while evaluating surroundingareas for additional reserves would provide investors with "upside potential". Finally,
1/ These crudes make up a large portion of proven reserves and are costlier toextract, because they need more sophisticated technology than other crudes andhave lower per well productivity.

- viii -
efficiency would increased by the privatization of the distribution and sale of refined productsand natural gas, and expansion of refinery capacity.
35. Oil Sector Legal Framework. Venezuela's legal framework gives the state amonopoly on hydrocarbon operations and allows private involvement only under highlyrestrictive circumstances. Venezuela still offers only two options for private participation inhydrocarbon operations: through operations contracts or association contracts with PDVSA;the proposed new framework prepared by PDVSA maintains this limitation. Operationscontracts typically provide a service such as drilling; association contracts are joint ventures.PDVSA has entered into several joint agreements recently where large investments for newtechnologies are required, but it maintains substantial control by appointing the president ofeach venture.
36. To modernize its legal system Venezuela might want to establish a grantingauthority within the government that could approve exploration rights for qualified bidders.A pre-bidding requirement would ensure that all bidders, domestic or foreign, have thenecessary technical and financial qualifications. Licensees would have the right to undertakesubsequent development and production operations, and to engage in transport and processingactivities as well. The import, distribution and marketing of hydrocarbons may be open toany qualified agent through a competitive process also. The granting authority wouldmanage the bidding process, providing all the relevant information--including the oil taxationrules--to the parties involved. It would be allowed also to issue licenses without legislativeapproval to ensure that contracts do not fall prey to political maneuvering.
37. Oil Sector Taxation. The current oil taxation system applies to PDVSA, a statemonopoly, but its main features were present even before the 1975 nationalization of theindustry. Oil income taxes and royalties exceed 83 percent of net pre-tax cash flow, and thesystem is discretionary because it penalizes promising lower-return projects by basing toomuch of the total tax take on gross production. Today, this system impedes the country'sability to compete internationally for private investment at a time when capital constraintsand declining production from established oil fields prevail.
38. The Government may want to replace the present system with one that isprogressive and profits related because of the range of costs inherent in the production oflight to heavy oils, and because of substantial market variations in the value of this range ofcrudes.
39. A new set of fiscal terms may incorporate a sliding scale of royalties that wouldcontinue to ensure the government a minimum revenue from every unit of oil produced, yettake into consideration the quality of the oil extracted. Income taxes for all petroleumactivities may be reduced to make them consistent with those for other economic activities,and the phasing-out of the export reference price should be completed. A petroleum surtaxmay be charged on a field-by-field basis. This would be a profit-related tax that secures the

- ix -
government's share of rents earned in excess of normal operations. These new fiscal termscould be applied to all ventures signed after the terms have received congressional approval.
40. Venezuela needs a unified system of oil taxes and royalties for both the publicand private sectors. However, in the short term, it will not be advisable to reduce the levelsof taxation on PDVSA beyond the phasing-out of the export reference price (already inprogress). This is because the institutional and administrative relationship between thecompany and its only shareholder must first be modernized to increase transparency andaccountability. The taxation system recommended here could be applied to the private sectoras soon as the legal, institutional, and administrative details are worked out by theGovernment.
Economic Outlook
41. The medium-term outlook (1995-98) was developed under reform case and lowcase scenarios, using a standard RMSM model. The results are consistent outcomes, underexpected international economic conditions and parameters of the domestic economy. Thereform case assumes that an economic program, like the one announced in September 1994,and the recommendations made here are fully and promptly implemented, while the low-caseassumes that this will not happen.
42. In the reform case, by 1997 the central government's fiscal accounts arebalanced and inflation is lower than in 1994. The fiscal adjustment and lower inflationsupport an increase in the real exchange rate, although this increase will be less thanotherwise because of foreign capital inflows that will cause the currency to appreciate. Amore competitive real exchange rate and lower domestic interest rates should lead to anexpansion of economic activity, especially of tradables and non-oil exports. Starting in 1996,per capita income and consumption increase every year and poverty declines.
43. Under the low case scenario, there is a deterioration of the fiscal accountsbecause little reform takes place, and the domestic debt service increases as a result of theGovernment's assistance to the banking sector. The central government's deficit increasesfrom 2.6 percent in 1994 to 5.9 percent of GDP in 1995 and remains high through 1998.Moreover, the deficit of the consolidated accounts is much larger because of banking sectorlosses. In this case, inflation remains higher than the historical levels and the real exchangerate appreciates. Growth stagnates through 1998 and investment and savings rates remainbelow historical levels. The privatization program does not advance and foreign investmentand financing is significantly lower than the early 1990s levels. In this economicenvironment with high inflation and low growth, per capita income declines every yearthrough 1998 and poverty increases.

Chapter 1. Economic Overview
L.A Introduction
1.1 This chapter identifies the main areas of economic reform for sustainedgrowth. It also describes economic policy and performance in Venezuela from 1950-93,reviews the oil market's influence on government decisions, and discusses the impact ofpolicies on oil and non-oil growth, inflation, and poverty. It concludes with a description ofVenezuela's political economy and recent developments.
1.2 Oil and the Venezuelan Economy. Since the early 1970s, changes in theinternational oil market have significantly affected economic growth in Venezuela, first,through the linkages between the domestic oil and non-oil sectors and second, through theirimpact on the government's fiscal, foreign exchange, and energy pricing policies. Economicgrowth has also been influenced by the government's labor market and social securityregulations.
1.3 Today, Venezuela's economy is still highly dependent on oil, in spite of largedeclines in the oil price after 1982. In 1993, oil GDP was about 22 percent of total GDP,oil exports were about 78 percent of merchandise exports, and oil taxes and royalties wereabout 61 percent of total fiscal revenues. This oil dependency and the linkages between theoil and non-oil economies have contributed along with economic policy to low economicgrowth rates (Figure 1.1).
Figure 1.1
CM gnU Nsndo Re SP Guowt IUI1POni Pffo.nQ
,\ I , \,
.i&.\ I
4&W' 01 GOP
.M. lt_ OU:tt__SO4Pl
N~IH e..h.a 1t*w_ pt. SMuu ee. _mn_pe

- 2 -
1.4 Structural changes in many oil-producing countries accompanied the decline inreal international oil prices from 1982-93 after the large price increases of the 1970s(Figure 1.2). In all of the countries included in Table 1.1, oil export shares increased from1970-81; except in Venezuela which, consistent with OPEC policies, reduced oil productionand exports. In contrast, from 1981 to 1991 all these countries except Venezuela reducedtheir dependency on oil exports. Only Venezuela and Nigeria received a higher share offiscal revenues from oil taxes and royalties at the end of the period.
Table 1.1: Oil as a Share of Exports and Fiscal Revenuein Selected Countries; 1970-91
Oil Exports Percent of Totalas a share of fiscal revenuetotal exports provided by oil taxes
1970 %
Indonesia 44 35
Nigeria 62 26.3
Malaysia 30 n.a.
Mexico 19 4.4
Venezuela 97 60.7
1981
Indonesia 83 70
Nigeria 91 81.1
Malaysia 36 19.6
Mexico 78 29.5
Venezuela 97 86.6
1991
Indonesia 43 37.4
Nigeria 96 78.1
Malaysia 17 9.0
Mexico 41 19.4
Wnezuela 86 90.5
Sources: Annual Report and Statement of Accounts, Central Bank of Nigeria, etc., variousyears.National Accounts Statistics: Maui Aggregates and Detailed lhbles, United Nations.various years.RMF Goverrnment Financial Statistics Yearbook, various years.

1.5 Venezuela's oil sector influences the domestic economy in other ways as well.The 1989 input-output data show that about 2 percent of the value added in manufacturingand about 6 percent of commerce and other services are inputs to oil, gas, and refineryactivities. These linkages have made Venezuela's non-oil economy--especially its non-tradeable sectors--dependent on the growth of the oil sector.
Figure 1.2
SpWt Avwrs Prm d OPEC Cmude ON; 1S043Constant 1O9 U$ and Cununt US$
" ,l9X~~~~~~~3Conswwt$aI
25
480 13 1974 1975 1376 160 13s 1X1 1366 1936 1360 133EOf Umd by Muuiamm ki*VMW )J hU
3 _uD W Bumm D.Whu Bu*
1.6 The dependency on oil has largely determined the government's fiscal, foreignexchange, and energy pricing polices and its labor and social security regulations. Thesepolicies have had a negative impact on the fiscal accounts and on economic growth.
1.7 During the early 1970s, high oil revenues enabled the state to applydiscretionary rather than market-oriented policies. In consequence, for most of that decadeand the next the economy was characterized by excessive government controls and directgovernment involvement. The public at large received highly subsidized goods and services,and their elimination has become a difficult economic and political issue.
1.8 Taxation of oil production and exports has been a major substitute for othersources of fiscal revenue, but this arrangement could not be sustained when oil prices fell.There is still no consensus among Venezuelans on how and how fast to now raise non-oiltaxes. But oil tax payments declined from 14.4 percent of GDP in 1984 to only 10.1 percentin 1993 while non-oil tax collection has not increased significantly yet.
1.9 In 1993, the caretaker government of President Velasquez introduced a new,value added tax (VAT) and a corporate asset tax (CAT), but the elected government of

President Caldera that followed suspended implementation and proposed to Congress a newversion of the VAT excluding transactions at the small retail level. Other new taxes recentlyproposed, such as luxury and financial transaction taxes, have been justified as mostlyaffecting the wealthier segments of the population. In reality, the luxury tax is likely to yieldvery little revenue and the financial transaction tax will be paid by large segments of thepopulation. Meanwhile, the most important sources of regressivity in the fiscal revenuesystem are high payroll taxes, exemptions on the income tax for corporations, and lowgasoline prices, and these still remain.
1.10 Labor markets and social security regulations play a critical role in fiscalpolicy. The govermnent has become highly dependent on payroll taxes paid mostly byworkers, while collection from income taxes is very low at about 1.5 percent of GDP.Because of exemptions, only the highest income groups pay any income taxes at all. Thesystem of payroll taxes has a very negative impact on the purchasing power of workers,while higher income groups do not contribute significantly to the financing of publiclysupplied goods. Workers also make contributions to the social security system, which isexpected to provide them with health services, unemployment insurance, and retirementpensions. In reality, the social security system is practically insolvent and large segments ofthe population do not receive adequate services.
1.11 Venezuela's labor and social security regulations have also had an adverseimpact on economic growth. These regulations were originally established to protect theinterests of the working classes, but they have increased the price of labor while laborproductivity has declined. In the process, informal markets have expanded along with theincidence of poverty.
1.12 Since the early 1980s, the government's provision of services to largesegments of the population has declined, both because of its operational inefficiencies andbecause oil revenues--the main source of public services financing--have dropped sharply.Moreover, extensive government involvement in activities outside its main responsibilities,the social sector and basic infrastructure, has diverted a large share of public spending toinvestments by public enterprises, particularly the oil company, PDVSA. Today there is stilla large agenda for privatization of industrial activities, and public sector reform is stillpending. These changes would increase efficiency in many sectors and help to eliminaterigidities in the government's budget. Labor market and social security reforms wouldfacilitate the implementation of these changes.
1.13 The public's unfulfilled expectations of government intervention havepoliticized the debate on pricing policies for publicly supplied goods and services. At thecore of this debate is the relationship between the central government and PDVSA. Forexample, elimination of gasoline subsidies has proven difficult so far, perhaps because thepublic considers them its share of the oil revenues in the absence of dividend distribution byPDVSA. At about US$0.12 per gallon, gasoline prices are among the lowest in the worldand the associated government subsidies are about 1 percent of GDP. In addition, there are

-5-
major cross-subsidies of electricity favoring residential consumers at the expense of theproductive sectors, and water tariffs are well below distribution costs. Even when publicservices are privatized, with clear concession agreements as in the case of telephones, thegovernment has proven reluctant to maintain real tariffs consistent with its market-orientedundertakings.
1.14 The impact of the government's inappropriate pricing policies is shown in thedecline in productivity growth in the industrial sector.'' Moreover, the fuel, electricity, andwater subsidies are very regressive because they favor mostly the middle and upper incomegroups, who have automobiles for personal use and water and electricity connections in theirhouses.
1.15 Poverty Alleviation. Poverty increased after 1982 as economic activitydeclined and informal employment grew-'. Social and political factors are also contributingto the deterioration in living standards. For example, several groups have used unsettlingpolitical events as an argument to delay economic policy changes likely to have a negative, iftemporary, impact on the living standards of middle and upper income groups but mightbenefit lower income groups. Similarly, some do not see the need to reduce dependency onoil revenues, and fail to recognize that temporary increases in the terms of trade cannot be anexcuse to delay long-awaited permanent changes in fiscal and monetary policy, energypricing, labor markets, and social security.
1.16 While the economic policy debate continues, the poor are afflicted by thedeterioration of the public health and education systems, the lack of adequate water andsanitation facilities, the difficulties of public transport, and the way the labor market andsocial security system operate. High inflation rates have eroded the impact of the targetedsocial programs, whose budgetary allocations have declined in real terms.
1.B Historical Baclground
1.17 Government spending for decades had been adjusted upwards as transitoryincreases in oil prices and oil tax revenues occurred. This policy, used to reactivate theeconomy, was accompanied by direct government participation in productive activities andexcessive controls and regulations, as pointed out earlier. The government regulated theeconomy through controls on investment, domestic prices, interest rates, imports, and foreignexchange, and even made decisions on levels of industrial production.
1/ See Paredes, Carlos E., 'Productivity Growth in Venezuela: The Need to Break with the Past,"unpublished, August 1993.
a/ See Morley, Samuel A. and Alvarez, Carola, Poverty and Adiustment in Venezuela, Inter-AmericanDevelopment Bank, Working Paper Series 124, July 1992, Table 2, p. 6.

1.18 As a result, economic growth declined and inflation increased, fiscal deficitsarose because spending levels were frequently maintained even after oil revenues could notsupport them,3' and real per capita GDP fell steadily from 1978 to 1985. By 1988, a largeproportion of the population was living in poverty and income distribution was highlyskewed.
1.19 By the time of the stabilization and adjustment program in 1989, thegovernment saw that oil exports could no longer be relied upon to finance economic growth.The Perez administration set about opening up the economy and reducing state intervention,controls, and subsidies that had distorted economic incentives for many years.Unfortunately, the unfinished program was stalled in 1992 by political developments andimplementation problems. The caretaker government of President VelAsquez continued partof the structural changes in 1993, implementing new non-oil taxes and new financial sectorregulations. The Caldera Government, which took office in early 1994, has faced verydifficult economic conditions, aggravated in part by a major financial sector crisis.
1.B.1 Economic Policy and Performance Before the Oil Shocks
1.20 During the 1950s, average annual GDP growth was 7.9 percent, the volumeand value of petroleum exports increased each year, and the country enjoyed swift expansionof its physical infrastructure and industry. However, in spite of high economic growth andan increase in real per capita income of about 57 percent between 1950 and 1957, incomeinequality was greater in 1957 than in 1950.4'
1.21 The ouster of Marcos Perez Jimenez in 1958 marked the end of militarydictatorship and the arrival of democracy. The new government, bent on improvement in thesocial sectors, started projects for low-cost housing and health facilities.5'
1.22 From 1950-72, annual inflation averaged only 2 percent and the economy grewat an annual average rate of 6.4 percent.0' Growth of non-oil GDP, due in part to theprotection given to industries such as steel, aluminum, and petrochemicals, contributed to theeconomic expansion. The share of imports in private consumption fell from 30 percent atthe end of the 1950s to 3 percent in 1970.
3/ Data on the fiscal deficit before 1988 refer to the central government only. Starting in 1988 the figuresindicate the result of the consolidated public sector "consolidado restringido". This includes the centralgovermnent, non financial state-owned enterprises, and the oil company PDVSA and its affiliates; itexcludes the local (state and municipal) governments.
4/ Blutstein, Howard 1. Area Handbook for Venezuela, 1976, p.82.
5/ Haggerty, Richard A., Venezuela: A Country Studv, 1993, p. 83.
6/ Elfas, Victor, Sources of Growth: A Study of Seven Latin American Economies, 1992, p. 50-51.

-7-
1.B.2 Economic Policy and Performance in 1973-82: The Oil Shocks
1.23 The first administration of Carlos Andres Perez, faced with an oil windfall ofunprecedented proportions in 1973, promised to "manage abundance with the mentality ofscarcity,"2' and promptly established the Venezuelan Investment Fund (FIV) to reserve partof the windfall and thus avoid excessive government spending.
1.24 However, in its attempt to distribute the new income among Venezuelans, thePerez administration soon forgot its promise of moderate spending. It introduced pricecontrols on food and other commodities, authorized wage increases, and imposed foreignexchange controls to subsidize imports. Its subsidies took other forms as well; in 1974, forexample, it canceled US$350 million in debts owed by farmers to state agencies.
1.25 The government assumed the role of primary engine of economic growth. ItsFifth National Plan, financed with high oil revenues, included US$52.2 billion in investmentsover a five-year period, implying a major increase in the government's responsibilities. InAugust 1976, Congress approved a bill nationalizing the petroleum industry; from then onexpansion of petroleum production was at public expense.
1.26 From 1973-78, average non-oil GDP growth was about 7.9 percent, but arapid increase in government spending led to a fiscal deficit approaching 5 percent of GDPby 1978. Inflation accelerated in 1973, doubled in 1974 to 8.3 percent, and rose further in1975 to 10.3 percent. Despite this, the official foreign exchange rate was maintained at 4.3Bolivars to the dollar. As the Bolivar appreciated, Venezuela ran a current account deficit ofabout 14.5 percent of GDP by 1978. In the end, the oil bonanza did not translate into anaccumulation of public foreign assets in net terms.
1.27 The Perez administration's ambitious plan did not improve income distributionor even reduce poverty. Income distribution was less equitable in 1976 than in 1960, andalthough real per capita GDP in 1975 was over US$5,000 (the highest in Latin America),about 40 percent of the population was ill-fed and undernourished.
1.28 The Herrera administration upon taking office in early 1979 promised tofollow an austere fiscal policy-'. It reduced spending, including consumer subsidies,increased interest rates to encourage savings, and eliminated price controls to foster privateeconomic activity. However, when the Iran-Iraq war caused oil prices to jump from US$17per barrel in 1979 to US$28 in 1980, the government abandoned its austerity measuresbefore they had a chance to yield results.
7/ Haggerty, Richard A., Venezuela: A Country Stud , 1993, p. 32.
8/ World Bank, Economic Memorandum on Venezuela, Report No. 5016-VE, 1985, p. 4.

1.29 The lack of private sector confidence in the administration's policiescontributed to a significant decline in GDP growth from an annual average of 6 percent from1974-78 to minus 1.2 percent from 1979-83. Capital flight occurred from 1980 onwards, inpart because of the increased attractiveness of foreign interest rates relative to domestic rates,and in part because of the continued real appreciation of the Bolivar. The large differentialbetween the free market and official exchange rates (7 Bolivars to the dollar in 1980 against4.3 Bolivars to the dollar) led to expectations of a devaluation of the official rate.
1.B.3 Economic Policv and Performance after the Oil Shocks
1.30 In 1983 the economy was in recession, and the new government of JaimeLusinchi (1984-89) attempted to reverse the crisis. It increased public spending, from 21percent of GDP in 1983 to 26.5 percent in 1988, despite continued reduction in oil revenues,and it also increased import protection as well as producer and consumer subsidies.Moreover, in 1983 the monetary authorities introduced a complicated four-tier exchange ratesystem that provided special subsidized rates for certain priority activities (debt service, andessential imports) and for oil export receipts and established a "free rate" to reflect theBolivar's true purchasing power. This system prevailed through early 1989. Domesticinterest rates were allowed to increase to reflect market conditions, and as a result thedomestic public debt service increased also. These policy changes stimulated a modesteconomic recovery from 1985-88.
1.31 In 1986, however, a further drop in oil prices triggered a fiscal deficit of about5.4 percent of GDP, as oil revenues fell from an average of US$13.9 billion in 1984-85 toUS$7.6 billion in 1986. Nonetheless, the government maintained its expansionary policy,and in 1988, the fiscal accounts showed a deficit of about 7 percent of GDP. Less restrictivefiscal policy also caused price increases; annual inflation rose from 11.5 percent in 1986 to28 percent in 1987. The negative balance of payments trend that began in 1986 with adeficit of US$3 billion was mainly the result of falling oil prices, but was also due to capitaloutflows and higher external debt interest payments.
1.B.4 Economic Pblicy and Performance after 1988: The Reform Years
1.32 By the late 1980s, the fundamental damage done by almost two decades ofeconomic mismanagement was exposed. In 1988 foreign reserves had fallen to 2.5 monthsof imports (the lowest since 1973), annual inflation was 60 percent and increasing, theconsolidated public sector deficit was 9.4 percent of GDP, and Venezuela could not serviceits external obligations. There were shortages of many goods and living standards hadplunged. Between 1980 and 1989, real GNP per capita had fallen every year despitecomparatively high oil prices until 1985, and the percentage of the population living inabsolute poverty increased, according to one study, from 4 percent in 1980 to 13 percent in
-9-
1989.2' Poverty may have been even more widespread than this. Other studies put thefigure as high as 60 percent in 1989.)'
1.33 Against this background, President Carlos Andr6s Nrez started a major reformprogram of which the cornerstone was stabilization, liberalization of trade and finances, pricederegulation, privatization, and new social sector programs. The stabilization programincluded reforms in both fiscal and monetary policy and the foreign exchange regime.ll'Multiple exchange rates were unified and the exchange rate left to float to an equilibriumlevel, which reached 43 Bolivars to the dollar by the end of 1989, three times the rate on theeve of the program. This amounted to a large real devaluation, which increased oil taxes inlocal currency terms. As a result, the tax paid by PDVSA to the central governmentincreased from 11.4 percent of GDP in 1988 to 20.5 percent in 1989. There was also asmall fiscal improvement from reduced capital spending by the central government.
1.34 The monetary authorities did not use open market operations nor changereserve coefficients to compensate for or add to the monetary impact of the fiscal shock.Monetary policy was neutral in allowing the fiscal improvement to translate fully into acorresponding decline in the stock of nominal money. In the first nine months of 1989, realmoney supply (M,) fell by 47 percent and interest rates, freed by the plan, increased sharplyto positive real levels. During the last quarter of 1989, a change in monetary policy mayhave exacerbated inflation. Once inflation declined, the authorities expected cash balanceswould return to pre-reform levels. They expanded the monetary supply well beyond theincrease in prices, believing this was consistent with a continuous decline in inflation. Theincrease in money supply, however, turned out to be inconsistent with declining inflationbecause the velocity of money remained high. The trend in declining inflation was thusreversed during the last quarter of 1989.
1.35 The completion of a 1990 Debt and Debt Service Reduction agreement withcommercial banks led to a permanent cut in external interest payments on outstanding debts,rekindled international confidence in the economy, helped the privatization program along,and attracted direct foreign investment in 1991-92. By the end of 1990, the fiscal andexternal accounts showed large surpluses due in part to windfall oil earnings because of theGulf War. This improvement in the external accounts has been sustained, even with loweroil prices, due in part to non-oil exports growth. Foreign exchange reserves increased toabout US$15 billion in 1991, and remained comparatively high at about US$12 billion in1992. The fiscal position, however, deteriorated. In 1992, despite a reduction in central
9/ World Bank, Poverty and Income Distribution in Latin America: The Story of the 1980s, 1993, Thbles2.1 on p.16 and 4.1 on p.58.
10/ Morley, Samuel A. and Alvarez, Carola, op. cit.
11/ World Bank, Venezuela: Structural and Econoniic Relforms--The New Regime, Report No. 10404-VE,1993, p. 47.

- 10 -
government expenditures of about 3 percent of GDP, the fiscal accounts showed a 6.1percent deficit because lower oil exports yielded lower fiscal revenues and Congress wasslow to approve new non-oil taxes.
1.36 Reductions in the number and level of import tariffs and licenses and abolitionof foreign exchange controls accompanied the unification and floating of the exchange rate.Today, non-tariff barriers affect only about 2 percent of domestic production, while theaverage tariff has been cut from 37 to 16 percent and the maximum from 135 to 20 percent.Licensing of agricultural imports has been greatly reduced, too, but some commodities havevariable tariffs to maintain a minimum domestic price. The trade regime includes severalbilateral free trade agreements with Latin American countries; the latest one with Colombiaand Mexico was signed in June 1994.
1.37 Financial sector reforms were aimed at reducing the government's role in thepricing and allocation of credit, while strengthening the Central Bank's ability to control themonetary aggregates. Initially, the government tried to fully liberalize interest rates, but thiswas declared unconstitutional. As a compromise, in April 1990, the Central Bank - BancoCentral de Venezuela (BCV) - set the minimum rate for deposits at 10 percent and themaximum lending rate at 60 percent, a spread which allowed sufficient scope for markets todetermine interest rates at prevailing inflation rates until 1993. In early 1993, the lendingrate ceiling was replaced by an adjustable level of no more than 20 percentage points, and inearly 1994 to no more than 15 percentage points, above the Central Bank's zero-coupon bondrate. These bonds, offered through public auction since 1990, are the main instrument forCentral Bank open market operations.
1.38 Other financial sector reforms included elimination of directed credit (exceptfor agriculture), liquidation of many development banks, and elimination of subsidized credit(except for agriculture and housing). Legislation approved by Congress in 1992 freed theBCV's decision-making process from control by other government units. However, otherfinancial sector legislation was approved only in late 1993, too late to avoid the bankingsector crisis started by the collapse of Banco Latino in early 1994. Moreover, theSuperintendency of Banks and the deposit insurance agency (FOGADE) were both hamperedby inadequate budgets and were unable to regulate the banking sector effectively. Inretrospect, a key element of financial reform--the state's regulatory capacity--was missing.
1.39 In 1989, prices of most goods and services were liberalized, including those ofaluminum, steel, and major petrochemicals produced by SOEs. Electricity tariffs wereincreased but were subsequently rolled back in March 1992, after the first coup attempt.Since late 1992, tariff increases in real terms have resumed, although there is still a majorcross-subsidy of residential consumers by larger users. Water and natural gas prices havealso increased, but do not yet cover costs. At the start of reforms the government increasedgasoline prices significantly, but in March 1992 it abandoned its adjustment schedule. Atabout US$0.12 per gallon, the domestic gasoline price is one of the lowest in the world. At

- 11 -
the core of pricing policy is the need to change the institutional features of the water,electricity, and oil sectors to facilitate price adjustments that will reflect market conditions.
1.40 The government has privatized 12 major enterprises, including three banks, 51percent of the telephone company (CANTV), and the international airline (VIASA). It hasliquidated the national ports agency, privatized cargo handling and stevedoring, andtransferred port administration to new regional authorities. It is also liquidating the nationalwater agency and establishing new regional authorities under common guidelines. Through1992, the government had received about US$2.4 billion in privatization proceeds andeliminated transfers to most of the largest SOEs. The pace of privatization has declined after1992, not only because of the political events affecting the reform program, but also becauseinstitutional, regulatory, and pricing policy changes are still pending in several sectors(water, electricity, and oil).
1.41 Although Venezuela's per-capita income and public social sector spendingremain quite high, large sections of the population still live in poverty. In 1989, generalfood subsidies were replaced with programs specifically aimed at lower-income groups toprovide nutritional supplements to pregnant women and their children, expand coverage oflow-cost pre-school options, and aid low-income families with primary school children."a'The new policy was a step in the right direction, but appropriate targeting is still an issue.For example, a disproportionate share of public spending is absorbed by overheads and byhigh cost hospitals and universities at the expense of basic health and education.
1.42 The initial impact of the reforms in 1989 was recessionary, as expected, butmajor macroeconomic imbalances were corrected in less than a year and growth resumedsoon after (Table 1.2). In 1989, inflation fell from about 80 percent in the first half of theyear to 27 percent by December (Table 1.3), but GDP fell by 8.9 percent over the wholeyear. As in the past, oil played a role in the economic results after 1989, but the non-oileconomy's response to reform was clearly positive. From 1990-92, annual GDP growthaveraged 7.8 percent, oil activities expanded by about 8.0 percent, and non-oil activities byabout 7.8 percent. Per capita GDP increased by about 5.3 percent annually. In 1992, oilprices declined and oil GDP contracted by about 0.3 percent, but non-oil activities expandedby about 8.1 percent, evidence of a growing diversification of the economy fostered by thereforms. However, inflation stabilized around 33 percent from 1990-92, a level much higherthan the historical average.
12/ World Bank, Venezuela Poverty Study: From Generalized Subsidies to Tarzeted Programs, ReportNo. 9114-VE, 1991, p. 5.

- 12 -
¶lble 1.2: Macroeconomic Indicators, GDP Shares and Growth Rats; 198-93
1988 1989 1990 1991 1992 1993
Real Growth Rates(Percentages)
GDP 5.8 -8.6 6.5 10.4 5.4 -1.0Non-oil GDP 5.3 -10.5 4.5 10.4 7.4 -1.7Oil GDP 8.0 -0.4 13.9 10.3 -1.2 4.6
GDP per Capita 3.1 -10.9 3.7 7.9 3.1 -2.6Private Fixed Investment 3.6 -32.1 -35.3 75.4 1.9 7.7Non-oil Exports of Goods 27.1 49.3 9.5 -23.2 2.9 24.4
Macroeconomic Balances(GDP Shares Current Prices)
Foreign SavingsBalance on Current Accountexcluding Net Official Transfers -9.6 5.0 17.1 2.9 -6.2 -3.7
Public and Private SectorGross Domestic Investment 28.0 12.7. 10.2 18.7 23.7 18.7
Fixed Investment 22.8 16.9 14.1 17.8 12.2 19.5Public (Fixed) 10.5 9.0 9.2 9.6 8.9 10.5Private (Fixed) 12.4 7.9 4.9 8.2 2.6 9.0
Change in Stocks 5.1 -4.2 -3.9 0.9 21.2 -0.8National Savings 21.0 24.1 29.5 23.4 2.6 18.1Investment minus Savings 6.9 -11.4 -19.3 -4.7 0.6
Foreign TradeImports GNFS 27.4 20.2 26.2 26.2 28.9 26.8Exports GNFS 20.5 33.3 30.9 30.9 26.4 26.2
Change in Foreign Exchange Reserves 8.1 -0.2 -6.0 -6.0 1.9 1.2(-increase)
Memorandum Item:Share of Gross Domestic Investment -10.8 25.9 21.5financed by Foreign Savings (%) 36.0 -53.4 -153.7
Flscal Accounts1
(GDP Shars Current Prices)
Current Income 18.9 20.4 23.6 23.3 17.8 16.6Oil Revenues 10.5 14.9 18.7 18.3 11.7 10.1Non-oil Revenues 8.4 5.5 4.9 5.0 6.1 6.5
Current Expenditures 20.5 20.4 20.7 20.0 18.5 18.8Current Surplus or (Deficit) 3.9 9.5 13.1 9.3 6.1 6.6
Capital Income 0.0 0.0 0.0 4.1 0.0 0.2Capital Expenditures and Net Lending 7.1 2.8 5.5 6.5 5.4 4.8
Overall Surplus or (Deficit) -7.7 -1.5 -1.2 2.6 -3.6 -3.6
Sour Central Government only.Source: Data provided by WtnezueWas Central Bank

- 13 -
Thble 1.3: Key Economic Variables; 1988-93
1988 1989 1990 1991 1992 1993
Incentive Indicators and Terms ofTrade
Real Exchange Rate (Bs/US$)!' 100 126.14 139.99 139.83 139.83 137.08(1988=100)
Average Nominal Interest Rates (%)Deposit Rate 8.95 28.66 28.69 31.42 31.42 53.28Lending Rate 12.68 31.76 36.11 37.27 37.27 60.50
Inflation Rate (%) 29.50 81.00 36.48 31.02 31.86 45.87
Commodity Terms of Trade 70.60 132.91 170.81 101.19 81.04 85.65Index (1987 = 100)
Creditworthiness Indicators (%)
DOD/GDP 59.9 77.2 69.5 63.1 57.6 57.2DOD/Exports 326.6 239.7 180.4 207.3 233.9 219.9Debt Service/GDP-' 9.3 10.2 12.8 9.5 7.1 8.1Debt Service/Exports GNFS 50.5 31.7 33.3 31.1 27.5 31.3Interest Payments/GDP 5.2 7.0 6.5 4.9 3.7 3.6Interest Payments/Exports GNFS 28.1 21.7 16.9 16.0 14.4 13.9
1/ The real exchange rate is constructed by taking world prices as represented by the U.S. consumer price index anddomestic prices represented by the consumer price index in Caracas.
2/ Excludes repayments on short-term debt.Source: Data provided by Venezuela's Central Bank.
1.43 Uncertainty about reform prospects and a large structural fiscal deficitcontributed to economic deterioration in 1993. The economy contracted for the first timesince 1989, inflation and nominal interest rates increased in the second half of the year, thefiscal deficit expanded, and foreign exchange reserves declined. The recession reflected adecline in consumer confidence leading to lower demand for goods and services and areduction in the central government's spending due to lack of financing. Changes in theprice level were partly due to the once-and-for-all impact of the first stage of the full-scaleVAT in October 1993, and to a contraction in real money demand that the Central Bank didnot fully accommodate. This contraction in real money demand was partly determined bydevaluation expectations. Import demand declined and non-traditional exports expanded,leading to an improvement in the trade and current accounts of the balance of payments.The government and PDVSA were able to obtain external financing to partially support afiscal deficit of about 6 percent of GDP. The central government's fiscal deficit--at about3.3 percent of GDP--was smaller than in 1992. This deficit reduction was possible byincreasing social security contributions and indirect taxes (VAT) and by reducing capitalexpenditures. In spite of comparatively high real domestic interest rates and a decline in

- 14 -
imports, foreign reserves declined by about US$1.3 billion in 1993 because of increasingexpectations of a large devaluation of the Bolivar.
1.C Political Economy and 1994 Developments
1.44 In 1992, two attempted military coups brought the P6rez administration'scomprehensive reform program to a halt and in 1993 then-president Perez was removed fromoffice on corruption charges. The then-president of Congress Mr. Lepage assumed thepresidency for about one month before handing it over to the caretaker government ofMr. Velasquez. The Velasquez administration made significant progress on economic policyby starting to implement new non-oil taxes and the new banking sector laws.
1.45 President Caldera was elected in December 1993--with only 30 percent of theelectoral vote and members of Convergencia--his political party--hold only a small share ofthe seats in Congress. Nevertheless, Congress gave the Caldera administration an EnablingLaw in April 1994, only two months after Mr. Caldera took office. This Law allowed hisadministration to start implementing a new tax package, commonly recognized as the "SosaPlan" (see Chapter 6).
1.46 The Caldera administration has faced severe economic difficulties from thestart. The poor economic conditions of 1993, accompanied by inappropriate managerialpractices by bank managers and the inadequate performance of the banking supervisoryagency, led to the collapse of Banco Latino--the second largest Venezuelan bank--in earlyJanuary 1994. In the following months, banking difficulties increased because of thegovernment's arrears to the private sector, high interest rates, and past bad loans. CentralBank assistance to at least eight other mid-size banks through FOGADE, the depositinsurance agency, amounted to US$6.1 billion, which increased the 1994 fiscal deficit of theconsolidated public sector to a projected 17 percent of GDP.
1.47 In the first half of 1994, Venezuela was heading for record high levels ofinflation, mainly because of the fiscal imbalance, the banking crisis, and problems ofmanaging monetary and exchange rate policy. Annual inflation had averaged 30-33 percentin the past three years. However, the Central Bank found it difficult to accommodate a largedecline in money demand in the second half of 1993 and early 1994. As a result, theinflation rate increased and the Bolivar was devalued in April 1994.
1.48 Under significant pressure in the foreign exchange market forcing large salesof Central Bank reserves, the authorities changed their foreign exchange policy in April 1994to support a higher real exchange rate. The new system had three different prices for thedollar: one for sales by the Central Bank to the commercial banks, a second for salesbetween the banks and their preferred customers, and a third for all other transactions(parallel market). The authorities replaced that system in mid-May 1994 with a moretransparent auction process by which the Central Bank each day took the five highest bids forforeign exchange purchases by the commercial banks and other major intermediaries.
- 15 -
Between end-April and end-May 1994, the exchange rate at the Central Bank changed from117.6 Bs per US$ to 165.7 Bs per US$. The new foreign exchange system eliminated theparallel market and allowed a higher real exchange rate.
1.49 On June 14, 1994, the Government intervened the eight banks that werereceiving its financial support. However, it failed to explain promptly and consistently to thepublic its strategy for honoring deposits at these banks. These events further eroded thepublic's confidence on the financial system.
1.50 The Government decreed foreign exchange and price controls on June 27,1994, after the eight banks were intervened and the exchange rate had reached 200 Bs perUS$. On a televised speech to the nation, President Caldera explained that he considersthese measures necessary to protect the stock of foreign exchange reserves, and to reduceinflation and interest rates.
1.51 In 1994 output contracted for the second year in a row, despite a largeincrease in oil production. The economic contraction and the real devaluation of the Bolivarled to lower import volumes. That year the trade and current accounts of the balance ofpayments show surpluses of US$5.5 and US$4.1 billion, respectively.
1.52 One of the main elements of the Sosa Plan, the general sales and luxury tax(GST), became effective only in August 1994. The GST is a value added tax excludingsmall retailers and with special surcharges for "luxury goods" (see Chapter 6). Delays in theimplementation of the Sosa Plan and in institutional changes to increase tax collection did notundermined the government's fiscal objective of reducing the central administration deficit.This deficit was about 2.6 percent of GDP in 1994, but the consolidated fiscal accounts showa larger fiscal deficit--15.5 percent of GDP--mainly because of the Government's financialassistance to the banking sector through FOGADE.
1.53 Inflation reached an annual rate of 71 percent even though the annualizedmonthly rate of inflation declined from 9.0 percent in June to about 4.3 percent inNovember. Higher inflation rates and the decline in money demand forced the Central Bankto offer higher nominal interest rates on its zero-coupon bonds; these are used as referencefor other market-determined rates. However, since April 1994, real interest rates have beensignificantly negative; this is because of the Government's monetary policy after the realdevaluation and the foreign exchange and price controls. Unfortunately, negative realinterest rates discourage savings and foster inflationary expectations.
1.54 On September 12, 1994, the Government announced a new economic plan toreduce inflation and promote economic growth. However, through mid-1995, this plan hasnot been implemented for the most part. Chapter 2 analyzes the main elements of this planin the context of a broad agenda for stabilization and sustained growth.
Chapter 2. The Strategy
2.A Introduction
2.1 This chapter suggests how the Venezuelan government might stabilize theeconomy and resume sustained growth while reducing the incidence of poverty. It discussestrends in the inflation rate and policies to reduce it, considers measures to resume growth,emphasizing the need to close the fiscal imbalance, and examines the influence of economicpolicy on the incidence of poverty, offering recommendations for change. It also discussesVenezuela's economic outlook.
2.B StabilizationS'
2.2 A correction of the fiscal imbalance and a floating exchange rate with netaccumulation of foreign reserves, and a monetary policy based on control of the monetarybase are appropriate choices for stabilization in the short- and medium-term. They are asvalid today as ever, even after the change to foreign exchange and price controls and thedevaluation of the Bolivar in the first-half of 1994. In fact, the devaluation was a good startin the implementation of the recommendations of this report.
2.3 Determinants of Inflation. From June 1989, immediately after thestabilization program began, until the second half of 1993 inflation remained stable at anaverage annual rate of 32 percent. This rate, equal to the average rate from 1987-88, ismuch higher than for any other period in Venezuela's history.
2.4 The two common explanations for pernanent and relatively high inflation ratesseem inadequate here. One is the existence of inertia, monopolistic forces, and unyieldingexpectations that make stabilization extremely difficult; the other is fiscal pressure thatencourages the govermnent to use the "inflation tax" as a source of revenues. Venezuela'slong tradition of relatively low inflation and its lack of indexed instruments do not supportthe first explanation.
2.5 The trend in inflation revenues (often called the inflation tax)!' reveals thatfiscal pressure can hardly be a strong explanation of inflation in Venezuela either(Figure 2.1). The data show that since 1985, revenues from the growth of the monetary base
1/ This section is based on the report by the World Bank, Venezuela - A Strategv for Monetary Stability,Report No. 13084-VE, May 1994.
2/ The real revenue that the Treasury may obtain from the growth of the monetary base can be expressed asthe real monetary base times the rate of growth of the nominal monetary base, or alternatively, as the sumof the real monetary base times the inflation rate (inflation tax) plus the change in the real monetary base(seignorage). When the economy is stationary and in a long run equilibrium, the real monetary base willremain constant, and the revenue is equal to the inflation tax. Revenues were calculated here for everymonth, over the last 12 months. Figures for GDP have been expressed on a monthly basis by smoothingquarterly figures via a moving 12-month average.

- 17 -
have been lower than 2.5 percent of GDP, except during 1991-92. The large revenues forthese two years reflected the "remonetization" of the economy, following the once-and-for-allrise in prices during the first part of 1989, and the subsequent fall in the inflation rate. Thisincrease in the demand for money had two components--the recovery of real monetary assetsfrom the low levels attained after the once-and-for-all rise in prices, and the additionalrecovery due to a greater decline in inflation than expected. Because these two componentswere once-and-for-all changes that could not be sustained while inflation remained stable, therevenue increase was only temporary. Inflation revenues fell from an exceptionally highpeak of almost 4.5 percent of GDP during 1991 to less than 1 per cent of GDP at the end of1992, and after three years of stable and high inflation, revenues from monetary base growthbecame almost negligible in 1993.
Figure 2.1
Rato f Rev~lues from Bae Cr*etion to GDP; 19853
o 046
0.040
0.020
° A
0.015
0.010
0.010
0.000
I m 19se 1987 1968 196 1960 1991 1962 199W
su Bw Opt" de Vau,m
2.6 The data suggest that following the 1989 stabilization program the policy hasbeen to "live with" the inflation rate. In fact, the Central Bank uses past rates to calculatethe forthcoming inflation rate and accommodates changes in the money supply (Ml) to thisrate.3' This results in a "loss of anchor" and perpetrates inflation. In effect, thegovernment validates existing inflation with a mix of monetary and exchange rate policies.
2.7 Figure 2.2 tracks the rate of growth of Ml. The increase in 1990 and 1991corresponds to the real monetization discussed above, and the decrease since 1992 indicates
3/ The model used by the Central Bank is formally discussed in "Modelo Costo-Inflaci6n", Banco Central deVenezuela, Gerencia de Investigaciones Econ6micas, December 1992.

- 18 -Figure 2.2
*l l
Figure 2.3
Inflation Rate; 1981-Novembr 1994Annual Rate of Change
120
100
40eo~~~~~~~* . . . ^
20--- *. ; .
o
1961 1982 1963 1984 1985 1966 1987 1968 1969 1990 1991 1992 1993 1094
Sot:oe Bu CSnlm de Veraz
that a "monetary rule" which would have maintained stable growth has not been followed.Instead, the data show a combination of exchange rate and monetary policies to maintain astable inflation rate (Figure 2.3) and avoid a devaluation of the Bolivar (Figure 2.4), with theCentral Bank accommodating to changes in the demand for real money.

- 19 -Figure 2.4
Ral Exchange Rate (Bs#US$); 1981-October 1994May 1964o1
2-
1.6 _
1.6 _
1.4
1.2
0.8
0.8
OA
0.2o_ I 1 1 I I I I I I I I I I II I i I 4 I I I I I I I I I I I I I I I I I I I I I I1 I I I I 1 I I 1 I I
1961 1962 1983 1964 1965 1966 1967 1968 1969 1990 1991 1992 1993 1994 1995
Sax BM Cl*. de VanzuobN&W: The US *wWlo pWrI hUd mwod peice end Cm wosal price Mu r nta domalc p1im
2.8 This combination of exchange rate and monetary policies continued in 1994,but with higher levels of inflation than during 1990-93. In April 1994, the Central Bankallowed a large real devaluation of the Bolivar; however, the trend in the real exchange rateis following the same path since 1981.
2.9 Stabilization Policies. A necessary condition for the success of anystabilization program is fiscal solvency. Fiscal imbalances are very difficult to avoid whenthe real exchange rate, to which Venezuela's fiscal policy is linked, is allowed to appreciatefor whatever reason. Therefore, an overvalued Bolivar is almost surely inconsistent withstability.
2.10 In Venezuela, reductions in the supply of foreign exchange by the CentralBank to the market can generate a depreciation in the real exchange rate, which addscredibility to a stabilization strategy based on a real exchange rate realignment. Moreover,the reduction of foreign exchange to finance public expenditures in nontradable goods meansan equivalent accumulation of international reserves, which also increases credibility.
2.11 Table 2.1 shows the estimated changes in the ratio of the deficit to GDP as aresult of proportional changes in the real exchange rate. Thus a 10 percent depreciation inthe real exchange rate, which translates into a 13.7 percent rise in the ratio of traded tonontraded goods prices, brings about a fall of 2 points in the ratio of the deficit to GDP.These calculations are relevant not only for the long-term effects of a permanent increase inthe real exchange rate, but also for the public's expectations about short-term gains from anominal devaluation, assuming devaluations of 25 or 30 percent.

- 20 -
Table 2.1: Fiscal Inpact of a Real Devaluation
Depreciation Change Change inof the Real in Points of theExchange Relative Deficit/GDPRate (%b) Prices Ratio
_ _ _ _I_ (% ) l _ _ _l_
5 6.85 1
10 13.7 2.05
15 20.5 3.07
20 27.4 4.1
25 34.25 5.1
30 41.1 6.1
50 68.5 10.2 -
Source: Venezuela - A Strategy for Monetary Stability,mimeo, May 1994.
2.12 The key, of course, is to ensure that a devaluation leads to a real depreciationof the exchange rate, which would be accomplished by a reduction of foreign exchangecommitted to the purchase of nontradables. This in turn requires reduced public expenditureson domestic goods, either through increasing outlays on imports or increasing the fiscalsurplus.
2.13 Exchange Rate Rule. In an "exchange rate rule" regime (either with aconstant nominal exchange rate, as in Venezuela for many years and now in Argentina, orwith a constant exogenous rate of devaluation), the Central Bank relinquishes control overthe monetary base, and the regime indeed can provide a stable anchor for domestic prices.One problem with the system, which has been profusely discussed in the literature, is its "allor nothing" feature, since the government's credibility is concentrated in the pre-announcedpath of the nominal exchange rate.
2.14 Using the exchange rate to anchor prices, be it through a fixed exchange rateor a guaranteed pre-announced path for the nominal exchange rate, is particularly risky whenthe fiscal effects of an overvalued currency are very strong. This is the case in Venezuela,where the government derives most of its fiscal resources from oil exports. The exchangerate regime is very vulnerable to expectations of future devaluation, even when these are notdue to fundamental macroeconomic disequilibrium.

- 21 -
2.15 This is all the more important since the real exchange rate has been so volatileunder the "fixed" exchange rate policy Venezuela attempted to follow; maxi-devaluationswere followed by a gradual appreciation of the rate until another devaluation occurs (Figure2.4). Past foreign exchange rate policies have indeed been dominated by use of the exchangerate to anchor prices while inflation was fueled by increasing fiscal disequilibria financedwith monetary base growth. Failure to contain monetary growth led to accelerated inflationuntil the next maxi-devaluation.
2.16 Monetary Rule. Another regime of monetary management--called the"monetary rule"-- may be more appropriate for Venezuela. In its more extreme and simpleform, the Central Bank gives up control of the nominal exchange rate, while the authoritiesmaintain price stability mostly through monetary control. The government commits itself toa low growth rate of a narrow monetary aggregate such as the monetary base. The regime,of course, may allow for discretion in response to short-term shocks, but would be consistentwith monetary targets in the long run.
2.17 Credibility is important for foreign exchange policies. However, while a lackof credibility is very harmful with a foreign exchange rate rule, it actually may help with amonetary rule. Since the government does not control the nominal exchange rate,expectations focus not on devaluation but on failures of the monetary rule; the public maybelieve that monetary expansion will accelerate to meet adverse fiscal shocks. This lack ofcredibility will be immediately reflected in a higher demand for foreign exchange, which, inturn, will bring about a depreciated real exchange rate and an increase in the purchasingpower of oil fiscal revenues. In short, net fiscal receipts would increase and ensuremonetary goals can be met.
2.18 The main conclusion of this analysis is that expectations have an importanteffect even if they do not conform to economic fundamentals. When these expectations aregenerated in the presence of a regime that uses an exchange rate anchor in a country likeVenezuela, they produce very strong adverse fiscal effects that put the exchange rate regimeat high risk of failure. On the other hand, if the regime uses the control of monetary growthto anchor prices, allowing for the nominal exchange rate to respond to changes inexpectations, the fiscal impact during a crisis of credibility will be favorable. This latterregime is clearly more appropriate for Venezuela.
2.19 Recommendations. In the very short-term, the Government needs to preventfurther instability in the banking sector and to reduce liquidity. To this end, the Governmentis assessing the financial status of the non-intervened banks, to avoid additional requests forfinancial support. It is also planning to issue long-term bonds in the domestic markets.These bonds will have a longer maturity than the zero-coupon bonds and will reduce liquidityin the coming months. Other proposed measures to address the banking sector problems arediscussed below along with other public spending issues.

- 22 -
2.20 Everyone is in favor of long-run inflation at single digits. A necessarycondition for this is that the components of the government accounts should be consistentwith a low rate of growth in the money supply. Higher levels of non-oil fiscal revenues areneeded and, along with public sector restructuring, are the first essential of a soundmacroeconomic program for monetary stability.
2.21 The second element for stability is a floating exchange rate systemaccompanied by the accumulation of net foreign exchange reserves. This would support ahigher real exchange rate than otherwise, improve the fiscal situation and promote exportdiversification.
2.22 Finally, monetary policy should make the path of monetary aggregates such asthe monetary base that the Central Bank can control, consistent with the permanent decline ofinflation until single digit annual rates are attained. At the same time, the monetary authorityshould not try to control interest rates. A higher real exchange rate will lower real interestrates because of its positive effect on the fiscal balance. This will reduce the pressure onmarket-determined interest rates and defuse the present credibility crisis.
2.C Growth
2.23 Economic growth is determined by the rate of growth of the economy's factorsof production (e.g., labor and capital) and by gains in their productivity. Total factorproductivity growth (TFPG) is one way to measure changes in output per unit for all inputscombined. When it is positive, it reflects the improved efficiency of all production factors.
2.24 In Venezuela, the decline in output growth after 1973 is closely related to adecline in TFPG, which was negative from 1974-89 but rose between 1990-92, when highoutput growth rates were achieved (Table 2.2).
2.25 Through its direct investments and its regulation of factor markets, thegovernment has had an important influence on TFPG. Most of its large investments inpower, aluminum, steel, and petrochemicals since the early 1970s have had very low returnsbecause of the inappropriate economic environment in which they were made, including thetrade regime and pricing policies (see Chapter 5). Distortions in the factor markets, such assubsidized interest rates, have favored the use of capital over labor, and excessive laborregulations have enlarged the size of the informal market, where labor productivity isloweri-'.
4/ See, World Bank, Venezuela Labor Markets Study, Report No. 12449-VE, April 1994.

- 23 -
Table 2.2: Output, Factor Input and ProductivityGrowth in Venezuela; 1921-92 (in Percent)
Growth in: 1921-43 1944-58 1959-73 1974-82 1983-89 1990-92
Output 6.03 10.52 4.18 4.18 4.50 7.86
Factor Input 4.40 6.99 3.53 5.25 1.07 1.73
Labor 1.28 3.64 3.51 3.21 2.75 2.54
Capital 7.51 10.34 3.56 7.30 -0.62 0.93
TFP 1.64 3.53 0.65 -2.11 -1.57 6.13
Labor Productivity 4.75 6.87 0.68 -0.07 -3.25 5.33
Capital Productivity -1.47 0.18 0.63 4.16 0.11 6.93
Note: These estimates are not corrected by capacity utilization. Source: Carlos Paredes estimates based on an updated version of Baptista (1991)
2.26 Venezuela is facing serious financial difficulties. International oil prices arelow, the recent banking crisis will require a significant share of future savings to be assignedto service a much larger internal debt, and fiscal resources are scarce. Unless productivitycan continue to improve, future growth will be constrained. What is striking about the 1990-92 period is the rapidity with which productivity increased even though capital growth wasmoderate. This underscores the need to sustain the policies--liberalization of financialmarkets and the trade regime, deregulation of domestic markets, privatization, and publicutility pricing closer to opportunity cost--that led to such productivity growth.
2.C.1 Government Revenue
2.C.1.1 Non-Oil Taxes
2.27 In 1994, the Government introduced several new non-oil taxes: a general salesand luxury tax (GST) replacing the value added tax, a financial transaction tax, a reformedincome tax, and a corporate asset tax. That year, it raised about 8.5 percent of GDP fromthese and other non-oil taxes and about 9.4 percent of GDP from oil taxes and royalties.However, these collection levels were not enough to close the gap between revenues andexpenditures, made even more difficult by financial assistance to the banking sector, whichhas reached about US$ 8 billion.
2.28 The Government's economic program originally proposed an increase in theGST from 10 to 15 percent in 1995, this would have brought in about 1.2 percent more thanthe 1994 levels and could compensate for the elimination at the end of 1994 of the transitorytax on financial transactions. However, the 1995 budget includes a GST rate of only 12.5percent although the tax on financial transactions was removed, as expected. TheGovernment is also planning to again request Congress to eliminate the remaining exemptions

- 24 -
to the personal and corporate income tax (see Chapter 6). In addition, the administrationwill need to vigorously enforce the new corporate asset tax and may also need to expand theGST to the retail level to avoid a deterioration of the taxable base.
2.29 Payroll Taxes. The current tax regime overtaxes workers in the formal sectorwhile other groups--partnerships, informal workers, professionals, merchants--pay almost noincome tax. Payroll taxes for a minimum wage worker reach 31 percent of total labor costs,equivalent to the marginal income tax rate for the highest income bracket. They are made bythe employer, but given the relatively inelastic supply of labor, most of these taxes are, ineffect, paid by the workers.5' Reform of the payroll taxes should make the rates consistentwith the pending reforms of the income tax (see Chapter 6). The existing tax law includes apayroll tax to finance mortgage bank operations. However, this bank provides few benefitsfor low-income workers, who bear a disproportionate share of the costs. It should beeliminated. The loss of revenues from the reduction of payroll taxes can be offset byincreased collection of personal and corporate income taxes resulting from the elimination ofexemptions and better tax administration. Reduced payroll taxes will also expand formalsector employment and the government's tax collection over the medium term.
2.30 Social Security Taxes.§' These include contributions for health coverage,old-age pensions, and unemployment insurance. The contribution for health coverage is 6.25percent of the participant's salary, up to a maximum contribution which was about Bs 45,000or US$450 in 1993. Since the Social Security System (IVSS) provides poor service, patientssometimes seek help from Ministry of Health (MSAS) facilities, but more often than notfrom private doctors for whose services they must pay. These workers in effect get nohealth benefits from the social security system.
2.31 To finance old-age pensions, employees pay the IVSS an average of 6.56percent of their salaries up to the maximum set for health coverage. This is a mandatorypayment for all private sector employees, except occasional and temporary workers. Menqualify for a pension at 60 years of age, women at 55 years, as long as they have contributedfor 14.4 years. The system is progressive since the simple replacement rate, that is, themonthly pension as a proportion of salary, tends to be lower as the salary level rises. Inaddition, because there is no monetary correction, the pensions lose value in real terms.
2.32 Unemployment insurance, started in 1989, requires workers to contribute 0.5percent of their salary, matched by 1.7 percent from their employer, to an unemploymentcompensation fund. Since this fund has been constantly depleted, workers consider the
5/ A complete description of these taxes and their impact on the labor cost is in World Bank, Venezuela LaborMarkets Study, op. cit.
6/ The discussion on social security issues is based on World Bank, Venezuela Social Security Stud,forthcomning.

- 25 -
system of "prestaciones sociales" (social contributions) a surer way to get some protection incase of forced unemployment.
2.33 The prestaciones sociales system requires employers to maintain reserves equalto current monthly-salary times years of tenure for each employee. These reserves must bedisbursed to the employee at the end of the contract, regardless of the termination cause. Inaddition, interest on the previous year's accumulated funds, calculated at a rate slightlybelow the rate for commercial borrowing, must be disbursed to workers every year. Sincethis makes total labor costs dependent on tenure and inflation, it discourages training byfirms and increases turnover and unemployment. From a legal point of view, thecontributions are a privileged liability of the firm, can be expensed for tax purposes, and aresubject to income tax once the worker receives them. Firms can deposit these contributionsin financial institutions, but if they do not do so, they have to reflect the debt in theiraccounts as a reserve. Most firms do not set funds aside for these commitments annually.
2.34 Severance payments are calculated as an amount equal to the prestacionessociales' accumulated reserves, and are due (in addition to the prestaciones) when the workeris fired withoiit just cause. They amplify the effects of the prestaciones sociales,systematically increasing the burden of labor costs when the economic environment isuncertain.
2.35 The social security system must be reformed if employers are to beencouraged to expand employment in newly attractive areas while reducing employment (oravoiding bankruptcy) in other areas.
2.36 The reform should emphasize the government's policy making and control roleand provide competition in the supply of social security services, if possible. A possible newsystem to consider would have three tiers: a tier for minimum pension and health coverage,where the government subsidizes, on a means-tested basis, the insufficient contributions oflow-income workers or the unemployed; a tier that includes all those who can--with theexisting mandatory contributions--finance at least the minimum established coverage; and atier for additional voluntary coverage purchased from private insurance companies.
2.37 The Proposed Pension System. Every employed person would make a tax-deductible mandatory pension contribution (say 10 percent of gross salary), which would bedeposited either at the IVSS or in one of the new pension funds. A salary adjustment wouldbe made to compensate for the share presently paid by the employer. Self-employed personscould also contribute to the new pension funds. The minimum contribution would also betax deductible.
2.38 The Proposed System of Prestaciones Sociales. A severance payment equal toa month's salary per year of work, at the last salary, would be made in three monthlyinstallments to a worker who was fired. No interest would be paid on accumulated severance

- 26 -
benefits. The purpose of this payment would be to deter arbitrary firings as well as layoffsduring minor recessions or temporary drops in sales.
2.39 The present system could be phased out as part of creating an efficient systemof unemployment insurance. Simply eliminating severance payments is not desirable,because they are intended to facilitate the downsizing needed for modernization and increasedproductivity. Workers who are laid off must be given a financial cushion while they areunemployed and in search of new jobs.
2.40 The Proposed Unemployment Insurance System. One proposal would be tobase unemployment insurance on contributions proportional to total payroll so that all firmsincurred similar costs. Experience-rated options (where firms in sectors with high turnoverrates would pay more) would be considered as an alternative. The worker could use hisseverance payment during the first three months of unemployment, and after that wouldobtain unemployment compensation, drawing down from the fund at declining percentages ofhis last salary.
2.41 Finally, the government's intervention in collective bargaining should bereduced. At present, because the arbitration committee is allowed to settle for an average ofthe demands of each side, the parties tend to take extreme positions to influence the averageand avoid any real negotiation. To encourage negotiation, the arbitration committee shouldbe allowed to choose only one of the proposals, not the average. The inspectors of theLabor Ministry should concentrate on policing labor law violations and abandon interferencein collective bargaining.
2.42 It might be appropriate to provide stronger incentives for negotiation followingthe example of Chile, where a firm can replace strikers after two weeks if its offered raise ishigher than inflation (i.e., a raise in real terms). Forbidding the replacement of strikingworkers under all and any conditions does not benefit them. Firms in Venezuela simplyresort to pressure to have the strike declared illegal and then replace workers at will.
2.43 The cost to the government of the proposed changes in the social securitysystem are estimated at about 24.1 percent of GDP on present value terms; this issignificantly less than the cost of continuing with the current scheme, which has beenestimated at about 77 percent of GDP on the same terms. The reduction in the cost of thesocial security system will come from its components. First, an increase in the contributionsfor pension and unemployment compensation from 8.7 of salaries to about 16 percent.Second, an increase in the minimum contribution period for benefits eligibility, from 750weeks to 1,050 weeks. Finally, the increase in the minimum retirement age, from 55 forwomen and 60 for men to 65 years for both.

- 27 -
2.C.1.2 Oil Sector Taxation
2.44 Venezuela's oil taxation system was designed before the 1975 nationalization,and it applies now to PDVSA, the state monopoly. Today, oil production and profit-sharingagreements with private sector participants are being pursued for fields containing heaviercrude. Private investment in the oil sector will soon be encouraged in all areas. To takeadvantage of the new investment opportunities the Government needs to modernize its oillegal and taxation systems. Oil taxation in Venezuela is particularly inappropriate to dealwith private investment in a rapidly changing environment. Income tax and royalty ratesexceed 83 percent of net pre-tax cash flow--and this in a relatively high-cost country. Thesystem is discretionary and penalizes promising lower return projects by basing too much ofthe total tax take on gross production (see Chapter 9). It impedes the country's ability tocompete internationally for private investment at a time of growing capital constraints anddeclining production from established oil fields.
2.45 Reducing the onerous oil tax rates to internationally competitive levels wouldboth foster private investment in the oil sector and create a broader, more stable, oil taxbase. The present system could be replaced with one that is progressive and profits-relatedbecause of the range of cost conditions inherent in the production of light to heavy oils, andbecause of substantial market variation in the value of this range of crude. Chapter 9discusses the proposed oil taxation system in detail.
2.46 Venezuela also needs a unified system of oil taxes and royalties for both thepublic and private sectors. However, in the short term, it would not be advisable to reducethe levels of taxation on PDVSA, beyond the phasing-out of the export reference price, untilthe whole institutional and administrative relationship between the Government and the oilcompany has been modernized to increase transparency and accountability to the onlyshareholder, the Government. The taxation system recommended here should be applied tothe private sector as soon as the legal, institutional, and administrative details have beenworked out.
2.C.1.3 Pricing Policy
2.47 One of the instruments the government is considering to increase fiscalrevenues in 1995 is an adjustment in gasoline prices, which for years have been below theiropportunity cost. In 1992, the difference between prices and opportunity cost was about 40percent (Table 2.3) and there have been no price increases since then. This pricing policygreatly benefits the higher income groups and has limited the means to improve the livingconditions of the less fortunate. Our estimates indicate that in 1993 subsidies on all fuels andelectricity were about 7.4 percent of GDP and gasoline subsidies alone were about 3.4percent 2'.
7/ See World Bank, Venezuela: Efficiency ReDricing of Energy, Table 2, Report No. 13581-VE, May 15,1995.
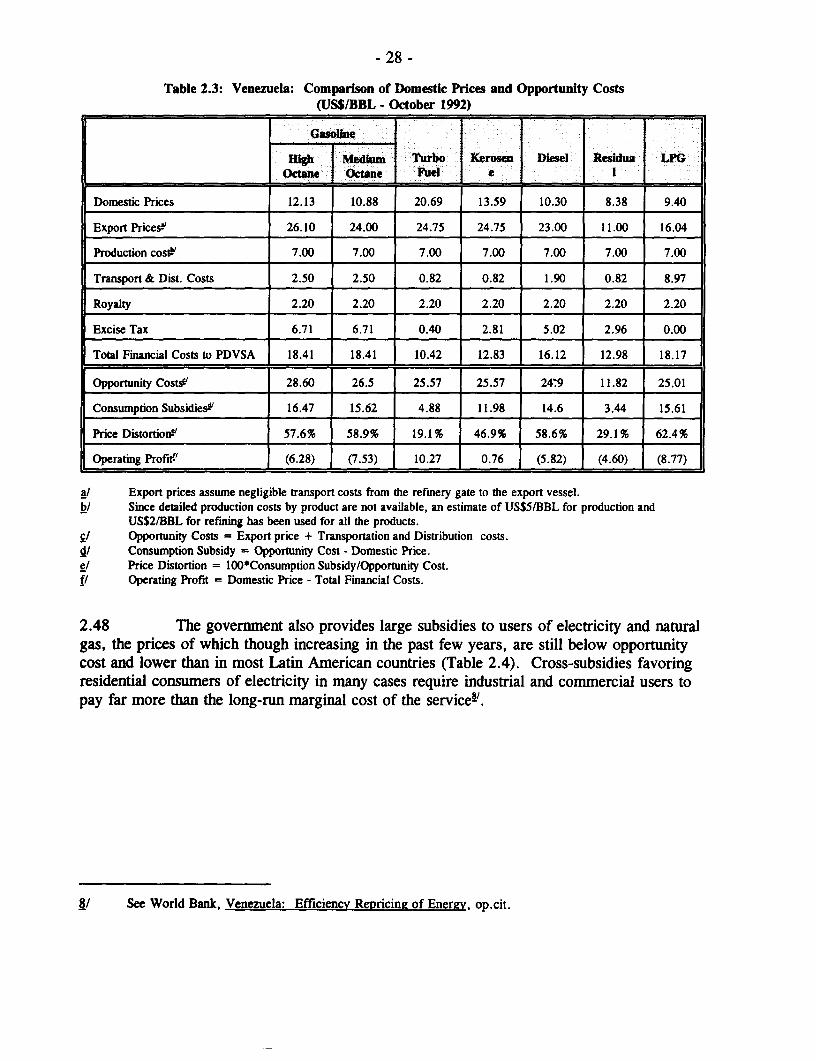
- 28 -
Table 2.3: Venezuela: Comparison of Domestic Prices and Opportunity Costs(US$/BBL - October 1992)
G"De
Hi&h ] Medium Turbo Kerosen Diesel Resdus LPGOctane Octsan Fuel eeI
Domestic Prices 12.13 10.88 20.69 13.59 10.30 8.38 9.40
Export Prices" 26.10 24.00 24.75 24.75 23.00 11.00 16.04
Production costF 7.00 7.00 7.00 7.00 7.00 7.00 7.00
Transport & Dist. Costs 2.50 2.50 0.82 0.82 1.90 0.82 8.97
Royalty 2.20 2.20 2.20 2.20 2.20 2.20 2.20
Excise Tax 6.71 6.71 0.40 2.81 5.02 2.96 0.00
Total Financial Costs to PDVSA 18.41 18.41 10.42 12.83 16.12 12.98 18.17
Opportunity Costs' 28.60 26.5 25.57 25.57 24-9 11.82 25.01
Consumption Subsidies!' 16.47 15.62 4.88 11.98 14.6 3.44 15.61
Price Distortion!' 57.6% 58.9% 19.1% 46.9% 58.6% 29.1% 62.4%
Operating Profit!' (6.28) | (7.53) J 10.27 0.76 (5.82) (4.60) (8.77)
J/ Export prices assume negligible transport costs from the refinery gate to the export vessel.bl Since detailed production costs by product are not available, an estimate of US$5/BBL for production and
US$2/BBL for refining has been used for all the products.-/ Opportunity Costs = Export price + Transportation and Distribution costs.d/ Consumption Subsidy = Opportunity Cost - Domestic Price.e/ Price Distortion = 100*Consumption Subsidy/Opportunity Cost.f/ Operating Profit = Domestic Price - Total Financial Costs.
2.48 The government also provides large subsidies to users of electricity and naturalgas, the prices of which though increasing in the past few years, are still below opportunitycost and lower than in most Latin American countries (Table 2.4). Cross-subsidies favoringresidential consumers of electricity in many cases require industrial and commercial users topay far more than the long-nm marginal cost of the services'.
8/ See World Bank, Venezuela: Efficiency Repricine of Energy, op.cit.

- 29 -
Table 2.4: Average Energy Prices In Selected LAC Countries During 1992
Argentina Bolivia Brazil Colombia Chile Meuxico Venezuela
Petroleum Products (US$/Gallon)
Gasoline 2.11 1.65 1.48 0.61 1.56 1.35 0.29
Diesel 1.20 r 1.37 0.96 0.61 1.28 j0.83 0.25
Kerosene
* Residential 1.02 0.85 na na na 0.83 0.32
* Transport 0.83 1.37 0.66 0.61 1.62 0.65 0.49
Fuel Oil na 1.29 0.47 0.27 0.52 0.23 0.20
LPG | 1.33 0 O.59 0 O.55 | 0.44 na 0.34 0.22
Electricity (US C/kWh) __
* Industrial 9.79 na na 4.48 6.01 5.67 4.04
* Residential 9.51 6.33 6.91 2.04 | 11.02 5.12 1.99
* Commercial 16.67 T 11.91 1 7.94 1 5.87 9.89 T 12.67 5.75
Natural Gas (US$/kCF) -|
* Industrial 3.13 2.00 na 2.07 na 2.12 0.29
* Residential 5.14 3.42 na 2.98 na | 2.62 0.89
Source: OLADE, SIEE, September 1993
2.49 The adjustment of energy prices to opportunity cost will not only enlarge fiscalrevenues but also improve resource allocation. For example, PDVSA's proposal to switch publictransport from gasoline to gas would reduce gasoline consumption and increase the company'sexport potential. A side benefit of this conversion would be improved air quality. Appropriatepricing would also be an incentive for energy conservation. Industries invest in energyconservation to the point where the cost of saving an additional unit of fuel is the same as itspurchase price. Therefore, large and high-voltage electricity users should be subject to time-of-daytariffs with a kilowatt-demand charge, using peak and off-peak rates that reflect the marginal costsof the interconnected system21.
2.50 It would be advisable to complete reforms of the power sector and introduce somechanges in the hydrocarbons sector to make price adjustments transparent and flexible, and also topromote private sector participation in these sectors. Proposed changes are discussed in detail inthe Venezuela Energy Pricing Report and in Chapters 8 and 9 of this report.
9/ See World Bank, Venezuela: Efficiency Repricing of Enernr, op.cit.

- 30 -
2.C.2 Government Spending
2.51 Reduced government spending is critical to maintaining a realistic real exchange rateand fostering non-oil economic activities. Estimates show that a permanent reduction of about 10percent in central government spending will depreciate the real exchange rate by about 6 percent,with a very positive effect on non-oil activitiesL°'.
2.52 Although central government spending has declined from 23.5 percent of GDP in1984 to 20.7 percent in 1994, it is not yet in line with the drastic decline in oil tax revenues, anddeficits have appeared almost every year since 1984. In 1994, the deficit of the centralgovernment was about 2.6 percent of GDP, excluding the support to the banking sector. Thegovernment faces significant pressure from large segments of the population who demandeducation, health, water, and other basic services. Central government capital formation has beennegligible in the past five years, a factor likely to lead to bottlenecks adversely affecting theeconomic efficiency of both the private and public sectors.
2.53 Spending reductions made so far are not of a permanent nature because thegovernment has too many commitments that are difficult to eliminate without structural changes.Examples are wages and salaries and external debt services. In 1994, central government wagesand salaries were about 4.4 percent of GDP and total debt service about 4.2 percent, togetheraccounting for about 50 percent of current spending.
2.54 Permanent reductions will come as a result of a comprehensive restructuring of thepublic sector, decentralization, privatization, private sector participation in the oil sector, andchanges in the social security system. Better budget practices can also help by preventingunnecessary increases in expenditures when oil prices increase.
2.55 Budget Practices. A new budgetary system is required to increase the downwardflexibility of expenditures when oil prices decline, and prevent excessive upward flexibility whenoil prices temporarily and unexpectedly increase. The common practice of ministries and otherpublic entities to commit funds beyond the budget authorization as oil prices increase (above theestimate in the budget) is highly inappropriate when fiscal discipline is most needed. This practiceis possible because the heads of the government units know that a large proportion of oil exportsbecomes fiscal revenue through oil taxation. For them, it pays to be ahead of the "spending game"by committing funds (above the approved budget), when the ordinary fiscal revenue increases asunexpected export revenues materialize.
2.56 A good beginning would be an annual budget based on multi-year conservativeestimates of future oil prices that would provide a better sense of the direction of future oilrevenues. If prices increase unexpectedly, the additional revenues should be set aside as foreign
10/ See World Bank, Venezuela Oil and Exchange Rates. Historical Exzerience and Policy Options, ReportNo. 10481-VE, February 1993, Figure A.13.

- 31 -
assets of the government to be used according to clear and simple rules the administration woulddevelop.
2.57 The implementation of the 1992 Budget Law should emphasize the new ex-postreviews that the Law allows rather than ex-ante expenditure controls. A new system to assess howthe budget was spent should substitute for the "control previo" of the Controller's office, a processthat has no relation to the effectiveness of public spending. The management of publicexpenditures will be made more efficient by improving the coordination between the tax andbudget offices and the Controller's office.
2.58 Central Administration Restructuring. The Government should consider a majorrestructuring of its central administration, beginning with autonomous entities, such as those inhigher education, which account for about 3 percent of GDP but seem to have no clear purpose.There is a common perception that employment in many of these entities is excessive. Upgradingpersonnel skills and redirecting financial allocations should be accorded some importance, so that,for example, in health and education overhead and administrative costs, now representing a majorshare of overall spending, are not given priority while serious shortages of medical supplies andteaching materials prevail.
2.59 Decentralization. During 1989-94, transfers from the central to the localgovernments have increased by law from 16 percent to 20 percent of the central government'sordinary revenues. These transfers represent a major source of fiscal disequilibrium, because theyhave not been matched by additional service responsibilities by the local governments. The centralgovernment needs to agree on changes to the system of prestaciones sociales so that its redundantpersonnel can be transferred to the local governments, along with the responsibilities for theprovision of services. Under the current rules, the central government would have to transfer theaccumulated severance reserves of its employees to the local governments. The centraladministration's estimated liabilities for severance payments are about US$14.4 billion, which are amajor obstacle to the transfer from national to regional governments of the education and healthsystems.
2.60 Privatization. The Government should consider extensive privatization to fullyeliminate the 1 percent of GDP it transfers to money-losing companies every year. Privatizationproceeds can be used to reduce domestic debt and debt service and to honor other commitmentslike prestaciones sociales. It will also enhance revenues because privatized companies that showprofits will pay corporate income tax. The Government is planning to continue its privatizationprogram to allow private sector participation in the CVG companies, mining, and the oil sector.
2.61 PDVSA. The Government has reviewed the proposed investment program ofPDVSA, which over the last five years has had investments equivalent to about 5 percent of GDP.This is the single largest public investment and is much larger than the investments in basicinfrastructure and social sector services.

- 32 -
2.62 PDVSA can no longer afford to finance projects with uncertain or low returns, andit is therefore important that the company focus on traditional areas where the volume of light andmedium crude oil reserves is expected to be sizable, and on fields with a history of higher per-wellproductivity. Efficiency would increase by privatizing many activities, including the distributionand sale of refined products and natural gas, and expansion of refinery capacity. Moreover, manyof the new projects proposed in PDVSA's plan also stand to benefit substantially from privatesector financing and participation (see Chapter 7).
2.63 PDVSA's latest plan includes new associations allowing the private sector to bid forexploration work all over the country. The company expects to get Congress approval for theproposed associations, within the existing legal framework. However, changes in the legal andtaxation system affecting the oil sector might be needed to attract a critical mass of privateinvestors and generate more tax and royalty revenues than PDVSA could do on its own (seeChapters 8 and 9).
2.64 Banking System. Today, the cash cost to the Government of paying off depositorsin failed banks has been about 12 percent of GDP. The final cost will likely be higher becausethis estimate does not take into account the poor quality of the intervened banks' portfolio, whichhave been transferred to the Government as collateral for its financial assistance. Moreover, theremaining non-intervened banks, might also need support; their financial situation is now beingassessed.
2.65 In the very short-term, further disruptions of the payments system must be avoidedby immediate payment of deposits up to an announced limit. This is important to gain the public'sconfidence on the banking sector and avoid unnecessary pressure on the remaining non-intervenedbanks.
2.66 Other specific actions to deal with the non-intervened banks include to provide theGovernment with enough information to assess their solvency. The non-intervened banks shouldaccept a three-year recapitalization plan and must comply in full with the new Banking Law. Atthe same time, the public agencies involved in the banking system should improve theircoordination, to avoid ambiguities in the definition of their individual responsibilities. In addition,FOGADE, the government's deposit insurance agency, should be properly endowed to make theguarantee system credible.
2.67 Over the medium term, the Government's strategy will require a plan to cover theGovernment's banking sector losses. This might involve additional non-oil tax revenues andprivatization. Moreover, additional funds will be required to support the modernization of theBanks Supervision Agency and of FOGADE. These modernization would involve personneltraining, a review of operational practices, and office equipment. The Government needs also tostart selling the assets of the intervened banks.
2.68 Debt Service. External debt service accounts for only about 2.6 percent of GDP.The stock of public external debt (about US$25.6 billion) was about three times larger than the

- 33 -
stock of domestic debt in early 1994, but domestic debt has increased in 1994 because of thebanking sector crisis and must be given serious attention in any strategy of fiscal correction.
2.69 Privatization can help towards less reliance on expensive domestic debt. Foreignreceipts from the sale of public assets could be allocated to retire domestic debt, and a soundprivatization program can provide the right signal to facilitate the placement of Venezuela's publicdebt in international markets at comparatively lower rates than in the recent past.
2.D Poverty Reduction
2.70 Trends in the Incidence of Poverty. The Venezuelan economy achieved both highgrowth and price stability between the 1950s and the end of the 1970s. By 1970, only Argentina,Chile, and Costa Rica had poverty head-count ratios lower than Venezuela's"', and povertycontinued to decline through 1982, while income distribution showed signs of improvement.However, the apparent sustained growth masked fundamental problems that were developing,because growth was not achieved through productivity gains. Instead, growth was sustained byhigh levels of investment that became unsustainable once oil revenues declined.
2.71 All information suggests that poverty began to grow during the 1980s (Table2.5)L2' as the previous economic strategy collapsed. The data indicate a reduction in theincidence of poverty from 1989-91. More recent data are not available, but given the GNP declinein 1993, incomes of the poorest segments of society probably decreased, and the distribution ofincome may have worsened.
2.72 Main Determinants of Poverty in Venezuela. The major factors that explain thepersistence of poverty are: 1) inappropriate economic policies and poor economic performance; 2)high taxation of labor that discourages employment in the formal sector; and 3) social programsthat have been poorly managed by the government.
11/ See Marquez, Gustavo, Poverty and Social Policies in Venezuela, April 1993.
12/ The variance in poverty estimates has resulted from data limitations. For example, there is no accepteddefinition of the poverty line in Venezuela, and much of the work that has been done on poverty there hasbeen based on the 'Encuesta de Hogares" eamed income survey, without establishing a norm for thetreatment of underreporting of income. While the existing data serves to gauge trends in poverty andincome distribution, effective policy making and project design continue to be hampered by inadequateinformation regarding the conditions of the poor in Venezuela. In an effort to improve the quality of thepoverty information in use in Venezuela, the World Bank is currently comparing the results of the threehousehold surveys (the Household Expenditure Survey, the Encuesta de Hogares, and the Social Survey)with a view to identifying data distortions. OCEI is also considering possible modifications to theHousehold Survey that would broaden its coverage and improve income data.

- 34 -
Table 2.5: A Comparison of Poverty Estimates from Different StudiesPoverty Headcount Indices
World Bank Morley/Alvarez World Bank Gustavo MirquezVenezuela Poverty Study." Poverty and Adjustment Poverty and Income Poverty and Social
in Venezuela. Distribution in Latin Policies in Venezuela.America.
1980 32.6%21' 24.0% 11.5% 17.7%
1989 53.7% 48.2% 34.3% 41.3%
1991 na na na 34.6%
1/ Using OCEI household survey data for 1989 calculations.2/ 1982 figure.
2.73 Economic Policy and Performance. As discussed in the previous chapter,Venezuela's growth generally has been slow since late 1970s. The decline in oil prices after 1982and the lack of appropriate macroeconomic policies to foster diversification and productiveemployment caused poverty to spread. Under the adjustment program of the Perez administration,most indirect subsidies were replaced by programs targeted to lower-income groups. However, inthe past five years, benefits granted to the poor have been reduced in real terms, and fiscaldifficulties have limited the amount available for these programs since 1992.
2.74 Social Sector Policy. Fiscal revenues for years have been misallocated to areaswhere social returns are low. In the education sector, for instance, 35-45 percent of the budget isspent on higher education, benefiting only a small portion of the population, and a great deal ofspending is devoted to overhead and administration to the neglect of direct classroom expenditureson educational material and teacher training, which would most benefit the poor (see Chapter 4).
2.75 In the health sector, many cost-effective interventions (such as childhoodimmunizations and integrated prenatal and delivery care programs) are being neglected, and publicfacilities and skilled personnel are distributed unequally throughout the country, lessening accessby the poor to a basic package of health services. The sector is ill-prepared to meet the problemsthat contribute to the persistence of poverty, and programs to improve the health status of the poor(like water and sanitation services and regulation of tobacco and alcohol consumption) also sufferfrom inadequate resource targeting (see Chapter 4).
2.76 Poverty Alleviation Policy. The government has redirected generalized foodsubsidies into new programs that target lower income groups, from direct cash transfers to familieswith children in the public schools, to special medical attention and food delivery for pregnant andbreast-feeding women, to the enactment of a new unemployment insurance system. But theseprograms have been slow in reaching those most in need of assistance.
2.77 Access to the programs needs to be improved, especially for the significant numberof poor mothers and children who do not live close to health clinics, and the misallocation ofpublic resources should be corrected. For example, a program like PAMI (designed to provide

- 35 -
medical and nutritional services to women and children in poor areas) serves 21 percent of childrenin the top 30 percent of the population, which is evidence of leakage to families in lesser need ofbenefits.
2.78 Fiscal difficulties have prevented adjustment of the benefits in nominal terms, thereal value of the benefits has been eroded significantly (Table 2.6).
Table 2.6: Public Spending in Social Programs1990 = 100
Programn 1989 1990 1991 1992 1993
School Materials 0.0 100.0 56.1 64.3 32.3
Assistance to Mothers and Infants 0.0 100.0 78.5 120.3 39.9
Milk 0.0 100.0 216.3 242.7 113.0
Cereals (1991 = 100) - 100.0 114.4 54.3
Day Care Centers 157.0 100.0 136.1 155.7 73.9
Food 69.0 100.0 71.9 56.3 30.9
Source: Haydde Garcia, "Gasto Social en Venezuela durante 1989-93," March 1994.
2.79 Recommendations for Chan2e. The first priority is an economic policy aimed at asteady rate of growth with low inflation. Economic growth will increase productive employment,and price stability will help economic growth. This policy should be accompanied by a more evendistribution of human capital investments to reduce the proportion of workers prone to fall belowthe poverty line and to make formal jobs more likely.
2.80 Labor Markets and Social Security Reform. Labor market reform should removethe obstacles to hiring and firing that hinder productivity and the adoption of new technologies, andshould allow total labor costs to reflect current wages. Payroll taxes should be substantiallyreduced to encourage more formal labor contracts and should be consistent with the income taxreform presented to Congress in March 1994.
2.81 The social security system should seek to alleviate the social costs of economicreform. What is significant for large numbers of workers in the informal sector of the economy,as well as for the unemployed, is that the present high mandatory contributions discourageemployers from hiring and maintaining workers, thus forcing people to remain in the unregulatedsector of the economy.
2.82 Energy Pricine Policy. Our estimates indicate that adjusting fuel prices toopportunity cost will increase the expenditures of low-income households by about 3.2 percent.

- 36 -
This could be fully compensated by direct subsidies of about 0.3 percent of GDP, a small amountcompared with the large revenues the price adjustments will generate13'.
2.83 It should be borne in mind that: 1) price adjustments of electricity and LPG willaffect the poor more than others; and 2) price adjustments of gasoline will have the largest impacton all households but mostly on higher-income groups.
2.84 The Government's strategy must include price changes of all fuels to opportunitycost, not only to avoid price distortions among fuels but also to increase fiscal revenues. If theGovernment decides to provide subsidies to the poor, they should be direct subsidies to the lowincome users of electricity and LPG. Because a gasoline price adjustment will have an impact onthe poor through the prices of food, housing and transport (other than gasoline), a subsidy programto alleviate hardship would be appropriate.
2.85 As stated above, the Government must also consider changes in the institutionalarrangements to fully liberalize domestic fuel prices in order to remove political pressure when itsets up an efficient energy price policy.
2.86 Social Poliey Reform. The government considered its direct transfer programs of1989 to be a "new social policy" when they were, in fact, transitory instrumentsli'. In opting forthese programs, it circumvented the resistance of vested interests by creating a new apparatus todeliver targeted services to the poorer segments of the population, without changing thedistribution of budget assignments to "traditional" social programs. In this sense, it did not makeany meaningful effort to reduce the inefficiency of the traditional social programs.
2.87 The organizational and financial gridlock of this system must be broken to free-upresources now held hostage to public enterprises and social services bureaucracy. This moneywould be better spent on primary schooling and preventive and basic health care to benefit thepoor. Long-term increases in this type of spending would improve income distribution and reducepoverty.
2.88 Foremost on an agenda for social sector reform must be market discipline in socialservice delivery. This could be achieved by means of a budgetary system defined not in terms ofentitlement but in terms of measurable results, to introduce a connection between service deliveryand budgetary assignments. Further guidelines for reform include: 1) increasing reliance on userfees to finance some services; 2) reallocating employment away from administrative chores andreducing it where necessary; 3) moving problems and the authority to solve them closer to localgovernments; and 4) reducing the share of high-level services (university education and hospitalcare) for the benefit of primary education and preventive health care (see Chapter 4).
13/ See World Bank, Venezuela: Energy Pricing Report, Chapter VI, op. cit.
14/ See Marquez, Gustavo, Poverty and Social Policies in Venezuela, op. cit.

- 37 -
2.89 Social policies should take equal precedence with economic policies, so thateconomic growth can be met by an expanding supply of qualified human capital. Because theeffects of reform often take time to be felt, it should be undertaken as urgently as the measures forstabilization and growth were.
2.E Economic Outlook
2.90 The medium-term outlook (1995-98) was developed under reform case and low casescenarios, using a standard RMSM model. The results are simply consistent outcomes, underexpected international economic conditions and the economy's parameters. The reform caseassumes that a program, as the one announced in September 1994, and the recommendations ofthis chapter are implemented soon, while the lower case assumes that this does not happen.
2.91 Under the reform case, the Govermnent eliminates foreign exchange and pricecontrols promptly. Non-oil taxes increase and the composition of public expenditures changes.Major adjustments of publicly supplied goods and services, as well as privatization of non-oilactivities, and domestic and foreign private investment in the oil sector, occur. Privatization isaccompanied by foreign capital inflows. The Government would also have a plan that includeslong-term debt issues, higher non-oil taxes, and privatization to deal with the banking sector lossesthat have appeared in the accounts of the consolidado restringido.
2.92 By 1997, the central government's fiscal accounts are balanced and inflation is lowerthan in 1994. The fiscal adjustment and lower inflation support an increase in the real exchangerate, although this increase will be less than otherwise because of foreign capital inflows that willcause the currency to appreciate. A more competitive real exchange rate and lower domesticinterest rates will lead to an expansion of economic activity, especially of tradables and non-oilexports. Starting in 1996, per capita income increases every year and poverty declines.
2.93 Under the low case scenario, the Government continues its foreign exchange andprice controls in the short-term, there is a deterioration of the fiscal accounts because little reformtakes place, and the domestic debt service increases as a result of the Government's assistance tothe banking sector. The central government's deficit increases from 2.6 percent in 1994 to 4.9percent of GDP in 1995 and remains high through 1998. Moreover, the deficit of the consolidadorestringido is much larger because of the banking sector losses. In this case, inflation remainshigher than the historical levels and the real exchange rate appreciates. Growth stagnates through1998 and investment and savings rates remain below historical levels. The privatization programdoes not advance and foreign investment and financing are significantly reduced from early 1990slevels. In this economic environment with high inflation and low growth, per capita incomedeclines every year through 1998 and poverty is likely to increase.
2.E.1 Assumptions.
2.94 Fiscal Policy. As a result of changes in the income tax law, the implementation ofnew non-oil taxes, and better tax and customs administration, in the reform case non-oil taxes

- 38 -
increase from about 8.5 percent in 1994 to about 13.1 percent of GDP in 1998. However, asmentioned before, the Government may want to increase its non-oil tax collection beyond this levelto cover in part the losses of the banking sector. In the low case, non-oil taxes do not increasethrough 1998 (Tables 2.7 and 2.8).
2.95 Oil taxes will depend on the impact of changes to modernize the oil sector. Theprojections assume reforms of the legal, institutional, and taxation systems that would apply toprivate participation in the sector. However, the current system of taxation for PDVSA, includingthe phasing-out of the export reference price, stays in place in the medium term, while theinstitutional framework for PDVSA changes. In the reform case, the projections include oil taxesand royalties from PDVSA and private operations (Table 2.7). The latter correspond to the levelof private sector activity in the oil sector of scenario 2--subject to the fiscal system identified as"surtax 1 "--in Appendix 4. In the low case, there is no private investment in the oil sector,PDVSA remains the only producer and the potential for additional oil production and oil taxrevenues is limited (Table 2.8).
2.96 Revenues from the provision of goods and services by the SOEs are not expected toincrease significantly. This is because the reform case assumes that widespread privatization willreduce the number of SOEs and their impact on fiscal revenues (or losses). Nevertheless,increases in the prices of publicly supplied goods and services, reducing subsidies by about 2percent of GDP, will reduce the Government's losses, especially in the electricity sector.Adjustments in domestic fuel prices increase fuel taxes to about 3 percent of GDP by 1996. In thelow case, current transfers to the SOEs will continue at about 0.6 percent of GDP through 1998and there is no additional revenue from fuel taxes.
2.97 Reforms in the public sector, including the social security system, would facilitatethe decentralization of public services responsibilities and avoid further fiscal imbalances;decentralization is likely to bring improvements in spending efficiency, allowing for reductions inthe level of spending. The reform case assumes only small reductions in central governmentpayments of wages and salaries in the medium term because there are no clear govermnentinitiatives yet to reform the public sector and social security system. A new social security systemas the one proposed above, will have an estimated cost to the government of about 24.1 percent ofGDP (in present value terms). Over 40 years this will be equivalent to 0.6 percent of GDP peryear; the reform case projections assume that the Government starts the social security systemreforms in 1995.
2.98 Reductions in the government's current expenditures are expected from smallertransfers to "entidades administrativas". Most of these units are not part of the core responsibilityof the government and should be eliminated. Transfers to universities and other educationalfoundations should be analyzed carefully to establish priorities. Other spending cuts will comefrom elimination of capital transfers to SOEs as a result of privatization and better pricing ofpublicly supplied goods and services. In the reform case, privatization proceeds are about 0.5percent of GDP during the period, almost enough to cover the cost of the first stage of socialsecurity reforms. Additional privatization might take place to cover banking sector losses. In the
- 39 -
low case, transfers to the "entidades administrativas" remain at about 2.6 percent of GDP andthere are no privatization revenues.
2.99 Monetary Policy. In the reform case, the government specifies a monetary targetcompatible with annual inflation rates in the single digits. This is consistent with the expectedcorrection in the fiscal stance, leads to lower domestic interest rates, and a more competitive realexchange rate than at the end of 1994. In the low case, inflation remains high over the mediumterm at an annual rate of 100 percent. In this scenario, there is also a real exchange rateappreciation over the next five years.
2.100 Trade Policy. In the reform case the authorities liberalize the foreign exchangesystem and reduce trade barriers through bilateral and regional agreements. In the low case, theforeign exchange controls remain and other setbacks in trade policy are likely.
2.101 Other Assumptions. The export prices of oil and other international variables likeinflation and growth rates are standard World Bank projections (Table 2.9). In the reform case,the volume of oil production is assumed to increase from 2.7 million barrels per day (mbd) in1994 to 3.3 mbd 1998 so that Venezuela keeps its production quota of about 10 percent of OPECoutput. However, PDVSA's oil production and exports are lower than those in its 1993-98investment program, because in the reformn case there is increasing private sector participation.The figures on private sector activity correspond to those in Appendix 4 scenario 2. This appendixtook as inputs for the analysis the exploration data from PDVSA's investment program discussed inChapter 7. In the low case, the price of oil products is lower than otherwise, because without theresources to continue exploration, the quality of the products basket will continue to deteriorate.
2.E.2 Results
2.102 In the reform case, the projections show a small economic recovery in 1995 andGDP growth rates increasing every year to reach 5 percent after 1996 (Table 2.10). During1994-98, oil production increases at an average annual rate of 4.8 percent. Non-oil GDP declinesin 1994 but expands at an annual average rate of 3.8 percent afterwards. The share of investmentas a percentage of GDP increases from 9.4 percent in 1994 to 17.9 percent in 1998. Thecomposition of investments changes because private investment increases faster than publicinvestment, as a result of increasing private investment in the oil and non-oil sectors. By 1998,public investment declines to 8.5 percent of GDP, but private investment increases to 7.9 percentof GDP. In the outer years, higher imports and lower foreign reserve accumulations thanprojected here could accommodate higher private consumption levels, consistent with the othermacroeconomic outcomes of these projections.
2.103 During the projected period, the current account shows a surplus of US$2.3 billionin 1995 and increases over the medium term, because imports growth remains moderate. At thesame time, non-oil exports expand faster than in the early 1990s, because of a more competitivereal exchange rate and a continuation of open trade policies. The capital account shows large
- 40 -
inputs of direct foreign investment, due in part to private sector oil investments. In the outeryears, these capital inflows lead to foreign exchange accumulations.
2.104 As expected, the fiscal accounts of the central government are in balance by 1997,as a result of higher non-oil taxes as a share of GDP (Table 2.7). The composition of oil taxeschanges, showing oil tax payments by the private sector at about 1.5 percent of GDP in 1998.The composition of the central government's current expenditures changes to accommodate largerspending in the social programs and transfers to the local governments in 1998 than in 1994.Public investment is dominated by the central government's spending on capital formation andcapital transfers to the local governments, while PDVSA's investment declines from 5.2 percent ofGDP in 1994 to about 4 percent in 1998.
2.105 In the low case, the economy contracts in 1994 and 1995 and shows very lowgrowth rates afterwards (Table 2.11). The current account shows surpluses every year and thereare no foreign investment or external financing. The share of savings at about 17-21 percent ofGDP is lower than the historical average. The central government's deficit remains comparativelyhigh through the 1995-98 period at an average 3.8 percent of GDP (Table 2.8). Moreover, withthe losses of the banking sector, the accounts of the consolidado restringido will show a muchlarger deficit. In this scenario, inflation remains much higher than the historical average, percapita income declines every year during 1994-98 and poverty increases.

Table 2.7: Venezuela: riscal Accounts Reform Case; 1999-9eGDP Shares
Aetma Pro1 .561mm
1999 1990 1991 1992 1993 1904(*) 1995 1999 1997 1996
Cemt*al Ge.Veinmkt R ......Current Income 20.4 23.6 23.3 17.8 16.6 17.9 21.0 23.4 24.1 24.8
Oil Income from PDVSA 14.9 18.7 18.3 11.7 10.1 9.4 9.4 9.9 10.3 10.6
Oil Income from Private Sector 0.1 0.5 1.0 1.5Ta.es 5.2 4.4 5.0 6.1 6.7 8.5 12.5 13.0 12.9 13.1
From NFSOE 0.4 0.3 0.3 0.1 0.1 0.1 0.1 0.1 0.1 0.1Incom Tax 1.7 1.4 1.3 1.4 2.1 1.6 2.5 2.5 2.5 2.5
Customs 1.6 1.4 2.0 2.0 1.9 1.4 1.9 2.2 2.2 2.4Other Taxes (VAT/GST) 0.7 2.9 4.0 4 .2 4 .2 4.1Frm Gasoline Price Increase 2.0 3.0 3.0 3.0Banking Debit Tax (BDT) 1.5 0.0 0.0 0.0 0.0Other 1.5 1.3 1.5 2.5 2.0 1.0 1.0 1.0 1.0 1.0
Central Bank Income 0.3 0.5 0.0 0.0 0.0 0.0 0.0 0.0 0.0 0.0
C etva. ovmeammet zpe mdit-e.Current Expenditures 19.1 19.3 18.3 16.1 15.5 16.7 20.0 19.3 19.1 18.9
wages nd Salaries 4 .2 4.1 4 .3 4.7 4 .6 4 .4 4 .4 4 .2 4.0 4.0Goods and Services 0.8 1.0 1.0 1.1 1.0 1.0 1. 0 1.0 1.0 1.0
Domestic Debt 0.5 0.7 0.5 0.9 0.7 1.5 2.5 2.5 2.5 2.5External Debt 3.2 2.6 3.0 2.6 2.4 2.7 4.0 3.6 3.3 2.9Regional & Hunicipal Governments 1.7 1.8 2.3 1.8 1.6 1.9 2.1 2.3 2.4 2.5Administrative Entities 2.1 2.0 2.3 2.4 2.7 2.5 2.3 2.0 2.0 2.0Social Progr-m 0.3 0.7 1.0 1.1 0.9 0.9 2.0 2.3 2.7 3.0Social Security Reform 0.6 0.6 0.6 0.6Non-budgetary K.penditures 0.6 0.3 0.2 0.1 0.2 0.7 0.4 0.1 0.0 0.0E chanqe Losses 2.0 2.3 1.0 0.0 0.0 0.0 0.0 0.0 0.0 0.0
Central Bank Losses 0.0 0.1 0.7 0.2 0.3 2.0 0.0 0.0 0.0 0.0Others 3.7 3.7 2.1 1.3 1.1 1.0 0.8 0.7 0.6 0.4
Central mI.r O mDt Capitl Zxpamdits.ze ad If.t LandiD 2.8 5.5 6.5 5 .4 4,8 4.0 5 .5 5 .8 5.1 4. 7Capital Formation 0.1 0.8 1.2 1.3 1.0 0.6 2.3 3.0 2.6 2.2Transfer. to Local Governments 0.9 1.7 2.0 1.7 1.5 1.6 2.1 2.3 2.4 2.5Transfers to Administr.tive Entitles 0.1 0.2 0.3 0.2 0,3 0.4 0.3 0.2 0.1 0.1
Other Transfers 0.0 0.0 0.0 0.0 0.0 0.2 0.1 0.0 0.0 0.0Financial Investments 1.7 2.9 3.0 2.2 2.0 - 0.7 0.3 0.0 0.0
Cntral e..rm.nt Ovec. ll InSpl.. (Deficit) -1.5 -1.2 2.6 -3.6 -3.6 -2.6 -4.3 -1.7 0.0 1.2
Memo:Domestic Debt Interest
Including FOGADE 0.5 0.8 0.6 1.6 1.0 1.5 3.0 3.0 3.0 3.0
Capital Formation 8.3 8.8 9.5 9.7 8.1 7 .4 8.9 8.4 7.7 7.0Central Government 0.1 0.8 1.2 1.3 1.0 0.6 2 .3 3.0 2.6 2.2
PDVSA 3.3 3.9 5.4 5.6 5.3 5.2 4.5 4.0 4.0 4.0NYSOE 4.9 4.1 2.8 2 .8 18 1.6 2.0 1.3 1.0 0.8Other 0.0 0.0 0.0 0.0 0.0 0.0 0.1 0.1 0.1 0.1
Financial Investments n.e.i 0.3 0.5 1.1 0.4 0.2 13.7
R..triit.d Pabli. Sestor O, ra11 Surpl.s (D.ficit) -1.9 0.9 -0.6 -5.8 -3.3 -15.4 -0.8 4.1 - -
NIlt--CThe 1994 figur. for C-ctra1 Gover-aeot Over-ll Surplue (Deficit) .eclud.s the baking crisis cost which is i-oluded ic th. ia item('F Prel iansry Data

Table 2.8: Venezuela: Fiscal Accounts - Low Case; 1989-99GDP Shares
Aetoal Pnj .stio..
1989 1990 1991 1992 1993 1994(-) 1995 1996 1997 1998
Centrai Govern.t R .ene.Current Income 20.4 23.6 23.3 17.8 16.6 17.9 17.6 18.1 18.7 19.5
O0l Income from PDVSA 14.9 18.7 18.3 11.7 10.1 9.4 9.4 9.9 10.4 11.0Ol Income from Private Sector 0.0 0.0 0.0 0.0 0.0
Taxes 5.2 4.4 5.0 6.1 6.7 8.5 8.2 8.2 8.3 8.5From NFSOE 0.4 0.3 0.3 0.1 0.1 0.1 0.1 0.1 0.1 0.1
Income Tax 1.7 1.4 1.3 1.4 2.1 1.6 2.2 2.3 2.3 2.3
Custome 1.6 1.4 2.0 2.0 1.9 1.4 1.9 1.9 2.0 2.1Other Taxes (VAT/GST) 0.7 2.9 3.0 3.0 3.0 3.0From Gasoline Price Increase 0.0 0.0 0.0 0.0 0.0
Banklnq Debit Ta. (BDTI 1.5 0.0 0.0 0.0 0.0
Other 1.5 1.3 1.5 2.5 2.0 1.0 1.0 1.0 1.0 1.0
Central Bank Income 0.3 0.5 0.0 0.0 0.0 0.0 0.0 0.0 0.0 0.0
Central Go.rnmnt txp.nditar..Current Expenditure- 19.1 19.3 18.3 16.1 15.5 16.7 19.4 19.3 19.4 19.2
Wages and Salar-es 4.2 4.1 4.3 4.7 4.6 4.4 4.5 4.5 4.5 4.4Goods and Services 0.8 1.0 1.0 1.1 1.0 1.0 1.0 1.0 1.0 1.0Domestic Debt 0.5 0.7 0.5 0.9 0.7 1.5 3.0 3.5 4.0 4.0External Debt 3.2 2.6 3.0 2.6 2.4 2.7 3.8 3.4 3.2 3.0ReqIonal & Municipal Governments 1.7 1.8 2.3 1.8 1.6 1.9 1.8 1.8 1.9 1.9Ad-minstrative Entities 2.1 2.0 2.3 2.4 2.7 2.5 2.6 2.6 2.6 2.6Soc-al Program 0.3 0.7 1.0 1.1 0.9 0.9 1.3 1.3 1.3 1.3 Social Security Reform 0.0 0.0 0.0 0.0 0.0
Non-budgetary Expenditures 0.6 0.3 0.2 0.1 0.2 0.7 0.4 0.1 0.0 0.0Exchangs Losses 2.0 2.3 1.0 0.0 0.0 0.0 0.0 0.0 0.0 0.0Central Bank Losse- 0.0 0.1 0.7 0.2 0.3 2.0 0.0 0.0 0.0 0.0Others 3.7 3.7 2.1 1.3 1.1 1.0 1.1 1.0 1.0 1.0
Centrai Govrnnt CaPit.. lapenditr.. end Net Lendin 2.8 5.5 6.5 5.4 4.8 4.0 3.2 3.0 2.8 3.0Capital Formation 0.1 0.8 1.2 1.3 1.0 0.6 0.4 0.6 0.7 0.9Transfers to Local Goversnents 0.9 1.7 2.0 1.7 1.5 1.6 1.8 1.8 1.9 1.9Transfers to Adinlstrative Entities 0.1 0.2 0.3 0.2 0.3 0.4 0.3 0.3 0.2 0.1Other Transfers 0.0 0.0 0.0 0.0 0.0 0.2 0.1 0.0 0.0 0.0Financial Investments 1.7 2.9 3.0 2.2 2.0 - 0.7 0.3 0.0 0.0
Central Governnt 0-rall Surplue (D.fisit) -1.5 -1.2 2.6 -3.6 -3.6 -2.6 -4.9 -4.1 -3.4 -2.6
Memo:Domestic Debt Interest
Including FOGADE 0.5 0.8 0.6 1.6 1.0 1.5 3.5 4.0 4.5 4.5
Capital Formation 8.3 8.8 9.5 9.7 8.1 7.4 7.4 7.5 7.6 7.8Central Government 0.1 0.8 1.2 1.3 1.0 0.6 0.4 0.6 0.7 0.9PDVSA 3.3 3.9 5.4 5.6 5.3 5.2 5.0 5.0 5.0 5.0NFSOE 4.9 4.1 2.8 2.8 1.8 1.6 2.0 1.9 1.9 1.8Other 0.0 0.0 0.0 0.0 0.0 0.0 0.0 0.0 0.0 0.0
FinancIal Investments n.e.1. 0.3 0.5 1.1 0.4 0.2 13.7
Re.trieted Publio Soetmr 0-eral Purple. (D.fieit) -1.8 0.9 -0.6 -5.8 -3.3 -15.4 -6.3 -4.0 - -
85t-.:The 1994 figure for Central Gover.n-et Overall Surplus (Defi-it) .ecludee the banking criis cost chih ie i-cludd in th.e o it..(-) Pr-Ii-inury Date

Table 2.9: Venezuela: Trade Assumptions; 1995-98
1995 1996 1997 1998
Oil Price (US$/BBL) 1/
World Average OPEC 15.3 16.0 17.3 18.5
Low Case
Oil Production (thousand of BBL/day) 2769 2846 2883 2920
PDVSA 2769 2846 2883 2920
Private Projects 0 0 0 0
Oil Price (US$/BBL)
Average Venezuela Export 12.3 13.0 14.3 15.5
Reform Case
Oil Production (thousand of BBL/day) 2789 2991 3153 3315
PDVSA 2769 2846 2883 2920
Private Projects 20 145 270 395
Oil Price (US$/BBL)
Average Venezuela Export 13.3 14.0 15.3 16.5
Notes:
1/ World average OPEC oil price forecasted by IECIT.

Table 2.10: Venezuela: Macroeconomic Indicators; 1989-98
Reforzm Case
Actual projections
1939 1990 1931 1992 1993 1994(*) 19S5 1996 1997 1998
GDP (Urs. of as) 1,510 2,279 3,036 4,131 5,449 8,768 13,627 19,656 26,716 33,906
Non-oil GDP 1,182 1,636 2,363 3,346 4,491 7,326 11,243 15,950 21,329 26,725
Oil GDP 328 643 673 786 959 1,441 2,383 3,706 5,387 7,182
ea 1 Oowth RatesGDP -8.9 6.9 10.4 5.4 -0.4 -3.3 1.0 3.0 4.0 5.0
Non-oil GDP -10.9 5.0 10.4 7.4 -1.7 -5.8 1.0 1.7 3.5 4.9
Oil GDP -0.4 13.9 10.3 -1.2 4.6 5.6 0.9 7.2 5.4 5.2
GDP per capita 4.1 7.9 3.1 -2.6 -5.4 -1.3 0.9 1.8 3.0
Total Consumption per capita 0.5 6.5 4.7 -3.0 -7.7 -6.5 -0.9 1.0 2.6
Xawestment (CutrSnt MR Shr0s)
Gross Investment 12.7 10.2 18.7 23.7 18.7 9.4 13.9 14.7 16.1 17.9
Private Fixed Investment 7.9 4.9 8.2 8.9 9.0 3.5 4.3 4.8 6.0 7.9
Public Fixed Investment 9.0 9.2 9.6 12.2 10.5 9.2 9.2 9.1 8.9 8.5
Change in Stocks -4.2 -3.9 0.9 2.6 -0.8 -3.3 0.4 0.7 1.2 1.5
Savings (Current DP abares)
Domestic Savings 24.1 29.5 23.4 21.2 18.1 18.7 22.1 23.5 24.5 25.3
National Savings 18.7 27.7 21.9 18.3 15.4 16.4 18.7 20.5 22.1 23.4
roreriga rada (Current GDP Shares)
Exports GNFS 32.2 38.5 30.4 25.7 26.0 29.2 31.1 33.2 34.8 36.1
Imports GNFS 21.4 19.1 25.4 28.5 26.5 19.9 22.9 24.5 26.4 28.7
Current xecount alaance (Ran. of uS$) 2.2 8.3 1.5 -3.8 -2.2 4.1 2.3 3.2 3.5 3.6
as a percentage of current GDP 5.0 17.0 2.9 -6.2 -3.7 7.0 4.0 5.2 5.4 5.0
Debt asd Debt Service
DOD/GDP 73.9 66.7 65.9 57.6 57.2 60.1 53.6 49.3 44.1 39.2
Debt Service/Exports GNFS 31.7 33.3 25.3 27.5 31.3 23.6 28.3 25.3 22.7 19.8
Interest Payments/Exports GNFS 21.7 16.9 15.7 14.4 13.9 12.9 14.9 12.6 11.0 9.6
Iateruational Reserves (months import)
Net Official Reserves 5.3 10.8 9.4 6.7 7.0 9.0 8.4 10.3 12.1 13.4
BCV Gross Liq. Operational Reserves 4.1 5.2 7.1 6.2 5.4 6.7 6.1 7.9 9.7 11.1
Znflation Rate 81.0 36.5 31.0 31.9 45.9 70.8 50.0 40.0 30.0 20.0
Real Nxahaqe- Rate (19S4-100) 58.6 56.3 59.3 62.9 64.8 64.1 62.3 62.3 62.3 62.3
Notes:(-) Preliminary Data

Table 2.11: Venezuela: Macroeconomic Indicators; 1989-99Low Came
Actual Projections
1989 1990 1991 1992 1993 1994 (*) 1995 1996 1997 1999
MP (n.A. of Rs) 1,510 2,279 3,036 4,131 5,449 8,768 17,427 35,244 71,677 145,683
Non-oil GDP 1,182 1,636 2,363 3,346 4,491 7,326 14,724 29,524 59,418 119,460
Oil GDP 328 643 673 786 958 1,441 2,703 5,719 12,258 26,224
Real Growth RatesGDP -8.9 6.5 10.4 5.4 -0.4 -3.3 -1.5 1.0 1.0 1.0
Non-oil GDP -10.9 4.5 10.4 7.4 -1.7 -5.8 -2.0 0.4 0.9 0.9
Oil GDP -0.4 13.9 10.3 -1.2 4.6 5.6 0.2 2.8 1.3 1.3
GDP per capita 3.7 7.9 3.1 -2.6 -5.4 -3.8 -1.4 -1.4 -1.4
Total Consumption per capita 0.0 6.5 4.7 -3.0 -7.7 -9.0 -2.0 -0.4 -0.1
Inest.ant (Current MP Shares)Gross Investment 12.7 10.2 18.7 23.7 18.7 9.4 12.5 13.8 14.0 14.3
Private Fixed Investment 7.9 4.9 8.2 8.9 9.0 3.5 4.0 4.0 4.0 4.1
Public Fixed Investment 9.0 9.2 9.6 12.2 10.5 9.2 9.5 9.6 9.7 9.8
Change in Stocks -4.2 -3.9 0.9 2.6 -0.8 -3.3 -1.0 0.3 0.3 0.3
Savings (Current GDP Sbares)Domestic Savings 24.1 29.5 23.4 21.2 18.1 18.7 20.7 21.2 20.9 20.4National Savings 18.7 27.7 21.9 18.3 15.4 16.4 17.3 18.3 18.2 18.0
loreign Trade (Current QDP Sbares)Exports GNFS 32.2 38.5 30.4 25.7 26.0 29.2 28.1 29.1 30.1 31.4
Imports GNFS 21.4 19.1 25.4 28.5 26.5 19.9 19.9 21.8 23.2 25.2
Current Account Balance (Bus. of US$) 2.2 8.3 1.5 -3.8 -2.2 4.1 2.4 2.4 2.5 2.2as a percentage of current GDP 5.0 17.0 2.9 -6.2 -3.7 7.0 4.1 3.9 3.7 3.3
Debt and Debt ServiceDOD/GDP 73 .9 69.5 63.1 57.6 57.2 60.1 51.0 46.9 42.4 38.8
Debt Service/Exports GNFS 31.7 33.3 31.1 27.5 31.3 23.6 30.3 27.3 24.6 21.7Interest Payments/Exports GNFS 21.7 16.9 16.0 14.4 13.9 12.9 15.8 13.8 12.4 11.1
1litarnational Reserves (mntbs inports)Net Official Reserves 5.3 10.8 9.4 6.7 7.0 9.0 8.2 8.1 8.0 7.8BCV Gross Liq. Operational Reserves 4.1 5.2 7.1 6.2 5.4 6.7 5.6 5.4 5.3 5.1
Inflation Rate 81.0 36.5 31.0 31.9 45.9 70.8 100.0 100.0 100.0 100.0
Real Exchange Rate (1984-100) 58.6 56.3 59.3 62.9 64.8 64.1 67.4 68.1 68.7 69.0
N.tes:(*) Preliaml.ary Data

Chapter 3. Government Revenues
3.A Introduction
3.1 This chapter analyzes the main features of Venezuela's fiscal revenues from1970-931': 1) high dependency on oil revenues; 2) low and declining non-oil revenues; 3)strong negative correlation between oil and non-oil revenues; and 4) strong positivecorrelation between fiscal revenues and expenditures. It also compares the main features ofpublic finances in Venezuela and Mexico, and offers some policy recommendations.
3.B Main Characteristics of Fiscal Revenues
3.B.1 Oil Revenue Dependency
3.2 Oil taxes and royalties have averaged 66.1 percent of fiscal revenues from1973-93 and have been highly volatile during the same period. They reached a maximum of85.2 percent in 1974 and a minimum of 46.6 percent in 1986. The trend in these revenueshas been downward since 1974 in spite of comparatively high rates of taxes and royalties(Figure 3.1), because PDVSA's ability to generate large taxable net revenues has decreasedwith falling oil prices.
3.3 Oil Taxation Instruments. Rates, and Determinants. The oil income taxand royalty are the main instruments of oil taxation. The tax is set at about 67.7 percent ofnet revenue, the royalty at 16.7 percent of oil production. There is also an export referenceprice (the actual export price plus a margin) established on a yearly basis by the governmentand used in the estimates of oil export revenue for income tax purposes2 '. In 1993,Congress approved legislation to fully phase out the export reference price by 1996. Oiltaxes and royalty revenues depend primarily on income tax and royalty rates, and theinternational oil price, exchange rate, oil production level, and export reference price.
3.4 Oil Income Tax. The oil income tax rate is applied to PDVSA's net revenue,defined as operational income minus operational expenditures that exclude taxes and royaltypayments. Net revenue is positively related to oil income (determined by the oil price andproduction volume and the nominal exchange rate) and negatively related to operationalexpenses.
3.5 The de facto tax rate on net oil revenue, as opposed to the legal rate, hasaveraged 81 percent from 1976-93 but has varied widely. It is high by internationalstandards (see Chapter 9) and has been determined arbitrarily, ranging from 98.4 percent in
1/ In this chapter "fiscal revenues' refer to the central government's total revenues.
2/ Chapter 9 explains Venezuela's oil taxes and royalties in more detail, compares them with those of othercountries, and offers recommendations for change.

- 47 -Figure 3.1
Ca"l Gonment Revnues; 1P04GDP Shwm
40
20.~~~~~~~~~~~a
I 0 ~ ~ ~ ~ ~ ~ ~ ~~~~=-
970 1In 1974 1976 17 10 11 114 1ON I 11 191
1981 to only 65.8 percent in 1979. A major reason for this fluctuation has been changes inthe export reference price through Presidential decree.
3.6 Royalties. The legal royalty rate has been constant for many years at about16.7 percent of the value of oil production; however, the actual ratio of royalty revenues tooil (GDP) production has not been fixed. From 1976-91, this ratio averaged 17.3 percent(close to the legal 16.7 percent); but it was 25.5 percent in 1975 and only 9.8 percent in1981. Surprisingly, royalty revenues are more highly correlated to oil volumes than to oilprices (see Appendix 1), partly because of the discretion the Ministry of Energy and Minesuses in establishing the "price" for royalty payments.
3.7 Oil Taxation Prospects. PDVSA's ability to transfer revenues to the centralgovernment through tax payments is decreasing because international oil prices havedeclined, operating costs have increased, and the company is servicing its external debt.These changes are reflected in a decline in the ratio of PDVSA's operational revenues toexpenses. From 1976-93, this ratio averaged 5.2. While it was almost always above thisfrom 1976-85, it has declined in the recent past (excluding 1989-90) to an average of 3.9.The increase to 7.2 in 1989 and 7.1 in 1990 is mostly explained by the impact of realdevaluation on PDVSA's income (see Chapter 1).
3.B.2 Non-Oil Taxation
3.8 Non-oil tax revenues have also been decreasing (Figure 3.2), from a peak of11 percent of GDP to a low of 5 percent in 1990. (Data after 1989 include privatizationproceeds.) Since 1987, the composition of non-oil taxes has changed as well; income taxrevenues have declined significantly in real terms, thus increasing the share of indirect taxes

- 48 -
in total taxes. The decline in non-oil tax revenues is due to tax evasion and avoidance, aswell as to erosion of the tax base because of inflation and other factors.
3.9 Income and Payroll Taxes. Personal income tax payments have declinedsharply from a peak of 1.5 percent of GDP in 1981 to a negligible amount in 1992.Corporate income tax payments (excluding income tax payments by PDVSA) have declinedfrom about 2.7 percent of GDP in 1987 to about 1.3 percent in 1992 rising to 1.9 percent in1993. Payroll taxes were about 1.5 percent of GDP from 1980-93 (Figure 3.3).
Flgure 3.2
Cenl Ooywnt Non-ON R.vsnues t9GDP 8hU
12\st
oz IM I I I I I I I1im ie im u1_ 1U7 im urn usa urn u92 u9se
3.10 Indirect Taxes. Fiscal revenues from fuel taxes were only about 0.2 percentof GDP from 1970-81. They increased through the early 1980s to almost 1 percent of GDPin 1986, but again declined to about 0.2 percent of GDP in 1991. Fuel tax collectionincreased in 1992, with revenues accounting for 0.7 percent of GDP, then declined again in1993 to 0.6 percent of GDP (Figure 3.4). Customs duties, the other important indirecttaxes, averaged about 1.8 percent of GDP from 1980-93, and have shown an upward trendsince 1990 after the trade reform (Figure 3.5). The share of indirect tax revenues in total taxrevenues increased from an average of 9.9 percent between 1980-86 to about 13.3 percentbetween 1987-92. This is partly explained by the large decline in income tax collection after1987.
3.11 Tax evasion and avoidance are the main reasons for the decline in income taxrevenues. Tax evasion in essence is a violation of the tax laws, while tax avoidance seeks toreduce obligations by using loopholes in the legal framework. Together, they are estimated

- 49 -
Flgure 3.3
InCOMM and Payroll Sax.uI 1970-93
3 -1DP Ehaxr
2.5 - >- 4orpozate
2.5 .
4. 70 1972 1974 1970 197B 1980 1982 19B4 19BB 19B 1990 1992
10.5 -
(1 Payrol Tw hndude modal um* y lex Ow Mm ak taa: to unwnp hwwt nmom and Ow doyw facf tclyax(-I Cpof hxm wzxlWcmtx pwfdf by PDVSA
S 1Pua:OCEPRE
Figure 3.4
G"ollneT^x Renw; 1FO-
0.5
0.
-0.5
(*eoI ae Indd Iod Ie% I x Ie Ieh'*i tax tI I emIo~e I kiwc I n tI Iaw Iait I I I I I
ion 1972 1974 17t 1978 19 1982 19e4 tax pay ien lb V
SoweOCEPRE
to cause a revenue loss of 64 percent, based on a comparison of potential revenue and actualcollection, and taking into account exonerations, exemptions, and investment incentives.3
31 See GarcCa, Gustavo. Fiscal Issues and Non-oil Taxation in Venezuela, mimeo, November 1993.

- 50 -
Figure 3.5
Reonw from Import DutIs 1704GDP She
2.5
2
1970 1B72 1974 1076 17o 160 lOU 1064 UN lS 1o0 g o_:mocEPR
3.12 The differences between tax evasion and avoidance are not always clear buttheir causes and solutions are similar. Several features of the tax system encouraged highlevels of tax evasion and avoidance for many years: high income tax rates, low penalties andfees, poor tax enforcement and administration, and the lack of general taxes. The effect ofthese features on tax collection and reduced revenues through 1990 are discussed below.Reforms in the tax system after 1990 are analyzed in Chapter 6.
3.13 A) High Tax Rates and Double Taxation of Dividends. Before the 1991income tax reform, nominal rates were as high as 45 percent for individuals and up to 50percent for corporations. Dividends were taxed at both the corporate and personal levels,and tax rates were not adjusted for inflation. These features of the taxation systemencouraged tax avoidance and evasion.
3.14 B) Low Penalties and Fees. The Tax Code establishes penalties, sanctionsand fees, the legal and judicial procedures for disputes between the tax administration andtaxpayers, and the rights and obligations of taxpayers. Penalties and fees were nominal, andinterest rates for overdue payments had a ceiling of 18 percent; moreover, overdue paymentswere not adjusted for inflation until the 1992 reform. As a result, the cost of getting caughtfor evasion was greatly reduced over time.
3.15 C) Inefficient Tax Enforcement. Another factor that induced tax evasion wasthe complicated legal procedure for appeals established in the Tax Code. The real impact ofthe penalties and the tax itself were eroded by the number of appeals allowed to taxpayers by

- 51 -
the tax administration. This situation changed significantly after the reform of the Tax Codecame into effect at the end of 1992. The judicial process reinforces the negative impact ontax collection that results from delays in the application of penalties. If an appeal is rejectedby the tax administration, the taxpayer can turn to the courts. The request enters the judicialsystem, where administrative deficiencies and the complicated procedures defined in the TaxCode can postpone a final decision for several years. Final decisions in the courts for theperiod 1988-90 had taken an average of 17.5 years.
3.16 D) Weak Tax Administration. Tax enforcement is still severely impaired bya weak tax administration, whose resources have been diminishing for several years, andwhose employees have decreased, in spite of the increasing number of taxpayers.
3.17 The most serious consequence of poor tax administration is the lack of reliableinformation on taxpayers. The current "Registro de Informaci6n Fiscal" (RIF) is virtuallyuseless. Some taxpayers have more than one RIF number and many RIF numbers areassigned to more than one taxpayer. Moreover, some essential data about taxpayers such astheir addresses and names are never updated in the RIF.
3.18 There are no research units, information systems or databases on taxation andeconomic variables for use in the design of tax policy and tax regulations; as a result, this isaccomplished without any technical support. There are no centers where taxpayers canobtain information on tax returns, regulations and deadlines. Most of the time regulationsare issued without any notification to taxpayers.
3.19 The tax administration has no authority even to apply sanctions. Employeemorale is poor, salaries are extremely low and the staff is ill-qualified for the tasks it shouldperform. In general, employees are not abreast of changes in the tax laws or regulations thataffect their day-to-day work. Computers are almost a luxury in the tax administrationoffices, especially outside Caracas, and the physical infrastructure is also inadequate.
3.20 E) Lack of Other General Taxes. Venezuela did not have a sales or a valueadded tax (VAT) until recently, which has reduced the tax administration's effectiveness incontrolling income tax evasion. Taxes like the VAT and the new corporate asset tax (CAT)(see Chapter 6) can help indirectly to discourage tax evasion in three ways: first, byenabling cross-checking of information about taxpayers; second, by creating mechanisms forcompensating taxpayers, so that paying one tax might cause a decrease in another, as in thecase of the CAT and the income tax; third, by inducing taxpayers to report transactions, thusavoiding the transfer of taxes, of which the system of credits and debits of the VAT isprobably the best example. To obtain a credit, the taxpayer would need a receipt from theprovider showing the VAT charged on the sale; otherwise the taxpayer would pay more thanthe value added.

- 52 -
3.21 Inmact of InMlation: The "Tauzi effect." The income tax in Venezuela isstrongly affected by the "Tanzi effect," which is the loss in real value of fiscal revenueresulting from inflation between the time the tax liability is incurred and the tax is actuallycollected. This factor has been important since inflation accelerated after 1985. Until 1992,the average lag in collection was about nine months, which caused an annual loss in the realvalue of revenue of approximately 24 percent from 1990-92. Changes in regulations in early1993 reduced the average lag to six months. However, the loss of about 18 percent in 1993is still very high. Inflation has eroded these income tax payments significantly, and thecorrelation coefficient between taxes and the rate of inflation was -0.75 from 1982-92.
3.22 Exemptions and Exonerations. Venezuela's income tax law is characterizedby extensive personal deductions and excessive fiscal incentives and exemptions forcorporations, all of which have contributed to a reduction of the tax base. In addition, thelaw has several technical loopholes for tax avoidance, most of which have survived variousreforms since 1967 and even the 1991 reform. The discussion below focuses on the 1978and 1986 Income Tax Laws to explain the major drop in income tax collection after 1987.
3.23 The law allows deductions for education and medical expenses, life, medicaland auto insurance premiums, residential rent, and interest on mortgages. In addition,taxpayers may deduct social security tax payments, pension fund contributions, publicutilities payments, and payments to professionals for non-commercial services, such as feesto lawyers for obtaining a divorce. Most of these deductions are not justified on economicgrounds and benefit mainly the higher income groups, which can afford such expenditures.Until the 1991 tax reform eliminated all ceilings, some of these deductions had ceilings,while others did not. In any event, such liberal deductions are responsible, to a certainextent, for some discontinuity in tax payments, reversing the intended progressiveness in thenominal tax rates.
3.24 Until the 1991 tax reform, the law provided exemptions for corporationsengaged in agriculture, construction, tourism, fishing, mining, and transportation, andprovided tax incentives for regional development, capital goods production, and exports.Frequently, when an activity was exempted, interest earned from loans to that activity bydomestic financial institutions was also exempted. This was the case for the agriculturalsector and some specific business associations.
3.25 The excessive use of exemptions and investment incentives created severaldifficulties. It severely eroded the tax base and therefore its potential for revenue generation.It distorted the allocation of resources by influencing investment decisions. It decreasedtransparency in the assignment of tax burdens, which in turn undermined the legitimacy ofthe tax system and hence encouraged tax evasion and avoidance. In spite of the intention ofthe law, exemptions were subject to a certain degree of discretion, as most of them could beextended every five years by a decision of the central government.

- 53 -
3.26 Until the 1991 reform, one of the most important technical defects of thecorporate income tax law was the large number of marginal rates that fostered corporatefragmentation to evade the higher rates. The 1986 tax reform tried to eliminate thisdistortion by requiring the consolidation of companies in which the same owners held themajority of stocks. This regulation explains in part the increase in corporate income taxrevenue in 1987 as consolidated corporations were taxed at higher rates. In addition toconsolidation, the significant increase in 1987 revenue can be explained by the buoyancy orelasticity of the income tax with respect to GDP. The system of marginal rates gave theincome tax a cyclical character, as revenue decreased or increased more than GDP becausecorporations moved to lower or higher tax rates depending on the cycle. In this sense, theexpansion of GDP in 1987 induced a significant rise in income tax revenues (Figure 3.3).
3.27 However, corporate income tax revenue declined significantly after 1987, assoon as taxpayers leamed to dodge the consolidation requirement. Profit-making companiesfound ways to move to lower marginal rates by creating loss-making companies and otherlegal associations, and by using transfer prices, leasing arrangements, and transfer ofdepreciation allowances across companies. Transfers among companies to reduce their taxburden were also used where exemptions and investment incentives could benefit the profit-making corporations. This was clearly the case in the agricultural sector and in somebusiness associations. Expenditures and depreciation allowances of the exempted firms weretransferred to the profit-making companies, while sales or income from the profit-makingcompanies were registered by the exempted firms.
3.28 Effective Taxation of Income. Exemptions have drained the potential taxrevenue from individuals and corporations. Average deductions per taxpayer were 38percent of taxable income in 1992. In the case of the corporate income tax, tax avoidance,evasion, and investment incentives reduced the number of effective taxpayers. Of about250,000 corporate taxpayers registered in 1991, only 6.4 percent paid taxes; the rest declaredlosses, no income, or no profits. Moreover, only about half of these effective taxpayersdeclared taxable income above Bs 2 million, for which the tax rate is 30 percent; the otherhalf declared taxable income below Bs 2 million, for which the tax rate is 20 percent. Theaverage tax paid by effective corporate taxpayers was Bs 2.4 million or US$24,000 in 1992.
3.29 There are great inequities in the rates for individuals. For example, workerswith the lowest incomes subject to payroll taxes pay at a rate of about 20 percent, whereasonly the highest-income individuals are taxed at that rate or higher. (See Chapter 6,Table 6. 1).
3.B.3 Relationship Between Oil and Non-oil Taxes.
3.30 The data show that non-oil tax revenues have declined whenever oil taxrevenues have increased. Non-oil fiscal revenues were never large, but at their peak yeardirect taxes accounted for almost 3.5 percent of GDP and indirect taxes (excluding fuel
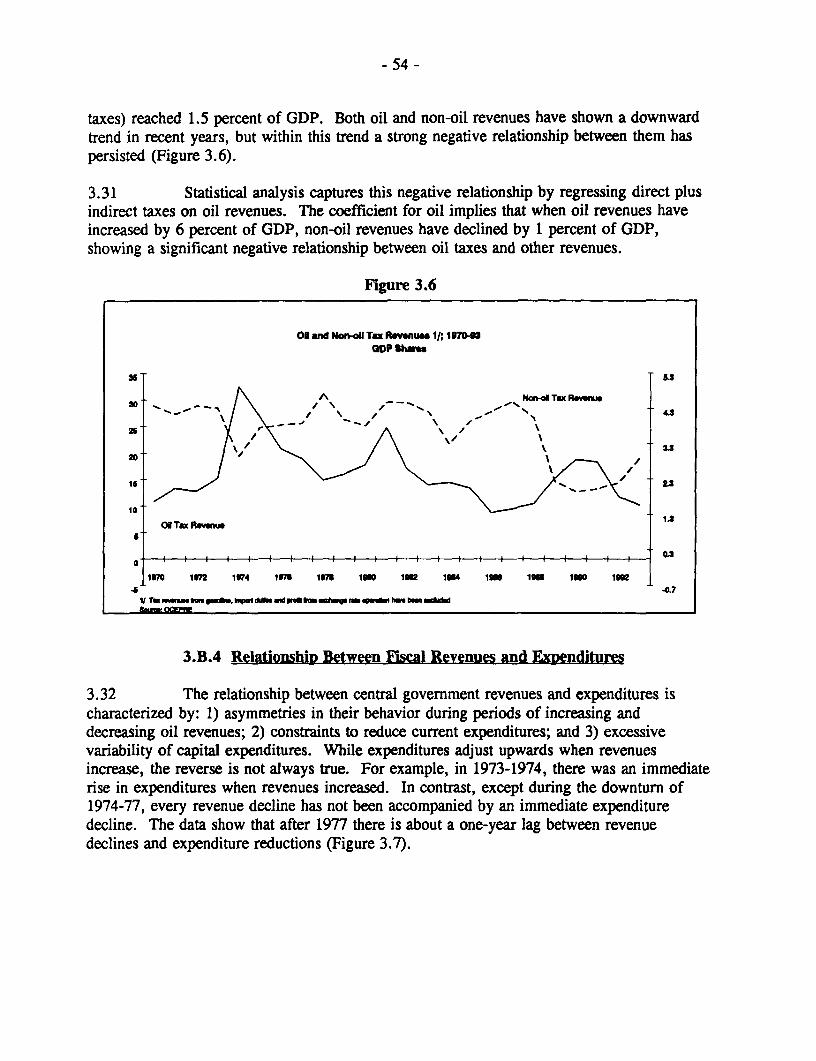
- 54 -
taxes) reached 1.5 percent of GDP. Both oil and non-oil revenues have shown a downwardtrend in recent years, but within this trend a strong negative relationship between them haspersisted (Figure 3.6).
3.31 Statistical analysis captures this negative relationship by regressing direct plusindirect taxes on oil revenues. The coefficient for oil implies that when oil revenues haveincreased by 6 percent of GDP, non-oil revenues have declined by 1 percent of GDP,showing a significant negative relationship between oil taxes and other revenues.
Flgure 3.6
OH an Nord Tax Reue It; 197041GDP Shwe
1 1
3.B.4 Tax tiowm i.N Te i Revenues
- %.~~~~~~~~~~.
3.32 The relationship between central government revenues and expenditures ischaracterized by: 1) asymmetries in their behavior during periods of increasing anddecreasing oil revenues; 2) constraints to reduce current expenditures; and 3) excessivevariability of capital expenditures. While expenditures adjust upwards when revenuesincrease, the reverse is not always true. For example, in 1973-1974, there was an immediaterise in expenditures when revenues increased. In contrast, except during the downturn of1974-77, every revenue decline has not been accompanied by an immediate expendituredecline. The data show that after 1977 there is about a one-year lag between revenuedeclines and expenditure reductions (Figure 3.7).

- 55 -
Figure 3.7
Cem Governmt Tot Rovnue uA Totl Expendftu. 197043GDP Shwus
4t0P
1670 1673 1974 1716 ¶67 1660 16 1664 1666 166 1660 166
3.33 Statistical estimates support these policy links between fiscal revenues andexpenditures. For periods of increasing revenues, the correlation coefficient betweencontemporaneous revenues and expenditures is 0.75, and declines to 0.14 when expendituresare correlated to the one-year lagged revenues. This pattern is reversed for periods ofdecreasing revenues. When revenues decline, expenditures are more highly correlated withthe previous year's revenues. Thus, the correlation coefficient between current expendituresand one-year lagged revenues is 0.84 during the downswing.
3.34 The data show that although total revenues have declined as a share of GDPsince 1984, current expenditures have remained at about 20 percent of GDP and most of theadjustment to lower revenues has taken place through reductions in the central government'scapital spending (Figure 3.8). The high variability and downward trend in revenues contrastsharply with the relative stability of current expenditures. While real revenues continued toplunge until 1987, current expenditures seem to have reached a floor of about 20 percent ofGDP since 1984. In fact, current expenditures averaged 16.6 percent of GDP from 1970-9 1,and varied between 14 percent in 1970 and 21 percent in 1982. The correlation coefficientof revenues with current expenditures is almost zero. The adjustment to lower revenuestakes place through reductions in capital expenditures, which reached a maximum of 22percent of GD)P in 1974 and a minimum of 3 percent in 1989. From 1970-9 1, thecorrelation coefficient between real revenues and real capital expenditures is 0.87. (Thesame relationships between revenues and different types of expenditures hold for subperiodsof either revenue increases or decreases.)

- 56 -
FSgure 3.8
Centl Governmt ToW R.vene and Eendllee 19704GDP Shwe
Is ... .. . . .. .lZi I~~~~~~~
1ff~i - ,, J"ho.
1e70 1ion 1974 1976 1973 160 ime 1i"4 im 16 160 i
3.C Fiscal Police: Venezuela and Mexico
3.35 Data comparing the evolution of fiscal policy in Venezuela and Mexico showthe success of Mexico's fiscal reform after 1987. In particular, the Mexican government hasbeen able to: 1) increase fiscal revenues; 2) decrease its dependency on oil taxes; and 3)reduce public spending. In contrast, Venezuela's fiscal situation is worrisome: 1) in 1992fiscal revenues were the lowest in 22 years at only 16 percent of GDP; 2) about 70 percentof revenues are oil-related; and 3) the central government's expenditures are about 20 percentof GDP and do not show a downward trend (Figures 3.9-3.11).
3.36 The 1970-92 data show a sharp contrast between the large variability anddownward trend of Venezuela's revenues and the steadiness of Mexico's figures. Moreover,in the last two years Venezuela's public finances have deteriorated while Mexico's haveimproved.
3.37 Another important feature of the changing structure of Mexico's public financestrategy compared with Venezuela's is Mexico's decreasing dependency on oil as a source offiscal revenues. For the 1970-81 period, the correlation coefficients between total revenuesand oil revenues are 0.94 and 0.97 for Venezuela and Mexico, respectively. For the 1982-91 period, the same correlation coefficients are 0.84 and negative 0.18 for Venezuela andMexico, respectively. The figures also show a clear downward trend in Mexico's ratio of oilto total revenues, starting in 1982. Moreover, Mexico has dramatically reduced expendituresfrom 31 percent of GDP in 1987 to 17 percent in 1992. Most of this adjustment has taken

- 57 -
Figure 3.9
V_mada NW 6daboi TOW Fbeal Epmniuam ie
40
36
25
20
15"~ ~ ~ ~~~1
o~ ~ ~ ~~at
1970 1972 1974 1976 1978 1980 1982 1984 1966 196 1900 19m
Figure 3.10
Venezuela and MUxko: Central Govemnment Total Fiscal Rvnues; 1970-93GDP Share
40
36
30'
25
20 0 0
15 - - - -
1970 1972 1974 1976 1978 1960 1962 1964 1966 1968 1900 1992
place through difficult reductions in current expenditures. There is no such trend inVenezuela.

- 58 -
Figure 3.11
Venezuela and M6xico: Non-oil Flcal Revenum; 1962493GDP Shares
12- _
10' - =
2- I l l l l l l 0 l l I
1962 196 196 1966 1966 197 1986 1969 1900 11 192 1903
3.D Recommendatio
3.38 The government should reduce its dependency on oil revenue and itsvariability by increasing non-oil taxes. To this end it should: 1) improve collection ofexisting taxes; 2) eliminate exemptions on the income tax; 3) improve customs administrationto increase import tariff collection; 4) increase fuel (including gasoline) tax collection; and 5)implement the new non-oil taxes, as discussed in Chapter 6.
Chapter 4. Government Expenditures
4.A Introduction
4.1 Government spending in the past 23 years has been highly inefficient becauseof a huge public sector, the dominant influence of a volatile oil market, and the poorperformance of public administration. The reforms introduced in 1989, includingrestructuring of ministries and state-owned enterprises (SOEs), privatization, anddecentralization, still have a lot of ground to cover.
4.B Main Causes of Public Spending Inefficienec
4.B.1 The Size of the Public Sector
4.2 The public sector's size is illustrated by its contribution to employment andGDP. In 1992, the public sector had about 1.3 million employees, or 16.8 percent of thelabor force. In 1993, it accounted for 35 percent of GDP (at constant 1984 prices); publicsector oil and non-oil GDP were 22 and 13 percent of total GDP, respectively. Venezuela'sconsolidated public sector fiscal accounts are commonly known as the restricted public sectoror "consolidado restringido". It includes current and capital spending by the centralgovernment, the SOEs, and PDVSA, but excludes the states and municipalities (because ofdelays in getting complete data). The largest decentralized units are part of the centralgovernment. Table 4.1 lists the government units in the non-military public sector as of1992.
4.3 In general, the definition of government for budget purses includes entitiesmanaged and financed with public funds. Their market behavior is more important than theirownership because their fiscal impact derives from the taxes and subsidies embodied in theirprices and reflected in their financial results.
4.4 There are several arguments to omit PDVSA from the government budget. Itis considered a well-managed firm that responds to competition in the world economy. It hasa decentralized management system that pre-dates its nationalization. It does not receivetransfers from the central government.
4.5 However, there are important reasons why it should be considered a publiclyowned firm. Its operating profits are not independent of revenue and budgetary decisions bythe central government. Its domestic pricing policies are not market determined, and implysignificant subsidies to the consumers and losses to the company. Its domestic activities arean important central government fiscal tool.

- 60 -
Table 4.1. Venezuela: The Non-Military Public Sector; 1992
Cera De:-enralized Loal : SOEs Oi and(.overmet-t Pe oheml
* The Presidency, * 46 Institutos The states and 120 firms including PDVSA and its* 16 ministries, Aut6nomos, municipalities, these in which the affiliates* 6 Oficinas * 9 Regional although they government holds at including
Centrales, Development are distinct least a majority PEQUIVEN.* The Attorney Corporations, and subnational share: CADAFE,
General's Office, * about 37 other levels of CANTV, SIDOR,and units including government, CSB, EDELCA,
* The Supreme small firms, they are de ALCASA,Electoral Council. foundations, facto agents of INTERALUMINA,
funds, cultural, the national BAUXIVEN,and educational administration. FESILVEN,entities. CAMETRO,
._____________ ____________ FERROCAR, VTV.
4.B.2 Public Spendina Trends and Composition
4.6 Spending from 1970-88. Changes in the level and allocation of publicexpenditures from 1970-88 reflected the government's response to the two oil shocks duringthe 1970s and the 1976 oil sector nationalization. Spending inefficiencies arose because: 1)public spending increased quickly to unsustainable levels between 1970-82; and 2)expenditures favored PDVSA and the SOEs at the expense of the basic public sectors.
4.7 The upward trend in expenditures accelerated after the 1979 oil shock butslowed for a few years when oil prices declined after 1982. However, the governmentdecided to stimulate economic growth by increasing current spending when oil pricescollapsed in 1986 to their lowest level since 1976. Capital spending showed a large andunsustainable increase in 1974 in response to the first oil shock, and although it declinedthereafter, the reduction was not smooth and until 1988 spending was not consistently lowerthan in 1973 (Figure 4.1).
4.8 Several changes characterized central government spending by sector from1970-88 (Figure 4.2). Spending in the social sectors appeared to be more stable thanexpenditures in other areas. Social spending increased from 6.6 percent of GDP in 1970 to10.5 percent in 1981, but with the fall in oil prices and fiscal revenues declined to 7.9 ofGDP percent in 1989. However, spending in the "productive sectors" (mining, industry,agriculture) increased from 5.1 percent of GDP in 1970 to 10.6 percent in 1981. At thesame time, debt service and transfers to decentralized units and local governments increasedfrom 4.3 percent of GDP in 1970 to 18.5 percent in 1974, and in 1987 were still 11.4percent.

- 61 -
Figure 4.1
Co __ Gv Expwnd; 19MoGDP Shin
zuf_ jX 40 *~~~~~-t/ /
' i , . \"/ ',."N
-------------- ~-- -
1170 1g72 1th4 1" ion lo 1 194 tm 1" im
Flgure 4.2
1&00 )
,_~~~~~~~~~~~~~~~~------------
&W~~~~~~~~~~~~~~~~~~~~~~~~~~~N
tJ .................................... -..- --.. >...r ' _ , _ _ ,
0II0 I I I I I I I
v t1370 t302 164 131 1t73 1130 t3 114 lUg 13U 1t0 l
4.9 From 1970-88, the rmtio of current to capital expenditures increased becausecapital spending bore the brunt of reductions. Wages and salaries were the largest singlecomponent of cuffent spending, although these declined from 7.1 percent of GDP in 1970 to4.7 percent in 1988. The rigidities in cuffent spending were due in part to personnel

- 62 -
increases and to rising external debt service and transfers to decentralized units and localgovernments.
4.10 SOE investments paralleled those of the central government for the period.There were large expenditure increases in the 1970s and a scaling down in the first half ofthe 1980s. Similarly, the downward trend was reversed in 1986, as the government pursuedexpansionary fiscal measures. Operating expenditures increased almost every year from1970-82, reflecting increased investments in the industrial, mining, and petrochemicalsectors. Although these expenditures declined in 1983 and 1984, their share of GDP almostdoubled from 1970-88. Central government transfers to the SOEs followed the pattern ofSOE investments (Figure 4.3).
Figure 4.3
SOb Emu 1312AO - - GDP Shut
io.oo - -\ / p.-xdavsN,~
*S~~~ \_- X, "/f\
too -
&00
4.00
1970 172 1174 101 16 1ow0 11o 1164 196 196 160 100
4.11 PDVSA's operating expenditures were rather stable from 1976-88, but sinceproduction declined by 70 percent from 2.3 million bpd in 1976 to 1.6 million bpd in 1988,the cost per barrel was higher. The rationale for PDVSA's increased capital investmentsfrom 1976-82 (Figure 4.4) could be that there had been no investment in the oil industry forseveral years before it was nationalized in 1976.
4.12 Public Spending after 1988. The main determinants of spending after thePerez administration took office were: 1) the reform program; 2) the oil windfall of 1990-91;and 3) the five-year investment program. Total public sector spending declined from 34percent of GDP in 1988 to 31.3 percent in 1989. However, the restrictive fiscal policy was

- 63 -
relaxed in early 1989 and, combined with the Gulf War oil windfall and congressionalapproval of the administration's investment program, total public expenditures increased to35.3 percent of GDP in 1991. Spending again declined to 30.1 percent in 1992, when oilprices collapsed, but the cuts have not been enough. There were large fiscal deficits in 1992and 1993 (see Chapter 1), and the 1989-93 figures indicate that PDVSA's activities haveexpanded at the expense of the central government's operations.
Figure 4.4
Ptroleum Sector Expwndibtrn; 1976-93ODPShw.
5.00
7.00
&00
_-~~~~~~~~~~~~~~~~~~~~~~~~~~~~ x
4.00
2.W~~~~~~~~~~~~~~~~~~~~~~~~~~~~~~~~~~~~~~~~~~~~~,
0100
0.00 I If I I I I I I I I I I
1S7 1i low 1N2 ige4 1o urn ieo ISM
4.13 Current Expenditures after 1988. The main change after 1988 has been thelevel and allocation of current spending, which declined from 19.3 percent of GDP in 1988to 15.5 percent in 1993 and shows the influence of the adjustment program (Table 4.2). Thenew composition reflects: a) reduction in subsidies; b) reduction of the export bonus;c) reduction of expenditures for non-budgetary items; and d) increase in targeted socialprograms. These changes are a step in the right direction, but more needs to be done.Restructuring of ministries and privatization of SOEs have not been completed. As a result,transfers from the central government to the SOEs increased from 0.5 percent of GDP in1988 to 1.0 percent in 1991, although they declined to 0.5 percent in 1993. Centralgovernment wages and salaries remained almost constant during 1989-93 at about 4.4percent.

- 64 -
Table 42: Central Government's Spending Allocation; (GDP Share)
. ,~~~39
C4nbsrhl 9ubsid;" 0.6 0.0
Expyn Borm 0.7 0.0
NQwbudgduy Itum 0.6 0.2
Exchanp Lm 2.5 0.0
Social Provan 0.0 0.8
4.14 SOEs and PDVSA operational expenditures also changed after 1988. Theydeclined for the SOEs, reflecting a decrease in the number of firms as a result ofprivatization (see Chapter 1), but increased for PDVSA (Figure 4.5). Because of oildepletion, production is moving to lower-quality fields where production is more expensive.PDVSA's employment levels rose and wages and salaries increased from 1.1 percent in 1987to 1.6 percent in 1991, both coinciding with higher production because of the Gulf War.
Flgure 4.5
--
. = S ss--' ~"sss,,/S - -
zoo ~~~~~~. .. . . ......... ..------ '......'.... "
4.15 Cait l dtu_-satr1. Capital excpenditures after 1988 have beendetermined by the 1989-93 investment program, prepared by the Ptrez administration, and

- 65 -
approved by Congress after delays in mid-1990 (Table 4.3). The smallest allocations werefor water and sanitation, education, and health; the largest for PDVSA, the SOEs (power,steel, and aluminum), transport and agriculture. Total public sector capital spending declinedbetween 1988 and 1990 from 13.9 percent to 12.5 percent, mostly through capital formationof the central government, then increased to 14 percent in 1991, once the investmentprogram was approved by Congress and larger fiscal revenues became available because ofthe oil windfall. However, capital spending dropped to 10.1 percent in 1993, its lowest levelsince 1985, because oil fiscal revenues collapsed (Figure 4.6).
Table 4.3: Composition of the Five Year (1989-93) Investmnent Program
Billions of As percent ofConstant 1989 Bs the total
Total of Investment 1,065.2 100.0of which:
PDVSA 324.7 30.5
Transport Infrastructure 170.4 16.0
Housing Construction 85.2 8.0
Electricity 84.4 8.0
Steel 32.0 3.0
Aluminum 37.1 3.5
Agriculture 80.0 7.5
Education 47.9 4.5
Health Facilities 18.1 1.7
Water and Sanitation 26.6 2.5
Other 158.8 14.8
4.16 As part of the adjustment program, the allocation of capital expenditures to thecentral government declined from 7.1 percent in 1988 to 2.8 percent in 1989, and capitalformation (i.e. non-financial investment) from 3.2 percent in 1988 to 0. 1 percent in 1989.From 1989-93, central government capital formation has not risen above 1.3 percent.
4.17 The SOE's capital formation and inventory accumulation increased from 5.6percent of GDP in 1988 to 6.2 percent in 1989, but declined to 2.9 percent in 1992, partlybecause of privatization. Declines in capital transfers from the central government after theoil windfall also led to less capital spending by SOEs. Only PDVSA's investmentsincreased, from 2.9 percent of GDP in 1988 to 5.3 percent in 1992, although they declined

- 66 -
Figure 4.6
Capfal ExpedIture: 197043GDP Shwme
15.00
'.0 -u -K/ ' j.\ 7-'
6.00 Nan&twitde St.b.own~ed Enfer'Pune S - o-
eLoo ; 1 1 i i i i i f i i i i i i i i i i i
1170 1072 1074 176 1073 1060 1164 1o6 l I1 lowSou5: Bw Cer d Vwon a
to 4.2 percent in 1993. These changes reflect the implementation of the company's multi-year investment program, including large outlays to maintain production capacity.
4.B.3 Public Administration Performance
4.18 Venezuela's public administration sector (PAS), defined as the central anddecentralized government, is widely regarded as inefficient because of: 1) its size in terms ofthe number of agencies and employees; 2) unsatisfactory recruitment and compensationpolicies; 3) poor coordination among agencies; 4) unsound budgetary practices; and 5)centralized funding and decision-making. The agencies, institutes, and other organizationsthat proliferated during the 1970s and 1980s are still part of the PAS, as Table 4.1 shows.
4.19 Efforts to reduce employment in the public sector (including the PAS, SOEsand PDVSA) have resulted in a decline from 20.2 percent of the economically activepopulation (EAP) in 1982 to about 16.8 percent in 1992. Formal, as opposed to contract,employees of the PAS have declined from 6.9 of the EAP in 1989 to 5.6 percent in 1992.
4.20 The decline in numbers has not been accompanied by any major improvementin personnel practices. From 1989-92, compensation to PAS workers increased 4.7 percentannually in real terms, but the compensation to (formal) employees declined 1.9 percent. Inaddition, there is no clear career path for civil servants, and little relevant training toimprove their skills and prospects for better positions. This makes it extremely difficult toattract and retain qualified civil servants at the higher levels and undermines the

- 67 -
government's ability to implement effective economic policies. High turnover leads to poorinstitutional memory.
4.21 The civil service has problems with patronage, and it is also overstaffed at thelower levels but dangerously understaffed at the professional levels. In 1991, out of 482,984PAS formal positions, workers held 54 percent and employees 46 percent. Moreover, about62 percent of the employees were administrative personnel classified in the lowest grades. In1992, the situation changed slightly, and now employees and workers each have 50 percentof the PAS positions.
4.22 There are significant salary differences. In 1991, the average monthly salaryfor administrative personnel was US$162; for technicians, US$284; for high-level staff,US$536; and for others, US$227. Moreover, workers are better compensated thanemployees. In 1992, the average monthly pay of workers and employees was US$249 andUS$215, respectively.
4.23 Coordination Among and Within Government Units. By virtue of itsadvisory mandate, CORDIPLAN sits on most interministerial committees that deal witheconomic policy and public investment. However, it is constrained by time and humanresource limitations. Except at the Economic Cabinet level, its links with sectoral ministriesare weak. CORDIPLAN might usefully set priorities for issues and sectors it considerscritical, then concentrate on working closely with other government units to resolve technicalproblems at the high- and mid-levels before presenting proposals to the Ministers.
4.24 Ministers often spend much time at Council meetings merely becomingacquainted with policy alternatives--work that in many countries is usually done in briefingsby lower-level staff before the meetings. Because there is almost no coordination at themiddle management level (i.e., the Direcciones Generales Sectoriales), where the generallack of policy design and implementation capacity is evident, the Ministers themselves mustdevote time to making routine decisions--sometimes at Council meetings--that in othercountries are delegated to lower-level staff.
4.25 Budget Practices and Coordination. Bank ESW on budgeting in Venezuelahas identified several problems. The usefulness of the budget process as a fiscal managementand expenditure control instrument has been seriously eroded by deficiencies in the budget'sstructure and organization. For example, budgets for ministries are normally based onhistorical allocations, not on present priorities. Other problems are that transactions havebeen financed with public credit under extra-budgetary accounts, and that internal control ofbudget implementation is virtually non-existent. Moreover, there is no ex-post assessment ofthe effectiveness of expenditures.
4.26 The 1992 Budget and Public Credit laws should correct some of theseproblems. The budget law establishes the Office of the Budget (OCEPRE) as a regulatory

- 68 -
agency to review budget implementation and disallow expenditure commitments without apre-established budgetary account. These new laws also impose strict conditions to preventauthorizations for extraordinary expenditures and set a borrowing limit for the fiscal year.
4.27 It is too early to tell how these laws will be implemented, and there is yet noattempt to monitor the effectiveness of expenditures. Similarly, the law should incorporate astrong commitment to a balanced budget, and oil revenues should be projected on a multi-year basis to make them more responsive to expected international market changes. Thegovernment also needs a mechanism to prevent overspending in the event of oil pricewindfalls so as to avoid some of the problems discussed in Chapter 3, especially over theshort- to medium-term while major public sector inefficiencies prevail.
4.28 Decentralization. Since most public sector decisions and project design andimplementation have been highly centralized, state and municipal institutions are notequipped to plan, budget, monitor, or control investments. Moreover, although allowed bylaw to collect revenues, the municipalities have instead relied on central government grants tocover their expenditures.
4.29 Since 1989, when Congress approved the Decentralization Law, responsibilityfor some activities has been transferred to the local governments. For example, highways,ports and airports and the corresponding user fees are now administered locally. The lawallows the local government to take over delivery of a number of basic services, includinghealth, education, transport, and water. However, there is no institutional framework oradministrative procedure to guide the gradual transfer of responsibility for these services.
4.30 Although decentralization would permit better identification of the demand forpublic services and more efficient service delivery, it is potentially a major source of fiscalimbalance for two reasons. First, the states and municipalities have very little experience inproviding goods and services. Second, through the "situado constitucional,"1 ' largetransfers of funds from the central to local governments are occurring without an actualtransfer of responsibilities for service provision.
4.B.4 Sectoral Performance
4.31 The decline in oil revenues after 1982 and the contraction in centralgovemment spending (especially on capital formation) have made it extremely difficult forthe govemment to meet the increasing demands for public services and to alleviate poverty.
4.32 A) Health Sector. Health conditions have deteriorated in the last decade. Forexample, the infant mortality rate increased by about 10 percent from 1980 to 1989 and there
I/ ITe situado constitucional is a legal transfer of revenues from the central government to the localgovemment. In particular, about 20 percent of ordinary revenues must be transferred each year.

- 69 -
is some evidence of an increase in the proportion of low birthweight babies in the sameperiod. The proportion of children covered by immunization programs has decreased.Malaria cases expanded from 4,200 in 1982 to 47,000 in 1990. This decline in public healthis due in part to a decrease in the coverage and quality of health services that can be ascribedto inadequate financing and inefficient resource use.
4.33 Public health services are centralized in two organizations, the Ministry ofHealth and Social Assistance (MSAS) and the Venezuelan Social Security Institute (IVSS).MSAS depends almost entirely on central government financing, with states contributing lessthan 10 percent of operating expenditures. Its facilities are available to the population atlarge. IVSS health facilities are financed through earmarked payroll taxes, employercontributions, and central government funding, and are available only to formal sectorworkers and their families.
4.34 Health sector expenditures declined from US$102 to US$55 per capita between1985 and 1988, and remained at about US$55 per capita through 1990, or about 3.1 percentof GDP. They increased in 1991-92, but at 3.7 percent of GDP, are lower than in othercountries in the region.
4.35 The reduction in resources was not accompanied by attempts to increaseefficiency. For example, instead of reducing employment, both organizations added tens ofthousands of personnel to their rolls during the 1980s. Unit cost data are not availablebecause of lack of hospital cost accounting, but staff expenditures absorb about 70 percent oftotal spending, leaving little for other operating costs.
4.36 The staffing of health facilities is not only bloated but also distorted. Bothphysicians and unskilled workers are overrepresented in comparison with middle-levelpersonnel such as nurses. Physician productivity is low; outpatient visits per physician-hourat both IVSS hospitals and clinics have been documented at about half the government norm.Absenteeism, disability claims, and abuse of sick leave are common in MSAS and IVSSfacilities. To fill in for absentees, the government has a supernumerary body equal to 7 to10 percent of budgeted positions. 'Substitutes" have been estimated at 20 percent of theemployees in the health facilities. Finally, shortages of drugs and supplies and diagnosticequipment in need of repairs are major problems.
4.37 Since 1989 real budgetary allocations and public health expenditures haveincreased but have not been large enough to offset pre-1989 declines. In 1991, the largestMSAS budget category continued to be personnel expenditures, followed by support to otherinstitutions. Real allocations for personnel after 1989 are not much different from before,but real allocations to support other institutions are markedly higher, a possible effect ofimplementing the decentralization program. Real allocations for complementary inputs,materials, equipment, and furniture have remained mostly unchanged since 1989. At the
- 70 -
same time, there is no evidence that the quality of health services has improved in recentyears.
4.38 B) Education Sector. A massive expansion of education took place from1960-90. Today, 97 percent of children have access to primary school, and the educationallevel of the labor force has improved significantly. However, only 63 percent of studentsstarting primary school complete grade six and only 46 percent complete grade 9.
4.39 In a recent international test of reading achievement in 31 countries,Venezuelan nine-year-olds ranked fourth to last and 13-year-olds ranked third to last, aboveonly Nigeria, Zimbabwe, and Botswana. In both groups, only 5 percent of the Venezuelanstudents performed at or above the international mean. Adult illiteracy is roughly 13percent, compared with 5 percent for Argentina and Uruguay and 6 percent for Costa Ricaand Chile.
4.40 The poor performance of Venezuelan students on standardized cognitive testsindicates inefficient spending rather than inadequate resources. Although educationalspending in 1992 was about 10 percent lower than in the mid-80s, the US$800 per student isabove the Latin American average. Inefficient spending arises from: 1) the disproportionateallocation for personnel rather than classroom expenditures; and 2) the skewed distribution infavor of higher education.
4.41 In 1992, spending on personnel was at least 90 percent of total outlay, andadministrative and support workers at the Ministry of Education (MOE) were far more thanrequired. The ratio of teachers to administrators and workers is estimated at about 2:1,compared with 8:1 or more in better-managed systems. In contrast, school infrastructure,educational materials and other non-salary items represented only 5 percent of the primaryeducation budget. Spending per student on books--which research has shown to be one ofthe most cost-effective investments--is estimated to be less than one-quarter of the leveldeemed adequate for primary school students, leaving them almost wholly dependent uponthe teacher's skills. The primary schools have a very low student-teacher ratio. From 1980-90, the average class size fell from 33.6 students to 26.7, one of the lowest ratios in LatinAmerica. This is a positive change, but the limited information available suggests thatteachers are poorly qualified.
4.42 The quality of secondary education is believed to be very low. The results ofthe last standardized tests, in 1984, yielded average scores of 10 out of 100 for mathematics,15 out of 100 for chemistry, and 20 out of 100 for biology and physics. Students in privateschools scored twice as high overall as students in public secondary schools and three timesas high in mathematics.
4.43 Spending not only is inefficient but skewed. Although the allocation forprimary education increased very substantially from 18 percent to 25 percent of total sector

- 71 -
expenditures during 1989-92, primary education represented only 25 percent of the MOE'sbudget while higher education received 32 percent in 1992. Also, the share of expendituresassigned to "other educational institutions" not included in the MOE's budget increasedduring 1989-92. These are normally higher education institutions.
4.44 Outlays on higher education (as a percentage of the education budget and inrelation to GDP) are among the highest in the world, although the rate of return is lowerthan for other education levels. Despite the enrollment of a very large number of students,the percentage of graduates is not high.
4.45 C) Poverty Alleviation. The drastic decline in the terms of trade after 1982,but more importantly, the poor economic policy of decades, caused an increase in thepopulation living in poverty during the 1980s (see Chapter 2). Before the Perezadministration, poverty alleviation programs employed inefficient indirect subsidies thatwere very costly and often did not reach the very poor.
4.46 In May 1989, the administration started the Presidential Committee for PovertyAlleviation to cover three broad programs: basic needs, worker protection, and governmentservice delivery. These programs, targeting poor families and low-income workers, accountfor 16.1 percent of expenditures in the social sectors and about 1 percent of the centralgovernment's budget. The Ministries of the Family, Education, and Health administer theresources for poverty alleviation, and the MOE manages about 78.8 percent of the budgetthrough its Food and School Materials programs. The poverty alleviation programs includenutritional supplements to pregnant women and their children, expanded coverage of low-costpre-school options, and aid to low-income families with primary school children. Reachingthe intended targets is still a problem. For example, a disproportionate share of publicspending is absorbed by overheads and high-cost hospitals and universities at the expense ofbasic health and education.
4.47 D) Transport Sector. Road transport is the country's dominant mode. Thecentral government normally prepares and finances the highway construction andmaintenance programs, to which the states sometimes allocate a small proportion of theirsituado. The states contribute more for feeder and local access roads, but until recently thedesign and construction of these roads was a central responsibility. The government is nowimplementing inter-urban programs that establish road user charges and is grantingconcessions for private sector construction and operation of expressways.
4.48 A 1991 survey of the paved network showed that: 1) 26 percent of thenetwork is in good condition and essentially requires only routine maintenance; 2) 54 percentis in fair condition and will soon require resurfacing; and 3) 20 percent is in poor conditionand requires extensive reconstruction. Routine maintenance has generally been carried outunder mandate by state directorates. However, poor management of equipment and lack of

- 72 -
spare parts have contributed to the rapid deterioration of machinery. Leis than half of thefleet of about 1,000 units is in operating condition.
4.49 Annual road expenditures have varied widely according to the availability offunds. Maintenance expenditures were about US$60-80 million until 1986, but declineddrastically afterwards. In 1992, the maintenance budget was increased to about US$80million. The DGSVT and all maintenance districts have a staff of about 4,000. These unitsfind it difficult to build competent staff because of freezes on hiring and lack of incentivessuch as career development.
4.50 E) Water and Sanitation Sector. The coverage of drinking water andsanitation services is high relative to other Latin American countries. Eighty-five percent ofthe urban population have connections to water systems and 61 percent to sewerage systems.Reliable data on services in rural areas are not available. However, the available figuressuggest that the percentage for water service coverage does not deviate significantly from thatin urban areas, but that a much smaller percentage enjoys sanitation facilities.
4.51 Although coverage is relatively high, the standard of service is unsatisfactoryand has steadily deteriorated for several reasons: procedural, technical, and managerialproblems in operations and maintenance; administrative problems in billing and revenuecollection; and a lack of incentives for efficient management and personnel training. Thepriorities for the sector are to implement a new water sector law and tariff structure and toprivatize the Caracas water system.
4.C Recommendations
4.52 To increase the efficiency of spending, the Government should consider thesemeasures:
A) The budget should provide a mechanism to prevent over-spending whenunexpected oil revenues are earned. Projections of oil revenues should bemade by using a multi-year formula that takes into account expected changesin international oil prices. Budgetary ex-post reviews should also be a seriousconsideration.
B) Balance the expenditure mix within sectors by allocating less for wages andsalaries and more for other inputs. This will mean reducing the number ofpublic sector employees and reviewing recruitment and compensationpractices.
C) Reverse the downward trend in capital spending by changing public spendingallocations. This would imply, among other things, privatizing SOEs andallowing extensive private investment in the oil sector so as to free public

- 73 -
revenues for the main responsibilities of the government: the social sectors,poverty alleviation, and basic infrastructure.

Chapter 5. Savings and Investment
5.A Introduction
5.1 Over the past 23 years, the government, through oil taxes and directinvestments in many sectors, has made most of the decisions on how and how much to saveand invest. Savings and investment rates generally have been high but volatile, and thereturns have been low.
5.B Main Causes of Low Investment Retums
5.B.1 Savings and Investment: Level and Variability
5.2 Background. Sound economic policies are necessary for sustained growth,not only because they foster high and stable savings and investment rates, but also becausethey influence the profitability of investments. Profitable investments increase GDP andimprove living standards. An economy such as Venezuela's from 1970-88--closed, oil-dominated, and with significant distortions in goods and factor markets--is not likely to fosterprofitable investments.
5.3 Savings and Investment Levels. Venezuela's savings rate from 1970-91, atabout 25 percent of GDP, is higher than for other upper middle income countries such asArgentina and Mexico; it was also higher than Korea's through 1982. The average 1970-91rates for these countries were 19, 21, and 27 percent, respectively (Figure 5.1). Investmentrates in Korea, Venezuela, Mexico, and Argentina averaged 29, 22, 21 and 17 percent,respectively (Figure 5.2). Korea had the highest average rates for all countries during 1970-91, moreover, since the early 1980s its rates have been significantly higher than in the LatinAmerican countries, including Venezuela.
5.4 It would appear that Venezuela should continue to save more than countriessimilar to it because it depends so heavily on income from an exhaustible natural resource.Although it has large reserves of condensate, light, medium, and heavy crude oil that give ita reserve-to-production ratio of 75 to 1, that is, 75 years of production at the currentproduction level, recent information indicates that about 50 percent of proven reserves areextra heavy oil requiring expensive capital-intensive investments (Table 5.1). Under mostlikely international oil price scenarios, the return on these investments will be modest at best.
5.5 The trend of oil income per capita further confirms the need for savings. Itreached US$1,728 in 1974, measured in constant 1985 dollars, but fell to only US$441 in1993. PDVSA's cost per barrel is increasing, and international prices are expected to remainalmost constant in real terms in the coming years (see Chapter 2). Unless there are newdiscoveries of light and medium crude, or prices increase sharply, profitability will continueto decline. Under the reform case scenario (see Chapter 2) oil GDP per capita in constantprices might be about US$471 by the year 2000 (Figure 5.3), enough to make a strong casefor Venezuela to maintain high domestic savings rates and to invest wisely.

- 75 -Figure 5.1
Goo" DomatC S.Wl 1970491GDP Uhwns
45.00
40.00
35.00
30.00
25.00
20.00
16.00.10.00
5.000.00 ' , , .
1,970 1,910
Argw-n - -- hr Korea V Me)
Flgure 5.2
Gran DowesUc kwestn*f; 197011GOP Shars
45.00
40.00
35.00
30.00
20.00
16.00
10.00
1,970 1,980 1,990
1-- --Argz F - ~XKorea me.dco Vewnzula

76 -Flgure 5.3
Per Capita Oil Inme in Ven_eb; 190-OConstant 1985 US$
1400-
1200
1000
800
600
400-
200'
196 193 190 199 200
Table 3.1: Proven Reserves
Proved Reservee in billions:(10' of barrels
Resource Base Barrels Percent:
Condensate (above 45° API) 2.0 3.1Light oil (above 32° API) 8.5 13.1Medium oil (between 22' to 31.90 API) 9.1 14.1Heavy oil (between 14° to 21.9° API) 15.3 23.7Extra heavy oil (between 8° to 13.90 API) 29.7 46.0
Total crude oil 64.6 100.0
Bitumen (ess than 8' API) 70.0
5.6 Saingl and Jhn Mt Variability. International oil market developmentsand the lack of policies to smooth out their impact have had a significant influence on thecountry's comparatively high but unstable savings and investment rates. From 1970-91, thesavings-to-GDP ratio showed large changes. In 1970, it was about 20 percent, reached apeak of 37 percent in 1974, then in 1983 after the second oil shock dropped to 21 percent.

- 77 -
During the same period, the ratio of investment to GDP changed also, increasing from 21percent in 1970 to 35 percent in 1977, then declining to 13 percent in 1983 and 10 percent in1990.
5.7 Savings and investment rates have not supported high economic growth inVenezuela. Its average annual growth rate was only 2.5 percent for overall GDP and 3.5percent for non-oil GDP during 1970-91; the average annual growth rate in Korea was 8.9percent in the same period. Moreover, Venezuela showed the highest variability in economicgrowth and Korea the lowest in a comparison with Mexico and Argentina (Table 5.2).Venezuela's savings and investment rates were as high (through the early 1980s) and variableas Korea's (Table 5.3) in the same comparison, showing that Venezuela's poor growthperformance is not due only to the level and volatility of savings and investment rates.
Table 5.2: International Comparison of GDP:Average Annual Growth Rate and its Variability "; 1970-91
GDP Annual Growth Rate0 Country0000000 0j Average- VariabiRlty
Argentina 1.23 4.03Korea 8.88 3.60Mexico 4.27 3.83Venezuela 2.49 4.67
"Variability is the standard deviation of the GDP growth rates
Table 5.3: International Comparison of Savings and Investment Variability;"1970-91
1970-91 1970-80 l98"0-9
Couitry Savings Investment Savings Investment _.fSavingsi Investment
Argentina 4.02 5.34 2.58 1.45 2.42 4.46Korea 8.49 5.27 5.73 4.77 6.62 4.43Mexico 2.60 3.57 1.76 2.00 3.40 4.34Venezuela 5.43 6.49 5.10 4.99 4.64 5.06
"Variability is the standard deviation of the GDP shares

- 78 -
5.B.2 Total Factor Productivity Growth!'
5.8 The decline in output growth since 1973 has been strongly determined by adrop in total factor productivity growth (TFPG), which measures changes in output per unitof all inputs combined. In fact, the contribution of TFPG to overall economic growth inVenezuela has been negligible since the 1950s, and in most years after 1970 has beennegative.
5.9 Table 5.4, showing the relationship between TFPG and economic growth inVenezuela and selected developed and developing countries from 1960-87,2' indicates thatthe decline in the average growth rate in the Latin American countries, and in Venezuela inparticular, was accompanied by reductions in TFPG after 1972.2'
5.10 Estimates of Venezuela's economic growth, labor and capital input growth,and TFPG (Table 5.5) show that both labor and capital input growth were comparativelyhigh until 1982, consistent with the high savings and investment average rates. However,with the exception of the 1990-92 period, both labor and capital productivity growth werenegligible or negative, and economic growth rates were comparatively low after 1973.
5.11 The decline in output and TFPG coincides with excessive governmentintervention in the economy, mainly after 1970, and with inappropriate economic policies.The nature of the public investments and the economic framework in which they were madeprovide a convincing explanation for the poor results.
5.B.3 Public Investments
5.12 Venezuela's high savings and investment rates have not supported high andsustained economic growth. Savings and investment levels have been strongly linked togovernment decisions because the state collects most of the oil income and public investmenthas been a large share of GDP. The shares of private and public (fixed) investment changeddrastically after 1970 because of the increasing role of the government. In 1970, they were17 percent and 5 percent of GDP, respectively; by 1982 they had been reversed to 7 percentand 15 percent, respectively.
1/ This section is based in full on Paredes, Carlos E., Productivity Growth in Venezuela: The Need to Breakwith the Past, unpublished, August 1993.
/ In order to estimate the TFPG, the growth of each factor is weighted by its share in total cost. Thedifference between output growth and factor input growth, the residual, is equal to TFPG, which itselfequals the weighted sum of growth in labor productivity and in capital productivity.
3/ World Bank. World DeveloDment Regort 1991. N.Y. Oxford University Press, p.45
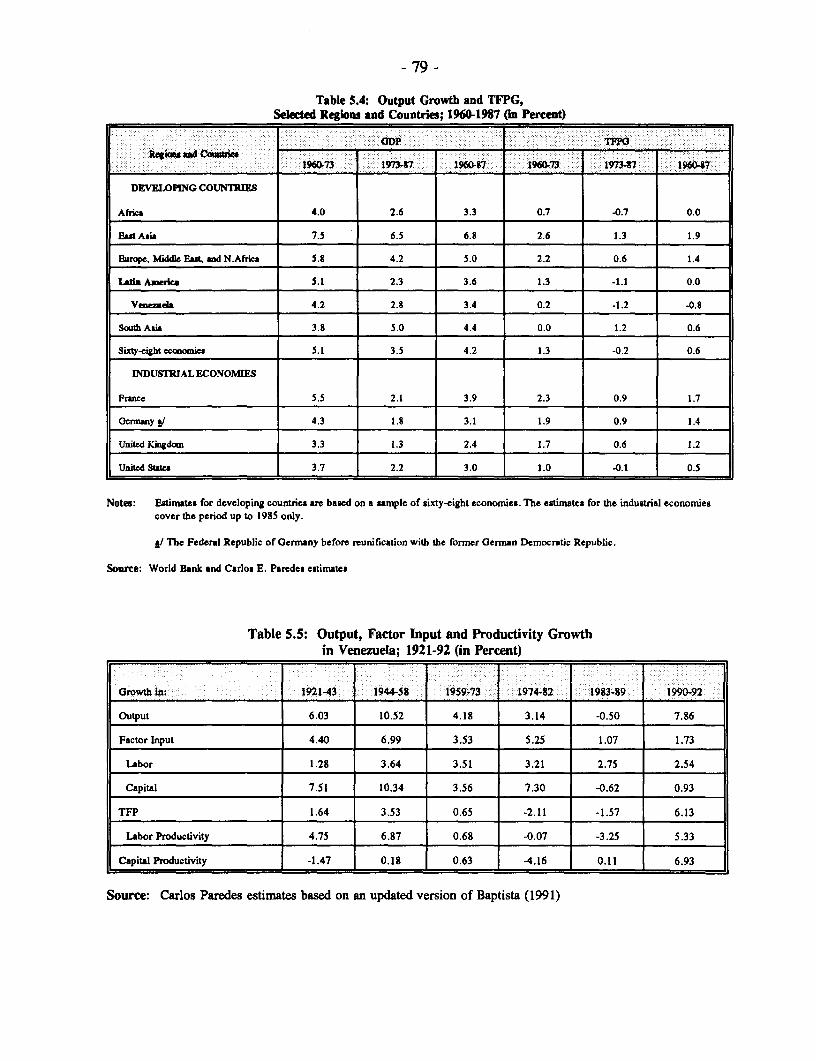
- 79 -
Table 5.4: Output Growth and TFPG,Seleted Re&ons and Countries; 1960-1987 (n Percent)
-30t - - j;i 00000000960-73 ;0X00- -1973-7 10-7 90019603 1973-17 194047.
DEVELOPING COUNTREES
Afrka 4.0 2.6 3.3 0.7 -0.7 0.0
EuatAsia 7.5 6.5 6.8 2.6 1.3 1.9
Burope, Middle East, and N.Africa 5.8 4.2 5.0 2.2 0.6 1.4
La Amealc 5.1 2.3 3.6 1.3 -1.1 0.0
Venebda 4.2 2.8 3.4 0.2 -1.2 -0.8
South Asia 3.8 5.0 4.4 0.0 1.2 0.6
Sixty-eight economirc 5.1 3.5 4.2 1.3 -0.2 0.6
INDUSTRIAL ECONOMIES
France 5.5 2.1 3.9 2.3 0.9 1.7
Oenany I/ 4.3 1.8 3.1 1.9 0.9 1.4
UnitedKingdom 3.3 1.3 2.4 1.7 0.6 1.2
Unitaed Stes 3.7 2.2 3.0 1.0 -0.1 0.5
Notes: Estinutes for developing countries are based on a sample of sixty-eight economies. The estimates for the industrial economiescover the period up to 1985 only.
_/ The Federal Republic of GermAny before reunification with the former German Democratic Republic.
Source: World Bank and Carlo E. Paredes estimates
Table 5.5: Output, Factor Input and Productivity Growthin Venezuela; 1921-92 (in Percent)
Growth in: 1921-43 1944-58 1959-73 1974-82 1983-89 1990-02
Output 6.03 10.52 4.18 3.14 -0.50 7.86
Factor Input 4.40 6.99 3.53 5.25 1.07 1.73
Labor 1.28 3.64 3.51 3.21 2.75 2.54
Capital 7.51 10.34 3.56 7.30 -0.62 0.93
TFP 1.64 3.53 0.65 -2.11 -1.57 6.13
Labor Productivity 4.75 6.87 0.68 -0.07 -3.25 5.33
Capital Productivity -1.47 0.18 0.63 -4.16 0.11 6.93
Source: Carlos Paredes estimates based on an updated version of Baptista (1991)

- 80 -
5.13 In the early 1970s, the govemment began using the windfalls from oilrevenues to try to diversify production away from oil. The increase in public investment bythe SOEs reflects this policy. From 1970 to 1992, these investments averaged 6.1 percent ofGDP, and increased as a share of GDP from 2.3 percent in 1970 to 11.7 percent in 1977.They were made in many sectors, including steel and aluminum. Today, large companiesproducing resource-based manufactures are managed by the state-owned Corporaci6nVenezolana de Guayana (CVG). Public investments in the power sector have supported thesteel and aluminum industries, and the government has also invested in petrochemicals andoil.
5.14 Many SOEs received transfers and direct and indirect subsidies through exportbonuses and input prices, and after 1982, when oil prices and fiscal revenues declined, theSOEs supported their investments through external debt. When they were unable to meettheir debt service obligations, the central government stepped in to assume responsibility.Many SOEs were adversely affected by economic policy, which, for example, set pricesbelow opportunity cost.
5.15 Since 1989, many of these companies have had to operate in a competitiveenvironment with less financial support from the government. Most CVG companies are insevere financial difficulties and some are near bankruptcy. In the power sector, majorregulatory and tariff problems persist and most public companies still receive governmenttransfers. In the oil sector, the Government must resolve some institutional, legal, andtaxation issues and liberalize domestic fuel prices to encourage private participation.
5.16 A) Steel. In 1991, steel production was about 2.7 million metric tons (mmt), orabout 0.4 percent of world production. The iron and steel sector accounts for about 1.5percent of GDP and 3.5 percent of merchandise exports. SIDOR, the main domestic steelproducer, is a CVG company that started operations in 1964. It is fully integrated andprocesses iron ore into a wide range of semi-finished and finished steel products. In 1978,after a major expansion, SIDOR's production capacity increased from 1.2 mmt to 4.8 mmt ofliquid steel.
5.17 Since 1989, policy in the steel sector has changed significantly. The price andtrade liberalization programs have reduced import tariffs on steel products from 24 percent to8 percent of cif prices, eliminated quantitative restrictions on steel imports, and decontrolleddomestic prices for almost all steel products. The CVG changed the prices of its key inputsto SIDOR: iron ore is supplied at export opportunity cost, and electricity is supplied at thesame price paid by other industrial users, which is still below long-run marginal cost. Thegovernment has eliminated all operating and capital transfers to SIDOR and has not given itnew loan guarantees.
5.18 At the beginning of the Perez administration, SIDOR faced major technical,managerial, and financial problems, and the Cabinet approved a new business strategyincluding a restructuring program for the company in October 1990. The three main
- 81 -
elements of this strategy are to: 1) focus operations on flat products; 2) privatize non-flatfacilities, including the seamless pipe mill and the rod and bar mills; and 3) capitalize 60percent, or US$900 million, of SIDOR's extemal debt. The government assumed part of thisdebt and the Cabinet agreed to monitor several performance targets for the company.
5.19 As a result of economic policy changes and its new business strategy,SIDOR's efficiency and profitability have increased somewhat since 1991. Its total unit costsare low by international standards, partly because of Venezuela's low-cost energy and ironore, and its operating unit costs have declined and labor productivity and capacity utilizationhave increased. However, SIDOR's labor productivity and profitability remain low byinternational standards, and its return on investments--about 2 percent in 1991--is extremelylow and insufficient to finance its proposed investment program.
5.20 SIDOR's investment program for the next five years will cost about US$600million, of which half is for modernizing the flat product facilities, especially the hot rollingmill. Other major components include environmental damage control improvements and newcomputerized systems. The company expects to finance its investment program with internalfunds and commercial borrowing, but no financing has been secured. Since its potential as alow-cost international steel producer has not been realized in the past 30 years under publicownership, the government should consider privatizing it.
5.21 B) Aluminum. VENALUM, Venezuela's largest primary aluminum producer,was created in 1973 and started production in 1978. It has an installed capacity of 430thousand metric tons (tmt), and produces--at an average of 388 tmt from 1989-91--about 67.6percent of total domestic primary aluminum. Its exports average 70 percent of itsproduction. At the end of 1990, the firm's total equity was about US$423 million; CVGholds 80 percent of the shares and a group of Japanese companies holds the rest.
5.22 ALCASA is the country's second largest primary aluminum producer. It wascreated in 1960 and started operations in 1965. It has an installed capacity of 214 tmt, andproduced 207 tmt in 1991, of which about 60 percent was exported. At the end of 1991,ALCASA's total equity was US$380 million; CVG holds about 92 percent and ReynoldsInternational the rest.
5.23 Today, despite large personnel reductions, both companies have financialproblems resulting from large expansions between 1989-91 that increased their indebtedness.From 1989-91, VENALUM invested about US$229 million, mostly in capacity expansion,and at the end of 1990 its total debt was about US$560 million. The company had anoperational deficit of about US$81 million in 1992, partly as a result of a 21 percent declinein international prices from 1991 levels. From 1989-91, ALCASA invested about US$295.3million, and at the end of 1991 its total debt was about US$733 million, of which onlyUS$292 million was long-term debt. In 1992, ALCASA's operational losses were aboutUS$100 million.

- 82 -
5.24 The companies have cost advantages over their competitors, including cheaphydropower, natural gas and labor, and import tariffs on inputs; however, low internationalprices and domestic factors have created financial difficulties. These factors include thecompanies' large debt overhang, associated with their 1989-91 expansions, and theelimination of current and capital government transfers in 1990. Their financial situationindicates the need for privatization.
5.25 C) Power Sector. The power sector has seven private companies, of whichthe most important is Electricidad de Caracas that supplies most of the Caracas metropolitanarea. There are also four major SOEs: EDELCA, CADAFE, ENELVEN, and ENELBAR.EDELCA owns and operates the hydro-plants on the Caroni river; it is a CVG company andthe main electricity supplier to the group. CADAFE serves most of the country, includingabout 60 percent of residential users, ENELVEN provides electricity to Maracaibo and thewestern state of Zulia, and ENELBAR serves the Barquisimeto metropolitan area.
5.26 Supported by large public investments and transfers from the government, theSOEs' participation in electricity generation increased from 20 percent in 1960 to 90 percentin 1991, while electricity coverage increased significantly to reach about 90 percent of thecountry. From 1990-92, the government's transfers to CADAFE and EDELCA were Bs14,250 million and Bs 16,150 million, respectively, or about 0.3 and 0.4 percent of 1992GDP, respectively. Of these transfers about 40 percent cover current expenditures. Despiteexcess capacity and inefficient use of electricity, in 1990 Congress approved a large 1990-93investment program, of which half was assigned to EDELCA for the Macagua II project.
5.27 To eliminate transfers to the companies, the government should: 1) improvethe sector's institutional and legal environment; 2) implement efficient tariff policies; and3) privatize many of the SOEs.
5.28 In the last few years there have been improvements in the power sector'sinstitutional environment, but more needs to be done. In 1989, the government issuedDecree 369 creating the Tariff Committee (TC), which includes representatives fromCORDIPLAN, MEM, FIV, and the CVG. The TC was established to: 1) implement thetariff-setting principles; 2) define the target minimum rate of return for electricity companies;3) review tariff adjustment requests by the utilities; and 4) recommend tariff adjustments tothe government. Its performance has been unsatisfactory because it is technically weak andit is not independent of the sector. In 1992, the government established the interministerialElectric Energy Regulatory Commission (EERC) and its technical support agencyFUNDELEC. This agency will provide independent analysis to the commission.
5.29 To correct the outstanding tariff problems, the government in October 1992decreed a three-year adjustment program for residential and non-residential users, and forbulk power purchased among utilities. The tariff adjustment program is reducing pricedistortions in the sector, but cross-subsidies to residential users by commercial and industrialusers continue and should be eliminated. Moreover, besides the institutional and tariff

- 83 -
changes started in 1992, the sector SOEs need to improve their technical and financialmanagement.
5.30 The government plans to privatize several SOEs in the near future, includingENELVEN, ENELBAR, and Planta Centro (operated now by CADAFE).
5.31 D) Petrochemicals. Venezuela has an annual petrochemical productioncapacity of about 4 million metric tons (mmt). In 1991, PEQUIVEN, a PDVSA subsidiary,produced about 2.43 mmt of petrochemical products in its own facilities, and the jointventures in which it participates produced about 1.3 mmt. PEQUIVEN's main petrochemicalfacilities include the Zulia-El Tablazo complex, which produces ethylene and propylene forplastics, chlorine, and caustic soda; the Moron complex, which specializes in fertilizers likeammonia and urea and industrial chemicals; and the Anzoltegui complex, which has anannual production capacity of 0.5 mmt, including the MTBE plant completed recently.
5.32 Private sector participation in the petrochemical sector is increasing rapidly inresponse to the more favorable foreign investment regime (established in Decree 727), theavailability of low-cost inputs, and the increasing size of the domestic market. The privatesector is also responding to a large U.S. demand for products such as oxygenates, usedinstead of lead-ethyl substances to increase octane in gasolines. PEQUIVEN has partnershiparrangements with 22 private Venezuelan groups and 15 foreign companies. PDVSA has fulland partial ownership of several petrochemical complexes outside Venezuela, mainly in theU.S. and Europe. Its production share in these facilities was about 3.5 mmt in 1991.
5.33 Before 1989, the petrochemical sector was adversely affected by domesticprice policies, in particular those that set prices of petrochemical products and fertilizersbelow opportunity cost. After 1989, the prices of some petrochemical products, such aspropylene and ethylene, have seen substantial increases. At the same time, the governmenthas been phasing out subsidies on fertilizers.
5.34 PEQUIVEN has an investment program of about US$4.2 billion for 1993-98whose main objective is to increase annual petrochemical production from about 4 to14 mmt. The financing includes about US$1.2 billion of its own resources, US$0.8 billionfrom investment partners, and US$2.17 billion of direct financing. In a break with pastpractices, PDVSA will not make any financial contributions.
5.35 E) Oil Sector. PDVSA's investments, the government's largest, averaged 6.1percent of GDP from 1976-93. They have been made in an economic environmentcharacterized by declining international oil prices (after the second oil shock), high anddiscretionary oil income taxes and royalties, and large domestic consumer subsidies on oilproducts. Thus, government policies have dominated PDVSA's investment decisions andfinancial results. The little information available indicates that crude production is the mostprofitable of its activities. However, after 1976 PDVSA increased its domestic and externalrefinery capacity rather than its domestic crude production capacity. Moreover, its

- 84 -
explorations for light and medium crudes (the more profitable types) were neglected after thediscovery of heavy crudes in the Orinoco Belt. Production declined from 3.5 million barrelsper day (mbd) in 1970 to 2.3 mbd in 1992. It is not clear how much of this decline is due tointernational oil market conditions, government policies, OPEC membership, or otherfactors.
5.36 Since the petroleum industry was nationalized in 1976, expenditures of aboutUS$6 billion to upgrade domestic refineries have been a major part of PDVSA's investments.Its domestic refining capacity includes: 1) the Amuay refinery with processing capacity of0.57 mbd; 2) the Card6n refinery with processing capacity of 0.28 mbd; 3) the Puerto LaCruz/San Roque refinery complex with processing capacity of 0.2 mbd; and 4) the refinerycomplex of El Palito/El Torefio with processing capacity of 0.11 mbd. These four refinerieshave a combined installed atmospheric distillation capacity of about 1.1 mbd; theirconversion capacity is slightly over 0.8 mbd; and they processed about 1.0 mbd in 1992.More important than these volumes has been the shift in conversion capacities, which hasreduced the yield of heavy fuel oil from 60 percent in 1976 to 28 percent in 1992, andincreased the yield of gasolines from 18 percent in 1976 to 34 percent in 1992. The yield ofmiddle distillates has increased from 12 percent in 1976 to 34 percent in 1992. This hasallowed PDVSA to supply the type and quality of products required by industry, mostly inthe U.S., Venezuela's main customer for refined products. As a result, PDVSA hasincreased the exports of refined products from 542 mbd in 1985 to 617 mbd in 1992(Table 5.6).
5.37 PDVSA has leased and purchased additional refining capacity abroad, whichenables it to process almost 75 percent of its crude oil production. Following a series ofacquisitions, mergers, and expansions that began in 1982, PDVSA's wholly ownedsubsidiary, CITGO Petroleum Corporation, has become the eighth largest refinery andmarketer of refined products in the United States. It controls over 5 percent of the lightproducts market, and engages in the full spectrum of marketing activities with over 13,000gas stations and terminals, lube oil plants, and pipelines. CITGO runs refineries inLouisiana, Texas, New Jersey, Georgia, and Illinois. PDVSA's downstreaminternationalization has also extended to Europe, where it owns several refineries on a 50/50basis in Germany, Sweden, and Belgium.
5.38 PDVSA is the only supplier of refined petroleum products and natural gas inVenezuela and its profitability has been negatively affected by low domestic prices,determined by the Executive and significantly lower than fob export prices. Table 5.7 showsthe historical figures on volumes and prices in the domestic market; in 1991, the domesticmarket consumed about 22.4 percent of Venezuela's total crude oil output. PDVSA's (andtherefore the government's) cumulative losses from 1982-91 by selling in the domesticmarket what could have been sold abroad were about US$17.3 billion (Table 5.8). Thecumulative losses through 1993 would have been even larger, because domestic gasolineprices were frozen in early 1992.

- 85 -
Table 5.6: Crude Oil and Refining Production and Exports; 1985-92
MBD J Years 1985 1986 1987 1988 1989 1990 1991 1992
Crude Oil Production 1,694 1,876 1,863 2,001 1,954 2,211 2,458 2,412
Refinery Output 923 924 854 1,024 901 1,006 1,098 1,067
Crude Oil Exports 829 949 1,028 1,011 986 1,242 1,381 1,435
Refined Products Exports 542 585 492 639 638 639 737 617
Total Exports 1,371 1,534 1,520 1,650 1,624 1,881 2,118 2,052
Domestic Consumption 323 342 343 351 330 330 340 360
5.39 As part of the Five Year Plan, PDVSA seeks to invest in exploration andproduction, including the heavy oil fields of the Orinoco Belt. It also plans to enlarge theconversion capacity of its domestic refineries by almost 0.4 mbd by the end of 1998.Chapter 7 explains the investment plan in detail.
Table 5.7: PDVSA's Domestic Sales, Volume and Prices; 1982-91
1982 1983 1984 1985 1986 1987 1988 1989 1990 1991,Volune(MBD)LPG 23 24 28 28 31 34 34 35 39 48
Gasolines 170 169 161 163 164 168 174 162 164 172
Diesel 76 71 58 51 58 59 61 57 61 65
Fuel Oil 58 51 47 50 51 42 40 43 34 19
Others 34 31 28 31 38 40 42 33 32 36
Natural Gas 142 148 180 183 182 186 187 185 204 212
Prices (Bs/BI.)LPG 10.23 11.57 27.68 28.08 31.64 30.67 21.17 46.66 57.23 94.23
Gasoline 31.09 38.14 87.25 100.52 113.93 113.85 110.10 264.80 313.60 418.27
Diesel 10.45 10.36 32.20 44.24 43.27 43.27 43.03 85.67 166.26 367.77
Fuel Oil 10.32 11.01 22.52 27.06 28.72 28.87 27.01 57.00 139.87 423.36
Others 57.19 61.79 110.29 128.89 132.12 140.75 140.40 377.13 776.23 186.32
Natural Gas -- -- 19.37 22.64 23.58 24.62 24.60 53.00 72.16 105.22
Exchange 4.3 4.203 5.744 5.993 7.495 10.495 14.495 35.7 48.0 56.96Rate .

- 86 -
Table 5.8: PDVSA's Domestic Market Loes, nim-.i
-5*l (Milliesa 1135) 1R~ 1933 19U4 19S 1936 1917 195S -9U 1990 1991W1
At Internal 737.9 868.4 1335.1 1507.7 1392.9 1031.2 744.2 657.2 709.1 941.4 9925.2MuAtd Price
If Expored 3,526. 2995.6 2930.6 2908.5 1438.0 1931.8 1643.7 1932.0 2311.4 1372.7 23,540.4s CrudeOil 0
If Exported 3822.5 3530.3 3448.3 3271.6 1862.5 2276.1 1866.6 2137.4 2716.2 2168.0 27,199.5a Rcfined Produs
Low vs. Cnude 2788.2 2127.2 1645.5 1400.8 45.1 900.5 899.5 1274.8 1602.3 931.3 13,615.2Oil Exports Price I _
Lss vs. Products 3034.6 2711.9 2113.2 1763.9 469.6 1244.8 1122.4 1530.2 2007.1 1226.6 17,274.3Expors Prie __28_0 _ _02_9_
Los vs. Avere 2331.7 2323.0 1302.9 1544.6 207.4 1011.9 936.6 1374.8 1739.6 1034.3 14,911.8Export Price
5.C Recommendatio
5.40 Savings and investment rates in Venezuela, although comparatively highthrough 1982, have been more volatile than in other Latin American countries, which mayexplain in part the low returns on public investment. However, the most evident explanationis the nature of these investments and the economic environment in which they were made.
5.41 The Government should consider these measures to eliminate inefficiencies:
A) Limit future public investments to the social sectors and basicinfrastructure.
B) Extend the privatization program to power, petrochemical, and otherindustries in order to: 1) increase government revenues through thesales; and 2) eliminate permanently the need to make transfers to SOEsand cover their external debt obligations. Profitable private investmentswould increase the chances for efficient and sustained growth and raisethe government's corporate income tax revenues.
C) Fully decontrol the domestic prices of fuel, petrochemicals, andfertilizers. There is no economic rationale for price controls ontradable goods.
D) Improve the institutional, legal, and fiscal environment of the oilsector to encourage private investment and increase PDVSA'sefficiency.

Chapter 6. New Non-Oil Taxes
6.A Introduction
6.1 The government, fully recognizing the need to increase non-oil taxes, hastaken several major initiatives, including reform of the Income Tax Law in 1991 and the TaxCode at the end of 1992. The Value Added Tax (VAT) was at first rejected by Congress in1990, but through an Enabling Lawl' the caretaker government of President Velasquezreceived congressional approval to implement it. The first stage of the VAT (wholesalelevel) was implemented in October 1993; the second stage (retail level) was implemented inJanuary 1994, but was in place only briefly because of public opposition. At the end of1993, the Economic Cabinet approved the Corporate Asset Tax (CAT), which went intoeffect in January 1994.
6.2 In February 1994, the newly elected Caldera administration repealed the VATat the retail level, and in March revealed the Sosa Plan, a series of bills for improving thetax system. The Plan had three main elements: income tax reform, a general sales tax(replacing the VAT), and a bank debit tax. Another Enabling Law passed by Congress inmid-April allowed the Government to implement the Sosa Plan by decree. In early June1994, the Cabinet approved the Plan's main elements; the bank debit tax was in effect fromMay to December, 1994.
6.B Changes in the Legal Framework: 1991 and 1992
6.3 Many of the government's proposals in 1991 to modernize the income taxwere modified by Congress under strong pressure from several economic groups and theirlobbyists, and from political groups demanding less tax burden for the middle class. Theresult was a law that reduced some economic distortions and simplified tax administration,but increased the probability of further tax erosion. The VAT was originally drafted tocompensate for this expected loss in tax revenue, while the CAT would provide thegovernment with a minimum corporate income tax and thus reduce tax evasion.
6.B.1 The 1991 Reform of the Income Tax!'
6.4 Inflation Adjustment for Corporations. The 1991 Income Tax Lawincorporated an inflation adjustment for non-monetary assets (other than securities) and forliabilities; both are now adjusted annually according to the Consumer Price Index (CPI) todetermine changes in the shareholder's net equity at the end of the fiscal year. The amountof this change is used to calculate taxable income in real terms and to establish the
I/ The Enabling Law allowed the caretaker government of President VelAsquez to decide on theimplementation of several initiatives, among them the Value Added and Corporate Asset taxes.
2/ The 1991 income tax revisions continue in effect until the beginning of 1995, when the income tax changesdetailed in the Sosa Plan become effective.

- 88 -
shareholder's equity at the beginning of each fiscal year. The mechanism took effect inJanuary 1993 and is mandatory for corporations and businesses.
6.5 Increase in the Minimum Exemption Base for Individuals. The 1991reform established the minimum exemption base at an annual income equivalent to 50 timesthe minimum wage, and the tax bracket scale was adjusted according to changes in theminimum wage. In spite of this, the individual income tax is only partially indexed, becausethe minimum wage is not always fully adjusted for inflation. The change in the minimumexemption base reduced the number of taxpayers from 1.3 million in 1990 to 350,000 in1991; however, this reduction was not very significant because the income of mostindividuals required to file tax returns in the past was too low.
6.6 Tax Rate Reductions and Simplification. The reform reduced tax rates andsimplified the tax structure. Specifically, the maximum rate was lowered from 45 percent to30 percent for individuals and from 50 percent to 30 percent for corporations, and thenumber of brackets for individuals declined from 15 to 8 and for corporations from 3 to 2.These were positive changes, but three problems remain unsolved. First, corporate andindividual tax rates have not been integrated completely. For example, corporations withincome below Bs 2 million are taxed at 20 percent, while individuals with the same incomeare taxed at 15 percent or less, and corporations with income above Bs 2 million are taxed at30 percent, while only individuals with income above Bs 4.25 million are taxed at that rate.Second, corporate fragmentation continues as a means to avoid the highest tax rate. Finally,there are still too many personal tax brackets and no continuity between levels of income andtax rates. As a result, a small increase in income can move an individual to a much highertax bracket.
6.7 Tax on Dividends and Capital Gains from Stocks. One important steptowards the integration of the corporate and individual income taxes was the elimination ofdouble taxation of dividends. Dividends distributed by corporations that have been taxed arenot included in the taxable base of the recipients. Capital gains from the sale of stocks arefully taxed but the norms for determining the cost of these stocks are not clear in all cases.When stocks are issued out of asset revaluation, no cost is recognized. When stocks haveoriginated from profits and the seller is the original stockholder, the cost deductible for taxpurposes is the nominal book value; however, when the seller is not the original stockholder,the law does not specify the cost accepted for tax deduction. The cost could still be the bookvalue of the stock dividend, or the price paid by the seller when the stock was purchased.The latter interpretation has been used in practice, but the law has offered no clarification.
6.8 Exemptions and Investment Incentives for Corporations. The reformsignificantly reduced the number of exemptions and eliminated the Executive's power todetermine which activities would receive them. The only (private) economic activity toretain an exemption is agriculture.

- 89 -
6.9 The 1991 law also eliminated the Executive's power to grant income taxreductions as investment incentives for corporations, establishing instead a limited list ofacceptable incentives. Congress, however, passed the law with five-year extensions for mostof these incentives and incorporated a new incentive for research and development activities.
6.10 Extension of Deductions for Individuals. The major weakness in the revisedlaw was the extension of deductions for personal expenditures from the taxable income ofindividuals. To an already extensive list of deductions, Congress added automobile repairsand medicines, and eliminated the ceilings on deductible amounts included in the originallaw. As a result, some individuals with higher incomes and high levels of deductions haveended up paying less than individuals with less income.
6.11 Simplification of Administrative Procedures. The new law introducedseveral improvements to facilitate tax administration and reduce the opportunities forcorruption. The most important of these is the elimination of the certificate of tax solvencyand the requirement to include with the tax return the receipts for personal expendituredeductions. Further, the reduction in the number of taxpayers resulting from the increase inthe minimum exemption base has reduced the volume of paper work.
6.12 Changes in Income Tax ReLiulation. Updated regulations required by thereform were completed at the end of 1992. In addition, a separate decree was issued toregulate tax withholding. Apart from easing the adoption of the major 1991 revisions (inparticular, the introduction of the inflation adjustment mechanism), the new regulations haveattempted to reduce the "Tanzi" effect by shortening the lags for tax payments, withholdings,and advance estimates of tax liabilities.
6.B.2 The 1992 Reform of the Tax Code
6.13 The 1992 reform of the Tax Code focused on sanctions and penalties, andadded new ones for indirect taxes. Most penalties and fees were significantly increased, butthe value of the enhanced revenues has been eroded rapidly by persistently high inflation.The Tax Code had originally removed the 18 percent ceiling on interest on overduepayments; the revised code established the rate at 30 percent above the average loan ratecharged by the six largest commercial banks. By making the penalties severe, the revisionhas eliminated the practice of ignoring overdue tax payments. But it also applies the sameinterest rates to the tax administration's outstanding liabilities to taxpayers. Given the taxadministration's reputation for inefficiency, this rule could cause significant payments fromthe public sector's accounts.
6.14 The reform introduced new penalties and fees for evading indirect taxes leviedon final consumption, particularly at the retail level. The old code had no provision for thistype of sanction because no indirect taxes existed. The change took into account the possiblefuture implementation of a VAT. Among other penalties, the reform mandated the closingfor up to 30 days of businesses that repeatedly violate indirect consumption tax laws.

- 90 -
6.B.3 Impact of the 1991-92 Reforms on Revenue and IncomeDistribution
6.15 Fiscal Revenues. It is difficult to measure the impact of the tax changes fortwo reasons. First, many of the changes could affect revenue indirectly. For example, theincreased penalties and fees, as well as more extensive audits permitted by the simplificationof administrative paper work, could both reduce tax evasion. Second, the tax administrationhas no reliable data. Most tax estimates are based on general data on the economy availablefrom other sources, but this is no substitute for information systems and statistical profilesderived from actual tax files.
6.16 The effectiveness of many of these changes in increasing revenues depends onthe efficiency of the tax administration. For example, increased penalties and fees are oflittle value if the tax administration cannot impose them. The positive impact of otherchanges will have to wait because the Tax Code rules that specific tax laws take effect onlywhen the benefits granted under the old law expire. In the past, exemptions were frequentlygranted for five or ten years and others were extended by the Executive, who took advantageof the discretion that the old tax law permitted.
6.17 The tax changes' have reduced revenues by eliminating the double taxation ofdividends, extending deductions for personal expenditures, extending investment incentives,and introducing the inflation adjustment. The elimination of double taxation of dividendstook effect at the end 1991, and the change was reflected in the collection of taxes in 1992.Personal income tax revenues declined by 23.8 percent, while corporate income tax revenuesincreased by 56.4 percent; moreover, while the corporate income taxes registered a buoyancyor elasticity of 1.14 with respect to nominal GDP, the figure for the personal income tax wasminus 0.54. The decline in personal income tax revenues was also due to the extension ofdeductions for personal expenditures, and to the elimination of the ceilings on them. In fact,the ratio of average deductions to net taxable income increased from 35 percent in the 1986reform to more than 38 percent after the 1991 tax reform.
6.18 The most important reduction in revenues is expected from the introduction ofthe inflation adjustment, particularly on the depreciation of flxed assets. The regulation tookeffect in January 1993 and affects the accrued value of 1993 income taxes, most of which arebeing collected in 1994. The book value and the accumulated depreciation of fixed assets arebeing adjusted for inflation since their acquisition dates and annual depreciation will be basedon this adjusted value. The difference between the "new" adjusted depreciation and the"old" nominal depreciation will be the increase in deductions to determine taxable income.In other words, the same income base will be reduced by a higher depreciation of fixedassets.
6.19 To measure the imnpact of the inflation adjustnent on the corporate income taxfrom 1993-96, a stock of fixed assets was calculated with the national accounts data on grossfixed investment and depreciation. Given the unstable economic environment, no new

- 91 -
investments were projected in these calculations. Two series of fixed asset stocks and annualdepreciation schedules were constructed, one in nominal terms the other in real terms, andthe series assumed average asset lives of 10 and 15 years.
6.20 As expected in theory, the shorter the asset life the larger the annualdepreciation allowance to be deducted from income; however, under highly inflationarycircumstances, the longer the asset life the larger the inflation adjustment accumulatedthrough time. The calculations show that the increase in annual depreciation allowances for1993 and 1994 is greater under the assumption of a 15-year average asset life, but theydecrease in 1995 and stagnate in 1996, whereas depreciation allowances increase substantiallyin 1995-96 under the 10-year average asset life scenario. The lack of regulation regardingthe extension of asset life and the absence of inflation adjustment prior to the income taxreform in 1991 induced corporations to depreciate assets as quickly as possible, particularlyin a highly inflationary environment. These circumstances make more plausible the scenarioof a 10-year average asset life.3'
6.21 Income Distribution. Total direct taxation of individuals, including payrolltaxes and the individual income tax, shows some regression in income distribution. Theceilings on payroll taxes produce decreasing marginal rates as income rises, and deductionsof the social security tax from the income tax benefits individuals with incomes above theminimum exemption base. In contrast, individuals who pay income at rates lower than therates of the social security tax benefit from the deduction and thus reduce the effectivemarginal rates at which they are charged. Only those individuals with very high incomeshave higher marginal rates than those with incomes below the ceilings for payroll taxes.Furthermore, the extensive deductions allowed in the personal income tax tend to favorindividuals with higher incomes, given that some of these deductions increase their share inconsumption as income rises. Also, the exemption of savings from the individual income taxfavors the higher income groups, as the capacity to save also increases with income levels.
6.22 Table 6.1 shows an approximate calculation of effective marginal rates ofpayroll taxes for 1992, taking into consideration the different ceilings for each tax and thededuction of the social security tax from the individual income tax. These effective marginalrates were combined with the bracket structure of the income tax, after adjusting the rates bythe average amount of deduction declared by taxpayers in the income tax of 1992. Theresult obtained is an estimated scale of effective marginal rates for total direct individualtaxation.4' As this table indicates, individuals with low incomes, although formally exempt
3/ The accumulated rate of inflation in Venezuela during the last five years (1988-92) was about 480 percent.
4/ This scale applies only to private-sector workers. Public-sector employees are not subject to somecomponents of the social security tax, as they have separate medical services and their own pension fund.Additionally, it is not clear that public-sector employees bear the full cost of payroll taxes, as is probablythe case with private-sector workers.

- 92 -
from the income tax, are taxed more heavily through payroll taxes than individuals withhigher incomes. Only the very wealthy in the two highest brackets are taxed at similar orhigher rates. This "U" shape of effective marginal rates in direct individual taxation isshown in Figure 6.1.
6.23 The economic effects of payroll taxes cannot be isolated from the services andbenefits for which they were created. The most important of these is social security, whichprovides medical services, retirement and unemployment pensions, and death and accidentinsurance. Undoubtedly, the beneficiaries of these services are the low income groups;however, there is a consensus that these services are extremely deficient (see Chapter 4).
6.C The Sosa Plan
6.24 The Sosa Plan would close many loopholes in the tax system and increase non-oil taxes. It had three main elements--income tax reform, a general sales tax (GST) thatincludes luxury rates, and a bank debit tax (BDT)--and included proposals to amend theStamp Tax and the Organic Tax Code!'. Reform of the Organic Tax Code aims tomodernize the tax laws and reduce evasion by imposing stiffer sanctions, including jailsentences. It also ensures that state and municipal tax authorities are subject to the samestandards as the national govermuent, and creates the "tax unit", or TU, the new value inwhich tax brackets and deductions will be expressedY'.
6.C.1 The Income Tax Reform Bill
6.25 Rates. The major change in the corporate income tax has been an increase inthe top rate from 30 to 34 percent. The individual income tax was reduced to just twobrackets: 20 percent on earnings from Bs 750,000 to Bs 2.0 million, and 34 percent onearnings above that. Further, a flat 30 percent (up from 20 percent) will be applied to allsalaries and other payments to non-resident individuals.
S/ The Organic Tax Code established the general framework according to which all tax laws are applied inVenezuela.
6/ The Sosa Income Tax bill empowers the administration to adjust the value of the TU each year in line withinflation. It also provides for interim adjustments during the year should accumulated inflation equal orexceed 20 percent.

Table 6.1
VENEZUELAEffective Tax Rates on Individuals; 1992
L~~~~~~~~~~~~~~~~~~~~~~~~~~~~~~~~~~2_= ;i- ............................... 1t. .;0.t%Ai0
0 16000 0 2 10,00 4,00 1.t5 0.65 2.00 I,00 156.6 6.55 21.20 6.55 21.20
16001 46000 0 2 10,00 4.00 0.13 0.26 2.00 1.00 14.83 5,23 20,10 6,28 20.1045001 100000 0 2 0.21 2,46 0,34 0.11 2,00 1.00 10.55 3,0 14,14 3.00 14.14100001 200000 0 2 3.00 1.20 0,17 0,06 2,00 1,00 7.16 2.26 *.42 2.2e 9.42200001 300000 0 2 1.30 0.72 0.10 0,03 2,00 1,00 5,30 1.75 7,05 1,75 78s5300001 450000 0 2 1.20 0.40 0,07 0,02 2.00 1,00 5,27 1.50 6.77 1.50 6.77450001 1000000 10 2 0.62 0.25 0.03 0.01 2.00 1,00 4,05 11.26 15.31 5.66 6,37 11.31000001 1500000 12.5 2 0.38 0,14 0.02 0.0, 2.00 1.00 4,36 13.6S 16.03 6.57 6.566 3.9 1600001 2000000 1s 2 0.26 0,10 0,01 0,00 2.00 1,00 4,27 16.11 20,30 10.3 I .s9 16.262000001 2500000 16 2 0.20 p.0o 0,01 0.00 2.00 1.00 4,21 13,03 23.23 14,25 15s25 13.462500001 3376000 21 2 0.15 0.06 0.01 0.00 2.00 1.00 4,16 22.00 20.23 t7,65 16,65 22.61337SO01 4250000 25.5 2 0.12 0.06 0.01 0.00 2.00 1.00 4.12 26,5s 30,87 22,36 23.36 27.494250001 30 2 0.11 0.04 0,01 0,00 2,00 1.00 4,11 31,04 35,15 2e.s 27.69 31.80
II Lab. Trin Tom. Cawed by .waey121 Av.age131 Ah. lim Info incmunl .veugs ddunh. _h _i p..nd expndtu.. items Ism table I

Figure 6.1
35.00 Erfective Tax Rates on Individuals;' 1992
30.0I
25.00
120.00
U15.00 '
10.00
5.06 1 0~j il~ 8 § §~~~~~~~~~~~~~~~~~8 l} l} g4 td' l}4 l}. 8 8S. 8
a~~~ S 8 B 8 g 8 8 E
Scale of Net Taxable Income
Includes payroll taxes and the individual income tax adjusted by deductions

- 95 -
6.26 Deductions. The Plan originally proposed that many personal deductions beeliminated, including the amounts paid for social security, city and state taxes, services (e.g.,electricity and telephone), mortgage interest, schooling, medical expenses, auto insurance andrepairs, charitable contributions, and interest on savings accounts and pension funds.However, Congress decided that several deductions be maintained, including medical andeducational expenses, rents, interest on home loans, and income from interest on savingsaccounts and workers' benefits.
6.27 To compensate middle-class taxpayers for lost deductions, the bill provided fora larger, one-time personal deduction of 750 TUs. The value of a TU would be adjustedeach year to reflect inflation's impact. In the first year, each TU would be worth Bs 1,000,for a personal deduction of Bs 750,000.
6.28 Administrative Procedures. The cut-off limit for estimated payments was setat 1,200 TUs per year instead of Bs 500,000. Taxes will be paid in a lump sum, instead ofsix monthly installments (estimated tax payments, however, can be spread over 12 months).
6.C.2 The General Sales (GST) and Luxury Tax Bill
6.29 The GST is a VAT-like tax at the wholesale level and retains the VAT's debitand credit system. Enforcement is complicated by a long list of basic goods and services thatare exempted and a short list of luxury goods subject to a surcharge at the retail level. Theexemptions include among others non-processed agricultural foods, all types of fresh meat,bread and pastas, corn and wheat flour, medicines, milk in any form, infant formulas, books,magazines, newspapers and educational expenses. Public transportation except airtransportation, hydrocarbon products, and residential use of electricity by low incomegroups, are also exempted.
6.30 The Caldera administration believes that this GST could generate about thesame revenues as the VAT would. However, it is expected to prove much harder toadminister and thus easier to evade, especially if further measures to improve taxadministration are not implemented quickly.
6.31 Rates. The basic tax, which was 10 percent in 1994 and 12.5 percent in1995, is to be set each year between a minimum of 5 percent and a maximum of 20 percent.In addition, goods defined as luxuries are subject to an additional tax at a rate of either 10,20, or 30 percent. The luxury surcharge is to be paid by the importer or manufacturer as apercentage of the suggested or estimated retail price. The 10 percent surcharge applies tocigarettes, liquor, and motor vehicles with a factory price of 2,200 to 4,400 TUs. The 20percent surcharge applies to cable TV, video rentals, and cars costing over 4,400 TUs. The30 percent surcharge applies to private aircraft, yachts, motorcycles of over 500cc, coin-operated games, jewelry (including watches), billiards, salmon, caviar, fine rugs, tapestry,and furs. The tax for Margarita Island's free-zone importers was reduced by half.

- 96 -
6.C.3 The Bank Debit Tax (BDT) Bill
6.32 This bill required firms and individuals to pay a flat 0.75 percent of the valueof every check issued through December 1994 (bank transfers were also subject to the levy);it was collected and paid in by the banks themselves. The banks submitted daily andmonthly statements of the amounts collected, and were subject to stiff fines for failing tohand over collection promptly.
6.33 The BDT was the Plan's most controversial element, but generated largerevenues for the government. In 1994, revenues from this tax were about 1.5 percent ofGDP. The tax had potentially a large distortionary effect. It created an incentive to bypassthe nation's banks just when they faced financial difficulties and needed more business, andfirms and individuals were doing everything in their power to avoid using their bankaccounts, preferring to deal in dollars or cash or to endorse certified or cashier's checks.
6.34 Rates. Account holders were required to pay 0.75 percent of the value of allpayments made from any checking, savings, or other accounts. This included fundswithdrawn from an automatic teller machine and credit card transactions. Each endorsementon a check after the first cost the issuer 0.75 percent of the check amount. While the bill didnot limit the number of endorsements per check, issuers were encouraged to stamp checks"Not Endorsable". The BDT was also charged on the purchase of a money order, as well ason the buyer's check in a stock market transaction.
6.35 Exemptions. Transactions exempted from the tax were: transfers betweenaccounts belonging to the same account holder, interbank loans of five days or less, taxpayments, pension payments, diplomats' transactions, and checks issued by governmententities. Account holders exempted from the tax were: state and municipal governments,the Central Bank, BANAP, and the Venezuelan Investment Fund.
6.36 The Fiscal StamR Tax Bil. This bill made adjustments to rates in theVelasquez administration's Stamp Tax Law revisions of December 1993. The new billreduced the fee or tax charged for various services, including visas, permits for foreignyachts, airport exit, consultations with tax authorities, and public registry entities.
6.37 SENIAT. The Sosa Plan decree provided for an autonomous tax collectionagency, transferring tax administration from the Finance Ministry. The National TaxAdministration Service (Servicio Nacional de Administraci6n Tributaria--SENIAT) is nowresponsible for cracking down on evasion and streamlining collections. Its expenses are metby a percentage of the taxes it collects--initially 3 percent of wholesale, luxury, and incometax revenues. SENAT is already in operation.Y'
7/ Another amendment in the Sosa Plan is likely to further tax administration reform. This amendmentempowers the goverment to earmark up to 5 percent of its tax receipts for tax administration expensesand training.

- 97 -
6.D The VAT and CAT: Strengthening the Sosa Plan
6.38 Reinstation of a VAT as originally conceived in 1993 and the implementationof the CAT would be fundamental steps in the modernization of the tax systemO'. They willbroaden the tax base, diversify the sources of revenue, and help to reduce tax avoidance andevasion.
6.39 Economic Rationale for the Taxes. A full-fledged VAT is favored for itssubstantial revenue potential as an indirect general tax that is both neutral and non-distortionary. The VAT, before its repeal, was expected to become the most importantsource of non-oil revenue, with significant flexibility to adjust to public-sector revenue needsand to partially compensate for fluctuations in oil prices. As a general or universal tax, itaffects uniformly all economic activities, with few exemptions. For example, imported anddomestically produced goods and services are equally taxed, but exports are exempt. TheVAT is also neutral in savings and consumption and in production; it does not discriminatebetween consumption today or tomorrow or between the use of capital or labor.
6.40 The CAT is considered a form of presumptive taxation on "normal or average"income that could be used to reduce avoidance and evasion of the corporate income tax. Theimplicit assumption behind this tax is that the market value of a firm's assets reflects the netpresent value of future cash flows generated by these assets (Sadka and Tanzi, 1992). Inother words, the market value of assets reveals the true profits that could be generated bycorporations, compared with the low profits usually reported for tax purposes. "Normal" or"average" income is understood as the income that could be earned by a firm having anaverage work load, confronting an average level of risk, and using standard availabletechnology.
6.41 The Value Added Tax. The VAT implemented in late 1993 was aconsumption tax according to Shoup and Gillis21, and followed the standard criteria used inmost countries that have imposed a similar tax. It was based on the destination principle,followed the credit method, and was tax exclusive. It was to be applied to all sales, but theproducer's tax liability would be calculated by subtracting the VAT paid on all intermediateinputs and capital goods during the taxable period when the sale was made. Imports weretaxed and exports were exempted through a zero rate, with credit for VAT on inputs andcapital goods. The VAT was levied on the prices of the goods and services before the tax.
6.42 Following common practice, financial and construction activities were notsubject to the tax, as these are considered "difficult-to-tax goods and services" (see Tait,1988) and because the tax administration was not prepared to manage the tax in these
8/ The CAT is currently in effect in Venezuela and must be implemented to strengthen the Sosa Plan.
9/ See Shoup, Carl S. and Malcolm Gillis, Value Added Taxation in Developing Countries, Washington D.C.,World Bank, 1990.

- 98 -
sectors. Some items considered basics in the consumption basket of low-income groups wereexempted. Other exemptions were less justified on public policy grounds. These includedall non-processed agricultural foods, all types of meat in any form, bread and pastas, cornand wheat flour, medicines, milk in any form, infant formulas, books, magazines,newspapers, and educational expenses. Public transportation, except air transportation, andoil products, including gasoline and diesel, were also exempted.
6.43 There was a single VAT rate, ranging from 5 to 20 percent, except forexports, for which the rate was zero, to be set every year in the Annual Budget Law. Theidea was to allow enough flexibility to adjust revenues according to fiscal needs. The VATwas implemented at a rate of 10 percent when it began in October 1993.
6.44 The Corporate Asset Tax. Most countries with a corporate asset tax haveused it, as Venezuela will, as a minimum income tax; that is, any income above a leveldetermined by the asset tax is taxed at the marginal rate of the corporate income tax.
6.45 There are at least two practical reasons why the asset tax is considered aminimum income tax. The first is its potential to reduce the avoidance and evasion of theincome tax. The CAT, by taking the average value of corporate assets and a tax rateequivalent to the income tax rate, may close the loopholes typically used by corporations toavoid the income tax, particularly during periods of high inflation. The advantage is that thetax base is fixed and objective, and does not depend on individual behavior. Additionally,inflation does not erode the tax base, as long as there are no large time lags between the timewhen the tax is due and actual payment.
6.46 The second reason is that industrialized countries do not give tax credit basedon assets tax but only on income tax. If the CAT is not designed as a minimum income tax,some of the incentive for foreign investment in developing countries could be lost. The ideais that in most cases corporations pay the income tax. The CAT would be paid only when itexceeds the income tax and the amount to be paid is only that excess. Under thesecircumstances, the effect of the tax on foreign corporations is substantially reduced.
6.47 The CAT, which became effective in January 1994 with a 1 percent rate ongross assets, has the following desirable attributes. First, to avoid any investmentdisincentive, the assets will not be subject to the tax during the investment period when assetshave not yet been incorporated into the production process. Second, to avoid doubletaxation, a firm's holdings in subsidiaries will not be taxed as the assets of the subsidiary aretaxed at that level. Third, to avoid taxing some activities more or less than others, the tax isimposed on gross assets (including tangible and intangible assets as well as fixed and currentassets). Fourth, no deductions for liabilities are allowed because neutrality in debt versusequity financing could be artificially altered and the tax base could be easily eroded. In thisregard, a low rate on gross assets is preferable to a high rate on net assets. Fifth, financialinstitutions are taxed only on non-monetary assets, as those assets are basically liabilities ofthe institutions that represent assets of other economic agents. Sixth, to avoid erosion, the

- 99 -
tax base is adjusted annually for inflation, including depreciated assets which should beadjusted according to their book value. Finally, the base is the average value of gross assetsduring a certain period, preferably one year. This base would discourage artificial changesin assets to reduce tax liabilities.
6.48 Through the Enabling Law, Congress established exemptions for non-profitinstitutions, as well as for scientific, educational, and cultural activities. In addition,Congress exempted the agricultural sector "on the basis of consistency" with the Income TaxLaw, as this sector is exempt from the income tax and the CAT is considered a minimumincome tax. Also, the "Special Powers Law" established that corporations should deductfrom their tax liability the portion of their production dedicated to exports. Finally,Congress also exempted the activities "regulated" by the state and the "unproductive" assetsof corporations, although no criteria for defining these concepts were developed in the law.However, it is understood that "regulated activities" mean those that have regulated prices.
6.49 Except for non-profit institutions and educational, scientific, and culturalactivities, these exemptions have no justification based on any economic or public policycriteria. On the contrary, they will exacerbate the distortions created in the Income Tax Lawby giving privileges to certain activities, such as the exemptions to the agricultural sector and"regulated" corporations. These distortions, in addition to the exemptions for "unproductive"assets of corporations, will create loopholes that facilitate tax avoidance.
6.D.1 Impact of the VAT and CAT on Revenue Collection and OtherVariables
6.50 The estimate of the VAT's impact on tax revenue is based on the methodologyused by the IMFWO', updated with the data on aggregate supply for 1992, the input-outputmatrix of CORDIPLAN, and the version of the law approved in September 1993 by theExecutive. The estimates of the CAT's impact were prepared under several scenarios usingNational Accounts statistics and a survey prepared by the Central Bank based on tax returnsfrom private non-financial corporations for 1990. Information on financial corporations andpublic enterprises, including the oil companies, was taken from several Central Bankpublications.
6.51 VAT-Revenue ImRact. The estimate of revenue from the VAT arrives at ataxable aggregate supply by adding gross production and imports for each economic activity.Exports, inventories, and exempted goods and services are subtracted in order to determinethe taxable sales or the debits of the tax. The credits of the tax are determined by theintermediate inputs used by each sector. However, some intermediate inputs are exemptedfrom the tax, and for that reason are not subject to credit; similarly, taxed inputs used in theproduction of exempted sales are not subject to credits. The net credits of the VAT are
1O/ International Monetary Fund, Venezuela: Lineamientos Rara una Reforma Tributaria, Departamento deFinanzas P(blicas, Washington D.C., February 1991.

-100 -
determined by subtracting from total intermediate inputs the invoices of exempted inputs andthe invoices of taxed inputs dedicated to exempted sales-u'. In addition, investments aresubtracted from the taxable sales as those expenses are also subject to credits, with theexclusion of the investments made by sectors that are exempted from the VAT. The taxablebase is then estimated by subtracting the net credits and investments from the taxableaggregate supply.
6.52 Potential revenue collection is obtained by multiplying the taxable base by thetax rate (assumed at 10 percent), but a margin of 40 percent for tax evasion is assumed,taking into account the expected difficulties during the initial implementation of the tax.The calculations show collection--net of the 40 percent margin for evasion--at about 3.6percent of GDP. The taxable base is almost 60 percent of GDP; thus potential revenuewould be approximately 6 percent of GDP at a tax rate of 10 percent and almost 9 percent atthe maximum tax rate of 15 percent if evasion were totally eliminated.
6.53 VAT-Effective Rates. A set of effective VAT rates by income groups wascalculated using the Central Bank's Survey on Final Household Consumption. These rateswere estimated using final consumption instead of income data, which the survey does notprovide. The survey divides the sample population into quartiles, the first quartile being thepoorest group and the fourth quartile the richest, and divides final consumption into fourexpenditure items, foods and beverages, clothing, household expenses and sundry expenses.Following the configuration of taxed and exempted goods and services according to the VATlaw, the consumption basket for each quartile is composed of the share of taxed andexempted expenditures. Total taxed and exempted goods are also calculated as a proportionof final consumption, not only by quartile but also for the average consumption basket ofhouseholds. The effective tax rates are then calculated by multiplying the share of taxedgoods and services by the tax rate, 10 percent.
6.54 There are several interesting results. First, the effective tax rates onconsumption are progressive, increasing with income, because taxed expenses represent 53percent of final consumption for the first quartile, but 62 percent for the fourth quartile. Onaverage, taxed consumption is 57 percent, that is, the average effective tax rate is 5.7percent. Second, exempted foods and beverages absorb 52 percent of total expenditures onfoods and 20 percent of total final consumption for the first quartile, while they absorb only38 percent and 9.5 percent, respectively, for the fourth quartile. Similar proportions can beobserved for household expenses and sundry expenses. Finally, a high proportion ofexempted consumption is composed of properly exempted goods and services, but also of"not-subject-to-the-tax" activities, such as housing sales and rents and financial services.Expenses on these items decrease as the income level increases.
II/ The input-output matrix was used for the calculation for each economic activity of the taxed inputsdedicated to exempted production and the exempted inputs used in the production of taxed goods andservices.

- 101 -
6.55 In theory exemptions are undesirable, as the social distribution objectives ofgovernment policy can normally be achieved through other, more direct and better targetedinstruments. However, such exemptions are frequently unavoidable for indirect sale taxes.The exemptions in the VAT were mostly defined by social criteria in order to alleviate theimpact on low-income groups, and although exempted goods and services share an importantproportion of final consumption, the revenue potential of the VAT, which was initiated andsubsequently replaced, is substantial.
6.56 CAT-Revenue hnpact. The estimate of the CAT's impact on tax revenue isbased on the determination of an average balance sheet of corporate assets. This balancesheet is used to evaluate the composition of those assets and the alternative tax bases. Amajor difficulty in determining an average balance sheet is the absence of information on thevalue of the assets of private non-financial corporations.R'" This difficulty was overcomeby combining the information provided in BCV's Fiscal Module with National Accountsstatistics. The BCV survey was based on the 1989 and 1990 tax returns of 830 corporationsgrouped by economic sectors and considered the most important enterprises in theirrespective sectors, although their contribution to revenue from the income tax paid by non-oilcorporations was only 23 percent and 38 percent in 1989 and 1990, respectively.
6.57 The information from the survey was used to elaborate an average structure ofthe balance sheet for non-financial corporations, assuming that the sample resembles the truecomposition of the population. The structure was deternined in relative or percentage termsrather than in monetary values (bolivars), given the bias that could be produced by thoseentities for tax purposes. The estimate of the average balance sheet in monetary values wasmade by using the National Accounts statistics published by the Central Bank.
6.58 The procedure for calculating the stock of fixed assets of the non-financialprivate sector used a statistical series of fixed investment and depreciation. The stock offixed assets was adjusted annually for inflation and depreciation, according to thefundamentals that should be included in the tax law. These variables were used because ofthe availability of data from the National Accounts statistics similar in concept to the items ofthe balance sheet. The other items could not be estimated from other macroeconomicvariables for want of information segregated by sectors of economic activity. Once the stockof fixed assets was estimated in bolivars, the other items were obtained by applying thepercentage share or relative structure of the average balance sheet estimated in the survey ofthe Fiscal Module.
6.59 The estimate of the detailed average balance sheet in monetary values providedscenarios for several tax bases, such as gross or net assets, types of liabilities to be deducted,deduction of investments in progress, etc. Three tax bases were used. One was "netassets," in which the liabilities not deducted were those with local financial institutions and
12/ For other sectors, including financial institutions and oil and non-oil public enterprises, the value of theitems on the balance sheet is published by the Central Bank.

- 102 -
foreign creditors. Another was "non-financial assets," excluding inventories. The third wasbased on gross assets. Under all three, new investments in progress and a corporation'sholdings of subsidiaries were deducted.
6.60 Each of these tax bases was combined with three tax rates (1 percent, 1.5percent and 2 percent) and two periods for average asset life (10 and 15 years). As with theinflation adjustment, this tax is very sensitive to average asset life, probably the mostunpredictable factor in estimating revenues.
6.61 The CAT will be paid mostly by the private sector for two reasons. First, as itis considered a minimum income tax and is thus deductible from the corporate income tax,the oil companies, which already pay heavy income taxes, will not be likely to haveadditional tax liabilities because of the CAT. The other reason pertains to the non-oil publicenterprises, most of which, in spite of being subject to the income tax, have neither profitsnor heavy losses and will be unable to pay the CAT. Since these enterprises are part of thepublic sector or are mostly owned by the central government through the Finance Ministryand the Venezuelan Investment Fund, this problem might be less significant. Anotherimportant consideration that goes beyond the scope of this paper is privatizing theseenterprises, which could be affected by the implementation of this tax.
6.62 An analysis of the profitability of the private sector was made to compare theimpact of the CAT and of the income tax, using the figures of gross assets and gross profitsfrom the National Accounts statistics. The results showed that under the 15-year averageasset life scenario, a firm generally would make a profit of Bs 8.9 for every Bs 100 of grossassets (excluding its holdings in subsidiaries and new fixed investments). In other words, theprofitability of the private sector on average would be 8.9 percent of gross assets. At thecorporate income tax rate of 30 percent, the equivalent rate on gross assets would be 2.7percent (8.9 times 0.3). The 1 percent proposed in the draft last year would collect the samerevenues as a corporate income tax at a rate of 11 percent (1 divided by 8.9).
6.63 Under the 10-year average asset life scenario, the profitability of the privatesector is relatively higher (14.9 percent) as the base of gross assets is lower. An income taxrate of 30 percent would be equivalent to a tax on gross assets of 4.5 percent. In otherwords, the proposed tax rate of 1 percent would collect the same revenue as an income taxrate of 6.7 percent (1 divided by 14.9).
6.64 Apparently, a tax rate of about 1 percent on gross assets would not be higherthan what the private sector actually pays on the income tax in the aggregate, because theaverage effective income tax rate paid by corporations is about 22 percent. Thosecorporations that currently pay the income tax at the average would not be affected by thistax. However, those that actually evade or avoid the income tax would be partially caughtthrough the CAT, even at a tax rate of 1 percent on gross assets.

- 103 -
6.E Recommendations
6.65 The Government should consider increasing the level of non-oil taxes by:
A) Reinstating the VAT at all distribution levels as it was originally designed forimplementation in 1993.
B) Implementing the CAT efficiently to collect a minimum income tax fromcorporations, particularly in the short-to-medium term while deficiencies in taxadministration and in the Income Tax Law persist.
C) Reducing the lags between the time when the taxes are due and collection.
D) Extending income tax reform beyond the Sosa Plan, originally proposed toreduce the minimum income for tax exemptions and to eliminate all otherexemptions.
E) Improving tax administration, which SENIAT should be able to do if it isgiven autonomy in its recruitment and compensation practices.Simultaneously, the judicial system should be reformed so that it caneffectively enforce tax penalties.

Chapter 7. Oil Sector Investment Program
7.A International Market Prospects
7.1 World demand for crude is expected to increase at an annual rate of 1.3percent between 1993-2005; it would reach 68.5 mbd in 2000 and about 75 mbd in 2005.Demand will shift towards light-to-medium, low-sulphur types, and away form heavy andextra-heavy crudes because of more stringent environmental standards and the transportsector's demand for cleaner fuels. The demand for heavier products such as fuel oil (bothfor direct use and as refinery feedstock) may stagnate or even decline.
7.2 The share of OPEC countries in the world crude supply is projected toincrease to 29.6 mbd by 2000 (43 percent) and to 34 mbd by 2005 (46 percent). Worldrefining capacity, which in 1992 was about 75 mbd, may increase to 79.5 mbd by 1995 andto 86.1 by 2000. The Middle East, Venezuela, and other developing countries wouldprovide most of the increase, but there is also a small expansion underway in Japan andGermany. In all cases, significant upgrading will be needed to comply with higherenvironmental protection requirements. Expansion, especially of conversion capacity, will bedriven by demand growth in the oil-importing Asian countries, more stringent productspecifications, and the increasing share of sour crudes in the crude mix.
7.3 Crude oil prices in constant U.S. dollars are expected to decline by 1.3 percentannually from 1994-95, increase by 3.2 percent annually from 1996-2000, and decline againby 1.1 percent annually from 2001-05. The relatively high capital and operating costs ofnew conversion refinery capacity would tend to reduce profit margins. However, efficientutilization of refining capacity--projected at an average of 85-90 percent--would offset thisenough to justify expansion. Profit margins are also likely to be linked to higher-pricedpetroleum products, particularly from 1996-2000.
7.4 World demand for natural gas is projected to increase at an annual rate of 3-3.5 percent, faster than the demand for crude oil. While long-term gas supplies for theU.S., Western Europe, and Japan appear to be secure, future demand may outrun low-costand easily available supplies towards the end of the 1990s. Over the long term, supplies toWestern Europe and East Asia from Iran, the Middle East, and the new Central AsianRepublics are likely. However, in all cases, expansion will be costly yet profitable only ifnatural gas prices increase significantly above current levels.

- 105 -
7.B The Government's Investment Program1'
7.5 PDVSA prepares both an annual investment program and a Five YearInvestment Program (FYIP) which must be approved by the Board of Directors and theShareholders General Assembly. Because PDVSA is a 100 percent state-owned monopoly,its FYIP constitutes the govemment's oil sector investment plan.
7.6 The principal goal of PDVSA's 1993-98 FYIP is to consolidate its place in theintemational market by increasing its capacity to supply crude oil and refined products. Tothis end, it will concentrate its efforts in four areas. First, it will explore for large reservesof light and medium crude oil, as well as condensates and natural gas. Second, it willmaximize crude oil production in all traditional areas, and will gradually increase itspermanent production capacity. Third, it will exploit the country's large reserves of heavycrude and bitumen and produce orimulsion (a new patented product) in association withmajor international oil companies. Fourth, it will continue adapting its domestic andoverseas refineries to meet the growing demand for higher quality refined products, as wellas to augment processing of increasingly heavier and more sour crude oil. The proposedFYIP investments are listed in Table 7.1.
7.B.1 Investments in Exploration
7.7 PDVSA will intensify its search for new reserves in zones near traditionalproducing areas, such as North Monagas, Central Anzoategui, and Lake Maracaibo, as wellas in the southern and northern flanks of the Andes in Merida and Perija, and the NorthBarinas, Central Monagas, and East Maturln regions. Exploration in these new areas willprovide an immediate evaluation of subsurface conditions so that a drilling program canbegin if the geophysical work offers the promise of success.
7.8 The FYIP includes investments of over US$2.4 billion for the drilling of 241exploration wells and the acquisition of about 47,755 kilometers of conventional seismic.The breakdown of these investments is shown in Table 7.2. Through these exploratoryactivities, the company hopes to produce an estimated 7,943 million barrels ofcondensate-light and medium crude oils. Expected year-end reserves, by type of crude oil,at the beginning of 1993 and at the end of 1998, are shown in Table 7.3.
I/ All information included in this section was provided by PDVSA staff.

- 106-
Table 7.1. Venezuela: 199341998 Investment Program
~~~~~~~~~~~Anwt 1 Million .S*. S
Arena of Majoa lii t -: 1--31:98
(i) Exploration 285.7 2,467.5
(ii) Production 2,142.9 14,506.5
(iii) Refining 896.1 4,051.9
(iv) Domestic Market 38.9 337.7
(v) Other (Infrastruc., Tankers, INTEVEP, etc.) 129.9 324.7
(vi) Strategic Associations 12.9 818.2
Subtotal for Direct Petroleum Investments 3,506.4 22,506.5
(a) Crist6bal Col6n Project 7.8 202.6
(b) PEQUIVEN (Petrochemicals) 0.0 0.0
(c) Carbozulia 2.6 93.5
(d) PDV Marina (Tanker Fleet) 28.6 28.6
(e) Intemational Operations 0.0 100.0
(f) Bitor (Orinoco heavy oil)In Existing Operations 31.2 31.2In New Operations 58.4 58.4
(g) Palmaven (Pertilizers)In Existing Operations 29.9 29.9In New Operations 2.3 42.9
Sub Total for Non Petroleum Investments 160.8 577.1
GRAND TOTAL 3,667.2 23,083.6
Table 712. Venezuela: Exploration Investments in Billions of Bolivars at Bs 771US$1
Year I993 1994 199 1996 1997 1998 TotalS
Seismic 22,434 9,668 7,227 7,945 7,189 5,353 44,526
Driing 15,290 21,755 27,243 27,794 26,517 26,926 145,555
Total 22,434 31,423 34,470 35,739 33,706 32,309 190,081

- 107 -
Table 7.3. Venezuela: Comparison of Reserves by Type of Crude Oil(million (10') of barrels)
Condasate/gtdumr y O H. vy Total:
Beginning 1993 17,926 45,504 63,330
Discoveries/Adjustments 8,910 (1,204) 7,706
Less Production 4,236 1,834 6,070
Final 1998 22,060 42,366 64,966
7.9 PDVSA does not plan an exploration program to discover new natural gasreserves, since most of the natural gas produced is associated gas, and non-associated gasmakes up a very small portion of the total. Proven natural gas reserves nonetheless willincrease substantially as a result of oil exploration and drilling, from 129 trillion cubic feet atthe beginning of 1993 to about 166 trillion cubic feet by the end of 1998. The breakdown isshown in Table 7.4.
Table 7.4. Venezuela: Natural Gas Proven Reserves
Beginning of 1993 128.9 T.C.F.
Discoveries 48.2 T.C.F.
Less Production 11.0 T.C.F.
Year end 1998 166.1 T.C.F.
7.10 The Crist6bal Col6n project is the only natural gas project in the FYIP. Itwill develop 4.7 T.C.F. of natural gas reserves (located at the extreme north of the PariaPenfnsula) for export as liquefied natural gas, or LNG. The liquefaction plant will have aproduction capacity of about 4.6 million tons per year. PDVSA and an internationalconsortium of petroleum and trading companies--including Exxon, Shell, and Mitsubishi--willinvest in the project.

- 108 -
7.B.2 Investments in Crude Oil. Condensate. and Natural Gas Production
7.11 PDVSA estimates about US$14.5 billion in investments to bring productioncapacity for crude oil, condensate, and natural gas to the levels proposed in the FYIP. Thecomponents are: 1) about US$7.9 billion for development and maintenance of potentialproduction capacity, i.e., drilling of new development and outpost wells, and workovers andrehabilitation of existing wells; 2) about US$0.9 billion for development of new areasdiscovered by successful exploratory activities; 3) about US$2.9 billion for oil and gasgathering systems, production batteries, separators, etc., to accompany the activities above;4) about US$1.0 billion for secondary recovery systems, including gas repressuring andwater flooding; 5) about US$0.7 billion for natural gas development; and 6) about US$0.9billion for natural gas compression facilities.
7.12 Venezuela's reserve-to-production ratio of 75:1 (75 years of production at thecurrent levels) compares favorably with the ratios of most large crude oil producer countries.However, a large portion of proven reserves are heavy and extra heavy crude oils, which areboth more expensive to produce and difficult to market (Table 7.5).
Table 7.5 Venezuela: Proven Reserves in Billions (10'
Condensate (above 45' API) 2.0 (3.1%)
Light Oil (above 32° API) 8.5 (13.2%)
Medium (betwee 22' API to 31.9') 9.1 (14.1%)
Heavy Oil (between 14- API to 21.9- API) 15.3 (23.7%)
Extrm Heavy (between 14 API to 13.9- API) 29.7 (46.0%)
Total Crude Oil 64.6 (100.0%)
Bitumcn (less than 8 API) 70.0
7.13 Since 1990, PDVSA has been producing about 2.5 mbd of crude oil andcondensate, and plans to increase production to about 3.1 mbd by 1998. This will requiresignificant investment in exploration so that PDVSA can incorporate and prove-up anestimated 7,943 million barrels of crude, which would maintain or increase Venezuela'scurrent reserves-to-production ratio. While PDVSA will continue to rely on the light andmedium crude oil reserves that make up most of its current production, it also needs tocontinue development of its existing resource base, which consists mainly of heavy and extraheavy crude oils (rable 7.6).

-109-
Table 7.6 Venezuela: Comparison of Production with Types of Crude Oil
Type of crude oil Production in 1992 Production in 1998
Condensate, light, and medium crude oil 1,817,000 bbs/day (76%) 2,054,000 bls/day (65.6%)
From new light and medium crude
oil reserves:
151,000 bbs/day (4.8%)
Heavy and extra heavy crude oil 624,000 bbs/day (24%) 926,000 bbs/day (29.6%)
Total 2,441,000 bbs/day 3,131,000 bbs/day
7.B.3 Investments in Orimulsion Production
7.14 The Orinoco Belt contains a resource base estimated at 1.3 trillion barrels.About 270 billion barrels are extra heavy crude oil and bitumen recoverable with advanced,sophisticated technology, and about 70 billion barrels are recoverable with existingtechnology. Much of these reserves are true bitumen, which is a liquid form of hydrocarbonsimilar to other forms of petroleum but with a very low hydrogen content. Bitumen is muchmore viscous than ordinary petroleum because of its low hydrogen-to-carbon ratio and isconsidered an unconventional petroleum. Orinoco bitumen is used to produce orimulsion, amixture of 70 percent bitumen, 30 percent water, and some diluents. Orimulsion istransportable and cleanly burned as a boiler fuel by power stations.
7.15 Bitumenes del Orinoco S.A. (BITOR) is the PDVSA subsidiary responsible forhandling Orinoco bitumen and marketing orimulsion. It produced 1.1 mmt of orimulsion in1991, four times the previous year's output, and has signed seven contracts to sell about240,000 barrels per day in international markets. Other agreements are under negotiation.
7.16 The FYIP includes US$90 million, PDVSA's share of the US$1.8 billionneeded to develop the Orinoco Belt, for the production of orimulsion already contracted andunder negotiation. These funds will be used to increase production capacity to 0.7 mbd by1998, and to lay the groundwork for production of 1 mbd by 2000. Specific activitiesinclude drilling some 1,500 wells, laying about 750 miles of pipeline, and constructing 8mixing plants and storage and maritime terminal facilities.

- 110-
7.B.4 Investments in Refining Operations
7.17 PDVSA plans to expand the conversion capacity of its domestic refineries by0.4 mbd by the end of 1998. The FYIP for refinery activity will:
1) Carry out conversion projects in existing refineries, mainly Amuay andCard6n, to reduce fuel oil yields from 0.277 mbd to 0.212 mbd, andincrease heavy crude oil processing capacity by approximately 0.1 mbd.
2) Improve the quality of all refined products to establish PDVSA'sposition in the intemational markets, which increasingly demandcleaner products. (In the U.S., the Clean Air Act requiresreformulated gasolines from 1995 onwards and diesel oil with a sulphurcontent of less than 0.05 percent from October 1993 onwards.)
3) Carry out and implement engineering studies to reduce emissions to theair and ground in all refineries, in compliance with stricter legislationapproved by Congress.
7.18 Implementation of the FYIP will significantly change PDVSA's refiningcapacity both at home and abroad (Table 7.7).
Table 7.7. Venezuela: Crude Oil Disposition and Refining
Dispositiorn i _ 1993 1998
Crude Oil Producwtn C/lMedium Heavy Total C/L/Mediwn Heavy Total
Sales as crude oil 222 420 642 549 443 992
Refined in Venezuela and 915 177 1092 928 277 1205Curacao
Refined abroad 385 203 588 388 231 619
Increased capacity abroad 132 132 212 212for heavy crude oils
Increased capacity 6 6 103 103domestically for heavy crudeoils
TOTALS 1552 938 2460 1865 1266 3131
7.19 The proposed investments in refining total about US$4.9 billion. The details,by location and type of project and corresponding internal rates of return (as calculated byPDVSA) are shown in Table 7.8.

- 111 -
Table 7.8. Venezuela: Investments in Refining (Bls/d)
Reduction of Incrtase ofAmount in :Fuel Oil : Heavv Oil
Location of Project Million USS Type of Project IRR (Bls/d) (BbId)
Card6n - BG 2.244 Deep Conversion 13% (90,000) 70,000Product Quality
Curacao 887 Deep Conversion 13% (60,000) 57,000(Isla Ref.) Products Quality
Environmental
Amuay 1.278 Deep Conversion 11% (45,000) 150,000Quality of ProductsEnvironmental
El Palito - 524 Quality of Products 17%Puerto La Cruz
TOTALS 4.933 (195,000) 277,000
7.B.5 Investments in the Domestic Market
7.20 PDVSA continues to expand and modernize its domestic market in spite oflarge financial losses due to inappropriate pricing policies. The FYIP includes investmentsof about US$300 million to increase distribution of natural gas and refined petroleumproducts, and to upgrade existing facilities. Work was completed in 1992 on two majordistribution systems: 1) the SUMANDES or Supply System for the Andean Region, and 2)the SISCO or Central-West Supply System. PDVSA also moved ahead with the expansion ofits natural gas pipeline network.
7.21 PDVSA has recently built or remodeled about 80 service stations and opened 5new stations to sell compressed natural gas (CNG), which is being used in an experimentalprogram to increase natural gas utilization in the transport sector. Similarly, new lines oflubricants were introduced, and a modern distribution system was installed to supply jet fuelat the International Maiquetfa Airport. A program to ensure more reliable fuel distribution inCaracas was also completed in 1992.
7.B.6 Other Investments
7.22 PDVSA has planned investments of about US$100 million to continue theexpansion and consolidation of its international marketing facilities. In addition, it plans tomodernize its entire tanker fleet, and has contracted with South Korea's Hyundai HeavyIndustries to construct eight new double-hulled tankers. The tankers are being designed tomeet the strictest environmental and safety standards. This is only the first stage in

- 112 -
PDVSA's tanker fleet modernization program; the FYIP includes about US$300 million toimprove the fleet.
7.C Assessment of the Proposed Investment Program'
7.23 The following assessment of the proposed investment program is based oninternal rate of return (IRR) estimates for several activities in the 1993-98 FYIP computedwith the Bank's projections for oil prices. The tables in Appendix 2 provide details of theseestimates computed with US$ figures.
7.C.1 Investments in Exploration. Production. and Refinery
7.24 The results of a financial analysis to evaluate the 1993-98 FYIP indicate that,even with the current domestic pricing structure and heavy tax burden, PDVSA will obtain afinancial IRR of 37.5 percent if its proposed exploration and production investments areimplemented. The IRR increases to 53.8 percent if the tax burden is reduced by eliminatingthe export reference price over the next four years. Most of the refining projects have IRRsbetween 11 and 17 percent, which are considered low for petroleum projects, since most ofthe major international oil companies do not implement projects with IRRs of less than 20percent.
7.C.2 Investments in the Domestic Market
7.25 The proposed investments to improve domestic distribution are unwarranted onfinancial grounds. The highly subsidized domestic supply of petroleum products and naturalgas has caused losses for PDVSA averaging US$1.5 billion annually. As long as petroleumprices are maintained at artificially low levels, investments in the domestic market are notadvisable.
7.C.3 Investments in Other Areas
7.26 The investments for strategic associations proposed in the FYIP representPDVSA's "seed money" contribution to the projects. Successful projects will have IRRsranging from 10 to 19 percent, depending on the price received for the synthetic crude oilprocessed from Orinoco bitumen. The estimated payout time for these investments isbetween 10 and 15 years.
7.27 Investments not directly related to PDVSA's core petroleum operations, suchas support for its research and development institute, are very difficult to evaluate for lack ofdetails on actual total project investment requirements, operating costs, production or
2/ This assessment was prepared by Bank staff and consultants based on information provided by PDVSAstaff.

- 113 -
productivity targets, and prices or cost savings to be obtained. However, most of theseactivities have an unprofitable past, and this is unlikely to change significantly in the futurewithout a major change in pricing policies.
7.D Recommendations
7.28 PDVSA's Role. PDVSA should focus exploration in traditional areas wherethere are good possibilities of finding light and medium crude oils and where expectedreserves are sizable, and in fields with higher per well productivity. Again, the probabilityof encountering light-medium crudes is greater here, and costs will be lower. WhilePDVSA's proposed investments to maintain and expand production appear sound, a closerscrutiny is necessary, as the Government can no longer afford to finance oil projects withuncertain returns.
7.29 Private Sector Role. Exploration in zones outside the traditional areas carryboth greater risk and higher costs, and should therefore be left to the private sector. TheGovernment should invite private petroleum companies to participate in exploration andproduction in these areas via production- or profit-sharing risk contracts. (The legal detailsfor such contracts are described in Chapter 8.)
7.30 The Government should encourage private sector participation in theexploitation of fields containing heavier crudes, particularly in areas where potential reservesand production increases are still considerable. These crudes are unlikely candidates forPDVSA's attention, as they are costlier to extract, have lower per well productivity, andrequire the use of more sophisticated technology.
7.31 The Government should also allow private sector operation in all areas wherePDVSA can no longer afford to continue development, due to the degree of depletion,structural complexity, or the need for large investments to implement secondary or enhancedrecovery systems. The following operational guidelines would make participation in suchprojects more appealing to the private sector: 1) Consolidate several fields into a larger areaso that an operator can begin with a significant crude oil production base. 2) Ensure that allfields to be turned over to private sector operators contain proven reserves for furtherdevelopment. 3) Provide "upside potential" by evaluating whether areas have additionalreserves around and near them, and/or at depths yet to be developed. 4) Allow the privatesector operator to determine if sufficient reserves exist, if an area is amenable to secondaryor enhanced recovery, and if improved technology will increase existing production levels.5) Consider private sector participants to be partners (not merely "contractors") who fullycontrol their own investments and operations.
7.32 The Government should allow private sector participation in all refiningactivity; at minimum, new refineries should receive private financing. Similarly,distribution and sale of refined petroleum products, LPG, and natural gas should be

- 114 -
privatized, and domestic prices liberalized. These moves would result in reduced publicspending, lower costs, and increased efficiency. Further, when domestic investments areneeded for new gas terminals, distribution pipelines, or marketing facilities, private firmswould step in and lessen the public sector's burden.
7.33 PDVSA is seeking associations with major international petroleum companiesto develop the Orinoco Bitumen Belt. As such alliances will be necessary at each stage ofproduction (from field development to intemational marketing), the conditions forassociations need to be quite flexible (Chapter 8). The following projects would also benefitfrom private sector participation: PEQUIVEN's petrochemical projects, Carbozulia's coalexploration-exploitation operations, transport tanker fleet improvements, expansion ofinternational refining and marketing operations, increased production and marketingoperations for orimulsion, and expansion of PALMAVEN's fertilizer production andmarketing activities. Finally, the LNG Crist6bal Col6n project, which is still in its initialstages, should be left to the private sector because the project's prospects are dim, given thelarge investments it will require and the low price currently being paid for natural gas.
7.34 Conducting research and developing new applications to increase efficiency,reduce costs, and further the use of Venezuela's hydrocarbon resource base are worthy goals.Nevertheless, the Government should secure private sector participation by sharingknowledge, and by charging royalties to operating companies that use newly developedtechnology or profit form trademarks and patents made possible by this technology.

Chapter 8: 01 Sector Legal Framework
8.A Introduction
8.1 Venezuela still poses major obstacles to efficient privately led oil sectordevelopment. The chief one is the legal framework that gives the state a monopoly on theproduction of hydrocarbons, and allows private participation only under highly restrictiveconditions.
8.B International Changes in Ownership
8.2 Complete state monopolies hardly exist anymore except in Saudi Arabia,Kuwait, and Mexico. Even in Saudi Arabia, new capital-intensive projects, such as refiningand petrochemical facilities in the new industrial area of Jubail, are joint ventures with RoyalDutch-Shell and Mobil.
8.3 Several large oil monopolies have been or are being privatized in LatinAmerica (Argentina and Peru), Eastern Europe (Poland), and several parts of the formerSoviet Union. Several former socialist economies, such as Algeria, Viet Nam, Myanmar,India, Cuba, and countries of the former Soviet Union, are actively seeking internationalinvestment. Other large oil producers like Nigeria that have long relied on foreigninvestment are improving the fiscal conditions that affect such investment.
8.4 In developed countries the trend is also to move away from state control of theoil industry. In the U.K., the state-owned companies of the British National Oil Corporationhave been privatized. Privatization of Britoil and British Gas followed, and the publiclyowned shares in British Petroleum have been sold. In France, state ownership ofElf-Aquitaine and Total-CFP is being reduced through sales of shares to the public. InNorway, wholly state-owned companies such as Statoil are being retained, but these nowcompete with a flourishing private sector that has in turn benefitted from less interference bypublicly owned companies.
S.C The Leg-al Framework of Venezuela's Oil Sector
8.5 Ownership and Institutional Laws. Venezuela's commonly known "1975Nationalization Law" gives the state control of exploration, production, refining andprocessing, transportation and storage, and domestic and foreign marketing of hydrocarbonproducts. Concessions to private companies (domestic or foreign) involved in oil productionwere canceled effective December 31, 1975. The following laws still apply to oil activitiesbut are subject to the provisions of the Nationalization Law: the 1967 Hydrocarbons Law,the 1971 Law Reserving for the State the Natural Gas Industry, the 1971 Law of Reversionof Affected Property to Hydrocarbon Concessions, the 1973 Law Reserving for the State theImport and Domestic Marketing of Hydrocarbon Products, and the 1986 CentralAdministration Law.

- 116 -
8.6 Article 35 of the 1986. Central Administration Law states that the Ministry ofEnergy and Mines (MEM) is responsible for formulating and implementing energy policy inVenezuela. PDVSA, the financial holding company that acts as the coordinating agent forthe oil industry, carries out MEM's directives through its three affiliates: Lagoven, aformer affiliate of Exxon; Maraven, a former affiliate of Royal Dutch-Shell; and Corpoven,which consolidates the assets of Corporaci6n Venezolana de Petr6leo and of about fourteenother small private companies that existed at the time of the nationalization. The threecompanies are fully integrated and operationally independent of each other, even competingin some cases for contracts and markets. For simplification they will be referred tocollectively as PDVSA.
8.7 Article 5 of the Nationalization Law provides only two avenues for privatesector participation: through operations contracts and through association contracts (or "jointventures"), both with PDVSA. PDVSA may enter into operations contracts with any privateparty, foreign or domestic.
8.8 In 1992, PDVSA signed operations contracts with private parties for oilproduction for the first time. (International oil companies presented competitive tenders forthe development of nine marginal fields, and PDVSA signed three production contracts.)The contracts stipulate that all oil produced in these fields belongs to PDVSA, which willpay the operator a flat fee for development, and a fee per barrel for petroleum produced anddelivered. If a company provides drilling or mud-logging services at a site, PDVSA mustpay the stipulated fee, regardless of whether or not the well is productive.
8.9 PDVSA and the private contractor do not share the operational risks orbenefits equally. The contractor alone bears the risk that oil production will not be sufficientto recover costs in excess of the flat fee. Similarly, regardless of the international price ofoil, the contractor receives a fixed dollar amount per barrel. PDVSA bears the risk thatinternational oil prices will merely approximate the production fee, and it could thus beobligated to sell at a loss once transportation, treatment, and storage costs are added. Privateinvestors may worry that in such a case unprofitable production would simply be stopped,despite the existence of a contract. PDVSA gains if oil prices increase because all of theupside accrues to it. The operations contract is similar to the "service contract with risk"used in other countries, with one important difference. Most service contracts reserve ashare of any price upside for the contractor.
8.10 In 1993, PDVSA again began inviting competitive tenders for the developmentof marginal fields under operations contracts. Without altering the essence of the contract, acontractor will now be permitted to undertake exploration in addition to the development ofthe marginal field within the assigned area.
8.11 Association contracts are joint ventures in which the parties share all liabilities,risks, and benefits. The law governing these contracts stipulates: 1) that there must be

- 117 -
"special circumstances" or "public interest benefits"; 2) that PDVSA retains "control" of theoperations (there has been debate regarding the meaning of "control"); 3) that the contract betime-limited; and 4) that both chambers of Congress in joint session approve the contractafter the Executive provides all the relevant information.
8.12 The "special circumstances" refer to new technologies and large capitalinvestments that PDVSA cannot obtain. "Control" has not been interpreted as having amajority equity interest, as is normally the case, but as having control of operations throughveto power or through a requirement for a unanimous vote on specific issues.
8.13 PDVSA has resorted to association contracts for the first time to manufactureand export liquid natural gas (LNG) and to develop the extra heavy crude reserves in theOrinoco Belt. The economics of both projects, which require the application of newtechnologies and the investment of several billion dollars per project, are far from certain.To comply with the "control" requirement, PDVSA is asking that the president of each jointventure be appointed by the contract's Venezuelan party. (For example, Lagoven willappoint the president for the LNG project, and Maraven for the Orinoco Belt project.)Under the contracts it has begun negotiating, PDVSA would contribute 20-30 percent of thetotal equity, or about 40 percent of project costs. The balance would come from financialinstitutions.
8.D Characteristics of an Efficient legal Framework for the Oil Sector
8.14 An efficient legal framework for the oil sector in almost any country must:1) recognize the peculiar characteristics of the petroleum business; 2) set forth clear policyobjectives for the public sector and define the role of the private sector; 3) identify a realisticmethodology for carrying out those objectives; and 4) provide a neutral system of incentivesfor all participants.
8.15 A well-managed, comprehensive exploitation policy, recognizing that oil is anon-renewable resource and that the rent derived from it will also disappear some day, willendeavor to maximize the qualitative use of revenue in the long, albeit finite, term. Thismeans that the development of additional reserves should allow for a fairly constant flow ofrevenue.
8.16 The applicable legislation should ensure that exploration for new reservescontinues, and that these should replace produced volumes for as long as is economicallypossible. It should also provide for "efficient" petroleum production that will: 1) maximizeexport earnings; 2) provide reliable and competitively priced feedstocks for the localpetrochemical and derivative industries; 3) expand tax revenues; and 4) minimize theenvironmental damage that results from petroleum operations.

- 118 -
8.17 Exploration, by its very nature, is a risky venture; drilling a well is the onlyway to find out if there are hydrocarbons under the ground. To maintain a stable revenuestream requires that extracted volumes be replaced by equivalent reserves. Venezuela's largeproduction calls for annual exploration budgets in the hundreds of millions or billions ofdollars, with a high probability that this investment will yield some dry holes. Private sectorparticipation in this risky undertaking is advisable.
8.18 In addition to the uncertain results of exploration, there is the cost ofemploying constantly changing and expensive technologies as finding new reserves becomesprogressively more difficult. As a matter of policy, the state should recognize that the mostbeneficial and efficient way to attract these technologies is by offering appealing investmentopportunities to private participants, and not merely by hiring support services.
8.19 As exploration contends with geological risk, production and development arefraught with economic risk. The production, transport, and processing of petroleum requirevery large up-front capital expenditures that might not be recovered fully for various reasons,including shortfalls in anticipated production and price collapses (in particular when PDVSAmakes no effort to hedge these price risks). It is unrealistic to believe that the state can findthe capital to develop all of Venezuela's hydrocarbon resources, or can afford the wastefuldiversion of substantial oil tax revenue for investments that the private sector can take over.
8.20 Environmental protection in connection with petroleum operations is anotherconcern. The state, as the sole producer of oil and user of its revenues, has not allocatedadequate resources for environmental protection. However, the experience of severalcountries demonstrates that a government can fairly and effectively regulate theenvironmental impact of petroleum operations carried out by the private sector.
8.21 New legislation should recognize that domestic and foreign investors withmore resources than the state can muster are in a better position to take financial risks. Theprivate sector also possesses the technology and management skills to undertake newprojects, and can provide market access for new products. Therefore, the legal frameworkshould be concerned primarily with the creation of an environment in which private investorswill find incentives to provide capital and technology to the petroleum sector.
8.E Recommendations
8.22 Venezuela may need to modernize its legal framework in the petroleum sectorto attract private investment. The authorities may want to consider a new legislation toinclude several suggestions. The first one is that:
A) All new exploration may be carried out by any party, Venezuelan orforeign, deemed both technically and financially qualified by an

- 119 -
authority within the Executive branch. The approved party or partieswould enter into association contracts with PDVSA.
B) The holders of exploration licenses would have the right to productionand development, following a discovery, and to participation intransport and processing, either independently or in association withPDVSA. No government approval would be required.
C) Private producers would be free to export a negotiable portion of theirnet hydrocarbon and related production. Many firms interested indoing business in Venezuela would require access to crude oil as aprerequisite to investing there, and would settle for being allowed toexport part of their net production, perhaps prorated to the limitationsimposed on other producers, as in Nigeria. These exports would haveto be reconciled with Venezuela's membership in OPEC and PDVSA'sdownstream integration.
D) Exploration licenses would be awarded by the Government through abidding procedure that included the pre-qualification of bidders.Operating rights would be awarded on the merits of a committedminimum work program and other relevant variables. The grantingauthority would develop and implement a transparent and competitivebidding process. It will also provide the relevant information tointerested parties including the oil taxation rules.
8.23 The second recommendation is that the royalty provisions in the HydrocarbonsLaw should be revised to provide a fair basis for calculating this tax and avoiding distortions.For example, at present royalties are required for hydrocarbons used in field operations, orfor natural gas products, without allowing the producer to deduct processing costs.
8.24 The third recommendation is that PDVSA should focus on: 1) managementand development of all producing fields currently under its operational control (including theOrinoco Belt), either alone or with private partners; 2) selective participation in jointventures with private firms on an arm's-length basis; and 3) any other activities in which itcan compete with the private sector on a level playing field. The law should allow PDVSAto negotiate association contracts without government approval. Similarly, the grantingauthority should be able to award hydrocarbon exploration and exploitation rights without theapproval of Congress. Prospective investors often rightly fear that the deals they work sohard to negotiate might become political footballs. Finally, the import, distribution, andmarketing of hydrocarbons and derivatives should be entrusted to a competitive market ofqualified agents.

Chapter 9: Oil Sector Taxation
9.A Introduction
9.1 Venezuela has retained the tax system applied to foreign oil companies beforenationalization. At first, this policy did not have negative consequences because internationaloil prices were high and PDVSA's production mix has been dominated by light and mediumcrudes, which are highly valued and easy to market. However, since international oil pricescollapsed in 1986, taxes due as a share of oil revenues has become very high, and wouldimpede Venezuela's ability to compete internationally for private investment in the sector.
9.B Characteristics of an Efficient Oil Fiscal Framework
9.2 There are almost as many mechanisms for capturing the rent from petroleumextraction as there are hydrocarbon-producing countries. The characteristics of a country'sfiscal system and its choice of instruments determine the government's take from variousoperations. They also influence the economic agent's investment decisions in the country.
9.3 The economic conditions affecting the profitability of oil and gas extractiondepend on: 1) the international and domestic prices of petroleum and gas; 2) the operatingcost, determined in part by the oil price and also by technical factors, such as the size of thereserves, the quality of the petroleum produced, and the depth, productivity, and area drainedby each well; and 3) geographic features, such as a field's accessibility and the terrain whereit is located, and its proximity to transportation and export facilities.
9.4 An efficient oil fiscal system encourages the operator of existing fields tocontinue production as long as it is economically feasible, and offers investors an attractivebasis on which to calculate the potential returns from projects. It must work for veryprofitable fields, without leaving too much of the extra rent in the hands of the operator. Itmust also work for small, costly, or otherwise marginal fields that the investor wouldabandon unless he were allowed to keep a reasonable return on his investment. It must doall of these things equally well under a broad range of international oil prices. The mostsuccessful fiscal systems are risk-related, progressive, flexible, and profit-related.
9.5 Risk-related systems. These take into account the actual or expected projectrisk. Thus, the rent-sharing mechanism will impose less of a tax burden on investments withsubstantial exploration risks before a decision to develop a field takes place. It will appearless generous when economic levels of reserves have been proven, even if the actualprofitability of the high- and low-risk fields turns out to be the same.
9.6 Progressive systems. These give a larger share of rent to the government as aproject generates higher profits. This does not mean that the government confiscates all therent once a certain return on investment, rate of return, or other trigger-point has beenreached. Rather, the government, as the resource owner, gets a larger proportion of the rent

- 121 -
than the investor when profits are in excess of what he would reasonably require in order toundertake the investment.
9.7 Flexible svstems. These take into account the production costs, prices, andgross resources extracted during a given period. A typical inflexible fiscal instrument is onethat bases the govemment's take on gross production, like Venezuela's royalties and theVFE.
9.8 Profit-related systems. Progressive and flexible systems are normallyprofit-related. They may apply a progressive tax rate to annual net income, or charge a levyonce the investor has achieved a pre-determined real rate of return. Some simple systemsuse approximations of profitability, such as average daily production levels, to establish taxrates. These are easy to verify but, because they do not take into account the key elementsof cost and price, are flexible only under certain assumptions.
9.C Venezuela's Oil FLscal System
9.9 Royalies. The Hydrocarbons Law sets a maximum of 16.7 percent of thevalue of production as royalties, deductible for income tax purposes, and the MEMestablishes the reference price at which these payments are made. The Executive has theauthority to change the royalty rate for specific fields when economic circumstances warrant.Corpoven, which was formed from the old state company Corporaci6n Venezolana dePetr6leo (CVP) and several smaller companies when the industry was nationalized in1975-76, does not pay royalties because CVP had been exempted by decree before 1975.Royalties payable on associated natural gas, which is used in production operations or forLPG production, are calculated on the thermal value of the crude oil with which it isproduced--generally the more valuable light and medium crudes, as heavy oil tends to containless gas.
9.10 Export Reference Price. The export reference price, or 'valor fiscal deexportaci6n" (VFE), is set by the Executive as a percentage of the export price of oil. TheVFE is used to calculate revenues subject to the income tax, but not to compute royaltypayments. It was originally intended to discourage foreign oil companies from the use oftransfer pricing among their affiliates to evade attempts to tax production rent. Thedifference between export prices and the VFE has varied over the years. At PDVSA'surging, the Executive has asked Congress to progressively phase it out within four years. In1993 the VFE was reduced to 16 percent of the export price of oil; it will be 8 percent in1994, 4 percent in 1995, and 0 thereafter.
9.11 Tax on Net Revenue from Oil. This tax was established in the 1991 IncomeTax Law at 67.7 percent of net revenue on oil activities downstream and upstream. Thestandard income tax rates on non-oil activities are between 20 and 30 percent, and apply also

- 122 -
to joint ventures exploiting deposits of heavy and extra-heavy oil or non-associated naturalgas, provided these ventures meet the provisions of the Nationalization Law.
9.12 For tax purposes, all operating costs, including exploration expenses, arecapitalized, but dry holes and certain other costs are deducted by special arrangement. Thedepreciation method is the unit of production system, whereby unamortized capital costs arededucted each year in the proportion that the current year's production from a given fieldbears to total reserves in that field. Given that production tends to decline after the earlyyears of a field's life, PDVSA reports that many assets are being largely depreciated over anaverage period of 8 years. Full amortization takes longer than 8 years because it is linked tothe theoretical useful life of the asset. There is a 3-year loss carry-forward limitation thatwould harm companies initiating their first development project. There is also a requirementthat companies perform regular asset revaluations; assets are denominated in bolivars, whichcould result in a tax liability even before the first revenue comes in. Capital gains are taxedlike ordinary income. There is a 10 percent tax rebate on new exploration investments madewithin 5 years after the enactment of the 1991 law. Other minor taxation items that have asmall impact on the overall economics of oil and gas exploration and production may bedisregarded. However, they make the fiscal system one of the most complicated in usetoday.
9.D International Comparison of Oil Taxation Incidence
9.13 Appendix 3 is a comparative study of the effects of fiscal systems inVenezuela, Algeria and Norway on oil development and production, using a range ofdevelopment costs and international oil price scenarios. The comparison is significantbecause both Algeria and Norway are grappling or have grappled with the same problems asVenezuela.
9.14 Norway has a mixed industry in which private domestic and foreign oilcompanies compete with Statoil, the national oil company, run very much like a private firm.Algeria nationalized the operations of foreign oil companies in 1975, and for many years thenational oil company, Sonotrach, has dominated the sector as thoroughly as PDVSA has inVenezuela. Capital constraints and declining rates of production from established oil fieldsled Algeria to open up to intemational investment. The industry includes joint ventures forLNG exports, exploitation operations on mature fields, gas-gathering systems, marginalhydrocarbon fields of several kinds, and greenfield exploration.
9.15 The main conclusion of the analysis is that taxes in Venezuela are very highand could impede private sector investment in an increasingly liberalized and competitiveinternational environment. Besides high income tax and royalties, the Venezuelan fiscalsystem is inefficient. There is too much discretion in its application and too much of thetotal tax take is based on gross revenues, which penalizes projects that have a low returnbecause they are experimental or in the early stages but that over a longer term might be

- 123 -
profitable. This discourages the development of smaller fields, fields with heavier oil, gasprojects, and accumulations that require deep drilling or are in areas of difficult access.These are the geological characteristics that can be expected in Venezuela, now that theeasiest sources have been exploited.
9.16 Applied to projects that are economically justified, the government take incurrent prices, under every development cost and oil price scenario in Venezuela, exceeds 83percent of each field's pre-tax net cash flow. It reaches a maximum of 93.6 percent whendevelopment costs are US$7 per barrel and the price is US$15, and both of theseassumptions may be optimistic when applied to Venezuelan heavy oil. Comparatively,Venezuela's fiscal terms are not very different from Algeria's, and under a few scenarios areslightly better. Both countries have systems that disproportionately penalize low-retumprojects. Algeria has been trying to attract private investment by providing incentives, suchas lower royalty rates for areas believed to offer less promising prospects, but with limitedsuccess to date. Norway's terms are better across the board and in most cases progressive:the government take from the whole range of prices and costs is never more than 78 percent,increasing with higher prices and decreasing with higher costs, as an efficient tax systemshould.
9.17 The calculation of relative net present value at a moderate 10 percent is evenmore telling. The government take in Venezuela exceeds 100 percent in many cases,meaning that the investor cannot even earn a 10 percent real rate of return. It exceeds 500percent for a large 500 million barrel field, where development costs equal or exceed US$6per barrel, as they are expected to in the Orinoco and other heavy oil fields yet to bedeveloped.
9.E New Taxation System for Venezuela
9.18 The fiscal system and the taxes levied on both PDVSA and private sectoractivities, with or without PDVSA participation, should make Venezuela competitive,especially with other oil countries offering similar geological prospects, geographicalparameters, and non-technical country factors. To this end, the most important change is toreplace the present system with one that is progressive and profit-related.
9.19 Variable Royalty Rates. The royalty is an inflexible taxation instrument andshould not be the Government's main choice. It does have two advantages, however. Itprovides a minimum revenue from every unit produced beginning with the first one, and oilcompanies are used to it. It can be argued, moreover, that a hydrocarbon field that cannotpay a modest royalty--provided the other fiscal instruments are profit-related--is not worthdeveloping under the economic parameters of the day. A sliding scale, with a maximum of13 percent, is suggested (Table 9.1).

- 124 -
Table 9.1: Substance Royalty Rate (Indicative)
Substance R Rate
Natural Gas 9 percent of netback valueCrude Oil < 9° API 3 percent of market value at the wellCrude Oil > 9° API 3 percent plus 1/2 percent for each degree API
over 9 up to a maximum of 13 percent
9.20 Income Tax. This would be set for oil activities, including production,transportation, refining, and distribution, at the same rate as non-oil activities. Explorationand operating costs, including dry holes and discovery wells (one per discovery) but notappraisal wells, would be expensed, and capital assets would be depreciated over a maximumof 10 years.
9.21 Petroleum Surtax. A surtax could be applied to production on a field-by-fieldbasis, if a field falls into the "windfall" category, which obviously requires definition. Thiswould fulfill the need, identified in the comparative study, for a profit-related tax. Thebenchmark for this tax could be one of several criteria commonly used today:
a) Actual real rate of return up to the year for which the calculation ismade.
b) Cumulative production from the field.c) The investor's undiscounted cumulative cashflow, obtained by dividing
his cumulative gross receipts from the project's inception by hiscumulative gross outpays, including taxes, through the year previous tothe one for which the calculation is made. This number is called the"R-Factor" in a number of new countries.
9.22 Of these three indices, the rate of return is theoretically the most accurate, butis not generally favored by the oil industry. The cumulative production indicator is a veryblunt instrument, as it does not take costs into account and progressively squeezesprofitability during the declining years of a field. The "R-Factor" would be a convenientmethod of surtax computation, because it is known and accepted by intemational oilcompanies.
9.23 For a large oil-producing country such as Venezuela, a schema like that shownin Table 9.2 could be appropriate. Actual numbers could only be determined through furthereconomic analysis.
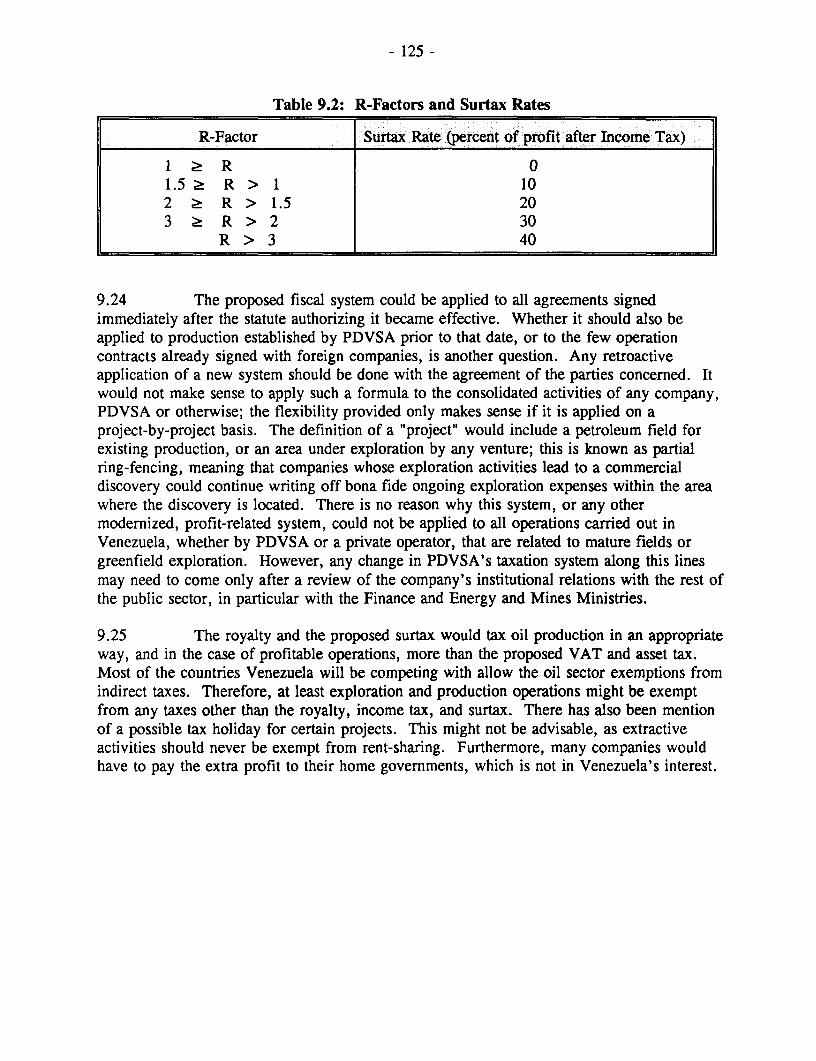
- 125 -
Table 9.2: R-Factors and Surtax Rates
R-Factor Surtax Rate (percent of profit after Income Tax)
1 2 R 01.5 2 R > 1 102 2 R > 1.5 203 Ž R > 2 30
R > 3 40
9.24 The proposed fiscal system could be applied to all agreements signedimmediately after the statute authorizing it became effective. Whether it should also beapplied to production established by PDVSA prior to that date, or to the few operationcontracts already signed with foreign companies, is another question. Any retroactiveapplication of a new system should be done with the agreement of the parties concerned. Itwould not make sense to apply such a formula to the consolidated activities of any company,PDVSA or otherwise; the flexibility provided only makes sense if it is applied on aproject-by-project basis. The definition of a "project" would include a petroleum field forexisting production, or an area under exploration by any venture; this is known as partialring-fencing, meaning that companies whose exploration activities lead to a commercialdiscovery could continue writing off bona fide ongoing exploration expenses within the areawhere the discovery is located. There is no reason why this system, or any othermodernized, profit-related system, could not be applied to all operations carried out inVenezuela, whether by PDVSA or a private operator, that are related to mature fields orgreenfield exploration. However, any change in PDVSA's taxation system along this linesmay need to come only after a review of the company's institutional relations with the rest ofthe public sector, in particular with the Finance and Energy and Mines Ministries.
9.25 The royalty and the proposed surtax would tax oil production in an appropriateway, and in the case of profitable operations, more than the proposed VAT and asset tax.Most of the countries Venezuela will be competing with allow the oil sector exemptions fromindirect taxes. Therefore, at least exploration and production operations might be exemptfrom any taxes other than the royalty, income tax, and surtax. There has also been mentionof a possible tax holiday for certain projects. This might not be advisable, as extractiveactivities should never be exempt from rent-sharing. Furthermore, many companies wouldhave to pay the extra profit to their home governments, which is not in Venezuela's interest.

- 126 -
9.F Impact of the New System on Central Government Revenues
9.26 Appendix 4 estimates the revenues that would result if the tax system proposedhere were applied to a substantial private sector exploration program. Four explorationscenarios were analyzed, based on 20, 15, and 10 new ventures per year, and on gradualintensification of exploration activity. These four cases were plugged into a model adjustedfor Venezuela's geological parameters, and run through three oil price and sevendevelopment cost alternatives. (The geological parameters and other field information arethose discussed in Chapter 7.) The most likely scenario is somewhere between the 15 and 20ventures, assuming that the price and development cost assumptions hold.
9.27 The simulations predict that a private sector exploration and developmentprogram of about 20 ventures per year would yield cumulative tax revenues of approximatelyUS$1.5 billion by 1998, US$5.5 billion by 2000, and over US$50 billion by 2010, dependingupon the prevailing fiscal system. Similar results could likely be obtained if PDVSA carriesout a portion of the exploration; however, it is improbable that PDVSA could deploy capitalin the amounts necessary for exploration and development to generate such levels of taxrevenues.
9.28 The reform case economic projections in Chapter 2 include the production,investment, and government tax revenue corresponding to scenario 2, subject to fiscal termsidentified as "surtax 1" in Appendix 4. Under this scenario, government tax revenue fromprivate investment reaches 1.4 percent of GDP in 1998. In the same projection, PDVSAwould provide taxes equivalent to about 10.6 percent of GDP, assuming that the currentfiscal system (including the phasing out of the export reference price) stays the same in themedium term.
9.G Recomnendations
9.29 Venezuela should have an oil taxation system for private investments that isboth flexible and profit-related. Flexibility is required to respond to both the high-cost, low-value operations associated with heavy crudes, and the more profitable endeavors associatedwith light and medium oil. A fiscal system that is strongly profit-related is imperative fortwo reasons: the range of costs for producing light to heavy oils is wide, and the variation inthe market value of light and heavier oils is substantial.
9.30 Once a flexible system is in place, a surtax such as the British Petroleum Taxor the Norwegian Special Tax could be adapted for Venezuelan conditions. This surtaxwould ensure the Government's share of rent in excess of normal operations. The VFEshould be abolished as planned, while current tax and royalty rates for PDVSA productioncould be maintained during the transition to a new system.

t j t t' ' ' ' pilPI>t6t '"' ' _P P 'S PR$:Ul�rtlir d r P-P Fna:l!el trof rr 1 - r . .. r;S: t ::: pr.- - E -. . , :s; >
;
^ 1| 11l__ ll1
I I_
_I_