Embed Size (px)
Citation preview
Report of the Regional Co-ordination Meeting
for the Baltic (RCM Baltic)
2013
Final 21/10/13
Ministry of the Environment Tallinn, Estonia
26/08/2013-30/08/2013
2
Table of Contents
Table of Contents ...................................................................................................... 2 1. Executive summary .......................................................................................... 4 2. Introduction .................................................................................................... 6
2.1 General ........................................................................................................... 6 2.2 Background & legal requirements........................................................................ 6 2.3 Terms of Reference ........................................................................................... 6 2.4 Structure of the report ...................................................................................... 7 2.5 Participants: ..................................................................................................... 7
3. Review progress in regional co-ordination since the 2012 RCM ................................ 9 3.1 Follow-up of recommendations from the 2012 RCM Baltic ...................................... 9 3.2 Follow-up of recommendations from the 9th LM meeting ...................................... 11 3.3 Feedback and recommendation from data end users ........................................... 17
3.3.1 STECF EWGs ...................................................................................... 17 3.3.2 Outcome and recommendations from PGECON ....................................... 18 3.3.3 ICES .................................................................................................. 19 3.3.4 ICES feedback on data transmission ...................................................... 21 3.3.5 ICES Benchmark workshops ................................................................. 21 3.3.6 PGCCDBS ........................................................................................... 22 3.3.7 SGPIDS ............................................................................................. 24 3.3.8 WKPICS2 ........................................................................................... 25 3.3.9 WGRFS .............................................................................................. 26 3.3.10 Possible new structure on PGCCDBS and related ICES EGs ....................... 27
4. Status of the 2012 data collection activities in the Baltic Sea region ....................... 32 4.1 Quality of the response to the 2013 RCM data call .............................................. 32 4.2 Overview of fishing activities in the Baltic Sea region .......................................... 33 4.3 Stock-related sampling .................................................................................... 34
4.3.1 Conclusions from 2012 data sets ........................................................... 34 4.3.2 Conclusions from comparisons between 2011 and 2012 data case studies .. 35 4.3.3 General conclusions ............................................................................. 36
4.4 Sampling intensity .......................................................................................... 36 4.4.1 General conclusion .............................................................................. 39
4.5 Task sharing for biological data ........................................................................ 39 4.6 Coordination of biological sampling for stocks where the sum of MS having a share of
quotas/landings less than 10%, but altogether exceeds 25%. .............................. 39 4.7 Sampling intensity for data limited stocks (DLS) ................................................. 39
4.7.1 Definition DLS .................................................................................... 39 4.7.2 Data on DLS in RDB-FishFrame ............................................................. 40 4.7.3 General conclusion for Baltic DLS .......................................................... 41 4.7.4 Detailed information on Baltic flatfish data in RDB-FishFrame ................... 42
5. Data Quality issues ......................................................................................... 45 5.1 Review progress on quality control, validation etc. in NP proposals........................ 45 5.2 Quality indicators of surveys ............................................................................ 45 5.3 Developing statistical sound harmonised sampling programmes............................ 46 5.4 Approaches to evaluate the performance of national discard sampling programmes 48
6. Regional coordination ...................................................................................... 53 6.1 Regional databases: update since RCMs 2012..................................................... 53 6.2 Proposal for standard reports in the RDB-FishFrame ............................................ 54 6.3 Regional coordination under the revised DCF ...................................................... 55 6.4 Cooperation activities between Member States funded under the EMFF and by the
Commission ................................................................................................... 56 7. Needs to modify the NP for 2014 based on updated information on metier ranking. .. 57 8. Revision of the DCF and of the EU Multiannual programme (MAP) for data collection 63
8.1 Feedback from ICES on revision of the DCF ........................................................ 63 8.2 RCM Baltic MS feedback on revision of the DCF ................................................... 63 8.3 Proposed roadmap for the development of a regional sampling programme ........... 64
9. Studies ......................................................................................................... 66 Title: Exploration and Development of new facilities in RDB-FishFrame 5.0 ............ 66 Title: “Support design based regional data collection programmes” ....................... 67
10. Any other business ......................................................................................... 69 10.1 Consequences of the landing obligation in 2015 introduced by the CFP for sampling
programmes. ................................................................................................. 69 10.2 Chairmanship, venue and dates of next meeting ................................................. 70
11. Summary of recommendations ......................................................................... 72 12. Glossary ....................................................................................................... 74 13. References .................................................................................................... 77 14. Annex 1 ........................................................................................................ 78 15. Annex 2 ........................................................................................................ 92
4
1. Executive summary
The Regional Coordination Meeting for the Baltic (RCM Baltic) was held in August 2013 in Tallinn, Estonia. This year meeting was focusing on the present status of the data collection and analysed whether further cooperation and task sharing could be agreed. In addition, DCF work during the period 2014-2016 was discussed as well as the revision of the DCF of the EU Multiannual Programme which will be the new framework for data collection. Initially, it was envisaged that, from 2104 onwards, the CFP Basic regulation would contain an Article providing the legal basis for data collection, which would be complemented by a Data Collection multiannual programme (DC-MAP). However, Council and Parliament decided that the CFP Basic Regulation would not act as the legal basis for data collection, but would instead set out the key principles for future data collection, and that Regulation 199/2008 would be maintained, and should be revised to align it with the principles in the CFP basic Regulation. In order to avoid a gap in data collection, the Commission has extended the present EU Multiannual Programme (Commission Decision 2010/93/EU) for 2014-2016, and to roll-over the Member States' National programmes 2011-2013 for the period 2014-2016. Since these NP have been adopted without any changes, there is no need for major coordination.
The ICES observer presented feedback from expert groups on data needs, projected benchmark meetings in 2014, comments on revision to be carried out for the DCF, and changes in the structure of the role of PGCCDBS. Also participants reported on progress made by a number of ICES experts groups which are relevant for (the quality) of data collection.
An introduction was given by the Commission representative to the changes in the new CFP –beyond Article 37 on data collection - and the consequences for data collection. The most prominent change is the introduction of the landing obligation. The RCM expressed great concern about the lack of clarity in the CFP on this subject and concluded that this potentially could lead to chaos in catch reporting. Proposed extension of areas of data collection was received with scepticism by some MS on the basis that as an expansion of data collection for some MS would be difficult to finance.
A summary was presented of the process in STECF that lead to proposed changes to the DCF and the EU Multiannual programme by STECF EWG 13-05. As the work to be carried out by STECF is not yet finalised and that the Commission not yet has presented first draft of a new framework the discussion at the RCM Baltic on the revision of the DCF are somewhat speculative.
In spring of 2013 the chairs of the RCM Baltic, RCM NS&EA and RCM NA had send out a call to all MS to populate the RDB with low aggregated transversal (catch, effort, metier, port) data and biological data from the period 2009-2012. All MS responded positively and this is great progress compared to previous years. Also the quality of the data upload has improved. Only very few data still have to be checked and uploaded the data in the RDB were explored in three subgroups to:
1. Ranking of metier in order to check whether there have been major changes in the fisheries (metiers) in the last 4 years which may compromise the Commission's decision to transfer the 2011-13 NPs unchanged to 2014-16.
2. Analyse the level of sampling of biological parameters and propose new analyses to be carried out for quality assurance.
3. Analyse possibilities for setting up statistical sound regional designed sampling schemes for the Baltic Sea based on outcome of the ICES WKPICS and SGPIDS.
Group 1 concluded that no major changes to the NP’s for 2014 have to be made. Most important metiers are relatively stable and will be covered with data collection as in previous years.
Group 2 developed a scenario for a regional sampling frame and explored diagnostics to assess data quality issues. At present, the use of the term “trip” differs between countries and does not have a unique value in the Regional Data Base so that the sampling performance of the different countries cannot be reasonably compared.
Group 3 suggested further analysis needed to be carried out and hopefully this could be done intersessionally before any decision can be made on whether a regional data collection programme could be implemented. Further, that the RDB is a key tool for future work on regional data collection programmes.
The RCM Baltic considered that coordination is likely to change considerably under the revised DCF. Under the current DCF, obligations to collect data are defined for each MS and these are coordinated by the RCM on the basis of provisional NPs. It is considered likely that, under the revised DCF, part of the obligations will be defined at a regional level and need to be allocated to the MS before they produce their NP (or Annual Work plans as they will be referred to under the EMFF).
RCM Baltic considers that the allocation of regional priorities to MS may conflict with national priorities and available resources and therefore may become problematic in the future. Other changes foreseen are more involvement of the end-user in defining data needs, a regional approach to sampling design and another approach to data quality measurement. The RCM Baltic stress that a well-functioning RDB is an essential tools.
A roadmap towards the implementation of the revision of the DCF was considered mostly after the meeting and was further considered by the RCM NS&EA as well as the RCM NA. It is clear that when regional coordination is strengthened in the future, is may be more complicated, involving more parties and will require good communication and information sharing. There will be a need for inter-sessional work in smaller groups as this will speed up the development of new and more statistical sound regional sampling schemes and to develop quality analysis tools.
6
2. Introduction
2.1 General
The RCM Baltic 2013 was held in the Ministry of the Environment in Tallinn, Estonia from the 26th until 30th of August 2013
RCM Baltic appreciates the good facilities offered by the Estonian Ministry of the Environment. The availability of SharePoint offered by ICES proves to be very efficient in organising the work before, during and after the meeting. The RCM Database, maintained by the ICES secretariat proved to be a great facility for coordination, planning and managing the recommendations.
2.2 Background & legal requirements
The EU Data Collection Framework (DCF; EC 2008a, 2008b, 2008c, 2010) establishes a framework for the collection of economic, biological and transversal data by Member States (MS). It was intended that this programme would provide the basic data needed to evaluate the state of fishery resources and the fisheries sector.
The Regional Coordination Meeting for the Baltic (RCM Baltic) proceeds from the new Data Collection Framework (EC Regulation no. 199/2008) establishing a community framework for the collection, management and use of data in fisheries sector for scientific advice regarding the CFP. According to this regulation and without prejudice to their current data collection obligations under EU law, Member States (MS) shall collect primary biological, technical, environmental and socio-economic data within the framework of a multi-annual national programme drawn up in accordance with the EU programme.
According to EC Regulation 665/2008, laying down detailed rules for the application of Council Regulation (EC) 199/2008, and its technical Decision 2010/93/UE specifying practical aspects for data collection, actions planned by MS in their national programme shall be presented according to the predefined regions.
The coordination of the data collection is recommended at regional level and specific meetings are in charge of facilitating this and these meetings aim to identify areas for standardisation, collaboration and task sharing between MS. RCMs are held annually and involve participants from each MS involved in the DCF.
2.3 Terms of Reference
1. Review progress in regional co-ordination since the 2012 RCM (follow-up of recommendations) and 9th Liaison Meeting report. Evaluate the outcomes of the RCMs that took place in 2012 & of any other RCMs that took place in 2013, pending availability of outcomes, in terms of complementarities and actions to be carried out by MS in the RCM region of competence.
2. Review feedback and recommendations from data end users (STECF EWGs, ICES assessment WGs and benchmark meetings, GFCM Subcommittees and relevant WGs, and ICCAT assessment WGs) and PGCCDBS.
3. Regional coordination
Regional databases: update since RCMs 2012. Identify needs of the RCMs that could be addressed by the RDB SC and suggest any new features/reports to be developed.
Make proposals for ways in which the work of RCMs could be expanded under the DC-MAP, to become Regional Coordination Groups (i.e. what new tasks to deal with at regional level, which tasks should take place during a meeting, which tasks could be carried out intersessionally).
Proposals for cooperation activities between Member States that could be put forward for funding under the EMFF.
4. Data Quality issues
Review progress on quality control, validation etc. in NP proposals.
5. EU Multiannual programme (MAP) for data collection for 2014-2020
Provide feedback on the draft EU MAP2014-2020.
Prepare a roadmap for the development of a regional sampling programme.
6. Studies and pilot projects
7. Any other business
Analyse data from 2013 RCM data call (TBC).
2.4 Structure of the report
All the topis in the ToR have been addressed by the RCM Baltic.
ToR 1 in section 3.1 and 3.2
ToR 2 in section 3.3
ToR 3 in section 4
ToR 4 in section 5
ToR 5 in section 6 and 7
ToR 6 in section 8
ToR 7 in section 9
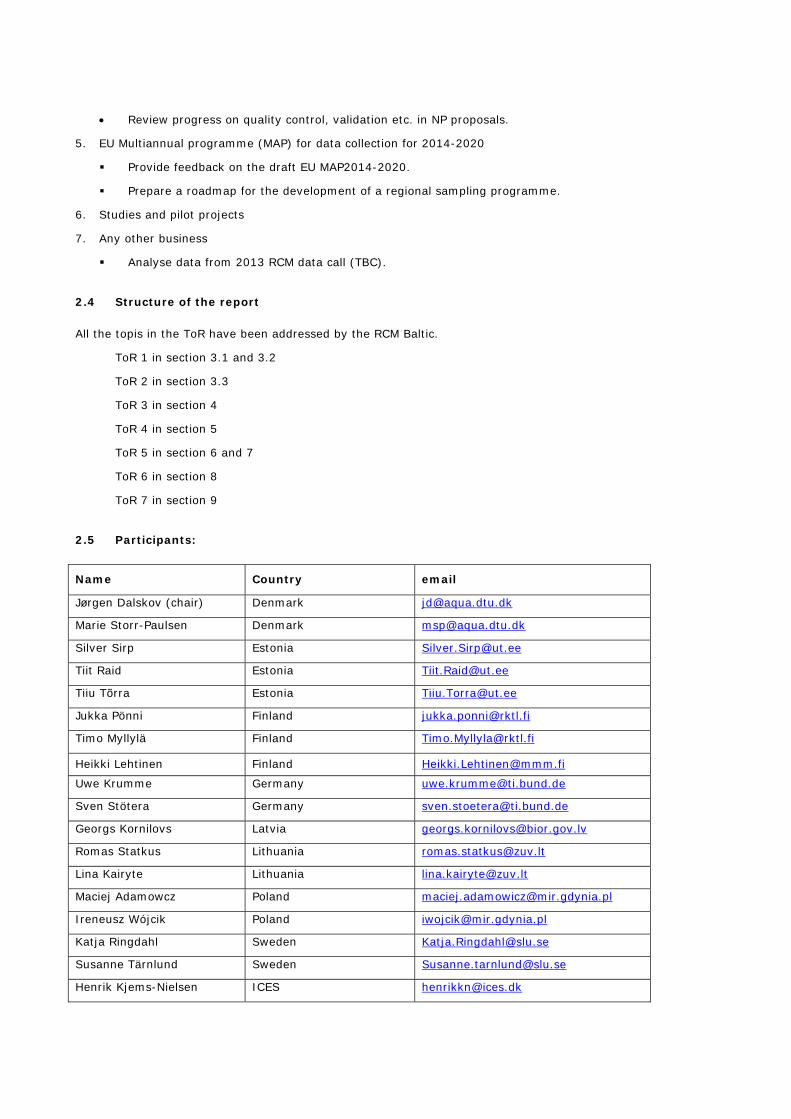
2.5 Participants:
Name Country email
Jørgen Dalskov (chair) Denmark [email protected]
Marie Storr-Paulsen Denmark [email protected]
Silver Sirp Estonia [email protected]
Tiit Raid Estonia [email protected]
Tiiu Tõrra Estonia [email protected]
Jukka Pönni Finland [email protected]
Timo Myllylä Finland [email protected]
Heikki Lehtinen Finland [email protected]
Uwe Krumme Germany [email protected]
Sven Stötera Germany [email protected]
Georgs Kornilovs Latvia [email protected]
Romas Statkus Lithuania [email protected]
Lina Kairyte Lithuania [email protected]
Maciej Adamowcz Poland [email protected]
Ireneusz Wójcik Poland [email protected]
Katja Ringdahl Sweden [email protected]
Susanne Tärnlund Sweden [email protected]
Henrik Kjems-Nielsen ICES [email protected]

8
Name Country email
Cristina Morgado ICES [email protected]
Amelie Knapp EU Commission [email protected]
Russia is the only non EU country operating in the Baltic Sea and an invitation to participate in the RCM Baltic meeting 2013 was send to Russia but unfortunately no Russian representatives participated in the meeting.
3. Review progress in regional co-ordination since the 2012 RCM
3.1 Follow-up of recommendations from the 2012 RCM Baltic
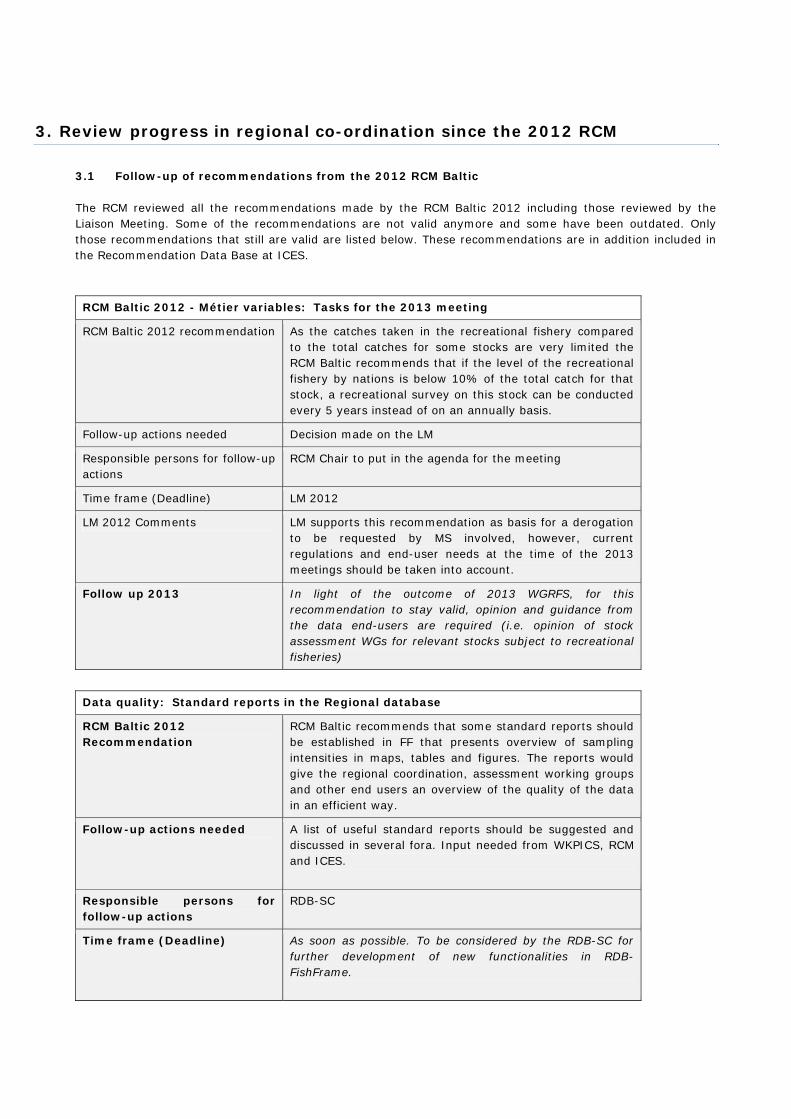
The RCM reviewed all the recommendations made by the RCM Baltic 2012 including those reviewed by the Liaison Meeting. Some of the recommendations are not valid anymore and some have been outdated. Only those recommendations that still are valid are listed below. These recommendations are in addition included in the Recommendation Data Base at ICES.
RCM Baltic 2012 - Métier variables: Tasks for the 2013 meeting
RCM Baltic 2012 recommendation As the catches taken in the recreational fishery compared to the total catches for some stocks are very limited the RCM Baltic recommends that if the level of the recreational fishery by nations is below 10% of the total catch for that stock, a recreational survey on this stock can be conducted every 5 years instead of on an annually basis.
Follow-up actions needed Decision made on the LM
Responsible persons for follow-up actions
RCM Chair to put in the agenda for the meeting
Time frame (Deadline) LM 2012
LM 2012 Comments LM supports this recommendation as basis for a derogation to be requested by MS involved, however, current regulations and end-user needs at the time of the 2013 meetings should be taken into account.
Follow up 2013 In light of the outcome of 2013 WGRFS, for this recommendation to stay valid, opinion and guidance from the data end-users are required (i.e. opinion of stock assessment WGs for relevant stocks subject to recreational fisheries)
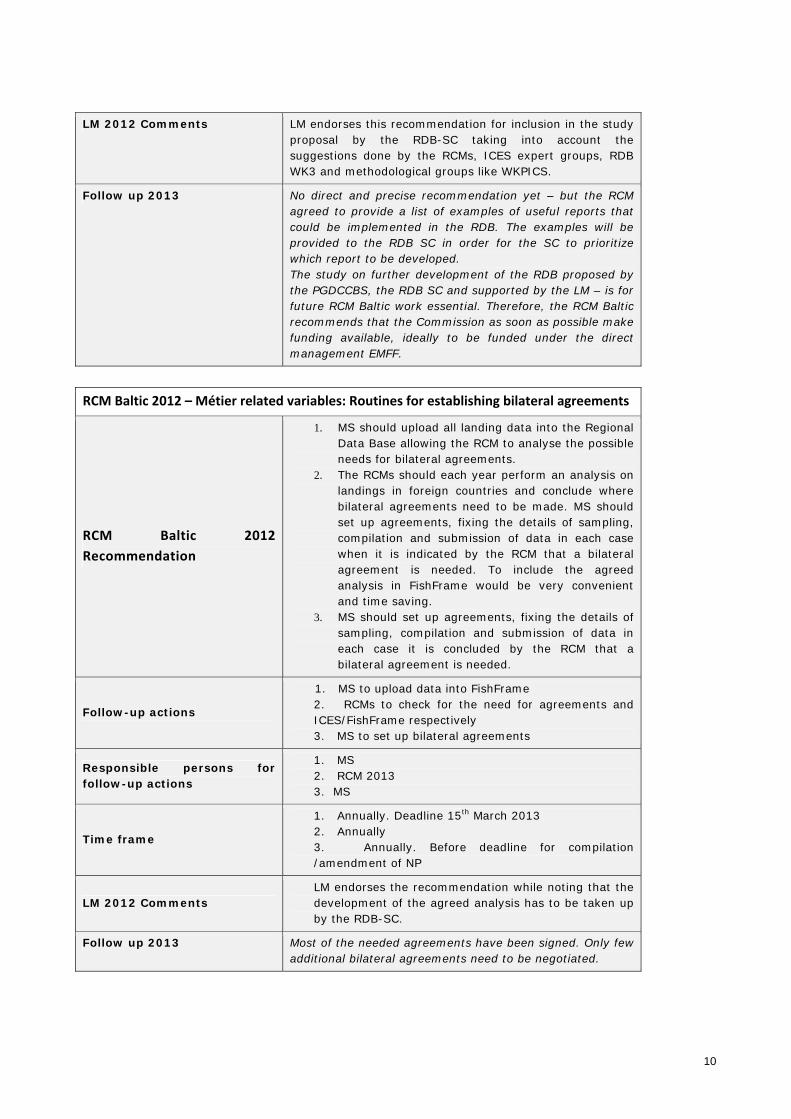
Data quality: Standard reports in the Regional database
RCM Baltic 2012 Recommendation
RCM Baltic recommends that some standard reports should be established in FF that presents overview of sampling intensities in maps, tables and figures. The reports would give the regional coordination, assessment working groups and other end users an overview of the quality of the data in an efficient way.
Follow-up actions needed A list of useful standard reports should be suggested and discussed in several fora. Input needed from WKPICS, RCM and ICES.
Responsible persons for follow-up actions
RDB-SC
Time frame (Deadline) As soon as possible. To be considered by the RDB-SC for further development of new functionalities in RDB-FishFrame.
10
LM 2012 Comments LM endorses this recommendation for inclusion in the study proposal by the RDB-SC taking into account the suggestions done by the RCMs, ICES expert groups, RDB WK3 and methodological groups like WKPICS.
Follow up 2013 No direct and precise recommendation yet – but the RCM agreed to provide a list of examples of useful reports that could be implemented in the RDB. The examples will be provided to the RDB SC in order for the SC to prioritize which report to be developed. The study on further development of the RDB proposed by the PGDCCBS, the RDB SC and supported by the LM – is for future RCM Baltic work essential. Therefore, the RCM Baltic recommends that the Commission as soon as possible make funding available, ideally to be funded under the direct management EMFF.
RCM Baltic 2012 – Métier related variables: Routines for establishing bilateral agreements
RCM Baltic 2012
Recommendation
1. MS should upload all landing data into the Regional Data Base allowing the RCM to analyse the possible needs for bilateral agreements.
2. The RCMs should each year perform an analysis on landings in foreign countries and conclude where bilateral agreements need to be made. MS should set up agreements, fixing the details of sampling, compilation and submission of data in each case when it is indicated by the RCM that a bilateral agreement is needed. To include the agreed analysis in FishFrame would be very convenient and time saving.
3. MS should set up agreements, fixing the details of sampling, compilation and submission of data in each case it is concluded by the RCM that a bilateral agreement is needed.
Follow-up actions
1. MS to upload data into FishFrame 2. RCMs to check for the need for agreements and ICES/FishFrame respectively 3. MS to set up bilateral agreements
Responsible persons for follow-up actions
1. MS 2. RCM 2013 3. MS
Time frame
1. Annually. Deadline 15th March 2013 2. Annually 3. Annually. Before deadline for compilation /amendment of NP
LM 2012 Comments LM endorses the recommendation while noting that the development of the agreed analysis has to be taken up by the RDB-SC.
Follow up 2013 Most of the needed agreements have been signed. Only few additional bilateral agreements need to be negotiated.
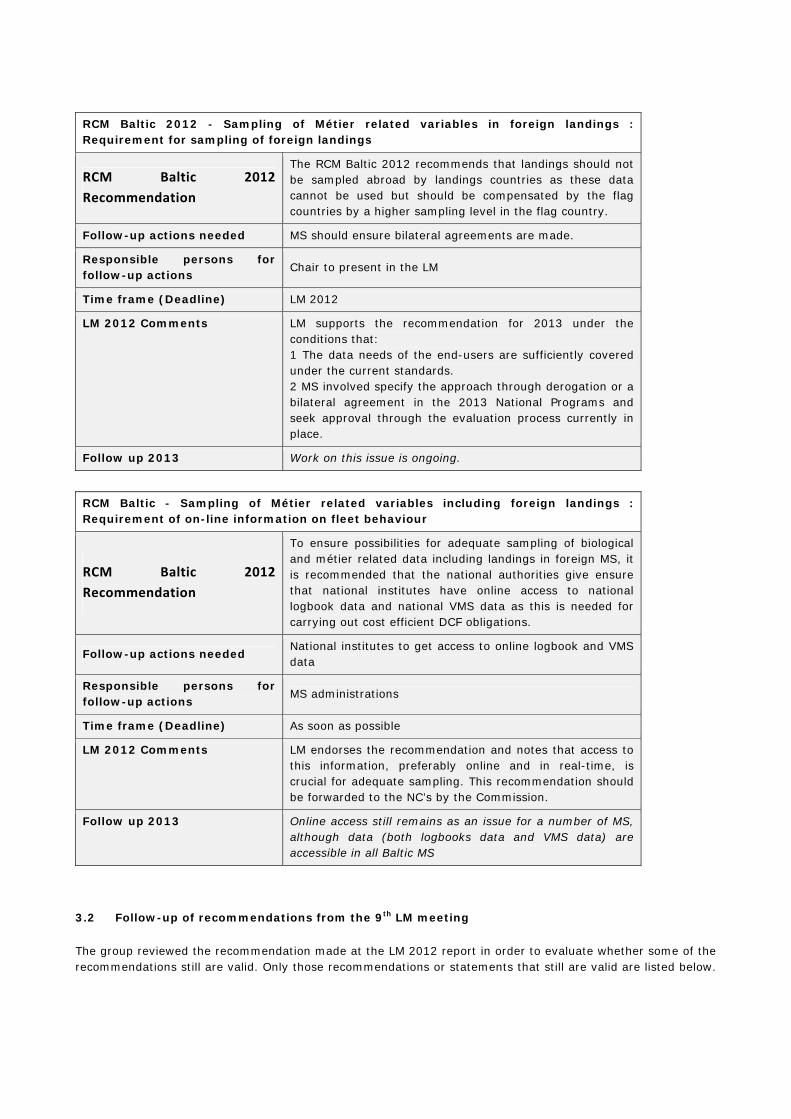
RCM Baltic 2012 - Sampling of Métier related variables in foreign landings : Requirement for sampling of foreign landings
RCM Baltic 2012
Recommendation
The RCM Baltic 2012 recommends that landings should not be sampled abroad by landings countries as these data cannot be used but should be compensated by the flag countries by a higher sampling level in the flag country.
Follow-up actions needed MS should ensure bilateral agreements are made.
Responsible persons for follow-up actions
Chair to present in the LM
Time frame (Deadline) LM 2012
LM 2012 Comments LM supports the recommendation for 2013 under the conditions that: 1 The data needs of the end-users are sufficiently covered under the current standards. 2 MS involved specify the approach through derogation or a bilateral agreement in the 2013 National Programs and seek approval through the evaluation process currently in place.
Follow up 2013 Work on this issue is ongoing.
RCM Baltic - Sampling of Métier related variables including foreign landings : Requirement of on-line information on fleet behaviour
RCM Baltic 2012
Recommendation
To ensure possibilities for adequate sampling of biological and métier related data including landings in foreign MS, it is recommended that the national authorities give ensure that national institutes have online access to national logbook data and national VMS data as this is needed for carrying out cost efficient DCF obligations.
Follow-up actions needed National institutes to get access to online logbook and VMS data
Responsible persons for follow-up actions
MS administrations
Time frame (Deadline) As soon as possible
LM 2012 Comments LM endorses the recommendation and notes that access to this information, preferably online and in real-time, is crucial for adequate sampling. This recommendation should be forwarded to the NC’s by the Commission.
Follow up 2013 Online access still remains as an issue for a number of MS, although data (both logbooks data and VMS data) are accessible in all Baltic MS
3.2 Follow-up of recommendations from the 9th LM meeting
The group reviewed the recommendation made at the LM 2012 report in order to evaluate whether some of the recommendations still are valid. Only those recommendations or statements that still are valid are listed below.
12
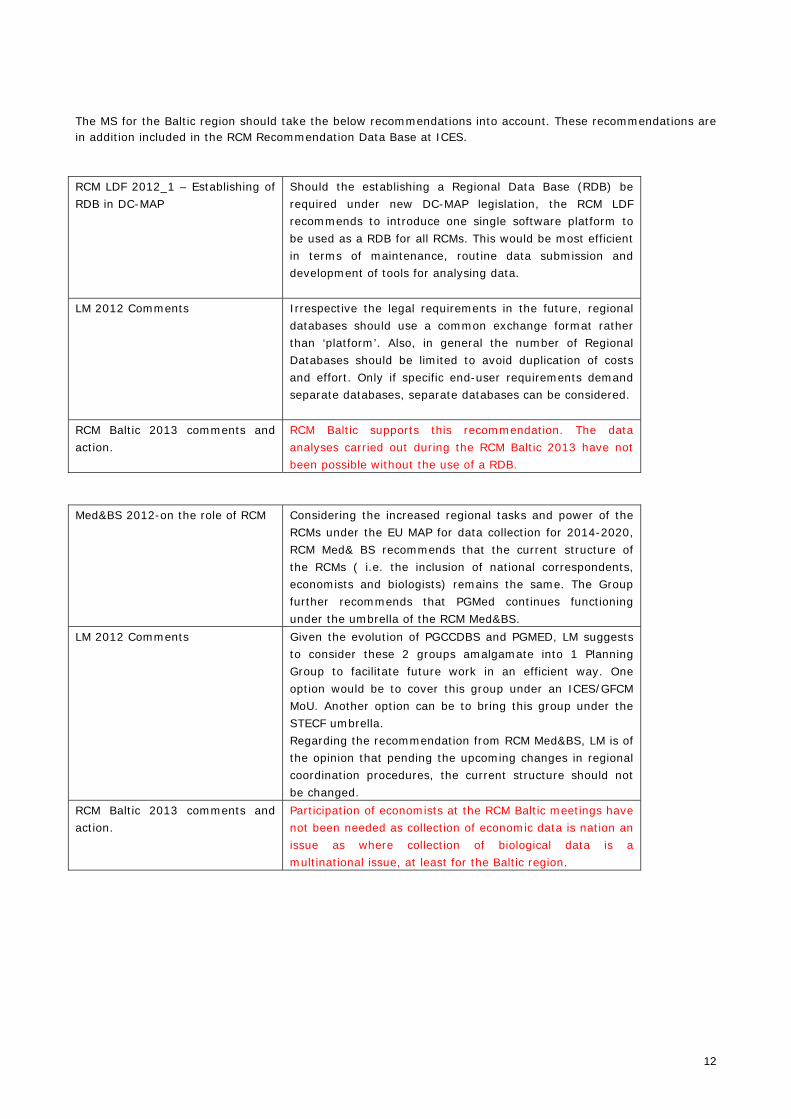
The MS for the Baltic region should take the below recommendations into account. These recommendations are in addition included in the RCM Recommendation Data Base at ICES.
RCM LDF 2012_1 – Establishing of RDB in DC-MAP
Should the establishing a Regional Data Base (RDB) be required under new DC-MAP legislation, the RCM LDF recommends to introduce one single software platform to be used as a RDB for all RCMs. This would be most efficient in terms of maintenance, routine data submission and development of tools for analysing data.
LM 2012 Comments Irrespective the legal requirements in the future, regional databases should use a common exchange format rather than ‘platform’. Also, in general the number of Regional Databases should be limited to avoid duplication of costs and effort. Only if specific end-user requirements demand separate databases, separate databases can be considered.
RCM Baltic 2013 comments and action.
RCM Baltic supports this recommendation. The data analyses carried out during the RCM Baltic 2013 have not been possible without the use of a RDB.
Med&BS 2012-on the role of RCM Considering the increased regional tasks and power of the RCMs under the EU MAP for data collection for 2014-2020, RCM Med& BS recommends that the current structure of the RCMs ( i.e. the inclusion of national correspondents, economists and biologists) remains the same. The Group further recommends that PGMed continues functioning under the umbrella of the RCM Med&BS.
LM 2012 Comments Given the evolution of PGCCDBS and PGMED, LM suggests to consider these 2 groups amalgamate into 1 Planning Group to facilitate future work in an efficient way. One option would be to cover this group under an ICES/GFCM MoU. Another option can be to bring this group under the STECF umbrella. Regarding the recommendation from RCM Med&BS, LM is of the opinion that pending the upcoming changes in regional coordination procedures, the current structure should not be changed.
RCM Baltic 2013 comments and action.
Participation of economists at the RCM Baltic meetings have not been needed as collection of economic data is nation an issue as where collection of biological data is a multinational issue, at least for the Baltic region.
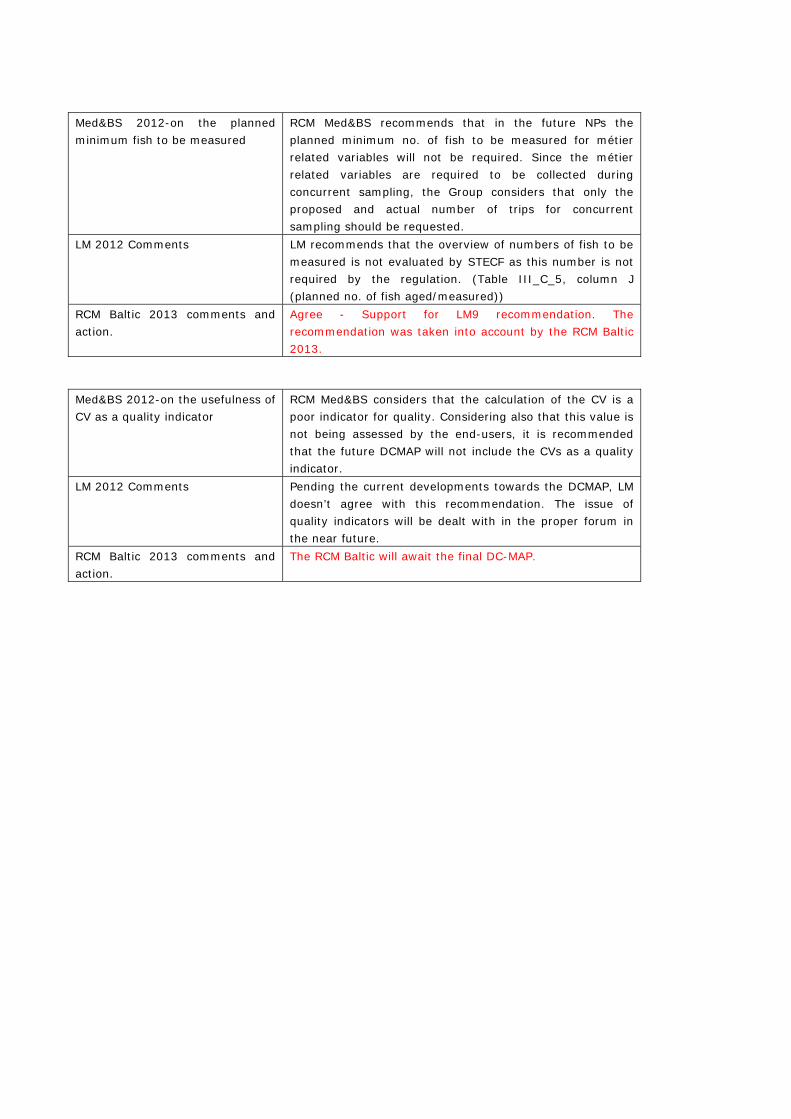
Med&BS 2012-on the planned minimum fish to be measured
RCM Med&BS recommends that in the future NPs the planned minimum no. of fish to be measured for métier related variables will not be required. Since the métier related variables are required to be collected during concurrent sampling, the Group considers that only the proposed and actual number of trips for concurrent sampling should be requested.
LM 2012 Comments LM recommends that the overview of numbers of fish to be measured is not evaluated by STECF as this number is not required by the regulation. (Table III_C_5, column J (planned no. of fish aged/measured))
RCM Baltic 2013 comments and action.
Agree - Support for LM9 recommendation. The recommendation was taken into account by the RCM Baltic 2013.
Med&BS 2012-on the usefulness of CV as a quality indicator
RCM Med&BS considers that the calculation of the CV is a poor indicator for quality. Considering also that this value is not being assessed by the end-users, it is recommended that the future DCMAP will not include the CVs as a quality indicator.
LM 2012 Comments Pending the current developments towards the DCMAP, LM doesn’t agree with this recommendation. The issue of quality indicators will be dealt with in the proper forum in the near future.
RCM Baltic 2013 comments and action.
The RCM Baltic will await the final DC-MAP.
14
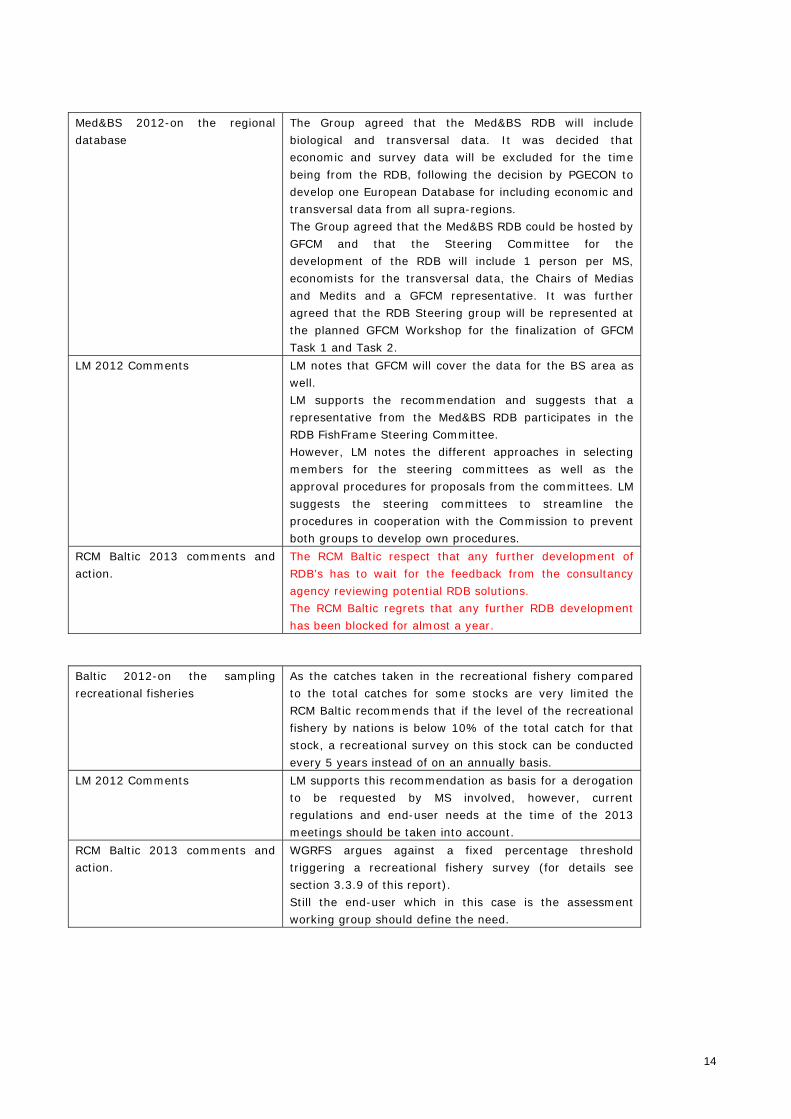
Med&BS 2012-on the regional database
The Group agreed that the Med&BS RDB will include biological and transversal data. It was decided that economic and survey data will be excluded for the time being from the RDB, following the decision by PGECON to develop one European Database for including economic and transversal data from all supra-regions. The Group agreed that the Med&BS RDB could be hosted by GFCM and that the Steering Committee for the development of the RDB will include 1 person per MS, economists for the transversal data, the Chairs of Medias and Medits and a GFCM representative. It was further agreed that the RDB Steering group will be represented at the planned GFCM Workshop for the finalization of GFCM Task 1 and Task 2.
LM 2012 Comments LM notes that GFCM will cover the data for the BS area as well. LM supports the recommendation and suggests that a representative from the Med&BS RDB participates in the RDB FishFrame Steering Committee. However, LM notes the different approaches in selecting members for the steering committees as well as the approval procedures for proposals from the committees. LM suggests the steering committees to streamline the procedures in cooperation with the Commission to prevent both groups to develop own procedures.
RCM Baltic 2013 comments and action.
The RCM Baltic respect that any further development of RDB’s has to wait for the feedback from the consultancy agency reviewing potential RDB solutions. The RCM Baltic regrets that any further RDB development has been blocked for almost a year.
Baltic 2012-on the sampling recreational fisheries
As the catches taken in the recreational fishery compared to the total catches for some stocks are very limited the RCM Baltic recommends that if the level of the recreational fishery by nations is below 10% of the total catch for that stock, a recreational survey on this stock can be conducted every 5 years instead of on an annually basis.
LM 2012 Comments LM supports this recommendation as basis for a derogation to be requested by MS involved, however, current regulations and end-user needs at the time of the 2013 meetings should be taken into account.
RCM Baltic 2013 comments and action.
WGRFS argues against a fixed percentage threshold triggering a recreational fishery survey (for details see section 3.3.9 of this report). Still the end-user which in this case is the assessment working group should define the need.
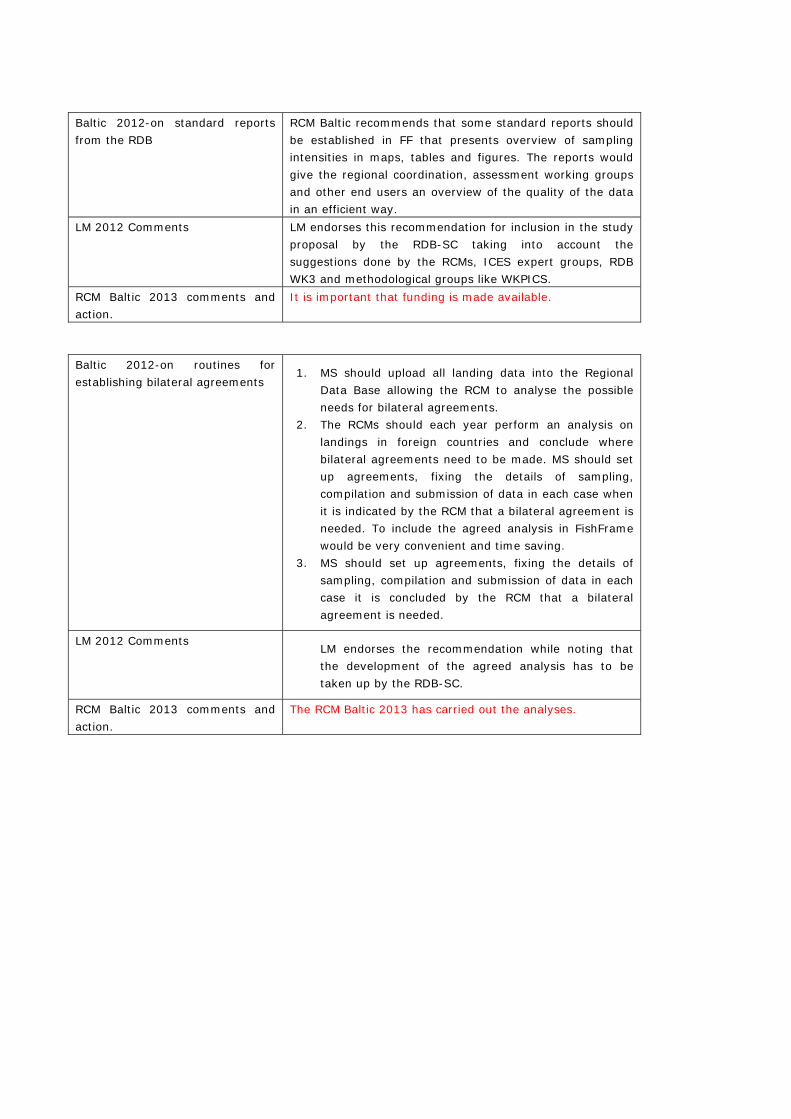
Baltic 2012-on standard reports from the RDB
RCM Baltic recommends that some standard reports should be established in FF that presents overview of sampling intensities in maps, tables and figures. The reports would give the regional coordination, assessment working groups and other end users an overview of the quality of the data in an efficient way.
LM 2012 Comments LM endorses this recommendation for inclusion in the study proposal by the RDB-SC taking into account the suggestions done by the RCMs, ICES expert groups, RDB WK3 and methodological groups like WKPICS.
RCM Baltic 2013 comments and action.
It is important that funding is made available.
Baltic 2012-on routines for establishing bilateral agreements
1. MS should upload all landing data into the Regional Data Base allowing the RCM to analyse the possible needs for bilateral agreements.
2. The RCMs should each year perform an analysis on landings in foreign countries and conclude where bilateral agreements need to be made. MS should set up agreements, fixing the details of sampling, compilation and submission of data in each case when it is indicated by the RCM that a bilateral agreement is needed. To include the agreed analysis in FishFrame would be very convenient and time saving.
3. MS should set up agreements, fixing the details of sampling, compilation and submission of data in each case it is concluded by the RCM that a bilateral agreement is needed.
LM 2012 Comments LM endorses the recommendation while noting that the development of the agreed analysis has to be taken up by the RDB-SC.
RCM Baltic 2013 comments and action.
The RCM Baltic 2013 has carried out the analyses.
16
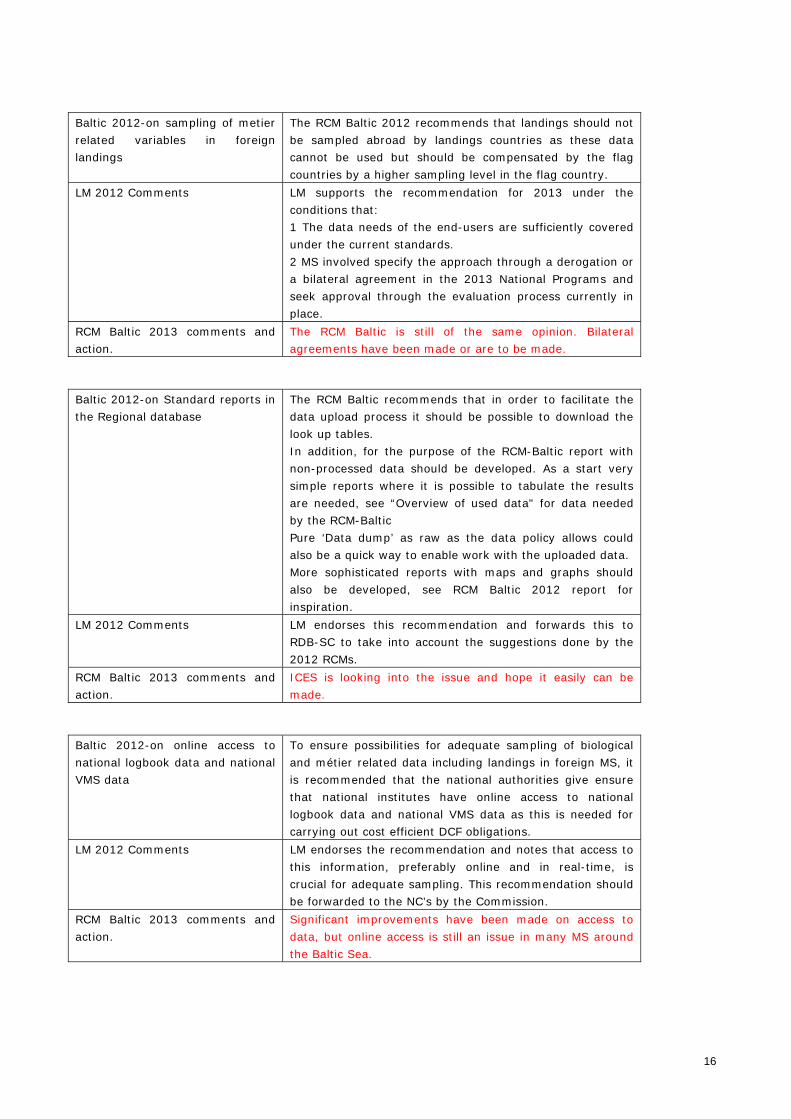
Baltic 2012-on sampling of metier related variables in foreign landings
The RCM Baltic 2012 recommends that landings should not be sampled abroad by landings countries as these data cannot be used but should be compensated by the flag countries by a higher sampling level in the flag country.
LM 2012 Comments LM supports the recommendation for 2013 under the conditions that: 1 The data needs of the end-users are sufficiently covered under the current standards. 2 MS involved specify the approach through a derogation or a bilateral agreement in the 2013 National Programs and seek approval through the evaluation process currently in place.
RCM Baltic 2013 comments and action.
The RCM Baltic is still of the same opinion. Bilateral agreements have been made or are to be made.
Baltic 2012-on Standard reports in the Regional database
The RCM Baltic recommends that in order to facilitate the data upload process it should be possible to download the look up tables. In addition, for the purpose of the RCM-Baltic report with non-processed data should be developed. As a start very simple reports where it is possible to tabulate the results are needed, see “Overview of used data" for data needed by the RCM-Baltic Pure ‘Data dump’ as raw as the data policy allows could also be a quick way to enable work with the uploaded data. More sophisticated reports with maps and graphs should also be developed, see RCM Baltic 2012 report for inspiration.
LM 2012 Comments LM endorses this recommendation and forwards this to RDB-SC to take into account the suggestions done by the 2012 RCMs.
RCM Baltic 2013 comments and action.
ICES is looking into the issue and hope it easily can be made.
Baltic 2012-on online access to national logbook data and national VMS data
To ensure possibilities for adequate sampling of biological and métier related data including landings in foreign MS, it is recommended that the national authorities give ensure that national institutes have online access to national logbook data and national VMS data as this is needed for carrying out cost efficient DCF obligations.
LM 2012 Comments LM endorses the recommendation and notes that access to this information, preferably online and in real-time, is crucial for adequate sampling. This recommendation should be forwarded to the NC’s by the Commission.
RCM Baltic 2013 comments and action.
Significant improvements have been made on access to data, but online access is still an issue in many MS around the Baltic Sea.
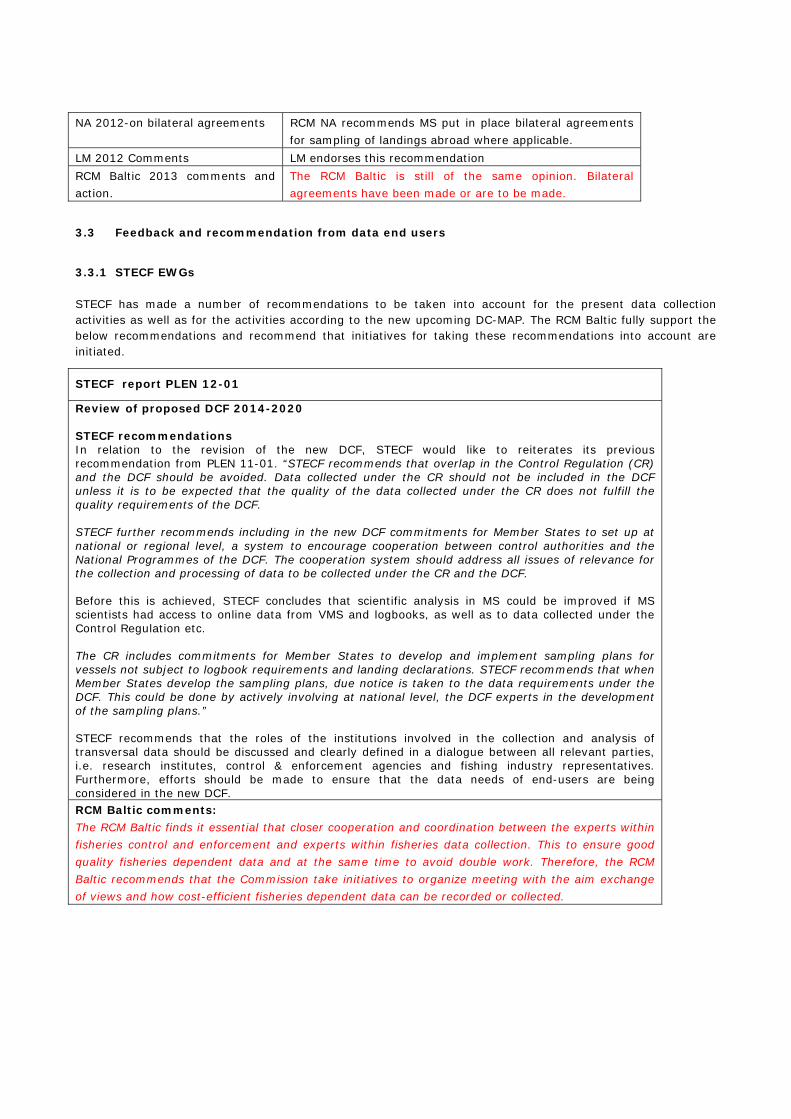
NA 2012-on bilateral agreements RCM NA recommends MS put in place bilateral agreements for sampling of landings abroad where applicable.
LM 2012 Comments LM endorses this recommendation RCM Baltic 2013 comments and action.
The RCM Baltic is still of the same opinion. Bilateral agreements have been made or are to be made.
3.3 Feedback and recommendation from data end users
3.3.1 STECF EWGs
STECF has made a number of recommendations to be taken into account for the present data collection activities as well as for the activities according to the new upcoming DC-MAP. The RCM Baltic fully support the below recommendations and recommend that initiatives for taking these recommendations into account are initiated.
STECF report PLEN 12-01
Review of proposed DCF 2014-2020 STECF recommendations In relation to the revision of the new DCF, STECF would like to reiterates its previous recommendation from PLEN 11-01. “STECF recommends that overlap in the Control Regulation (CR) and the DCF should be avoided. Data collected under the CR should not be included in the DCF unless it is to be expected that the quality of the data collected under the CR does not fulfill the quality requirements of the DCF. STECF further recommends including in the new DCF commitments for Member States to set up at national or regional level, a system to encourage cooperation between control authorities and the National Programmes of the DCF. The cooperation system should address all issues of relevance for the collection and processing of data to be collected under the CR and the DCF. Before this is achieved, STECF concludes that scientific analysis in MS could be improved if MS scientists had access to online data from VMS and logbooks, as well as to data collected under the Control Regulation etc. The CR includes commitments for Member States to develop and implement sampling plans for vessels not subject to logbook requirements and landing declarations. STECF recommends that when Member States develop the sampling plans, due notice is taken to the data requirements under the DCF. This could be done by actively involving at national level, the DCF experts in the development of the sampling plans.” STECF recommends that the roles of the institutions involved in the collection and analysis of transversal data should be discussed and clearly defined in a dialogue between all relevant parties, i.e. research institutes, control & enforcement agencies and fishing industry representatives. Furthermore, efforts should be made to ensure that the data needs of end-users are being considered in the new DCF. RCM Baltic comments: The RCM Baltic finds it essential that closer cooperation and coordination between the experts within fisheries control and enforcement and experts within fisheries data collection. This to ensure good quality fisheries dependent data and at the same time to avoid double work. Therefore, the RCM Baltic recommends that the Commission take initiatives to organize meeting with the aim exchange of views and how cost-efficient fisheries dependent data can be recorded or collected.
18
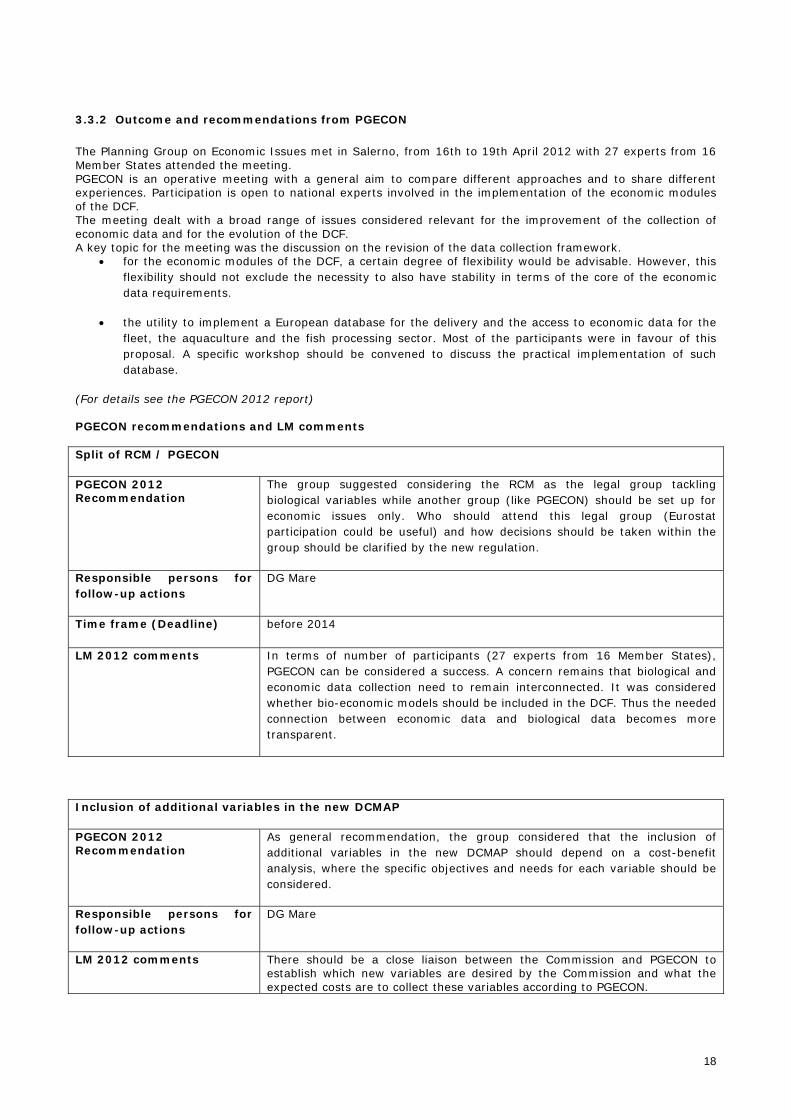
3.3.2 Outcome and recommendations from PGECON
The Planning Group on Economic Issues met in Salerno, from 16th to 19th April 2012 with 27 experts from 16 Member States attended the meeting. PGECON is an operative meeting with a general aim to compare different approaches and to share different experiences. Participation is open to national experts involved in the implementation of the economic modules of the DCF. The meeting dealt with a broad range of issues considered relevant for the improvement of the collection of economic data and for the evolution of the DCF. A key topic for the meeting was the discussion on the revision of the data collection framework.
for the economic modules of the DCF, a certain degree of flexibility would be advisable. However, this flexibility should not exclude the necessity to also have stability in terms of the core of the economic data requirements.
the utility to implement a European database for the delivery and the access to economic data for the
fleet, the aquaculture and the fish processing sector. Most of the participants were in favour of this proposal. A specific workshop should be convened to discuss the practical implementation of such database.
(For details see the PGECON 2012 report) PGECON recommendations and LM comments Split of RCM / PGECON
PGECON 2012 Recommendation
The group suggested considering the RCM as the legal group tackling biological variables while another group (like PGECON) should be set up for economic issues only. Who should attend this legal group (Eurostat participation could be useful) and how decisions should be taken within the group should be clarified by the new regulation.
Responsible persons for follow-up actions
DG Mare
Time frame (Deadline) before 2014
LM 2012 comments In terms of number of participants (27 experts from 16 Member States), PGECON can be considered a success. A concern remains that biological and economic data collection need to remain interconnected. It was considered whether bio-economic models should be included in the DCF. Thus the needed connection between economic data and biological data becomes more transparent.
Inclusion of additional variables in the new DCMAP
PGECON 2012 Recommendation
As general recommendation, the group considered that the inclusion of additional variables in the new DCMAP should depend on a cost-benefit analysis, where the specific objectives and needs for each variable should be considered.
Responsible persons for follow-up actions
DG Mare
LM 2012 comments There should be a close liaison between the Commission and PGECON to establish which new variables are desired by the Commission and what the expected costs are to collect these variables according to PGECON.
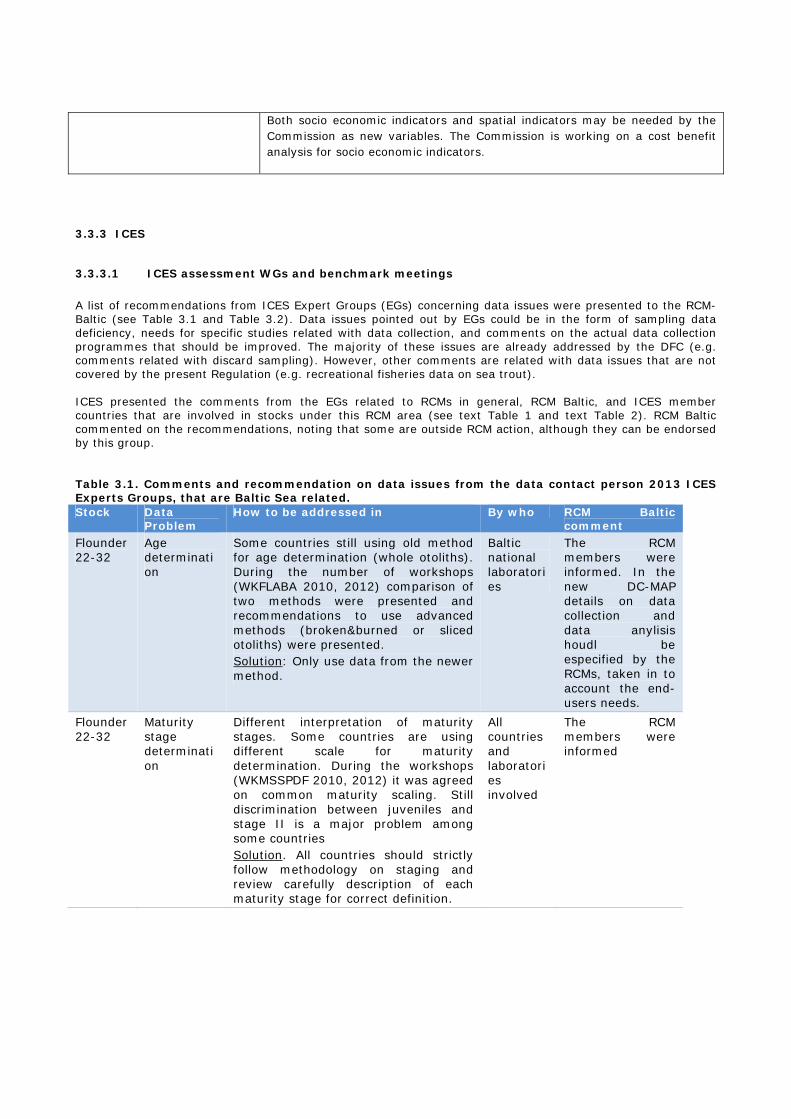
Both socio economic indicators and spatial indicators may be needed by the Commission as new variables. The Commission is working on a cost benefit analysis for socio economic indicators.
3.3.3 ICES
3.3.3.1 ICES assessment WGs and benchmark meetings
A list of recommendations from ICES Expert Groups (EGs) concerning data issues were presented to the RCM-Baltic (see Table 3.1 and Table 3.2). Data issues pointed out by EGs could be in the form of sampling data deficiency, needs for specific studies related with data collection, and comments on the actual data collection programmes that should be improved. The majority of these issues are already addressed by the DFC (e.g. comments related with discard sampling). However, other comments are related with data issues that are not covered by the present Regulation (e.g. recreational fisheries data on sea trout). ICES presented the comments from the EGs related to RCMs in general, RCM Baltic, and ICES member countries that are involved in stocks under this RCM area (see text Table 1 and text Table 2). RCM Baltic commented on the recommendations, noting that some are outside RCM action, although they can be endorsed by this group. Table 3.1. Comments and recommendation on data issues from the data contact person 2013 ICES Experts Groups, that are Baltic Sea related. Stock Data
Problem How to be addressed in By who RCM Baltic
comment
Flounder 22-32
Age determination
Some countries still using old method for age determination (whole otoliths). During the number of workshops (WKFLABA 2010, 2012) comparison of two methods were presented and recommendations to use advanced methods (broken&burned or sliced otoliths) were presented. Solution: Only use data from the newer method.
Baltic national laboratories
The RCM members were informed. In the new DC-MAP details on data collection and data anylisis houdl be especified by the RCMs, taken in to account the end-users needs.
Flounder 22-32
Maturity stage determination
Different interpretation of maturity stages. Some countries are using different scale for maturity determination. During the workshops (WKMSSPDF 2010, 2012) it was agreed on common maturity scaling. Still discrimination between juveniles and stage II is a major problem among some countries
Solution. All countries should strictly follow methodology on staging and review carefully description of each maturity stage for correct definition.
All countries and laboratories involved
The RCM members were informed
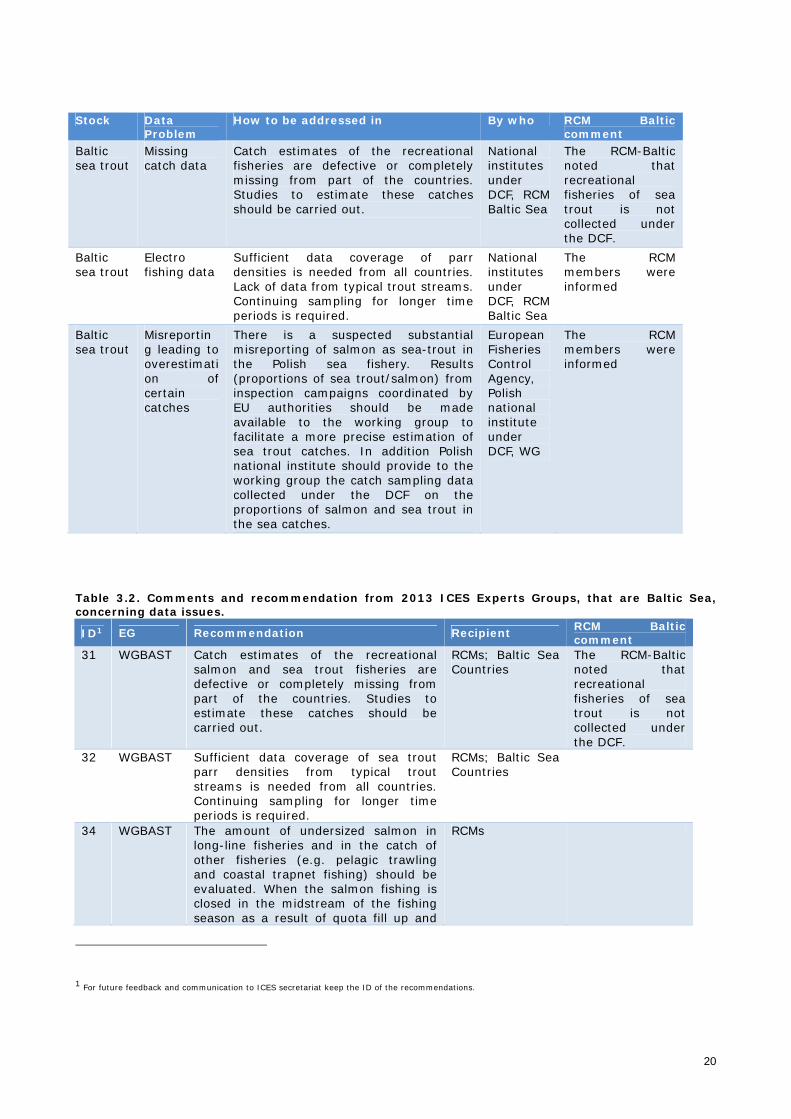
20
Stock Data Problem
How to be addressed in By who RCM Baltic comment
Baltic sea trout
Missing catch data
Catch estimates of the recreational fisheries are defective or completely missing from part of the countries. Studies to estimate these catches should be carried out.
National institutes under DCF, RCM Baltic Sea
The RCM-Baltic noted that recreational fisheries of sea trout is not collected under the DCF.
Baltic sea trout
Electro fishing data
Sufficient data coverage of parr densities is needed from all countries. Lack of data from typical trout streams. Continuing sampling for longer time periods is required.
National institutes under DCF, RCM Baltic Sea
The RCM members were informed
Baltic sea trout
Misreporting leading to overestimation of certain catches
There is a suspected substantial misreporting of salmon as sea-trout in the Polish sea fishery. Results (proportions of sea trout/salmon) from inspection campaigns coordinated by EU authorities should be made available to the working group to facilitate a more precise estimation of sea trout catches. In addition Polish national institute should provide to the working group the catch sampling data collected under the DCF on the proportions of salmon and sea trout in the sea catches.
European Fisheries Control Agency, Polish national institute under DCF, WG
The RCM members were informed
Table 3.2. Comments and recommendation from 2013 ICES Experts Groups, that are Baltic Sea, concerning data issues.
ID1 EG Recommendation Recipient RCM Baltic comment
31 WGBAST Catch estimates of the recreational salmon and sea trout fisheries are defective or completely missing from part of the countries. Studies to estimate these catches should be carried out.
RCMs; Baltic Sea Countries
The RCM-Baltic noted that recreational fisheries of sea trout is not collected under the DCF.
32 WGBAST Sufficient data coverage of sea trout parr densities from typical trout streams is needed from all countries. Continuing sampling for longer time periods is required.
RCMs; Baltic Sea Countries
34 WGBAST The amount of undersized salmon in long-line fisheries and in the catch of other fisheries (e.g. pelagic trawling and coastal trapnet fishing) should be evaluated. When the salmon fishing is closed in the midstream of the fishing season as a result of quota fill up and
RCMs
1 For future feedback and communication to ICES secretariat keep the ID of the recommendations.
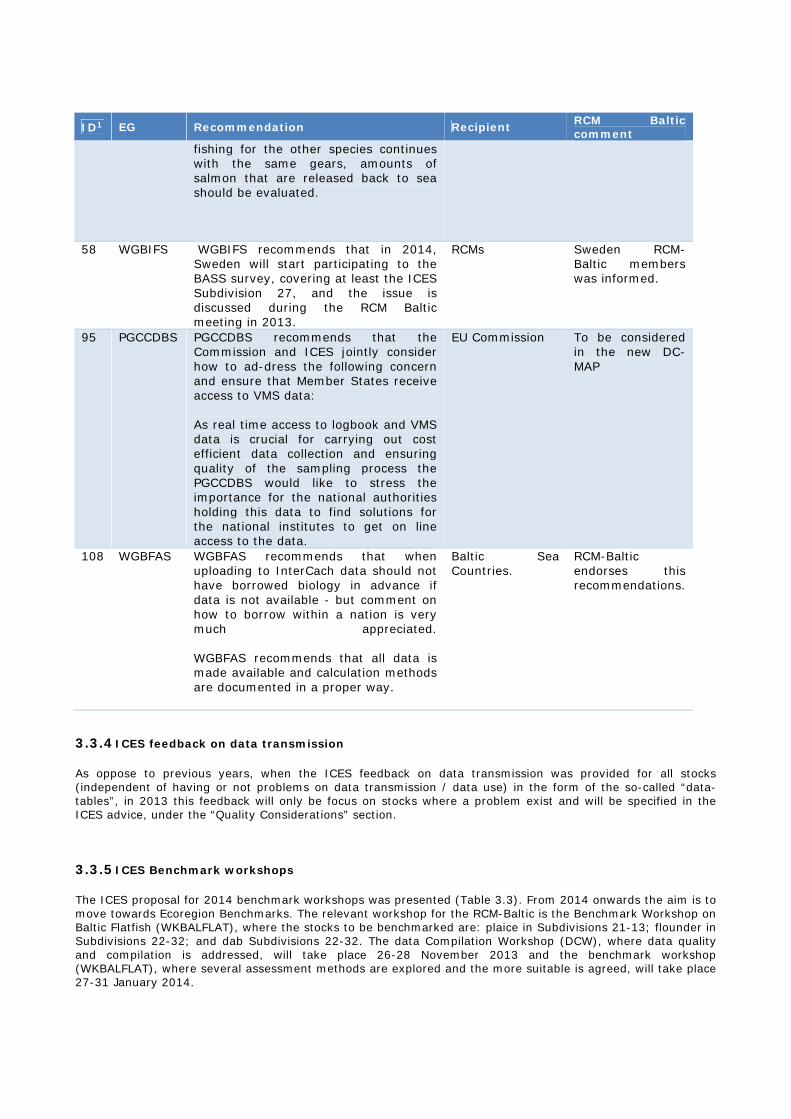
ID1 EG Recommendation Recipient RCM Baltic comment
fishing for the other species continues with the same gears, amounts of salmon that are released back to sea should be evaluated.
58 WGBIFS WGBIFS recommends that in 2014, Sweden will start participating to the BASS survey, covering at least the ICES Subdivision 27, and the issue is discussed during the RCM Baltic meeting in 2013.
RCMs Sweden RCM-Baltic members was informed.
95 PGCCDBS PGCCDBS recommends that the Commission and ICES jointly consider how to ad-dress the following concern and ensure that Member States receive access to VMS data: As real time access to logbook and VMS data is crucial for carrying out cost efficient data collection and ensuring quality of the sampling process the PGCCDBS would like to stress the importance for the national authorities holding this data to find solutions for the national institutes to get on line access to the data.
EU Commission To be considered in the new DC-MAP
108 WGBFAS WGBFAS recommends that when uploading to InterCach data should not have borrowed biology in advance if data is not available - but comment on how to borrow within a nation is very much appreciated. WGBFAS recommends that all data is made available and calculation methods are documented in a proper way.
Baltic Sea Countries.
RCM-Baltic endorses this recommendations.
3.3.4 ICES feedback on data transmission
As oppose to previous years, when the ICES feedback on data transmission was provided for all stocks (independent of having or not problems on data transmission / data use) in the form of the so-called “data-tables”, in 2013 this feedback will only be focus on stocks where a problem exist and will be specified in the ICES advice, under the “Quality Considerations” section.
3.3.5 ICES Benchmark workshops
The ICES proposal for 2014 benchmark workshops was presented (Table 3.3). From 2014 onwards the aim is to move towards Ecoregion Benchmarks. The relevant workshop for the RCM-Baltic is the Benchmark Workshop on Baltic Flatfish (WKBALFLAT), where the stocks to be benchmarked are: plaice in Subdivisions 21-13; flounder in Subdivisions 22-32; and dab Subdivisions 22-32. The data Compilation Workshop (DCW), where data quality and compilation is addressed, will take place 26-28 November 2013 and the benchmark workshop (WKBALFLAT), where several assessment methods are explored and the more suitable is agreed, will take place 27-31 January 2014.

22
The RCM-Baltic examined the data available at the Regional Database – FishFrame (RDB) for the three species to be benchmark. This will provide an overview to the Data Compilation Workshop (DCW) on DCF data availability since 2009. An overview of the data availability is available in Figure 1. This information highlights the usefulness of having a regional database as RDB-FF as a tool for the ICES DCW. Table 3.3. ICES proposal for 2014 benchmark workshops2 Benchmark Workshop
Stocks
WKBALFLAT
Dab in Subdivisions 22 – 32
Plaice in Kattegat, Belts and Sound (Subdivisions 21-23) Flounder in Subdivisions 22 – 32
WKBUT
Greenland halibut in Subareas I and II Greenland halibut in Subareas V, VI, XII and XIV
WKCELT Sole in Divisions VIIf, g (Celtic Sea)
Whiting in Division VIIe-k Nephrops in the FU 20 (Labadie, Baltimore and Galley), FU 21 (Jones and Cockburn) Nephrops off the southeastern and southwestern coasts of Ireland (FU 19)
WKPELA Mackerel in the Northeast Atlantic (combined Southern, Western and North Sea spawning components)
Herring in Division VIIa South of 52° 30’ N and VIIg,h,j,k (Celtic Sea and South of Ireland) Anchovy in Divisions VIIIa,b,d (Bay of Biscay)
WKSOUTH Four-spot megrim (Lepidorhombus boscii) in Divisions VIIIc and IXa Megrim (Lepidorhombus whiffiagonis) in Divisions VIIIc and IXa Hake in Division IIIa, Subareas IV, VI, and VII, and Divisions VIIIa,b,d Hake in Divisions VIIIc and IXa
WKHAD Haddock in Subarea IV (North Sea) and Division IIIa West (Skagerrak)
Haddock in Division VIa (West of Scotland)
WKDEEP Blue ling in Division Vb, and Subareas VI, VII
Ling in Division Va Black scabbardfish (Aphanopus carbo) in Subareas VI, VII and Divisions Vb and XIIb Black scabbardfish (Aphanopus carbo) in Subareas VIII and IX Black scabbardfish (Aphanopus carbo) in other areas (Subareas I, II, IV, X, XIV and Divisions IIIa, Vb)
3.3.6 PGCCDBS
The Planning Group on Commercial Catches, Discards and Biological Sampling [PGCCDBS] (Co-Chairs: Mike Armstrong, UK, and Gráinne Ní Chonchúir, Ireland) met in Belfast, Northern Ireland, 18th February – 22nd February 2013, in parallel with the Mediterranean Planning Group for Methodological Development (PGMed). The 2012 meeting of PGCCDBS focused on the following topics:
2 The benchmarks workshops and respective list of stocks is a proposal not approved yet.
Stock-based biological parameters from sampling of fishery and survey catches (age, growth, maturity, fecundity, sex ratio)
Fleet/métier related variables (discards estimates and length/age compositions of landings and discards) and statistical design of sampling schemes
Data collection technology (hardware, and software such as WebGR and the Regional Data bases).
Implementation of the ICES Quality Assurance Framework
Addressing recommendations and requests for advice from ICES expert groups (including through PGCCDBS data contact persons), and RCMs.
In addition, the PGCCDBS provided views on the revision of the Data Collection Framework, focusing on the need for statistically-sound, regional sampling programmes and task-sharing to improve cost effectiveness. The PGCCDBS met in plenary with PGMed to review the outcomes of a wide range of workshops and age exchanges conducted since PGCCDBS 2011 and the workplan for 2012. On the basis of this and the PGCCDBS long term planning process, further workshops and exchanges were proposed for 2013-2014. These include:
Age workshops (WKARBLUE: Workshop on Age Reading of Blue whiting; WKNARC2: Workshop of National Age Readings Coordinators; WKSABCAL: Workshop on the Statistical Analysis of Biological Calibration Studies [postponed until 2014]; WKAVSG - Workshop on Age Validation Studies for Gadoids; WKMIAS: Workshop on Micro increment Daily Growth in European Anchovy and Sardine.
Sampling design workshops (WKPICS3- Workshop on the Practical Implementation of Statically Sound Catch Sampling programmes)
Age exchanges (Sprat-Full scale exchange North sea only; Mackerel - small exchange; Herring (norwegian spring spawner) - small exchange; Saithe -full exchange using only images; Capelin - small exchange between Iceland and Norway; Dab - 2012 exchange postponed until 2013; Sea Bass - full scale exchange).
Proposals for study contracts on i) anglerfish ageing (Lophius piscatorius); ii) stock- and component related issues for the herring in the West of Scotland, West of Ireland, Irish Sea and North Sea; iii) Supporting design based regional data collection programmes
Proposal for a series of training courses covering the design of statistically sound catch sampling for fisheries monitoring programmes, and for a theme session at the 2013 ICES Annual Science Conference – “Improving statistical survey methods for monitoring commercial catches”.
Training course covering the design of statistically sound catch sampling for fisheries monitoring programmes PGCCDBS has recommended that ICES provide a training course covering the design of statistically sound catch sampling for fisheries monitoring programmes as the absence of any progress made with the recommendation in 2012. The RCM Baltic 2013 fully support that such courses are needed. The PGCCDBS 2012 indicated that a statistically-robust sampling scheme should be a prerequisite for collecting any data for any form of assessment. Expertise in designing sampling schemes is growing within the individual countries through ICES expert group participation, but there is little formal training available that concentrates on sampling design, particularly taking logistical constraints into account. Such courses will not only help those setting up schemes and implementing them but will also help inform end users on how this data can and should be used. Documenting schemes is forming part of the current process but it is important for the end user to understand this documentation, how that data was derived and why, and how it can be used. In 2012 PGCCDBS proposed that there should be three levels: an introductory level, an intermediate, and an advanced level. The idea was that at the introductory level, the candidates would already have grounding in
24
basic statistics and experience of biological sampling in the field and/or experience of using catch estimates from sampling programmes, in stock or fisheries assessments. The higher level courses may extend to the analysis of complex sampling programmes using design-based and model-based estimators for raising the sample estimates of catch characteristics (e.g. numbers-at-age) to the total catch estimates, with associated precision estimates. The PGCCDBS 2013 recommended that at least one course at a more intermediate level should be set up - aimed at providing a complete overview of the considerations and best practice when setting up or evaluating and possibly improving on current catch sampling programmes and also how to raise the data in reference to sampling design. Data collectors with an understanding of basic statistics working with fishery data would benefit from this course. The results from this one course will inform ICES on the need for further courses at different levels. Details of the proposal, in the format of ICES training course template, are given below.
RCM Baltic - workshop on “Design and analysis of statistically sound catch sampling programmes”
RCM Baltic 2013 Recommendation 1
The RCM Baltic fully support and recommend that a workshop on “Design and analysis of statistically sound catch sampling programmes” should be carried out.
Follow-up actions needed
Should be taken up by the ICES secretariat
Responsible persons for follow-up actions
ICES secretariat
Time frame (Deadline)
April 1st 2014
LM 2013
3.3.7 SGPIDS
SGPIDS 3 met 24 June – 28 June 2013 in Lysekil, Sweden attended by 19 participants from 12 different nations, and chaired by Alastair Pout (UK Scotland) and Marie Storr-Paulsen (Denmark). The study group focused on practical aspects of implementing sampling plans with participants providing case studies, worked examples, and progress reports that covered three main themes: sampling frames based on vessel lists; random vessel selection procedures; on-board sampling and estimation. The chair of WKBYC (Bram Couperus) attended and continued the liaison with this group. Setting up sampling frames based on vessels lists was explored through different national case studies. The EU fleet register can provide the basis for a national vessel list but the SG stressed the need for additional information from logbooks, sales notes and other sources to further inform the stratification. Stratification criteria considered included: vessel size; the use of passive or active gears; and geographical location of fishing or observer locations. These gross distinctions within national fleets enabled national programmes to define a small number of sampling strata into which national vessel lists could be divided. The implementation of random vessel selection procedures were reviewed for six national observer programmes with four programmes being able to calculate non-response rates (and industry refusals) from 2011-12 data. Direct comparison between non-response rates of different programmes is not yet possible due to differences between national programmes in the time window over which individual vessel selection attempts operate, and the relative effort expended trying to secure a trip on a fishing vessel. The SG recommends that a vessel’s “next trip” be used as the criteria to define the selection attempt and that the effort to secure a trip is the same for all attempted contacts. The SG recommends that national programmes should summarize their vessel contact attempts using (at least) the 6 contact categories (Not available, No contact details, Observer decline,
No answer, Industry decline, Successful sample) to ensure standardization and comparability. In the absence of comparable non-response and refusal rate, these would be appropriate to include in the QI table. The QI table should not be considered out of context of the scheme to which it relates. The SG emphasised the considerable advantages of operating a random selection system both in improving the statistical robustness of the data, and in fostering dialogue and securing cooperation with industry. Various case studies presented comparisons between realised sample data and the wider population of vessels being sampled (e.g. of the spatial-temporal distribution, gear types, landing categories, and catch composition). Particularly where non-response rates and refusal rates are high it is suggested that national programmes use such comparisons to examine potential bias in the sample data. Furthermore, the calculation of on-board sample weights was explored for seven national case studies. Sample weights for numbers at length could be calculated in all cases though for numbers at age this was possible for only one case using existing collection protocols. Aggregated ALK are used at various levels and the use of sample weights for age samples would represent a considerable departure in estimation methodology, if not sampling protocol, for most national programmes. Linking an age sample to the haul or set is required if sample weights for age are to be calculated. Weight estimates were obtained in a variety of ways, through on-board measures of individual fish or groups of fish, or derived from length weight relationships. Uncertainties in discard estimates were greatest where catches were large and diverse, and protocols that involve quantifying, rather than estimating the total discard can be recommended to improve estimates. The practical difficulties of achieving probability based selection of a discard sample on-board were recognised. The SG noticed that data exchange format of RDB-FishFrame would require a number of additional new fields and modification to the estimation procedure to enable at-sea sample weights to be calculated correctly.
3.3.8 WKPICS2
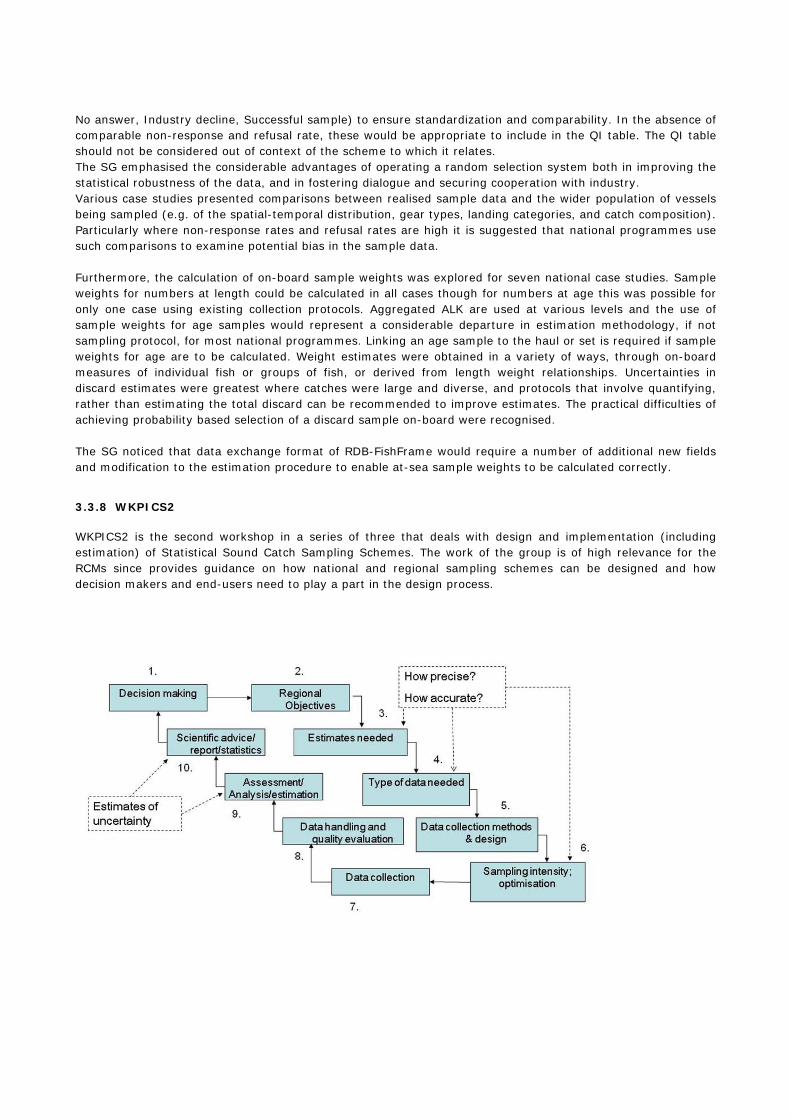
WKPICS2 is the second workshop in a series of three that deals with design and implementation (including estimation) of Statistical Sound Catch Sampling Schemes. The work of the group is of high relevance for the RCMs since provides guidance on how national and regional sampling schemes can be designed and how decision makers and end-users need to play a part in the design process.
26
WKPICS2 outlines four principal classes of probability-based sampling schemes, and discusses how sampling frames, primary sampling units and strata can be developed and optimised to deliver the required estimates for species, fleet metiers, fishing grounds or other variables of interest. Methods for design-based estimation procedures are described. Detailed description of design-based estimation is provided for an at-sea sampling programme where vessels are primary sampling units and for an on-shore catch sampling programme where site-days are primary sampling units. In the latter, vessel-trips are sampled for a random selection of ports and days. These two design classes result in a clustered sample of trips, and in general it is not reasonable to assume that a simple random sample of trips is obtained from the fleet. Detailed advice on estimation procedures for all principal design classes will be finalized in WKPICS3. WKPICS2 has developed guidelines for “best practice” that covers the design, implementation and analysis stages of catch sampling schemes, assuming that regional objectives and data needs are clearly defined. Ideally, all national surveys should clearly document the sampling frame, sample selection procedures, response rates (e.g. refusals to take observers), imputation methods for missing data and weighting procedures employed to derive national estimates. Best practice can be defined as sampling designs, implementation and data analysis that lead to minimum bias and an accurate estimate of precision, and which make the most efficient use of sampling resources. WKPICS2 also proposes revised data quality indicators, including a simple one-page form that can be used to evaluate quality of data used for stock assessments. It is recommended that the quality indicators be further refined through practical testing by Regional Coordination Groups and stock assessment working groups, based on several case studies.
3.3.9 WGRFS
The ICES Working Group on Recreational Fisheries Surveys (WGRFS) is a forum for planning and coordination of marine recreational fisheries data collection and analysis (20-25 experts from throughout Europe). End-user of WGRFS is WGBFAS and WGBAST, and ultimately ACOM. WGRFS had a WebEx meeting with the Commission (DG MARE) in 2012 and reviewed the documents EWG 12-01/12-15/13-02/13-05 and WKESDCF. WGRFS defined recreational fishing (RF) as “the capture or attempted capture of living aquatic resources mainly for leisure and / or personal consumption. This covers active fishing methods including line, spear, and hand–gathering and passive fishing methods including nets, traps, pots, and set–lines”. It also points out that the worldwide term “catch” is defined as “harvest + release”. Proposals for frequency and precision of recreational fishery surveys in the new DC-MAP were reviewed. WGRFS continues to advise that requirements to collect recreational fishery data in DC-MAP should be driven by end-user needs. WGRFS argues against a fixed percentage threshold triggering a recreational fishery survey (“if the level of the recreational fishery by nations is below 10% of the total catch for that stock, a recreational survey on this stock can be conducted every 5 years instead of on an annually basis”).
At present, many MS have not conducted sufficient, unbiased recreational fisheries surveys so that reliable data are not available on which threshold values could be estimated.
In case a RF is considered irrelevant, the MS can apply for a derogation; there is no need for a threshold (there is also no fixed threshold for not sampling commercial métiers).
In particular when the recreational fisheries take a large component of young fish (strong year class), the numerical catch could be huge although the removal weight is low; in the case of overfishing RF could still be exerting a significant fishing mortality even if the estimated removal is considered low; stocks under recovery may need better evaluation of all sources of mortality (e.g. cod in the Baltic Sea)
RF for particular species may become more or less important over time, so there is need for time series data to show trends, e.g. salmon and sea trout in the Baltic Sea
Analyses of available and future RF data still have to identify the most appropriate metric to determine a threshold (e.g. by weights or numbers; MS harvest from the entire total catch or MS harvest from the MS landings).
Recreational surveys should be conducted annually to preserve expertise, infrastructure and budgets; annual data at low precision may provide better information than intermittent higher-precision surveys at greater intervals; fish stock assessments require continuous time series.
WGRFS should be closely involved in this process, as it is the current Expert Group on recreational fishery surveys in Europe, and should have appropriate Terms of Reference to provide Regional Coordination Groups (RCG) with advice on how end-user requests for recreational fishery data can be addressed. There are several options how this work could be structured: (1) the establishment of a supranational meeting that meets annually at one of the RCGs bringing together fishery experts from Europe; (2) strengthening the Liaison Meeting by including the chairs of WGRFS, WGBAST and WGEEL; (3) Specific ToRs formulated within the RCGs to be forwarded to WGRFS. Given the low number of experts in the field, these options ensure that relevant experts can participate in this work. WGRFS provided the following recommendations concerning data collection requests:
Precision level: There should not be a single precision target set for all countries individually but rather a single precision target for the overall catch, harvest or release of each stock.
Biological variables: Specific details of survey schemes such as periodicity of estimates (e.g. annual, twice a year or quarterly) and type of data to collect (e.g. numbers, weight, length compositions) shall be agreed at a regional level. This process should be targeted to end-user needs with coordinating input from WGRFS.
Economic variables: WGRFS recommends including the collection of socioeconomic data to assess the economic and social benefits of the recreational fishery.
3.3.10 Possible new structure on PGCCDBS and related ICES EGs
Background Role and operation of PGCCDBS The ICES Planning Group on Commercial Catches, Discards and Biological Sampling (PGCCDBS) was established in 2002 in response to the EC-ICES Memorandum of Understanding (MoU) requesting ICES to provide support for the EU Data Collection Framework (DCF). It implements the ICES Quality Assurance Framework to ensure that data sets and parameters supporting assessments and advice for the ICES area are based on i) statistically-sound sampling schemes; ii) correct and consistent interpretation of biological material such as otoliths and gonads; iii) technology that improves accuracy and cost-effectiveness of data collection; iv) comprehensive and easily sourced documentation, and v) efficient collaboration between PGCCDBS, expert groups and other bodies in relation to data collection. The outputs of the series of PGCCDBS meetings and associated intersessional work such as workshops and exchanges form an extremely valuable resource summarising current state of knowledge in Europe and worldwide. In many cases, a high degree of technical and scientific competence has been required for PGCCDBS workshops (such as sampling design and data analysis), and leading experts from Europe and overseas have been involved. The recent meetings of PGCCDBS have focused on work completed since the last year, planned work for the current and next year, in the following topics which have formed the basis of the Terms of Reference:
Stock-based biological parameters from sampling of fishery and survey catches (age, growth, maturity, fecundity, sex ratio)
Fleet/métier related variables (discards estimates and length/age compositions of landings and discards) and statistical design of sampling schemes
Data collection technology (hardware, and software such as WebGR and the Regional Data bases). Implementation of the ICES Quality Assurance Framework Addressing recommendations and requests for advice from ICES expert groups (including through
PGCCDBS data contact persons), and RCMs. The PGCCDBS meets in parallel with the Planning Group for the Mediterranean Sea Data Collection (PGMED) to review the outcomes of a wide range of workshops and age exchanges. The PGCCDBS has over 40 members and the annual meeting of five days is typically structured around plenary presentations of the outcomes of intersessional workshops and age exchanges, followed by three sub-groups working in parallel to address ToRs related to biological parameters, fleet-based sampling, data collection technology or any other specific requests, with further plenaries to review subgroup outcomes and agree the report content and proposals for future work. Future work on age and maturity is partly driven by schedules for age exchanges etc. provided through age and maturity interactive tables developed by the PG, and specific requests from assessment expert groups. The PGCCDBS in 2013 and beyond
28
The body of data and knowledge, and the competences of PGCCDBS, have increased over time, but this has also served to highlight the limitations in data and understanding. Furthermore, by raising the level of awareness of these issues in other ICES Expert Groups, a wide range of requests for advice are being sent to PGCCDBS. As a result, the scope of the subgroups has expanded over the last few years. For example, the fleet-based subgroup has spent increasing time on issues of statistical sampling design (building on outcomes from the PGCCDBS-derived Workshop on Practical Implementation of catch Sampling (WKPICS) and Study Group of practical Implementation of Discards Sampling (SGPIDS)) and how to report data quality, whilst the biological parameters subgroup is facing an ever-increasing body of information from age exchanges and calibration studies, and age/maturity workshops, along with the need to develop quality indicators for assessment expert groups. Whilst the subgroups have remained very productive, the amount and complexity of material being produced, and the volume of responses to external requests, has meant that PGCCDBS outputs are not being reviewed as comprehensively as desired during the meeting, increasing the amount of post-PGCCDBS work by the Chairs and subgroup members and reducing the synergy of having many experts together in the same room. During the 2013 PGCCDBS meeting, members of the fleet subgroup proposed that their work would be better undertaken during a dedicated Working Group, which would allow more time to focus on its ToRs and develop its role to meet the changing demands for fishery data in coming years. This WG would also build on the comprehensive frameworks developed through SGPIDS and WKPICS and the earlier workshops on data collection and data quality evaluation dealing with data accuracy (WKACCU), precision (WKPRECISE) and merging different metier (WKMERGE). A proposal for a Working Group on Commercial Catches (WGCATCH) was developed (see Annex 6 of PGCCDBS 2013 report). During the 2013 meeting of the Workshop for National Age Reading Coordinators (WKNARC), a similar conclusion was reached that PGCCDBS is no longer the ideal vehicle for coordinating and developing the collection, interpretation and use of data on biological parameters, and that a new Working Group on Biological Parameters (WGBIOP) should be formed (see proposal in the WKNARC 2013 report). Future options Considering i) the proposal to established WGCATCH and WGBIOP, iii) the current workload at PGCCDBS meetings, iii) the link with PGMED, iv) the inputs from the WGRFS and v) the surveys related a new setup of PGCCDBS is needed. Several options are currently being discusses considering how these WGs would fit into the larger picture of ICES work on data quality and understanding of biological processes. The PGCCDBS exists within a broader set of activities aimed at facilitating the process of data collection under the DCF (Fig. 1), and ensuring the quality and cost-effectiveness of the data collection across Member States. Other related meetings linking with PGCCDBS are:
The Regional Coordination Meetings for the North Sea & Eastern Arctic; North Atlantic; Baltic; Mediterranean & Black Sea; Long Distance fisheries. (Their purpose is to coordinate the activities of Member States in meeting DCF data collection requirements);
PGMED (which meets in parallel with PGCCDBS) PGECON (established in 2012 to discuss methodological and coordination issues related to the
economic modules of the DCF at European level - fleet economic data, aquaculture, processing sector). The annual Liaison Meeting (LM) which includes: the chairs of STECF DCF EWG’s (formerly chairs SGRN
and SGECA); the chairs of the different RCMs; the Chairs of PGCCDBS, PGMED and PGECON; ICES secretariat; European Commission representatives. (Held annually to analyse the RCM reports in order to ensure overall coordination between the RCMs. On the basis of the reports, the LM makes recommendations to the Commission.)
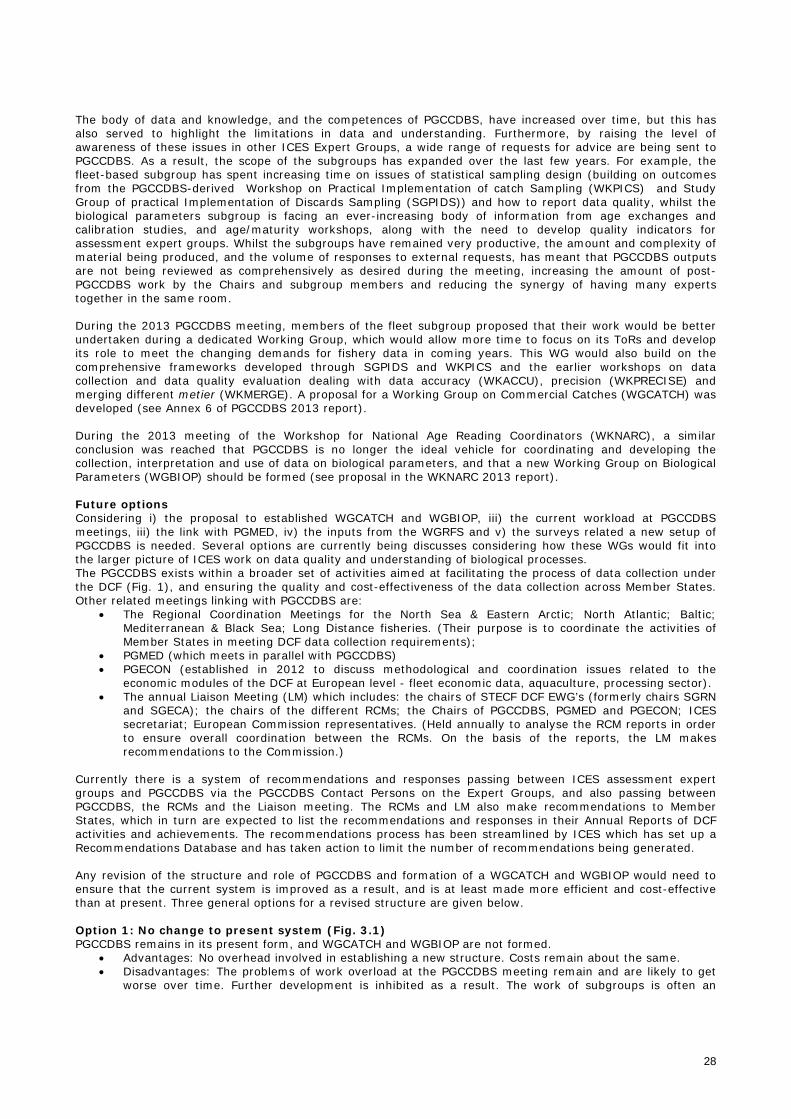
Currently there is a system of recommendations and responses passing between ICES assessment expert groups and PGCCDBS via the PGCCDBS Contact Persons on the Expert Groups, and also passing between PGCCDBS, the RCMs and the Liaison meeting. The RCMs and LM also make recommendations to Member States, which in turn are expected to list the recommendations and responses in their Annual Reports of DCF activities and achievements. The recommendations process has been streamlined by ICES which has set up a Recommendations Database and has taken action to limit the number of recommendations being generated. Any revision of the structure and role of PGCCDBS and formation of a WGCATCH and WGBIOP would need to ensure that the current system is improved as a result, and is at least made more efficient and cost-effective than at present. Three general options for a revised structure are given below. Option 1: No change to present system (Fig. 3.1) PGCCDBS remains in its present form, and WGCATCH and WGBIOP are not formed.
Advantages: No overhead involved in establishing a new structure. Costs remain about the same. Disadvantages: The problems of work overload at the PGCCDBS meeting remain and are likely to get
worse over time. Further development is inhibited as a result. The work of subgroups is often an
extension of work carried out in workshops established by PGCCDBS, and there is a cost for PG members also attending the workshops as well as some duplication of effort.
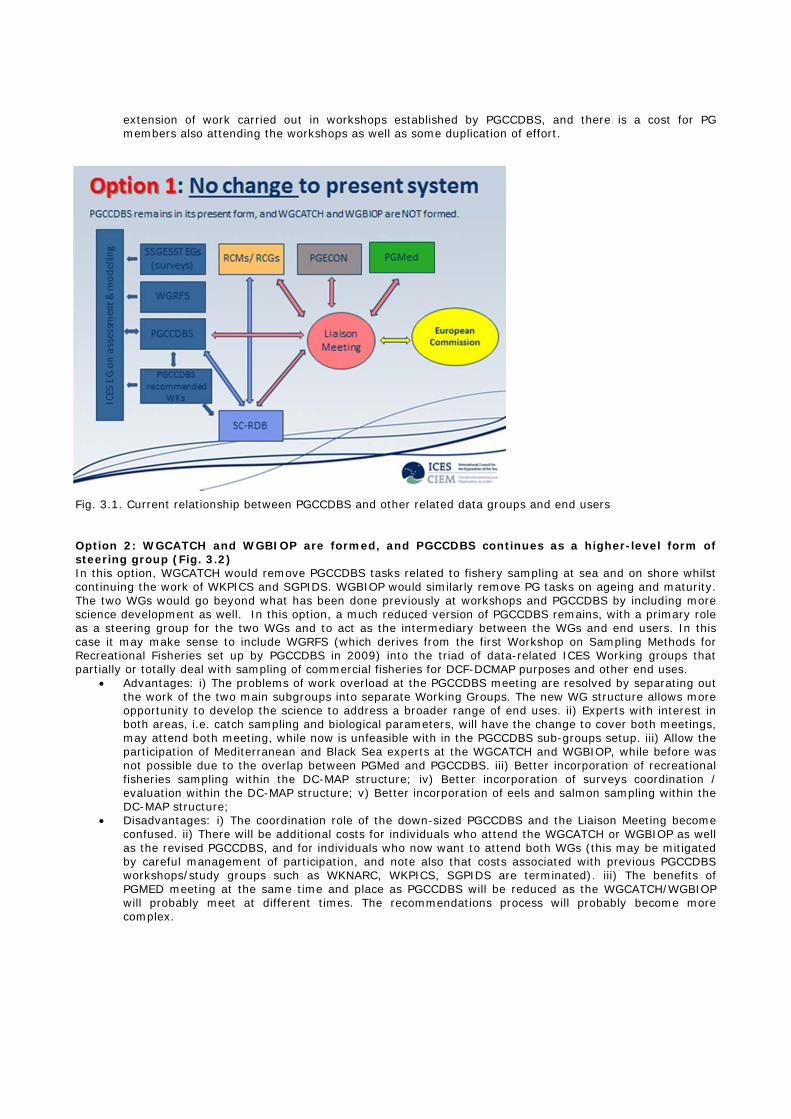
Fig. 3.1. Current relationship between PGCCDBS and other related data groups and end users Option 2: WGCATCH and WGBIOP are formed, and PGCCDBS continues as a higher-level form of steering group (Fig. 3.2) In this option, WGCATCH would remove PGCCDBS tasks related to fishery sampling at sea and on shore whilst continuing the work of WKPICS and SGPIDS. WGBIOP would similarly remove PG tasks on ageing and maturity. The two WGs would go beyond what has been done previously at workshops and PGCCDBS by including more science development as well. In this option, a much reduced version of PGCCDBS remains, with a primary role as a steering group for the two WGs and to act as the intermediary between the WGs and end users. In this case it may make sense to include WGRFS (which derives from the first Workshop on Sampling Methods for Recreational Fisheries set up by PGCCDBS in 2009) into the triad of data-related ICES Working groups that partially or totally deal with sampling of commercial fisheries for DCF-DCMAP purposes and other end uses.
Advantages: i) The problems of work overload at the PGCCDBS meeting are resolved by separating out the work of the two main subgroups into separate Working Groups. The new WG structure allows more opportunity to develop the science to address a broader range of end uses. ii) Experts with interest in both areas, i.e. catch sampling and biological parameters, will have the change to cover both meetings, may attend both meeting, while now is unfeasible with in the PGCCDBS sub-groups setup. iii) Allow the participation of Mediterranean and Black Sea experts at the WGCATCH and WGBIOP, while before was not possible due to the overlap between PGMed and PGCCDBS. iii) Better incorporation of recreational fisheries sampling within the DC-MAP structure; iv) Better incorporation of surveys coordination / evaluation within the DC-MAP structure; v) Better incorporation of eels and salmon sampling within the DC-MAP structure;
Disadvantages: i) The coordination role of the down-sized PGCCDBS and the Liaison Meeting become confused. ii) There will be additional costs for individuals who attend the WGCATCH or WGBIOP as well as the revised PGCCDBS, and for individuals who now want to attend both WGs (this may be mitigated by careful management of participation, and note also that costs associated with previous PGCCDBS workshops/study groups such as WKNARC, WKPICS, SGPIDS are terminated). iii) The benefits of PGMED meeting at the same time and place as PGCCDBS will be reduced as the WGCATCH/WGBIOP will probably meet at different times. The recommendations process will probably become more complex.
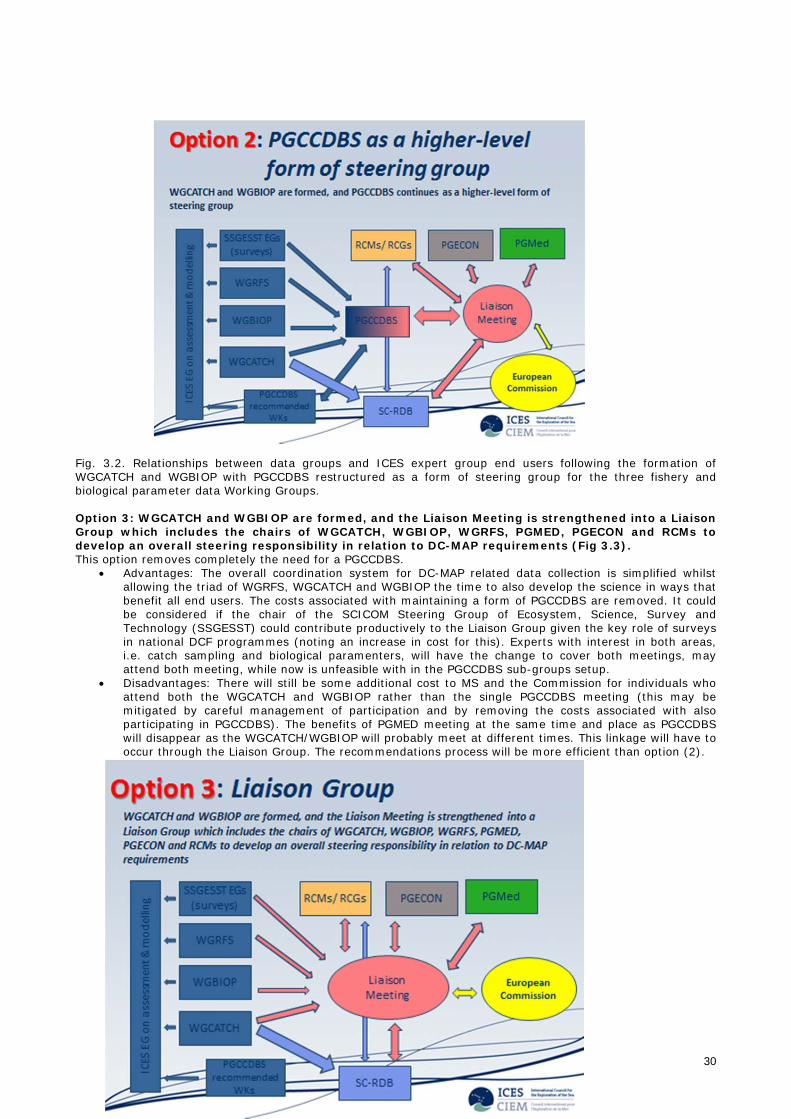
30
Fig. 3.2. Relationships between data groups and ICES expert group end users following the formation of WGCATCH and WGBIOP with PGCCDBS restructured as a form of steering group for the three fishery and biological parameter data Working Groups. Option 3: WGCATCH and WGBIOP are formed, and the Liaison Meeting is strengthened into a Liaison Group which includes the chairs of WGCATCH, WGBIOP, WGRFS, PGMED, PGECON and RCMs to develop an overall steering responsibility in relation to DC-MAP requirements (Fig 3.3). This option removes completely the need for a PGCCDBS.
Advantages: The overall coordination system for DC-MAP related data collection is simplified whilst allowing the triad of WGRFS, WGCATCH and WGBIOP the time to also develop the science in ways that benefit all end users. The costs associated with maintaining a form of PGCCDBS are removed. It could be considered if the chair of the SCICOM Steering Group of Ecosystem, Science, Survey and Technology (SSGESST) could contribute productively to the Liaison Group given the key role of surveys in national DCF programmes (noting an increase in cost for this). Experts with interest in both areas, i.e. catch sampling and biological paramenters, will have the change to cover both meetings, may attend both meeting, while now is unfeasible with in the PGCCDBS sub-groups setup.
Disadvantages: There will still be some additional cost to MS and the Commission for individuals who attend both the WGCATCH and WGBIOP rather than the single PGCCDBS meeting (this may be mitigated by careful management of participation and by removing the costs associated with also participating in PGCCDBS). The benefits of PGMED meeting at the same time and place as PGCCDBS will disappear as the WGCATCH/WGBIOP will probably meet at different times. This linkage will have to occur through the Liaison Group. The recommendations process will be more efficient than option (2).
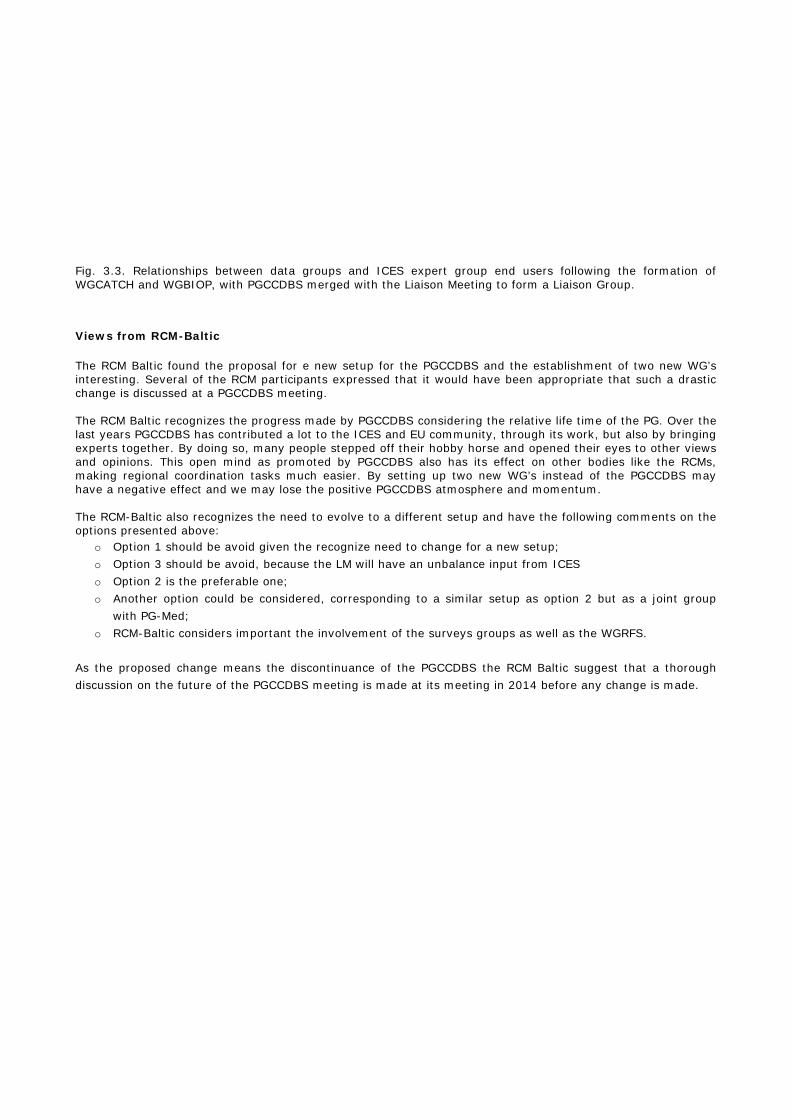
Fig. 3.3. Relationships between data groups and ICES expert group end users following the formation of WGCATCH and WGBIOP, with PGCCDBS merged with the Liaison Meeting to form a Liaison Group.
Views from RCM-Baltic
The RCM Baltic found the proposal for e new setup for the PGCCDBS and the establishment of two new WG’s interesting. Several of the RCM participants expressed that it would have been appropriate that such a drastic change is discussed at a PGCCDBS meeting. The RCM Baltic recognizes the progress made by PGCCDBS considering the relative life time of the PG. Over the last years PGCCDBS has contributed a lot to the ICES and EU community, through its work, but also by bringing experts together. By doing so, many people stepped off their hobby horse and opened their eyes to other views and opinions. This open mind as promoted by PGCCDBS also has its effect on other bodies like the RCMs, making regional coordination tasks much easier. By setting up two new WG’s instead of the PGCCDBS may have a negative effect and we may lose the positive PGCCDBS atmosphere and momentum. The RCM-Baltic also recognizes the need to evolve to a different setup and have the following comments on the options presented above:
o Option 1 should be avoid given the recognize need to change for a new setup; o Option 3 should be avoid, because the LM will have an unbalance input from ICES o Option 2 is the preferable one; o Another option could be considered, corresponding to a similar setup as option 2 but as a joint group
with PG-Med; o RCM-Baltic considers important the involvement of the surveys groups as well as the WGRFS.
As the proposed change means the discontinuance of the PGCCDBS the RCM Baltic suggest that a thorough discussion on the future of the PGCCDBS meeting is made at its meeting in 2014 before any change is made.
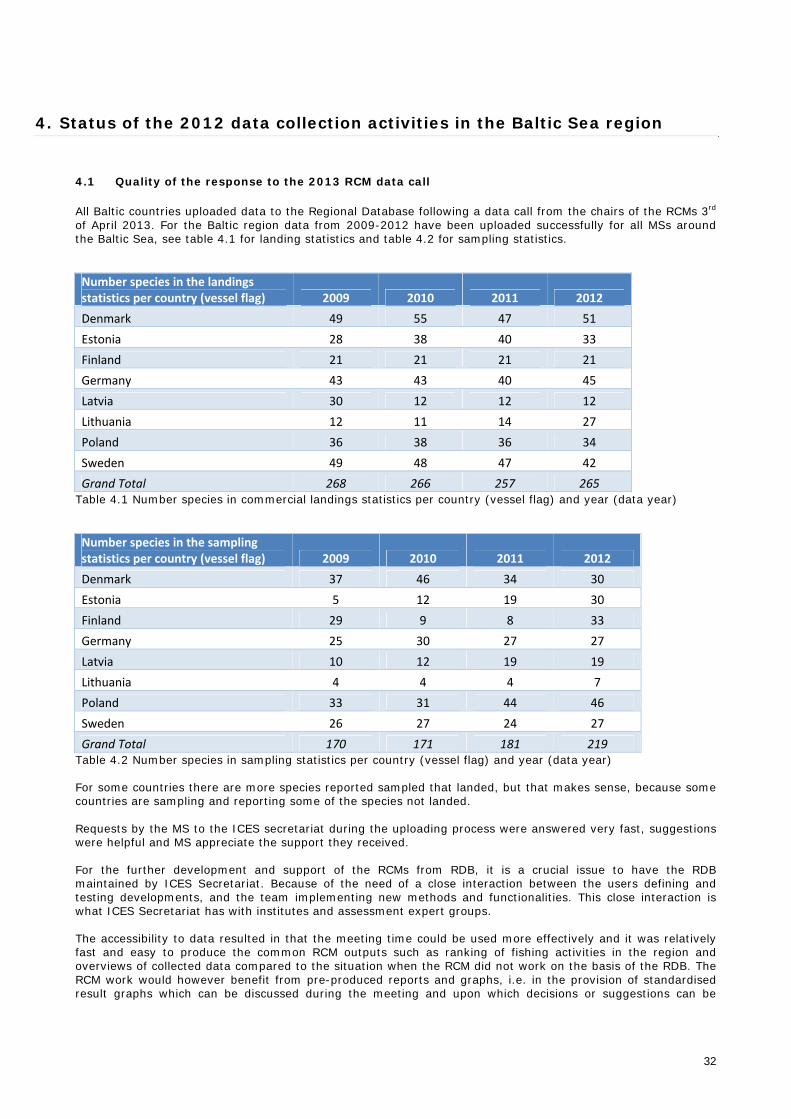
32
4. Status of the 2012 data collection activities in the Baltic Sea region
4.1 Quality of the response to the 2013 RCM data call
All Baltic countries uploaded data to the Regional Database following a data call from the chairs of the RCMs 3rd
of April 2013. For the Baltic region data from 2009-2012 have been uploaded successfully for all MSs around the Baltic Sea, see table 4.1 for landing statistics and table 4.2 for sampling statistics. Number species in the landings statistics per country (vessel flag) 2009 2010 2011 2012
Denmark 49 55 47 51
Estonia 28 38 40 33
Finland 21 21 21 21
Germany 43 43 40 45
Latvia 30 12 12 12
Lithuania 12 11 14 27
Poland 36 38 36 34
Sweden 49 48 47 42
Grand Total 268 266 257 265 Table 4.1 Number species in commercial landings statistics per country (vessel flag) and year (data year) Number species in the sampling statistics per country (vessel flag) 2009 2010 2011 2012
Denmark 37 46 34 30
Estonia 5 12 19 30
Finland 29 9 8 33
Germany 25 30 27 27
Latvia 10 12 19 19
Lithuania 4 4 4 7
Poland 33 31 44 46
Sweden 26 27 24 27
Grand Total 170 171 181 219 Table 4.2 Number species in sampling statistics per country (vessel flag) and year (data year) For some countries there are more species reported sampled that landed, but that makes sense, because some countries are sampling and reporting some of the species not landed. Requests by the MS to the ICES secretariat during the uploading process were answered very fast, suggestions were helpful and MS appreciate the support they received. For the further development and support of the RCMs from RDB, it is a crucial issue to have the RDB maintained by ICES Secretariat. Because of the need of a close interaction between the users defining and testing developments, and the team implementing new methods and functionalities. This close interaction is what ICES Secretariat has with institutes and assessment expert groups. The accessibility to data resulted in that the meeting time could be used more effectively and it was relatively fast and easy to produce the common RCM outputs such as ranking of fishing activities in the region and overviews of collected data compared to the situation when the RCM did not work on the basis of the RDB. The RCM work would however benefit from pre-produced reports and graphs, i.e. in the provision of standardised result graphs which can be discussed during the meeting and upon which decisions or suggestions can be
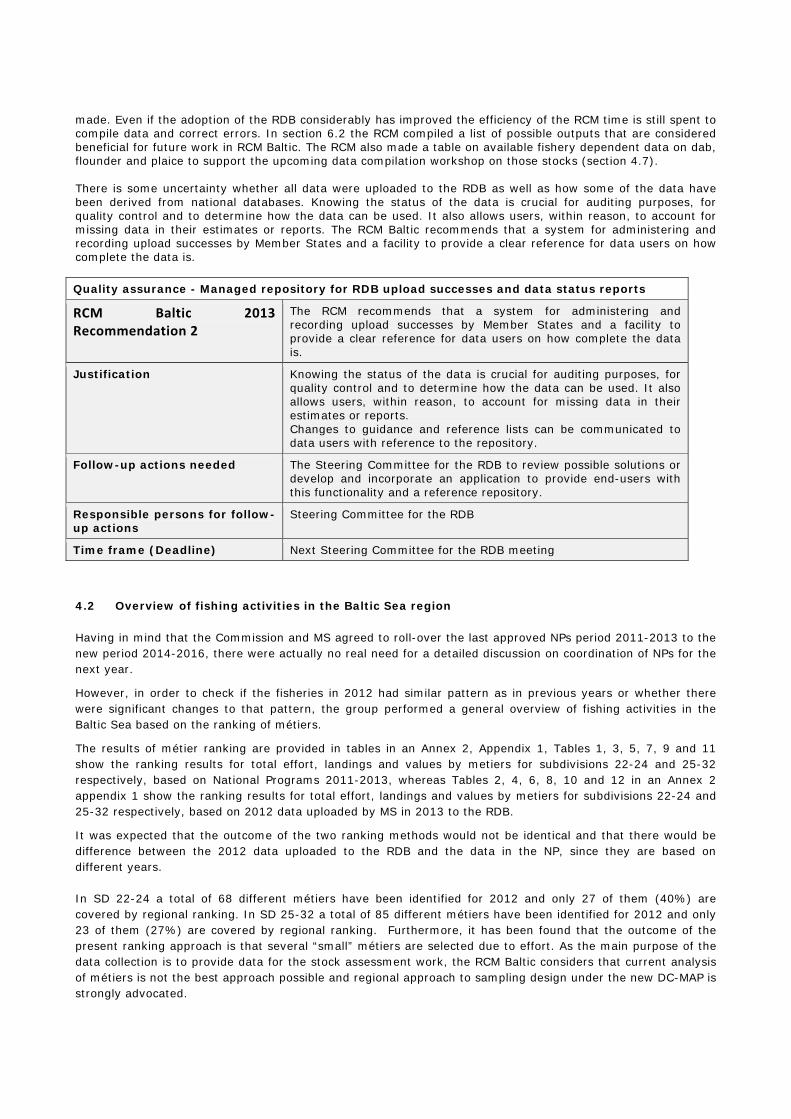
made. Even if the adoption of the RDB considerably has improved the efficiency of the RCM time is still spent to compile data and correct errors. In section 6.2 the RCM compiled a list of possible outputs that are considered beneficial for future work in RCM Baltic. The RCM also made a table on available fishery dependent data on dab, flounder and plaice to support the upcoming data compilation workshop on those stocks (section 4.7). There is some uncertainty whether all data were uploaded to the RDB as well as how some of the data have been derived from national databases. Knowing the status of the data is crucial for auditing purposes, for quality control and to determine how the data can be used. It also allows users, within reason, to account for missing data in their estimates or reports. The RCM Baltic recommends that a system for administering and recording upload successes by Member States and a facility to provide a clear reference for data users on how complete the data is. Quality assurance - Managed repository for RDB upload successes and data status reports
RCM Baltic 2013 Recommendation 2
The RCM recommends that a system for administering and recording upload successes by Member States and a facility to provide a clear reference for data users on how complete the data is.
Justification Knowing the status of the data is crucial for auditing purposes, for quality control and to determine how the data can be used. It also allows users, within reason, to account for missing data in their estimates or reports. Changes to guidance and reference lists can be communicated to data users with reference to the repository.
Follow-up actions needed The Steering Committee for the RDB to review possible solutions or develop and incorporate an application to provide end-users with this functionality and a reference repository.
Responsible persons for follow-up actions
Steering Committee for the RDB
Time frame (Deadline) Next Steering Committee for the RDB meeting
4.2 Overview of fishing activities in the Baltic Sea region
Having in mind that the Commission and MS agreed to roll-over the last approved NPs period 2011-2013 to the new period 2014-2016, there were actually no real need for a detailed discussion on coordination of NPs for the next year.
However, in order to check if the fisheries in 2012 had similar pattern as in previous years or whether there were significant changes to that pattern, the group performed a general overview of fishing activities in the Baltic Sea based on the ranking of métiers.
The results of métier ranking are provided in tables in an Annex 2, Appendix 1, Tables 1, 3, 5, 7, 9 and 11 show the ranking results for total effort, landings and values by metiers for subdivisions 22-24 and 25-32 respectively, based on National Programs 2011-2013, whereas Tables 2, 4, 6, 8, 10 and 12 in an Annex 2 appendix 1 show the ranking results for total effort, landings and values by metiers for subdivisions 22-24 and 25-32 respectively, based on 2012 data uploaded by MS in 2013 to the RDB.
It was expected that the outcome of the two ranking methods would not be identical and that there would be difference between the 2012 data uploaded to the RDB and the data in the NP, since they are based on different years. In SD 22-24 a total of 68 different métiers have been identified for 2012 and only 27 of them (40%) are covered by regional ranking. In SD 25-32 a total of 85 different métiers have been identified for 2012 and only 23 of them (27%) are covered by regional ranking. Furthermore, it has been found that the outcome of the present ranking approach is that several “small” métiers are selected due to effort. As the main purpose of the data collection is to provide data for the stock assessment work, the RCM Baltic considers that current analysis of métiers is not the best approach possible and regional approach to sampling design under the new DC-MAP is strongly advocated.
34
However, the comparison of ranking of metiers using the up to date effort, landings and values data for 2012 with the ranking based on the NP-s 2011-2013, enables to conclude that there are no substantial differences between metiers selected for sampling in NPs 2011-2013 and those selected regionally on the basis of most recent effort, landings and value data. Hence, the group concluded that there were no essential changes in the pattern of fishing activity in the Baltic Sea over the last years, except for natural fluctuations resulting from differences in fishing quotas levels and their spatial and temporal utilization between different MS.
Section 7 of this Report contains additional observations resulting from the analysis of métiers ranking.
4.3 Stock-related sampling
For the second year in a row, it was possible for the RCM Baltic to analyse and compare biological data collected by the MS in an efficient way. This could be performed since data had been uploaded to RDB prior to the meeting by all countries more or less completely. Also, it was an advantage to be able to reuse graphs from last year’s RCM. Overall, it is encouraging that data are available from an increasing number of countries. However, any changes in the fishing pattern and consequently the sampling, which could be an alternative explanation for the current situation, were not investigated. First, for year 2012 and the main species in the Baltic (cod, sprat and herring), the RCM Baltic investigated a) weight at age relationship and b) length at age relationship. Data were plotted in graphs and to facilitate the interpretation of the data quality it was plotted by SD and MS (Annex 2 Appendix 2, figures 1-3 and figures 4-6). Conclusions see section 4.3.1 below. Secondly, for cod in SD 25 and sprat in SD 28 respectively, we continued last year’s case studies, by comparing the 2011 data plots with the new 2012 data plots to try to follow up any changes in the patterns that were detected when analysing 2011 data. See section 4.3.2. Generally, when interpreting results from pooled data sets, one of the challenges is to control the eventual impact of differences in the sampling programmes regarding first overall design and thereafter time and space. Also, the fishing pattern of the fleet and gear used could be of importance. It was not possible to correct for all these factors here, however in the future, sampling information should be provided and has to be taken into account. If both possible and feasible, a standardisation of the sampling should be sought for in the region. In fact in RCM Baltic 2012, the lack of knowledge regarding the sampling design lead to that misleading conclusions regarding data quality were drawn for cod. The wrong interpretations that were made stated that there was not a good agreement in the age readings, since the weight at age relationship and length at age relationship respectively differed amongst the countries. E.g. data from Sweden stood out in comparison with the other countries, however the observed discrepancy was due to different sampling design, where Sweden applies a size category stratification method, and it was not due to a different interpretation in the age readings.
4.3.1 Conclusions from 2012 data sets
For cod, sprat and herring and the weight at age relationship and length at age relationship respectively, the RCM Baltic 2013 concluded the following from 2012 data: Cod - For the weight at age relationship there is quite a high variability overall in between the MS and especially in SD 25 and SD 26. In SD 22 and 24, the same holds for Age group 5 and older. The pattern was similar for the length at age relationship. As earlier pointed out (section 4.4), one explanation for an observed false discrepancy is the different sampling approaches in the countries’ national programmes. Sprat – Overall, there is a very good agreement among all MS in all SD for the length at age relationship. For the weight at age relationship the results are more variable, where e.g. data from SD 24 display a high variability. To be able to explain the results in detail, further investigations are needed. Herring – A good agreement in the length at age relationship is displayed for all MS in almost all SD. The agreement is less obvious in SD 26 and 28 and in SD 25, the results are incoherent. For the weight at age
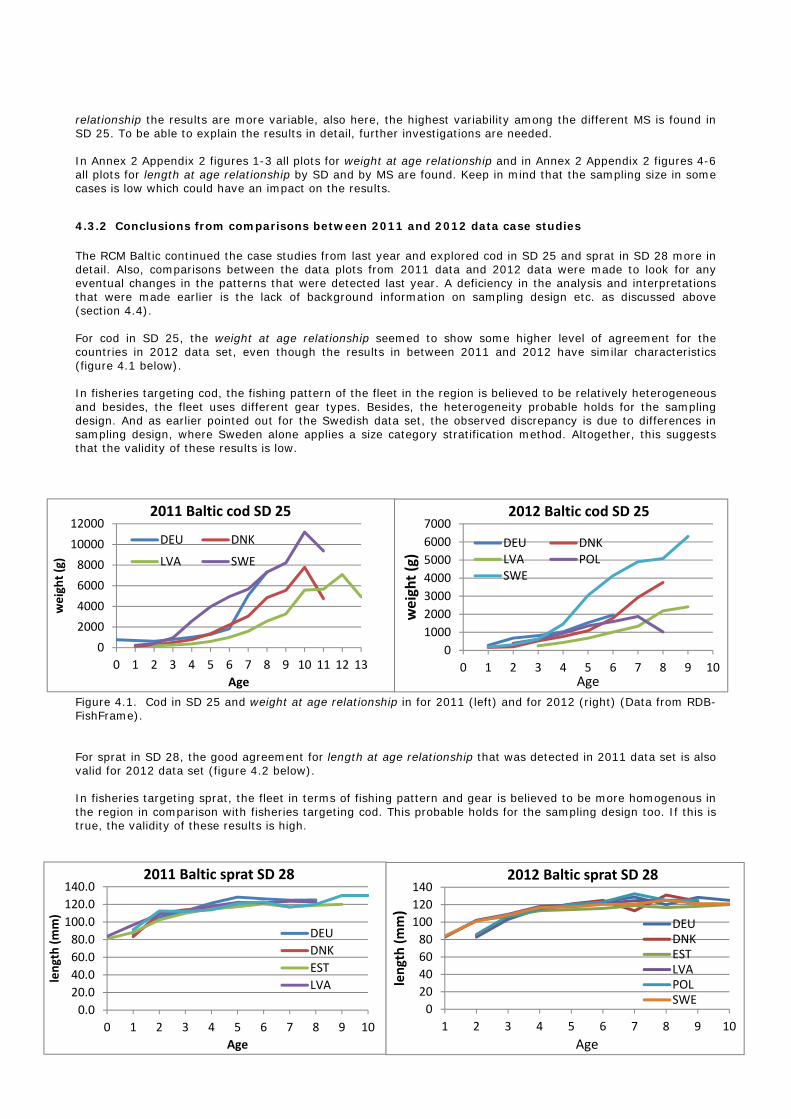
relationship the results are more variable, also here, the highest variability among the different MS is found in SD 25. To be able to explain the results in detail, further investigations are needed. In Annex 2 Appendix 2 figures 1-3 all plots for weight at age relationship and in Annex 2 Appendix 2 figures 4-6 all plots for length at age relationship by SD and by MS are found. Keep in mind that the sampling size in some cases is low which could have an impact on the results.
4.3.2 Conclusions from comparisons between 2011 and 2012 data case studies
The RCM Baltic continued the case studies from last year and explored cod in SD 25 and sprat in SD 28 more in detail. Also, comparisons between the data plots from 2011 data and 2012 data were made to look for any eventual changes in the patterns that were detected last year. A deficiency in the analysis and interpretations that were made earlier is the lack of background information on sampling design etc. as discussed above (section 4.4). For cod in SD 25, the weight at age relationship seemed to show some higher level of agreement for the countries in 2012 data set, even though the results in between 2011 and 2012 have similar characteristics (figure 4.1 below). In fisheries targeting cod, the fishing pattern of the fleet in the region is believed to be relatively heterogeneous and besides, the fleet uses different gear types. Besides, the heterogeneity probable holds for the sampling design. And as earlier pointed out for the Swedish data set, the observed discrepancy is due to differences in sampling design, where Sweden alone applies a size category stratification method. Altogether, this suggests that the validity of these results is low.
Figure 4.1. Cod in SD 25 and weight at age relationship in for 2011 (left) and for 2012 (right) (Data from RDB-FishFrame). For sprat in SD 28, the good agreement for length at age relationship that was detected in 2011 data set is also valid for 2012 data set (figure 4.2 below). In fisheries targeting sprat, the fleet in terms of fishing pattern and gear is believed to be more homogenous in the region in comparison with fisheries targeting cod. This probable holds for the sampling design too. If this is true, the validity of these results is high.
0
1000
2000
3000
4000
5000
6000
7000
0 1 2 3 4 5 6 7 8 9 10
weight (g)
Age
2012 Baltic cod SD 25
DEU DNKLVA POLSWE
0
2000
4000
6000
8000
10000
12000
0 1 2 3 4 5 6 7 8 9 10 11 12 13
weight (g)
Age
2011 Baltic cod SD 25
DEU DNK
LVA SWE
0.0
20.0
40.0
60.0
80.0
100.0
120.0
140.0
0 1 2 3 4 5 6 7 8 9 10
length (mm)
Age
2011 Baltic sprat SD 28
DEU
DNK
EST
LVA
0
20
40
60
80
100
120
140
1 2 3 4 5 6 7 8 9 10
length (mm)
Age
2012 Baltic sprat SD 28
DEUDNKESTLVAPOLSWE
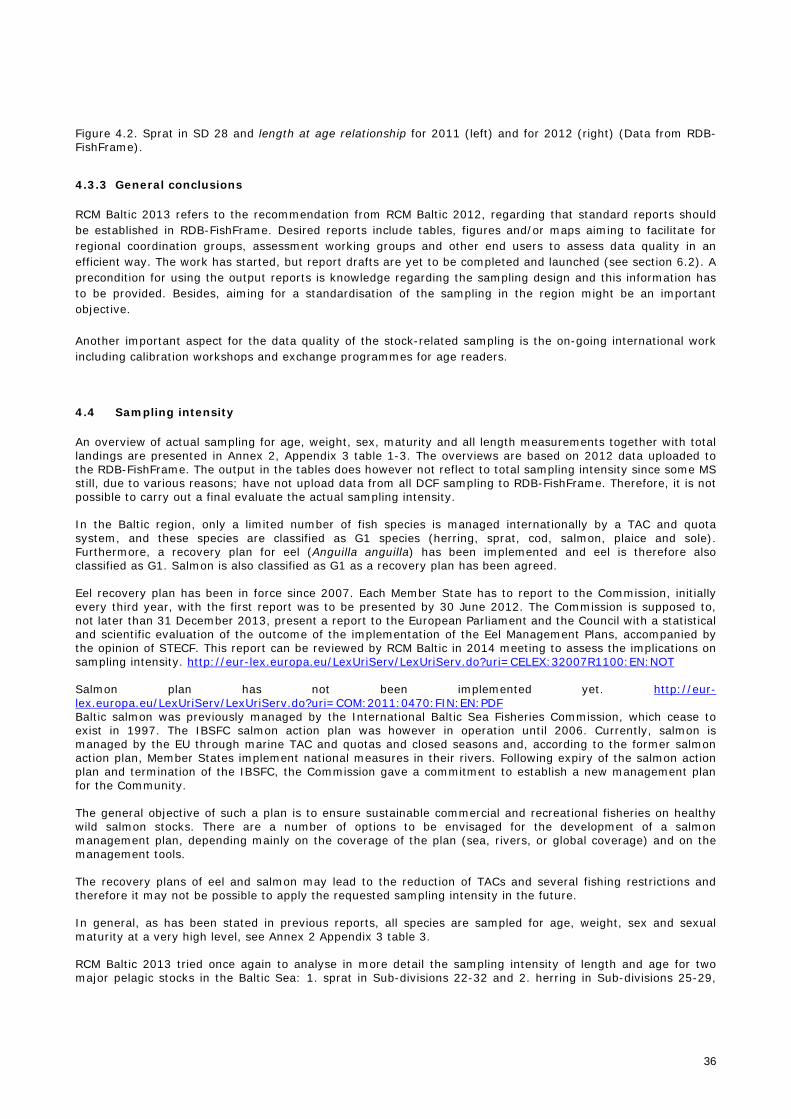
36
Figure 4.2. Sprat in SD 28 and length at age relationship for 2011 (left) and for 2012 (right) (Data from RDB-FishFrame).
4.3.3 General conclusions
RCM Baltic 2013 refers to the recommendation from RCM Baltic 2012, regarding that standard reports should be established in RDB-FishFrame. Desired reports include tables, figures and/or maps aiming to facilitate for regional coordination groups, assessment working groups and other end users to assess data quality in an efficient way. The work has started, but report drafts are yet to be completed and launched (see section 6.2). A precondition for using the output reports is knowledge regarding the sampling design and this information has to be provided. Besides, aiming for a standardisation of the sampling in the region might be an important objective. Another important aspect for the data quality of the stock-related sampling is the on-going international work including calibration workshops and exchange programmes for age readers.
4.4 Sampling intensity
An overview of actual sampling for age, weight, sex, maturity and all length measurements together with total landings are presented in Annex 2, Appendix 3 table 1-3. The overviews are based on 2012 data uploaded to the RDB-FishFrame. The output in the tables does however not reflect to total sampling intensity since some MS still, due to various reasons; have not upload data from all DCF sampling to RDB-FishFrame. Therefore, it is not possible to carry out a final evaluate the actual sampling intensity. In the Baltic region, only a limited number of fish species is managed internationally by a TAC and quota system, and these species are classified as G1 species (herring, sprat, cod, salmon, plaice and sole). Furthermore, a recovery plan for eel (Anguilla anguilla) has been implemented and eel is therefore also classified as G1. Salmon is also classified as G1 as a recovery plan has been agreed. Eel recovery plan has been in force since 2007. Each Member State has to report to the Commission, initially every third year, with the first report was to be presented by 30 June 2012. The Commission is supposed to, not later than 31 December 2013, present a report to the European Parliament and the Council with a statistical and scientific evaluation of the outcome of the implementation of the Eel Management Plans, accompanied by the opinion of STECF. This report can be reviewed by RCM Baltic in 2014 meeting to assess the implications on sampling intensity. http://eur-lex.europa.eu/LexUriServ/LexUriServ.do?uri=CELEX:32007R1100:EN:NOT Salmon plan has not been implemented yet. http://eur-lex.europa.eu/LexUriServ/LexUriServ.do?uri=COM:2011:0470:FIN:EN:PDF Baltic salmon was previously managed by the International Baltic Sea Fisheries Commission, which cease to exist in 1997. The IBSFC salmon action plan was however in operation until 2006. Currently, salmon is managed by the EU through marine TAC and quotas and closed seasons and, according to the former salmon action plan, Member States implement national measures in their rivers. Following expiry of the salmon action plan and termination of the IBSFC, the Commission gave a commitment to establish a new management plan for the Community. The general objective of such a plan is to ensure sustainable commercial and recreational fisheries on healthy wild salmon stocks. There are a number of options to be envisaged for the development of a salmon management plan, depending mainly on the coverage of the plan (sea, rivers, or global coverage) and on the management tools. The recovery plans of eel and salmon may lead to the reduction of TACs and several fishing restrictions and therefore it may not be possible to apply the requested sampling intensity in the future. In general, as has been stated in previous reports, all species are sampled for age, weight, sex and sexual maturity at a very high level, see Annex 2 Appendix 3 table 3. RCM Baltic 2013 tried once again to analyse in more detail the sampling intensity of length and age for two major pelagic stocks in the Baltic Sea: 1. sprat in Sub-divisions 22-32 and 2. herring in Sub-divisions 25-29,
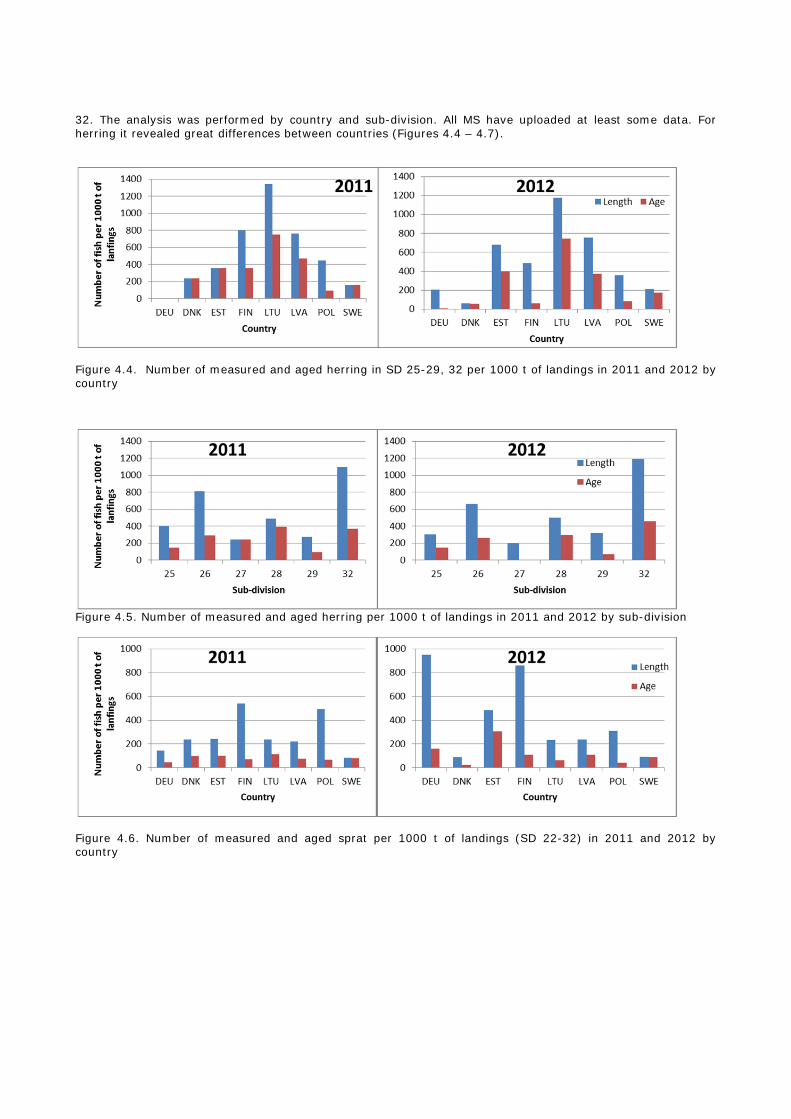
32. The analysis was performed by country and sub-division. All MS have uploaded at least some data. For herring it revealed great differences between countries (Figures 4.4 – 4.7).
Figure 4.4. Number of measured and aged herring in SD 25-29, 32 per 1000 t of landings in 2011 and 2012 by country
Figure 4.5. Number of measured and aged herring per 1000 t of landings in 2011 and 2012 by sub-division
Figure 4.6. Number of measured and aged sprat per 1000 t of landings (SD 22-32) in 2011 and 2012 by country
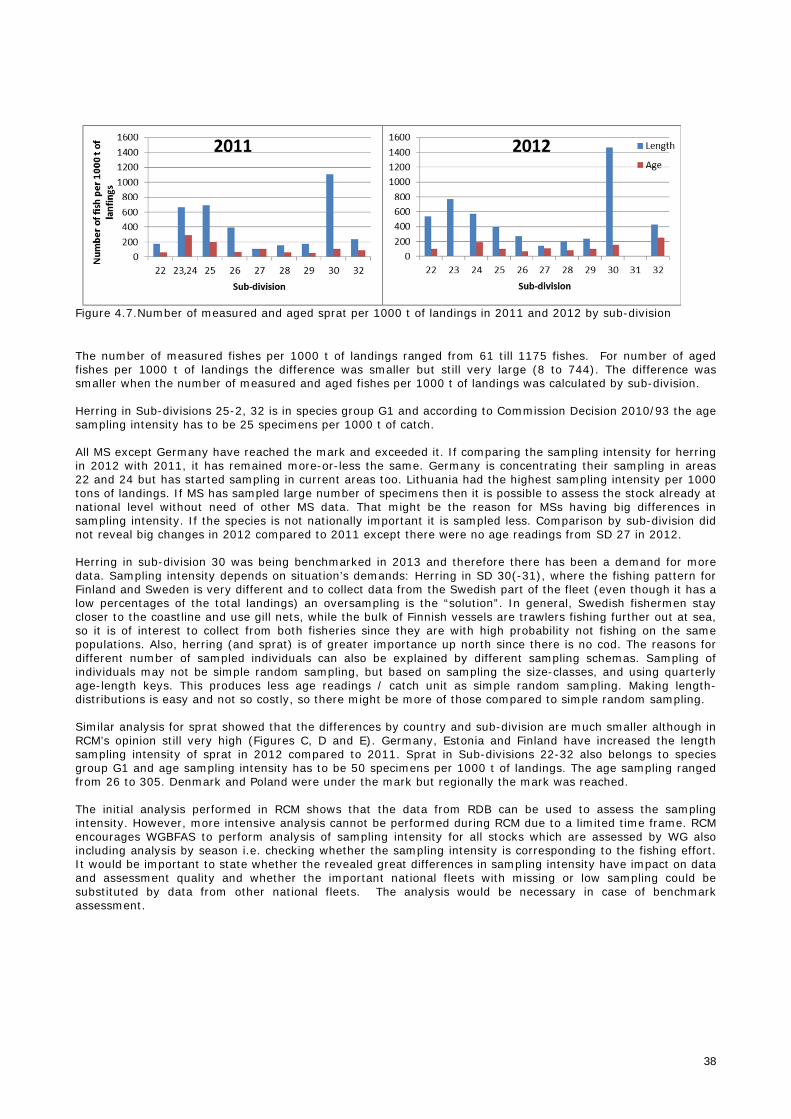
38
Figure 4.7.Number of measured and aged sprat per 1000 t of landings in 2011 and 2012 by sub-division
The number of measured fishes per 1000 t of landings ranged from 61 till 1175 fishes. For number of aged fishes per 1000 t of landings the difference was smaller but still very large (8 to 744). The difference was smaller when the number of measured and aged fishes per 1000 t of landings was calculated by sub-division. Herring in Sub-divisions 25-2, 32 is in species group G1 and according to Commission Decision 2010/93 the age sampling intensity has to be 25 specimens per 1000 t of catch. All MS except Germany have reached the mark and exceeded it. If comparing the sampling intensity for herring in 2012 with 2011, it has remained more-or-less the same. Germany is concentrating their sampling in areas 22 and 24 but has started sampling in current areas too. Lithuania had the highest sampling intensity per 1000 tons of landings. If MS has sampled large number of specimens then it is possible to assess the stock already at national level without need of other MS data. That might be the reason for MSs having big differences in sampling intensity. If the species is not nationally important it is sampled less. Comparison by sub-division did not reveal big changes in 2012 compared to 2011 except there were no age readings from SD 27 in 2012. Herring in sub-division 30 was being benchmarked in 2013 and therefore there has been a demand for more data. Sampling intensity depends on situation’s demands: Herring in SD 30(-31), where the fishing pattern for Finland and Sweden is very different and to collect data from the Swedish part of the fleet (even though it has a low percentages of the total landings) an oversampling is the “solution”. In general, Swedish fishermen stay closer to the coastline and use gill nets, while the bulk of Finnish vessels are trawlers fishing further out at sea, so it is of interest to collect from both fisheries since they are with high probability not fishing on the same populations. Also, herring (and sprat) is of greater importance up north since there is no cod. The reasons for different number of sampled individuals can also be explained by different sampling schemas. Sampling of individuals may not be simple random sampling, but based on sampling the size-classes, and using quarterly age-length keys. This produces less age readings / catch unit as simple random sampling. Making length-distributions is easy and not so costly, so there might be more of those compared to simple random sampling. Similar analysis for sprat showed that the differences by country and sub-division are much smaller although in RCM’s opinion still very high (Figures C, D and E). Germany, Estonia and Finland have increased the length sampling intensity of sprat in 2012 compared to 2011. Sprat in Sub-divisions 22-32 also belongs to species group G1 and age sampling intensity has to be 50 specimens per 1000 t of landings. The age sampling ranged from 26 to 305. Denmark and Poland were under the mark but regionally the mark was reached. The initial analysis performed in RCM shows that the data from RDB can be used to assess the sampling intensity. However, more intensive analysis cannot be performed during RCM due to a limited time frame. RCM encourages WGBFAS to perform analysis of sampling intensity for all stocks which are assessed by WG also including analysis by season i.e. checking whether the sampling intensity is corresponding to the fishing effort. It would be important to state whether the revealed great differences in sampling intensity have impact on data and assessment quality and whether the important national fleets with missing or low sampling could be substituted by data from other national fleets. The analysis would be necessary in case of benchmark assessment.
4.4.1 General conclusion
First, the standard reports from RDB should include all the tables and graphs presented in RCM reports making it easier for the RCM to start with the coordination and not spend meeting time compiling data (se section 6.2). Second point is that end users will more easily be able to conclude what data that is needed with help of this back ground information, which in turn will be useful for coordination purposes.
4.5 Task sharing for biological data
Task-sharing in terms of age determination and quality improvement could be reorganized to increase efficiency, as concluded by RCM Baltic 2011 and RCM Baltic 2012. At present, nearly all age readings of all species are done at each and every of the national institutes and only limited coordination and bilateral agreements regarding this issue have been put into place. Benefits with task sharing include the chance of reducing costs since a significant effort has to be put into maintenance of gained skills and into training of new staff. Also, when new species have to be dealt with, it becomes costly for the individual institutes to train personnel for age reading of possibly small volumes of age samples from these new species. As earlier pointed out, age readers from the involved institutes participate in the various age reading workshops organised by the ICES PGCCDBS, but it can be difficult for all institutes and nations to send staff overall. Harmonisation and calibration of the age readings of the different species are also achieved through age sample exchange exercises, but these are only carried out sporadically.
4.6 Coordination of biological sampling for stocks where the sum of MS having a share of quotas/landings less than 10%, but altogether exceeds 25%.
In order to ensure that all relevant stocks are covered in the NPs of the MS, the sampling schemes in all NPs were checked for the exemption rules in Decision 2010/93/EU. The way RCM Baltic has interpreted the rules are as follows: MS are not obliged to sample stocks with landings less than 200 tonnes or less than 10% of total landings. However, if those MS having landings below 10 % of total landings but all together having landings that sum up to more than 25 % of total landings agreement on which MS to sample the stocks have to be agreed. The landing figures from 2012 (instead of a three year average or quotas) were used for the calculations and we present them by stock and MS in Annex 2 Appendix 4 table 1, where data of landings were extracted from RDB-FishFrame. According to our analysis, none of the Baltic stocks exceeded 25 %, which also was the case for 2011 data. Note that the trend for two of the stocks is that they are approaching the 25% limit and therefore, it is of importance to continue monitoring the development. These stocks are Sprat in SD 22-32, which increased from 18% in 2011 to 23% 2012, and Cod in SD 25-32, which increased from 15% in 2011 to 21% 2012.
4.7 Sampling intensity for data limited stocks (DLS)
4.7.1 Definition DLS
In the latest ICES Data Limited Stocks (DLS) Guidance Report (ICES 2012) the following stocks in the Baltic region are listed as data limited:
Brill Scophthalmus rhombus SD 22-32
Dab Limanda limanda SD 22-32
Flounder Platichthys flesus SD 22-32
Herring Clupea harengus SD 31
Plaice Pleuronectes platessa SD 21-23 (SD 21 is not in the Baltic region)
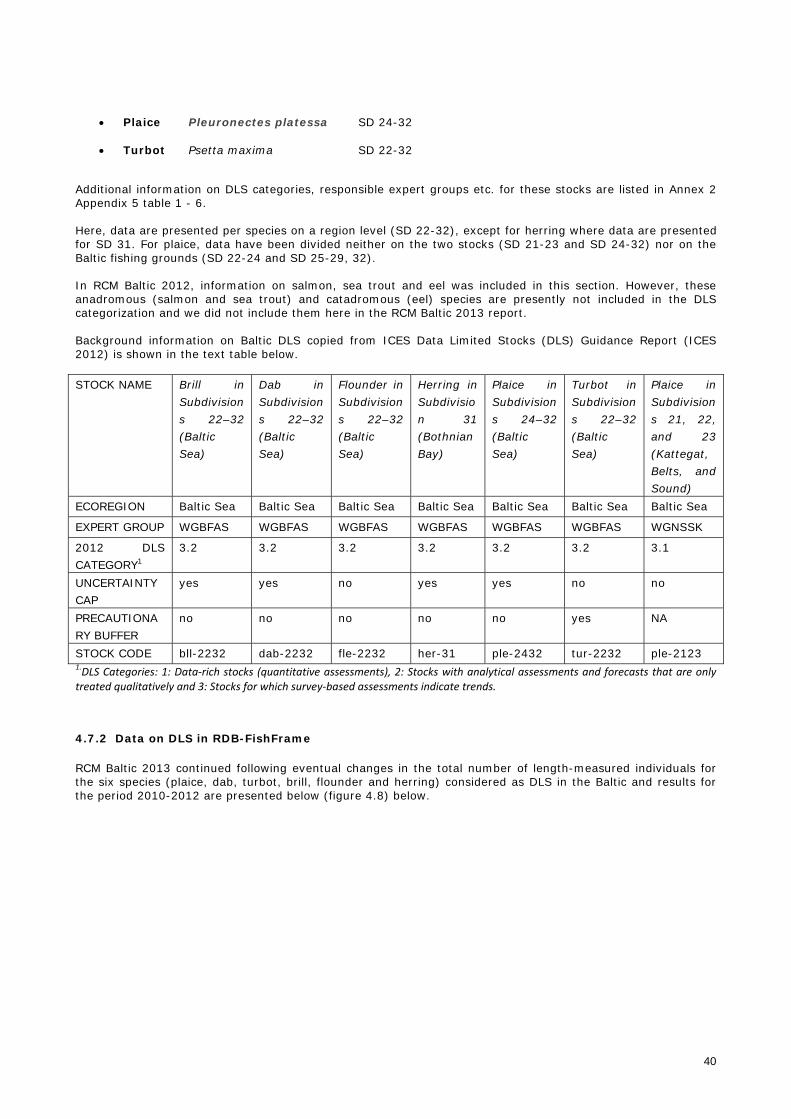
40
Plaice Pleuronectes platessa SD 24-32
Turbot Psetta maxima SD 22-32
Additional information on DLS categories, responsible expert groups etc. for these stocks are listed in Annex 2 Appendix 5 table 1 - 6. Here, data are presented per species on a region level (SD 22-32), except for herring where data are presented for SD 31. For plaice, data have been divided neither on the two stocks (SD 21-23 and SD 24-32) nor on the Baltic fishing grounds (SD 22-24 and SD 25-29, 32). In RCM Baltic 2012, information on salmon, sea trout and eel was included in this section. However, these anadromous (salmon and sea trout) and catadromous (eel) species are presently not included in the DLS categorization and we did not include them here in the RCM Baltic 2013 report. Background information on Baltic DLS copied from ICES Data Limited Stocks (DLS) Guidance Report (ICES 2012) is shown in the text table below. STOCK NAME Brill in
Subdivisions 22–32 (Baltic Sea)
Dab in Subdivisions 22–32 (Baltic Sea)
Flounder in Subdivisions 22–32 (Baltic Sea)
Herring in Subdivision 31 (Bothnian Bay)
Plaice in Subdivisions 24–32 (Baltic Sea)
Turbot in Subdivisions 22–32 (Baltic Sea)
Plaice in Subdivisions 21, 22, and 23 (Kattegat, Belts, and Sound)
ECOREGION Baltic Sea Baltic Sea Baltic Sea Baltic Sea Baltic Sea Baltic Sea Baltic Sea
EXPERT GROUP WGBFAS WGBFAS WGBFAS WGBFAS WGBFAS WGBFAS WGNSSK
2012 DLS CATEGORY1
3.2 3.2 3.2 3.2 3.2 3.2 3.1
UNCERTAINTY CAP
yes yes no yes yes no no
PRECAUTIONARY BUFFER
no no no no no yes NA
STOCK CODE bll-2232 dab-2232 fle-2232 her-31 ple-2432 tur-2232 ple-2123 1.DLS Categories: 1: Data‐rich stocks (quantitative assessments), 2: Stocks with analytical assessments and forecasts that are only treated qualitatively and 3: Stocks for which survey‐based assessments indicate trends.
4.7.2 Data on DLS in RDB-FishFrame
RCM Baltic 2013 continued following eventual changes in the total number of length-measured individuals for the six species (plaice, dab, turbot, brill, flounder and herring) considered as DLS in the Baltic and results for the period 2010-2012 are presented below (figure 4.8) below.
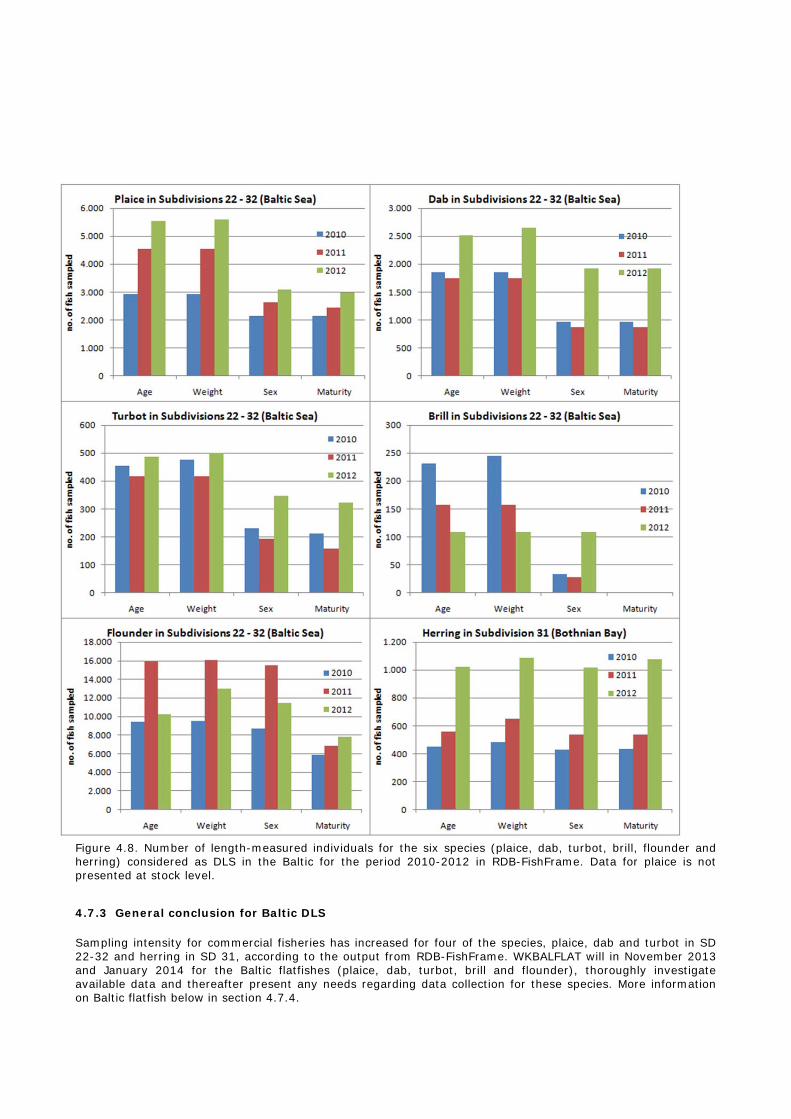
Figure 4.8. Number of length-measured individuals for the six species (plaice, dab, turbot, brill, flounder and herring) considered as DLS in the Baltic for the period 2010-2012 in RDB-FishFrame. Data for plaice is not presented at stock level.
4.7.3 General conclusion for Baltic DLS
Sampling intensity for commercial fisheries has increased for four of the species, plaice, dab and turbot in SD 22-32 and herring in SD 31, according to the output from RDB-FishFrame. WKBALFLAT will in November 2013 and January 2014 for the Baltic flatfishes (plaice, dab, turbot, brill and flounder), thoroughly investigate available data and thereafter present any needs regarding data collection for these species. More information on Baltic flatfish below in section 4.7.4.
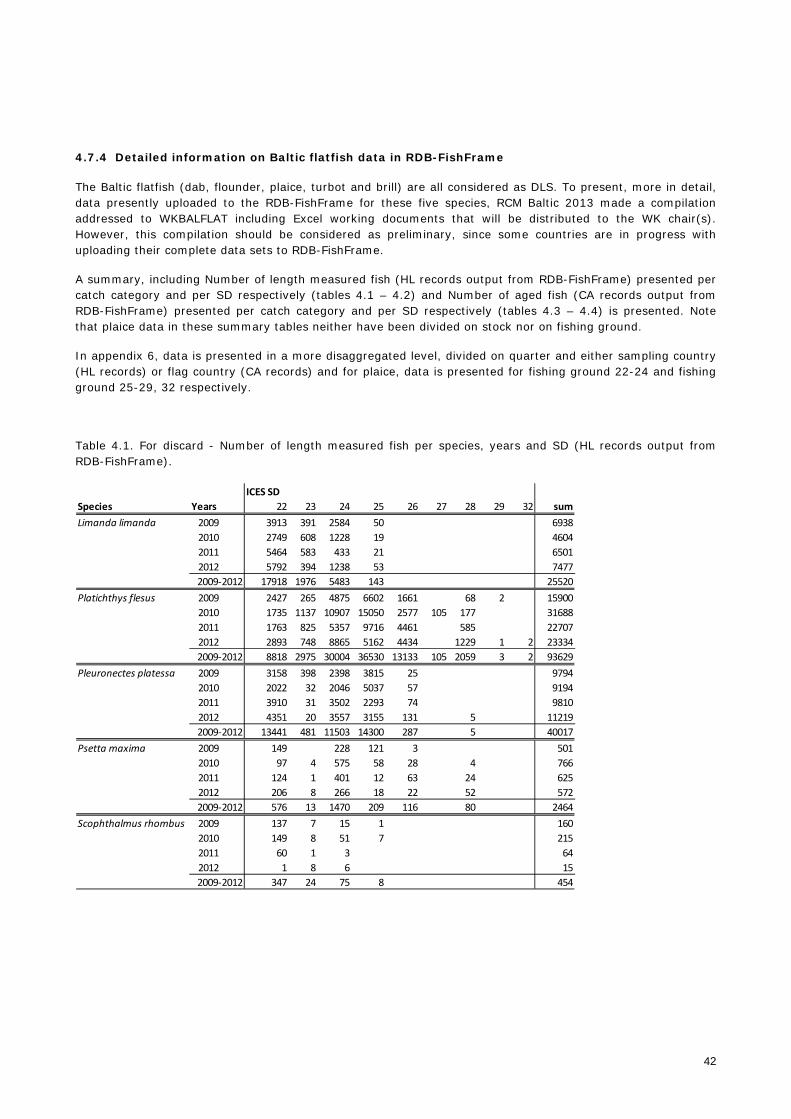
42
4.7.4 Detailed information on Baltic flatfish data in RDB-FishFrame
The Baltic flatfish (dab, flounder, plaice, turbot and brill) are all considered as DLS. To present, more in detail, data presently uploaded to the RDB-FishFrame for these five species, RCM Baltic 2013 made a compilation addressed to WKBALFLAT including Excel working documents that will be distributed to the WK chair(s). However, this compilation should be considered as preliminary, since some countries are in progress with uploading their complete data sets to RDB-FishFrame.
A summary, including Number of length measured fish (HL records output from RDB-FishFrame) presented per catch category and per SD respectively (tables 4.1 – 4.2) and Number of aged fish (CA records output from RDB-FishFrame) presented per catch category and per SD respectively (tables 4.3 – 4.4) is presented. Note that plaice data in these summary tables neither have been divided on stock nor on fishing ground.
In appendix 6, data is presented in a more disaggregated level, divided on quarter and either sampling country (HL records) or flag country (CA records) and for plaice, data is presented for fishing ground 22-24 and fishing ground 25-29, 32 respectively.
Table 4.1. For discard - Number of length measured fish per species, years and SD (HL records output from RDB-FishFrame).
ICES SD
Species Years 22 23 24 25 26 27 28 29 32 sum
Limanda limanda 2009 3913 391 2584 50 6938
2010 2749 608 1228 19 4604
2011 5464 583 433 21 6501
2012 5792 394 1238 53 7477
2009‐2012 17918 1976 5483 143 25520
Platichthys flesus 2009 2427 265 4875 6602 1661 68 2 15900
2010 1735 1137 10907 15050 2577 105 177 31688
2011 1763 825 5357 9716 4461 585 22707
2012 2893 748 8865 5162 4434 1229 1 2 23334
2009‐2012 8818 2975 30004 36530 13133 105 2059 3 2 93629
Pleuronectes platessa 2009 3158 398 2398 3815 25 9794
2010 2022 32 2046 5037 57 9194
2011 3910 31 3502 2293 74 9810
2012 4351 20 3557 3155 131 5 11219
2009‐2012 13441 481 11503 14300 287 5 40017
Psetta maxima 2009 149 228 121 3 501
2010 97 4 575 58 28 4 766
2011 124 1 401 12 63 24 625
2012 206 8 266 18 22 52 572
2009‐2012 576 13 1470 209 116 80 2464
Scophthalmus rhombus 2009 137 7 15 1 160
2010 149 8 51 7 215
2011 60 1 3 64
2012 1 8 6 15
2009‐2012 347 24 75 8 454
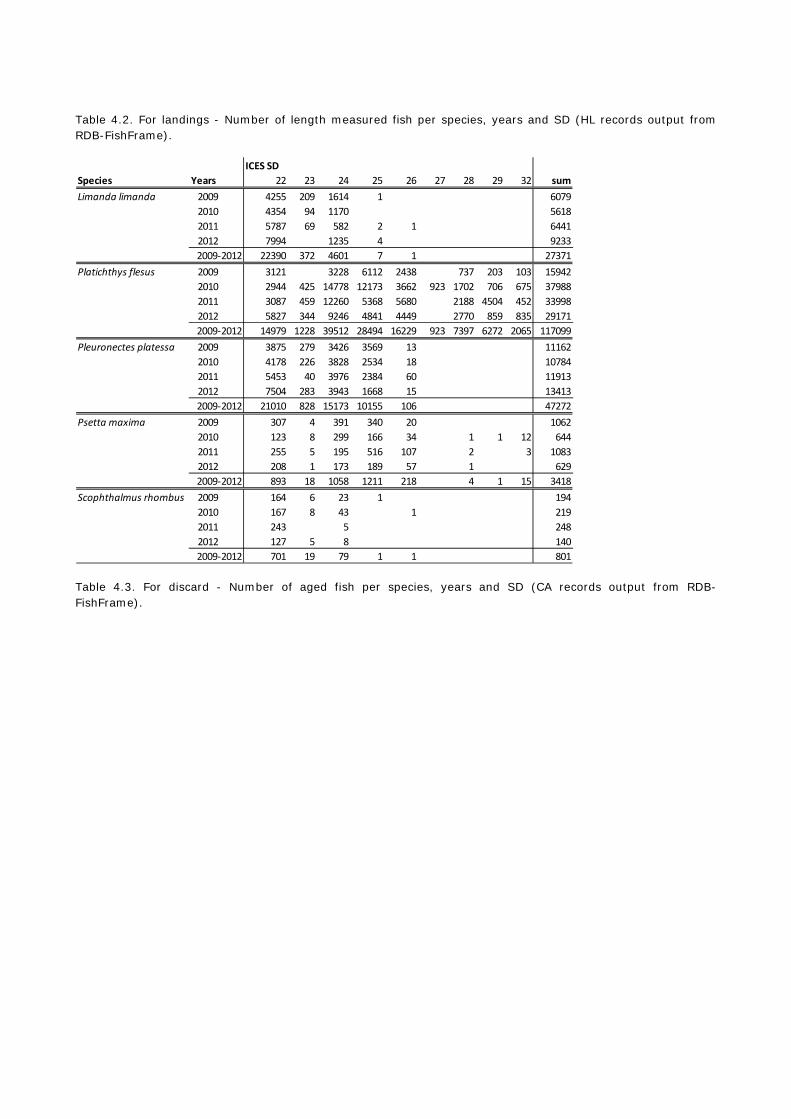
Table 4.2. For landings - Number of length measured fish per species, years and SD (HL records output from RDB-FishFrame).
Table 4.3. For discard - Number of aged fish per species, years and SD (CA records output from RDB-FishFrame).
ICES SD
Species Years 22 23 24 25 26 27 28 29 32 sum
Limanda limanda 2009 4255 209 1614 1 6079
2010 4354 94 1170 5618
2011 5787 69 582 2 1 6441
2012 7994 1235 4 9233
2009‐2012 22390 372 4601 7 1 27371
Platichthys flesus 2009 3121 3228 6112 2438 737 203 103 15942
2010 2944 425 14778 12173 3662 923 1702 706 675 37988
2011 3087 459 12260 5368 5680 2188 4504 452 33998
2012 5827 344 9246 4841 4449 2770 859 835 29171
2009‐2012 14979 1228 39512 28494 16229 923 7397 6272 2065 117099
Pleuronectes platessa 2009 3875 279 3426 3569 13 11162
2010 4178 226 3828 2534 18 10784
2011 5453 40 3976 2384 60 11913
2012 7504 283 3943 1668 15 13413
2009‐2012 21010 828 15173 10155 106 47272
Psetta maxima 2009 307 4 391 340 20 1062
2010 123 8 299 166 34 1 1 12 644
2011 255 5 195 516 107 2 3 1083
2012 208 1 173 189 57 1 629
2009‐2012 893 18 1058 1211 218 4 1 15 3418
Scophthalmus rhombus 2009 164 6 23 1 194
2010 167 8 43 1 219
2011 243 5 248
2012 127 5 8 140
2009‐2012 701 19 79 1 1 801
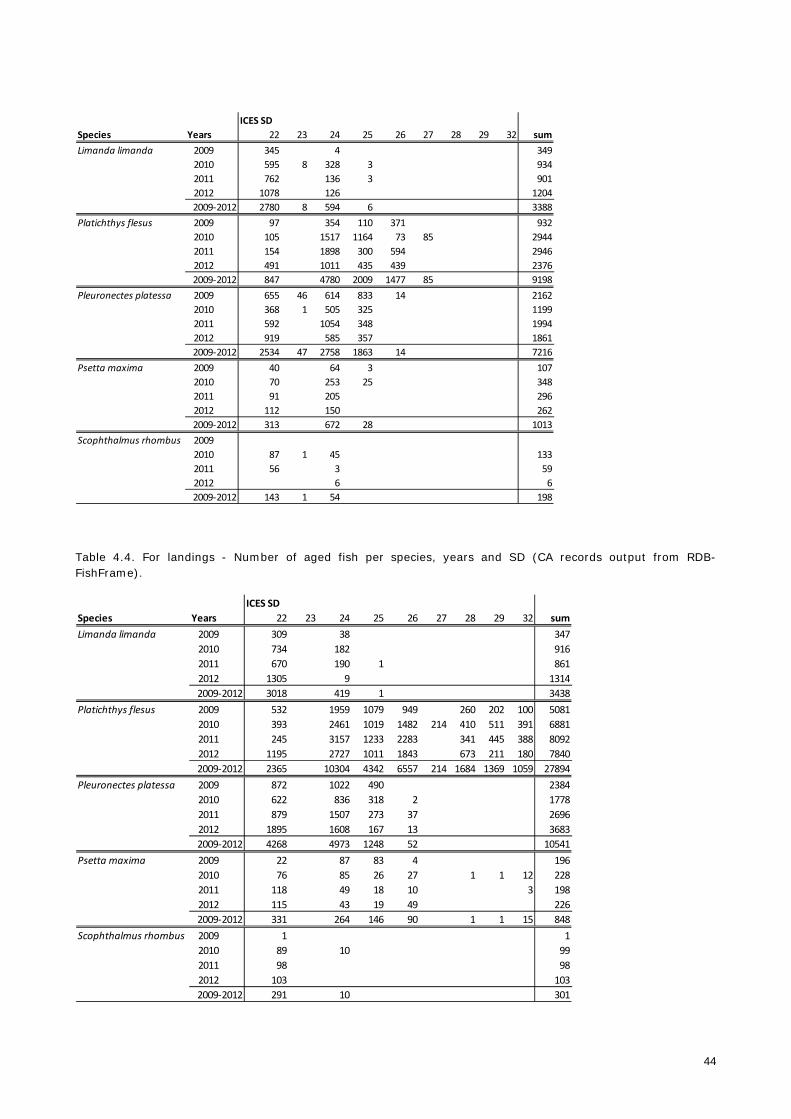
44
Table 4.4. For landings - Number of aged fish per species, years and SD (CA records output from RDB-FishFrame).
ICES SD
Species Years 22 23 24 25 26 27 28 29 32 sum
Limanda limanda 2009 345 4 349
2010 595 8 328 3 934
2011 762 136 3 901
2012 1078 126 1204
2009‐2012 2780 8 594 6 3388
Platichthys flesus 2009 97 354 110 371 932
2010 105 1517 1164 73 85 2944
2011 154 1898 300 594 2946
2012 491 1011 435 439 2376
2009‐2012 847 4780 2009 1477 85 9198
Pleuronectes platessa 2009 655 46 614 833 14 2162
2010 368 1 505 325 1199
2011 592 1054 348 1994
2012 919 585 357 1861
2009‐2012 2534 47 2758 1863 14 7216
Psetta maxima 2009 40 64 3 107
2010 70 253 25 348
2011 91 205 296
2012 112 150 262
2009‐2012 313 672 28 1013
Scophthalmus rhombus 2009
2010 87 1 45 133
2011 56 3 59
2012 6 6
2009‐2012 143 1 54 198
ICES SD
Species Years 22 23 24 25 26 27 28 29 32 sum
Limanda limanda 2009 309 38 347
2010 734 182 916
2011 670 190 1 861
2012 1305 9 1314
2009‐2012 3018 419 1 3438
Platichthys flesus 2009 532 1959 1079 949 260 202 100 5081
2010 393 2461 1019 1482 214 410 511 391 6881
2011 245 3157 1233 2283 341 445 388 8092
2012 1195 2727 1011 1843 673 211 180 7840
2009‐2012 2365 10304 4342 6557 214 1684 1369 1059 27894
Pleuronectes platessa 2009 872 1022 490 2384
2010 622 836 318 2 1778
2011 879 1507 273 37 2696
2012 1895 1608 167 13 3683
2009‐2012 4268 4973 1248 52 10541
Psetta maxima 2009 22 87 83 4 196
2010 76 85 26 27 1 1 12 228
2011 118 49 18 10 3 198
2012 115 43 19 49 226
2009‐2012 331 264 146 90 1 1 15 848
Scophthalmus rhombus 2009 1 1
2010 89 10 99
2011 98 98
2012 103 103
2009‐2012 291 10 301
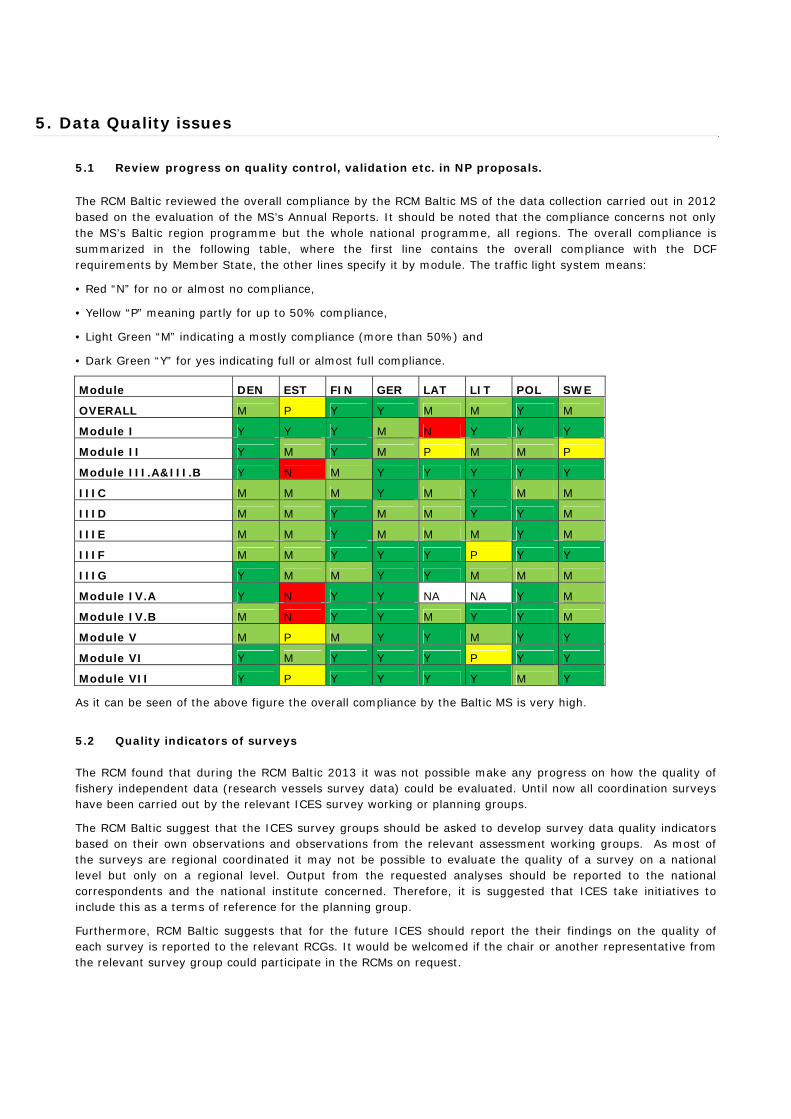
5. Data Quality issues
5.1 Review progress on quality control, validation etc. in NP proposals.
The RCM Baltic reviewed the overall compliance by the RCM Baltic MS of the data collection carried out in 2012 based on the evaluation of the MS’s Annual Reports. It should be noted that the compliance concerns not only the MS’s Baltic region programme but the whole national programme, all regions. The overall compliance is summarized in the following table, where the first line contains the overall compliance with the DCF requirements by Member State, the other lines specify it by module. The traffic light system means:
• Red “N” for no or almost no compliance,
• Yellow “P” meaning partly for up to 50% compliance,
• Light Green “M” indicating a mostly compliance (more than 50%) and
• Dark Green “Y” for yes indicating full or almost full compliance.
Module DEN EST FIN GER LAT LIT POL SWE
OVERALL M P Y Y M M Y M
Module I Y Y Y M N Y Y Y
Module II Y M Y M P M M P
Module III.A&III.B Y N M Y Y Y Y Y
IIIC M M M Y M Y M M
IIID M M Y M M Y Y M
IIIE M M Y M M M Y M
IIIF M M Y Y Y P Y Y
IIIG Y M M Y Y M M M
Module IV.A Y N Y Y NA NA Y M
Module IV.B M N Y Y M Y Y M
Module V M P M Y Y M Y Y
Module VI Y M Y Y Y P Y Y
Module VII Y P Y Y Y Y M Y
As it can be seen of the above figure the overall compliance by the Baltic MS is very high.
5.2 Quality indicators of surveys
The RCM found that during the RCM Baltic 2013 it was not possible make any progress on how the quality of fishery independent data (research vessels survey data) could be evaluated. Until now all coordination surveys have been carried out by the relevant ICES survey working or planning groups.
The RCM Baltic suggest that the ICES survey groups should be asked to develop survey data quality indicators based on their own observations and observations from the relevant assessment working groups. As most of the surveys are regional coordinated it may not be possible to evaluate the quality of a survey on a national level but only on a regional level. Output from the requested analyses should be reported to the national correspondents and the national institute concerned. Therefore, it is suggested that ICES take initiatives to include this as a terms of reference for the planning group.
Furthermore, RCM Baltic suggests that for the future ICES should report the their findings on the quality of each survey is reported to the relevant RCGs. It would be welcomed if the chair or another representative from the relevant survey group could participate in the RCMs on request.
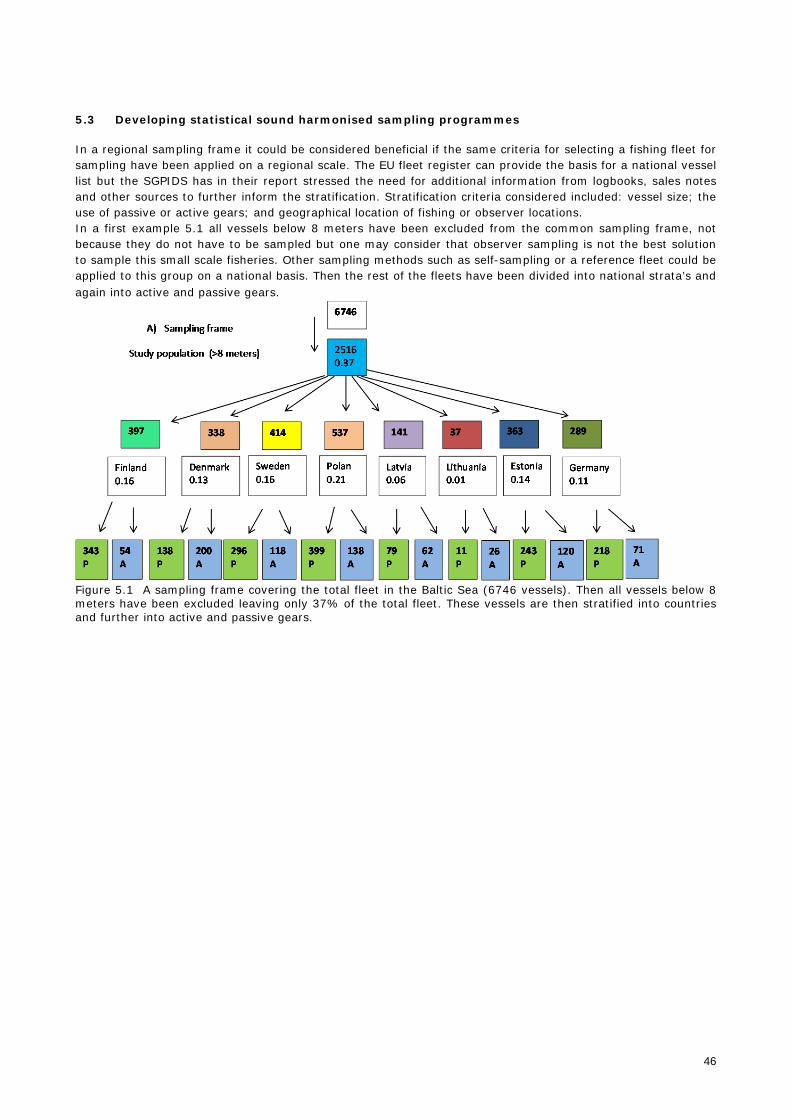
46
5.3 Developing statistical sound harmonised sampling programmes
In a regional sampling frame it could be considered beneficial if the same criteria for selecting a fishing fleet for sampling have been applied on a regional scale. The EU fleet register can provide the basis for a national vessel list but the SGPIDS has in their report stressed the need for additional information from logbooks, sales notes and other sources to further inform the stratification. Stratification criteria considered included: vessel size; the use of passive or active gears; and geographical location of fishing or observer locations. In a first example 5.1 all vessels below 8 meters have been excluded from the common sampling frame, not because they do not have to be sampled but one may consider that observer sampling is not the best solution to sample this small scale fisheries. Other sampling methods such as self-sampling or a reference fleet could be applied to this group on a national basis. Then the rest of the fleets have been divided into national strata’s and again into active and passive gears.
Figure 5.1 A sampling frame covering the total fleet in the Baltic Sea (6746 vessels). Then all vessels below 8 meters have been excluded leaving only 37% of the total fleet. These vessels are then stratified into countries and further into active and passive gears.
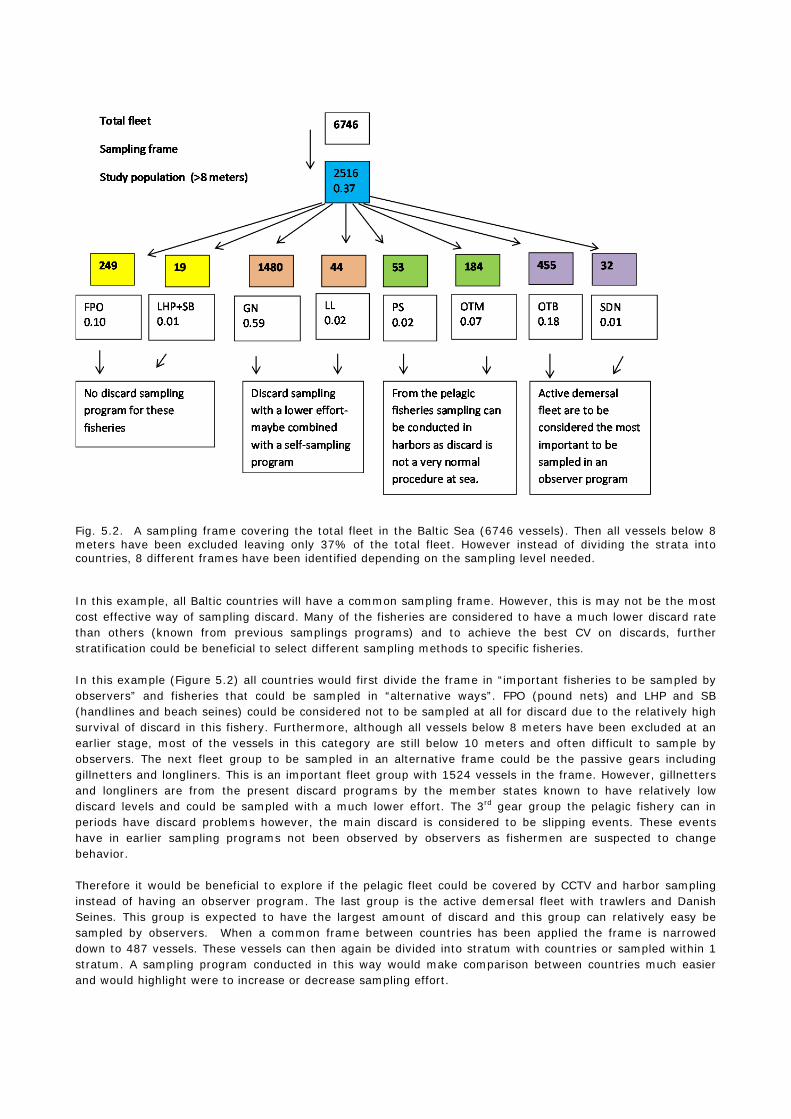
Fig. 5.2. A sampling frame covering the total fleet in the Baltic Sea (6746 vessels). Then all vessels below 8 meters have been excluded leaving only 37% of the total fleet. However instead of dividing the strata into countries, 8 different frames have been identified depending on the sampling level needed. In this example, all Baltic countries will have a common sampling frame. However, this is may not be the most cost effective way of sampling discard. Many of the fisheries are considered to have a much lower discard rate than others (known from previous samplings programs) and to achieve the best CV on discards, further stratification could be beneficial to select different sampling methods to specific fisheries. In this example (Figure 5.2) all countries would first divide the frame in “important fisheries to be sampled by observers” and fisheries that could be sampled in “alternative ways”. FPO (pound nets) and LHP and SB (handlines and beach seines) could be considered not to be sampled at all for discard due to the relatively high survival of discard in this fishery. Furthermore, although all vessels below 8 meters have been excluded at an earlier stage, most of the vessels in this category are still below 10 meters and often difficult to sample by observers. The next fleet group to be sampled in an alternative frame could be the passive gears including gillnetters and longliners. This is an important fleet group with 1524 vessels in the frame. However, gillnetters and longliners are from the present discard programs by the member states known to have relatively low discard levels and could be sampled with a much lower effort. The 3rd gear group the pelagic fishery can in periods have discard problems however, the main discard is considered to be slipping events. These events have in earlier sampling programs not been observed by observers as fishermen are suspected to change behavior. Therefore it would be beneficial to explore if the pelagic fleet could be covered by CCTV and harbor sampling instead of having an observer program. The last group is the active demersal fleet with trawlers and Danish Seines. This group is expected to have the largest amount of discard and this group can relatively easy be sampled by observers. When a common frame between countries has been applied the frame is narrowed down to 487 vessels. These vessels can then again be divided into stratum with countries or sampled within 1 stratum. A sampling program conducted in this way would make comparison between countries much easier and would highlight were to increase or decrease sampling effort.
48
In order to test whether regional sampling schemes can be implemented for the Baltic Sea it is recommended to test the process from end-user participation to defining data needs and designing a regional sampling scheme is carried out during the roll-over years 2014-2015.
Towards a regional sampling scheme
RCM Baltic 2013 Recommendation 3
RCM recommends that a test on the process from end-user participation to defining data needs and designing a regional sampling scheme is carried out during the roll-over years 2014-2015.
Justification Before adapting a full regional data collection approach, experience needs to be gained on the future process.
Follow-up actions needed Commission to initiate and steer the process
Responsible persons for follow-up actions
Commission and RCMs
Time frame (Deadline) 2014-2015
5.4 Approaches to evaluate the performance of national discard sampling programmes
A robust evaluation of the spatio-temporal overlap between commercial catches and scientific samples is a key element for data quality insurance issues (e.g. within a national laboratory, for the assessment working groups, and for the European Commission when evaluating the Annual Reports). To assess the temporal coverage of the national sampling schemes, the monthly landing weights were plotted by country for different fish stocks and years. The landing weights were then compared with the number of sampling trips by country and fish stock. An overview showing the number of commercial fishing trips (based on CE-records overview 2012), the number of realized sampling trips at sea, the proportion of sampled trips of all commercial trips (%S/C) and number of planned trips according to the National Programme by métier and country for the western Baltic Sea (subdivisions 22-24) in 2012 and for the eastern Baltic Sea in 2012 is given in Annex 2 Appendix 3 table 1 and table 2.. To assess the spatial coverage of the national sampling schemes, the total annual landing weights by ICES subdivision and country were compared with the number of sampling trips by country for a fish stock. Figure 5.3 and figure 5.4 is showing monthly landings of Western Baltic cod (SD 22-24) and Eastern Baltic cod (SD 25-32) respectively in 2012 from all métiers and number of sampled trips. Figure 5.5 is showing monthly landings of Baltic sprat in 2012 from all métiers and number of sampled trips.
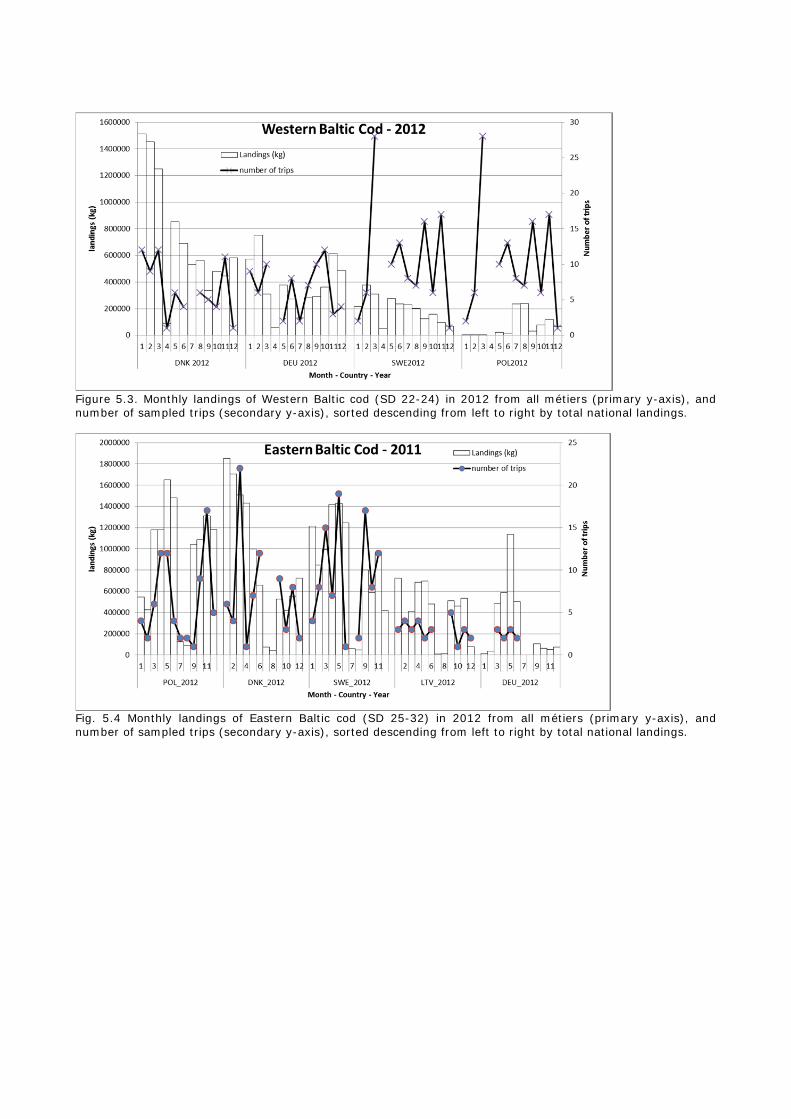
Figure 5.3. Monthly landings of Western Baltic cod (SD 22-24) in 2012 from all métiers (primary y-axis), and number of sampled trips (secondary y-axis), sorted descending from left to right by total national landings.
Fig. 5.4 Monthly landings of Eastern Baltic cod (SD 25-32) in 2012 from all métiers (primary y-axis), and number of sampled trips (secondary y-axis), sorted descending from left to right by total national landings.

50
Fig. 5.5 Landings of Sprat (SD 22-32) by ICES Sub-Division in 2012 from all métiers (primary y-axis), and number of sampled trips (secondary y-axis), sorted descending from left to right by total national landings. The graphs produced for cod of the Western and Eastern Baltic Sea (temporal coverage) and Baltic sprat (spatial coverage) show that these graphs are theoretically very useful as diagnostics to identify e.g. gaps in sampling, oversampling or undersampling within a country and effort comparison between countries. However, at present the term “trip” is presently not defined as an unique value in the RDB), indicating that “trip” may contain information from different sampling units, e.g. a true sampled fishing trip by observers, a sampled haul (within a fishing trip), a self-sampling haul or a box (in case of harbor sampling). The use of the term “trip” differs between countries and therefore, at present the sampling performance of the different countries cannot be reasonably compared. The RDB has to account for the different sources of the samples (i.e. at-sea sampling, self-sampling, market sampling) and for the different sampling categories used by the countries (i.e. number of trips, number of hauls, the number of boxes, the number of vessels whose boxes were sampled in the harbor). To allow immediate control of and the possibility to double-check the uploaded data by member state, we suggest that the following types of graphs are produced by default from the RDB after successful upload (for the stocks sampled by the country): For at-sea sampling (optionally including self-sampling):
Landings by month vs. number of trips by country and stock (temporal coverage) Landings by month vs. number of age readings by country and stock (temporal coverage) Landings by ICES subdivision vs. number of trips by country and stock (spatial coverage) Landings by ICES subdivision vs. number of age readings by country and stock (spatial coverage)
The landings (from logbooks) are reported on a monthly basis whereas some countries may perform their national sampling on a quarterly basis because assessment data (CANUM, WECA, etc.) are submitted on a quarterly basis. Data on the spatial coverage may also be collected only on a quarterly basis (InterCatch). Yet, to ensure the best spatio-temporal distribution and overlap between landing data and sampling data, affected countries may try to report their sampling on a monthly basis. We highlight that good spatial coverage (on Sub-division basis) is of great importance for fish stocks such as Central Baltic herring (SD 25-29, 32) due to its complicated population structure, but evidently is important also for other stocks. It is also important that subdivision 28 is divided in 28.1 and 28.2 so that the two herring management units can be distinguished. For harbor sampling (with the same concerns as for at-sea sampling):
Landings by month vs. number of trips by country and stock (temporal coverage)
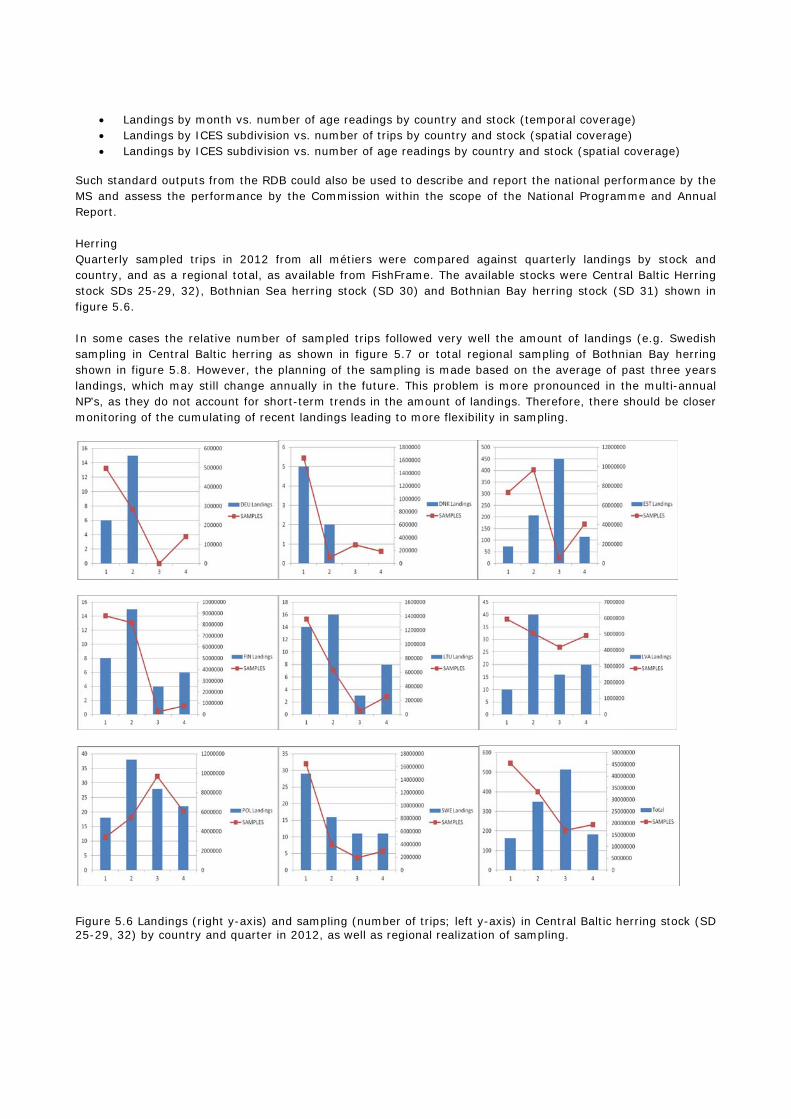
Landings by month vs. number of age readings by country and stock (temporal coverage) Landings by ICES subdivision vs. number of trips by country and stock (spatial coverage) Landings by ICES subdivision vs. number of age readings by country and stock (spatial coverage)
Such standard outputs from the RDB could also be used to describe and report the national performance by the MS and assess the performance by the Commission within the scope of the National Programme and Annual Report. Herring Quarterly sampled trips in 2012 from all métiers were compared against quarterly landings by stock and country, and as a regional total, as available from FishFrame. The available stocks were Central Baltic Herring stock SDs 25-29, 32), Bothnian Sea herring stock (SD 30) and Bothnian Bay herring stock (SD 31) shown in figure 5.6. In some cases the relative number of sampled trips followed very well the amount of landings (e.g. Swedish sampling in Central Baltic herring as shown in figure 5.7 or total regional sampling of Bothnian Bay herring shown in figure 5.8. However, the planning of the sampling is made based on the average of past three years landings, which may still change annually in the future. This problem is more pronounced in the multi-annual NP’s, as they do not account for short-term trends in the amount of landings. Therefore, there should be closer monitoring of the cumulating of recent landings leading to more flexibility in sampling.
Figure 5.6 Landings (right y-axis) and sampling (number of trips; left y-axis) in Central Baltic herring stock (SD 25-29, 32) by country and quarter in 2012, as well as regional realization of sampling.
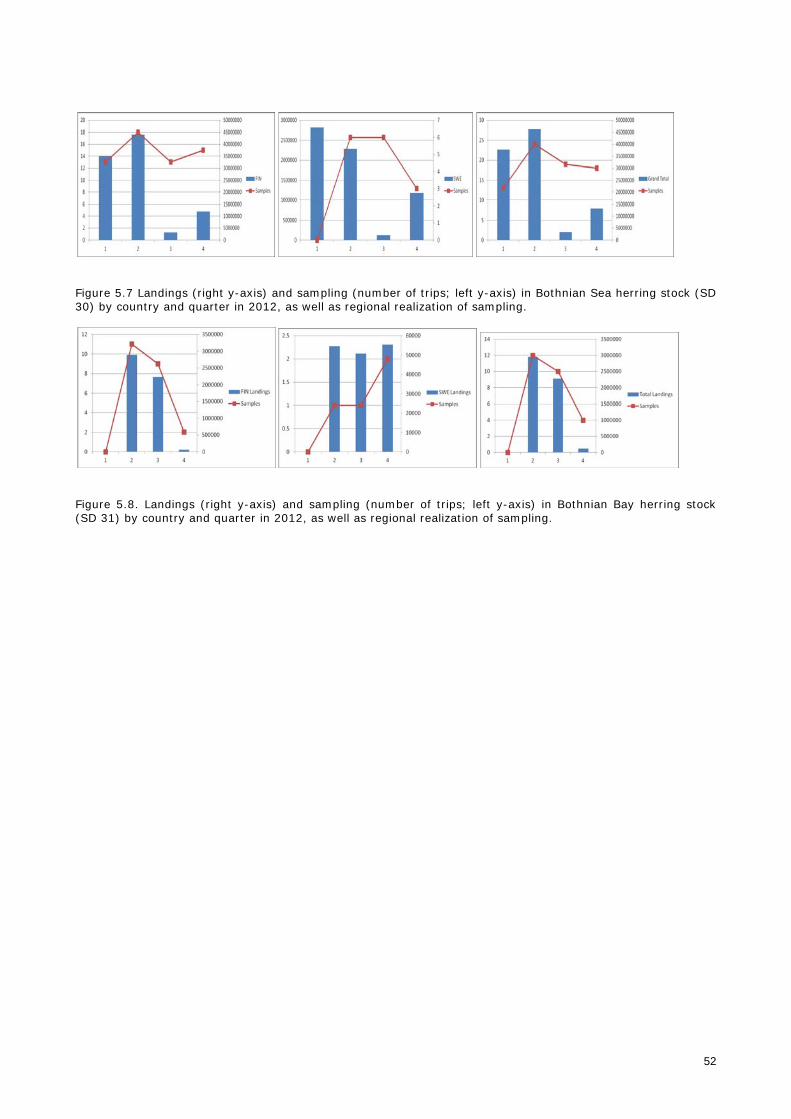
52
Figure 5.7 Landings (right y-axis) and sampling (number of trips; left y-axis) in Bothnian Sea herring stock (SD 30) by country and quarter in 2012, as well as regional realization of sampling.
Figure 5.8. Landings (right y-axis) and sampling (number of trips; left y-axis) in Bothnian Bay herring stock (SD 31) by country and quarter in 2012, as well as regional realization of sampling.
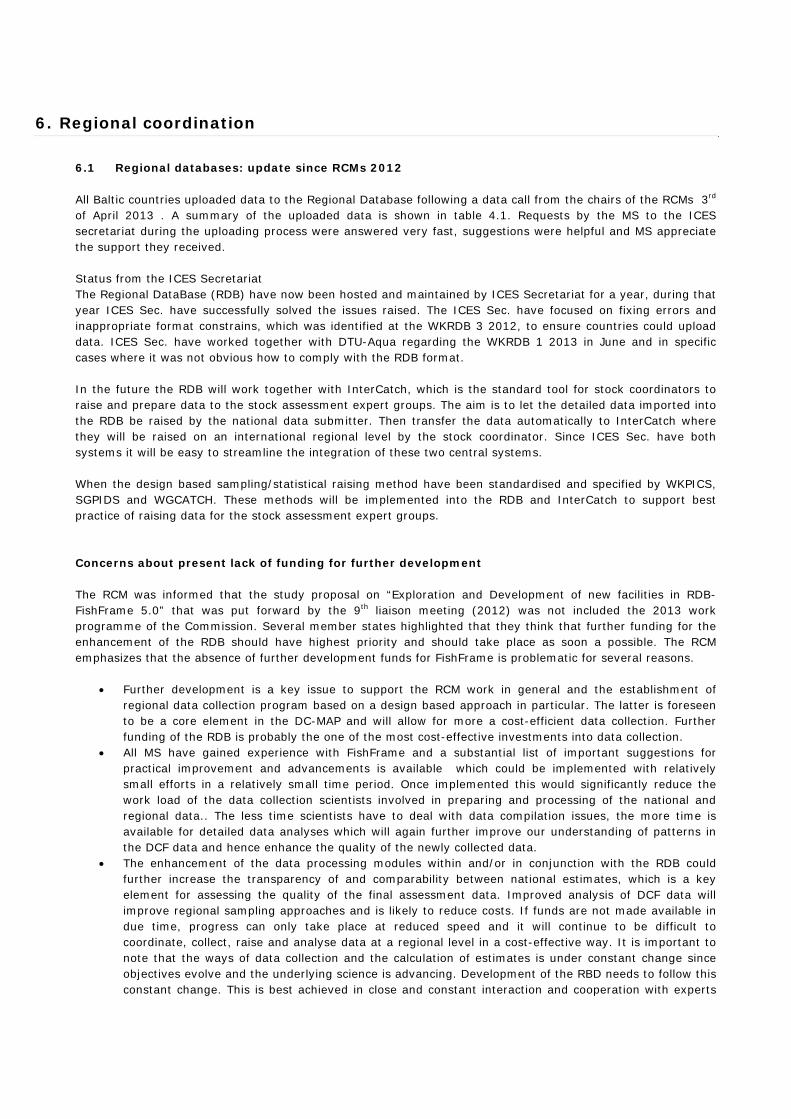
6. Regional coordination
6.1 Regional databases: update since RCMs 2012
All Baltic countries uploaded data to the Regional Database following a data call from the chairs of the RCMs 3rd
of April 2013 . A summary of the uploaded data is shown in table 4.1. Requests by the MS to the ICES secretariat during the uploading process were answered very fast, suggestions were helpful and MS appreciate the support they received. Status from the ICES Secretariat The Regional DataBase (RDB) have now been hosted and maintained by ICES Secretariat for a year, during that year ICES Sec. have successfully solved the issues raised. The ICES Sec. have focused on fixing errors and inappropriate format constrains, which was identified at the WKRDB 3 2012, to ensure countries could upload data. ICES Sec. have worked together with DTU-Aqua regarding the WKRDB 1 2013 in June and in specific cases where it was not obvious how to comply with the RDB format. In the future the RDB will work together with InterCatch, which is the standard tool for stock coordinators to raise and prepare data to the stock assessment expert groups. The aim is to let the detailed data imported into the RDB be raised by the national data submitter. Then transfer the data automatically to InterCatch where they will be raised on an international regional level by the stock coordinator. Since ICES Sec. have both systems it will be easy to streamline the integration of these two central systems. When the design based sampling/statistical raising method have been standardised and specified by WKPICS, SGPIDS and WGCATCH. These methods will be implemented into the RDB and InterCatch to support best practice of raising data for the stock assessment expert groups. Concerns about present lack of funding for further development The RCM was informed that the study proposal on “Exploration and Development of new facilities in RDB-FishFrame 5.0” that was put forward by the 9th liaison meeting (2012) was not included the 2013 work programme of the Commission. Several member states highlighted that they think that further funding for the enhancement of the RDB should have highest priority and should take place as soon a possible. The RCM emphasizes that the absence of further development funds for FishFrame is problematic for several reasons.
Further development is a key issue to support the RCM work in general and the establishment of regional data collection program based on a design based approach in particular. The latter is foreseen to be a core element in the DC-MAP and will allow for more a cost-efficient data collection. Further funding of the RDB is probably the one of the most cost-effective investments into data collection.
All MS have gained experience with FishFrame and a substantial list of important suggestions for practical improvement and advancements is available which could be implemented with relatively small efforts in a relatively small time period. Once implemented this would significantly reduce the work load of the data collection scientists involved in preparing and processing of the national and regional data.. The less time scientists have to deal with data compilation issues, the more time is available for detailed data analyses which will again further improve our understanding of patterns in the DCF data and hence enhance the quality of the newly collected data.
The enhancement of the data processing modules within and/or in conjunction with the RDB could further increase the transparency of and comparability between national estimates, which is a key element for assessing the quality of the final assessment data. Improved analysis of DCF data will improve regional sampling approaches and is likely to reduce costs. If funds are not made available in due time, progress can only take place at reduced speed and it will continue to be difficult to coordinate, collect, raise and analyse data at a regional level in a cost-effective way. It is important to note that the ways of data collection and the calculation of estimates is under constant change since objectives evolve and the underlying science is advancing. Development of the RBD needs to follow this constant change. This is best achieved in close and constant interaction and cooperation with experts
54
on design of data collection programs, data collectors and end-users. There are foreseen changes in the data collection legislation; the metier-based approach (ad-hoc sampling) will be replaced by a design-based approach (randomized sampling) and it is of vital importance that the RDB can meet the new requirements. Otherwise we risk loosing the present momentum towards more regionalized design-based data collection programs.
It is particular important that the development process interacts with expert groups dealing with a design-based regional data collection approach should be implemented (including e.g. the estimation processes). ICES expert groups, in particular WKPICS2 (ICES 2012) and SGPIDS (ICES 2013) have given the RDB-SC important guidance on how the RDB will need to be further developed to meet the new standards. The PGCCDBS recently suggested the expert working group WGCATCH which should provide advice and support in documenting, developing, implementing and using the data collected from statistically sound catch sampling schemes. WGCATCH may also provide a forum for the further enhancement of the RDB. RCM Baltic strongly recommends that funding is found to ensure further development and improvement of the RDB “FishFrame”. The most urgent needs for development needs are found in the study proposal supported by the liaison meeting 2012. A updated version of the study proposal is included in section 9.
Regional data base
RCM Baltic 2013
Recommendation
RCM Baltic strongly recommends that funding is found to ensure further development and improvement of the RDB “FishFrame”.
Follow‐up actions needed DG MARE
Responsible persons for follow‐
up actions
Liaison meeting
Time frame (Deadline) Funding should be made available as soon as possible
6.2 Proposal for standard reports in the RDB-FishFrame
During the RCM Baltic meeting a number of pivot tables were made. In order to standardize and for the data quality assurance it is suggested that the RDB Steering Committee based in input from the RCM and other data end user prioritize reports to be implemented in the RDB as soon as possible. List of suggested report made by the RCM Baltic is listed below.
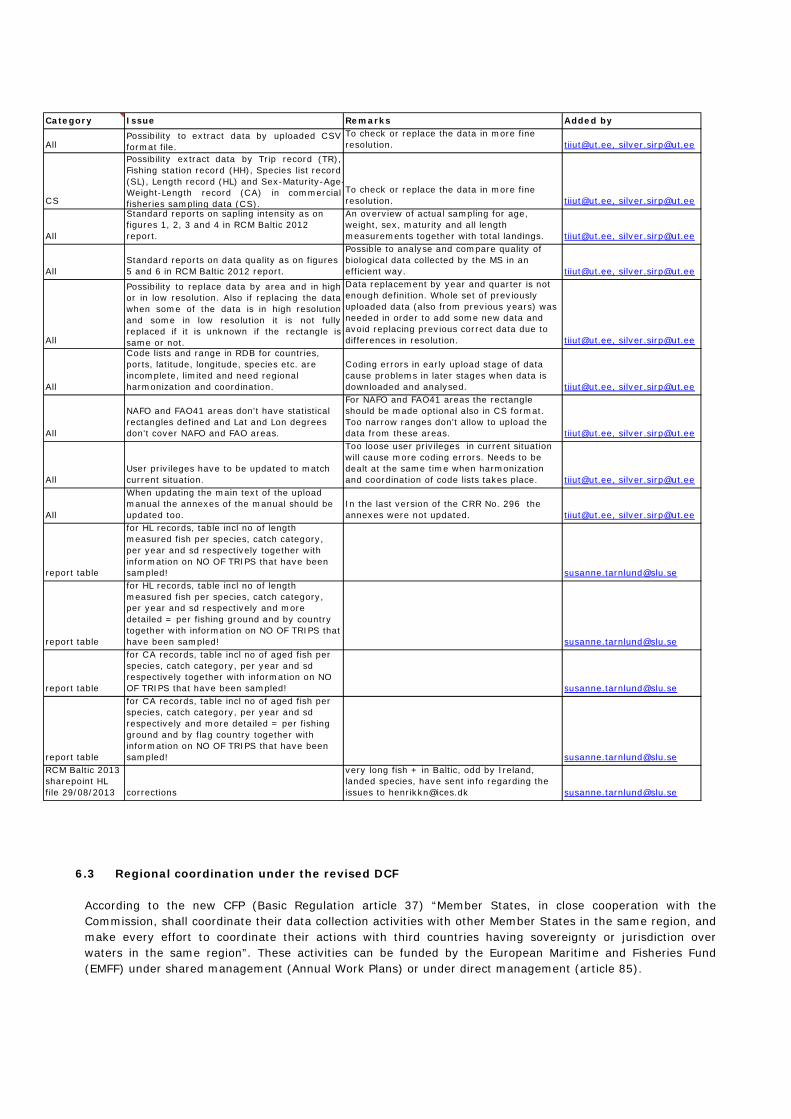
6.3 Regional coordination under the revised DCF
According to the new CFP (Basic Regulation article 37) “Member States, in close cooperation with the Commission, shall coordinate their data collection activities with other Member States in the same region, and make every effort to coordinate their actions with third countries having sovereignty or jurisdiction over waters in the same region”. These activities can be funded by the European Maritime and Fisheries Fund (EMFF) under shared management (Annual Work Plans) or under direct management (article 85).
Category Issue Remarks Added by
AllPossibility to extract data by uploaded CSVformat file.
To check or replace the data in more fine resolution. [email protected], [email protected]
CS
Possibility extract data by Trip record (TR),Fishing station record (HH), Species list record(SL), Length record (HL) and Sex-Maturity-Age-Weight-Length record (CA) in commercialfisheries sampling data (CS).
To check or replace the data in more fine resolution. [email protected], [email protected]
All
Standard reports on sapling intensity as on figures 1, 2, 3 and 4 in RCM Baltic 2012 report.
An overview of actual sampling for age, weight, sex, maturity and all length measurements together with total landings. [email protected], [email protected]
AllStandard reports on data quality as on figures 5 and 6 in RCM Baltic 2012 report.
Possible to analyse and compare quality of biological data collected by the MS in an efficient way. [email protected], [email protected]
All
Possibility to replace data by area and in highor in low resolution. Also if replacing the datawhen some of the data is in high resolutionand some in low resolution it is not fullyreplaced if it is unknown if the rectangle issame or not.
Data replacement by year and quarter is not enough definition. Whole set of previously uploaded data (also from previous years) was needed in order to add some new data and avoid replacing previous correct data due to differences in resolution. [email protected], [email protected]
All
Code lists and range in RDB for countries, ports, latitude, longitude, species etc. are incomplete, limited and need regional harmonization and coordination.
Coding errors in early upload stage of data cause problems in later stages when data is downloaded and analysed. [email protected], [email protected]
All
NAFO and FAO41 areas don't have statistical rectangles defined and Lat and Lon degrees don't cover NAFO and FAO areas.
For NAFO and FAO41 areas the rectangle should be made optional also in CS format. Too narrow ranges don't allow to upload the data from these areas. [email protected], [email protected]
AllUser privileges have to be updated to match current situation.
Too loose user privileges in current situation will cause more coding errors. Needs to be dealt at the same time when harmonization and coordination of code lists takes place. [email protected], [email protected]
All
When updating the main text of the upload manual the annexes of the manual should be updated too.
In the last version of the CRR No. 296 the annexes were not updated. [email protected], [email protected]
report table
for HL records, table incl no of length measured fish per species, catch category, per year and sd respectively together with information on NO OF TRIPS that have been sampled! [email protected]
report table
for HL records, table incl no of length measured fish per species, catch category, per year and sd respectively and more detailed = per fishing ground and by country together with information on NO OF TRIPS that have been sampled! [email protected]
report table
for CA records, table incl no of aged fish per species, catch category, per year and sd respectively together with information on NO OF TRIPS that have been sampled! [email protected]
report table
for CA records, table incl no of aged fish per species, catch category, per year and sd respectively and more detailed = per fishing ground and by flag country together with information on NO OF TRIPS that have been sampled! [email protected]
RCM Baltic 2013 sharepoint HL file 29/08/2013 corrections
very long fish + in Baltic, odd by Ireland, landed species, have sent info regarding the issues to [email protected] [email protected]
56
How this coordination and cooperation can be carried out has been discussed at various STECF EWG meeting dealing with the revision of the DCF and at several RCMs. It has been proposed that the successor of the present RCMs should be the establishment of Regional Coordination Groups (RCGs).
Regional coordination is a continuous process, not just an annual meeting. This process should lead into the elaboration of guidelines and decisions to ensure that adequate data are collected through coordinated national work plans. This is to enable regional assessments for stocks, fisheries and marine ecosystems in accord with transparent objectives and agreed priorities and to oversee sampling methodology and data flow.
For making the RCGs operational it requires participation by a membership that has the authority to consent to the decisions made by the group. Furthermore, the group needs to have a broad expertise including statisticians, data processors, national data collection coordinators, core data end-users and may be other expertise.
The RCM Baltic discussed the establishment of such RCGs and the competence of the groups. A number of issues were raised such as:
As the RCGs are suggested to have activities going on throughout the year and not only at an annual meeting it might be advisable to appoint both a chairman and (2-3?)co-chairman due to the expected workload.
It is suggested that funds for carrying out intercessional work including funds for carrying out regional, bilateral- or multilateral DCF activities. This will speed up the process towards establishing regional data collection programmes and task sharing.
Should independent expert participate and who should have the mandate to invite them?
Should it be possible for other interested parties such as NGO’s, RAC representatives or orthers to participate eg. as observers?
Should all recommendations be agreed by consensus or by majority decision?
How can the link between the Annual Workplan evaluators and the RCGs be made en order so ensure that the sum of all the MS annual workplans within a regional satisfy regional data collection needed by the data end-users?
The RCM Baltic would like to stress that funding for development of the RDB and for development of statistical sound regional sampling schemes are essential for the progress of the implementation of the new DC-MAP as well as regional sampling schemes.
6.4 Cooperation activities between Member States funded under the EMFF and by the Commission
According the EMFF article 85. 2(e) “cooperation activities between the Member States in the field of data collection, including the setting-up and running of regionalized databases for storage, management and use of data which will benefit regional cooperation and improve data collection and management activities as well as the scientific expertise in support of fisheries management”.
This enables cooperation activities between Member States that could be put forward for funding under the EMFF and by the Commission under direct management.
Suggests the following activities to be prioritised and funded by the Commission:
1. Further development of the present RDB hosted and maintained by ICES. (see section 6.1 and section 9)
2. Development of methods/analysis to be carried out for setting up regional data collection programmes
(see section 5.3 and section 9).
3. Regional, bilateral, multilateral cooperation is supported by additional funding.
4. Funding the exchange of personal for improving knowledge and common standards.
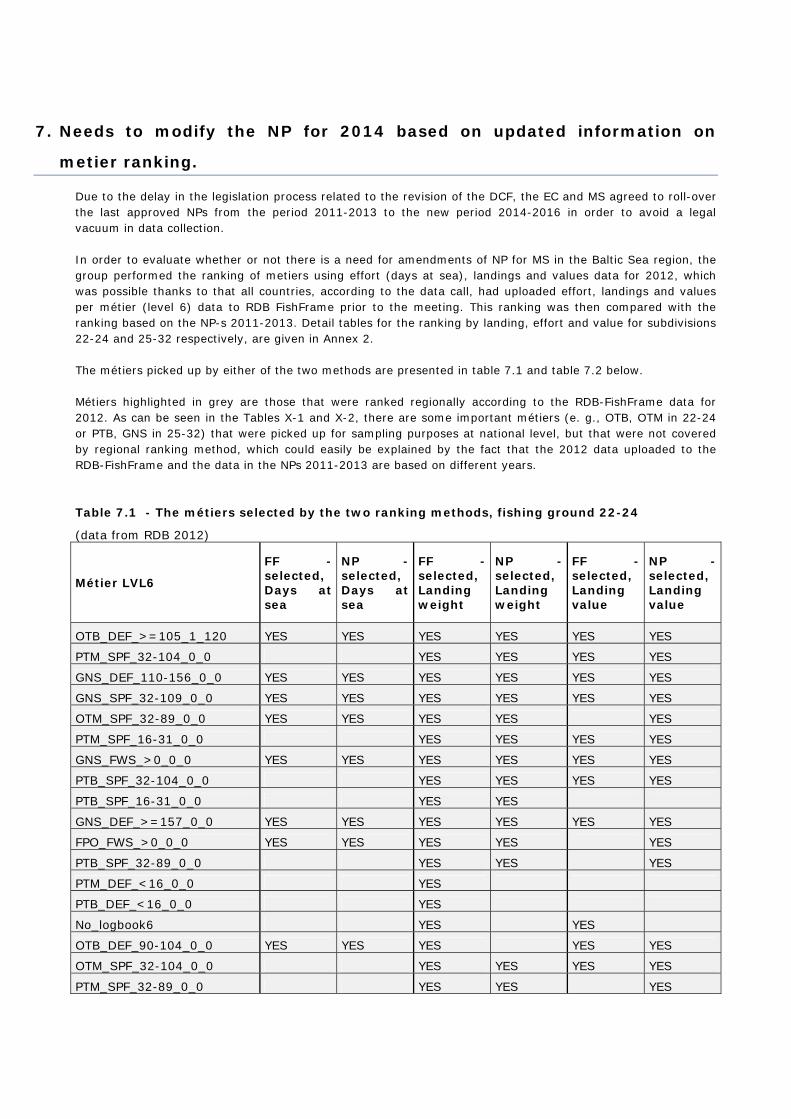
7. Needs to modify the NP for 2014 based on updated information on
metier ranking. Due to the delay in the legislation process related to the revision of the DCF, the EC and MS agreed to roll-over the last approved NPs from the period 2011-2013 to the new period 2014-2016 in order to avoid a legal vacuum in data collection. In order to evaluate whether or not there is a need for amendments of NP for MS in the Baltic Sea region, the group performed the ranking of metiers using effort (days at sea), landings and values data for 2012, which was possible thanks to that all countries, according to the data call, had uploaded effort, landings and values per métier (level 6) data to RDB FishFrame prior to the meeting. This ranking was then compared with the ranking based on the NP-s 2011-2013. Detail tables for the ranking by landing, effort and value for subdivisions 22-24 and 25-32 respectively, are given in Annex 2. The métiers picked up by either of the two methods are presented in table 7.1 and table 7.2 below. Métiers highlighted in grey are those that were ranked regionally according to the RDB-FishFrame data for 2012. As can be seen in the Tables X-1 and X-2, there are some important métiers (e. g., OTB, OTM in 22-24 or PTB, GNS in 25-32) that were picked up for sampling purposes at national level, but that were not covered by regional ranking method, which could easily be explained by the fact that the 2012 data uploaded to the RDB-FishFrame and the data in the NPs 2011-2013 are based on different years. Table 7.1 - The métiers selected by the two ranking methods, fishing ground 22-24
(data from RDB 2012)
Métier LVL6
FF - selected, Days at sea
NP - selected, Days at sea
FF - selected, Landing weight
NP - selected, Landing weight
FF - selected, Landing value
NP - selected, Landing value
OTB_DEF_>=105_1_120 YES YES YES YES YES YES
PTM_SPF_32-104_0_0 YES YES YES YES
GNS_DEF_110-156_0_0 YES YES YES YES YES YES
GNS_SPF_32-109_0_0 YES YES YES YES YES YES
OTM_SPF_32-89_0_0 YES YES YES YES YES
PTM_SPF_16-31_0_0 YES YES YES YES
GNS_FWS_>0_0_0 YES YES YES YES YES YES
PTB_SPF_32-104_0_0 YES YES YES YES
PTB_SPF_16-31_0_0 YES YES
GNS_DEF_>=157_0_0 YES YES YES YES YES YES
FPO_FWS_>0_0_0 YES YES YES YES YES
PTB_SPF_32-89_0_0 YES YES YES
PTM_DEF_<16_0_0 YES
PTB_DEF_<16_0_0 YES
No_logbook6 YES YES
OTB_DEF_90-104_0_0 YES YES YES YES YES
OTM_SPF_32-104_0_0 YES YES YES YES
PTM_SPF_32-89_0_0 YES YES YES
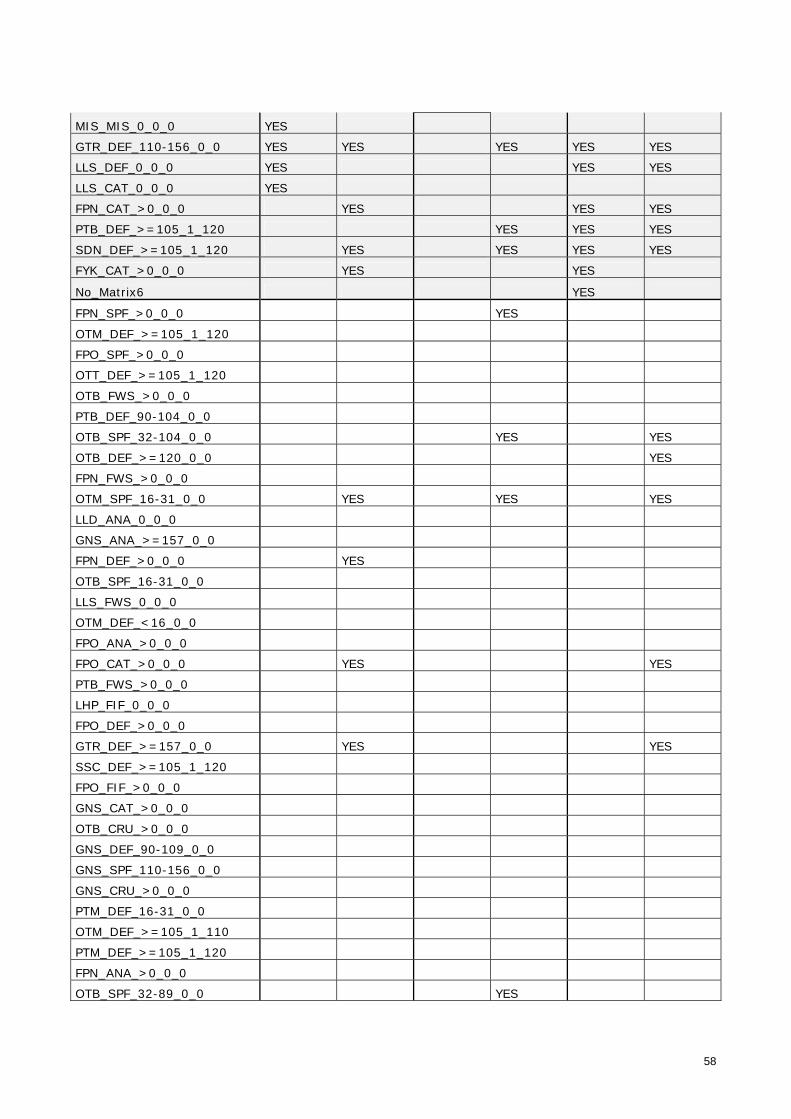
58
MIS_MIS_0_0_0 YES
GTR_DEF_110-156_0_0 YES YES YES YES YES
LLS_DEF_0_0_0 YES YES YES
LLS_CAT_0_0_0 YES
FPN_CAT_>0_0_0 YES YES YES
PTB_DEF_>=105_1_120 YES YES YES
SDN_DEF_>=105_1_120 YES YES YES YES
FYK_CAT_>0_0_0 YES YES
No_Matrix6 YES
FPN_SPF_>0_0_0 YES
OTM_DEF_>=105_1_120
FPO_SPF_>0_0_0
OTT_DEF_>=105_1_120
OTB_FWS_>0_0_0
PTB_DEF_90-104_0_0
OTB_SPF_32-104_0_0 YES YES
OTB_DEF_>=120_0_0 YES
FPN_FWS_>0_0_0
OTM_SPF_16-31_0_0 YES YES YES
LLD_ANA_0_0_0
GNS_ANA_>=157_0_0
FPN_DEF_>0_0_0 YES
OTB_SPF_16-31_0_0
LLS_FWS_0_0_0
OTM_DEF_<16_0_0
FPO_ANA_>0_0_0
FPO_CAT_>0_0_0 YES YES
PTB_FWS_>0_0_0
LHP_FIF_0_0_0
FPO_DEF_>0_0_0
GTR_DEF_>=157_0_0 YES YES
SSC_DEF_>=105_1_120
FPO_FIF_>0_0_0
GNS_CAT_>0_0_0
OTB_CRU_>0_0_0
GNS_DEF_90-109_0_0
GNS_SPF_110-156_0_0
GNS_CRU_>0_0_0
PTM_DEF_16-31_0_0
OTM_DEF_>=105_1_110
PTM_DEF_>=105_1_120
FPN_ANA_>0_0_0
OTB_SPF_32-89_0_0 YES
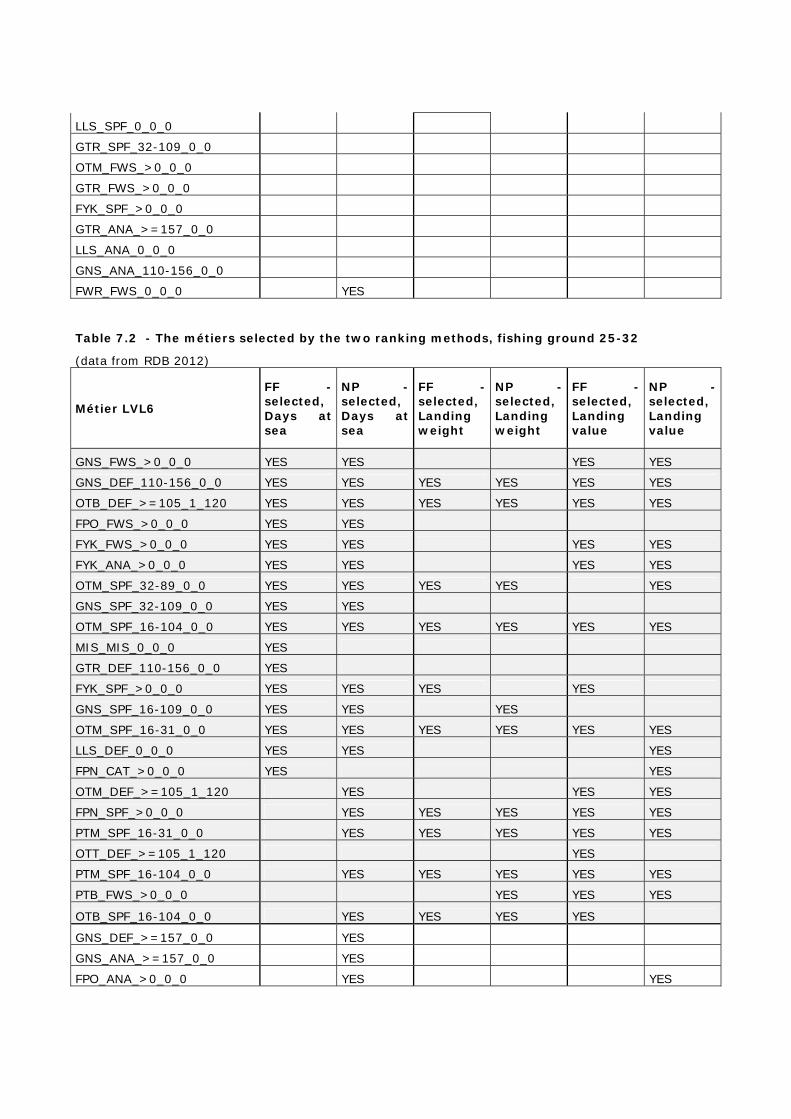
LLS_SPF_0_0_0
GTR_SPF_32-109_0_0
OTM_FWS_>0_0_0
GTR_FWS_>0_0_0
FYK_SPF_>0_0_0
GTR_ANA_>=157_0_0
LLS_ANA_0_0_0
GNS_ANA_110-156_0_0
FWR_FWS_0_0_0 YES Table 7.2 - The métiers selected by the two ranking methods, fishing ground 25-32
(data from RDB 2012)
Métier LVL6
FF - selected, Days at sea
NP - selected, Days at sea
FF - selected, Landing weight
NP - selected, Landing weight
FF - selected, Landing value
NP - selected, Landing value
GNS_FWS_>0_0_0 YES YES YES YES
GNS_DEF_110-156_0_0 YES YES YES YES YES YES
OTB_DEF_>=105_1_120 YES YES YES YES YES YES
FPO_FWS_>0_0_0 YES YES
FYK_FWS_>0_0_0 YES YES YES YES
FYK_ANA_>0_0_0 YES YES YES YES
OTM_SPF_32-89_0_0 YES YES YES YES YES
GNS_SPF_32-109_0_0 YES YES
OTM_SPF_16-104_0_0 YES YES YES YES YES YES
MIS_MIS_0_0_0 YES
GTR_DEF_110-156_0_0 YES
FYK_SPF_>0_0_0 YES YES YES YES
GNS_SPF_16-109_0_0 YES YES YES
OTM_SPF_16-31_0_0 YES YES YES YES YES YES
LLS_DEF_0_0_0 YES YES YES
FPN_CAT_>0_0_0 YES YES
OTM_DEF_>=105_1_120 YES YES YES
FPN_SPF_>0_0_0 YES YES YES YES YES
PTM_SPF_16-31_0_0 YES YES YES YES YES
OTT_DEF_>=105_1_120 YES
PTM_SPF_16-104_0_0 YES YES YES YES YES
PTB_FWS_>0_0_0 YES YES YES
OTB_SPF_16-104_0_0 YES YES YES YES
GNS_DEF_>=157_0_0 YES
GNS_ANA_>=157_0_0 YES
FPO_ANA_>0_0_0 YES YES
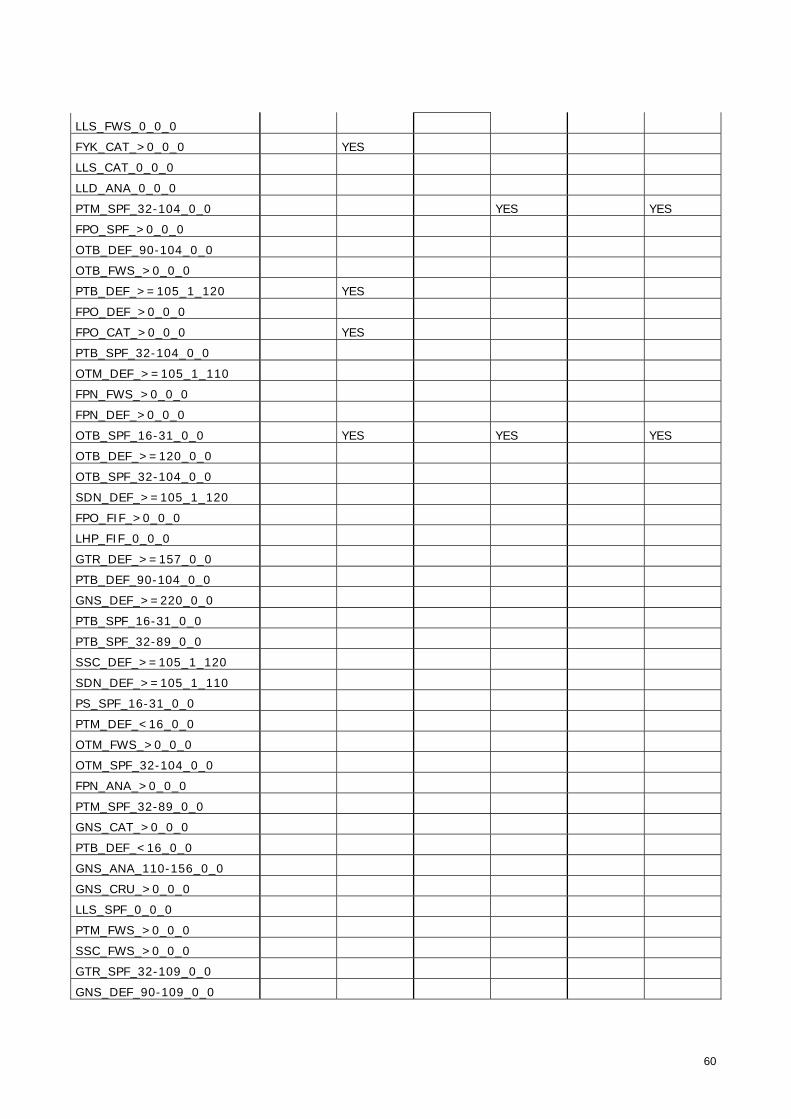
60
LLS_FWS_0_0_0
FYK_CAT_>0_0_0 YES
LLS_CAT_0_0_0
LLD_ANA_0_0_0
PTM_SPF_32-104_0_0 YES YES
FPO_SPF_>0_0_0
OTB_DEF_90-104_0_0
OTB_FWS_>0_0_0
PTB_DEF_>=105_1_120 YES
FPO_DEF_>0_0_0
FPO_CAT_>0_0_0 YES
PTB_SPF_32-104_0_0
OTM_DEF_>=105_1_110
FPN_FWS_>0_0_0
FPN_DEF_>0_0_0
OTB_SPF_16-31_0_0 YES YES YES
OTB_DEF_>=120_0_0
OTB_SPF_32-104_0_0
SDN_DEF_>=105_1_120
FPO_FIF_>0_0_0
LHP_FIF_0_0_0
GTR_DEF_>=157_0_0
PTB_DEF_90-104_0_0
GNS_DEF_>=220_0_0
PTB_SPF_16-31_0_0
PTB_SPF_32-89_0_0
SSC_DEF_>=105_1_120
SDN_DEF_>=105_1_110
PS_SPF_16-31_0_0
PTM_DEF_<16_0_0
OTM_FWS_>0_0_0
OTM_SPF_32-104_0_0
FPN_ANA_>0_0_0
PTM_SPF_32-89_0_0
GNS_CAT_>0_0_0
PTB_DEF_<16_0_0
GNS_ANA_110-156_0_0
GNS_CRU_>0_0_0
LLS_SPF_0_0_0
PTM_FWS_>0_0_0
SSC_FWS_>0_0_0
GTR_SPF_32-109_0_0
GNS_DEF_90-109_0_0
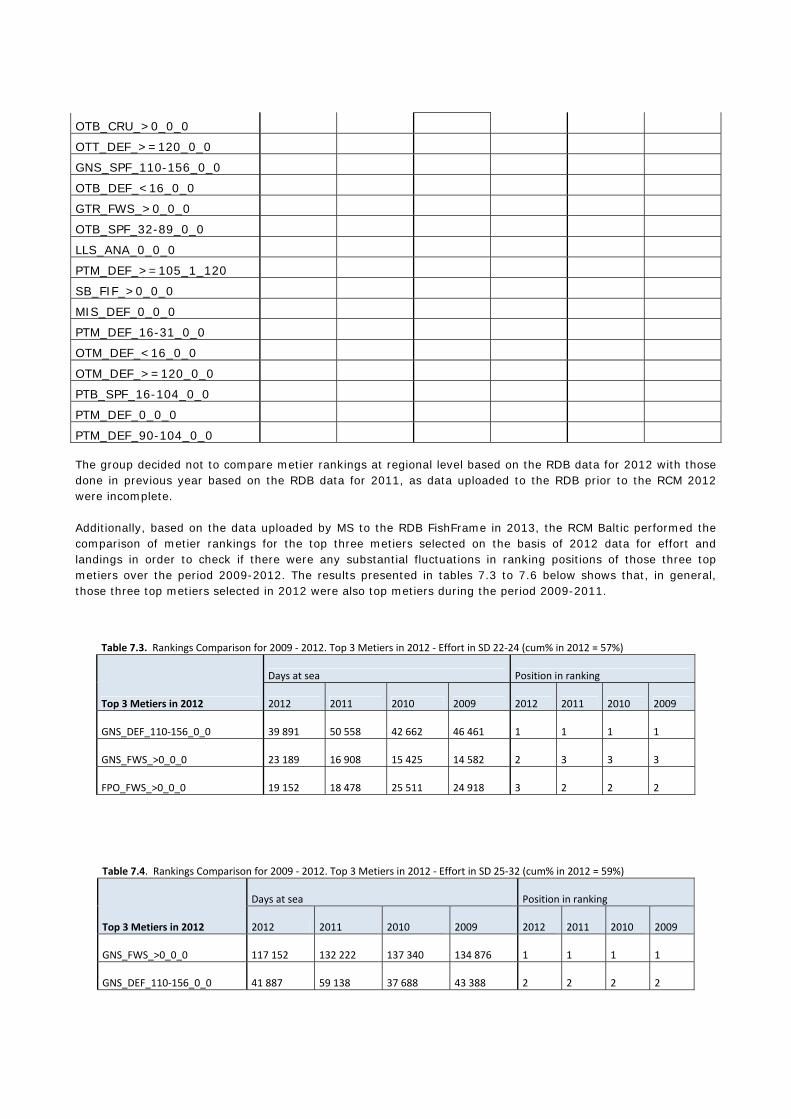
OTB_CRU_>0_0_0
OTT_DEF_>=120_0_0
GNS_SPF_110-156_0_0
OTB_DEF_<16_0_0
GTR_FWS_>0_0_0
OTB_SPF_32-89_0_0
LLS_ANA_0_0_0
PTM_DEF_>=105_1_120
SB_FIF_>0_0_0
MIS_DEF_0_0_0
PTM_DEF_16-31_0_0
OTM_DEF_<16_0_0
OTM_DEF_>=120_0_0
PTB_SPF_16-104_0_0
PTM_DEF_0_0_0
PTM_DEF_90-104_0_0 The group decided not to compare metier rankings at regional level based on the RDB data for 2012 with those done in previous year based on the RDB data for 2011, as data uploaded to the RDB prior to the RCM 2012 were incomplete. Additionally, based on the data uploaded by MS to the RDB FishFrame in 2013, the RCM Baltic performed the comparison of metier rankings for the top three metiers selected on the basis of 2012 data for effort and landings in order to check if there were any substantial fluctuations in ranking positions of those three top metiers over the period 2009-2012. The results presented in tables 7.3 to 7.6 below shows that, in general, those three top metiers selected in 2012 were also top metiers during the period 2009-2011.
Table 7.3. Rankings Comparison for 2009 ‐ 2012. Top 3 Metiers in 2012 ‐ Effort in SD 22‐24 (cum% in 2012 = 57%)
Top 3 Metiers in 2012
Days at sea Position in ranking
2012 2011 2010 2009 2012 2011 2010 2009
GNS_DEF_110‐156_0_0 39 891 50 558 42 662 46 461 1 1 1 1
GNS_FWS_>0_0_0 23 189 16 908 15 425 14 582 2 3 3 3
FPO_FWS_>0_0_0 19 152 18 478 25 511 24 918 3 2 2 2
Table 7.4. Rankings Comparison for 2009 ‐ 2012. Top 3 Metiers in 2012 ‐ Effort in SD 25‐32 (cum% in 2012 = 59%)
Top 3 Metiers in 2012
Days at sea Position in ranking
2012 2011 2010 2009 2012 2011 2010 2009
GNS_FWS_>0_0_0 117 152 132 222 137 340 134 876 1 1 1 1
GNS_DEF_110‐156_0_0 41 887 59 138 37 688 43 388 2 2 2 2
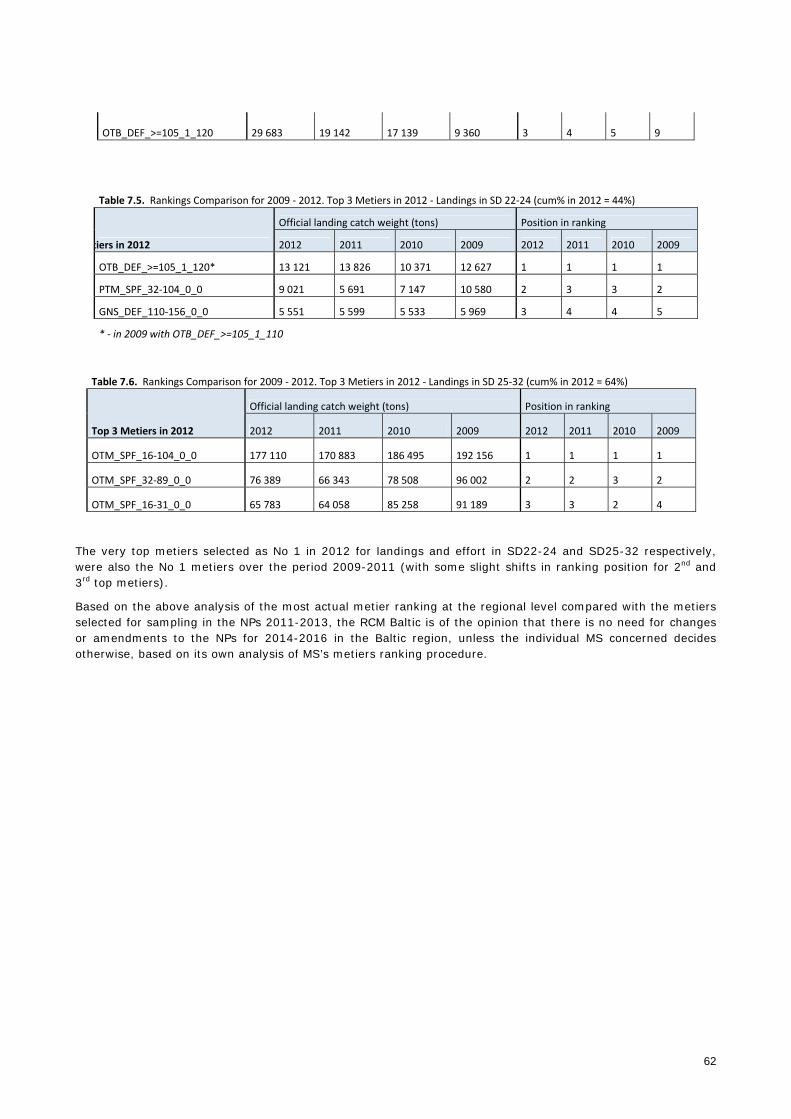
62
OTB_DEF_>=105_1_120 29 683 19 142 17 139 9 360 3 4 5 9
Table 7.6. Rankings Comparison for 2009 ‐ 2012. Top 3 Metiers in 2012 ‐ Landings in SD 25‐32 (cum% in 2012 = 64%)
Top 3 Metiers in 2012
Official landing catch weight (tons) Position in ranking
2012 2011 2010 2009 2012 2011 2010 2009
OTM_SPF_16‐104_0_0 177 110 170 883 186 495 192 156 1 1 1 1
OTM_SPF_32‐89_0_0 76 389 66 343 78 508 96 002 2 2 3 2
OTM_SPF_16‐31_0_0 65 783 64 058 85 258 91 189 3 3 2 4
The very top metiers selected as No 1 in 2012 for landings and effort in SD22-24 and SD25-32 respectively, were also the No 1 metiers over the period 2009-2011 (with some slight shifts in ranking position for 2nd and 3rd top metiers).
Based on the above analysis of the most actual metier ranking at the regional level compared with the metiers selected for sampling in the NPs 2011-2013, the RCM Baltic is of the opinion that there is no need for changes or amendments to the NPs for 2014-2016 in the Baltic region, unless the individual MS concerned decides otherwise, based on its own analysis of MS’s metiers ranking procedure.
Table 7.5. Rankings Comparison for 2009 ‐ 2012. Top 3 Metiers in 2012 ‐ Landings in SD 22‐24 (cum% in 2012 = 44%)
tiers in 2012
Official landing catch weight (tons) Position in ranking
2012 2011 2010 2009 2012 2011 2010 2009
OTB_DEF_>=105_1_120* 13 121 13 826 10 371 12 627 1 1 1 1
PTM_SPF_32‐104_0_0 9 021 5 691 7 147 10 580 2 3 3 2
GNS_DEF_110‐156_0_0 5 551 5 599 5 533 5 969 3 4 4 5
* ‐ in 2009 with OTB_DEF_>=105_1_110
8. Revision of the DCF and of the EU Multiannual programme (MAP) for data collection
8.1 Feedback from ICES on revision of the DCF
In spring 2012, ICES provide a generic feedback on data need to the European Commission. Four main item were recommended to be taken into account in the revision of the DCF: a) to be framed in regional basis; b) to considered the integration of data to assess the fisheries impacts on marine ecosystems and the implementation of the ecosystem approach to marine management; c) to have an improve user access; and d) to be more flexible and allow the inclusion of new types of data if needed. In May 20013, ICES provided an more detailed feedback with: a) comments on previous STECF-EWG report on revision of the DCF; b) other comments that were not been addressed yet, mainly on by-catch; c) overview of surveys used for basis of the ICES scientific advice and stocks with no fisheries independent data; d) overview of salmon data needs; e) overview of all the other stocks (except eels) data needs considering the short -term target category. The document provided by ICES was available to the RCM-Baltic. The data need for each stock depends of the respective category. Not all stocks should be under category 1 (stocks assessed with an analytical assessment and therefore using assessment model that are more data demanding). It was clarified to the RCM-Baltic that fecundity data is essentially needed for stocks that currently use eggs production methods. The feedback from ICES was provided under the assumption that new DCF will be more flexible and will easily deal with additional requests for data, in case stocks are upgraded in the “stocks categories” (moving towards category 1). Therefore, this feedback is not static and should evolve throughout the years. The revised DCF should be able to cope with this dynamic aspect, within the legal framework.
Some ICES assessment working groups is lacking participation compared to the work load. The present DCF list of eligible meeting only allow up to two participants per MS. This may have the consequence that a MS just are funding two participants even though more three or more participants are needed. It is suggested that a system under the DC-MAP is implemented.
8.2 RCM Baltic MS feedback on revision of the DCF
Initially, it was envisaged that, from 2104 onwards, the CFP Basic regulation would contain an Article providing the legal basis for data collection, which would be complemented by a Data Collection multiannual programme (DC-MAP). However, Council and Parliament decided that the CFP Basic Regulation would not act as the legal basis for data collection, but would instead set out the key principles for future data collection, and that Regulation 199/2008 would be maintained, and should be revised to align it with the principles in the CFP basic Regulation. In order to avoid a gap in data collection, the Commission has extended the present EU Multiannual Programme (Commission Decision 2010/93/EU) for 2014-2016, and to roll-over the Member States' National programmes 2011-2013 for the period 2014-2016.
At present no legislative text for the revision of the DCF is available. However, the requirements of future data collection programmes have been discussed by various STECF expert working groups (EWG). The Commission services have in June 2013 produced a consultation document “EU Data Collection for Fisheries 2014-2020”. This document should serve as a basis for discussion with the STECF EWG on 10-14 June 2013 and for the National Correspondents for Data Collection meeting on 24 June 2013.
In June 2103, STECF EWG 13-05 has proposed a structure for the revised DCF, including proposals for legislative text, which could be a basis for the revised DCF. The RCM Baltic considered the report of STECF EWG 13-05 and has the following comments. The comments are restricted to the collection of transversal and biological data.
64
On the basis of the Consultation document, the STECF EWG 13-05 and the ICES feedback on data need in the revised DCF all RCM Baltic MSs were asked to present their view on these documents and the revised DCF. Each MSs view are presented in annex 1.
Generally, all MS are very positive and are looking forward to have revised DCF that is more data end-user driven instead of the present more “quota” driven DCF.
8.3 Proposed roadmap for the development of a regional sampling programme
Road-map towards a regional sampling programme The regional coordination meetings have so far primarily had the task to coordinate data collection activities within a region. In the future DCF it is foreseen that there will be stronger incentives for MS to also cooperate within a region. It is further foreseen that requirements on a design-based approach and sampling in accordance with best practice will be pillars in the new regulation. This makes sense from a scientific point of view since it allows for a more thoroughly evaluation of data quality on a national and regional level as well as a more effective use of available sampling resources within a region. The regional database is a backbone in a regional approach, with the possibility to enable transparent data collection, estimation and submission of national and regional data (given that funding is provided to meet new requirements). The RCM 2012 did strongly support the movement towards a regional design based approach in the Oostende declaration. It is important to realize that regional programmes can be implemented in different ways and that people managing national data collections schemes most likely have different understandings on what a regional data collection program is. Regional data collection programs have been discussed from a more theoretical point during WKPICS and SGPIDS meetings but so far are there few, if any ongoing attempts to implement such approaches. The RCM Baltic is aware that a pilot project has started in the Skagerrak and thinks that the results can give valuable input to approaches in the Baltic area as well. Alternatively, other pilot sub-regions could be identified It is also importance to realize that all MS do not have experience on a design based approach. It is not a simple task to move from a traditional national ad-hoc based sampling approach to a regional design-based approach and that is why a transition period was suggested in the Oostende declaration. It is important to utilize the transition period in a way that as much knowledge as possible is gained to iron the way for an implementation phase. Experiences are building up, primarily as a consequence of the work done in ICES WKPICS and SGPIDS. There will also be a theme session “Whats the catch?” during the ASC 2013. It is important to build on and utilize this work in order to not lose the momentum. There are presently many meetings and processes (ICES methodological meetings (WKPICS2, WGCATCH), STECF meetings dealing with the revision of the DCF, RCMs, RDB-SC and national/multinational initiatives) that relates to the development of regional design based sampling programmes, but there is a lack of overview. This lack of overview may result in that time and resources are not spent efficiently but also that important parts of “the puzzle” may be uncovered. To reach the goal of regional design based sampling scheme we need to work in a much more structured and systematic way. We need to identify and agree on objectives, what we need to achieve those objectives and available resources. We further need to identify “showstoppers” and risks that would hamper the development and consequently also what we need to do to minimize the risks. This overarching inventory of objectives, needs, resources, “what is already done” and “what needs to be done” could preferably be compiled in a roadmap. The roadmap should also include processes (including meetings) that support the progress. The roadmap need to be developed on a supra regional level but the RCM Baltic started to work on a preliminary road map. This could be further discussed at the LM.
Preliminary roadmap The aim is to produce a road-map to secure funds, experience, expertise and time to be able to fully implement a regional sampling programme by 2018 (at the latest). Objective – regional sampling programme A regional sampling program, based on a statistically sound sampling design that enables transparent preparation of regional estimates of variables of interest and cost effective utilization of the sampling resources available in the region. What do we need to achieve this?
1) The RDB to be developed to accommodate the design-based approach, including transparent estimation procedures within or in conjunction with the RDB.
2) Guidance from expert groups on how regional programmes can be implemented including how estimates should be produced.
3) Support from statisticians on sampling levels to meet regional precision targets. How many samples and how many fish to be measured/aged within a sample.
4) Investigate how different national sampling protocols impact estimates (e.g. sea-sampling programmes)
5) Time to learn how we practically can implement regional design-based sampling programmes. 6) Assess how a regional sampling frame can account for the challenges related to distinct national
accounting systems
Preliminary road-map 2013
Develop and decide on a road-map
2014 Develop RDB – Needs funds Pilot project on a regional design - MS can participate actively or passively (support the project with
data) or chose to not participate. Need time to prioritize this work, funds for project meetings, project implementation.
Involvement of a statistician to calculate adequate sample sizes for the different levels of the data collection chain (e.g. how many samples as well as how many fish we need within a sample to meet precision targets on the regional scale (stock by stock)). Simulate different degrees of regional sampling and see how this affects the number of samples/fish. Needs good statistician and the money to hire her/him,
Follow the outcomes of WKPICS2, theme session ASC etc. Pilot project on sampling effects of sampling protocols (sea-sampling)
2015 Develop RDB – Need funds Based on the outcomes of the pilot project develop and discuss different possible designs, including
what´s needed in terms of sampling intensity and harmonization. Implications for MS. Organize a workshop with a panel of design experts to discuss possible solutions. Need be able to invite
(and pay) experts Design the regional sampling plan. Divide tasks between us
2016 Finalise design feed in to the legislative process Develop RDB – Need funds
2017 Start to implement the regional design – adjust 2018 Full implementation
66
9. Studies The RCM Baltic suggests two studies to be funder under the EMFF article 85, 2e under direct management. The proposals are:
Title: Exploration and Development of new facilities in RDB-FishFrame 5.0
Background: The demands from the users to a regional Database is under constant change; in the first hand, because the users discover new possibilities in the use of the data as they get more familiar with the use of the database and secondly because the data collection, fish stock management and modeling environment changes and new data types and processing facilities become important. The first one mostly requires design of new output reports to tabulate new combination of the existing variables, while the second one quite often requires adding of new variables and processing functionality. A central point is the design based approach in data collection, and eventually regional data collection programs, which is foreseen in the DC-MAP. Furthermore, RDB- FishFrame has now been introduced to additional regions. This has given rise to additional requests how data should be centrally processed due to new sampling stratifications practiced in the member states included compared to the existing. It is essential that a database reflects on new demands and not act as a straightjacket preventing new progressive initiatives. A constant development is therefore very important in order to keep the momentum. The development will be outsourced to the extent that external expertise is necessary in order to follow the time schedule. Development The main fields for development in 2013-14 are identified by the RDB-Steering Committee and presented in no specific order of priority: 1. Development of additional tools for analysis and data tabulating to support regional coordination. (20% of total budget) Outputs: Technical report, programming development Development of output reports which provide:
Overview of data status by region; data coverage; Support the planning of future regional based sampling schemes; Overview of potential areas for task sharing between member states.
2. Testing of trial stocks from different expert groups for national raising, by borrowing age-length keys from own and/or other countries and correct functionality according.
All data submitters for the selected stocks raise data in the RDB Output compared and corrections made where needed
3. Stream line the interfacing with InterCatch
Develop functionalities which when data have been raised to a certain level automatically will move data to InterCatch
4. Explore options and cost implications of implementing of external tools (i.e. COST) in the RDB-FishFrame. (35% of total budget) Outputs: Technical report, Technical Workshop(s), programming development Such analysis should include the following elements:
An inventory to collate and examine the tools present but also tools missing What level of documentation/quality controls would be required of a tool to be accepted into the RDB? What exports should the RDB provide to other formats/tools? What changes need to be made to the COST format/coding to comply with the RDB? Is COST sufficiently documented (methods, quality controls etc.)?

Which level of integrating should the RDB.-FishFrame provide to COST (just export to COST or an interface that allows users to manipulate RDB data using COST tools/functions)?
Proof of concept of programmatic interface to RDB-FishFrame
5. Requirements and automatisation of Data calls procedures. (20% of total Budget) Outputs: Technical report, programming development
What is formally required from the regional database to reply to data calls? What data calls can we respond to at present/future? (The present functionalities and documentations
in the regional database need to be compared with most common data calls) Alignment with FLUX developments
6. Development of more flexible structure to handle correct processing of design based sampling schemes to address regional differences in approach. (25% of total budget) Outputs: Technical report, Technical meetings/workshops covering all regions
What changes need to be made in the Exchange Formats in order to comply with design based sampling schemes?
Which additional processing functionality need to be developed in order to comply with design based sampling schemes?
7. Development of procedures to ensure confidentiality on individual vessel level for CL, CE and on value.
RCM Baltic comment
The RCM Baltic 2013 classifies this study as priority 1. This study has been supported by the PGCCDBS, the RCM Baltic, RCM NS&EA and the RCM NA has been endorsed by the 9th Liaison Meeting.
Title: “Support design based regional data collection programmes”
Objective of proposed study
The Study will develop an operational framework for establishing and coordinating design-based sampling programmes at a regional scale for the most cost-effective delivery of fishery and biological data required by the revised DCF and any specific additional needs to support assessment and fishery management.
Duration of project
It is anticipated that the project would run for two years, and cover two periods of RCM and Liaison meetings to allow consultation and discussion of proposals.
Indicative budget: € 450,000 The need for the proposed study
A design based sampling strategy is a prerequisite for transparency in the data collection-assessment-advice process since it allows for straightforward estimation processes, assessment of bias as well as variance associated with different estimates. In particular, it supports estimators that do not depend on complex models and assumptions about the underlying stochastic process of the catching operations of the fleet. It also enables the use of DCF data in the wider scientific/management community since data are collected in a transparent way following sound statistical procedures including documentation of sampling protocols and sampling designs.
Due to severe logistical constrains in sampling of fisheries, many national sampling programmes may in reality be more or less ad hoc based. Recent ICES workshops including WKPICS and WKMERGE have started to examine how sampling schemes can be adapted to deal with different types of logistical constrains without compromising the basic requirements of statistical design. Within these workshops it has become evident that countries need support to design and implement such statistically-sound sampling schemes.
68
Currently, the DCF Regional Coordination Meetings (RCMs) focus heavily on “task sharing” for metier and stock based sampling. It is foreseeable that in the new DCF, the role of RCMs may evolve more towards establishing and coordinating statistically-sound programmes of data collection to deliver the estimates for stocks and fleets required at the regional scale. This could include agreement of sampling frames, allocation of sampling effort amongst Member States, documentation of sampling schemes, and review of achievements and data quality. To adopt this role, RCMs would require guidance and a system of support because the sampling problems already encountered by individual countries will remain at the regional scale. If true progress should be made towards regional data collection programmes, it is crucial that sufficient resources and expertise are available for Member States and RCMs to carry out the necessary tasks.
Study specifications
The study will require setting up a core project team to work out principles for regional sampling designs, and to work closely with RCMs, ICES PGs, European Commission and Liaison meeting to review how the structure and operation of RCMs should be adapted to best serve the needs of the revised DCF. The project team will focus particularly on:
Understanding the fleet-based and stock-based estimates that are required to support assessments and advice at a regional scale.
Defining an operational framework for RCMs to coordinate annual or multi-annual regional sampling programmes to deliver the estimates.
Identifying logistical constraints to national sampling schemes within a region, and proposing solutions for how these could be handled in regional sampling plans and within the component national strata (ref: WKMERGE; WKPICS1–3).
Establishing procedures for optimising sampling schemes and allocation of sampling amongst Member States in relation to regional objectives and available resources.
Identifying the procedures for estimation and sample raising at the regional scale. Developing Quality Indicators for regional datasets. Identifying developments needed in the Regional Databases to support regional sampling programmes. Propose future support systems to help RCMs implement and evaluate regional sampling programmes.
RCM areas to be covered
The project will initially scope out the problem across all DCF regions in consultation with RCMs, European Commission and PGs, but depending on resources may then focus on one or two regions as case studies.
Project tasks
Subject to discussion with the European Commission, it is anticipated that a two-year Study would involve the following tasks:
Initial workshops and WebEx meetings with key RCM, ICES Planning Group and European Commission representatives, and invited external experts, to agree the basic principles of implementing and optimising a regional programme of sampling to deliver the required estimates.
Identification of the structure of a regional sampling programme allowing a fully coordinated international approach to delivering the required data and estimates, including documenting the characteristics of the fisheries and stocks to be sampled in each country, development of sampling frames, stratification schemes, sample selection procedures, optimal allocation of sampling effort amongst countries, estimation procedures and production of quality indicators.
Presentation of proposals to RCMs, ICES PGs, European Commission and Liaison Meeting, for discussion and further development.
Development of final proposals and report.
RCM Baltic comment
The RCM Baltic 2013 classifies this study as priority 2. This study has been proposed by the PGCCDBS and supported by the RCM Baltic, RCM NS&EA and has been endorsed by the 9th Liaison Meeting.
10. Any other business
10.1 Consequences of the landing obligation in 2015 introduced by the CFP for sampling programmes.
The European Council of Ministers for Fisheries and the European Parliament has agreed to implement a landing obligation of all catches for a number of species (Basic Regulation article 15). This landing obligation and discard ban will be implemented gradually starting in 2015 with pelagic species and full implementation at latest 1st January 2019. Furthermore, a so-called “de minimis” derogation is also agreed.
According to the new CFP basic regulation article 15 “EU Member States shall ensure adequate capacity and means for the purpose of monitoring compliance with the obligation to land all catches of species under the remit of this discard ban, inter alia such means as observers, CCTV and other.” How a discard ban in practise should be controlled has not yet been made. Therefore, detailed implications on the quality of catch statistics and connections to the DC-MAP requirements are not clear now.
At present, data provided to STECF, ICES, GFCM and other scientific or management organization is a combination of data collected according to the Control Regulation CR (Council Regulation (EC) No 1224/2009 ) or the DCF (Council Regulation (EC) No 199/2008). All estimates of discards have until now been provided using data collected according to the DCF. According to the CR implementation regulation (Commission Regulation No 404/2011), it is already mandatory to register discards in the logbooks if: “Discards of quantities of each species above 50 kg live weight equivalent shall be recorded. Discards of species taken for live bait purposes and which are recorded in the fishing logbook at section 15, shall also be recorded". The RCM Baltic is of the opinion, after analysis of these data, that the discard information in logbooks is not reliable. Level of compliance is low. When the discard ban is implemented, all catches (above and below the minimum reference size) should be reported in the logbook. At the same time, DCF at sea observer programmes will still be carried out to collect scientific and biological information. This means that information derived from two different sources on total catches of the species covered by the discard ban will be available. As the information may be conflicting, this may in future have a negative impact on the coming DCF data collection programmes as well as the quality of the advice provided by the scientific advisory organizations like ICES and STECF. The scientific community stresses the importance of continuing to use the best data available The discard ban on a number of species requires that catches of these species should be retained on board and landed. For all other species discarding is still legal, which means that discarding will still take place in the future. This makes the monitoring and control of the discard ban complicated, if not virtually impossible, where it is not only a question of monitoring if discarding is taking place but also what is discarded. However, depending on the type of fishery involved, fishermen might decide not to spent effort on sorting the fish and might land the species that can be discarded as well, including non-TAC species or species of no commercial value.
When the discard ban is brought in a new monitoring/surveillance system for the control of catches needs to be implemented. The RCM Baltic has discussed the possible impact on the reliability and quality of the new “catch” statistics.
For stock assessment and advisory purposes it is important to continue an at sea observer programme for the collection of scientific data for the DC-MAP as these programmes provide important and necessary information. The RCM Baltic highlights that in order to ensure high quality and reliable data collection at sea the following must be avoided:
That scientific at sea observer programmes may be regarded as a control and enforcement activity. That scientist may be forced to use official catch statistics (data collected according to the CR) which
may not the best available information.
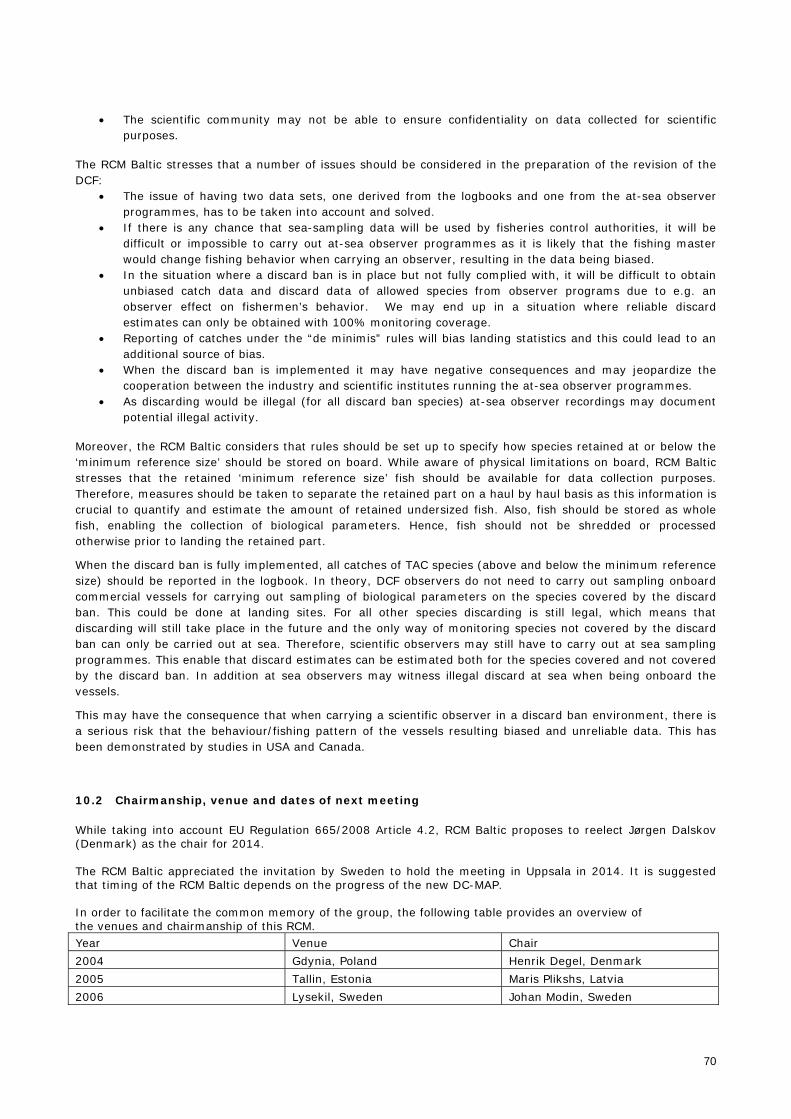
70
The scientific community may not be able to ensure confidentiality on data collected for scientific purposes.
The RCM Baltic stresses that a number of issues should be considered in the preparation of the revision of the DCF:
The issue of having two data sets, one derived from the logbooks and one from the at-sea observer programmes, has to be taken into account and solved.
If there is any chance that sea-sampling data will be used by fisheries control authorities, it will be difficult or impossible to carry out at-sea observer programmes as it is likely that the fishing master would change fishing behavior when carrying an observer, resulting in the data being biased.
In the situation where a discard ban is in place but not fully complied with, it will be difficult to obtain unbiased catch data and discard data of allowed species from observer programs due to e.g. an observer effect on fishermen’s behavior. We may end up in a situation where reliable discard estimates can only be obtained with 100% monitoring coverage.
Reporting of catches under the “de minimis” rules will bias landing statistics and this could lead to an additional source of bias.
When the discard ban is implemented it may have negative consequences and may jeopardize the cooperation between the industry and scientific institutes running the at-sea observer programmes.
As discarding would be illegal (for all discard ban species) at-sea observer recordings may document potential illegal activity.
Moreover, the RCM Baltic considers that rules should be set up to specify how species retained at or below the ‘minimum reference size’ should be stored on board. While aware of physical limitations on board, RCM Baltic stresses that the retained ‘minimum reference size’ fish should be available for data collection purposes. Therefore, measures should be taken to separate the retained part on a haul by haul basis as this information is crucial to quantify and estimate the amount of retained undersized fish. Also, fish should be stored as whole fish, enabling the collection of biological parameters. Hence, fish should not be shredded or processed otherwise prior to landing the retained part.
When the discard ban is fully implemented, all catches of TAC species (above and below the minimum reference size) should be reported in the logbook. In theory, DCF observers do not need to carry out sampling onboard commercial vessels for carrying out sampling of biological parameters on the species covered by the discard ban. This could be done at landing sites. For all other species discarding is still legal, which means that discarding will still take place in the future and the only way of monitoring species not covered by the discard ban can only be carried out at sea. Therefore, scientific observers may still have to carry out at sea sampling programmes. This enable that discard estimates can be estimated both for the species covered and not covered by the discard ban. In addition at sea observers may witness illegal discard at sea when being onboard the vessels.
This may have the consequence that when carrying a scientific observer in a discard ban environment, there is a serious risk that the behaviour/fishing pattern of the vessels resulting biased and unreliable data. This has been demonstrated by studies in USA and Canada.
10.2 Chairmanship, venue and dates of next meeting
While taking into account EU Regulation 665/2008 Article 4.2, RCM Baltic proposes to reelect Jørgen Dalskov (Denmark) as the chair for 2014. The RCM Baltic appreciated the invitation by Sweden to hold the meeting in Uppsala in 2014. It is suggested that timing of the RCM Baltic depends on the progress of the new DC-MAP. In order to facilitate the common memory of the group, the following table provides an overview of the venues and chairmanship of this RCM. Year Venue Chair 2004 Gdynia, Poland Henrik Degel, Denmark 2005 Tallin, Estonia Maris Plikshs, Latvia 2006 Lysekil, Sweden Johan Modin, Sweden
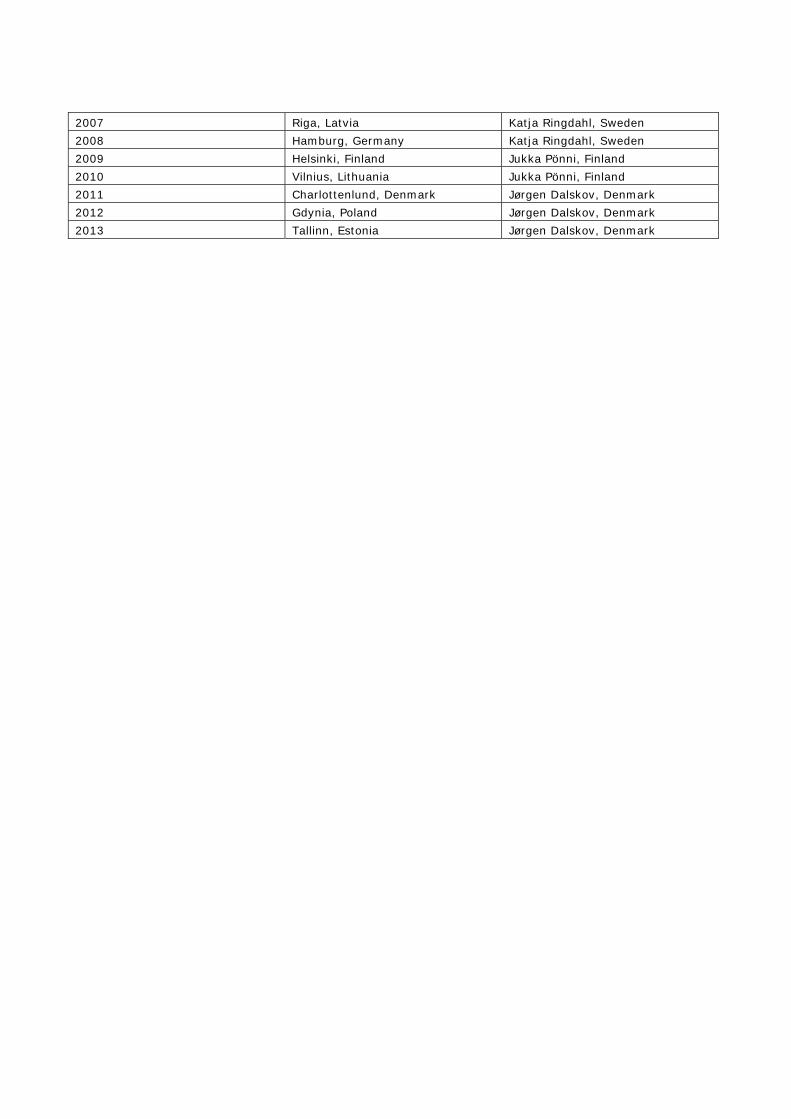
2007 Riga, Latvia Katja Ringdahl, Sweden 2008 Hamburg, Germany Katja Ringdahl, Sweden 2009 Helsinki, Finland Jukka Pönni, Finland 2010 Vilnius, Lithuania Jukka Pönni, Finland 2011 Charlottenlund, Denmark Jørgen Dalskov, Denmark 2012 Gdynia, Poland Jørgen Dalskov, Denmark 2013 Tallinn, Estonia Jørgen Dalskov, Denmark
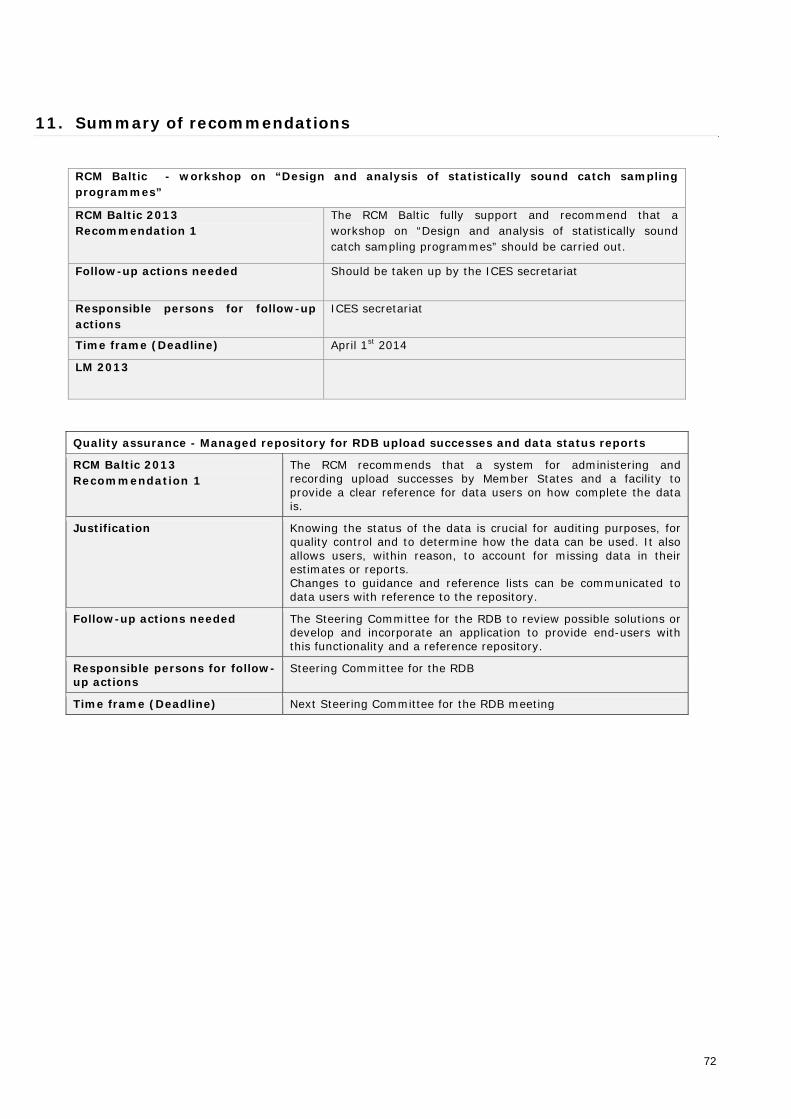
72
11. Summary of recommendations
RCM Baltic - workshop on “Design and analysis of statistically sound catch sampling programmes”
RCM Baltic 2013 Recommendation 1
The RCM Baltic fully support and recommend that a workshop on “Design and analysis of statistically sound catch sampling programmes” should be carried out.
Follow-up actions needed Should be taken up by the ICES secretariat
Responsible persons for follow-up actions
ICES secretariat
Time frame (Deadline) April 1st 2014
LM 2013
Quality assurance - Managed repository for RDB upload successes and data status reports
RCM Baltic 2013 Recommendation 1
The RCM recommends that a system for administering and recording upload successes by Member States and a facility to provide a clear reference for data users on how complete the data is.
Justification Knowing the status of the data is crucial for auditing purposes, for quality control and to determine how the data can be used. It also allows users, within reason, to account for missing data in their estimates or reports. Changes to guidance and reference lists can be communicated to data users with reference to the repository.
Follow-up actions needed The Steering Committee for the RDB to review possible solutions or develop and incorporate an application to provide end-users with this functionality and a reference repository.
Responsible persons for follow-up actions
Steering Committee for the RDB
Time frame (Deadline) Next Steering Committee for the RDB meeting
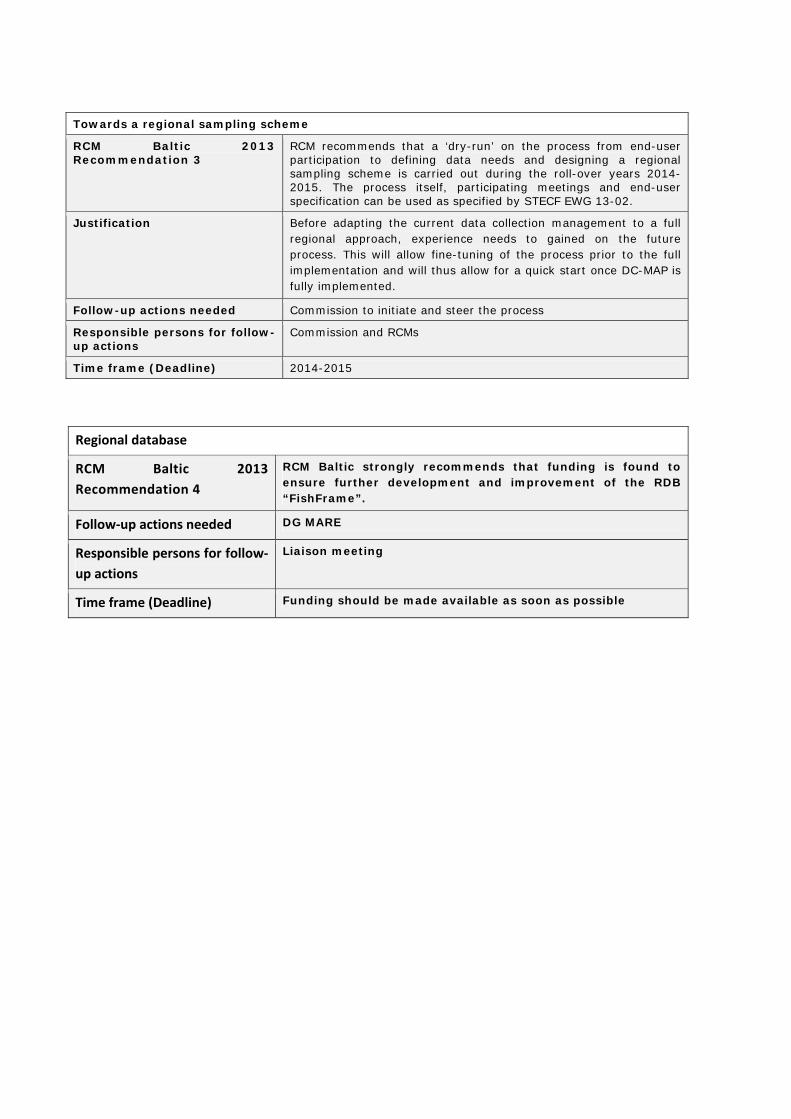
Towards a regional sampling scheme
RCM Baltic 2013 Recommendation 3
RCM recommends that a ‘dry-run’ on the process from end-user participation to defining data needs and designing a regional sampling scheme is carried out during the roll-over years 2014-2015. The process itself, participating meetings and end-user specification can be used as specified by STECF EWG 13-02.
Justification Before adapting the current data collection management to a full regional approach, experience needs to gained on the future process. This will allow fine-tuning of the process prior to the full implementation and will thus allow for a quick start once DC-MAP is fully implemented.
Follow-up actions needed Commission to initiate and steer the process
Responsible persons for follow-up actions
Commission and RCMs
Time frame (Deadline) 2014-2015
Regional database
RCM Baltic 2013
Recommendation 4
RCM Baltic strongly recommends that funding is found to ensure further development and improvement of the RDB “FishFrame”.
Follow‐up actions needed DG MARE
Responsible persons for follow‐
up actions
Liaison meeting
Time frame (Deadline) Funding should be made available as soon as possible
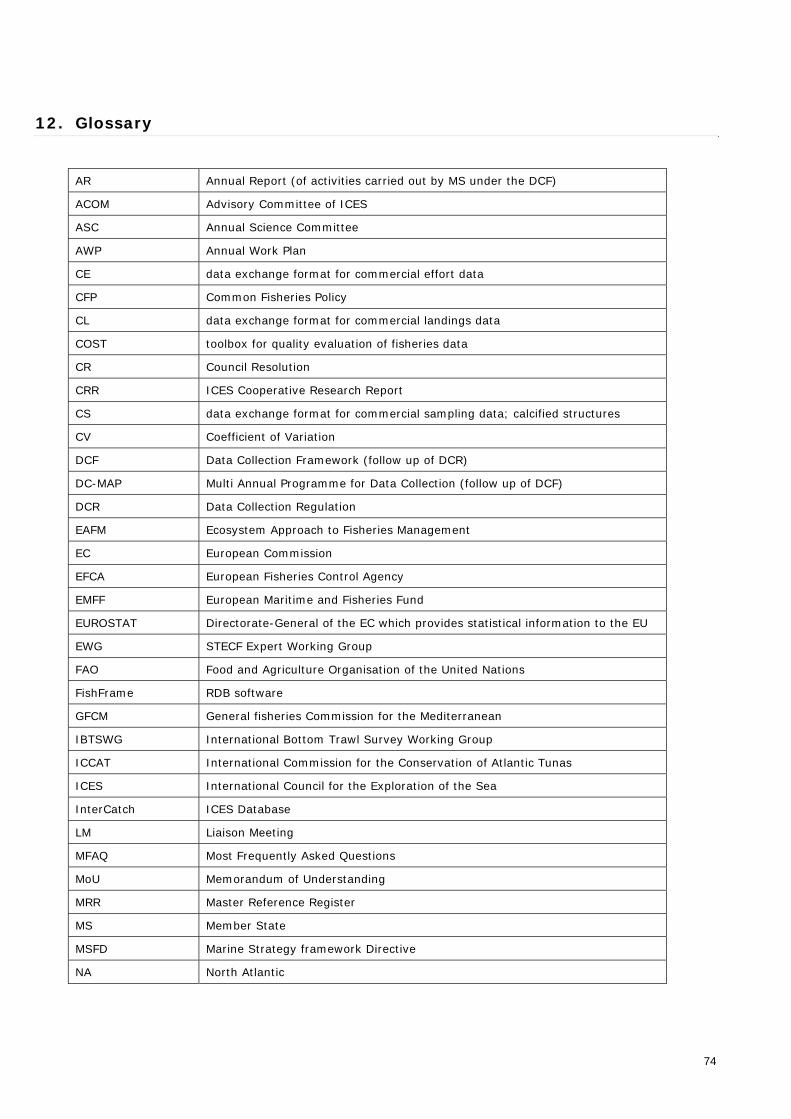
74
12. Glossary
AR Annual Report (of activities carried out by MS under the DCF)
ACOM Advisory Committee of ICES
ASC Annual Science Committee
AWP Annual Work Plan
CE data exchange format for commercial effort data
CFP Common Fisheries Policy
CL data exchange format for commercial landings data
COST toolbox for quality evaluation of fisheries data
CR Council Resolution
CRR ICES Cooperative Research Report
CS data exchange format for commercial sampling data; calcified structures
CV Coefficient of Variation
DCF Data Collection Framework (follow up of DCR)
DC-MAP Multi Annual Programme for Data Collection (follow up of DCF)
DCR Data Collection Regulation
EAFM Ecosystem Approach to Fisheries Management
EC European Commission
EFCA European Fisheries Control Agency
EMFF European Maritime and Fisheries Fund
EUROSTAT Directorate-General of the EC which provides statistical information to the EU
EWG STECF Expert Working Group
FAO Food and Agriculture Organisation of the United Nations
FishFrame RDB software
GFCM General fisheries Commission for the Mediterranean
IBTSWG International Bottom Trawl Survey Working Group
ICCAT International Commission for the Conservation of Atlantic Tunas
ICES International Council for the Exploration of the Sea
InterCatch ICES Database
LM Liaison Meeting
MFAQ Most Frequently Asked Questions
MoU Memorandum of Understanding
MRR Master Reference Register
MS Member State
MSFD Marine Strategy framework Directive
NA North Atlantic
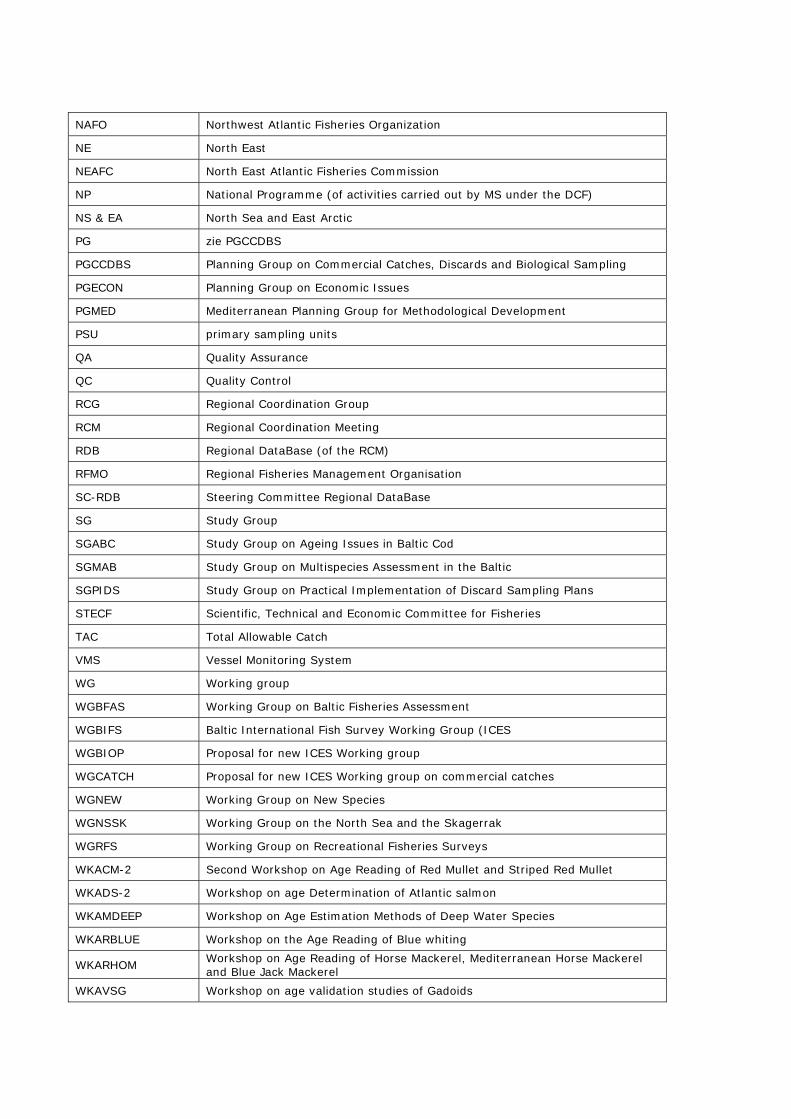
NAFO Northwest Atlantic Fisheries Organization
NE North East
NEAFC North East Atlantic Fisheries Commission
NP National Programme (of activities carried out by MS under the DCF)
NS & EA North Sea and East Arctic
PG zie PGCCDBS
PGCCDBS Planning Group on Commercial Catches, Discards and Biological Sampling
PGECON Planning Group on Economic Issues
PGMED Mediterranean Planning Group for Methodological Development
PSU primary sampling units
QA Quality Assurance
QC Quality Control
RCG Regional Coordination Group
RCM Regional Coordination Meeting
RDB Regional DataBase (of the RCM)
RFMO Regional Fisheries Management Organisation
SC-RDB Steering Committee Regional DataBase
SG Study Group
SGABC Study Group on Ageing Issues in Baltic Cod
SGMAB Study Group on Multispecies Assessment in the Baltic
SGPIDS Study Group on Practical Implementation of Discard Sampling Plans
STECF Scientific, Technical and Economic Committee for Fisheries
TAC Total Allowable Catch
VMS Vessel Monitoring System
WG Working group
WGBFAS Working Group on Baltic Fisheries Assessment
WGBIFS Baltic International Fish Survey Working Group (ICES
WGBIOP Proposal for new ICES Working group
WGCATCH Proposal for new ICES Working group on commercial catches
WGNEW Working Group on New Species
WGNSSK Working Group on the North Sea and the Skagerrak
WGRFS Working Group on Recreational Fisheries Surveys
WKACM-2 Second Workshop on Age Reading of Red Mullet and Striped Red Mullet
WKADS-2 Workshop on age Determination of Atlantic salmon
WKAMDEEP Workshop on Age Estimation Methods of Deep Water Species
WKARBLUE Workshop on the Age Reading of Blue whiting
WKARHOM Workshop on Age Reading of Horse Mackerel, Mediterranean Horse Mackerel and Blue Jack Mackerel
WKAVSG Workshop on age validation studies of Gadoids
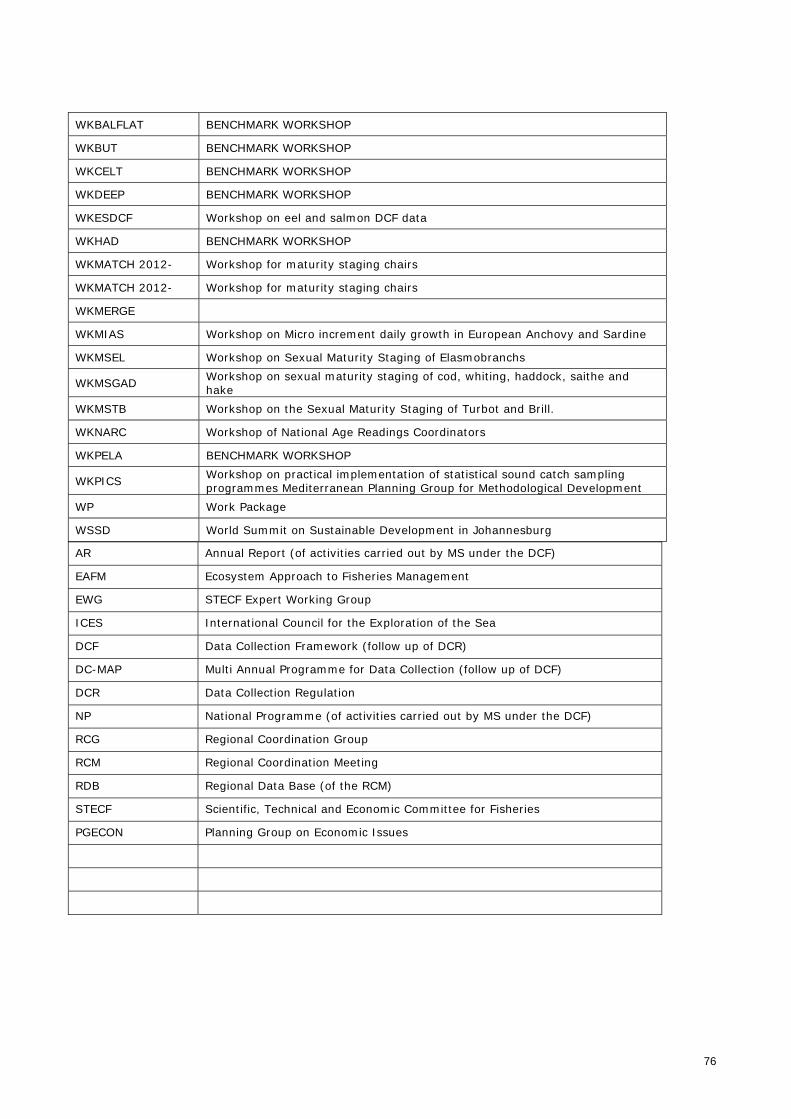
76
WKBALFLAT BENCHMARK WORKSHOP
WKBUT BENCHMARK WORKSHOP
WKCELT BENCHMARK WORKSHOP
WKDEEP BENCHMARK WORKSHOP
WKESDCF Workshop on eel and salmon DCF data
WKHAD BENCHMARK WORKSHOP
WKMATCH 2012- Workshop for maturity staging chairs
WKMATCH 2012- Workshop for maturity staging chairs
WKMERGE
WKMIAS Workshop on Micro increment daily growth in European Anchovy and Sardine
WKMSEL Workshop on Sexual Maturity Staging of Elasmobranchs
WKMSGAD Workshop on sexual maturity staging of cod, whiting, haddock, saithe and hake
WKMSTB Workshop on the Sexual Maturity Staging of Turbot and Brill.
WKNARC Workshop of National Age Readings Coordinators
WKPELA BENCHMARK WORKSHOP
WKPICS Workshop on practical implementation of statistical sound catch sampling programmes Mediterranean Planning Group for Methodological Development
WP Work Package
WSSD World Summit on Sustainable Development in Johannesburg
AR Annual Report (of activities carried out by MS under the DCF)
EAFM Ecosystem Approach to Fisheries Management
EWG STECF Expert Working Group
ICES International Council for the Exploration of the Sea
DCF Data Collection Framework (follow up of DCR)
DC-MAP Multi Annual Programme for Data Collection (follow up of DCF)
DCR Data Collection Regulation
NP National Programme (of activities carried out by MS under the DCF)
RCG Regional Coordination Group
RCM Regional Coordination Meeting
RDB Regional Data Base (of the RCM)
STECF Scientific, Technical and Economic Committee for Fisheries
PGECON Planning Group on Economic Issues
13. References
Council Regulation (EC) 199/2008 of 25 February 2008 concerning the establishment of a Community Framework for the collection, management and use of data in fisheries sector for scientific advice regarding the Common Fisheries Policy
Commission Regulation (EC) No 665/2008 of 14 July 2008 laying down detailed rules for the application of Council Regulation (EC) No 199/2008 concerning the establishment of a Community framework for the collection, management and use of data in the fisheries sector and support for scientific advice regarding the Common Fisheries Policy
Commission Regulation (EC) No 1078/2008 of 3 November 2008 laying down detailed rules for the implementation of Council Regulation (EC) No 861/2006 as regards the expenditure incurred by Member States for the collection and management of the basic fisheries data
Commission Decision (EC) No 2010/93/EC of 2010 adopting a multi annual Community programme pursuant to Council Regulation (EC) No 199/2008 establishing a Community framework for the collection, management and use of data in the fisheries sector and support for scientific advice regarding the Common Fisheries Policy.
ICES. 2012. ICES Implementation of Advice for Data-limited Stocks in 2012 in its 2012 Advice. ICES CM 2012/ACOM 68.42 pp.
RCM Baltic 2010. Report of the Regional Co-ordination Meeting for the BalticSea (RCM Baltic) 2010.
RCM Baltic 2011. Report of the Regional Co-ordination Meeting for the BalticSea (RCM Baltic) 2011.
RCM Baltic 2012. Report of the Regional Co-ordination Meeting for the BalticSea (RCM Baltic) 2012.
LM 2011: Report from the 8th Liaison Meeting 2011.
LM 2012: Report from the 9th Liaison Meeting 2012.
STECF EWG 12-02 Review of the Revised 2012 National Programmes and on the Future of the DCF. STECF EWG 12-07 Review of Proposed DCF 2014-2020 – Part 1 STECF EWG 12-15 Review of Proposed DCF 2014-2020 – Part 2 STECF EWG 13-02 Review of DC MAP- Part 1 STECF EWG 13-05 Review of DC MAP- Part 2
78
14. Annex 1 Members States views on the ICES feedback on DC-MAP, Consultation Document prepared by the Commission and STECF EWG 13-05 Report Denmark Denmark is welcoming and supports the DC-MAP approach and the suggestions given in the STECF EWG 13-05 report. This report in combination with the Commissions services Consultation Document is a good starting point for further work on establishing the new DC-MAP. The idea of establishing of regional sampling programmes is fully supported by Denmark. Furthermore, any initiative to promote task sharing in terms of eg. collection of biological samples, otolith age determination, bilateral- or multilateral research vessel surveys will be welcomed by Denmark. The suggestion on more open access to DC-MAP data will probably improve the use of the data and thereby improve the quality insurance of the data. To have more open access to data and at the same time that the confidentiality insurance have to be strict will be a challenge for all MS as it requires that data from one cannot under any circumstances be extracted from the data base without being aggregated with at least 3 or more vessels. This will be very challenging. Denmark finds it important that data to be used for the DC-MAP work but collected or recorded according to other regulations should be at a quality required. If the quality of these data does not meet the required level double data collected should not be accepted. Instead the regulation concerned should be amended or revised. Otherwise double work will be the consequence. The implementation of the landing obligation (Basic Regulation article 15) will without any doubt have significant consequences for DC-MAP work. How the landing obligation will be implemented in the various MS as well as the level of compliance to this obligation is not known. Denmark is having concerns that this may jeopardize or postpone further development of the DC-MAP. Estonia In general, Estonia is welcoming the progress made in the movement towards DCMAP. Below a few observations and remarks on the documents are presented. Consultation Document (CD) Building Block A: GENERAL PROVISIONS Definitions – agreed definitions are the important element in DCMAP documentation Building Block B: EU MULTI-ANNUAL COMMON CORE DATA COLLECTION PROGRAMME Chapter III Social variables- it is not clear how the social variables should be collected. Chapter III Metier-related variables Sampling obligation from flag country to first landing country? Accepts the move the sampling obligation from flag country to landing country.
- if there is a plans to move away from metier-related sampling – it is assumes that the metiers will remain as reporting unit rather than sampling unit in DCMAP?
Chapter III Metier-related variables Sampling strategy CD: The metier cells shall first be ranked according to their share in the total commercial landings. The shares are then to be cumulated, starting with the largest, until a cut-off level of 90% [to be discussed if not 95%] is reached. Suggest that a 90% cut-off level is sufficient STECF may add to the selection the metiers not picked up by the ranking system but of special importance in terms of management. It is though not clear- at which stage STECF can do so and on which level (MS?)
Chapter III Stock-related variables Agrees with the view of EWG 13-05 suggesting that the data to be collected is based on analyses of end-users needs. Chapter III Transversal variables Supports the view of EWG 13-05 stresses that it is important that the bodies responsible for the DC-MAP have timely access to the data collected under the other regulations in order to avoid duplicate work. Chapter III Surveys at sea Agrees with the view of EWG 13-05 suggesting that all surveys included in the DC-MAP should be evaluated periodically and that the new surveys, or modifications in already included surveys should be accepted based on documentation of end user needs, and that in the list of surveys, which will be included in the DC-MAP, a reference should be included identifying the Member States which should contribute to each survey. The document does not include the reference on the contribution of third countries (in Baltic case-Russia) in the international surveys (BITS, BIAS). Chapter V Module of evaluation of the effects of the fisheries sector on the marine ecosystem By-catch issues. Supports the view of EWG 13-05 stressing that by-catch data collected under the DC-MAP will not be sufficient to estimate the impact of incidental catches on populations of the species monitored and additional data on population size would be required; Supports the 1st option provided by EWG 1305 : The DC-MAP could include provisions for MS to sample by-catches of certain conspicuous and sensitive non-fisheries species, for which there are end user needs, in existing sampling programmes which make use of observers at sea. Indicator issues Supports the EWG 13-05 suggestion that before a decision to specify data collection requirements in relation to environmental indictors in the DC-MAP is taken, end-users first need to agree a priority list of indicators to suit their needs.
Building Block C: COLLECTION, STORAGE AND USE OF DATA BY MEMBER STATES
Chapter I Multi-annual programmes NAFO areas are moved back to RCMNA. EST would prefer the present situation (joint coordination under the RCM NS and EA) Chapter III (Chapter II is missing- typo?) Regional Coordination and cooperation The Regional Coordination Groups shall evaluate the regional co-ordination aspects of the national programmes and where necessary shall make recommendations for the better coordination of national programmes, for task-sharing among Member States and for providing input from end-users into the programmes. The procedure is not clear- shall RCG evaluate the NPs ? This would significantly increase the workload of RCGs. The ToRs of the meeting should be available to NCs earlier that the proposed 3-week period. Chapter IV Data quality Precision Levels and Sampling plans - CV s are still in? Chapter V Data storage MS shall ensure that any interested party may have access to data save for reasons of protection of commercial or personal data – this chapter is not clear and needs elaboration. Chapter VI Use and provision Serious infringement – should be elaborated
80
Building Block D: MASTER REFERENCE REGISTER Estonia supports the creation of MRR. However it difficult to comment at this early stage. Finland The process has been transparent as the member states have been included in the process well on time. A number of questions still remain to be clarified and solved. Data collection/decision making: Some elements need further consideration. Role and mandate of the Regional Coordination Groups remains an essential issue. It involves several elements such as administrative, financial and legal implications to be clarified. While the aspect of having a more regional approach is desirable, it is pivotal to a clear understanding of RCG also in the larger context of decision making. The present EU legislation provides a possibility not to provide data as requested in a data call. This has been due to the confidentiality reasons. This has led to situations where a member state has been suspected of not providing the data on the basis of some other reasons not provided in the legislation. To avoid the unnecessary burden caused by such incidents, a formal 'dialogue process' should be built in the legislation between the relevant parties to cater such situation. Of course, it is necessary to keep the procedures if the failure to provide data occurred has not been based on the confidentiality reasons. From the Finnish perspective, salmon in the rivers Tenojoki and Näätämö should be included. However, these are outside the Baltic Sea and thus should be discussed in relevant forum outside the Baltic Sea. ICES and STEFC have recognised salmon from these rivers to be included in DC. G2 species remain as one of the keys issues. Fresh water species but living also in the brackish water are essential for commercial fisheries and in certain areas are the backbone for fisheries. The discussions in the Council of Ministers have included financing possibilities for the implementation of the MSFD. This has been possible under the umbrella of the EU Maritime Policy. However, financing possibilities may be reduced and such development cannot be welcomed. The Finnish view on possibilities to establish a regional data collection programme and on the work of upcoming Regional Coordination Groups (successor of the RCM’s) From our point of view, at this point of regulation update, it is not possible to compile an extensive regional data collection programme. Instead, we suggest that the RCM/ RCG: (a) acts as a proactive forum for initiating regional/ multi-/ bi-lateral agreements whenever needed for optimising the regional data collection (in case of fish stocks are exploited by several MS), (b) keeps a record of the agreements, where the MS can refer to in their NPs, (c) maintains the forms and formats of the agreements. RCM/ RCG could be maintained at present format in NP 2014-2016, since the regulations remain the same (obliging a detailed NP from each MS). As before, RCM/RCG should still rank the metiers and check that all relevant stocks are properly covered, and ensure sufficient sampling levels on regional scale. Before deciding the RCG’s working routines and the tasks and duties of chairs/ co-chairs it should be known what is the role and mandate of the RCG’s in the upcoming DCF regulation. Germany In general, Germany suggests that the ICES feedback should be fully considered in the further development of DC-MAP. Brief review style is used below (bullet points referring to paragraphs of concern). STECF EWG 13-05
‐ 5 Data required for assessing the state of exploited marine biological resources and the impact of fishing activities on the marine biological resources (p. 12)
o Although the design of recreational fishery surveys can have much in common with commercial fishery sampling programs there are also some major differences

that require different survey approaches. The most prominent difference is that the majority of data (fishery, socioeconomic & biological) is collected based on off-site (e.g. postal or telephone surveys) or on-site methods (e.g. interviews) conducted at land. It is important that requirements for recreational fishery data collection in the new DCMAP recognizes these peculiarities and that the new DCMAP supports the research surveys at land required to deliver the data needed. This may also be applicable to future sampling of the small-scale fishery (SSF) and data needs for diadromous species.
‐ Full assessment of the land based-aquaculture sector may be outside the present capacities of MS.
‐ 6.1 By-catch (p. 14) o EWG expects greater sampling effort at landing sites but should be accompanied
by greater law enforcement/control activities at sea. o In the Baltic Sea, most discards affect non-quota species, namely flatfishes
(except for plaice). Hence, for most discards in the Baltic the new discard plans of the EU are not valid and discarding of non-quota species will continue as in the past. Therefore, non-quota species can only be assessed using data from at-sea sampling programmes.
o p. 15 (by-catch of protected non-fisheries species): TI-OF prefers by-catch option2 (“dedicated sampling programmes”) because observer efforts under option 1 cannot provide the spatio-temporal coverage necessary to assess low-incidence events of non-fisheries species such as birds or marine mammals for statistically robust analyses. Option 2 is, however, only feasible when new electronic monitoring systems are considered. TI-OF (Germany) has several project ideas regarding surveying the bycatch of marine mammals and sea birds in the Baltic Sea.
‐ 7. social and economic Variables o Pilot-studies should be launched to at a national/regional level to assess the
necessary or possible coverage of social data o It should be checked, which points of the DC-MAP draft are already covered by the
control-regulation Annex 1 to STECF EWG-13-05 Chapter I – Transversal data
‐ 1) Access to information sources o a) (p. 1): What is “timely”? TI-OF prefers real-time access.
‐ 4) Catch data o a) ii, iii) (p. 1): presently, the masters of Community fishing vessels are required
to record in their fishing logbook all discards in excess of 50kg of any species (Reg. 1224/2009 Art. 14.4). At present, this law is not enforced. What is the reference for 50kg – a haul, or the total catch of trip? It should be rephrased saying that in principal all discards have to be recorded; otherwise this law cannot be enforced.
o a) iii) (p.2): RCG should look at Regional Level: What is really needed and what is possible to collect under given situations (especially transversal data in SSF where only monthly landing-declarations are available).
o Does the implementation of “additional collection of the data concerned” also include SSF?
o b) (p. 2): The wording implies that if the administrative performance of a country is poor, DCF pays to compensate for the poor data from the registration system – the imperfection/deficiencies just have to be “justified” and you get money? This is not a sound incentive. The same applies for EFFORT (p. 2).
‐ 6) VMS data (p. 2): A time frame is not even mentioned (not even “timely”). We prefer real-time access. 7) Quality indicators (p.2): Specifications are completely missing.
82
Chapter II – Data required for assessing the state of exploited marine biological resources and the impact of fishing activities on the marine biological resources A. Biological Variables 1) End User need d) Recreational Fisheries (p. 3) WGRFS continues to advise that requirements to collect recreational fishery data in DC-MAP should be driven by end-user needs. WGRFS should be closely involved in this process, as it is the current Expert Group on recreational fishery surveys in Europe, and should be supplied with appropriate Terms of Reference to provide Regional Coordination Groups (RCGs) with advice on how any end-user requests for recreational fishery data can be addressed. WGRFS proposes that a fixed percentage threshold triggering a survey (percentage of total removals, by weight, attributable to recreational fisheries) is inflexible and not appropriate as a sole decision rule. Recreational fisheries for particular species may become more or less important over time, so there is a need for time series data to show trends. Furthermore, in a situation of overfishing, recreational fisheries could still be exerting a significant fishing mortality even if the estimated total removals weight is below the designated threshold. In the case of fixed frequencies for conducting surveys, WGRFS is of the opinion that where possible, surveys should be conducted annually in order to preserve expertise, infrastructure and budgets. Multi-annual surveys should only be adopted where the impact on assessments and advice have been evaluated and found acceptable. Comments on Small Scale Fisheries (SSF) Data Collection: - (even if removals and economic importance are negligible the SSF sector data should be collected) - to perform management strategy evaluations of future fisheries policy options and its impact on the SSF sector - SSF sector less resilient to management changes and more susceptible to e.g. bad weather conditions - SSF employs and supports many coastal communities in rural and disadvantaged areas - SSF sector is at the forefront of the policy agenda of international, regional and local institutions (EU, FAO, UNESCO) 2) Variables to be collected (p.4)
o a) better coordination is required, sampling procedures and raising methods need to be harmonized between MS in the same region
o b) This process should be targeted to end-user needs with coordinating input from WGRFS. o c)i.3.: (p.5) to implement such “regional consistent design based schemes” better coordination
and harmonization is needed. The transition period (until 2017?) is too long. We suggest to use 2014 as a transition-period (with interim reporting to RCG in 2014) and have full implementation of new sampling (randomized and design based) in 2015 with reporting to RCG
o d)i.1.:(p.5) the targets and minimum thresholds regarding the sampling effort should be set flexible in response to the dynamics in the stocks involved and in the relative contribution to the total catches (landings and discards) of a MS. Sampling derogations can account for negligible landings (either in absolute or relative terms). More important than determining minimum requirement is that the samples, though few, should be taken in a meaningful way tracking the spatiotemporal patterns of the fishery, i.e. during the main fishing seasons from the main fishing grounds (this is ensured by random vessel selection procedures). A possible ToR for the new RCG may be “to assess spatio-temporal dynamics in national fisheries and compare these with the sampling coverage for a given year using information from the Regional database tables CE and CL for each MS in order to derive sound regional sampling strategies)
o f) Consideration of métiers (p.7): Is the ranking of métiers still an up-to-date topic for RCM/RCG? If yes, maybe it would make sense to review this only every 2 or 3 years
Chapter 3 – A: By-Catch 2) Option II
o c) It is completely unclear what option c on p.9 means (see concerns mentioned under EWG 13-05, p. 15)
Comments on Appendices: p.22, Appendix V: There are no recreational fisheries for sharks in the Baltic. p.38, Appendix X: Baltic Sea GERAS is in fact the Baltic International Acoustic Survey (BIAS) carried out in SD21-24, it is a core survey (i.e. co-financed); HERAS is the Danish part of the overall HERAS, the Danish HERAS part is carried out in SD20-21 and used both in the assessment of Baltic and North Sea Herring.
Commission Services Consultation document Block A:
‐ Contains basically the content of DCF ‐ Is “public availability” already covered by regional database and Intercatch?
Block B: ‐ Chapter III: Collection of Economic Variables:
o WGRFS recommends including the collection of socioeconomic data in the new DC-MAP to assess the economic and social benefits of the recreational fishery and enable value judgements.A.1.1: It would make sense to refer to WKSSCF-report here (Table 9.1, which shows transversal Variables that need to be collected)
o A.3.1.: (p. 8): How exactly should MS describe their methodologies used for each economic variable?
o A.3. Sampling strategy: (p.9) sampling strategy: This is NOT up-to-date discussion; several ICES WGs (e.g. WKPICS1,2; SGPIDS2,3) highlighted the need for statistically sound, probability-based sampling strategies; random sampling of vessel trips will ensure proportional coverage of métiers; % coverage defaults by métier (as suggested in the document) have fostered ad-hoc sampling approaches in the past that produce likely biased data with restricted usefulness for raising samples to total catches; % coverage defaults by métier should therefore no longer be used in DC-MAP; the proportionality of the sampling is automatically ensured by random sampling.
In the past, numerous studies have shown that DCF precision levels are of little use, especially when the samples are not selected randomly and when sampling intensities are very low. Therefore, alternative quality indicators should be used. MS should provide a proof of ability that they are able to conduct a randomized sampling scheme that reflects spatio-temporal dynamics in landing patterns with a reasonable number of samples. Fixed thresholds are not useful; instead flexibility should be installed tailored to the regional or stock-specific circumstances.
o A.4.1.:
o B.1.1: There shouldn’t be a selection of trips based on métiers. They will be assigned to a trip afterwards.
o B.3.1.c: “sampling possible to add “Vendor-datasets” to RDB FishFrame now (containing only TR and CA)? Vendor information only does not allow tracking a sample to the level of a vessel or vessel trip and is, therefore, actually is useless for raising.
o B.3.1.e: this will be a result of a good randomized sampling-scheme o B.3.1.f and g seem redundant in the light of the EWG 13-05 comments o B.3.1.h: Does it make sense? How are these numbers/calculations justified? It is
almost impossible to generate a realistic length-distribution in that way o B.3.1.j.: (p.11) What exactly shall MS provide? It should allow to unambiguously
judging on the performance quality and randomness of the sampling scheme. o B.3.2.a and e.: “total volume of catches” is missing a reference size (e.g. trip,
haul, quarter) o B.3.2.b: very vague, what is “a good coverage”? o B.3.2.d: same problem, what is “a good proportion”?
This might be a good point for RCG o B.3.2.f: who will decide about the “relevance of pilot studies”?
RCG: defining sampling intensity and proportional number of trips? o B.3.3.a.: (p. 11). WGRFS advises that the specific details of survey schemes such
as periodicity of estimates (e.g. annual, twice a year or quarterly) and type of data to collect (e.g. numbers, weight, length compositions) shall be agreed at a regional level. This process should be targeted to end-user needs and types of surveys involved with coordinating input from WGRFS.
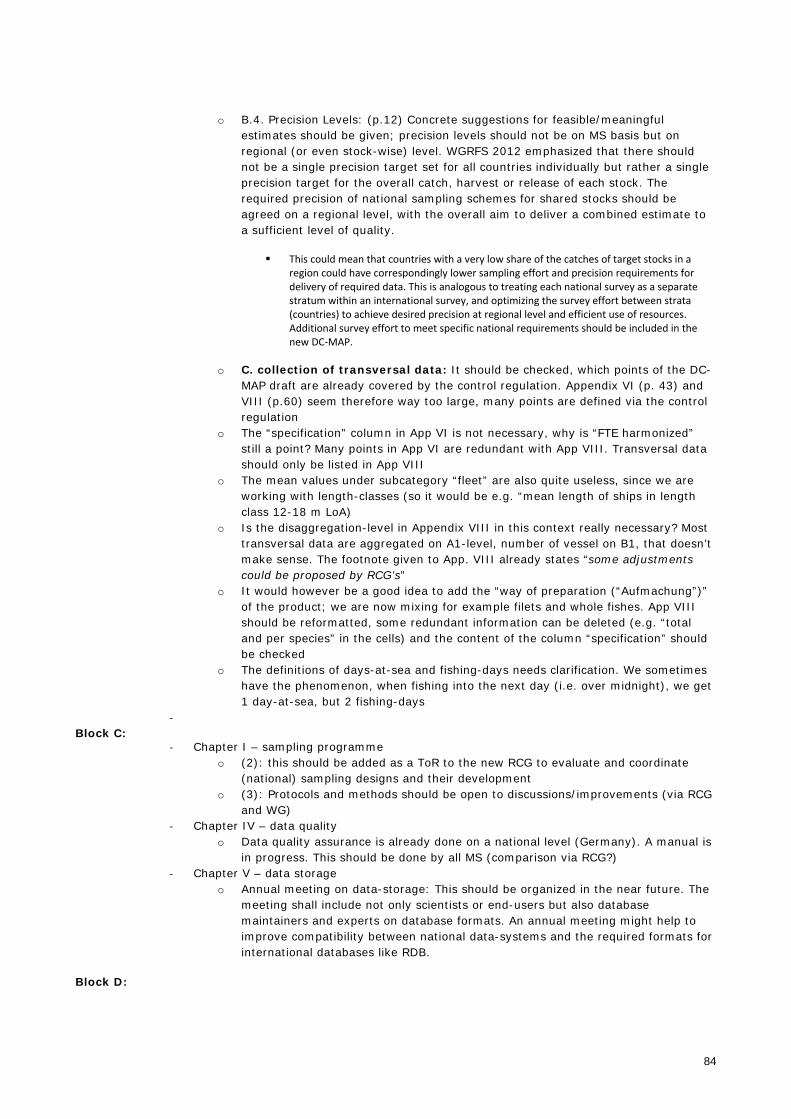
84
o B.4. Precision Levels: (p.12) Concrete suggestions for feasible/meaningful estimates should be given; precision levels should not be on MS basis but on regional (or even stock-wise) level. WGRFS 2012 emphasized that there should not be a single precision target set for all countries individually but rather a single precision target for the overall catch, harvest or release of each stock. The required precision of national sampling schemes for shared stocks should be agreed on a regional level, with the overall aim to deliver a combined estimate to a sufficient level of quality.
This could mean that countries with a very low share of the catches of target stocks in a region could have correspondingly lower sampling effort and precision requirements for delivery of required data. This is analogous to treating each national survey as a separate stratum within an international survey, and optimizing the survey effort between strata (countries) to achieve desired precision at regional level and efficient use of resources. Additional survey effort to meet specific national requirements should be included in the new DC‐MAP.
o C. collection of transversal data: It should be checked, which points of the DC-MAP draft are already covered by the control regulation. Appendix VI (p. 43) and VIII (p.60) seem therefore way too large, many points are defined via the control regulation
o The “specification” column in App VI is not necessary, why is “FTE harmonized” still a point? Many points in App VI are redundant with App VIII. Transversal data should only be listed in App VIII
o The mean values under subcategory “fleet” are also quite useless, since we are working with length-classes (so it would be e.g. “mean length of ships in length class 12-18 m LoA)
o Is the disaggregation-level in Appendix VIII in this context really necessary? Most transversal data are aggregated on A1-level, number of vessel on B1, that doesn’t make sense. The footnote given to App. VIII already states “some adjustments could be proposed by RCG’s”
o It would however be a good idea to add the “way of preparation (“Aufmachung”)” of the product; we are now mixing for example filets and whole fishes. App VIII should be reformatted, some redundant information can be deleted (e.g. “total and per species” in the cells) and the content of the column “specification” should be checked
o The definitions of days-at-sea and fishing-days needs clarification. We sometimes have the phenomenon, when fishing into the next day (i.e. over midnight), we get 1 day-at-sea, but 2 fishing-days
‐ Block C:
‐ Chapter I – sampling programme o (2): this should be added as a ToR to the new RCG to evaluate and coordinate
(national) sampling designs and their development o (3): Protocols and methods should be open to discussions/improvements (via RCG
and WG) ‐ Chapter IV – data quality
o Data quality assurance is already done on a national level (Germany). A manual is in progress. This should be done by all MS (comparison via RCG?)
‐ Chapter V – data storage o Annual meeting on data-storage: This should be organized in the near future. The
meeting shall include not only scientists or end-users but also database maintainers and experts on database formats. An annual meeting might help to improve compatibility between national data-systems and the required formats for international databases like RDB.
Block D:

‐ Appendix IV 1) Baltic Sea Recreational fisheries (p. 33) There is no recreational fishery for sharks in the Baltic, i.e. exclude sharks. ICES’ addition: Sea trout LoA classes are not applicable for recreational fisheries since there are land- and sea-based activities, i.e. should read “not applicable”.
‐ 2) North Sea Recreational fisheries (p. 35) ICES’ addition: European lobster and Pollack LoA classes are not applicable for recreational fisheries since there are land- and sea-based activities, i.e. should read “not applicable”.
‐ 3) North Atlantic Recreational fisheries (p. 38) ICES’ addition: Pollack LoA classes are not applicable for recreational fisheries since there are land- and sea-based activities, i.e. should read “not applicable”.
‐ 4) Mediterranean Sea and Black Sea Recreational fisheries (p. 40) LoA classes are not applicable for recreational fisheries since there are land- and sea-based activities, i.e. should read “not applicable”.
Additional Comments RCM Baltic 2013: Would it be possible to establish a regional data collection programme? In general, a regional data collection programme should be possible. But this requires analyses, preparations, regional coordination and time to establish sampling procedures among national institutes. A stepwise approach seems recommendable. RCMs or RCGs could develop a road map (e.g. requirements, steps to be taken). A sampling procedure, agreed upon by all MS involved, could then be tested on the level of one or two selected fish stocks within a region (e.g. in the Baltic Sea: cod (and associated flatfishes), and herring or sprat). A full regional data collection programme is unlikely, simply due to issues of accounting. We may rather try to improve the harmonization between MS. How should the upcoming Regional Coordination Groups (successor of the RCM’s) work? Multi-annual- and specific ToRs: The RCG venue alternates annually between MS institutes. The data collection programme of the hosting country should be presented in detail and critically reviewed. However, overlap with STECF should be avoided. One of the multi-annual ToRs could read: “Evaluate, coordinate and harmonize national fisheries data sampling schemes”. Specific ToRs could be forwarded to working groups (e.g. WGRFS, WGCATCH). This would improve the cooperation of WGs, WKs and RCGs (see also the MoU ICES-EU). Supranational meeting of recreational fisheries: To establish a formalized feedback path a supranational meeting hosted by one of the RCGs could bring together recreational fisheries experts. Given the low number of experts in the field, this ensures that the relevant experts can participate and express their point of view. RCGs could assess sampling programmes and analyse sampling performance and recommend improvements regarding the harmonization and quality insurance of sampling, raising, data storage etc. Precision levels may be determined stock-wise; the precision levels could be determined during RCGs, involving (where necessary) other EGs.
86
This graph shows how RCGs could work What responsibility should a chairman and possibly a co-chair be given? We think that the RCMs should continue to have the character of advisory groups with a restricted range for decisions (responsibility for harmonization should have STECF). The (co-)chair should be primus inter pares, coordinating the meeting. The Guidelines for ICES expert groups (Version 2012-1) seem to be a useful approach (p.7 onwards) also valid for RCGs. Latvia For Latvia the main concern is related to the collection of data that haven’t been collected so far. It is planned that the new DC-MAP will include data collection on the whole aquaculture sector including freshwater and the collection of social data. If freshwater aquaculture is included in DC-MAP there should be some transition period with pilot studies. It should be clear whether we should collect data also from so-called self-consumption aquaculture. There are quite many farms that are performing some aquaculture, mainly in ponds, but the production is mainly used for self-consumption. In many cases the economic side of such activities is poorly or not recorded. Concerning the collection of social data Latvia agrees with the STECF report that it should be started with a pilot study and shouldn’t be performed on yearly basis. Concerning the ecosystem indicators Latvia agrees with STECF that end-users first need to agree a priority list of indicators to suit their needs. The priority for data collection under the DC-MAP should be given to those indicators that have been tested and proven to be suitable for measuring the impact of fishing activities on the marine ecosystem. Latvia supports the opinion that institutes in charge of the implementation of the national programme should have timely access to all primary data fleet register information, special fishing permits information, fishing authorization information, logbook information, sales notes information, VMS data. However, since the transversal variables are highly important for the analysis of fishing sector Latvia does not see problem that
they are included in DC-MAP as evidently in the Baltic Sea region the access to these data is good enough and does not requires extra funding. Latvia supports the recommendation of STECF that Member States involved in the relevant fisheries and having a share of minimum xx% (where xx% should be determined by the Commission) in landings of a stock covered under a survey shall participate in surveys. Latvia considers that the monitoring of the by-catch of non-protected non fisheries species should be performed under other EU regulations. Besides the necessity of performing such monitoring in the Baltic Sea (by region) should be evaluated. Lithuania The comments by Lithuania has to be revised also by NC of Lithuania and experts involved into collection of economic data. Current review reflects only opinion of biologists fishing effort experts. Building Block A: GENERAL PROVISIONS Definitions are clear and understandable Building Block B: EU MULTI-ANNUAL COMMON CORE DATA COLLECTION PROGRAMME Chapter III Metier-related variables - Sampling obligation from flag country to first landing country. Lithuania supports this way of sampling as it’s in most cases rather effective and cheapest way to perform sampling. However, from fishery in distant waters landings are taking place in third countries, which are not EU members and/or DCF participants. In that cases only sampling at sea by observers ensure data collection. Metier ranking system using criteria of 90% is acceptable. Otherwise additional 5% would include metiers, from which collection of data in sufficient numbers or quality achievement would be complicated. Stock-related variables EWG 13-05 suggesting that the data to be collected is based on analyses of end-users needs. The problem is that not all end-users perform and/or provide the results of analysis. End-users must report to EC and ICES what data and from which countries are crucial. There are several cases when MS are obligated to collect data according to Regulation, while some end-users requires only part of data since major players in certain fisheries are from third countries and they have sufficient amount of data for stock assessment. This issue must be clarified. Chapter V Module of evaluation of the effects of the fisheries sector on the marine ecosystem By-catch issues MS can carry out a pilot studies for inventory of areas where by-catch of unwanted animals may occur. After pilot study areas of interest and fishery types for futher sampling could be chosen.
Building Block C: COLLECTION, STORAGE AND USE OF DATA BY MEMBER STATES
Chapter I Multi-annual programmes - NAFO areas are moved back to RCM NA. In terms of sampling coordination this is a good idea. However, in terms of attendance of RCM meetings, this would require extra experts and time (4 RCMs in row). Chapter IV Data quality CVs are not ideal indicators for evaluation of data quality. Some other methods could be applied. Building Block D: MASTER REFERENCE REGISTER It’s difficult to predict benefits of this. Therefore there are no comments.
88
Poland
The ICES feedback on DC-MAP is a very important input to the process of setting new data collection scheme and shall be given full consideration in designing DC-MAP. Consultation Document prepared by the Commission and STECF EWG 13-05 Report are both very welcomed by Poland as a good starting point in the process of transferring from current DCF to future DC-MAP. There are still a lot of issues to be solved and clarified as we are just on the beginning of the process. Setting the sampling program at regional level is a preferred option. Issues, which could be MS-specific but require careful attention include:
Extending aquaculture data collection to freshwater – given the number and variety (in terms of legal status, size, target production) of freshwater inland aquaculture sites in some MS, the potential increase in workload and overall cost of data collection raises concern,
Introduction of EMFF as funding source for data collection through the Paying Agency can create a number of problems due to a complex internal procedures applicable for programs co-financed by the EU,
It is still unclear the format of Annual Workplans and Annual Reports and what procedure will apply with regard to the adoption/acceptance of Annual Reports (who will have the final say – EC or funds provider?),
Landing obligation to be introduced gradually over the number of years - there still is a need to continue data collection through the at sea observer program in order to obtain reliable discard data – as not all species fished will be covered by landing obligation (e.g. protected species) and there is no obligation to record in the logbooks all discards, even if legally allowed. In this context, the discard data obtained through DC-MAP could not be used as compliance and surveillance means under the Control Regulations, in order to maintain the data collection observer program separate and independent from fisheries inspection and not to undermine the trust between the industry and scientific community. By-catch of protected non-fisheries species – the option one provided in the STECF EWG 13-05 Report, to cover the monitoring of this by-catch within the framework of DC-MAP, seems more practical to apply given the resources available as compared with option two providing for dedicated sampling program. Sweden The report is very easy to read and gives for the first time in the review process a clear indication on what the DC-MAP may look like, including details listed in appendices. It´s also very nice to see that the ideas and recommendations from meetings held the last years in the review process has been included and somewhat concretized. In particular is it nice to see that details on how sampling should be carried out has been replaced by references to good practice and design based sampling. General comments and remarks are presented chapter by chapter below. CHAPTER I – TRANSVERSAL DATA General: The overall intentions in this chapter, to make data available and avoid duplication of collection of data are of cause fine. Some concerns The control regulation which is suggested to be the main source for collection of transversial variables do not match the present DCF in all it´s details, it is also unclear how the control regulation will be amended as a consequence of the new CFP. For example
Discards needs only to be registered if they exceed 50 kg by species and day.
In the Swedish Skagerrak fishery this mean that there is a requirement to report less than 1/5 of the encountered species. This may have implications for the availability of data on protected species, elasmobranches and stocks of small sizes.
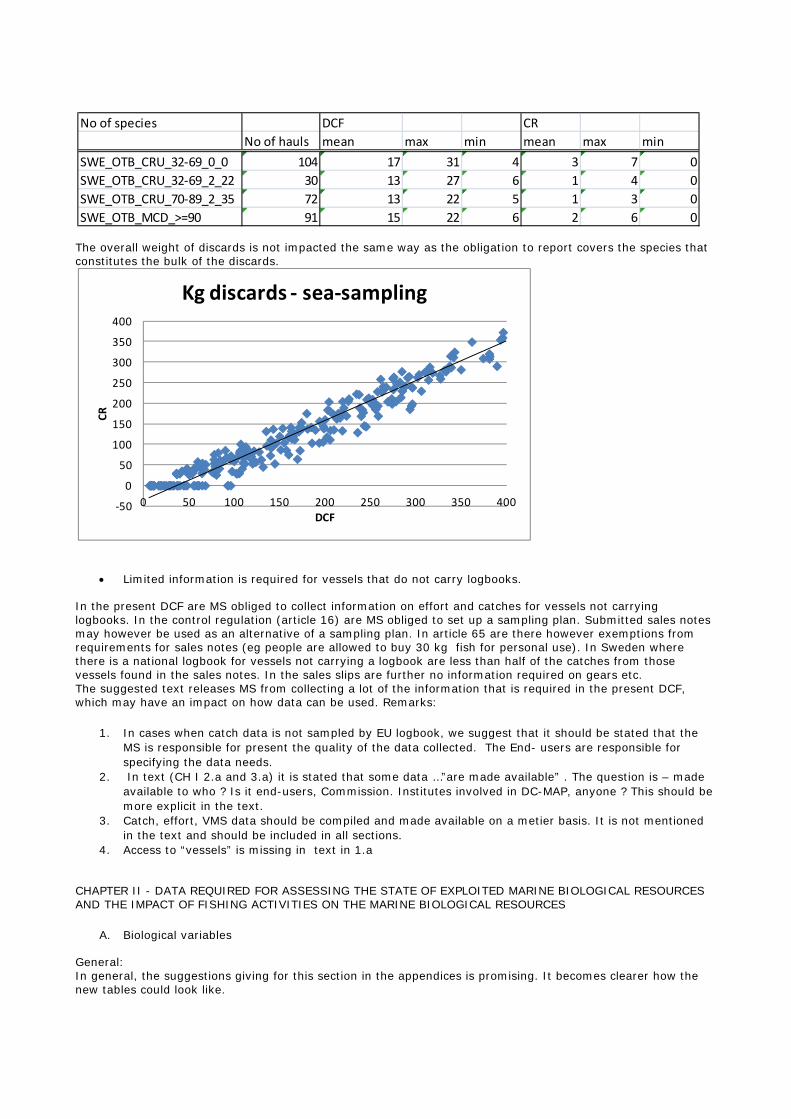
The overall weight of discards is not impacted the same way as the obligation to report covers the species that constitutes the bulk of the discards.
Limited information is required for vessels that do not carry logbooks.
In the present DCF are MS obliged to collect information on effort and catches for vessels not carrying logbooks. In the control regulation (article 16) are MS obliged to set up a sampling plan. Submitted sales notes may however be used as an alternative of a sampling plan. In article 65 are there however exemptions from requirements for sales notes (eg people are allowed to buy 30 kg fish for personal use). In Sweden where there is a national logbook for vessels not carrying a logbook are less than half of the catches from those vessels found in the sales notes. In the sales slips are further no information required on gears etc. The suggested text releases MS from collecting a lot of the information that is required in the present DCF, which may have an impact on how data can be used. Remarks:
1. In cases when catch data is not sampled by EU logbook, we suggest that it should be stated that the MS is responsible for present the quality of the data collected. The End- users are responsible for specifying the data needs.
2. In text (CH I 2.a and 3.a) it is stated that some data …”are made available” . The question is – made available to who ? Is it end-users, Commission. Institutes involved in DC-MAP, anyone ? This should be more explicit in the text.
3. Catch, effort, VMS data should be compiled and made available on a metier basis. It is not mentioned in the text and should be included in all sections.
4. Access to “vessels” is missing in text in 1.a
CHAPTER II - DATA REQUIRED FOR ASSESSING THE STATE OF EXPLOITED MARINE BIOLOGICAL RESOURCES AND THE IMPACT OF FISHING ACTIVITIES ON THE MARINE BIOLOGICAL RESOURCES
A. Biological variables
General: In general, the suggestions giving for this section in the appendices is promising. It becomes clearer how the new tables could look like.
No of species DCF CR
No of hauls mean max min mean max min
SWE_OTB_CRU_32‐69_0_0 104 17 31 4 3 7 0
SWE_OTB_CRU_32‐69_2_22 30 13 27 6 1 4 0
SWE_OTB_CRU_70‐89_2_35 72 13 22 5 1 3 0
SWE_OTB_MCD_>=90 91 15 22 6 2 6 0
‐50
0
50
100
150
200
250
300
350
400
0 50 100 150 200 250 300 350 400
CR
DCF
Kg discards ‐ sea‐sampling
90
However, some important parts are missing. We would expect to find a text which clarifies how regional coordination and flexibility should work in the DC-MAP and some clarification of the difference between core – and optional variables. Is the flexibility based on optional variables ? The role of RCG on these matters should be clarified. We suggest that a section is included where the benefits for the MS of establishing good regional cooperation are stated. (e g to establish minimum levels of sampling on MS level which can be taken off the MS responsibility if regional cooperation is set up… ) The interactions between RCG and end-users should be clarified and stated in the text
1. Variables to collected – Commercial fisheries 2. a Does it refer to landings or catch ? 2. Exemptions 2. e The threshold of 200 tonnes should go out (to avoid non sampling of stocks like cod
Kattegat) 3. Exemptions 2. e) Text about foreign landings should not be included in the legal text…. 4. 2.f consideration of métiers is not linked to the rest in an appropriate way.
Salmon and eel in the Baltic The data needs for eel and salmon is not addressed in the report because of time constraints. However, according to recommendations made (described below), there is a need for better coordination and regional cooperation of these species and something for the RCM Baltic to consider. ICES workshop on eel and salmon DCF data (WKESDCF) held in July 2012 had the key tasks to determine data requirements, describe adequate monitoring and survey programs, and consider options for integrating salmon and eel data collection. The WKESDCF report explains needs and provides important recommandations for improvements and coordination of the data collection of salmon and eel in both the Baltic Sea and the Arctic. In 2007, the EU Council of Ministers adopted a Regulation to protect and recover the eel. The Baltic area is mentioned in the preamble of the Regulation, as an area where coordination between countries is required. In 2012, individual countries have post-evaluated their actions to monitor and protect their part of the shared eel stock, and have reported to the EU Commission.. Though HELCOM aims to integrate Baltic eel assessments and management, very little coordination or cooperation has been achieved and very little data are available for considerable parts of the Baltic; half the countries did not report the mandatory stock indicators to the EU. It is generally acknowledged that international coordination and standardization are urgently required, and for this, further initiatives will be required in the Baltic. Besides considering the reports mentioned above, it is important for the RCM to discuss and support regional coordination regarding the eel in the Baltic. Special remarks:
B. Research Surveys at sea Support the approach on the traditional surveys. The need for fishery independent data on species/stocks (eg. eel) that are not caught in the traditional surveys and for which fishery dependant data becomes less available as a consequence of stock declines/regulations need to be investigated and considered. CHAPTER III – DATA REQUIRED FOR ASSESSING THE IMPACT OF FISHING ACTIVITIES ON THE MARINE ECOSYSTEM
A. By- Catch It´s clear that this can be handled by different approaches. … if sampling programs with observer at sea still is running…..
B. Environmental indicators
Wise approach described in the report CHAPTER IV – DATA REQUIRED FOR ASSESSING THE SOCIAL AND ECONOMICAL PERFORMANCE OF FISHING, AQUACULTURE AND PROCESSING SECTOR
A. Economic and social data required for assessing the performance of the fishing sector No comments
B. Economic and social data required for assessing the performance of the aquaculture sector General:
The text in the report reflects the discussions and the suggestions made by PGECON and STECF EWG, which is fine. We support the idea of conducting pilotstudies before introducing new variables (social variables) and set periodicity of sampling to every three years. No major comments to add. Outstanding issues: Since the direction of the new fisheries fund (EMFF) will be different in different MS, it is important to include” investment subsidies” among the variables, to create a link to the policy outlined in EMFF. Some MS may choose to keep the structure of the current fund with all the different types of investment subsidies available. Other MS (e.g Sweden) may choose to reform the type of investment subsidies in the policy package. A pilot study on the comparability between different investment support schemes is suggested.
C. Economic and social data required for assessing the performance of the processing industry General:
The text in the report reflects the discussions and the suggestions made by PGECON and STECF EWG. It is still unclear if and on what level the sampling of processing industry will be included in DC-MAP.
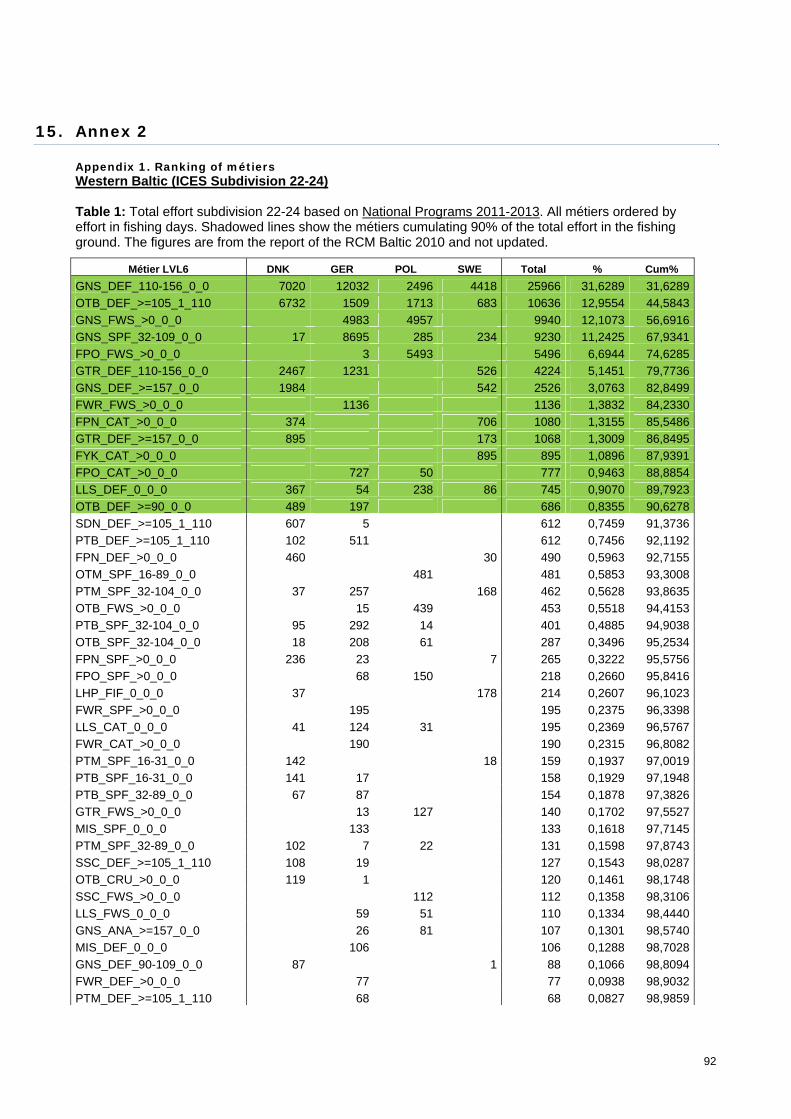
92
15. Annex 2 Appendix 1. Ranking of métiers Western Baltic (ICES Subdivision 22-24)
Table 1: Total effort subdivision 22-24 based on National Programs 2011-2013. All métiers ordered by effort in fishing days. Shadowed lines show the métiers cumulating 90% of the total effort in the fishing ground. The figures are from the report of the RCM Baltic 2010 and not updated.
Métier LVL6 DNK GER POL SWE Total % Cum%
GNS_DEF_110-156_0_0 7020 12032 2496 4418 25966 31,6289 31,6289
OTB_DEF_>=105_1_110 6732 1509 1713 683 10636 12,9554 44,5843
GNS_FWS_>0_0_0 4983 4957 9940 12,1073 56,6916
GNS_SPF_32-109_0_0 17 8695 285 234 9230 11,2425 67,9341
FPO_FWS_>0_0_0 3 5493 5496 6,6944 74,6285
GTR_DEF_110-156_0_0 2467 1231 526 4224 5,1451 79,7736
GNS_DEF_>=157_0_0 1984 542 2526 3,0763 82,8499
FWR_FWS_>0_0_0 1136 1136 1,3832 84,2330
FPN_CAT_>0_0_0 374 706 1080 1,3155 85,5486
GTR_DEF_>=157_0_0 895 173 1068 1,3009 86,8495
FYK_CAT_>0_0_0 895 895 1,0896 87,9391
FPO_CAT_>0_0_0 727 50 777 0,9463 88,8854
LLS_DEF_0_0_0 367 54 238 86 745 0,9070 89,7923
OTB_DEF_>=90_0_0 489 197 686 0,8355 90,6278
SDN_DEF_>=105_1_110 607 5 612 0,7459 91,3736
PTB_DEF_>=105_1_110 102 511 612 0,7456 92,1192
FPN_DEF_>0_0_0 460 30 490 0,5963 92,7155
OTM_SPF_16-89_0_0 481 481 0,5853 93,3008
PTM_SPF_32-104_0_0 37 257 168 462 0,5628 93,8635
OTB_FWS_>0_0_0 15 439 453 0,5518 94,4153
PTB_SPF_32-104_0_0 95 292 14 401 0,4885 94,9038
OTB_SPF_32-104_0_0 18 208 61 287 0,3496 95,2534
FPN_SPF_>0_0_0 236 23 7 265 0,3222 95,5756
FPO_SPF_>0_0_0 68 150 218 0,2660 95,8416
LHP_FIF_0_0_0 37 178 214 0,2607 96,1023
FWR_SPF_>0_0_0 195 195 0,2375 96,3398
LLS_CAT_0_0_0 41 124 31 195 0,2369 96,5767
FWR_CAT_>0_0_0 190 190 0,2315 96,8082
PTM_SPF_16-31_0_0 142 18 159 0,1937 97,0019
PTB_SPF_16-31_0_0 141 17 158 0,1929 97,1948
PTB_SPF_32-89_0_0 67 87 154 0,1878 97,3826
GTR_FWS_>0_0_0 13 127 140 0,1702 97,5527
MIS_SPF_0_0_0 133 133 0,1618 97,7145
PTM_SPF_32-89_0_0 102 7 22 131 0,1598 97,8743
SSC_DEF_>=105_1_110 108 19 127 0,1543 98,0287
OTB_CRU_>0_0_0 119 1 120 0,1461 98,1748
SSC_FWS_>0_0_0 112 112 0,1358 98,3106
LLS_FWS_0_0_0 59 51 110 0,1334 98,4440
GNS_ANA_>=157_0_0 26 81 107 0,1301 98,5740
MIS_DEF_0_0_0 106 106 0,1288 98,7028
GNS_DEF_90-109_0_0 87 1 88 0,1066 98,8094
FWR_DEF_>0_0_0 77 77 0,0938 98,9032
PTM_DEF_>=105_1_110 68 68 0,0827 98,9859
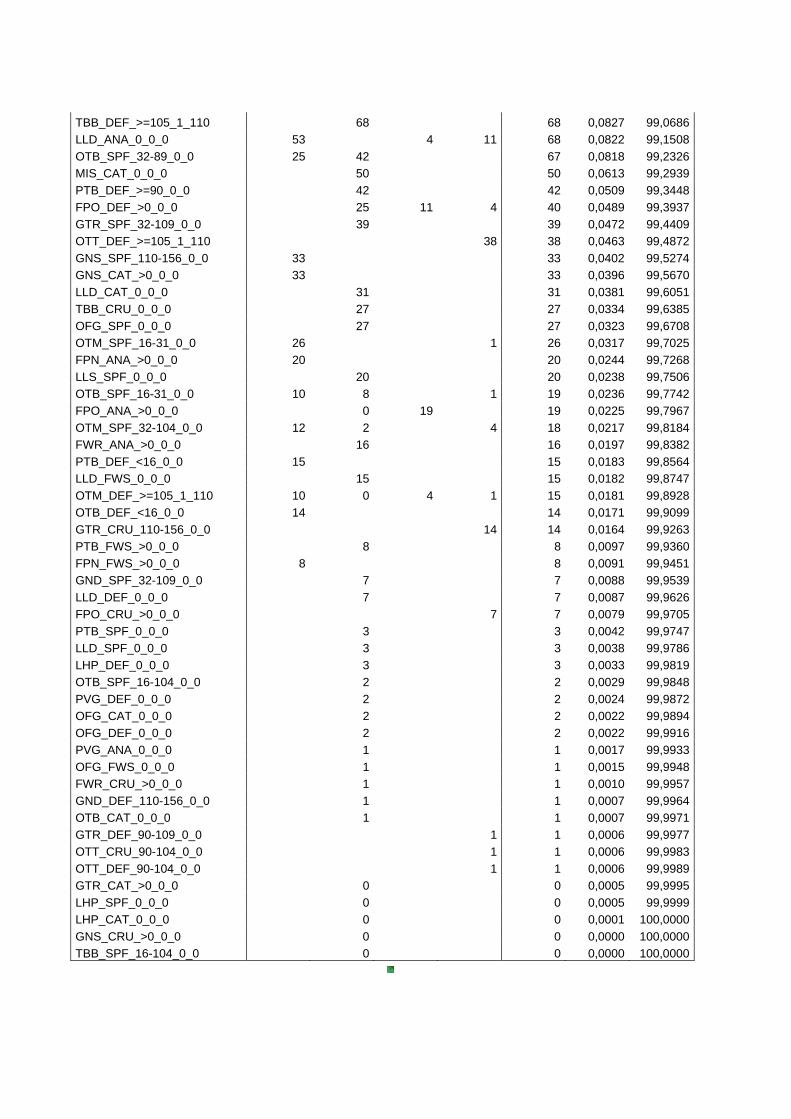
TBB_DEF_>=105_1_110 68 68 0,0827 99,0686
LLD_ANA_0_0_0 53 4 11 68 0,0822 99,1508
OTB_SPF_32-89_0_0 25 42 67 0,0818 99,2326
MIS_CAT_0_0_0 50 50 0,0613 99,2939
PTB_DEF_>=90_0_0 42 42 0,0509 99,3448
FPO_DEF_>0_0_0 25 11 4 40 0,0489 99,3937
GTR_SPF_32-109_0_0 39 39 0,0472 99,4409
OTT_DEF_>=105_1_110 38 38 0,0463 99,4872
GNS_SPF_110-156_0_0 33 33 0,0402 99,5274
GNS_CAT_>0_0_0 33 33 0,0396 99,5670
LLD_CAT_0_0_0 31 31 0,0381 99,6051
TBB_CRU_0_0_0 27 27 0,0334 99,6385
OFG_SPF_0_0_0 27 27 0,0323 99,6708
OTM_SPF_16-31_0_0 26 1 26 0,0317 99,7025
FPN_ANA_>0_0_0 20 20 0,0244 99,7268
LLS_SPF_0_0_0 20 20 0,0238 99,7506
OTB_SPF_16-31_0_0 10 8 1 19 0,0236 99,7742
FPO_ANA_>0_0_0 0 19 19 0,0225 99,7967
OTM_SPF_32-104_0_0 12 2 4 18 0,0217 99,8184
FWR_ANA_>0_0_0 16 16 0,0197 99,8382
PTB_DEF_<16_0_0 15 15 0,0183 99,8564
LLD_FWS_0_0_0 15 15 0,0182 99,8747
OTM_DEF_>=105_1_110 10 0 4 1 15 0,0181 99,8928
OTB_DEF_<16_0_0 14 14 0,0171 99,9099
GTR_CRU_110-156_0_0 14 14 0,0164 99,9263
PTB_FWS_>0_0_0 8 8 0,0097 99,9360
FPN_FWS_>0_0_0 8 8 0,0091 99,9451
GND_SPF_32-109_0_0 7 7 0,0088 99,9539
LLD_DEF_0_0_0 7 7 0,0087 99,9626
FPO_CRU_>0_0_0 7 7 0,0079 99,9705
PTB_SPF_0_0_0 3 3 0,0042 99,9747
LLD_SPF_0_0_0 3 3 0,0038 99,9786
LHP_DEF_0_0_0 3 3 0,0033 99,9819
OTB_SPF_16-104_0_0 2 2 0,0029 99,9848
PVG_DEF_0_0_0 2 2 0,0024 99,9872
OFG_CAT_0_0_0 2 2 0,0022 99,9894
OFG_DEF_0_0_0 2 2 0,0022 99,9916
PVG_ANA_0_0_0 1 1 0,0017 99,9933
OFG_FWS_0_0_0 1 1 0,0015 99,9948
FWR_CRU_>0_0_0 1 1 0,0010 99,9957
GND_DEF_110-156_0_0 1 1 0,0007 99,9964
OTB_CAT_0_0_0 1 1 0,0007 99,9971
GTR_DEF_90-109_0_0 1 1 0,0006 99,9977
OTT_CRU_90-104_0_0 1 1 0,0006 99,9983
OTT_DEF_90-104_0_0 1 1 0,0006 99,9989
GTR_CAT_>0_0_0 0 0 0,0005 99,9995
LHP_SPF_0_0_0 0 0 0,0005 99,9999
LHP_CAT_0_0_0 0 0 0,0001 100,0000
GNS_CRU_>0_0_0 0 0 0,0000 100,0000
TBB_SPF_16-104_0_0 0 0 0,0000 100,0000
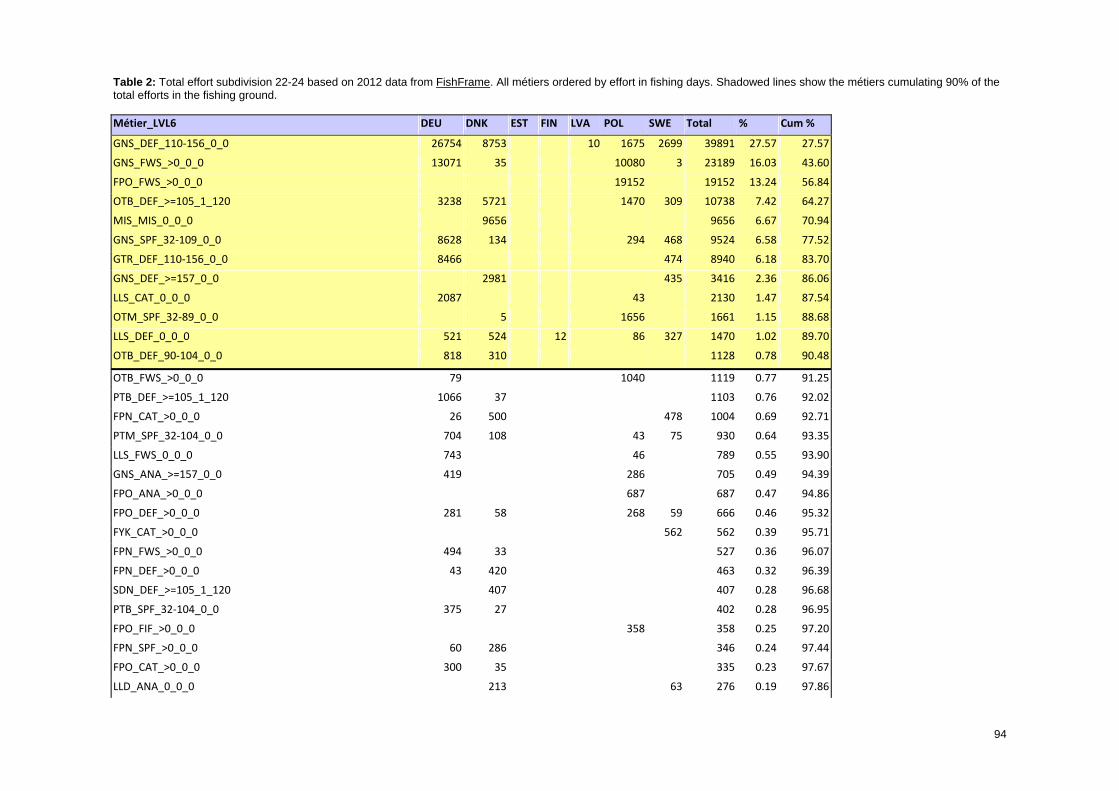
94
Table 2: Total effort subdivision 22-24 based on 2012 data from FishFrame. All métiers ordered by effort in fishing days. Shadowed lines show the métiers cumulating 90% of the total efforts in the fishing ground. Métier_LVL6 DEU DNK EST FIN LVA POL SWE Total % Cum %
GNS_DEF_110‐156_0_0 26754 8753 10 1675 2699 39891 27.57 27.57
GNS_FWS_>0_0_0 13071 35 10080 3 23189 16.03 43.60
FPO_FWS_>0_0_0 19152 19152 13.24 56.84
OTB_DEF_>=105_1_120 3238 5721 1470 309 10738 7.42 64.27
MIS_MIS_0_0_0 9656 9656 6.67 70.94
GNS_SPF_32‐109_0_0 8628 134 294 468 9524 6.58 77.52
GTR_DEF_110‐156_0_0 8466 474 8940 6.18 83.70
GNS_DEF_>=157_0_0 2981 435 3416 2.36 86.06
LLS_CAT_0_0_0 2087 43 2130 1.47 87.54
OTM_SPF_32‐89_0_0 5 1656 1661 1.15 88.68
LLS_DEF_0_0_0 521 524 12 86 327 1470 1.02 89.70
OTB_DEF_90‐104_0_0 818 310 1128 0.78 90.48
OTB_FWS_>0_0_0 79 1040 1119 0.77 91.25
PTB_DEF_>=105_1_120 1066 37 1103 0.76 92.02
FPN_CAT_>0_0_0 26 500 478 1004 0.69 92.71
PTM_SPF_32‐104_0_0 704 108 43 75 930 0.64 93.35
LLS_FWS_0_0_0 743 46 789 0.55 93.90
GNS_ANA_>=157_0_0 419 286 705 0.49 94.39
FPO_ANA_>0_0_0 687 687 0.47 94.86
FPO_DEF_>0_0_0 281 58 268 59 666 0.46 95.32
FYK_CAT_>0_0_0 562 562 0.39 95.71
FPN_FWS_>0_0_0 494 33 527 0.36 96.07
FPN_DEF_>0_0_0 43 420 463 0.32 96.39
SDN_DEF_>=105_1_120 407 407 0.28 96.68
PTB_SPF_32‐104_0_0 375 27 402 0.28 96.95
FPO_FIF_>0_0_0 358 358 0.25 97.20
FPN_SPF_>0_0_0 60 286 346 0.24 97.44
FPO_CAT_>0_0_0 300 35 335 0.23 97.67
LLD_ANA_0_0_0 213 63 276 0.19 97.86
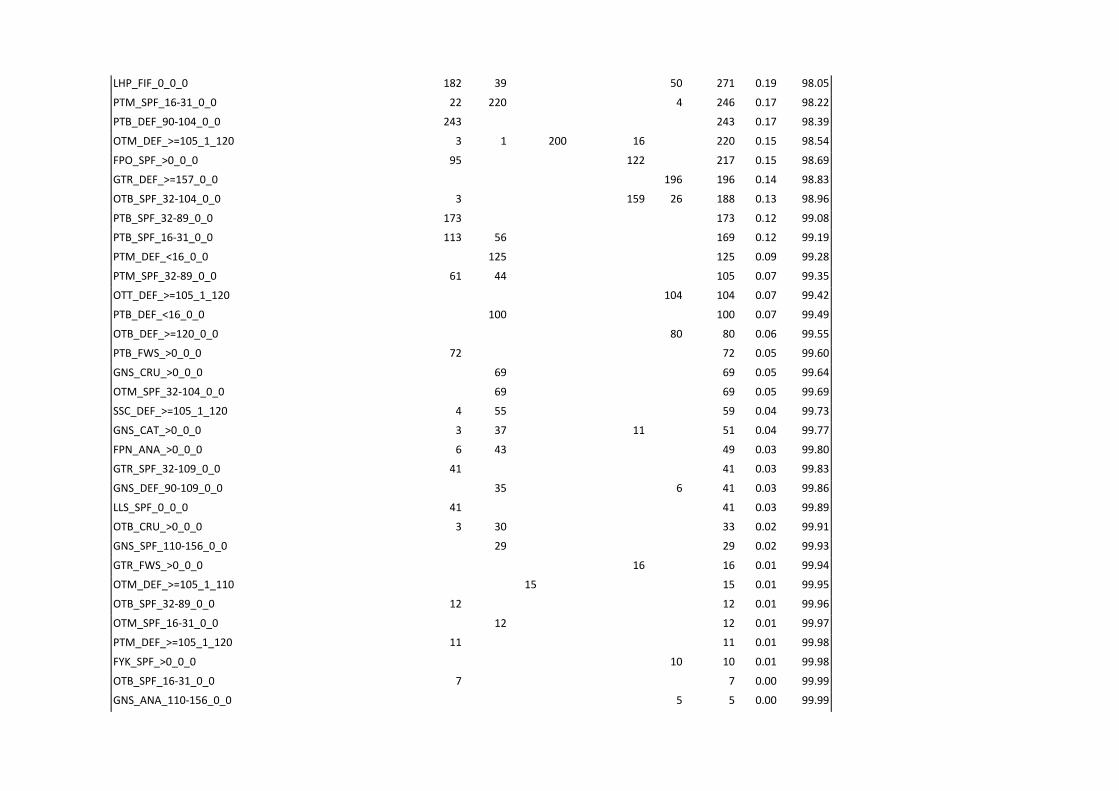
LHP_FIF_0_0_0 182 39 50 271 0.19 98.05
PTM_SPF_16‐31_0_0 22 220 4 246 0.17 98.22
PTB_DEF_90‐104_0_0 243 243 0.17 98.39
OTM_DEF_>=105_1_120 3 1 200 16 220 0.15 98.54
FPO_SPF_>0_0_0 95 122 217 0.15 98.69
GTR_DEF_>=157_0_0 196 196 0.14 98.83
OTB_SPF_32‐104_0_0 3 159 26 188 0.13 98.96
PTB_SPF_32‐89_0_0 173 173 0.12 99.08
PTB_SPF_16‐31_0_0 113 56 169 0.12 99.19
PTM_DEF_<16_0_0 125 125 0.09 99.28
PTM_SPF_32‐89_0_0 61 44 105 0.07 99.35
OTT_DEF_>=105_1_120 104 104 0.07 99.42
PTB_DEF_<16_0_0 100 100 0.07 99.49
OTB_DEF_>=120_0_0 80 80 0.06 99.55
PTB_FWS_>0_0_0 72 72 0.05 99.60
GNS_CRU_>0_0_0 69 69 0.05 99.64
OTM_SPF_32‐104_0_0 69 69 0.05 99.69
SSC_DEF_>=105_1_120 4 55 59 0.04 99.73
GNS_CAT_>0_0_0 3 37 11 51 0.04 99.77
FPN_ANA_>0_0_0 6 43 49 0.03 99.80
GTR_SPF_32‐109_0_0 41 41 0.03 99.83
GNS_DEF_90‐109_0_0 35 6 41 0.03 99.86
LLS_SPF_0_0_0 41 41 0.03 99.89
OTB_CRU_>0_0_0 3 30 33 0.02 99.91
GNS_SPF_110‐156_0_0 29 29 0.02 99.93
GTR_FWS_>0_0_0 16 16 0.01 99.94
OTM_DEF_>=105_1_110 15 15 0.01 99.95
OTB_SPF_32‐89_0_0 12 12 0.01 99.96
OTM_SPF_16‐31_0_0 12 12 0.01 99.97
PTM_DEF_>=105_1_120 11 11 0.01 99.98
FYK_SPF_>0_0_0 10 10 0.01 99.98
OTB_SPF_16‐31_0_0 7 7 0.00 99.99
GNS_ANA_110‐156_0_0 5 5 0.00 99.99
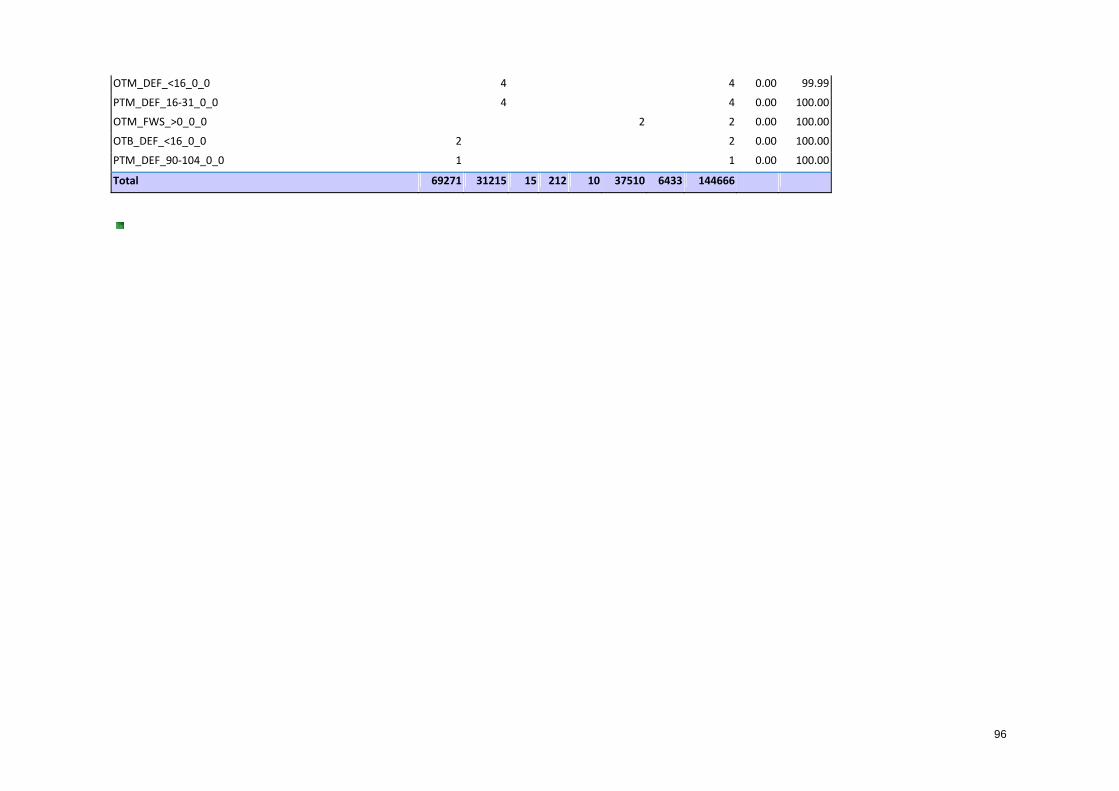
96
OTM_DEF_<16_0_0 4 4 0.00 99.99
PTM_DEF_16‐31_0_0 4 4 0.00 100.00
OTM_FWS_>0_0_0 2 2 0.00 100.00
OTB_DEF_<16_0_0 2 2 0.00 100.00
PTM_DEF_90‐104_0_0 1 1 0.00 100.00
Total 69271 31215 15 212 10 37510 6433 144666
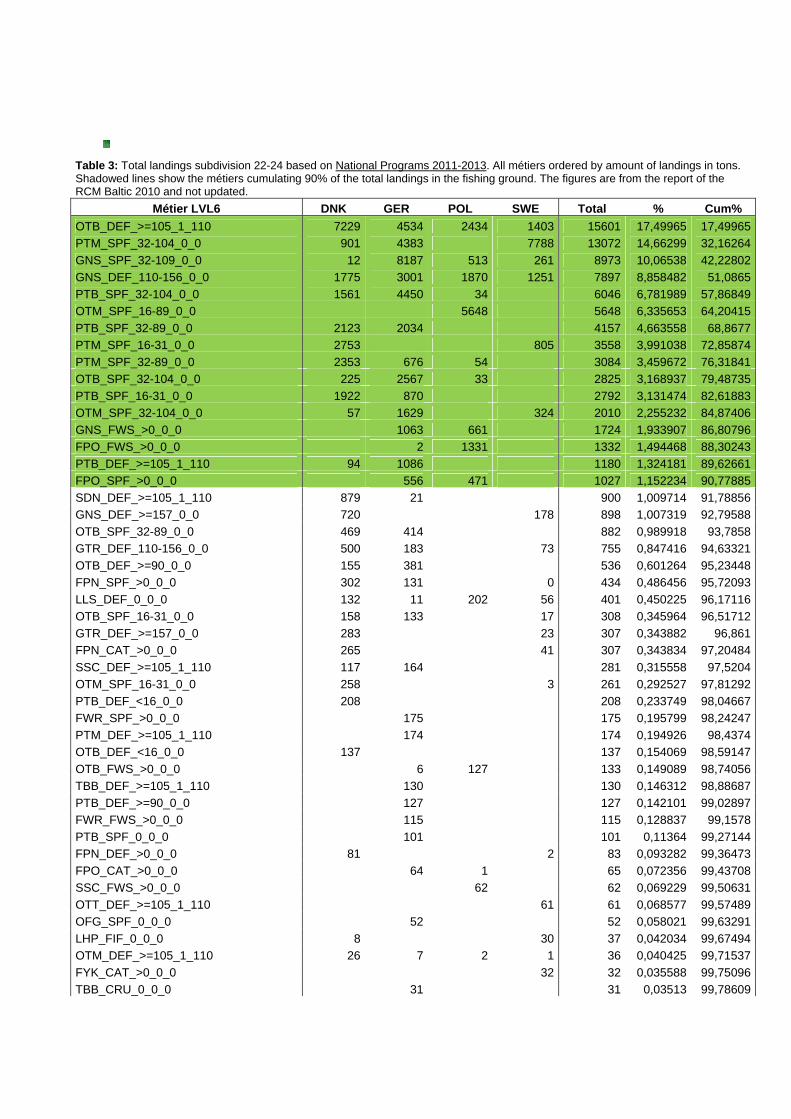
Table 3: Total landings subdivision 22-24 based on National Programs 2011-2013. All métiers ordered by amount of landings in tons. Shadowed lines show the métiers cumulating 90% of the total landings in the fishing ground. The figures are from the report of the RCM Baltic 2010 and not updated.
Métier LVL6 DNK GER POL SWE Total % Cum%
OTB_DEF_>=105_1_110 7229 4534 2434 1403 15601 17,49965 17,49965
PTM_SPF_32-104_0_0 901 4383 7788 13072 14,66299 32,16264
GNS_SPF_32-109_0_0 12 8187 513 261 8973 10,06538 42,22802
GNS_DEF_110-156_0_0 1775 3001 1870 1251 7897 8,858482 51,0865
PTB_SPF_32-104_0_0 1561 4450 34 6046 6,781989 57,86849
OTM_SPF_16-89_0_0 5648 5648 6,335653 64,20415
PTB_SPF_32-89_0_0 2123 2034 4157 4,663558 68,8677
PTM_SPF_16-31_0_0 2753 805 3558 3,991038 72,85874
PTM_SPF_32-89_0_0 2353 676 54 3084 3,459672 76,31841
OTB_SPF_32-104_0_0 225 2567 33 2825 3,168937 79,48735
PTB_SPF_16-31_0_0 1922 870 2792 3,131474 82,61883
OTM_SPF_32-104_0_0 57 1629 324 2010 2,255232 84,87406
GNS_FWS_>0_0_0 1063 661 1724 1,933907 86,80796
FPO_FWS_>0_0_0 2 1331 1332 1,494468 88,30243
PTB_DEF_>=105_1_110 94 1086 1180 1,324181 89,62661
FPO_SPF_>0_0_0 556 471 1027 1,152234 90,77885
SDN_DEF_>=105_1_110 879 21 900 1,009714 91,78856
GNS_DEF_>=157_0_0 720 178 898 1,007319 92,79588
OTB_SPF_32-89_0_0 469 414 882 0,989918 93,7858
GTR_DEF_110-156_0_0 500 183 73 755 0,847416 94,63321
OTB_DEF_>=90_0_0 155 381 536 0,601264 95,23448
FPN_SPF_>0_0_0 302 131 0 434 0,486456 95,72093
LLS_DEF_0_0_0 132 11 202 56 401 0,450225 96,17116
OTB_SPF_16-31_0_0 158 133 17 308 0,345964 96,51712
GTR_DEF_>=157_0_0 283 23 307 0,343882 96,861
FPN_CAT_>0_0_0 265 41 307 0,343834 97,20484
SSC_DEF_>=105_1_110 117 164 281 0,315558 97,5204
OTM_SPF_16-31_0_0 258 3 261 0,292527 97,81292
PTB_DEF_<16_0_0 208 208 0,233749 98,04667
FWR_SPF_>0_0_0 175 175 0,195799 98,24247
PTM_DEF_>=105_1_110 174 174 0,194926 98,4374
OTB_DEF_<16_0_0 137 137 0,154069 98,59147
OTB_FWS_>0_0_0 6 127 133 0,149089 98,74056
TBB_DEF_>=105_1_110 130 130 0,146312 98,88687
PTB_DEF_>=90_0_0 127 127 0,142101 99,02897
FWR_FWS_>0_0_0 115 115 0,128837 99,1578
PTB_SPF_0_0_0 101 101 0,11364 99,27144
FPN_DEF_>0_0_0 81 2 83 0,093282 99,36473
FPO_CAT_>0_0_0 64 1 65 0,072356 99,43708
SSC_FWS_>0_0_0 62 62 0,069229 99,50631
OTT_DEF_>=105_1_110 61 61 0,068577 99,57489
OFG_SPF_0_0_0 52 52 0,058021 99,63291
LHP_FIF_0_0_0 8 30 37 0,042034 99,67494
OTM_DEF_>=105_1_110 26 7 2 1 36 0,040425 99,71537
FYK_CAT_>0_0_0 32 32 0,035588 99,75096
TBB_CRU_0_0_0 31 31 0,03513 99,78609
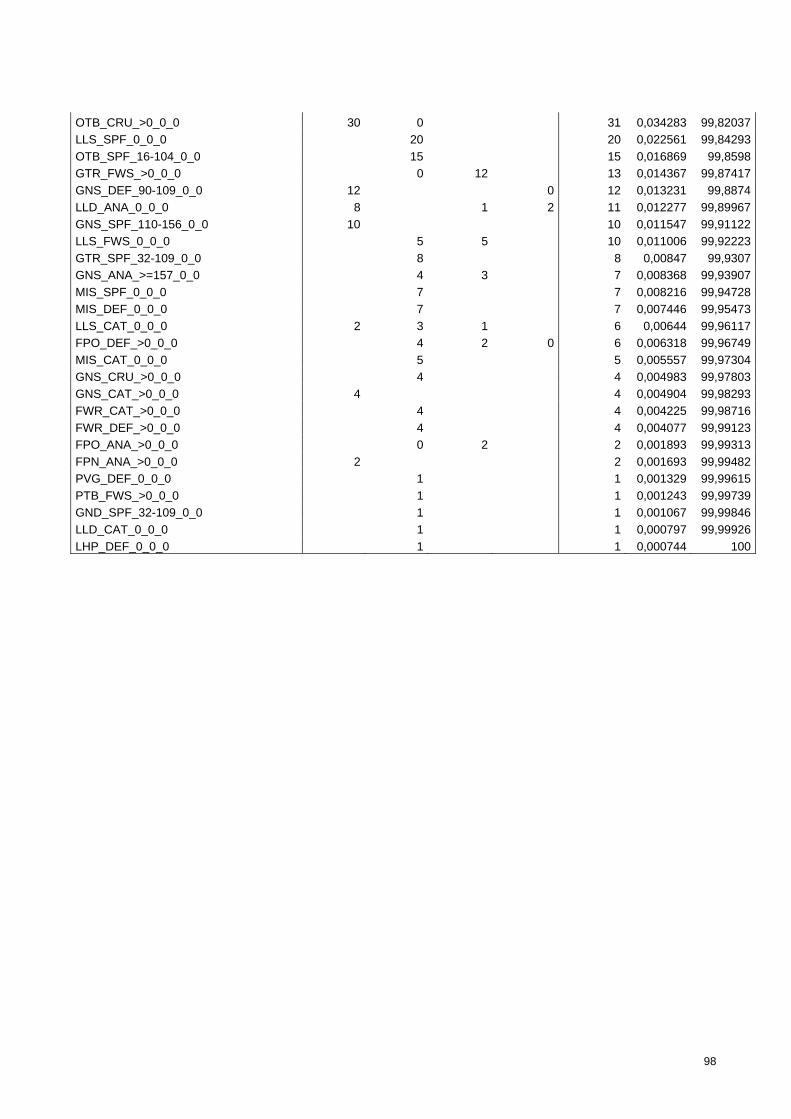
98
OTB_CRU_>0_0_0 30 0 31 0,034283 99,82037
LLS_SPF_0_0_0 20 20 0,022561 99,84293
OTB_SPF_16-104_0_0 15 15 0,016869 99,8598
GTR_FWS_>0_0_0 0 12 13 0,014367 99,87417
GNS_DEF_90-109_0_0 12 0 12 0,013231 99,8874
LLD_ANA_0_0_0 8 1 2 11 0,012277 99,89967
GNS_SPF_110-156_0_0 10 10 0,011547 99,91122
LLS_FWS_0_0_0 5 5 10 0,011006 99,92223
GTR_SPF_32-109_0_0 8 8 0,00847 99,9307
GNS_ANA_>=157_0_0 4 3 7 0,008368 99,93907
MIS_SPF_0_0_0 7 7 0,008216 99,94728
MIS_DEF_0_0_0 7 7 0,007446 99,95473
LLS_CAT_0_0_0 2 3 1 6 0,00644 99,96117
FPO_DEF_>0_0_0 4 2 0 6 0,006318 99,96749
MIS_CAT_0_0_0 5 5 0,005557 99,97304
GNS_CRU_>0_0_0 4 4 0,004983 99,97803
GNS_CAT_>0_0_0 4 4 0,004904 99,98293
FWR_CAT_>0_0_0 4 4 0,004225 99,98716
FWR_DEF_>0_0_0 4 4 0,004077 99,99123
FPO_ANA_>0_0_0 0 2 2 0,001893 99,99313
FPN_ANA_>0_0_0 2 2 0,001693 99,99482
PVG_DEF_0_0_0 1 1 0,001329 99,99615
PTB_FWS_>0_0_0 1 1 0,001243 99,99739
GND_SPF_32-109_0_0 1 1 0,001067 99,99846
LLD_CAT_0_0_0 1 1 0,000797 99,99926
LHP_DEF_0_0_0 1 1 0,000744 100
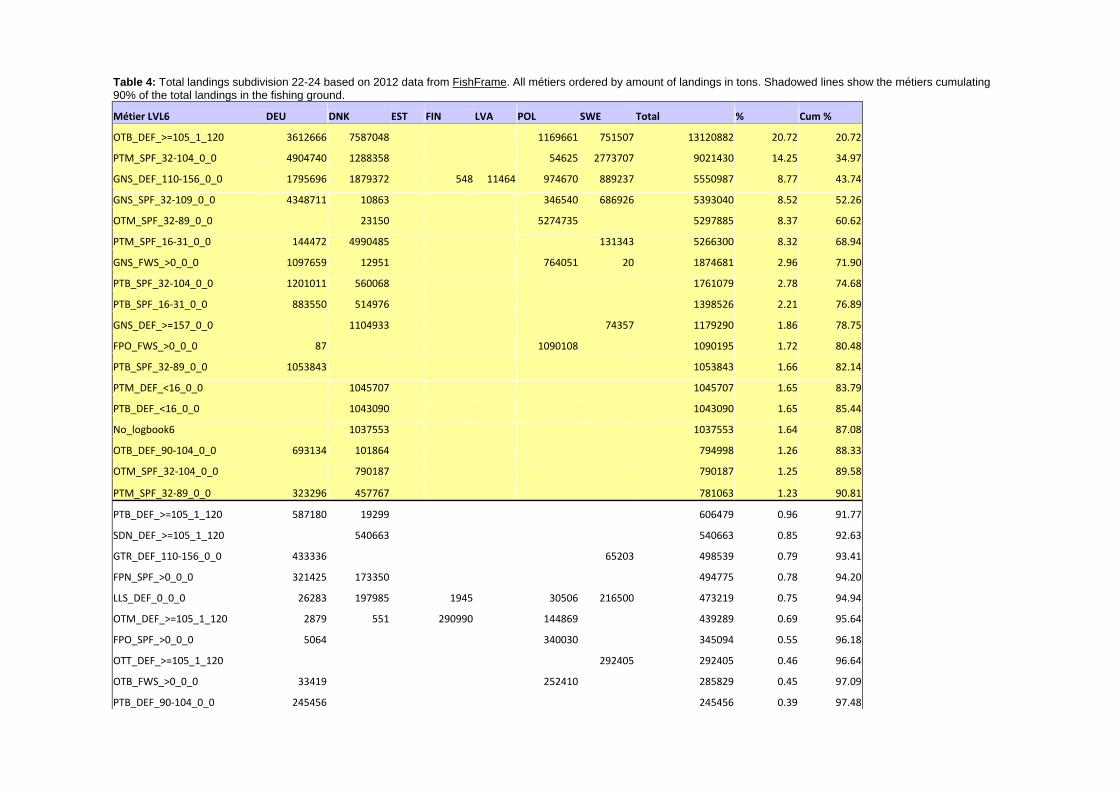
Table 4: Total landings subdivision 22-24 based on 2012 data from FishFrame. All métiers ordered by amount of landings in tons. Shadowed lines show the métiers cumulating 90% of the total landings in the fishing ground.
Métier LVL6 DEU DNK EST FIN LVA POL SWE Total % Cum %
OTB_DEF_>=105_1_120 3612666 7587048 1169661 751507 13120882 20.72 20.72
PTM_SPF_32‐104_0_0 4904740 1288358 54625 2773707 9021430 14.25 34.97
GNS_DEF_110‐156_0_0 1795696 1879372 548 11464 974670 889237 5550987 8.77 43.74
GNS_SPF_32‐109_0_0 4348711 10863 346540 686926 5393040 8.52 52.26
OTM_SPF_32‐89_0_0 23150 5274735 5297885 8.37 60.62
PTM_SPF_16‐31_0_0 144472 4990485 131343 5266300 8.32 68.94
GNS_FWS_>0_0_0 1097659 12951 764051 20 1874681 2.96 71.90
PTB_SPF_32‐104_0_0 1201011 560068 1761079 2.78 74.68
PTB_SPF_16‐31_0_0 883550 514976 1398526 2.21 76.89
GNS_DEF_>=157_0_0 1104933 74357 1179290 1.86 78.75
FPO_FWS_>0_0_0 87 1090108 1090195 1.72 80.48
PTB_SPF_32‐89_0_0 1053843 1053843 1.66 82.14
PTM_DEF_<16_0_0 1045707 1045707 1.65 83.79
PTB_DEF_<16_0_0 1043090 1043090 1.65 85.44
No_logbook6 1037553 1037553 1.64 87.08
OTB_DEF_90‐104_0_0 693134 101864 794998 1.26 88.33
OTM_SPF_32‐104_0_0 790187 790187 1.25 89.58
PTM_SPF_32‐89_0_0 323296 457767 781063 1.23 90.81
PTB_DEF_>=105_1_120 587180 19299 606479 0.96 91.77
SDN_DEF_>=105_1_120 540663 540663 0.85 92.63
GTR_DEF_110‐156_0_0 433336 65203 498539 0.79 93.41
FPN_SPF_>0_0_0 321425 173350 494775 0.78 94.20
LLS_DEF_0_0_0 26283 197985 1945 30506 216500 473219 0.75 94.94
OTM_DEF_>=105_1_120 2879 551 290990 144869 439289 0.69 95.64
FPO_SPF_>0_0_0 5064 340030 345094 0.55 96.18
OTT_DEF_>=105_1_120 292405 292405 0.46 96.64
OTB_FWS_>0_0_0 33419 252410 285829 0.45 97.09
PTB_DEF_90‐104_0_0 245456 245456 0.39 97.48
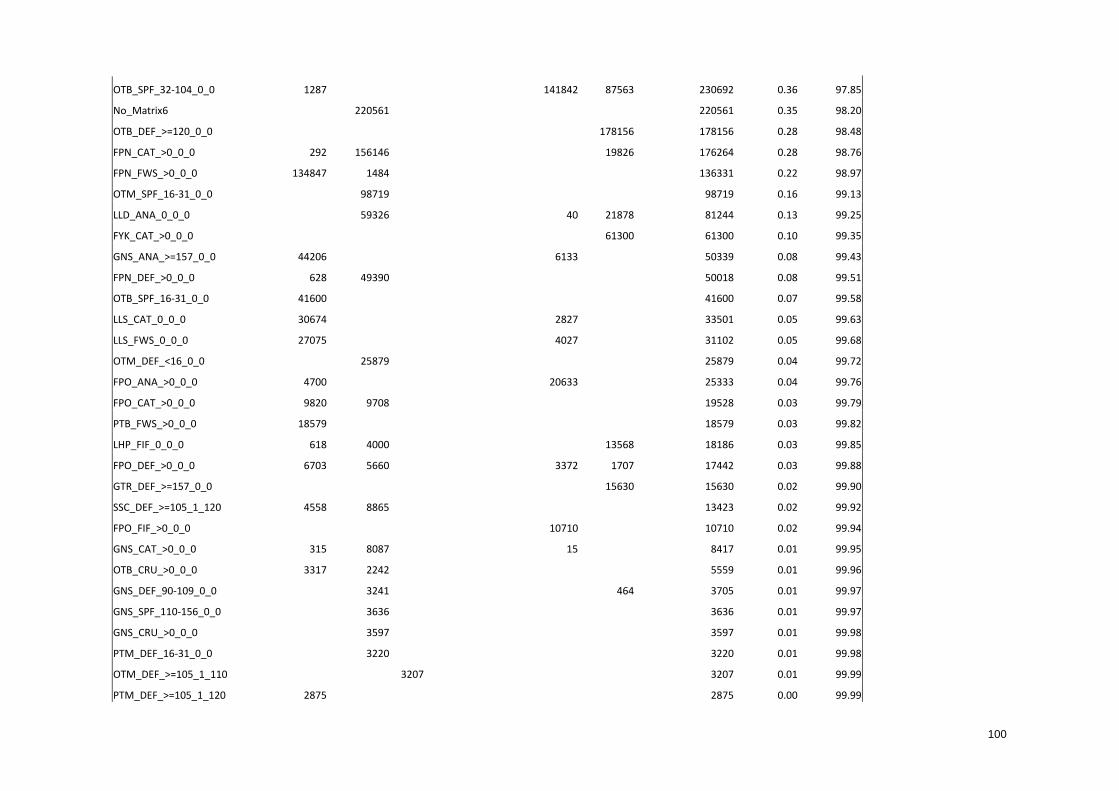
100
OTB_SPF_32‐104_0_0 1287 141842 87563 230692 0.36 97.85
No_Matrix6 220561 220561 0.35 98.20
OTB_DEF_>=120_0_0 178156 178156 0.28 98.48
FPN_CAT_>0_0_0 292 156146 19826 176264 0.28 98.76
FPN_FWS_>0_0_0 134847 1484 136331 0.22 98.97
OTM_SPF_16‐31_0_0 98719 98719 0.16 99.13
LLD_ANA_0_0_0 59326 40 21878 81244 0.13 99.25
FYK_CAT_>0_0_0 61300 61300 0.10 99.35
GNS_ANA_>=157_0_0 44206 6133 50339 0.08 99.43
FPN_DEF_>0_0_0 628 49390 50018 0.08 99.51
OTB_SPF_16‐31_0_0 41600 41600 0.07 99.58
LLS_CAT_0_0_0 30674 2827 33501 0.05 99.63
LLS_FWS_0_0_0 27075 4027 31102 0.05 99.68
OTM_DEF_<16_0_0 25879 25879 0.04 99.72
FPO_ANA_>0_0_0 4700 20633 25333 0.04 99.76
FPO_CAT_>0_0_0 9820 9708 19528 0.03 99.79
PTB_FWS_>0_0_0 18579 18579 0.03 99.82
LHP_FIF_0_0_0 618 4000 13568 18186 0.03 99.85
FPO_DEF_>0_0_0 6703 5660 3372 1707 17442 0.03 99.88
GTR_DEF_>=157_0_0 15630 15630 0.02 99.90
SSC_DEF_>=105_1_120 4558 8865 13423 0.02 99.92
FPO_FIF_>0_0_0 10710 10710 0.02 99.94
GNS_CAT_>0_0_0 315 8087 15 8417 0.01 99.95
OTB_CRU_>0_0_0 3317 2242 5559 0.01 99.96
GNS_DEF_90‐109_0_0 3241 464 3705 0.01 99.97
GNS_SPF_110‐156_0_0 3636 3636 0.01 99.97
GNS_CRU_>0_0_0 3597 3597 0.01 99.98
PTM_DEF_16‐31_0_0 3220 3220 0.01 99.98
OTM_DEF_>=105_1_110 3207 3207 0.01 99.99
PTM_DEF_>=105_1_120 2875 2875 0.00 99.99
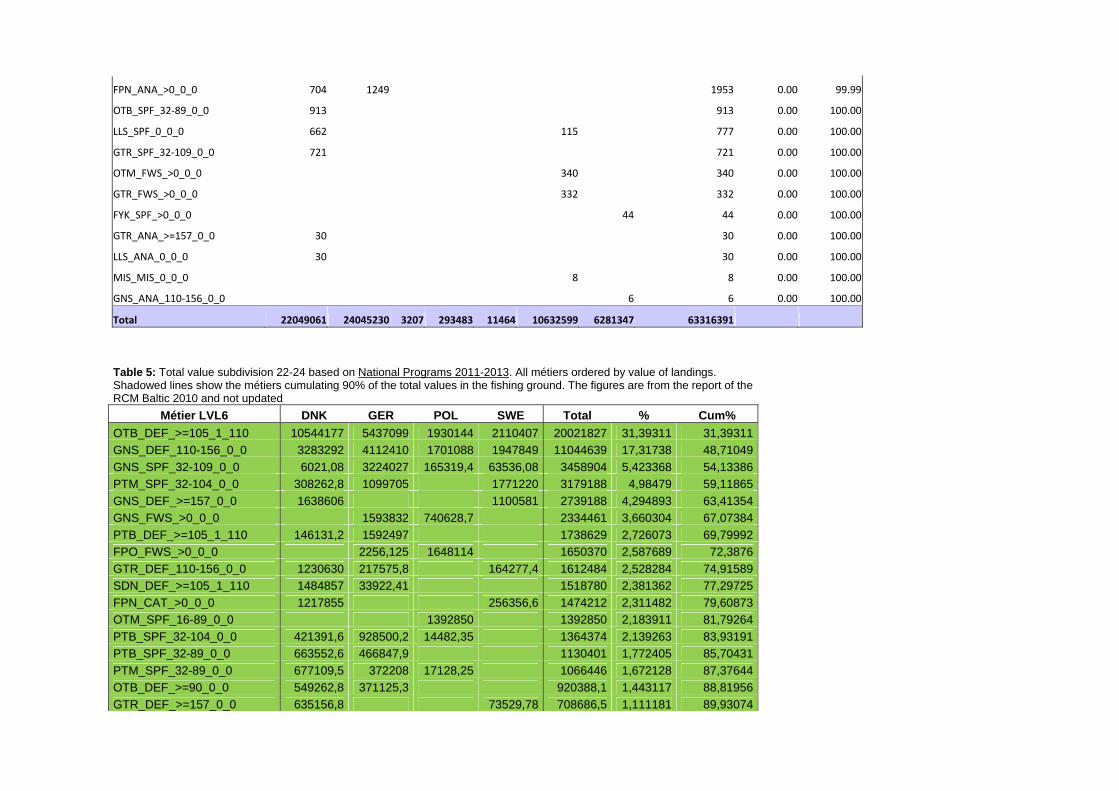
FPN_ANA_>0_0_0 704 1249 1953 0.00 99.99
OTB_SPF_32‐89_0_0 913 913 0.00 100.00
LLS_SPF_0_0_0 662 115 777 0.00 100.00
GTR_SPF_32‐109_0_0 721 721 0.00 100.00
OTM_FWS_>0_0_0 340 340 0.00 100.00
GTR_FWS_>0_0_0 332 332 0.00 100.00
FYK_SPF_>0_0_0 44 44 0.00 100.00
GTR_ANA_>=157_0_0 30 30 0.00 100.00
LLS_ANA_0_0_0 30 30 0.00 100.00
MIS_MIS_0_0_0 8 8 0.00 100.00
GNS_ANA_110‐156_0_0 6 6 0.00 100.00
Total 22049061 24045230 3207 293483 11464 10632599 6281347 63316391
Table 5: Total value subdivision 22-24 based on National Programs 2011-2013. All métiers ordered by value of landings. Shadowed lines show the métiers cumulating 90% of the total values in the fishing ground. The figures are from the report of the RCM Baltic 2010 and not updated
Métier LVL6 DNK GER POL SWE Total % Cum%
OTB_DEF_>=105_1_110 10544177 5437099 1930144 2110407 20021827 31,39311 31,39311
GNS_DEF_110-156_0_0 3283292 4112410 1701088 1947849 11044639 17,31738 48,71049
GNS_SPF_32-109_0_0 6021,08 3224027 165319,4 63536,08 3458904 5,423368 54,13386
PTM_SPF_32-104_0_0 308262,8 1099705 1771220 3179188 4,98479 59,11865
GNS_DEF_>=157_0_0 1638606 1100581 2739188 4,294893 63,41354
GNS_FWS_>0_0_0 1593832 740628,7 2334461 3,660304 67,07384
PTB_DEF_>=105_1_110 146131,2 1592497 1738629 2,726073 69,79992
FPO_FWS_>0_0_0 2256,125 1648114 1650370 2,587689 72,3876
GTR_DEF_110-156_0_0 1230630 217575,8 164277,4 1612484 2,528284 74,91589
SDN_DEF_>=105_1_110 1484857 33922,41 1518780 2,381362 77,29725
FPN_CAT_>0_0_0 1217855 256356,6 1474212 2,311482 79,60873
OTM_SPF_16-89_0_0 1392850 1392850 2,183911 81,79264
PTB_SPF_32-104_0_0 421391,6 928500,2 14482,35 1364374 2,139263 83,93191
PTB_SPF_32-89_0_0 663552,6 466847,9 1130401 1,772405 85,70431
PTM_SPF_32-89_0_0 677109,5 372208 17128,25 1066446 1,672128 87,37644
OTB_DEF_>=90_0_0 549262,8 371125,3 920388,1 1,443117 88,81956
GTR_DEF_>=157_0_0 635156,8 73529,78 708686,5 1,111181 89,93074
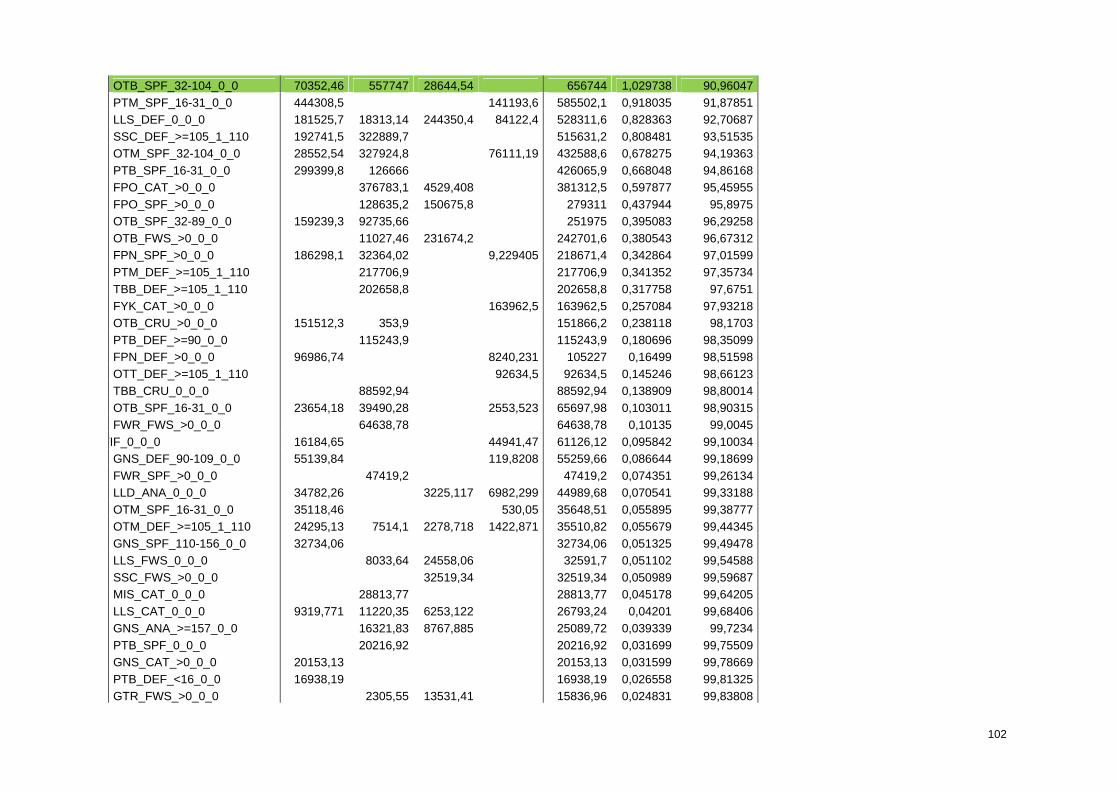
102
OTB_SPF_32-104_0_0 70352,46 557747 28644,54 656744 1,029738 90,96047
PTM_SPF_16-31_0_0 444308,5 141193,6 585502,1 0,918035 91,87851
LLS_DEF_0_0_0 181525,7 18313,14 244350,4 84122,4 528311,6 0,828363 92,70687
SSC_DEF_>=105_1_110 192741,5 322889,7 515631,2 0,808481 93,51535
OTM_SPF_32-104_0_0 28552,54 327924,8 76111,19 432588,6 0,678275 94,19363
PTB_SPF_16-31_0_0 299399,8 126666 426065,9 0,668048 94,86168
FPO_CAT_>0_0_0 376783,1 4529,408 381312,5 0,597877 95,45955
FPO_SPF_>0_0_0 128635,2 150675,8 279311 0,437944 95,8975
OTB_SPF_32-89_0_0 159239,3 92735,66 251975 0,395083 96,29258
OTB_FWS_>0_0_0 11027,46 231674,2 242701,6 0,380543 96,67312
FPN_SPF_>0_0_0 186298,1 32364,02 9,229405 218671,4 0,342864 97,01599
PTM_DEF_>=105_1_110 217706,9 217706,9 0,341352 97,35734
TBB_DEF_>=105_1_110 202658,8 202658,8 0,317758 97,6751
FYK_CAT_>0_0_0 163962,5 163962,5 0,257084 97,93218
OTB_CRU_>0_0_0 151512,3 353,9 151866,2 0,238118 98,1703
PTB_DEF_>=90_0_0 115243,9 115243,9 0,180696 98,35099
FPN_DEF_>0_0_0 96986,74 8240,231 105227 0,16499 98,51598
OTT_DEF_>=105_1_110 92634,5 92634,5 0,145246 98,66123
TBB_CRU_0_0_0 88592,94 88592,94 0,138909 98,80014
OTB_SPF_16-31_0_0 23654,18 39490,28 2553,523 65697,98 0,103011 98,90315
FWR_FWS_>0_0_0 64638,78 64638,78 0,10135 99,0045
FIF_0_0_0 16184,65 44941,47 61126,12 0,095842 99,10034
GNS_DEF_90-109_0_0 55139,84 119,8208 55259,66 0,086644 99,18699
FWR_SPF_>0_0_0 47419,2 47419,2 0,074351 99,26134
LLD_ANA_0_0_0 34782,26 3225,117 6982,299 44989,68 0,070541 99,33188
OTM_SPF_16-31_0_0 35118,46 530,05 35648,51 0,055895 99,38777
OTM_DEF_>=105_1_110 24295,13 7514,1 2278,718 1422,871 35510,82 0,055679 99,44345
GNS_SPF_110-156_0_0 32734,06 32734,06 0,051325 99,49478
LLS_FWS_0_0_0 8033,64 24558,06 32591,7 0,051102 99,54588
SSC_FWS_>0_0_0 32519,34 32519,34 0,050989 99,59687
MIS_CAT_0_0_0 28813,77 28813,77 0,045178 99,64205
LLS_CAT_0_0_0 9319,771 11220,35 6253,122 26793,24 0,04201 99,68406
GNS_ANA_>=157_0_0 16321,83 8767,885 25089,72 0,039339 99,7234
PTB_SPF_0_0_0 20216,92 20216,92 0,031699 99,75509
GNS_CAT_>0_0_0 20153,13 20153,13 0,031599 99,78669
PTB_DEF_<16_0_0 16938,19 16938,19 0,026558 99,81325
GTR_FWS_>0_0_0 2305,55 13531,41 15836,96 0,024831 99,83808
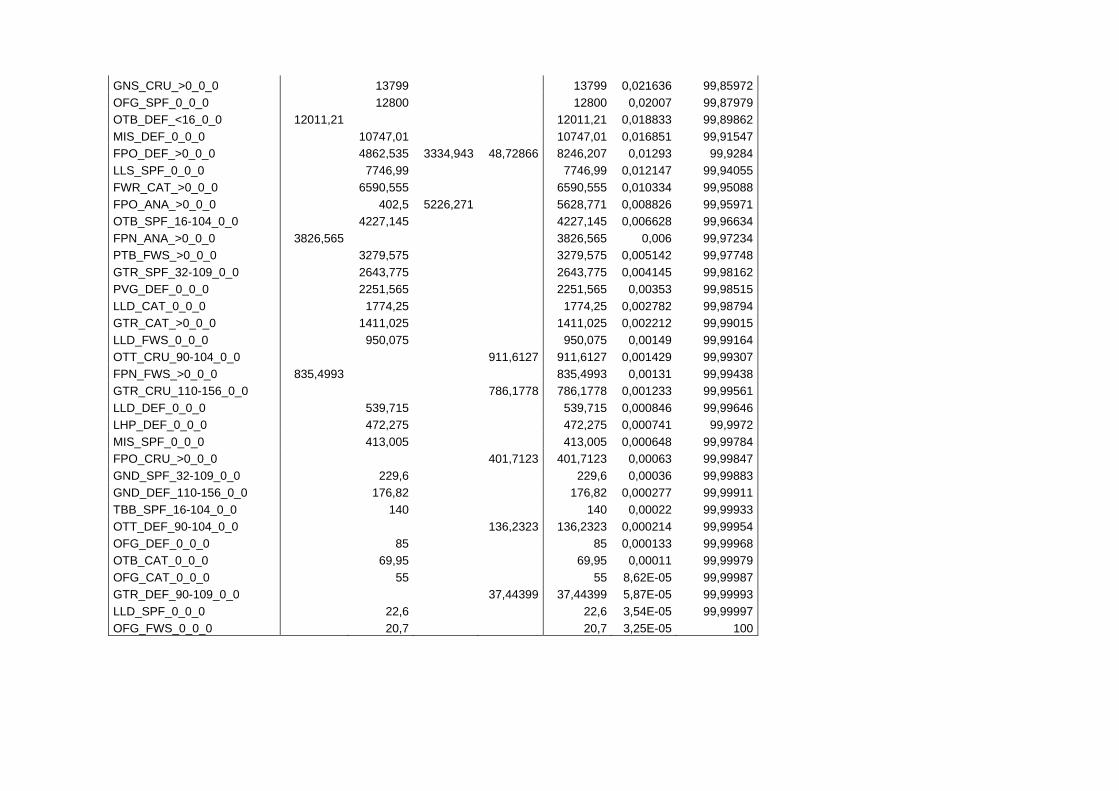
GNS_CRU_>0_0_0 13799 13799 0,021636 99,85972
OFG_SPF_0_0_0 12800 12800 0,02007 99,87979
OTB_DEF_<16_0_0 12011,21 12011,21 0,018833 99,89862
MIS_DEF_0_0_0 10747,01 10747,01 0,016851 99,91547
FPO_DEF_>0_0_0 4862,535 3334,943 48,72866 8246,207 0,01293 99,9284
LLS_SPF_0_0_0 7746,99 7746,99 0,012147 99,94055
FWR_CAT_>0_0_0 6590,555 6590,555 0,010334 99,95088
FPO_ANA_>0_0_0 402,5 5226,271 5628,771 0,008826 99,95971
OTB_SPF_16-104_0_0 4227,145 4227,145 0,006628 99,96634
FPN_ANA_>0_0_0 3826,565 3826,565 0,006 99,97234
PTB_FWS_>0_0_0 3279,575 3279,575 0,005142 99,97748
GTR_SPF_32-109_0_0 2643,775 2643,775 0,004145 99,98162
PVG_DEF_0_0_0 2251,565 2251,565 0,00353 99,98515
LLD_CAT_0_0_0 1774,25 1774,25 0,002782 99,98794
GTR_CAT_>0_0_0 1411,025 1411,025 0,002212 99,99015
LLD_FWS_0_0_0 950,075 950,075 0,00149 99,99164
OTT_CRU_90-104_0_0 911,6127 911,6127 0,001429 99,99307
FPN_FWS_>0_0_0 835,4993 835,4993 0,00131 99,99438
GTR_CRU_110-156_0_0 786,1778 786,1778 0,001233 99,99561
LLD_DEF_0_0_0 539,715 539,715 0,000846 99,99646
LHP_DEF_0_0_0 472,275 472,275 0,000741 99,9972
MIS_SPF_0_0_0 413,005 413,005 0,000648 99,99784
FPO_CRU_>0_0_0 401,7123 401,7123 0,00063 99,99847
GND_SPF_32-109_0_0 229,6 229,6 0,00036 99,99883
GND_DEF_110-156_0_0 176,82 176,82 0,000277 99,99911
TBB_SPF_16-104_0_0 140 140 0,00022 99,99933
OTT_DEF_90-104_0_0 136,2323 136,2323 0,000214 99,99954
OFG_DEF_0_0_0 85 85 0,000133 99,99968
OTB_CAT_0_0_0 69,95 69,95 0,00011 99,99979
OFG_CAT_0_0_0 55 55 8,62E-05 99,99987
GTR_DEF_90-109_0_0 37,44399 37,44399 5,87E-05 99,99993
LLD_SPF_0_0_0 22,6 22,6 3,54E-05 99,99997
OFG_FWS_0_0_0 20,7 20,7 3,25E-05 100
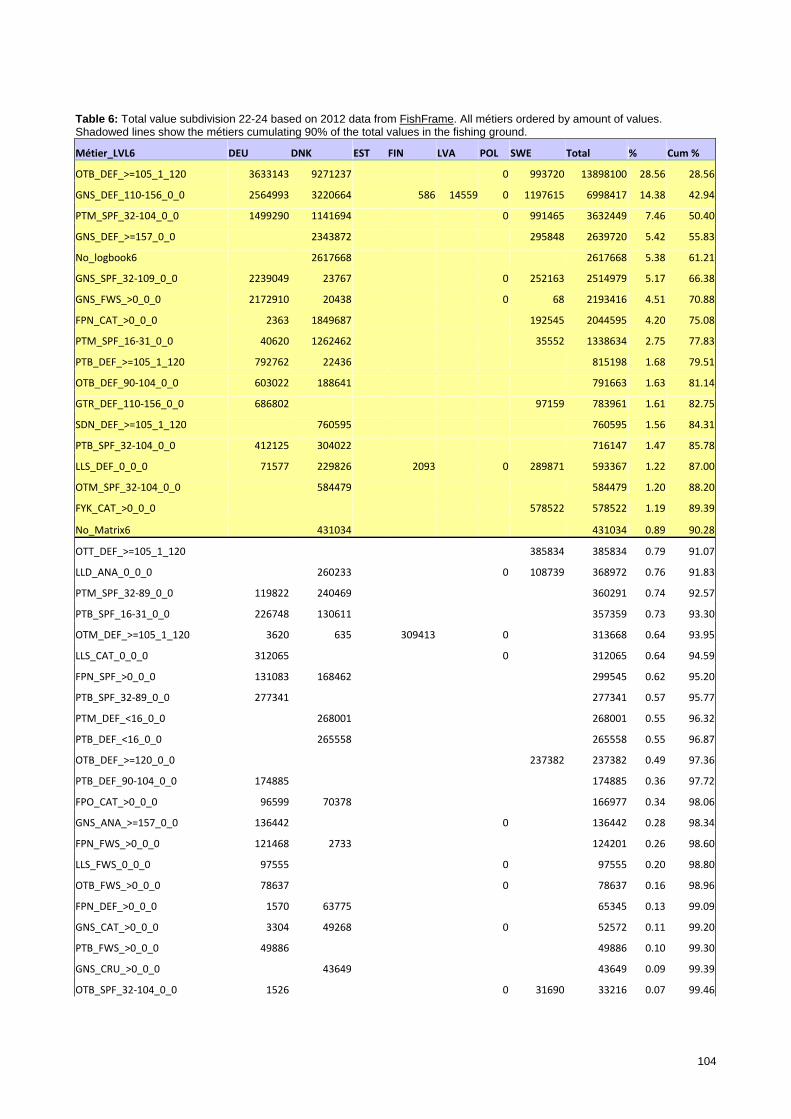
104
Table 6: Total value subdivision 22-24 based on 2012 data from FishFrame. All métiers ordered by amount of values. Shadowed lines show the métiers cumulating 90% of the total values in the fishing ground.
Métier_LVL6 DEU DNK EST FIN LVA POL SWE Total % Cum %
OTB_DEF_>=105_1_120 3633143 9271237 0 993720 13898100 28.56 28.56
GNS_DEF_110‐156_0_0 2564993 3220664 586 14559 0 1197615 6998417 14.38 42.94
PTM_SPF_32‐104_0_0 1499290 1141694 0 991465 3632449 7.46 50.40
GNS_DEF_>=157_0_0 2343872 295848 2639720 5.42 55.83
No_logbook6 2617668 2617668 5.38 61.21
GNS_SPF_32‐109_0_0 2239049 23767 0 252163 2514979 5.17 66.38
GNS_FWS_>0_0_0 2172910 20438 0 68 2193416 4.51 70.88
FPN_CAT_>0_0_0 2363 1849687 192545 2044595 4.20 75.08
PTM_SPF_16‐31_0_0 40620 1262462 35552 1338634 2.75 77.83
PTB_DEF_>=105_1_120 792762 22436 815198 1.68 79.51
OTB_DEF_90‐104_0_0 603022 188641 791663 1.63 81.14
GTR_DEF_110‐156_0_0 686802 97159 783961 1.61 82.75
SDN_DEF_>=105_1_120 760595 760595 1.56 84.31
PTB_SPF_32‐104_0_0 412125 304022 716147 1.47 85.78
LLS_DEF_0_0_0 71577 229826 2093 0 289871 593367 1.22 87.00
OTM_SPF_32‐104_0_0 584479 584479 1.20 88.20
FYK_CAT_>0_0_0 578522 578522 1.19 89.39
No_Matrix6 431034 431034 0.89 90.28
OTT_DEF_>=105_1_120 385834 385834 0.79 91.07
LLD_ANA_0_0_0 260233 0 108739 368972 0.76 91.83
PTM_SPF_32‐89_0_0 119822 240469 360291 0.74 92.57
PTB_SPF_16‐31_0_0 226748 130611 357359 0.73 93.30
OTM_DEF_>=105_1_120 3620 635 309413 0 313668 0.64 93.95
LLS_CAT_0_0_0 312065 0 312065 0.64 94.59
FPN_SPF_>0_0_0 131083 168462 299545 0.62 95.20
PTB_SPF_32‐89_0_0 277341 277341 0.57 95.77
PTM_DEF_<16_0_0 268001 268001 0.55 96.32
PTB_DEF_<16_0_0 265558 265558 0.55 96.87
OTB_DEF_>=120_0_0 237382 237382 0.49 97.36
PTB_DEF_90‐104_0_0 174885 174885 0.36 97.72
FPO_CAT_>0_0_0 96599 70378 166977 0.34 98.06
GNS_ANA_>=157_0_0 136442 0 136442 0.28 98.34
FPN_FWS_>0_0_0 121468 2733 124201 0.26 98.60
LLS_FWS_0_0_0 97555 0 97555 0.20 98.80
OTB_FWS_>0_0_0 78637 0 78637 0.16 98.96
FPN_DEF_>0_0_0 1570 63775 65345 0.13 99.09
GNS_CAT_>0_0_0 3304 49268 0 52572 0.11 99.20
PTB_FWS_>0_0_0 49886 49886 0.10 99.30
GNS_CRU_>0_0_0 43649 43649 0.09 99.39
OTB_SPF_32‐104_0_0 1526 0 31690 33216 0.07 99.46

GTR_DEF_>=157_0_0 31033 31033 0.06 99.52
FPO_ANA_>0_0_0 30085 0 30085 0.06 99.59
OTB_CRU_>0_0_0 10031 18038 28069 0.06 99.64
OTM_SPF_16‐31_0_0 27335 27335 0.06 99.70
LHP_FIF_0_0_0 908 6937 18179 26024 0.05 99.75
FPO_DEF_>0_0_0 15090 8272 0 2659 26021 0.05 99.81
SSC_DEF_>=105_1_120 5312 11849 17161 0.04 99.84
GNS_SPF_110‐156_0_0 14572 14572 0.03 99.87
GNS_DEF_90‐109_0_0 12057 2480 14537 0.03 99.90
OTM_SPF_32‐89_0_0 12430 0 12430 0.03 99.93
OTB_SPF_16‐31_0_0 6157 6157 0.01 99.94
OTM_DEF_<16_0_0 5267 5267 0.01 99.95
FPO_SPF_>0_0_0 5123 0 5123 0.01 99.96
FPN_ANA_>0_0_0 1766 2687 4453 0.01 99.97
PTM_DEF_16‐31_0_0 4066 4066 0.01 99.98
OTM_DEF_>=105_1_110 3046 3046 0.01 99.99
PTM_DEF_>=105_1_120 2623 2623 0.01 99.99
LLS_SPF_0_0_0 1684 0 1684 0.00 99.99
GTR_SPF_32‐109_0_0 1299 1299 0.00 100.00
OTB_SPF_32‐89_0_0 625 625 0.00 100.00
FPO_FWS_>0_0_0 313 0 313 0.00 100.00
LLS_ANA_0_0_0 270 270 0.00 100.00
GTR_ANA_>=157_0_0 116 116 0.00 100.00
GNS_ANA_110‐156_0_0 30 30 0.00 100.00
FYK_SPF_>0_0_0 16 16 0.00 100.00
FPO_FIF_>0_0_0 0 0 0.00 100.00
GTR_FWS_>0_0_0 0 0 0.00 100.00
MIS_MIS_0_0_0 0 0 0.00 100.00
OTM_FWS_>0_0_0 0 0 0.00 100.00
Total 16632609 25959804 3046 312092 14559 0 5742570 48664680
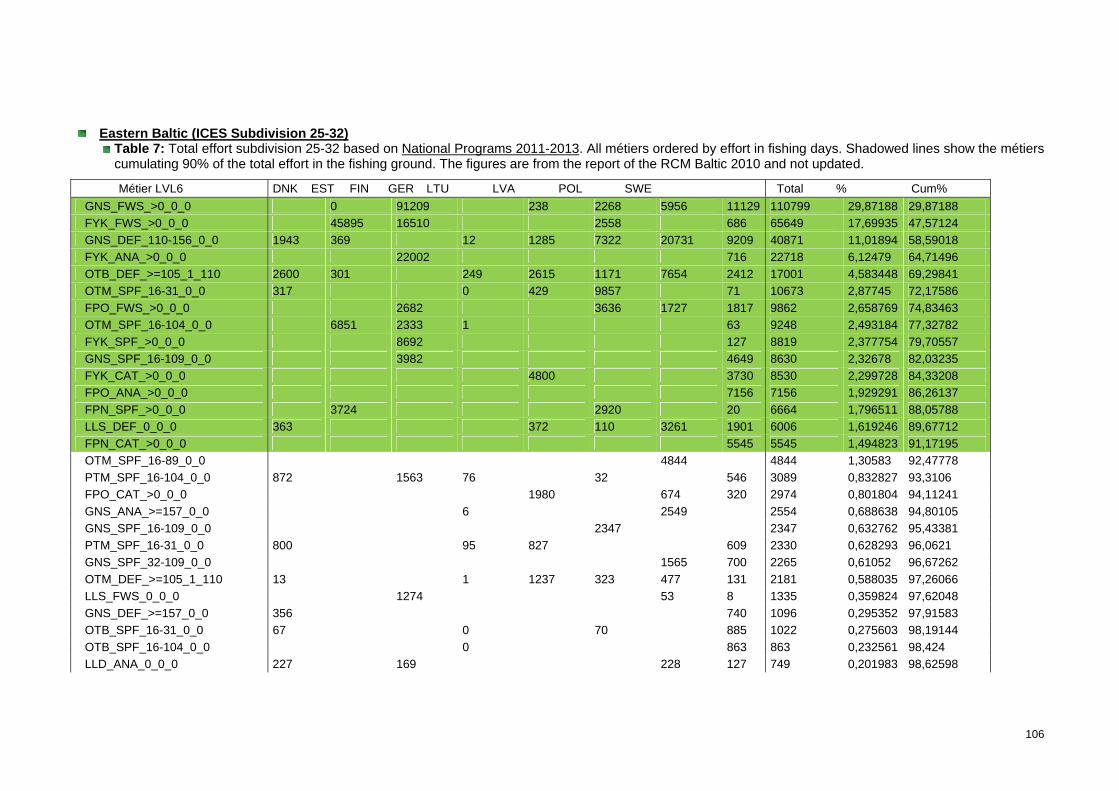
106
Eastern Baltic (ICES Subdivision 25-32)
Table 7: Total effort subdivision 25-32 based on National Programs 2011-2013. All métiers ordered by effort in fishing days. Shadowed lines show the métiers cumulating 90% of the total effort in the fishing ground. The figures are from the report of the RCM Baltic 2010 and not updated.
Métier LVL6 DNK EST FIN GER LTU LVA POL SWE Total % Cum%
GNS_FWS_>0_0_0 0 91209 238 2268 5956 11129 110799 29,87188 29,87188
FYK_FWS_>0_0_0 45895 16510 2558 686 65649 17,69935 47,57124
GNS_DEF_110-156_0_0 1943 369 12 1285 7322 20731 9209 40871 11,01894 58,59018
FYK_ANA_>0_0_0 22002 716 22718 6,12479 64,71496
OTB_DEF_>=105_1_110 2600 301 249 2615 1171 7654 2412 17001 4,583448 69,29841
OTM_SPF_16-31_0_0 317 0 429 9857 71 10673 2,87745 72,17586
FPO_FWS_>0_0_0 2682 3636 1727 1817 9862 2,658769 74,83463
OTM_SPF_16-104_0_0 6851 2333 1 63 9248 2,493184 77,32782
FYK_SPF_>0_0_0 8692 127 8819 2,377754 79,70557
GNS_SPF_16-109_0_0 3982 4649 8630 2,32678 82,03235
FYK_CAT_>0_0_0 4800 3730 8530 2,299728 84,33208
FPO_ANA_>0_0_0 7156 7156 1,929291 86,26137
FPN_SPF_>0_0_0 3724 2920 20 6664 1,796511 88,05788
LLS_DEF_0_0_0 363 372 110 3261 1901 6006 1,619246 89,67712
FPN_CAT_>0_0_0 5545 5545 1,494823 91,17195
OTM_SPF_16-89_0_0 4844 4844 1,30583 92,47778
PTM_SPF_16-104_0_0 872 1563 76 32 546 3089 0,832827 93,3106
FPO_CAT_>0_0_0 1980 674 320 2974 0,801804 94,11241
GNS_ANA_>=157_0_0 6 2549 2554 0,688638 94,80105
GNS_SPF_16-109_0_0 2347 2347 0,632762 95,43381
PTM_SPF_16-31_0_0 800 95 827 609 2330 0,628293 96,0621
GNS_SPF_32-109_0_0 1565 700 2265 0,61052 96,67262
OTM_DEF_>=105_1_110 13 1 1237 323 477 131 2181 0,588035 97,26066
LLS_FWS_0_0_0 1274 53 8 1335 0,359824 97,62048
GNS_DEF_>=157_0_0 356 740 1096 0,295352 97,91583
OTB_SPF_16-31_0_0 67 0 70 885 1022 0,275603 98,19144
OTB_SPF_16-104_0_0 0 863 863 0,232561 98,424
LLD_ANA_0_0_0 227 169 228 127 749 0,201983 98,62598
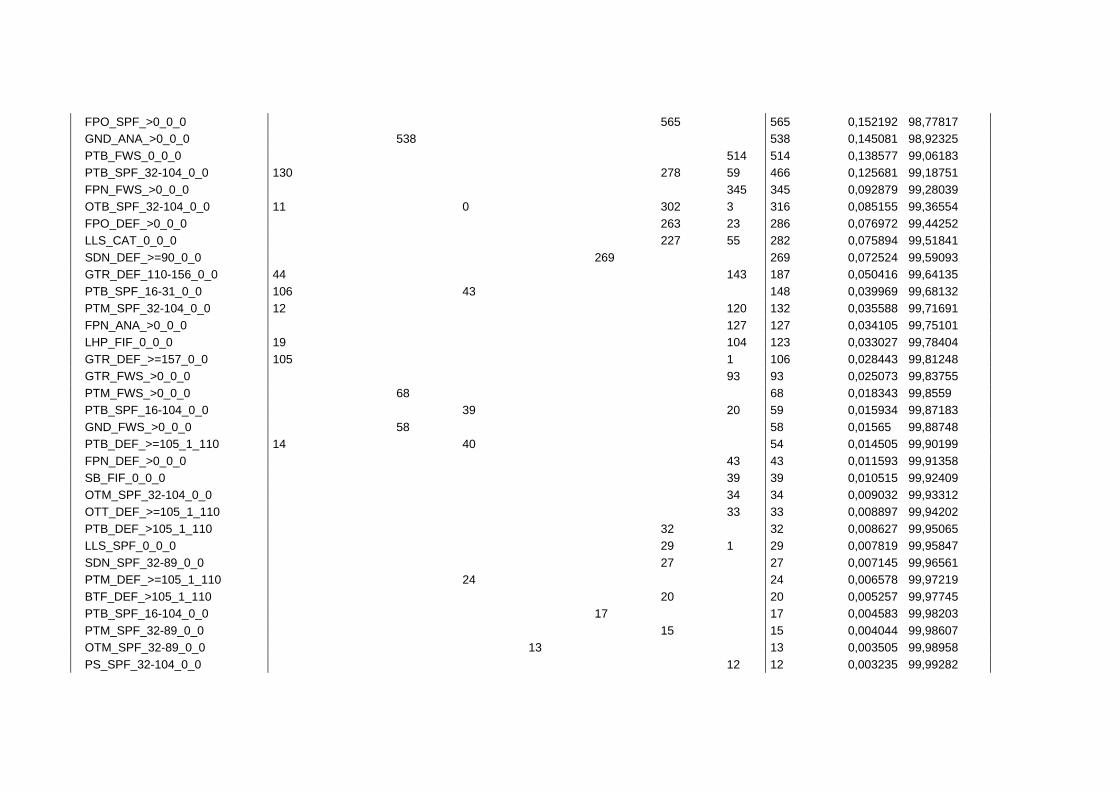
FPO_SPF_>0_0_0 565 565 0,152192 98,77817
GND_ANA_>0_0_0 538 538 0,145081 98,92325
PTB_FWS_0_0_0 514 514 0,138577 99,06183
PTB_SPF_32-104_0_0 130 278 59 466 0,125681 99,18751
FPN_FWS_>0_0_0 345 345 0,092879 99,28039
OTB_SPF_32-104_0_0 11 0 302 3 316 0,085155 99,36554
FPO_DEF_>0_0_0 263 23 286 0,076972 99,44252
LLS_CAT_0_0_0 227 55 282 0,075894 99,51841
SDN_DEF_>=90_0_0 269 269 0,072524 99,59093
GTR_DEF_110-156_0_0 44 143 187 0,050416 99,64135
PTB_SPF_16-31_0_0 106 43 148 0,039969 99,68132
PTM_SPF_32-104_0_0 12 120 132 0,035588 99,71691
FPN_ANA_>0_0_0 127 127 0,034105 99,75101
LHP_FIF_0_0_0 19 104 123 0,033027 99,78404
GTR_DEF_>=157_0_0 105 1 106 0,028443 99,81248
GTR_FWS_>0_0_0 93 93 0,025073 99,83755
PTM_FWS_>0_0_0 68 68 0,018343 99,8559
PTB_SPF_16-104_0_0 39 20 59 0,015934 99,87183
GND_FWS_>0_0_0 58 58 0,01565 99,88748
PTB_DEF_>=105_1_110 14 40 54 0,014505 99,90199
FPN_DEF_>0_0_0 43 43 0,011593 99,91358
SB_FIF_0_0_0 39 39 0,010515 99,92409
OTM_SPF_32-104_0_0 34 34 0,009032 99,93312
OTT_DEF_>=105_1_110 33 33 0,008897 99,94202
PTB_DEF_>105_1_110 32 32 0,008627 99,95065
LLS_SPF_0_0_0 29 1 29 0,007819 99,95847
SDN_SPF_32-89_0_0 27 27 0,007145 99,96561
PTM_DEF_>=105_1_110 24 24 0,006578 99,97219
BTF_DEF_>105_1_110 20 20 0,005257 99,97745
PTB_SPF_16-104_0_0 17 17 0,004583 99,98203
PTM_SPF_32-89_0_0 15 15 0,004044 99,98607
OTM_SPF_32-89_0_0 13 13 0,003505 99,98958
PS_SPF_32-104_0_0 12 12 0,003235 99,99282
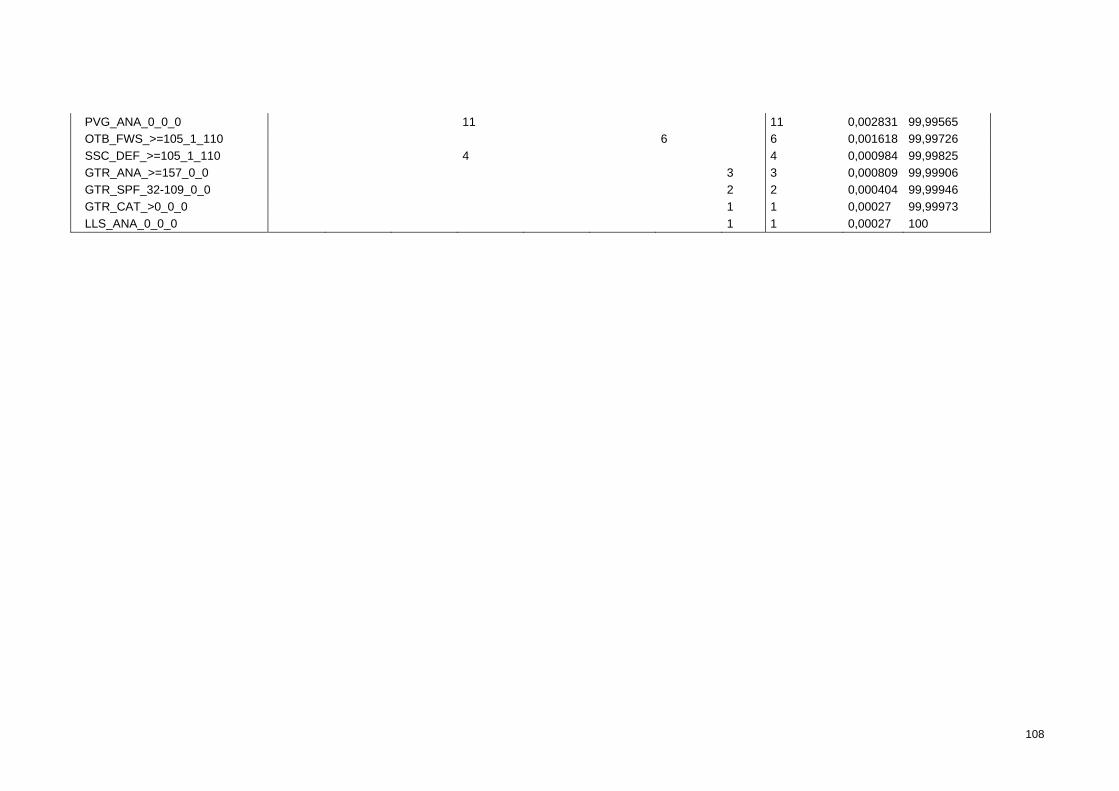
108
PVG_ANA_0_0_0 11 11 0,002831 99,99565
OTB_FWS_>=105_1_110 6 6 0,001618 99,99726
SSC_DEF_>=105_1_110 4 4 0,000984 99,99825
GTR_ANA_>=157_0_0 3 3 0,000809 99,99906
GTR_SPF_32-109_0_0 2 2 0,000404 99,99946
GTR_CAT_>0_0_0 1 1 0,00027 99,99973
LLS_ANA_0_0_0 1 1 0,00027 100
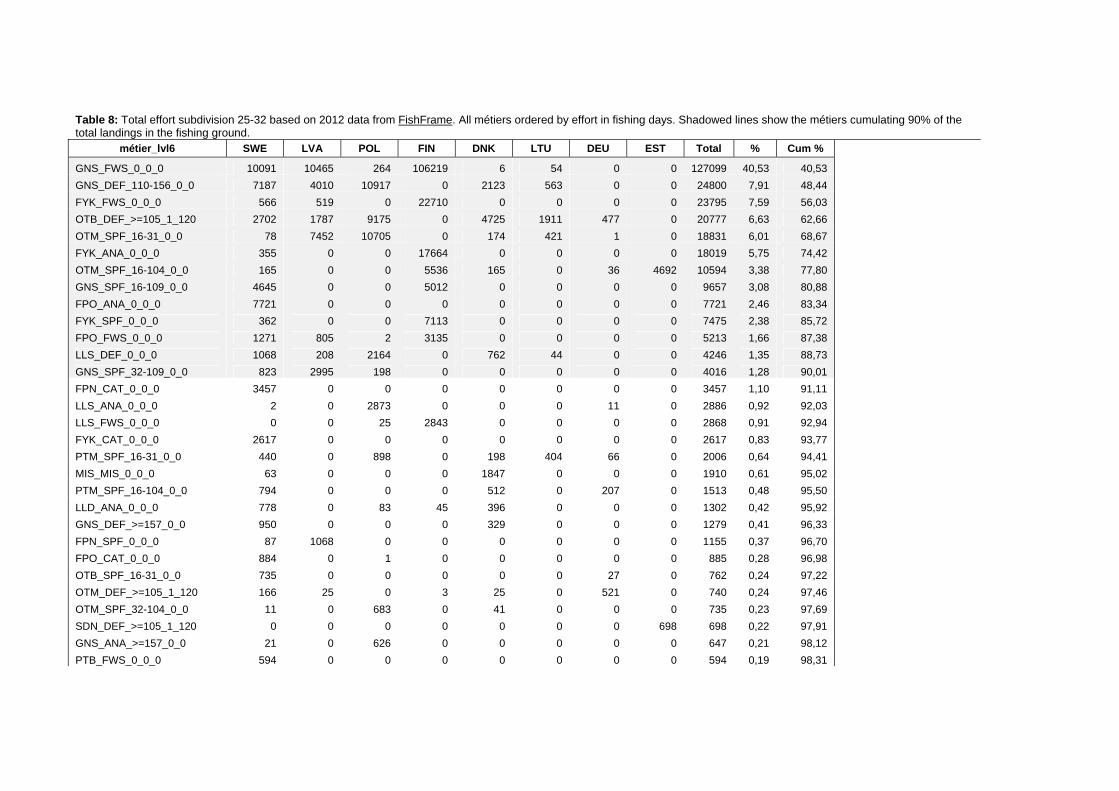
Table 8: Total effort subdivision 25-32 based on 2012 data from FishFrame. All métiers ordered by effort in fishing days. Shadowed lines show the métiers cumulating 90% of the total landings in the fishing ground.
métier_lvl6 SWE LVA POL FIN DNK LTU DEU EST Total % Cum %
GNS_FWS_0_0_0 10091 10465 264 106219 6 54 0 0 127099 40,53 40,53
GNS_DEF_110-156_0_0 7187 4010 10917 0 2123 563 0 0 24800 7,91 48,44
FYK_FWS_0_0_0 566 519 0 22710 0 0 0 0 23795 7,59 56,03
OTB_DEF_>=105_1_120 2702 1787 9175 0 4725 1911 477 0 20777 6,63 62,66
OTM_SPF_16-31_0_0 78 7452 10705 0 174 421 1 0 18831 6,01 68,67
FYK_ANA_0_0_0 355 0 0 17664 0 0 0 0 18019 5,75 74,42
OTM_SPF_16-104_0_0 165 0 0 5536 165 0 36 4692 10594 3,38 77,80
GNS_SPF_16-109_0_0 4645 0 0 5012 0 0 0 0 9657 3,08 80,88
FPO_ANA_0_0_0 7721 0 0 0 0 0 0 0 7721 2,46 83,34
FYK_SPF_0_0_0 362 0 0 7113 0 0 0 0 7475 2,38 85,72
FPO_FWS_0_0_0 1271 805 2 3135 0 0 0 0 5213 1,66 87,38
LLS_DEF_0_0_0 1068 208 2164 0 762 44 0 0 4246 1,35 88,73
GNS_SPF_32-109_0_0 823 2995 198 0 0 0 0 0 4016 1,28 90,01
FPN_CAT_0_0_0 3457 0 0 0 0 0 0 0 3457 1,10 91,11
LLS_ANA_0_0_0 2 0 2873 0 0 0 11 0 2886 0,92 92,03
LLS_FWS_0_0_0 0 0 25 2843 0 0 0 0 2868 0,91 92,94
FYK_CAT_0_0_0 2617 0 0 0 0 0 0 0 2617 0,83 93,77
PTM_SPF_16-31_0_0 440 0 898 0 198 404 66 0 2006 0,64 94,41
MIS_MIS_0_0_0 63 0 0 0 1847 0 0 0 1910 0,61 95,02
PTM_SPF_16-104_0_0 794 0 0 0 512 0 207 0 1513 0,48 95,50
LLD_ANA_0_0_0 778 0 83 45 396 0 0 0 1302 0,42 95,92
GNS_DEF_>=157_0_0 950 0 0 0 329 0 0 0 1279 0,41 96,33
FPN_SPF_0_0_0 87 1068 0 0 0 0 0 0 1155 0,37 96,70
FPO_CAT_0_0_0 884 0 1 0 0 0 0 0 885 0,28 96,98
OTB_SPF_16-31_0_0 735 0 0 0 0 0 27 0 762 0,24 97,22
OTM_DEF_>=105_1_120 166 25 0 3 25 0 521 0 740 0,24 97,46
OTM_SPF_32-104_0_0 11 0 683 0 41 0 0 0 735 0,23 97,69
SDN_DEF_>=105_1_120 0 0 0 0 0 0 0 698 698 0,22 97,91
GNS_ANA_>=157_0_0 21 0 626 0 0 0 0 0 647 0,21 98,12
PTB_FWS_0_0_0 594 0 0 0 0 0 0 0 594 0,19 98,31
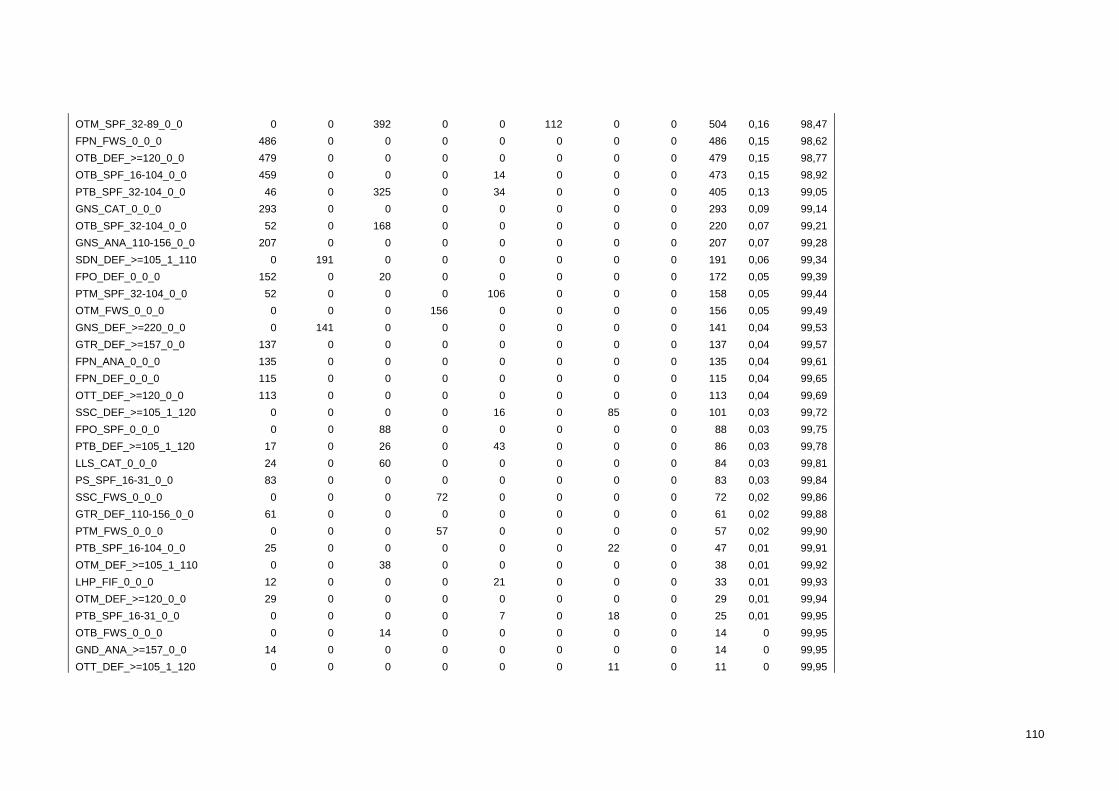
110
OTM_SPF_32-89_0_0 0 0 392 0 0 112 0 0 504 0,16 98,47
FPN_FWS_0_0_0 486 0 0 0 0 0 0 0 486 0,15 98,62
OTB_DEF_>=120_0_0 479 0 0 0 0 0 0 0 479 0,15 98,77
OTB_SPF_16-104_0_0 459 0 0 0 14 0 0 0 473 0,15 98,92
PTB_SPF_32-104_0_0 46 0 325 0 34 0 0 0 405 0,13 99,05
GNS_CAT_0_0_0 293 0 0 0 0 0 0 0 293 0,09 99,14
OTB_SPF_32-104_0_0 52 0 168 0 0 0 0 0 220 0,07 99,21
GNS_ANA_110-156_0_0 207 0 0 0 0 0 0 0 207 0,07 99,28
SDN_DEF_>=105_1_110 0 191 0 0 0 0 0 0 191 0,06 99,34
FPO_DEF_0_0_0 152 0 20 0 0 0 0 0 172 0,05 99,39
PTM_SPF_32-104_0_0 52 0 0 0 106 0 0 0 158 0,05 99,44
OTM_FWS_0_0_0 0 0 0 156 0 0 0 0 156 0,05 99,49
GNS_DEF_>=220_0_0 0 141 0 0 0 0 0 0 141 0,04 99,53
GTR_DEF_>=157_0_0 137 0 0 0 0 0 0 0 137 0,04 99,57
FPN_ANA_0_0_0 135 0 0 0 0 0 0 0 135 0,04 99,61
FPN_DEF_0_0_0 115 0 0 0 0 0 0 0 115 0,04 99,65
OTT_DEF_>=120_0_0 113 0 0 0 0 0 0 0 113 0,04 99,69
SSC_DEF_>=105_1_120 0 0 0 0 16 0 85 0 101 0,03 99,72
FPO_SPF_0_0_0 0 0 88 0 0 0 0 0 88 0,03 99,75
PTB_DEF_>=105_1_120 17 0 26 0 43 0 0 0 86 0,03 99,78
LLS_CAT_0_0_0 24 0 60 0 0 0 0 0 84 0,03 99,81
PS_SPF_16-31_0_0 83 0 0 0 0 0 0 0 83 0,03 99,84
SSC_FWS_0_0_0 0 0 0 72 0 0 0 0 72 0,02 99,86
GTR_DEF_110-156_0_0 61 0 0 0 0 0 0 0 61 0,02 99,88
PTM_FWS_0_0_0 0 0 0 57 0 0 0 0 57 0,02 99,90
PTB_SPF_16-104_0_0 25 0 0 0 0 0 22 0 47 0,01 99,91
OTM_DEF_>=105_1_110 0 0 38 0 0 0 0 0 38 0,01 99,92
LHP_FIF_0_0_0 12 0 0 0 21 0 0 0 33 0,01 99,93
OTM_DEF_>=120_0_0 29 0 0 0 0 0 0 0 29 0,01 99,94
PTB_SPF_16-31_0_0 0 0 0 0 7 0 18 0 25 0,01 99,95
OTB_FWS_0_0_0 0 0 14 0 0 0 0 0 14 0 99,95
GND_ANA_>=157_0_0 14 0 0 0 0 0 0 0 14 0 99,95
OTT_DEF_>=105_1_120 0 0 0 0 0 0 11 0 11 0 99,95
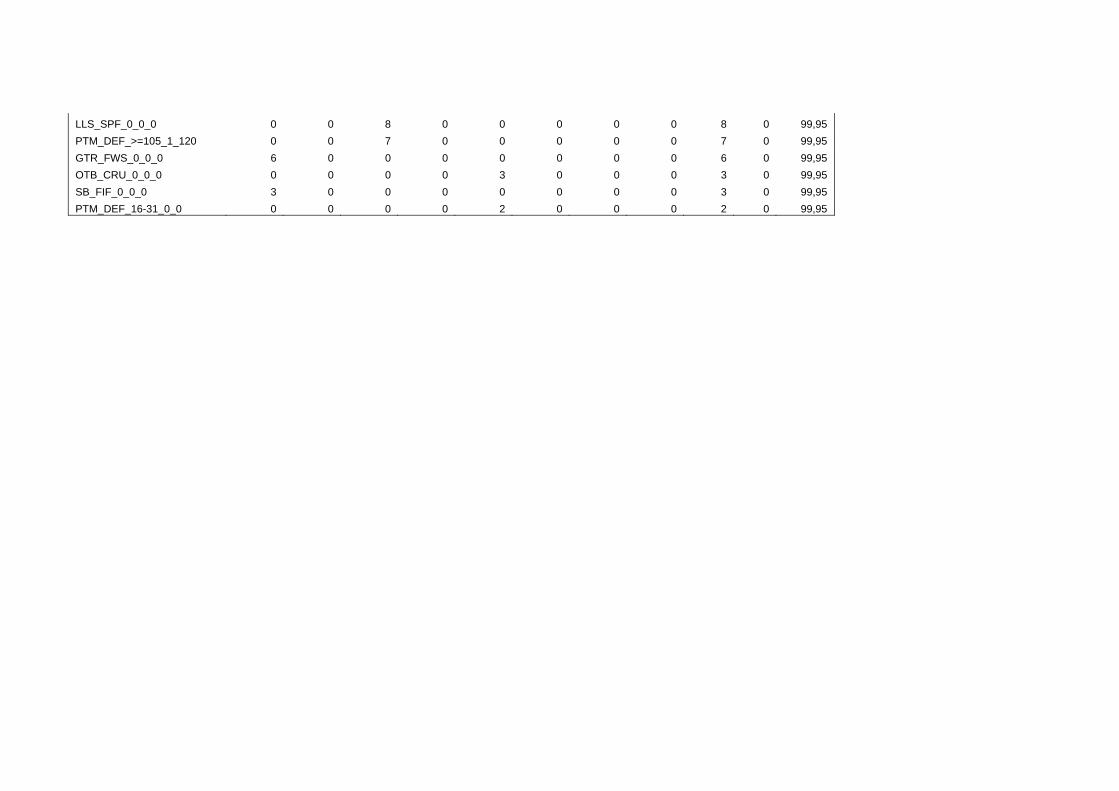
LLS_SPF_0_0_0 0 0 8 0 0 0 0 0 8 0 99,95
PTM_DEF_>=105_1_120 0 0 7 0 0 0 0 0 7 0 99,95
GTR_FWS_0_0_0 6 0 0 0 0 0 0 0 6 0 99,95
OTB_CRU_0_0_0 0 0 0 0 3 0 0 0 3 0 99,95
SB_FIF_0_0_0 3 0 0 0 0 0 0 0 3 0 99,95
PTM_DEF_16-31_0_0 0 0 0 0 2 0 0 0 2 0 99,95
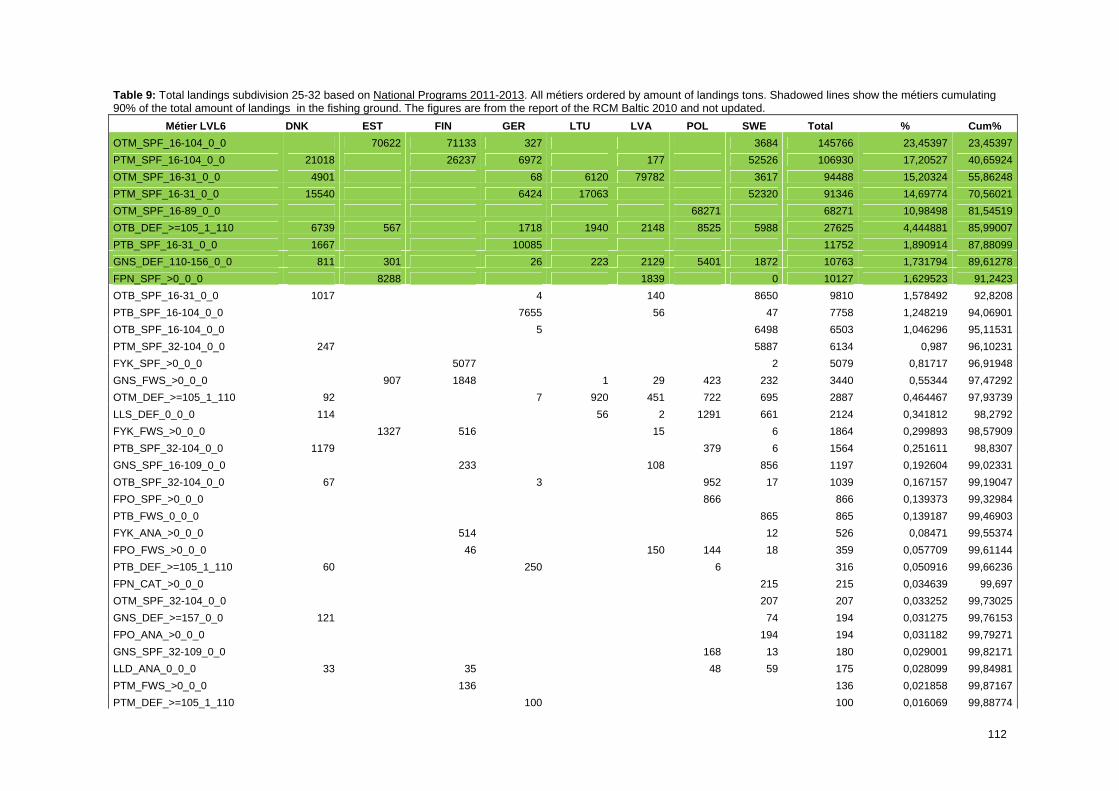
112
Table 9: Total landings subdivision 25-32 based on National Programs 2011-2013. All métiers ordered by amount of landings tons. Shadowed lines show the métiers cumulating 90% of the total amount of landings in the fishing ground. The figures are from the report of the RCM Baltic 2010 and not updated.
Métier LVL6 DNK EST FIN GER LTU LVA POL SWE Total % Cum%
OTM_SPF_16-104_0_0 70622 71133 327 3684 145766 23,45397 23,45397
PTM_SPF_16-104_0_0 21018 26237 6972 177 52526 106930 17,20527 40,65924
OTM_SPF_16-31_0_0 4901 68 6120 79782 3617 94488 15,20324 55,86248
PTM_SPF_16-31_0_0 15540 6424 17063 52320 91346 14,69774 70,56021
OTM_SPF_16-89_0_0 68271 68271 10,98498 81,54519
OTB_DEF_>=105_1_110 6739 567 1718 1940 2148 8525 5988 27625 4,444881 85,99007
PTB_SPF_16-31_0_0 1667 10085 11752 1,890914 87,88099
GNS_DEF_110-156_0_0 811 301 26 223 2129 5401 1872 10763 1,731794 89,61278
FPN_SPF_>0_0_0 8288 1839 0 10127 1,629523 91,2423
OTB_SPF_16-31_0_0 1017 4 140 8650 9810 1,578492 92,8208
PTB_SPF_16-104_0_0 7655 56 47 7758 1,248219 94,06901
OTB_SPF_16-104_0_0 5 6498 6503 1,046296 95,11531
PTM_SPF_32-104_0_0 247 5887 6134 0,987 96,10231
FYK_SPF_>0_0_0 5077 2 5079 0,81717 96,91948
GNS_FWS_>0_0_0 907 1848 1 29 423 232 3440 0,55344 97,47292
OTM_DEF_>=105_1_110 92 7 920 451 722 695 2887 0,464467 97,93739
LLS_DEF_0_0_0 114 56 2 1291 661 2124 0,341812 98,2792
FYK_FWS_>0_0_0 1327 516 15 6 1864 0,299893 98,57909
PTB_SPF_32-104_0_0 1179 379 6 1564 0,251611 98,8307
GNS_SPF_16-109_0_0 233 108 856 1197 0,192604 99,02331
OTB_SPF_32-104_0_0 67 3 952 17 1039 0,167157 99,19047
FPO_SPF_>0_0_0 866 866 0,139373 99,32984
PTB_FWS_0_0_0 865 865 0,139187 99,46903
FYK_ANA_>0_0_0 514 12 526 0,08471 99,55374
FPO_FWS_>0_0_0 46 150 144 18 359 0,057709 99,61144
PTB_DEF_>=105_1_110 60 250 6 316 0,050916 99,66236
FPN_CAT_>0_0_0 215 215 0,034639 99,697
OTM_SPF_32-104_0_0 207 207 0,033252 99,73025
GNS_DEF_>=157_0_0 121 74 194 0,031275 99,76153
FPO_ANA_>0_0_0 194 194 0,031182 99,79271
GNS_SPF_32-109_0_0 168 13 180 0,029001 99,82171
LLD_ANA_0_0_0 33 35 48 59 175 0,028099 99,84981
PTM_FWS_>0_0_0 136 136 0,021858 99,87167
PTM_DEF_>=105_1_110 100 100 0,016069 99,88774
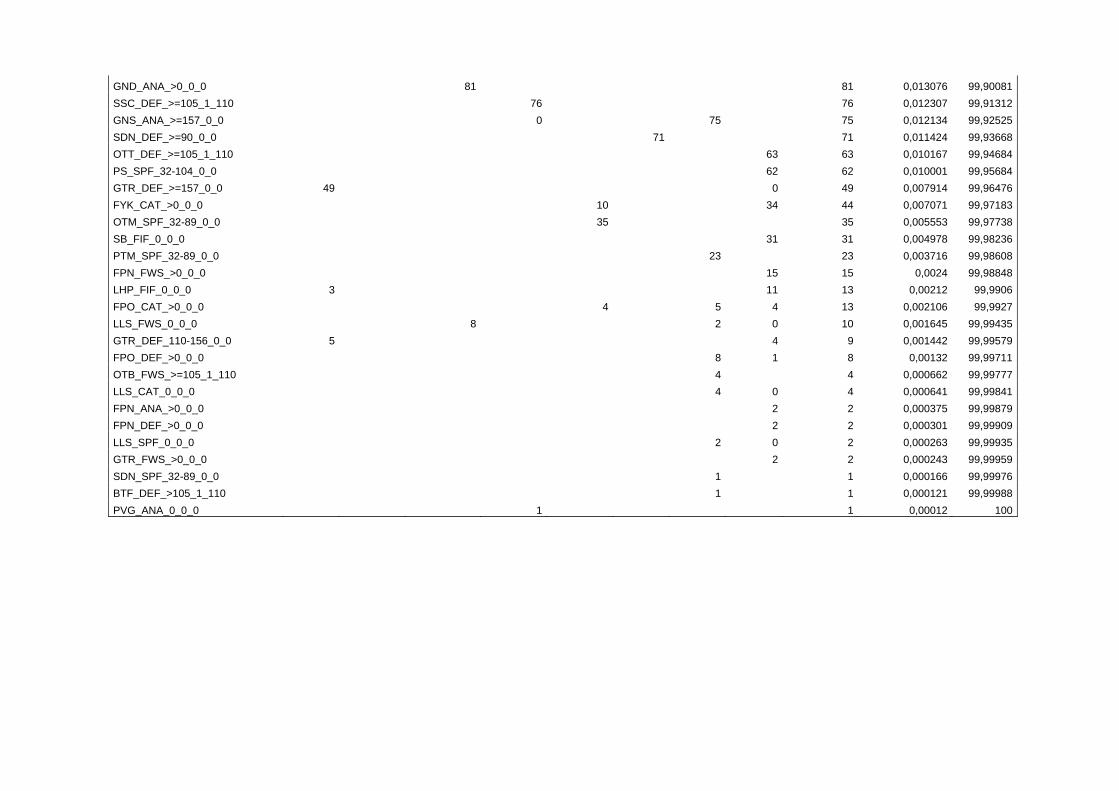
GND_ANA_>0_0_0 81 81 0,013076 99,90081
SSC_DEF_>=105_1_110 76 76 0,012307 99,91312
GNS_ANA_>=157_0_0 0 75 75 0,012134 99,92525
SDN_DEF_>=90_0_0 71 71 0,011424 99,93668
OTT_DEF_>=105_1_110 63 63 0,010167 99,94684
PS_SPF_32-104_0_0 62 62 0,010001 99,95684
GTR_DEF_>=157_0_0 49 0 49 0,007914 99,96476
FYK_CAT_>0_0_0 10 34 44 0,007071 99,97183
OTM_SPF_32-89_0_0 35 35 0,005553 99,97738
SB_FIF_0_0_0 31 31 0,004978 99,98236
PTM_SPF_32-89_0_0 23 23 0,003716 99,98608
FPN_FWS_>0_0_0 15 15 0,0024 99,98848
LHP_FIF_0_0_0 3 11 13 0,00212 99,9906
FPO_CAT_>0_0_0 4 5 4 13 0,002106 99,9927
LLS_FWS_0_0_0 8 2 0 10 0,001645 99,99435
GTR_DEF_110-156_0_0 5 4 9 0,001442 99,99579
FPO_DEF_>0_0_0 8 1 8 0,00132 99,99711
OTB_FWS_>=105_1_110 4 4 0,000662 99,99777
LLS_CAT_0_0_0 4 0 4 0,000641 99,99841
FPN_ANA_>0_0_0 2 2 0,000375 99,99879
FPN_DEF_>0_0_0 2 2 0,000301 99,99909
LLS_SPF_0_0_0 2 0 2 0,000263 99,99935
GTR_FWS_>0_0_0 2 2 0,000243 99,99959
SDN_SPF_32-89_0_0 1 1 0,000166 99,99976
BTF_DEF_>105_1_110 1 1 0,000121 99,99988
PVG_ANA_0_0_0 1 1 0,00012 100
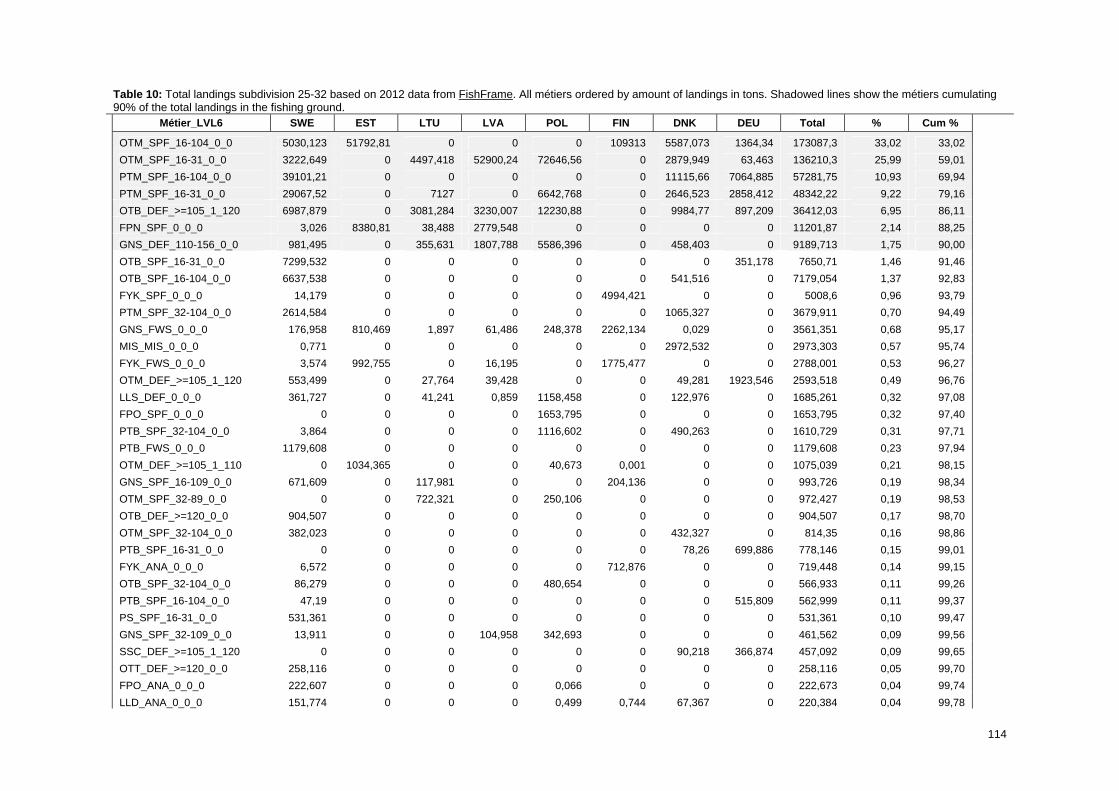
114
Table 10: Total landings subdivision 25-32 based on 2012 data from FishFrame. All métiers ordered by amount of landings in tons. Shadowed lines show the métiers cumulating 90% of the total landings in the fishing ground.
Métier_LVL6 SWE EST LTU LVA POL FIN DNK DEU Total % Cum %
OTM_SPF_16-104_0_0 5030,123 51792,81 0 0 0 109313 5587,073 1364,34 173087,3 33,02 33,02
OTM_SPF_16-31_0_0 3222,649 0 4497,418 52900,24 72646,56 0 2879,949 63,463 136210,3 25,99 59,01
PTM_SPF_16-104_0_0 39101,21 0 0 0 0 0 11115,66 7064,885 57281,75 10,93 69,94
PTM_SPF_16-31_0_0 29067,52 0 7127 0 6642,768 0 2646,523 2858,412 48342,22 9,22 79,16
OTB_DEF_>=105_1_120 6987,879 0 3081,284 3230,007 12230,88 0 9984,77 897,209 36412,03 6,95 86,11
FPN_SPF_0_0_0 3,026 8380,81 38,488 2779,548 0 0 0 0 11201,87 2,14 88,25
GNS_DEF_110-156_0_0 981,495 0 355,631 1807,788 5586,396 0 458,403 0 9189,713 1,75 90,00
OTB_SPF_16-31_0_0 7299,532 0 0 0 0 0 0 351,178 7650,71 1,46 91,46
OTB_SPF_16-104_0_0 6637,538 0 0 0 0 0 541,516 0 7179,054 1,37 92,83
FYK_SPF_0_0_0 14,179 0 0 0 0 4994,421 0 0 5008,6 0,96 93,79
PTM_SPF_32-104_0_0 2614,584 0 0 0 0 0 1065,327 0 3679,911 0,70 94,49
GNS_FWS_0_0_0 176,958 810,469 1,897 61,486 248,378 2262,134 0,029 0 3561,351 0,68 95,17
MIS_MIS_0_0_0 0,771 0 0 0 0 0 2972,532 0 2973,303 0,57 95,74
FYK_FWS_0_0_0 3,574 992,755 0 16,195 0 1775,477 0 0 2788,001 0,53 96,27
OTM_DEF_>=105_1_120 553,499 0 27,764 39,428 0 0 49,281 1923,546 2593,518 0,49 96,76
LLS_DEF_0_0_0 361,727 0 41,241 0,859 1158,458 0 122,976 0 1685,261 0,32 97,08
FPO_SPF_0_0_0 0 0 0 0 1653,795 0 0 0 1653,795 0,32 97,40
PTB_SPF_32-104_0_0 3,864 0 0 0 1116,602 0 490,263 0 1610,729 0,31 97,71
PTB_FWS_0_0_0 1179,608 0 0 0 0 0 0 0 1179,608 0,23 97,94
OTM_DEF_>=105_1_110 0 1034,365 0 0 40,673 0,001 0 0 1075,039 0,21 98,15
GNS_SPF_16-109_0_0 671,609 0 117,981 0 0 204,136 0 0 993,726 0,19 98,34
OTM_SPF_32-89_0_0 0 0 722,321 0 250,106 0 0 0 972,427 0,19 98,53
OTB_DEF_>=120_0_0 904,507 0 0 0 0 0 0 0 904,507 0,17 98,70
OTM_SPF_32-104_0_0 382,023 0 0 0 0 0 432,327 0 814,35 0,16 98,86
PTB_SPF_16-31_0_0 0 0 0 0 0 0 78,26 699,886 778,146 0,15 99,01
FYK_ANA_0_0_0 6,572 0 0 0 0 712,876 0 0 719,448 0,14 99,15
OTB_SPF_32-104_0_0 86,279 0 0 0 480,654 0 0 0 566,933 0,11 99,26
PTB_SPF_16-104_0_0 47,19 0 0 0 0 0 0 515,809 562,999 0,11 99,37
PS_SPF_16-31_0_0 531,361 0 0 0 0 0 0 0 531,361 0,10 99,47
GNS_SPF_32-109_0_0 13,911 0 0 104,958 342,693 0 0 0 461,562 0,09 99,56
SSC_DEF_>=105_1_120 0 0 0 0 0 0 90,218 366,874 457,092 0,09 99,65
OTT_DEF_>=120_0_0 258,116 0 0 0 0 0 0 0 258,116 0,05 99,70
FPO_ANA_0_0_0 222,607 0 0 0 0,066 0 0 0 222,673 0,04 99,74
LLD_ANA_0_0_0 151,774 0 0 0 0,499 0,744 67,367 0 220,384 0,04 99,78
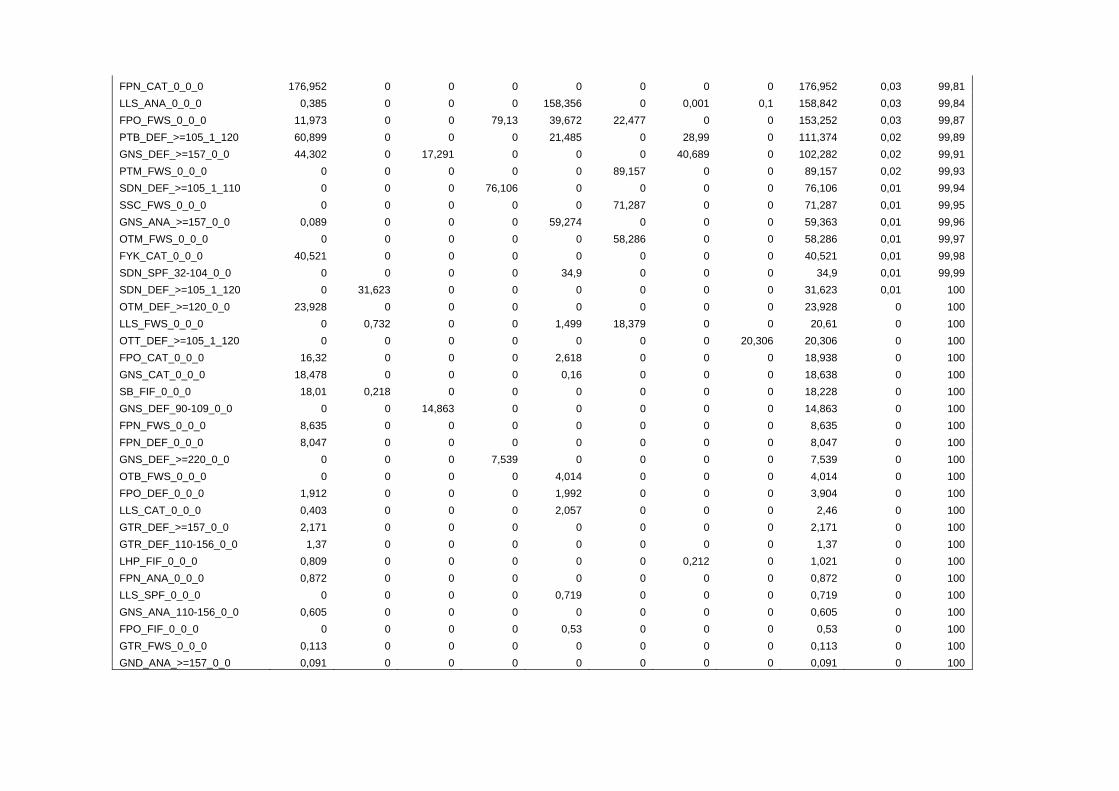
FPN_CAT_0_0_0 176,952 0 0 0 0 0 0 0 176,952 0,03 99,81
LLS_ANA_0_0_0 0,385 0 0 0 158,356 0 0,001 0,1 158,842 0,03 99,84
FPO_FWS_0_0_0 11,973 0 0 79,13 39,672 22,477 0 0 153,252 0,03 99,87
PTB_DEF_>=105_1_120 60,899 0 0 0 21,485 0 28,99 0 111,374 0,02 99,89
GNS_DEF_>=157_0_0 44,302 0 17,291 0 0 0 40,689 0 102,282 0,02 99,91
PTM_FWS_0_0_0 0 0 0 0 0 89,157 0 0 89,157 0,02 99,93
SDN_DEF_>=105_1_110 0 0 0 76,106 0 0 0 0 76,106 0,01 99,94
SSC_FWS_0_0_0 0 0 0 0 0 71,287 0 0 71,287 0,01 99,95
GNS_ANA_>=157_0_0 0,089 0 0 0 59,274 0 0 0 59,363 0,01 99,96
OTM_FWS_0_0_0 0 0 0 0 0 58,286 0 0 58,286 0,01 99,97
FYK_CAT_0_0_0 40,521 0 0 0 0 0 0 0 40,521 0,01 99,98
SDN_SPF_32-104_0_0 0 0 0 0 34,9 0 0 0 34,9 0,01 99,99
SDN_DEF_>=105_1_120 0 31,623 0 0 0 0 0 0 31,623 0,01 100
OTM_DEF_>=120_0_0 23,928 0 0 0 0 0 0 0 23,928 0 100
LLS_FWS_0_0_0 0 0,732 0 0 1,499 18,379 0 0 20,61 0 100
OTT_DEF_>=105_1_120 0 0 0 0 0 0 0 20,306 20,306 0 100
FPO_CAT_0_0_0 16,32 0 0 0 2,618 0 0 0 18,938 0 100
GNS_CAT_0_0_0 18,478 0 0 0 0,16 0 0 0 18,638 0 100
SB_FIF_0_0_0 18,01 0,218 0 0 0 0 0 0 18,228 0 100
GNS_DEF_90-109_0_0 0 0 14,863 0 0 0 0 0 14,863 0 100
FPN_FWS_0_0_0 8,635 0 0 0 0 0 0 0 8,635 0 100
FPN_DEF_0_0_0 8,047 0 0 0 0 0 0 0 8,047 0 100
GNS_DEF_>=220_0_0 0 0 0 7,539 0 0 0 0 7,539 0 100
OTB_FWS_0_0_0 0 0 0 0 4,014 0 0 0 4,014 0 100
FPO_DEF_0_0_0 1,912 0 0 0 1,992 0 0 0 3,904 0 100
LLS_CAT_0_0_0 0,403 0 0 0 2,057 0 0 0 2,46 0 100
GTR_DEF_>=157_0_0 2,171 0 0 0 0 0 0 0 2,171 0 100
GTR_DEF_110-156_0_0 1,37 0 0 0 0 0 0 0 1,37 0 100
LHP_FIF_0_0_0 0,809 0 0 0 0 0 0,212 0 1,021 0 100
FPN_ANA_0_0_0 0,872 0 0 0 0 0 0 0 0,872 0 100
LLS_SPF_0_0_0 0 0 0 0 0,719 0 0 0 0,719 0 100
GNS_ANA_110-156_0_0 0,605 0 0 0 0 0 0 0 0,605 0 100
FPO_FIF_0_0_0 0 0 0 0 0,53 0 0 0 0,53 0 100
GTR_FWS_0_0_0 0,113 0 0 0 0 0 0 0 0,113 0 100
GND_ANA_>=157_0_0 0,091 0 0 0 0 0 0 0 0,091 0 100
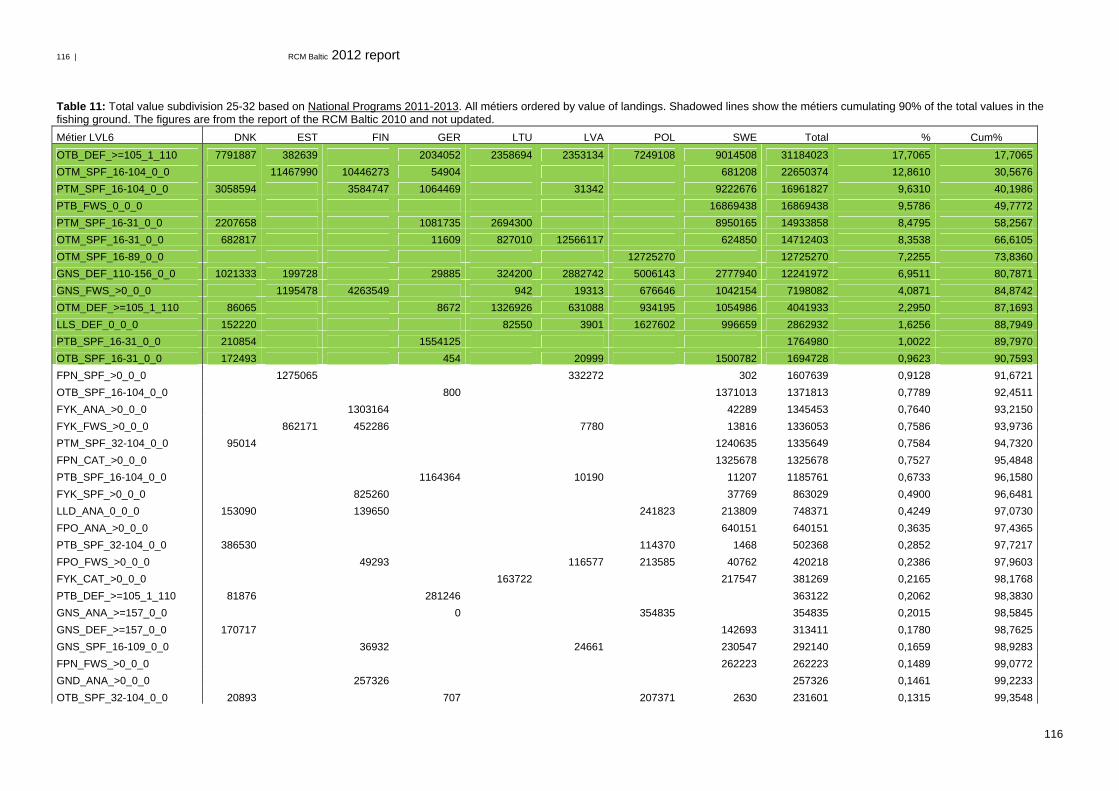
116 | RCM Baltic 2012 report
116
Table 11: Total value subdivision 25-32 based on National Programs 2011-2013. All métiers ordered by value of landings. Shadowed lines show the métiers cumulating 90% of the total values in the fishing ground. The figures are from the report of the RCM Baltic 2010 and not updated.
Métier LVL6 DNK EST FIN GER LTU LVA POL SWE Total % Cum%
OTB_DEF_>=105_1_110 7791887 382639 2034052 2358694 2353134 7249108 9014508 31184023 17,7065 17,7065
OTM_SPF_16-104_0_0 11467990 10446273 54904 681208 22650374 12,8610 30,5676
PTM_SPF_16-104_0_0 3058594 3584747 1064469 31342 9222676 16961827 9,6310 40,1986
PTB_FWS_0_0_0 16869438 16869438 9,5786 49,7772
PTM_SPF_16-31_0_0 2207658 1081735 2694300 8950165 14933858 8,4795 58,2567
OTM_SPF_16-31_0_0 682817 11609 827010 12566117 624850 14712403 8,3538 66,6105
OTM_SPF_16-89_0_0 12725270 12725270 7,2255 73,8360
GNS_DEF_110-156_0_0 1021333 199728 29885 324200 2882742 5006143 2777940 12241972 6,9511 80,7871
GNS_FWS_>0_0_0 1195478 4263549 942 19313 676646 1042154 7198082 4,0871 84,8742
OTM_DEF_>=105_1_110 86065 8672 1326926 631088 934195 1054986 4041933 2,2950 87,1693
LLS_DEF_0_0_0 152220 82550 3901 1627602 996659 2862932 1,6256 88,7949
PTB_SPF_16-31_0_0 210854 1554125 1764980 1,0022 89,7970
OTB_SPF_16-31_0_0 172493 454 20999 1500782 1694728 0,9623 90,7593
FPN_SPF_>0_0_0 1275065 332272 302 1607639 0,9128 91,6721
OTB_SPF_16-104_0_0 800 1371013 1371813 0,7789 92,4511
FYK_ANA_>0_0_0 1303164 42289 1345453 0,7640 93,2150
FYK_FWS_>0_0_0 862171 452286 7780 13816 1336053 0,7586 93,9736
PTM_SPF_32-104_0_0 95014 1240635 1335649 0,7584 94,7320
FPN_CAT_>0_0_0 1325678 1325678 0,7527 95,4848
PTB_SPF_16-104_0_0 1164364 10190 11207 1185761 0,6733 96,1580
FYK_SPF_>0_0_0 825260 37769 863029 0,4900 96,6481
LLD_ANA_0_0_0 153090 139650 241823 213809 748371 0,4249 97,0730
FPO_ANA_>0_0_0 640151 640151 0,3635 97,4365
PTB_SPF_32-104_0_0 386530 114370 1468 502368 0,2852 97,7217
FPO_FWS_>0_0_0 49293 116577 213585 40762 420218 0,2386 97,9603
FYK_CAT_>0_0_0 163722 217547 381269 0,2165 98,1768
PTB_DEF_>=105_1_110 81876 281246 363122 0,2062 98,3830
GNS_ANA_>=157_0_0 0 354835 354835 0,2015 98,5845
GNS_DEF_>=157_0_0 170717 142693 313411 0,1780 98,7625
GNS_SPF_16-109_0_0 36932 24661 230547 292140 0,1659 98,9283
FPN_FWS_>0_0_0 262223 262223 0,1489 99,0772
GND_ANA_>0_0_0 257326 257326 0,1461 99,2233
OTB_SPF_32-104_0_0 20893 707 207371 2630 231601 0,1315 99,3548
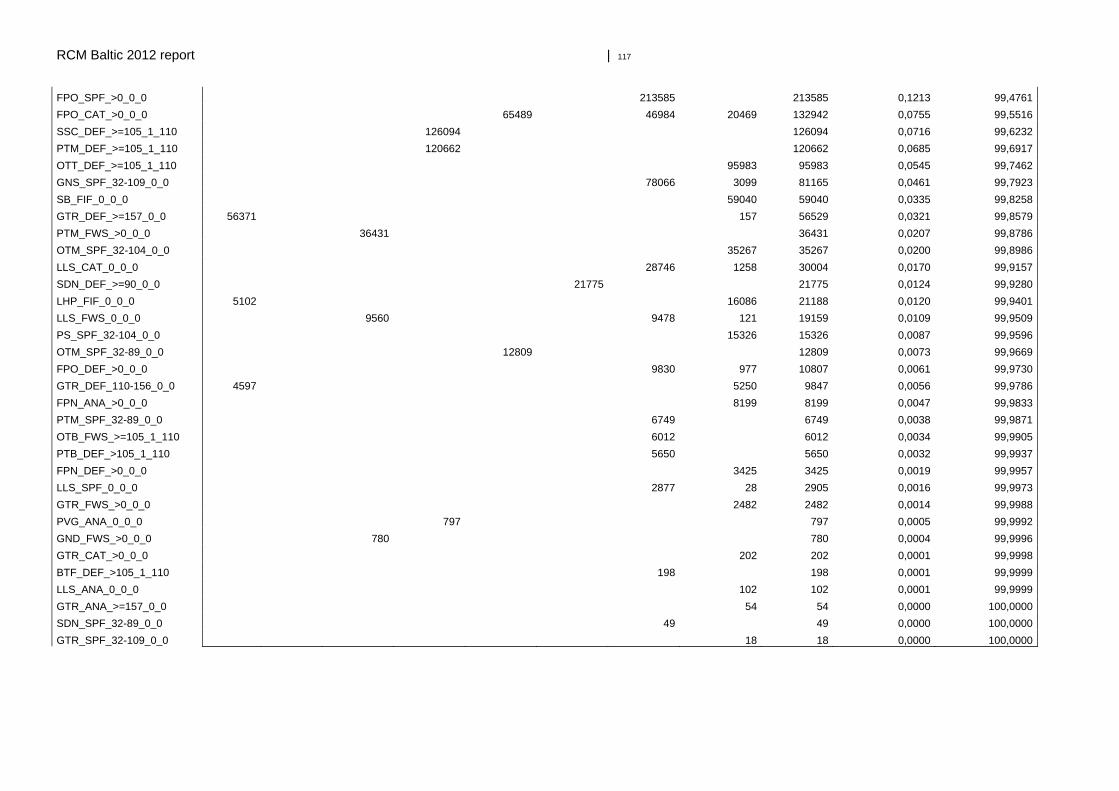
RCM Baltic 2012 report | 117
FPO_SPF_>0_0_0 213585 213585 0,1213 99,4761
FPO_CAT_>0_0_0 65489 46984 20469 132942 0,0755 99,5516
SSC_DEF_>=105_1_110 126094 126094 0,0716 99,6232
PTM_DEF_>=105_1_110 120662 120662 0,0685 99,6917
OTT_DEF_>=105_1_110 95983 95983 0,0545 99,7462
GNS_SPF_32-109_0_0 78066 3099 81165 0,0461 99,7923
SB_FIF_0_0_0 59040 59040 0,0335 99,8258
GTR_DEF_>=157_0_0 56371 157 56529 0,0321 99,8579
PTM_FWS_>0_0_0 36431 36431 0,0207 99,8786
OTM_SPF_32-104_0_0 35267 35267 0,0200 99,8986
LLS_CAT_0_0_0 28746 1258 30004 0,0170 99,9157
SDN_DEF_>=90_0_0 21775 21775 0,0124 99,9280
LHP_FIF_0_0_0 5102 16086 21188 0,0120 99,9401
LLS_FWS_0_0_0 9560 9478 121 19159 0,0109 99,9509
PS_SPF_32-104_0_0 15326 15326 0,0087 99,9596
OTM_SPF_32-89_0_0 12809 12809 0,0073 99,9669
FPO_DEF_>0_0_0 9830 977 10807 0,0061 99,9730
GTR_DEF_110-156_0_0 4597 5250 9847 0,0056 99,9786
FPN_ANA_>0_0_0 8199 8199 0,0047 99,9833
PTM_SPF_32-89_0_0 6749 6749 0,0038 99,9871
OTB_FWS_>=105_1_110 6012 6012 0,0034 99,9905
PTB_DEF_>105_1_110 5650 5650 0,0032 99,9937
FPN_DEF_>0_0_0 3425 3425 0,0019 99,9957
LLS_SPF_0_0_0 2877 28 2905 0,0016 99,9973
GTR_FWS_>0_0_0 2482 2482 0,0014 99,9988
PVG_ANA_0_0_0 797 797 0,0005 99,9992
GND_FWS_>0_0_0 780 780 0,0004 99,9996
GTR_CAT_>0_0_0 202 202 0,0001 99,9998
BTF_DEF_>105_1_110 198 198 0,0001 99,9999
LLS_ANA_0_0_0 102 102 0,0001 99,9999
GTR_ANA_>=157_0_0 54 54 0,0000 100,0000
SDN_SPF_32-89_0_0 49 49 0,0000 100,0000
GTR_SPF_32-109_0_0 18 18 0,0000 100,0000
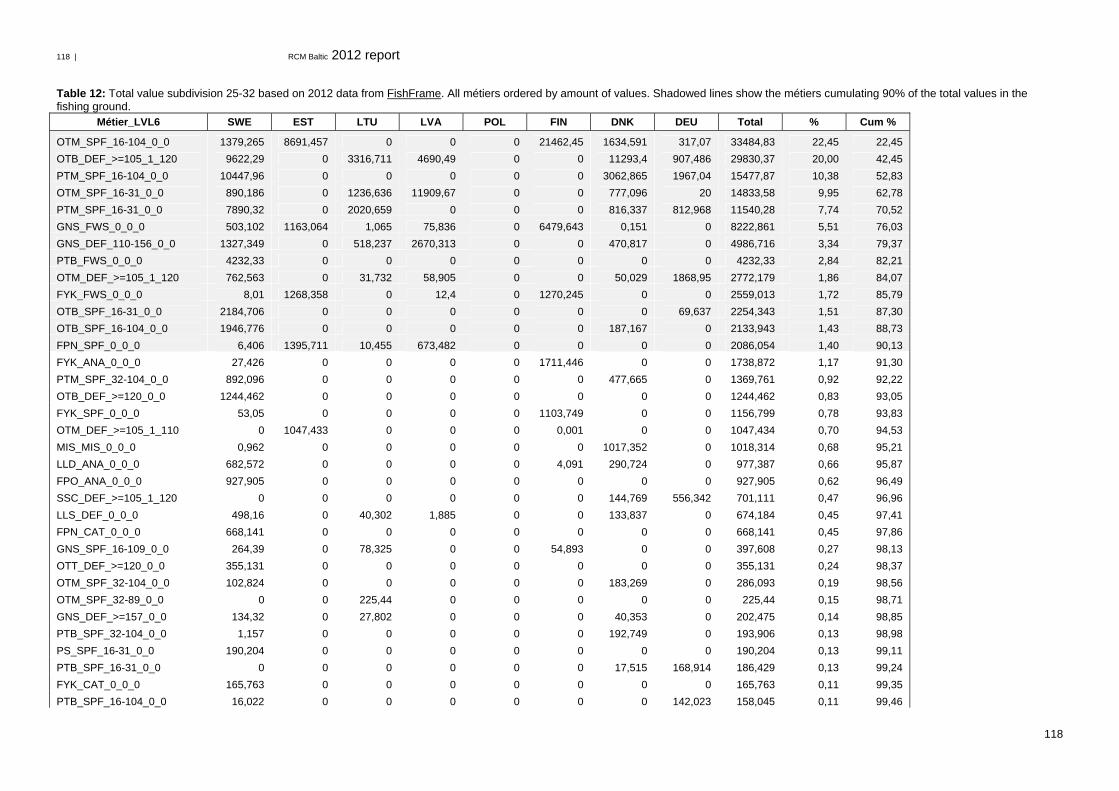
118 | RCM Baltic 2012 report
118
Table 12: Total value subdivision 25-32 based on 2012 data from FishFrame. All métiers ordered by amount of values. Shadowed lines show the métiers cumulating 90% of the total values in the fishing ground.
Métier_LVL6 SWE EST LTU LVA POL FIN DNK DEU Total % Cum %
OTM_SPF_16-104_0_0 1379,265 8691,457 0 0 0 21462,45 1634,591 317,07 33484,83 22,45 22,45
OTB_DEF_>=105_1_120 9622,29 0 3316,711 4690,49 0 0 11293,4 907,486 29830,37 20,00 42,45
PTM_SPF_16-104_0_0 10447,96 0 0 0 0 0 3062,865 1967,04 15477,87 10,38 52,83
OTM_SPF_16-31_0_0 890,186 0 1236,636 11909,67 0 0 777,096 20 14833,58 9,95 62,78
PTM_SPF_16-31_0_0 7890,32 0 2020,659 0 0 0 816,337 812,968 11540,28 7,74 70,52
GNS_FWS_0_0_0 503,102 1163,064 1,065 75,836 0 6479,643 0,151 0 8222,861 5,51 76,03
GNS_DEF_110-156_0_0 1327,349 0 518,237 2670,313 0 0 470,817 0 4986,716 3,34 79,37
PTB_FWS_0_0_0 4232,33 0 0 0 0 0 0 0 4232,33 2,84 82,21
OTM_DEF_>=105_1_120 762,563 0 31,732 58,905 0 0 50,029 1868,95 2772,179 1,86 84,07
FYK_FWS_0_0_0 8,01 1268,358 0 12,4 0 1270,245 0 0 2559,013 1,72 85,79
OTB_SPF_16-31_0_0 2184,706 0 0 0 0 0 0 69,637 2254,343 1,51 87,30
OTB_SPF_16-104_0_0 1946,776 0 0 0 0 0 187,167 0 2133,943 1,43 88,73
FPN_SPF_0_0_0 6,406 1395,711 10,455 673,482 0 0 0 0 2086,054 1,40 90,13
FYK_ANA_0_0_0 27,426 0 0 0 0 1711,446 0 0 1738,872 1,17 91,30
PTM_SPF_32-104_0_0 892,096 0 0 0 0 0 477,665 0 1369,761 0,92 92,22
OTB_DEF_>=120_0_0 1244,462 0 0 0 0 0 0 0 1244,462 0,83 93,05
FYK_SPF_0_0_0 53,05 0 0 0 0 1103,749 0 0 1156,799 0,78 93,83
OTM_DEF_>=105_1_110 0 1047,433 0 0 0 0,001 0 0 1047,434 0,70 94,53
MIS_MIS_0_0_0 0,962 0 0 0 0 0 1017,352 0 1018,314 0,68 95,21
LLD_ANA_0_0_0 682,572 0 0 0 0 4,091 290,724 0 977,387 0,66 95,87
FPO_ANA_0_0_0 927,905 0 0 0 0 0 0 0 927,905 0,62 96,49
SSC_DEF_>=105_1_120 0 0 0 0 0 0 144,769 556,342 701,111 0,47 96,96
LLS_DEF_0_0_0 498,16 0 40,302 1,885 0 0 133,837 0 674,184 0,45 97,41
FPN_CAT_0_0_0 668,141 0 0 0 0 0 0 0 668,141 0,45 97,86
GNS_SPF_16-109_0_0 264,39 0 78,325 0 0 54,893 0 0 397,608 0,27 98,13
OTT_DEF_>=120_0_0 355,131 0 0 0 0 0 0 0 355,131 0,24 98,37
OTM_SPF_32-104_0_0 102,824 0 0 0 0 0 183,269 0 286,093 0,19 98,56
OTM_SPF_32-89_0_0 0 0 225,44 0 0 0 0 0 225,44 0,15 98,71
GNS_DEF_>=157_0_0 134,32 0 27,802 0 0 0 40,353 0 202,475 0,14 98,85
PTB_SPF_32-104_0_0 1,157 0 0 0 0 0 192,749 0 193,906 0,13 98,98
PS_SPF_16-31_0_0 190,204 0 0 0 0 0 0 0 190,204 0,13 99,11
PTB_SPF_16-31_0_0 0 0 0 0 0 0 17,515 168,914 186,429 0,13 99,24
FYK_CAT_0_0_0 165,763 0 0 0 0 0 0 0 165,763 0,11 99,35
PTB_SPF_16-104_0_0 16,022 0 0 0 0 0 0 142,023 158,045 0,11 99,46
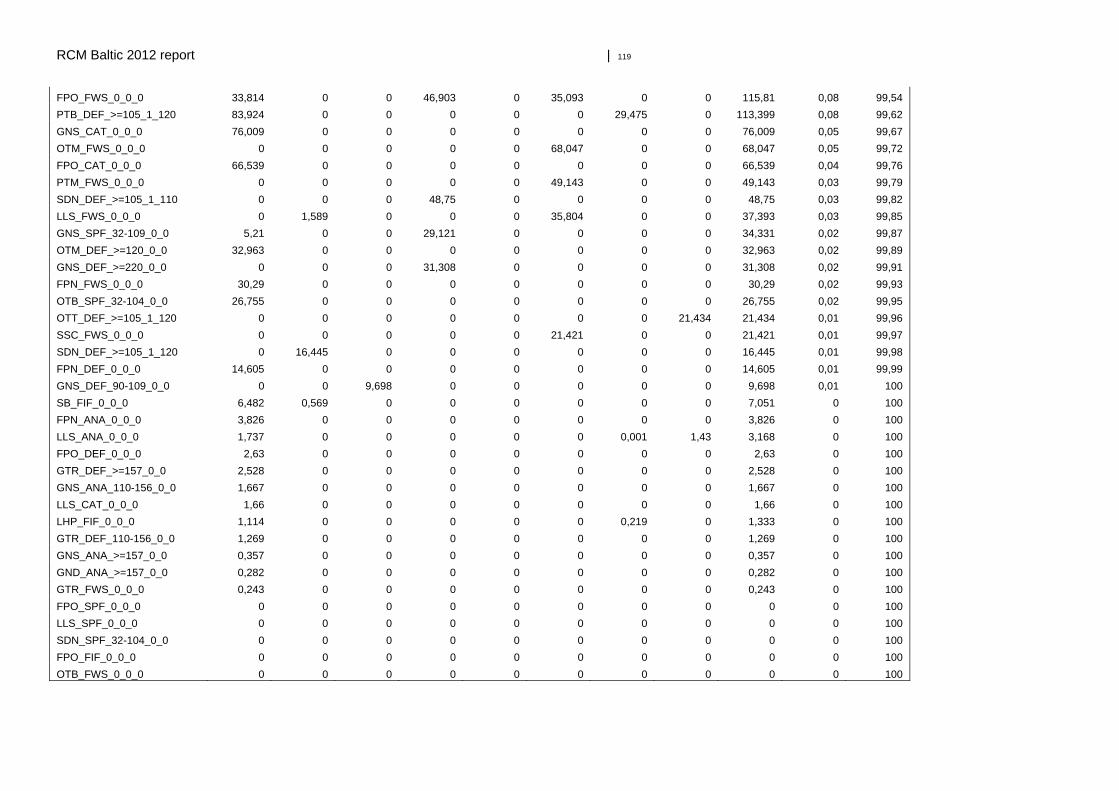
RCM Baltic 2012 report | 119
FPO_FWS_0_0_0 33,814 0 0 46,903 0 35,093 0 0 115,81 0,08 99,54
PTB_DEF_>=105_1_120 83,924 0 0 0 0 0 29,475 0 113,399 0,08 99,62
GNS_CAT_0_0_0 76,009 0 0 0 0 0 0 0 76,009 0,05 99,67
OTM_FWS_0_0_0 0 0 0 0 0 68,047 0 0 68,047 0,05 99,72
FPO_CAT_0_0_0 66,539 0 0 0 0 0 0 0 66,539 0,04 99,76
PTM_FWS_0_0_0 0 0 0 0 0 49,143 0 0 49,143 0,03 99,79
SDN_DEF_>=105_1_110 0 0 0 48,75 0 0 0 0 48,75 0,03 99,82
LLS_FWS_0_0_0 0 1,589 0 0 0 35,804 0 0 37,393 0,03 99,85
GNS_SPF_32-109_0_0 5,21 0 0 29,121 0 0 0 0 34,331 0,02 99,87
OTM_DEF_>=120_0_0 32,963 0 0 0 0 0 0 0 32,963 0,02 99,89
GNS_DEF_>=220_0_0 0 0 0 31,308 0 0 0 0 31,308 0,02 99,91
FPN_FWS_0_0_0 30,29 0 0 0 0 0 0 0 30,29 0,02 99,93
OTB_SPF_32-104_0_0 26,755 0 0 0 0 0 0 0 26,755 0,02 99,95
OTT_DEF_>=105_1_120 0 0 0 0 0 0 0 21,434 21,434 0,01 99,96
SSC_FWS_0_0_0 0 0 0 0 0 21,421 0 0 21,421 0,01 99,97
SDN_DEF_>=105_1_120 0 16,445 0 0 0 0 0 0 16,445 0,01 99,98
FPN_DEF_0_0_0 14,605 0 0 0 0 0 0 0 14,605 0,01 99,99
GNS_DEF_90-109_0_0 0 0 9,698 0 0 0 0 0 9,698 0,01 100
SB_FIF_0_0_0 6,482 0,569 0 0 0 0 0 0 7,051 0 100
FPN_ANA_0_0_0 3,826 0 0 0 0 0 0 0 3,826 0 100
LLS_ANA_0_0_0 1,737 0 0 0 0 0 0,001 1,43 3,168 0 100
FPO_DEF_0_0_0 2,63 0 0 0 0 0 0 0 2,63 0 100
GTR_DEF_>=157_0_0 2,528 0 0 0 0 0 0 0 2,528 0 100
GNS_ANA_110-156_0_0 1,667 0 0 0 0 0 0 0 1,667 0 100
LLS_CAT_0_0_0 1,66 0 0 0 0 0 0 0 1,66 0 100
LHP_FIF_0_0_0 1,114 0 0 0 0 0 0,219 0 1,333 0 100
GTR_DEF_110-156_0_0 1,269 0 0 0 0 0 0 0 1,269 0 100
GNS_ANA_>=157_0_0 0,357 0 0 0 0 0 0 0 0,357 0 100
GND_ANA_>=157_0_0 0,282 0 0 0 0 0 0 0 0,282 0 100
GTR_FWS_0_0_0 0,243 0 0 0 0 0 0 0 0,243 0 100
FPO_SPF_0_0_0 0 0 0 0 0 0 0 0 0 0 100
LLS_SPF_0_0_0 0 0 0 0 0 0 0 0 0 0 100
SDN_SPF_32-104_0_0 0 0 0 0 0 0 0 0 0 0 100
FPO_FIF_0_0_0 0 0 0 0 0 0 0 0 0 0 100
OTB_FWS_0_0_0 0 0 0 0 0 0 0 0 0 0 100
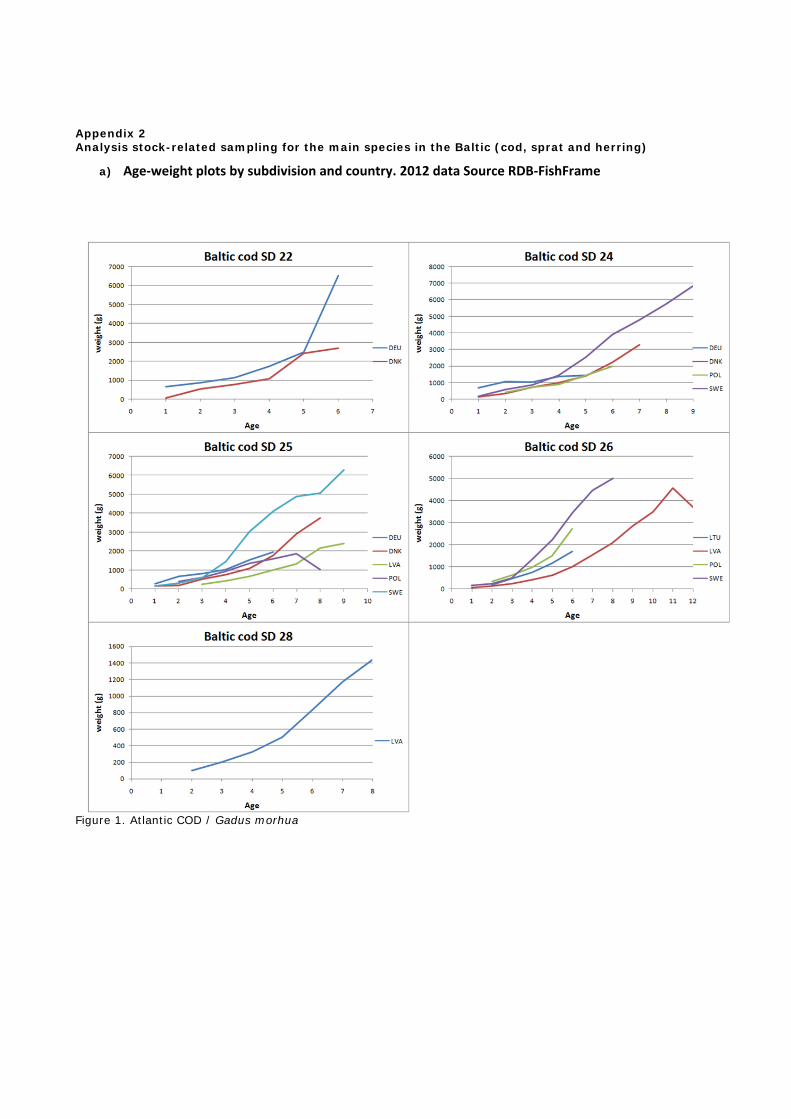
Appendix 2 Analysis stock-related sampling for the main species in the Baltic (cod, sprat and herring)
a) Age‐weight plots by subdivision and country. 2012 data Source RDB‐FishFrame
Figure 1. Atlantic COD / Gadus morhua
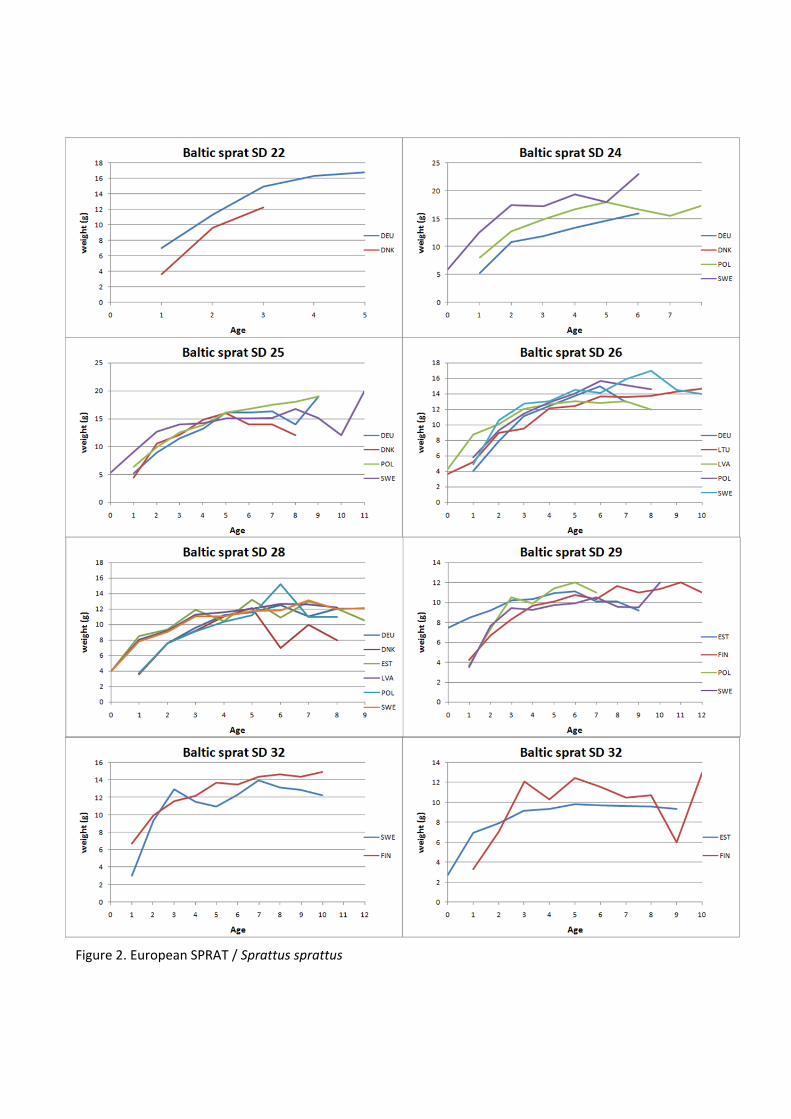
Figure 2. European SPRAT / Sprattus sprattus
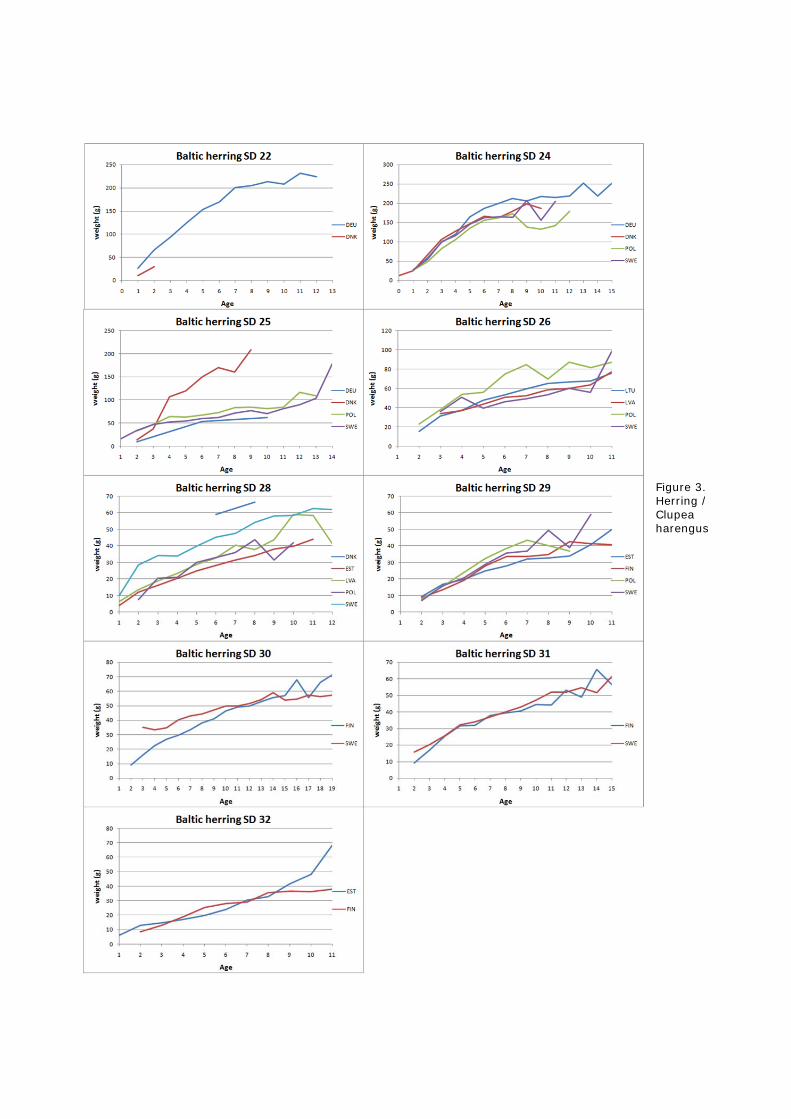
Figure 3. Herring / Clupea harengus
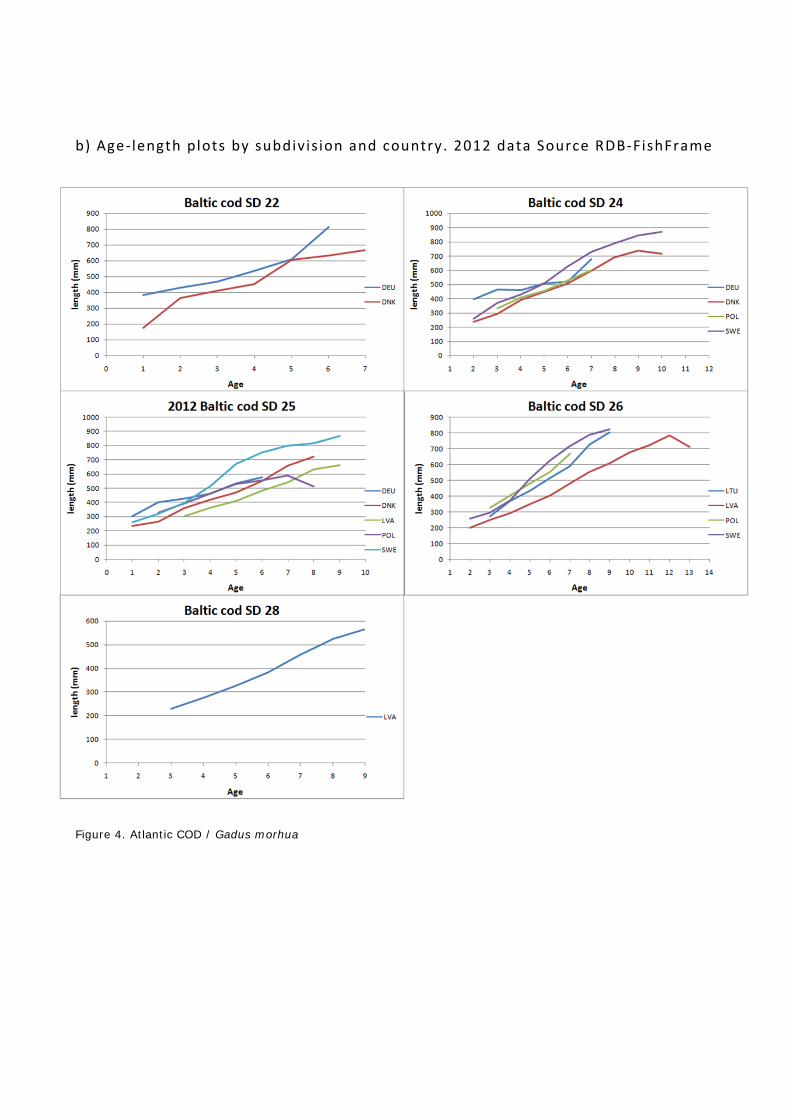
b) Age ‐ length plots by subdivis ion and country. 2012 data Source RDB‐FishFrame
Figure 4. Atlantic COD / Gadus morhua
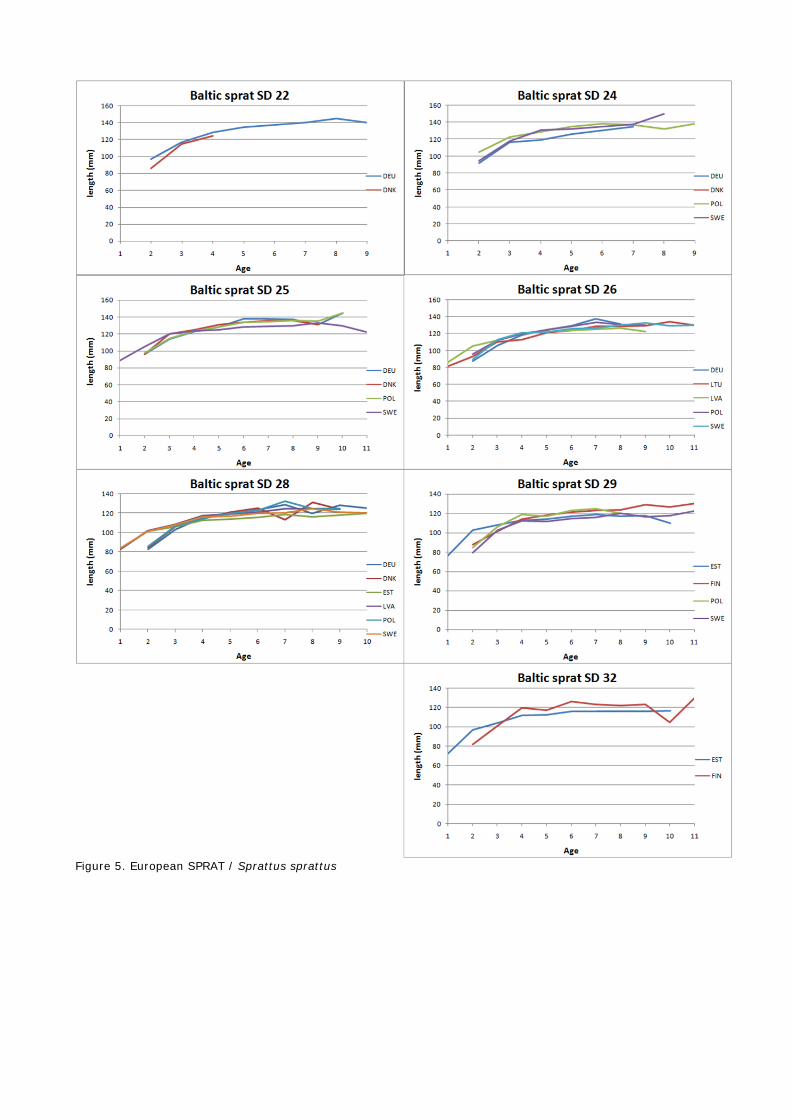
Figure 5. European SPRAT / Sprattus sprattus
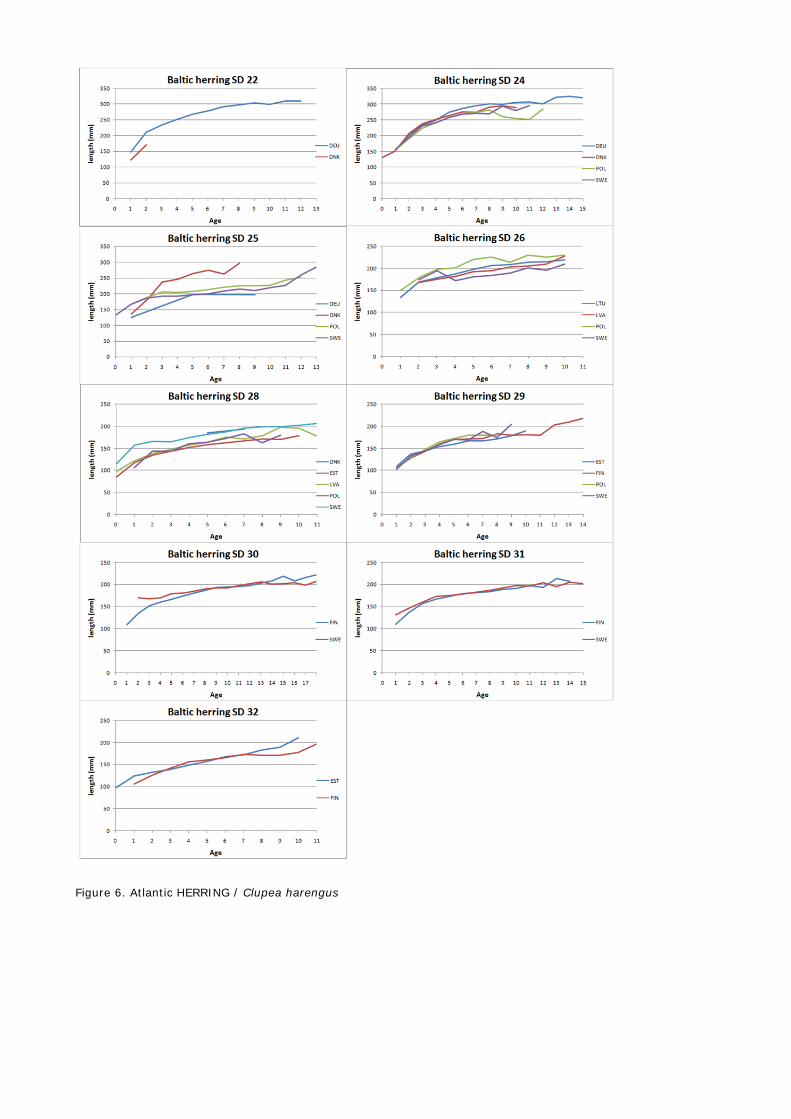
Figure 6. Atlantic HERRING / Clupea harengus
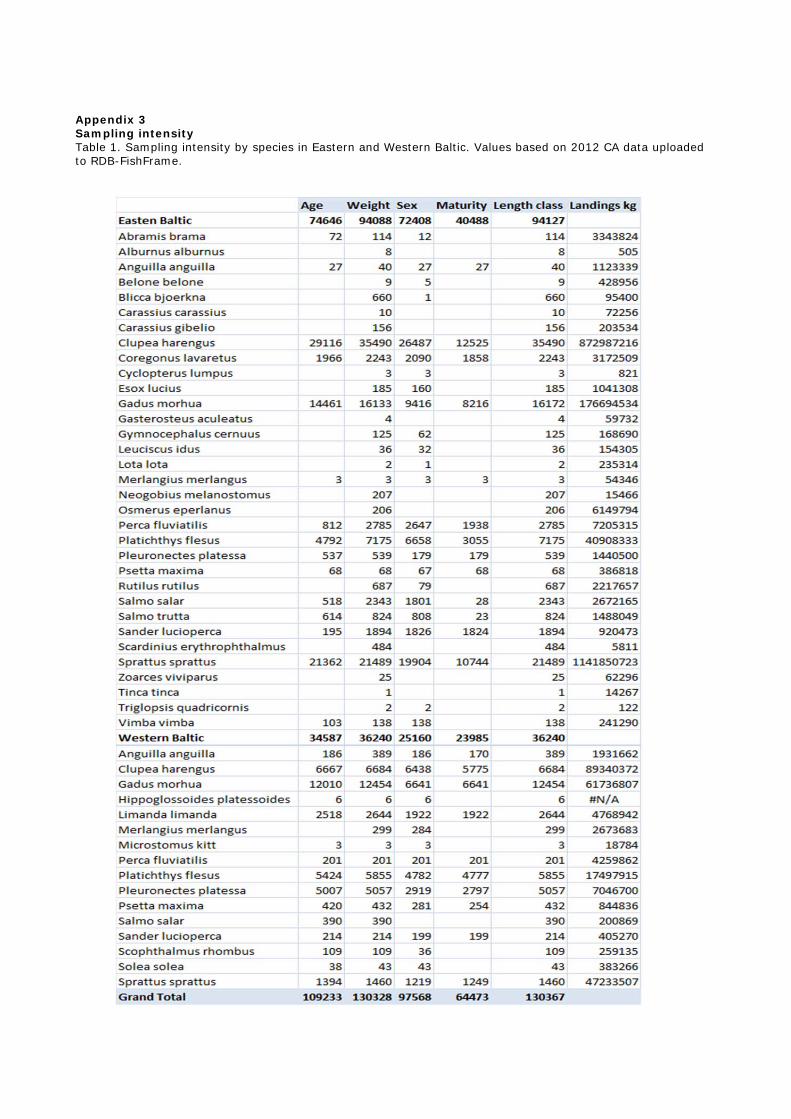
Appendix 3 Sampling intensity Table 1. Sampling intensity by species in Eastern and Western Baltic. Values based on 2012 CA data uploaded to RDB-FishFrame.
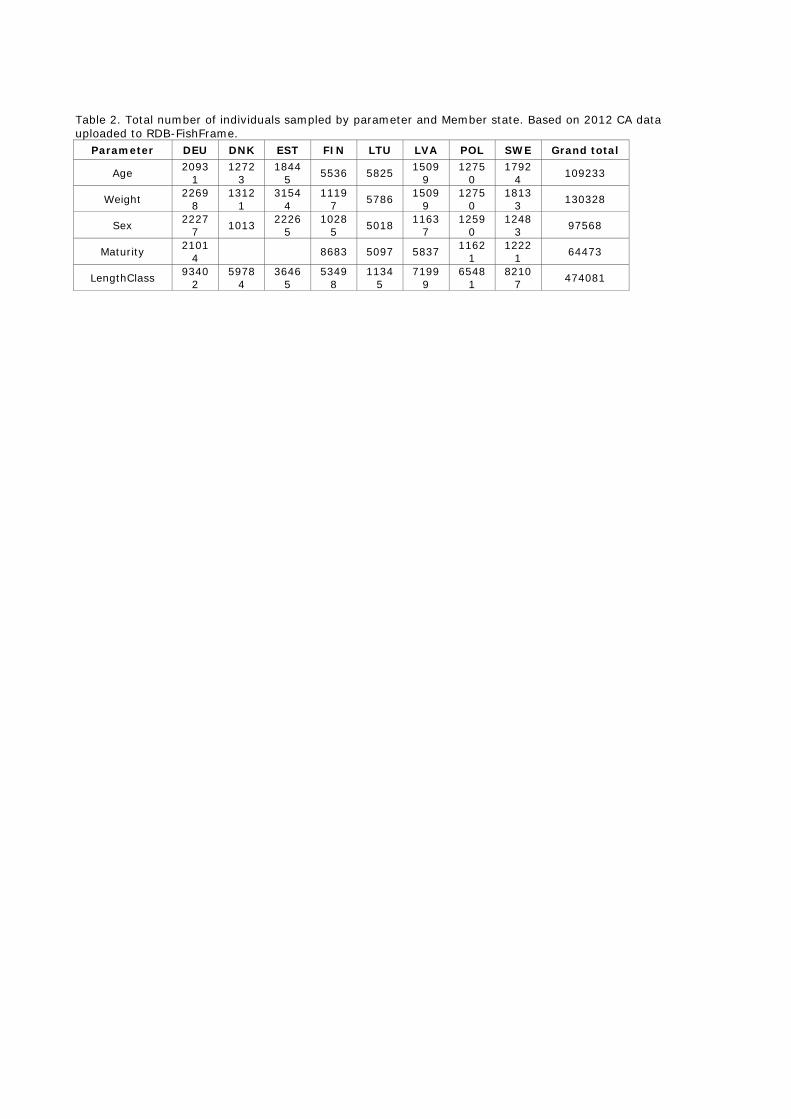
Table 2. Total number of individuals sampled by parameter and Member state. Based on 2012 CA data uploaded to RDB-FishFrame.
Parameter DEU DNK EST FIN LTU LVA POL SWE Grand total
Age 20931
12723
18445 5536 5825 1509
9 1275
0 1792
4 109233
Weight 22698
13121
31544
11197 5786 1509
9 1275
0 1813
3 130328
Sex 22277 1013 2226
5 1028
5 5018 11637
12590
12483 97568
Maturity 21014 8683 5097 5837 1162
1 1222
1 64473
LengthClass 93402
59784
36465
53498
11345
71999
65481
82107 474081

Table 3. Number of individuals sampled by species and country separated by fishing ground. Figures based on 2012 CA data uploaded to RDB-FishFrame.

Table 3 cont.
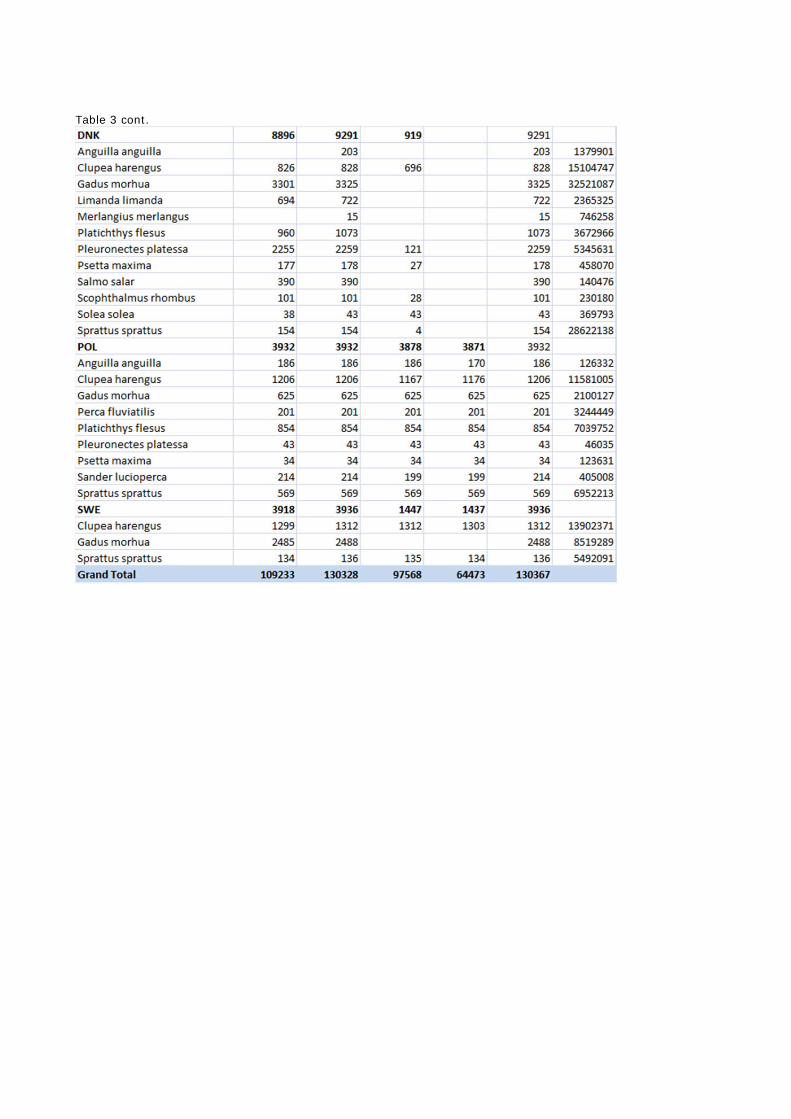
Table 3 cont.
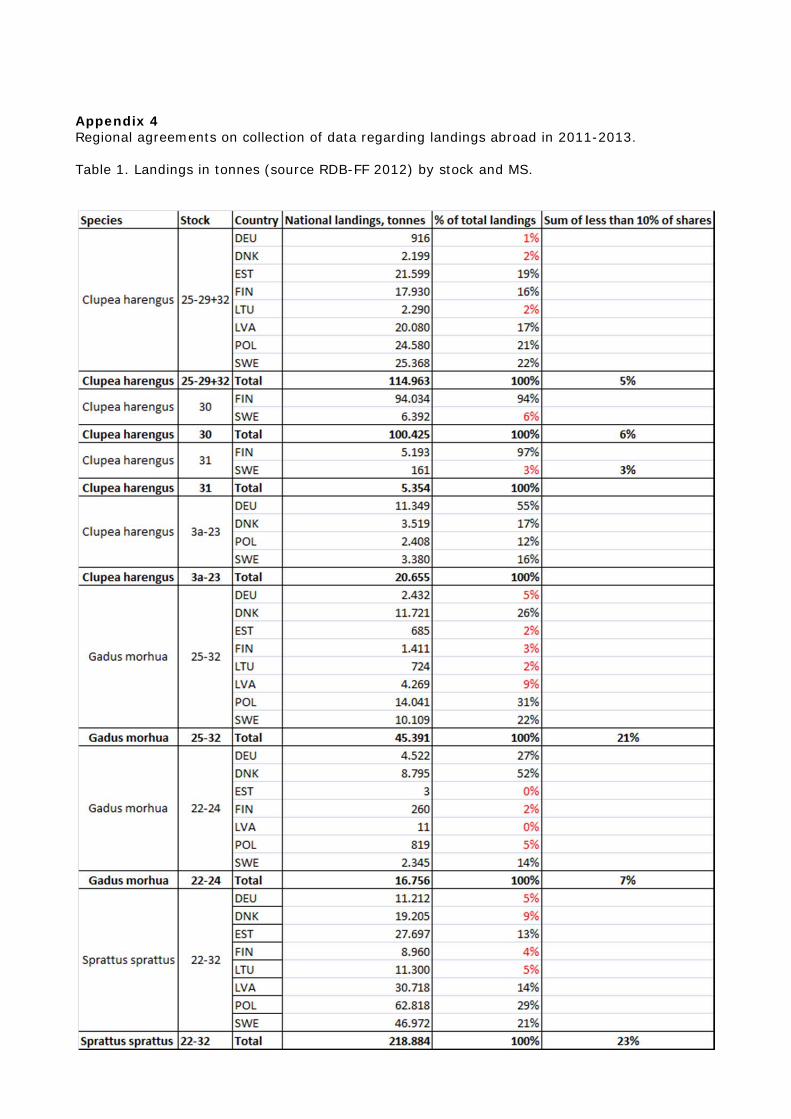
Appendix 4 Regional agreements on collection of data regarding landings abroad in 2011-2013. Table 1. Landings in tonnes (source RDB-FF 2012) by stock and MS.
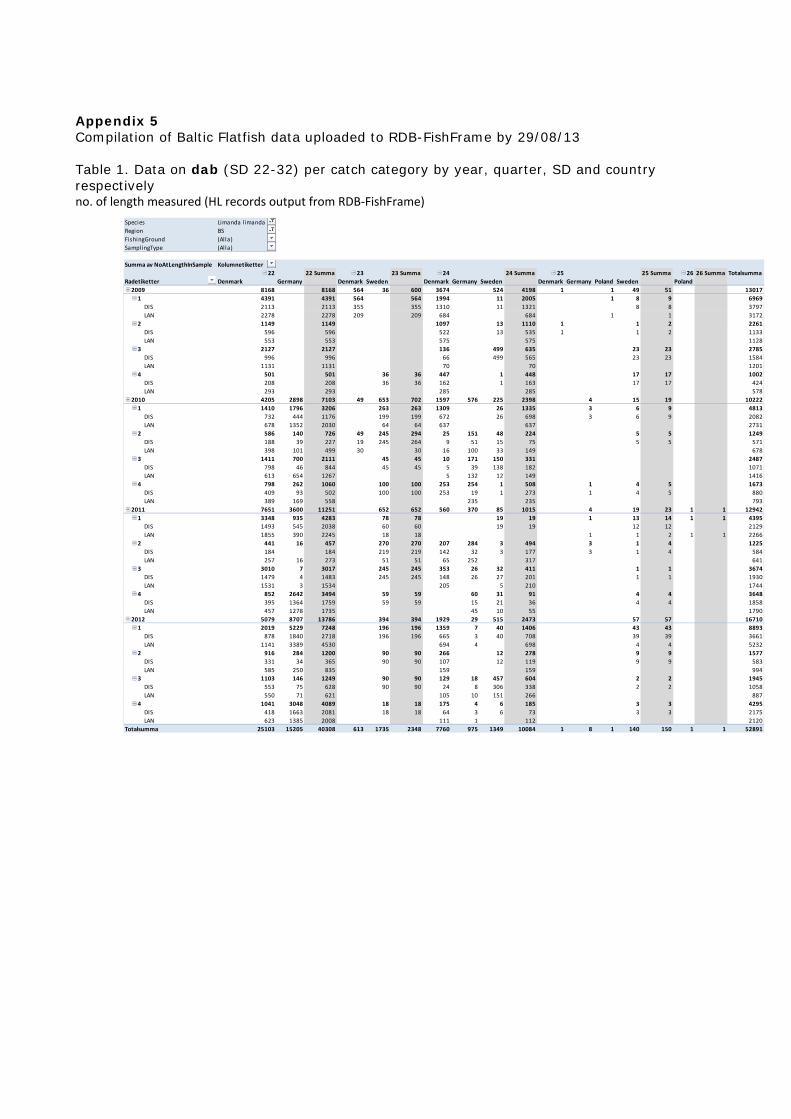
Appendix 5 Compilation of Baltic Flatfish data uploaded to RDB-FishFrame by 29/08/13 Table 1. Data on dab (SD 22-32) per catch category by year, quarter, SD and country respectively no. of length measured (HL records output from RDB‐FishFrame)
Species Limanda l imanda
Region BS
FishingGround (Alla)
SamplingType (Alla)
Summa av NoAtLengthInSample Kolumnetiketter
22 22 Summa 23 23 Summa 24 24 Summa 25 25 Summa 26 26 Summa Totalsumma
Radetiketter Denmark Germany Denmark Sweden Denmark Germany Sweden Denmark Germany Poland Sweden Poland
2009 8168 8168 564 36 600 3674 524 4198 1 1 49 51 13017
1 4391 4391 564 564 1994 11 2005 1 8 9 6969
DIS 2113 2113 355 355 1310 11 1321 8 8 3797
LAN 2278 2278 209 209 684 684 1 1 3172
2 1149 1149 1097 13 1110 1 1 2 2261
DIS 596 596 522 13 535 1 1 2 1133
LAN 553 553 575 575 1128
3 2127 2127 136 499 635 23 23 2785
DIS 996 996 66 499 565 23 23 1584
LAN 1131 1131 70 70 1201
4 501 501 36 36 447 1 448 17 17 1002
DIS 208 208 36 36 162 1 163 17 17 424
LAN 293 293 285 285 578
2010 4205 2898 7103 49 653 702 1597 576 225 2398 4 15 19 10222
1 1410 1796 3206 263 263 1309 26 1335 3 6 9 4813
DIS 732 444 1176 199 199 672 26 698 3 6 9 2082
LAN 678 1352 2030 64 64 637 637 2731
2 586 140 726 49 245 294 25 151 48 224 5 5 1249
DIS 188 39 227 19 245 264 9 51 15 75 5 5 571
LAN 398 101 499 30 30 16 100 33 149 678
3 1411 700 2111 45 45 10 171 150 331 2487
DIS 798 46 844 45 45 5 39 138 182 1071
LAN 613 654 1267 5 132 12 149 1416
4 798 262 1060 100 100 253 254 1 508 1 4 5 1673
DIS 409 93 502 100 100 253 19 1 273 1 4 5 880
LAN 389 169 558 235 235 793
2011 7651 3600 11251 652 652 560 370 85 1015 4 19 23 1 1 12942
1 3348 935 4283 78 78 19 19 1 13 14 1 1 4395
DIS 1493 545 2038 60 60 19 19 12 12 2129
LAN 1855 390 2245 18 18 1 1 2 1 1 2266
2 441 16 457 270 270 207 284 3 494 3 1 4 1225
DIS 184 184 219 219 142 32 3 177 3 1 4 584
LAN 257 16 273 51 51 65 252 317 641
3 3010 7 3017 245 245 353 26 32 411 1 1 3674
DIS 1479 4 1483 245 245 148 26 27 201 1 1 1930
LAN 1531 3 1534 205 5 210 1744
4 852 2642 3494 59 59 60 31 91 4 4 3648
DIS 395 1364 1759 59 59 15 21 36 4 4 1858
LAN 457 1278 1735 45 10 55 1790
2012 5079 8707 13786 394 394 1929 29 515 2473 57 57 16710
1 2019 5229 7248 196 196 1359 7 40 1406 43 43 8893
DIS 878 1840 2718 196 196 665 3 40 708 39 39 3661
LAN 1141 3389 4530 694 4 698 4 4 5232
2 916 284 1200 90 90 266 12 278 9 9 1577
DIS 331 34 365 90 90 107 12 119 9 9 583
LAN 585 250 835 159 159 994
3 1103 146 1249 90 90 129 18 457 604 2 2 1945
DIS 553 75 628 90 90 24 8 306 338 2 2 1058
LAN 550 71 621 105 10 151 266 887
4 1041 3048 4089 18 18 175 4 6 185 3 3 4295
DIS 418 1663 2081 18 18 64 3 6 73 3 3 2175
LAN 623 1385 2008 111 1 112 2120
Totalsumma 25103 15205 40308 613 1735 2348 7760 975 1349 10084 1 8 1 140 150 1 1 52891
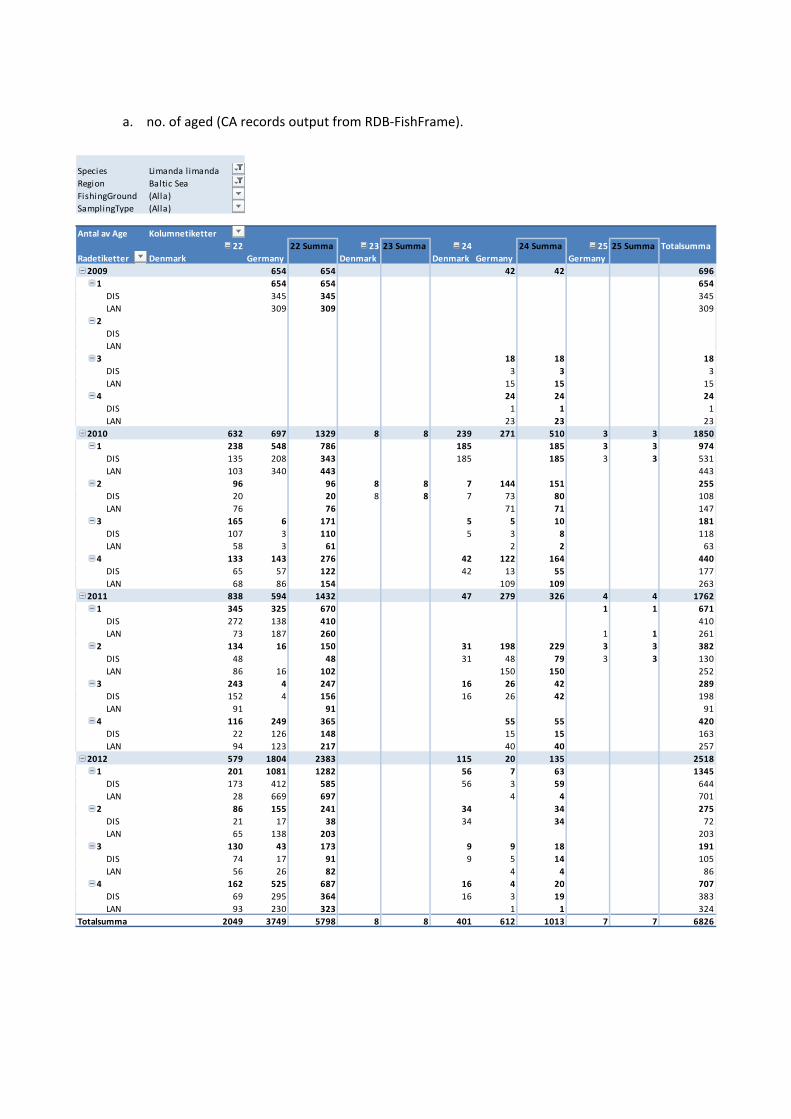
a. no. of aged (CA records output from RDB‐FishFrame).
Species Limanda l imanda
Region Baltic Sea
FishingGround (Alla)
SamplingType (Alla)
Antal av Age Kolumnetiketter
22 22 Summa 23 23 Summa 24 24 Summa 25 25 Summa Totalsumma
Radetiketter Denmark Germany Denmark Denmark Germany Germany
2009 654 654 42 42 696
1 654 654 654
DIS 345 345 345
LAN 309 309 309
2
DIS
LAN
3 18 18 18
DIS 3 3 3
LAN 15 15 15
4 24 24 24
DIS 1 1 1
LAN 23 23 23
2010 632 697 1329 8 8 239 271 510 3 3 1850
1 238 548 786 185 185 3 3 974
DIS 135 208 343 185 185 3 3 531
LAN 103 340 443 443
2 96 96 8 8 7 144 151 255
DIS 20 20 8 8 7 73 80 108
LAN 76 76 71 71 147
3 165 6 171 5 5 10 181
DIS 107 3 110 5 3 8 118
LAN 58 3 61 2 2 63
4 133 143 276 42 122 164 440
DIS 65 57 122 42 13 55 177
LAN 68 86 154 109 109 263
2011 838 594 1432 47 279 326 4 4 1762
1 345 325 670 1 1 671
DIS 272 138 410 410
LAN 73 187 260 1 1 261
2 134 16 150 31 198 229 3 3 382
DIS 48 48 31 48 79 3 3 130
LAN 86 16 102 150 150 252
3 243 4 247 16 26 42 289
DIS 152 4 156 16 26 42 198
LAN 91 91 91
4 116 249 365 55 55 420
DIS 22 126 148 15 15 163
LAN 94 123 217 40 40 257
2012 579 1804 2383 115 20 135 2518
1 201 1081 1282 56 7 63 1345
DIS 173 412 585 56 3 59 644
LAN 28 669 697 4 4 701
2 86 155 241 34 34 275
DIS 21 17 38 34 34 72
LAN 65 138 203 203
3 130 43 173 9 9 18 191
DIS 74 17 91 9 5 14 105
LAN 56 26 82 4 4 86
4 162 525 687 16 4 20 707
DIS 69 295 364 16 3 19 383
LAN 93 230 323 1 1 324
Totalsumma 2049 3749 5798 8 8 401 612 1013 7 7 6826
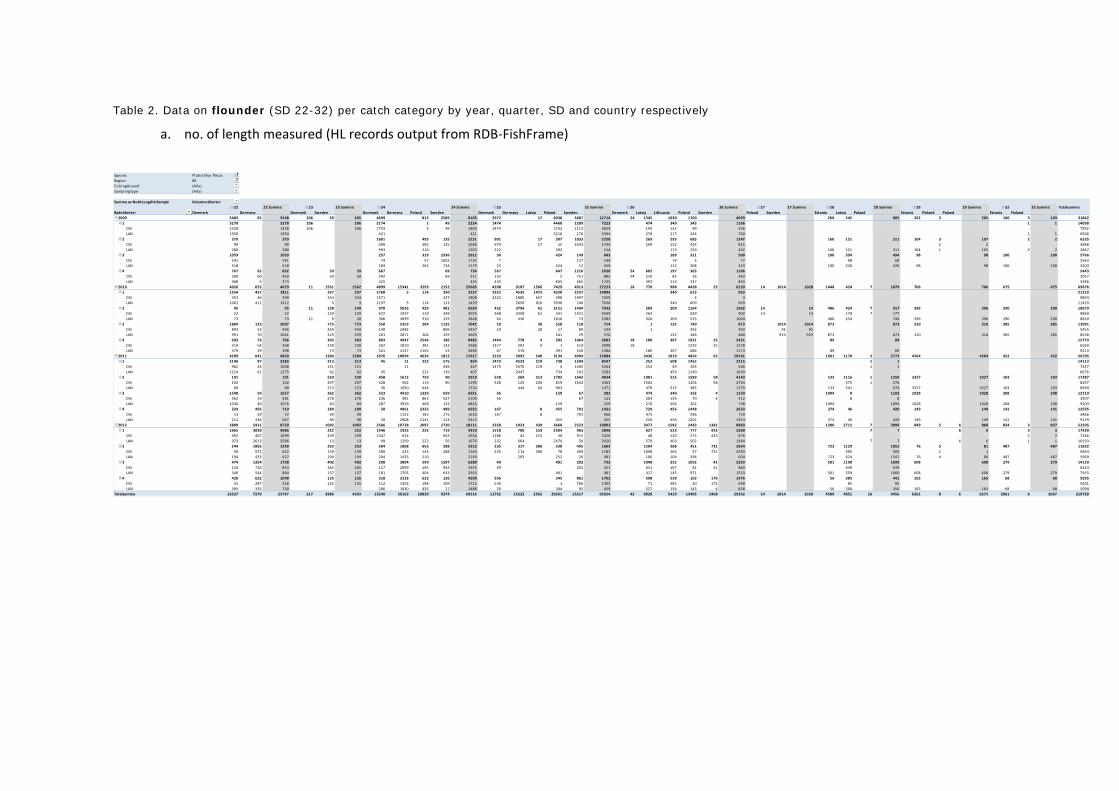
Table 2. Data on flounder (SD 22-32) per catch category by year, quarter, SD and country respectively
a. no. of length measured (HL records output from RDB‐FishFrame)
Species Platichthys flesus
Region BS
FishingGround (Alla)
SamplingType (Alla)
Summa av NoAtLengthInSample Kolumnetiketter
22 22 Summa 23 23 Summa 24 24 Summa 25 25 Summa 26 26 Summa 27 27 Summa 28 28 Summa 29 29 Summa 32 32 Summa Totalsumma
Radetiketter Denmark Germany Denmark Sweden Denmark Germany Poland Sweden Denmark Germany Latvia Poland Sweden Denmark Latvia Lithuania Poland Sweden Poland Sweden Estonia Latvia Poland Estonia Finland Poland Estonia Finland
2009 5483 65 5548 206 59 265 4699 815 2589 8103 2972 17 6038 3687 12714 24 1345 1030 1700 4099 260 545 805 202 3 205 100 3 103 31842
1 3278 3278 206 206 2174 1 49 2224 1474 4460 1289 7223 474 349 343 1166 1 1 14098
DIS 1328 1328 206 206 1753 1 49 1803 1474 1242 1113 3829 195 132 99 426 7592
LAN 1950 1950 421 421 3218 176 3394 279 217 244 740 1 1 6506
2 379 379 1601 495 135 2231 901 17 307 1033 2258 269 295 683 1247 160 151 311 104 3 107 2 2 6535
DIS 99 99 608 285 135 1028 679 17 15 1033 1744 269 122 424 815 2 2 3688
LAN 280 280 993 210 1203 222 292 514 173 259 432 160 151 311 104 1 105 2 2 2847
3 1059 1059 257 319 2336 2912 30 424 149 603 189 311 500 100 394 494 98 98 100 100 5766
DIS 541 541 74 57 1602 1733 7 137 144 74 3 77 68 68 2563
LAN 518 518 183 262 734 1179 23 424 12 459 115 308 423 100 326 426 98 98 100 100 3203
4 767 65 832 59 59 667 69 736 567 847 1216 2630 24 602 197 363 1186 5443
DIS 399 60 459 59 59 242 69 311 132 2 751 885 24 210 83 26 343 2057
LAN 368 5 373 425 425 435 845 465 1745 392 114 337 843 3386
2010 4026 653 4679 11 1551 1562 4899 15341 3293 2152 25685 4208 9107 1566 7429 4913 27223 18 770 988 4438 25 6239 14 1014 1028 1448 424 7 1879 706 706 675 675 69676
1 1354 457 1811 337 337 2768 5 114 350 3237 2322 4535 1473 4328 2237 14895 340 613 953 21233
DIS 353 46 399 334 334 1571 237 1808 2322 1885 657 398 1997 7259 4 4 9804
LAN 1001 411 1412 3 3 1197 5 114 113 1429 2650 816 3930 240 7636 340 609 949 11429
2 95 95 11 138 149 978 5036 429 481 6924 432 3794 61 2151 1494 7932 589 209 1164 1962 14 14 486 424 7 917 396 396 290 290 18679
DIS 22 22 129 129 672 1937 119 348 3076 368 3358 61 341 1421 5549 263 639 902 14 14 170 7 177 9869
LAN 73 73 11 9 20 306 3099 310 133 3848 64 436 1810 73 2383 326 209 525 1060 486 254 740 396 396 290 290 8810
3 1884 123 2007 773 773 350 5353 204 1135 7042 10 28 558 118 714 1 132 740 873 1014 1014 873 873 310 310 385 385 13991
DIS 893 53 946 444 444 149 2482 806 3437 10 28 17 89 144 1 392 393 91 91 5455
LAN 991 70 1061 329 329 201 2871 204 329 3605 541 29 570 132 348 480 923 923 873 873 310 310 385 385 8536
4 693 73 766 303 303 803 4947 2546 186 8482 1444 778 4 392 1064 3682 18 180 307 1921 25 2451 89 89 15773
DIS 314 54 368 230 230 262 1810 381 133 2586 1377 202 4 1 514 2098 18 1235 25 1278 6560
LAN 379 19 398 73 73 541 3137 2165 53 5896 67 576 391 550 1584 180 307 686 1173 89 89 9213
2011 4209 641 4850 1284 1284 1076 10094 4634 1813 17617 2224 5092 540 3134 4094 15084 3436 1819 4824 62 10141 1601 1170 2 2773 4504 4504 452 452 56705
1 2196 87 2283 213 213 45 11 223 575 854 1473 4523 219 738 1594 8547 252 508 1455 2215 1 1 14113
DIS 982 26 1008 151 151 11 436 447 1473 2076 219 4 1492 5264 252 49 265 566 1 1 7437
LAN 1214 61 1275 62 62 45 223 139 407 2447 734 102 3283 459 1190 1649 6676
2 191 191 520 520 458 1612 759 90 2919 528 569 313 1782 1642 4834 1981 515 1589 58 4143 133 1116 1 1250 3327 3327 103 103 17287
DIS 102 102 297 297 428 562 115 90 1195 528 125 249 819 1642 3363 1502 1204 58 2764 575 1 576 8297
LAN 89 89 223 223 30 1050 644 1724 444 64 963 1471 479 515 385 1379 133 541 674 3327 3327 103 103 8990
3 1598 59 1657 362 362 523 4410 1329 659 6921 56 159 67 282 474 340 332 4 1150 1094 8 1102 1028 1028 208 208 12710
DIS 562 19 581 278 278 236 481 861 527 2105 56 67 123 204 134 70 4 412 8 8 3507
LAN 1036 40 1076 84 84 287 3929 468 132 4816 159 159 270 206 262 738 1094 1094 1028 1028 208 208 9203
4 224 495 719 189 189 50 4061 2323 489 6923 167 8 455 791 1421 729 456 1448 2633 374 46 420 149 149 141 141 12595
DIS 13 59 72 99 99 1153 182 275 1610 167 8 791 966 473 246 719 3466
LAN 211 436 647 90 90 50 2908 2141 214 5313 455 455 256 456 1202 1914 374 46 420 149 149 141 141 9129
2012 2809 5911 8720 1092 1092 2566 10728 2097 2720 18111 2358 1023 439 3660 2523 10003 3477 1582 2443 1381 8883 1280 2712 7 3999 849 5 6 860 834 3 837 52505
1 1665 3020 4685 222 222 1446 1923 222 719 4310 1518 706 153 2504 965 5846 627 523 777 433 2360 7 7 6 6 3 3 17439
DIS 692 407 1099 209 209 1347 624 663 2634 1286 42 153 30 915 2426 48 120 275 433 876 2 2 7246
LAN 973 2613 3586 13 13 99 1299 222 56 1676 232 664 2474 50 3420 579 403 502 1484 7 7 6 6 1 1 10193
2 244 1005 1249 333 333 504 1868 653 288 3313 235 317 286 330 495 1663 1204 268 451 731 2654 723 1129 1852 76 5 81 487 487 11632
DIS 50 572 622 139 139 300 433 143 288 1164 235 114 286 78 469 1182 1098 164 57 731 2050 505 505 1 1 5663
LAN 194 433 627 194 194 204 1435 510 2149 203 252 26 481 106 104 394 604 723 624 1347 76 4 80 487 487 5969
3 474 1264 1738 402 402 298 3804 599 1587 6288 49 481 202 732 1048 252 1052 41 2393 501 1198 1699 608 608 279 279 14139
DIS 134 720 854 265 265 117 2099 195 944 3355 49 202 251 631 107 81 41 860 639 639 6224
LAN 340 544 884 137 137 181 1705 404 643 2933 481 481 417 145 971 1533 501 559 1060 608 608 279 279 7915
4 426 622 1048 135 135 318 3133 623 126 4200 556 345 861 1762 598 539 163 176 1476 56 385 441 165 165 68 68 9295
DIS 31 287 318 135 135 112 1303 188 109 1712 536 1 766 1303 71 385 20 172 648 85 85 4201
LAN 395 335 730 206 1830 435 17 2488 20 344 95 459 527 154 143 4 828 56 300 356 165 165 68 68 5094
Totalsumma 16527 7270 23797 217 3986 4203 13240 36163 10839 9274 69516 11762 15222 2562 20261 15217 65024 42 9028 5419 13405 1468 29362 14 1014 1028 4589 4851 16 9456 6261 8 6 6275 2061 6 2067 210728
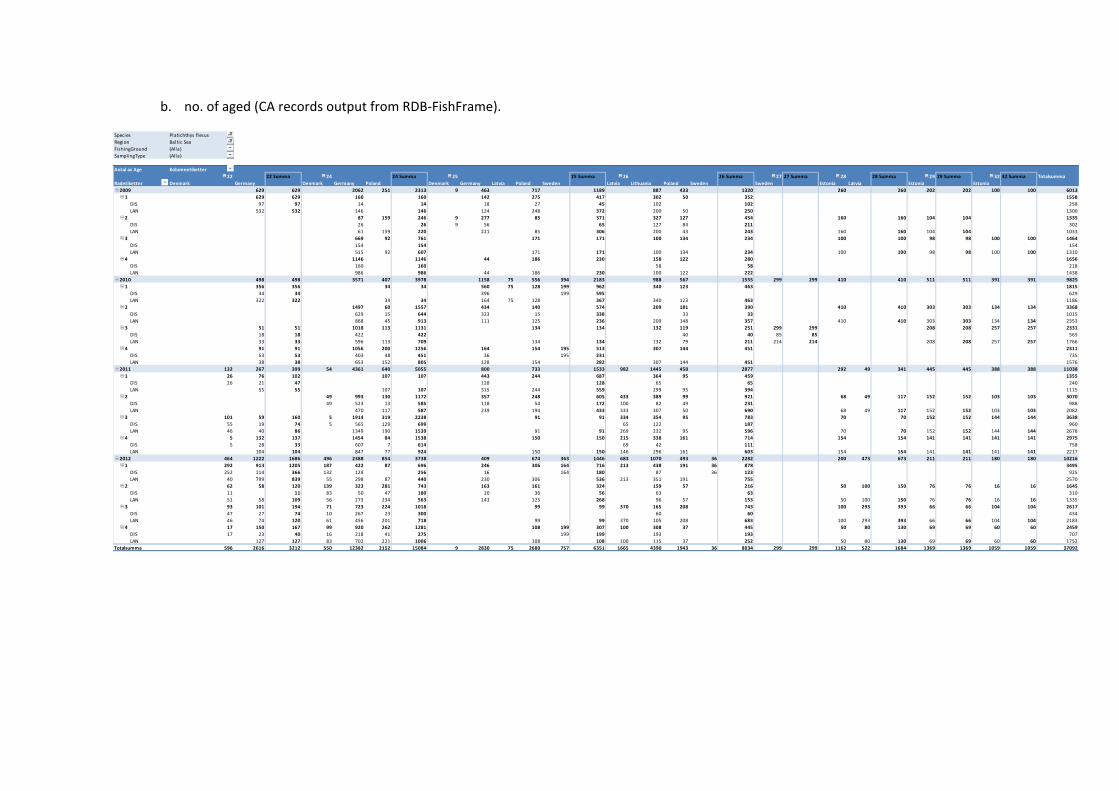
b. no. of aged (CA records output from RDB‐FishFrame).
Species Platichthys flesus
Region Baltic Sea
FishingGround (Alla)
SamplingType (Alla)
Antal av Age Kolumnetiketter
22 22 Summa 24 24 Summa 25 25 Summa 26 26 Summa 27 27 Summa 28 28 Summa 29 29 Summa 32 32 Summa Totalsumma
Radetiketter Denmark Germany Denmark Germany Poland Denmark Germany Latvia Poland Sweden Latvia Lithuania Poland Sweden Sweden Estonia Latvia Estonia Estonia
2009 629 629 2062 251 2313 9 463 717 1189 887 433 1320 260 260 202 202 100 100 6013
1 629 629 160 160 142 275 417 302 50 352 1558
DIS 97 97 14 14 18 27 45 102 102 258
LAN 532 532 146 146 124 248 372 200 50 250 1300
2 87 159 246 9 277 85 371 327 127 454 160 160 104 104 1335
DIS 26 26 9 56 65 127 84 211 302
LAN 61 159 220 221 85 306 200 43 243 160 160 104 104 1033
3 669 92 761 171 171 100 134 234 100 100 98 98 100 100 1464
DIS 154 154 154
LAN 515 92 607 171 171 100 134 234 100 100 98 98 100 100 1310
4 1146 1146 44 186 230 158 122 280 1656
DIS 160 160 58 58 218
LAN 986 986 44 186 230 100 122 222 1438
2010 498 498 3571 407 3978 1158 75 556 394 2183 988 567 1555 299 299 410 410 511 511 391 391 9825
1 356 356 34 34 560 75 128 199 962 340 123 463 1815
DIS 34 34 396 199 595 629
LAN 322 322 34 34 164 75 128 367 340 123 463 1186
2 1497 60 1557 434 140 574 209 181 390 410 410 303 303 134 134 3368
DIS 629 15 644 323 15 338 33 33 1015
LAN 868 45 913 111 125 236 209 148 357 410 410 303 303 134 134 2353
3 51 51 1018 113 1131 134 134 132 119 251 299 299 208 208 257 257 2331
DIS 18 18 422 422 40 40 85 85 565
LAN 33 33 596 113 709 134 134 132 79 211 214 214 208 208 257 257 1766
4 91 91 1056 200 1256 164 154 195 513 307 144 451 2311
DIS 53 53 403 48 451 36 195 231 735
LAN 38 38 653 152 805 128 154 282 307 144 451 1576
2011 132 267 399 54 4361 640 5055 800 733 1533 982 1445 450 2877 292 49 341 445 445 388 388 11038
1 26 76 102 107 107 443 244 687 364 95 459 1355
DIS 26 21 47 128 128 65 65 240
LAN 55 55 107 107 315 244 559 299 95 394 1115
2 49 993 130 1172 357 248 605 433 389 99 921 68 49 117 152 152 103 103 3070
DIS 49 523 13 585 118 54 172 100 82 49 231 988
LAN 470 117 587 239 194 433 333 307 50 690 68 49 117 152 152 103 103 2082
3 101 59 160 5 1914 319 2238 91 91 334 354 95 783 70 70 152 152 144 144 3638
DIS 55 19 74 5 565 129 699 65 122 187 960
LAN 46 40 86 1349 190 1539 91 91 269 232 95 596 70 70 152 152 144 144 2678
4 5 132 137 1454 84 1538 150 150 215 338 161 714 154 154 141 141 141 141 2975
DIS 5 28 33 607 7 614 69 42 111 758
LAN 104 104 847 77 924 150 150 146 296 161 603 154 154 141 141 141 141 2217
2012 464 1222 1686 496 2388 854 3738 409 674 363 1446 683 1070 493 36 2282 200 473 673 211 211 180 180 10216
1 292 913 1205 187 422 87 696 246 306 164 716 213 438 191 36 878 3495
DIS 252 114 366 132 124 256 16 164 180 87 36 123 925
LAN 40 799 839 55 298 87 440 230 306 536 213 351 191 755 2570
2 62 58 120 139 323 281 743 163 161 324 159 57 216 50 100 150 76 76 16 16 1645
DIS 11 11 83 50 47 180 20 36 56 63 63 310
LAN 51 58 109 56 273 234 563 143 125 268 96 57 153 50 100 150 76 76 16 16 1335
3 93 101 194 71 723 224 1018 99 99 370 165 208 743 100 293 393 66 66 104 104 2617
DIS 47 27 74 10 267 23 300 60 60 434
LAN 46 74 120 61 456 201 718 99 99 370 105 208 683 100 293 393 66 66 104 104 2183
4 17 150 167 99 920 262 1281 108 199 307 100 308 37 445 50 80 130 69 69 60 60 2459
DIS 17 23 40 16 218 41 275 199 199 193 193 707
LAN 127 127 83 702 221 1006 108 108 100 115 37 252 50 80 130 69 69 60 60 1752
Totalsumma 596 2616 3212 550 12382 2152 15084 9 2830 75 2680 757 6351 1665 4390 1943 36 8034 299 299 1162 522 1684 1369 1369 1059 1059 37092
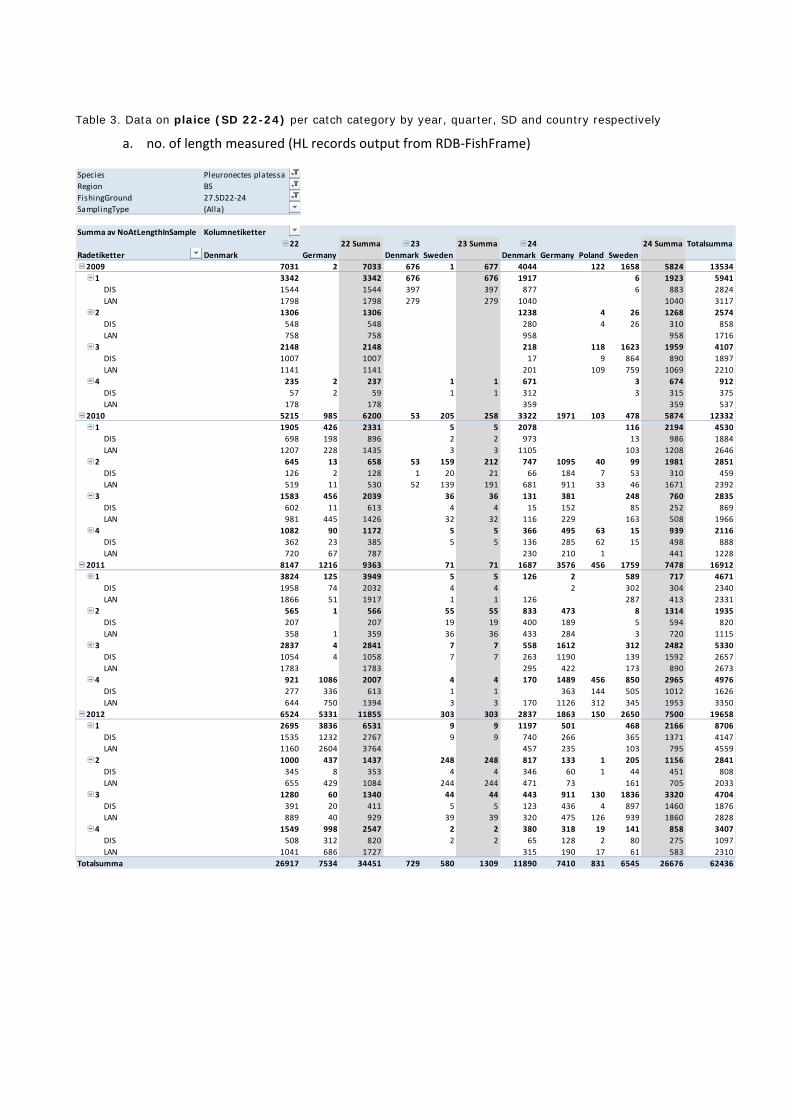
Table 3. Data on plaice (SD 22-24) per catch category by year, quarter, SD and country respectively
a. no. of length measured (HL records output from RDB‐FishFrame)
Species Pleuronectes platessa
Region BS
FishingGround 27.SD22‐24
SamplingType (Alla)
Summa av NoAtLengthInSample Kolumnetiketter
22 22 Summa 23 23 Summa 24 24 Summa Totalsumma
Radetiketter Denmark Germany Denmark Sweden Denmark Germany Poland Sweden
2009 7031 2 7033 676 1 677 4044 122 1658 5824 13534
1 3342 3342 676 676 1917 6 1923 5941
DIS 1544 1544 397 397 877 6 883 2824
LAN 1798 1798 279 279 1040 1040 3117
2 1306 1306 1238 4 26 1268 2574
DIS 548 548 280 4 26 310 858
LAN 758 758 958 958 1716
3 2148 2148 218 118 1623 1959 4107
DIS 1007 1007 17 9 864 890 1897
LAN 1141 1141 201 109 759 1069 2210
4 235 2 237 1 1 671 3 674 912
DIS 57 2 59 1 1 312 3 315 375
LAN 178 178 359 359 537
2010 5215 985 6200 53 205 258 3322 1971 103 478 5874 12332
1 1905 426 2331 5 5 2078 116 2194 4530
DIS 698 198 896 2 2 973 13 986 1884
LAN 1207 228 1435 3 3 1105 103 1208 2646
2 645 13 658 53 159 212 747 1095 40 99 1981 2851
DIS 126 2 128 1 20 21 66 184 7 53 310 459
LAN 519 11 530 52 139 191 681 911 33 46 1671 2392
3 1583 456 2039 36 36 131 381 248 760 2835
DIS 602 11 613 4 4 15 152 85 252 869
LAN 981 445 1426 32 32 116 229 163 508 1966
4 1082 90 1172 5 5 366 495 63 15 939 2116
DIS 362 23 385 5 5 136 285 62 15 498 888
LAN 720 67 787 230 210 1 441 1228
2011 8147 1216 9363 71 71 1687 3576 456 1759 7478 16912
1 3824 125 3949 5 5 126 2 589 717 4671
DIS 1958 74 2032 4 4 2 302 304 2340
LAN 1866 51 1917 1 1 126 287 413 2331
2 565 1 566 55 55 833 473 8 1314 1935
DIS 207 207 19 19 400 189 5 594 820
LAN 358 1 359 36 36 433 284 3 720 1115
3 2837 4 2841 7 7 558 1612 312 2482 5330
DIS 1054 4 1058 7 7 263 1190 139 1592 2657
LAN 1783 1783 295 422 173 890 2673
4 921 1086 2007 4 4 170 1489 456 850 2965 4976
DIS 277 336 613 1 1 363 144 505 1012 1626
LAN 644 750 1394 3 3 170 1126 312 345 1953 3350
2012 6524 5331 11855 303 303 2837 1863 150 2650 7500 19658
1 2695 3836 6531 9 9 1197 501 468 2166 8706
DIS 1535 1232 2767 9 9 740 266 365 1371 4147
LAN 1160 2604 3764 457 235 103 795 4559
2 1000 437 1437 248 248 817 133 1 205 1156 2841
DIS 345 8 353 4 4 346 60 1 44 451 808
LAN 655 429 1084 244 244 471 73 161 705 2033
3 1280 60 1340 44 44 443 911 130 1836 3320 4704
DIS 391 20 411 5 5 123 436 4 897 1460 1876
LAN 889 40 929 39 39 320 475 126 939 1860 2828
4 1549 998 2547 2 2 380 318 19 141 858 3407
DIS 508 312 820 2 2 65 128 2 80 275 1097
LAN 1041 686 1727 315 190 17 61 583 2310
Totalsumma 26917 7534 34451 729 580 1309 11890 7410 831 6545 26676 62436
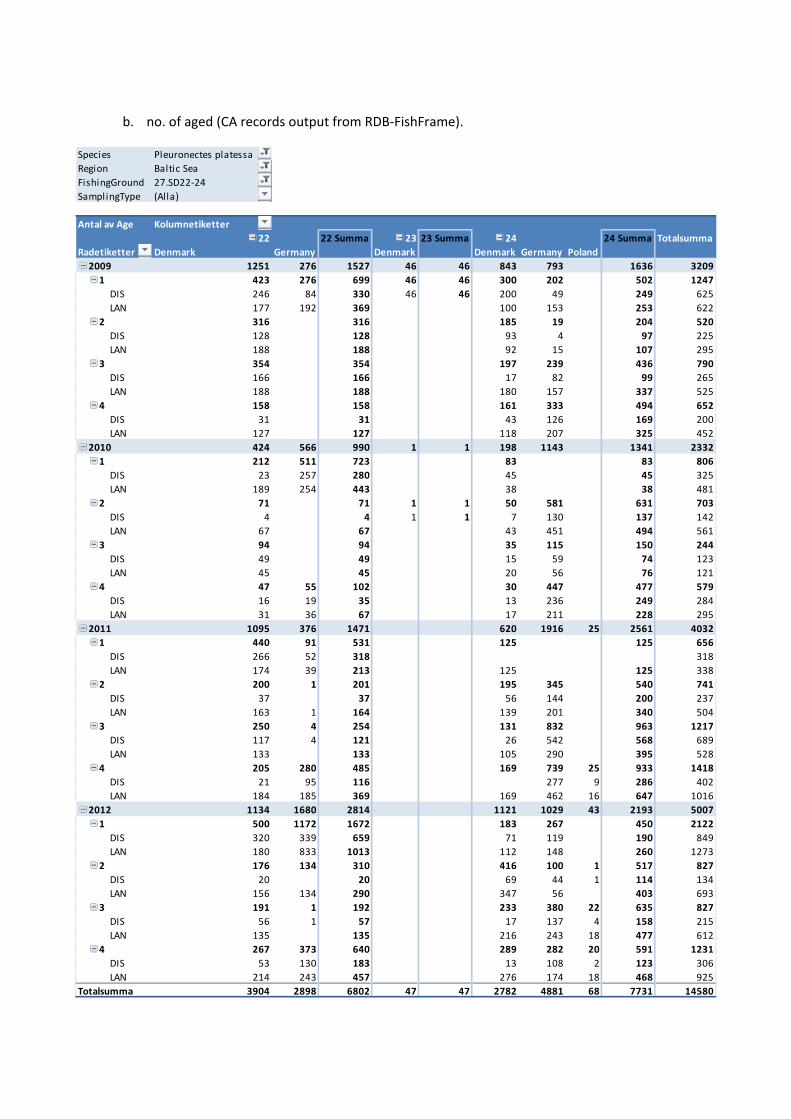
b. no. of aged (CA records output from RDB‐FishFrame).
Species Pleuronectes platessa
Region Baltic Sea
FishingGround 27.SD22‐24
SamplingType (Alla)
Antal av Age Kolumnetiketter
22 22 Summa 23 23 Summa 24 24 Summa Totalsumma
Radetiketter Denmark Germany Denmark Denmark Germany Poland
2009 1251 276 1527 46 46 843 793 1636 3209
1 423 276 699 46 46 300 202 502 1247
DIS 246 84 330 46 46 200 49 249 625
LAN 177 192 369 100 153 253 622
2 316 316 185 19 204 520
DIS 128 128 93 4 97 225
LAN 188 188 92 15 107 295
3 354 354 197 239 436 790
DIS 166 166 17 82 99 265
LAN 188 188 180 157 337 525
4 158 158 161 333 494 652
DIS 31 31 43 126 169 200
LAN 127 127 118 207 325 452
2010 424 566 990 1 1 198 1143 1341 2332
1 212 511 723 83 83 806
DIS 23 257 280 45 45 325
LAN 189 254 443 38 38 481
2 71 71 1 1 50 581 631 703
DIS 4 4 1 1 7 130 137 142
LAN 67 67 43 451 494 561
3 94 94 35 115 150 244
DIS 49 49 15 59 74 123
LAN 45 45 20 56 76 121
4 47 55 102 30 447 477 579
DIS 16 19 35 13 236 249 284
LAN 31 36 67 17 211 228 295
2011 1095 376 1471 620 1916 25 2561 4032
1 440 91 531 125 125 656
DIS 266 52 318 318
LAN 174 39 213 125 125 338
2 200 1 201 195 345 540 741
DIS 37 37 56 144 200 237
LAN 163 1 164 139 201 340 504
3 250 4 254 131 832 963 1217
DIS 117 4 121 26 542 568 689
LAN 133 133 105 290 395 528
4 205 280 485 169 739 25 933 1418
DIS 21 95 116 277 9 286 402
LAN 184 185 369 169 462 16 647 1016
2012 1134 1680 2814 1121 1029 43 2193 5007
1 500 1172 1672 183 267 450 2122
DIS 320 339 659 71 119 190 849
LAN 180 833 1013 112 148 260 1273
2 176 134 310 416 100 1 517 827
DIS 20 20 69 44 1 114 134
LAN 156 134 290 347 56 403 693
3 191 1 192 233 380 22 635 827
DIS 56 1 57 17 137 4 158 215
LAN 135 135 216 243 18 477 612
4 267 373 640 289 282 20 591 1231
DIS 53 130 183 13 108 2 123 306
LAN 214 243 457 276 174 18 468 925
Totalsumma 3904 2898 6802 47 47 2782 4881 68 7731 14580

Table 4. Data on plaice (SD 25-29, 32) per catch category by year, quarter, SD and country respectively
a. no. of length measured (HL records output from RDB‐FishFrame)
Species Pleuronectes platessa
Region BS
FishingGround 27.SD25‐32
SamplingType (Alla)
Summa av NoAtLengthInSample Kolumnetiketter
25 25 Summa 26 26 Summa 28 28 Summa Totalsumma
Radetiketter Denmark Germany Latvia Poland Sweden Denmark Latvia Poland Sweden Latvia
2009 3830 605 2949 7384 14 24 38 7422
1 1821 587 764 3172 13 13 3185
DIS 1446 203 354 2003 11 11 2014
LAN 375 384 410 1169 2 2 1171
2 310 10 254 574 574
DIS 219 221 440 440
LAN 91 10 33 134 134
3 210 1 741 952 952
DIS 29 117 146 146
LAN 181 1 624 806 806
4 1489 7 1190 2686 14 11 25 2711
DIS 692 3 531 1226 14 14 1240
LAN 797 4 659 1460 11 11 1471
2010 4436 857 105 110 2063 7571 5 60 10 75 7646
1 2516 232 73 22 816 3659 15 15 3674
DIS 2277 66 73 543 2959 1 1 2960
LAN 239 166 22 273 700 14 14 714
2 52 106 43 202 403 7 7 410
DIS 48 77 3 121 249 5 5 254
LAN 4 29 40 81 154 2 2 156
3 72 31 23 408 534 534
DIS 19 31 44 94 94
LAN 53 23 364 440 440
4 1796 519 1 22 637 2975 5 38 10 53 3028
DIS 1514 76 1 12 132 1735 5 36 10 51 1786
LAN 282 443 10 505 1240 2 2 1242
2011 1683 235 16 208 2535 4677 22 110 2 134 4811
1 842 187 1 32 1059 2121 7 40 47 2168
DIS 394 72 1 617 1084 7 38 45 1129
LAN 448 115 32 442 1037 2 2 1039
2 49 48 6 56 73 232 7 5 12 244
DIS 38 14 6 19 68 145 7 3 10 155
LAN 11 34 37 5 87 2 2 89
3 198 1 15 214 3 2 5 219
DIS 198 10 208 2 2 210
LAN 1 5 6 3 3 9
4 594 9 119 1388 2110 8 62 70 2180
DIS 268 9 579 856 8 9 17 873
LAN 326 119 809 1254 53 53 1307
2012 2052 265 97 318 2091 4823 53 21 72 146 5 5 4974
1 737 244 83 103 730 1897 10 7 6 23 1920
DIS 507 65 83 528 1183 10 5 6 21 1204
LAN 230 179 103 202 714 2 2 716
2 67 21 14 69 206 377 12 8 2 22 399
DIS 67 17 14 3 195 296 12 2 14 310
LAN 4 66 11 81 8 8 89
3 135 1 306 442 14 3 2 19 3 3 464
DIS 121 251 372 14 3 2 19 3 3 394
LAN 14 1 55 70 70
4 1113 145 849 2107 17 3 62 82 2 2 2191
DIS 732 10 562 1304 17 60 77 2 2 1383
LAN 381 135 287 803 3 2 5 808
Totalsumma 12001 1357 218 1241 9638 24455 14 80 215 84 393 5 5 24853
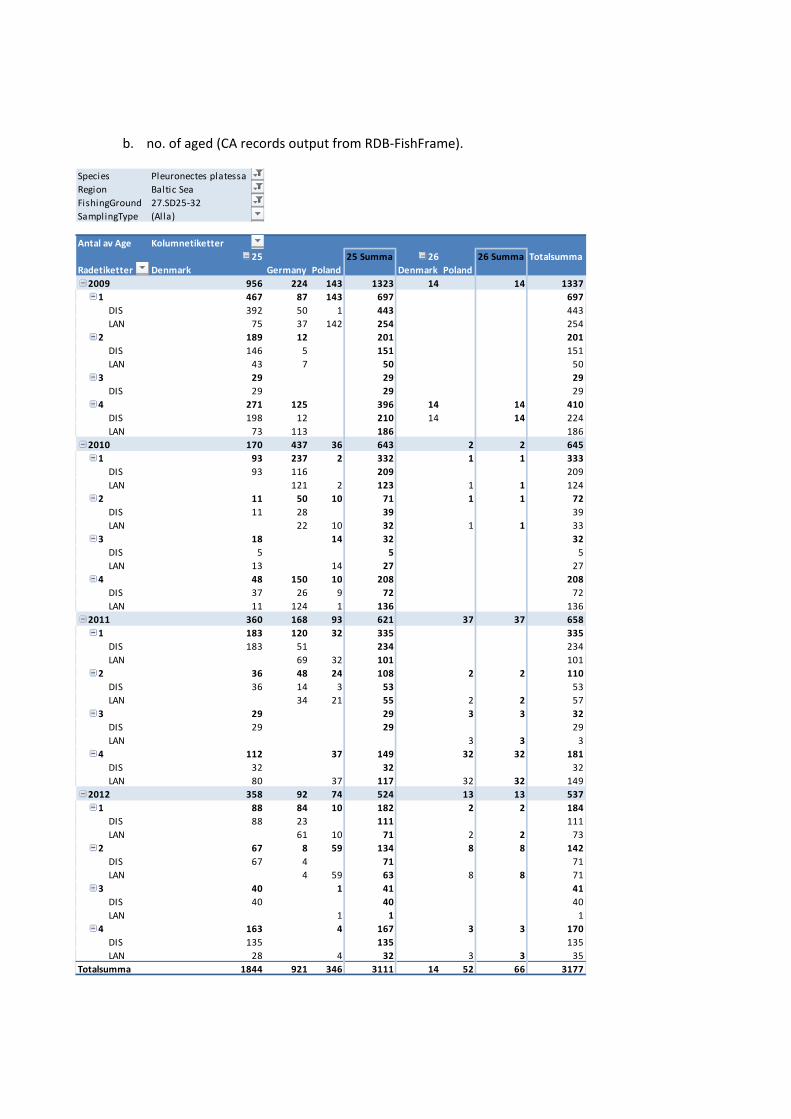
b. no. of aged (CA records output from RDB‐FishFrame).
Species Pleuronectes platessa
Region Baltic Sea
FishingGround 27.SD25‐32
SamplingType (Alla)
Antal av Age Kolumnetiketter
25 25 Summa 26 26 Summa Totalsumma
Radetiketter Denmark Germany Poland Denmark Poland
2009 956 224 143 1323 14 14 1337
1 467 87 143 697 697
DIS 392 50 1 443 443
LAN 75 37 142 254 254
2 189 12 201 201
DIS 146 5 151 151
LAN 43 7 50 50
3 29 29 29
DIS 29 29 29
4 271 125 396 14 14 410
DIS 198 12 210 14 14 224
LAN 73 113 186 186
2010 170 437 36 643 2 2 645
1 93 237 2 332 1 1 333
DIS 93 116 209 209
LAN 121 2 123 1 1 124
2 11 50 10 71 1 1 72
DIS 11 28 39 39
LAN 22 10 32 1 1 33
3 18 14 32 32
DIS 5 5 5
LAN 13 14 27 27
4 48 150 10 208 208
DIS 37 26 9 72 72
LAN 11 124 1 136 136
2011 360 168 93 621 37 37 658
1 183 120 32 335 335
DIS 183 51 234 234
LAN 69 32 101 101
2 36 48 24 108 2 2 110
DIS 36 14 3 53 53
LAN 34 21 55 2 2 57
3 29 29 3 3 32
DIS 29 29 29
LAN 3 3 3
4 112 37 149 32 32 181
DIS 32 32 32
LAN 80 37 117 32 32 149
2012 358 92 74 524 13 13 537
1 88 84 10 182 2 2 184
DIS 88 23 111 111
LAN 61 10 71 2 2 73
2 67 8 59 134 8 8 142
DIS 67 4 71 71
LAN 4 59 63 8 8 71
3 40 1 41 41
DIS 40 40 40
LAN 1 1 1
4 163 4 167 3 3 170
DIS 135 135 135
LAN 28 4 32 3 3 35
Totalsumma 1844 921 346 3111 14 52 66 3177
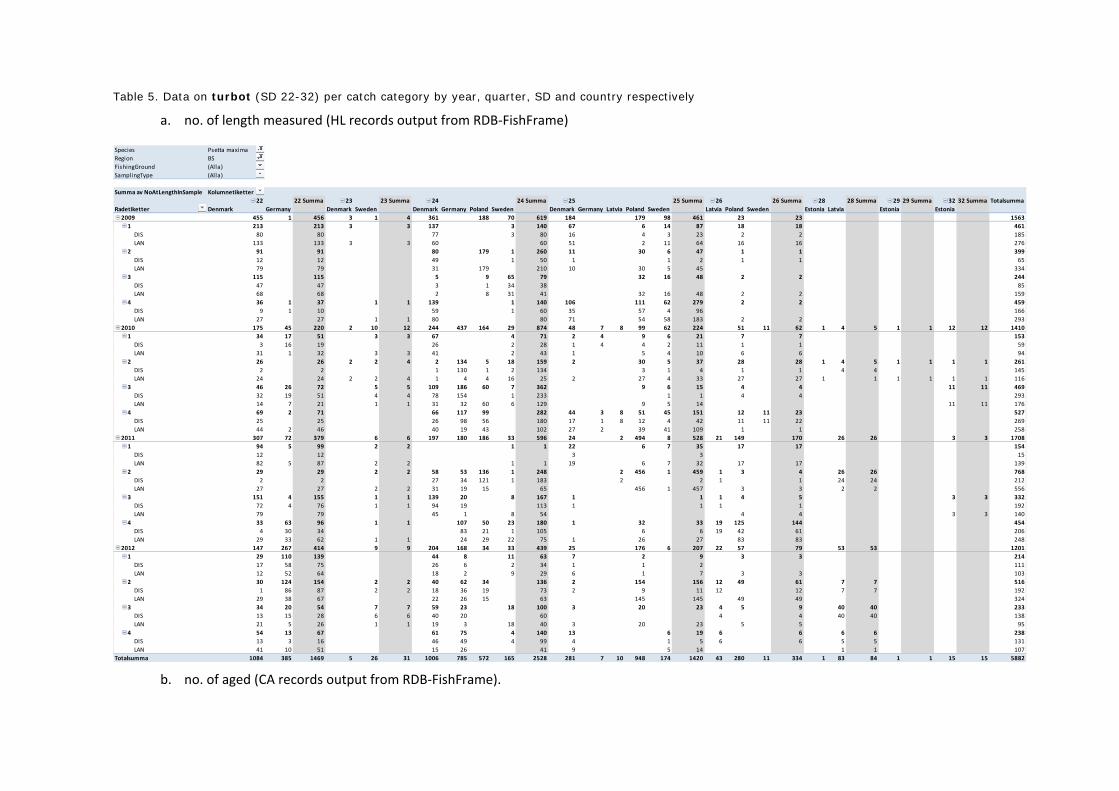
Table 5. Data on turbot (SD 22-32) per catch category by year, quarter, SD and country respectively
a. no. of length measured (HL records output from RDB‐FishFrame)
b. no. of aged (CA records output from RDB‐FishFrame).
Species Psetta maxima
Region BS
FishingGround (Alla)
SamplingType (Alla)
Summa av NoAtLengthInSample Kolumnetiketter
22 22 Summa 23 23 Summa 24 24 Summa 25 25 Summa 26 26 Summa 28 28 Summa 29 29 Summa 32 32 Summa Totalsumma
Radetiketter Denmark Germany Denmark Sweden Denmark Germany Poland Sweden Denmark Germany Latvia Poland Sweden Latvia Poland Sweden Estonia Latvia Estonia Estonia
2009 455 1 456 3 1 4 361 188 70 619 184 179 98 461 23 23 1563
1 213 213 3 3 137 3 140 67 6 14 87 18 18 461
DIS 80 80 77 3 80 16 4 3 23 2 2 185
LAN 133 133 3 3 60 60 51 2 11 64 16 16 276
2 91 91 80 179 1 260 11 30 6 47 1 1 399
DIS 12 12 49 1 50 1 1 2 1 1 65
LAN 79 79 31 179 210 10 30 5 45 334
3 115 115 5 9 65 79 32 16 48 2 2 244
DIS 47 47 3 1 34 38 85
LAN 68 68 2 8 31 41 32 16 48 2 2 159
4 36 1 37 1 1 139 1 140 106 111 62 279 2 2 459
DIS 9 1 10 59 1 60 35 57 4 96 166
LAN 27 27 1 1 80 80 71 54 58 183 2 2 293
2010 175 45 220 2 10 12 244 437 164 29 874 48 7 8 99 62 224 51 11 62 1 4 5 1 1 12 12 1410
1 34 17 51 3 3 67 4 71 2 4 9 6 21 7 7 153
DIS 3 16 19 26 2 28 1 4 4 2 11 1 1 59
LAN 31 1 32 3 3 41 2 43 1 5 4 10 6 6 94
2 26 26 2 2 4 2 134 5 18 159 2 30 5 37 28 28 1 4 5 1 1 1 1 261
DIS 2 2 1 130 1 2 134 3 1 4 1 1 4 4 145
LAN 24 24 2 2 4 1 4 4 16 25 2 27 4 33 27 27 1 1 1 1 1 1 116
3 46 26 72 5 5 109 186 60 7 362 9 6 15 4 4 11 11 469
DIS 32 19 51 4 4 78 154 1 233 1 1 4 4 293
LAN 14 7 21 1 1 31 32 60 6 129 9 5 14 11 11 176
4 69 2 71 66 117 99 282 44 3 8 51 45 151 12 11 23 527
DIS 25 25 26 98 56 180 17 1 8 12 4 42 11 11 22 269
LAN 44 2 46 40 19 43 102 27 2 39 41 109 1 1 258
2011 307 72 379 6 6 197 180 186 33 596 24 2 494 8 528 21 149 170 26 26 3 3 1708
1 94 5 99 2 2 1 1 22 6 7 35 17 17 154
DIS 12 12 3 3 15
LAN 82 5 87 2 2 1 1 19 6 7 32 17 17 139
2 29 29 2 2 58 53 136 1 248 2 456 1 459 1 3 4 26 26 768
DIS 2 2 27 34 121 1 183 2 2 1 1 24 24 212
LAN 27 27 2 2 31 19 15 65 456 1 457 3 3 2 2 556
3 151 4 155 1 1 139 20 8 167 1 1 1 4 5 3 3 332
DIS 72 4 76 1 1 94 19 113 1 1 1 1 192
LAN 79 79 45 1 8 54 4 4 3 3 140
4 33 63 96 1 1 107 50 23 180 1 32 33 19 125 144 454
DIS 4 30 34 83 21 1 105 6 6 19 42 61 206
LAN 29 33 62 1 1 24 29 22 75 1 26 27 83 83 248
2012 147 267 414 9 9 204 168 34 33 439 25 176 6 207 22 57 79 53 53 1201
1 29 110 139 44 8 11 63 7 2 9 3 3 214
DIS 17 58 75 26 6 2 34 1 1 2 111
LAN 12 52 64 18 2 9 29 6 1 7 3 3 103
2 30 124 154 2 2 40 62 34 136 2 154 156 12 49 61 7 7 516
DIS 1 86 87 2 2 18 36 19 73 2 9 11 12 12 7 7 192
LAN 29 38 67 22 26 15 63 145 145 49 49 324
3 34 20 54 7 7 59 23 18 100 3 20 23 4 5 9 40 40 233
DIS 13 15 28 6 6 40 20 60 4 4 40 40 138
LAN 21 5 26 1 1 19 3 18 40 3 20 23 5 5 95
4 54 13 67 61 75 4 140 13 6 19 6 6 6 6 238
DIS 13 3 16 46 49 4 99 4 1 5 6 6 5 5 131
LAN 41 10 51 15 26 41 9 5 14 1 1 107
Totalsumma 1084 385 1469 5 26 31 1006 785 572 165 2528 281 7 10 948 174 1420 43 280 11 334 1 83 84 1 1 15 15 5882
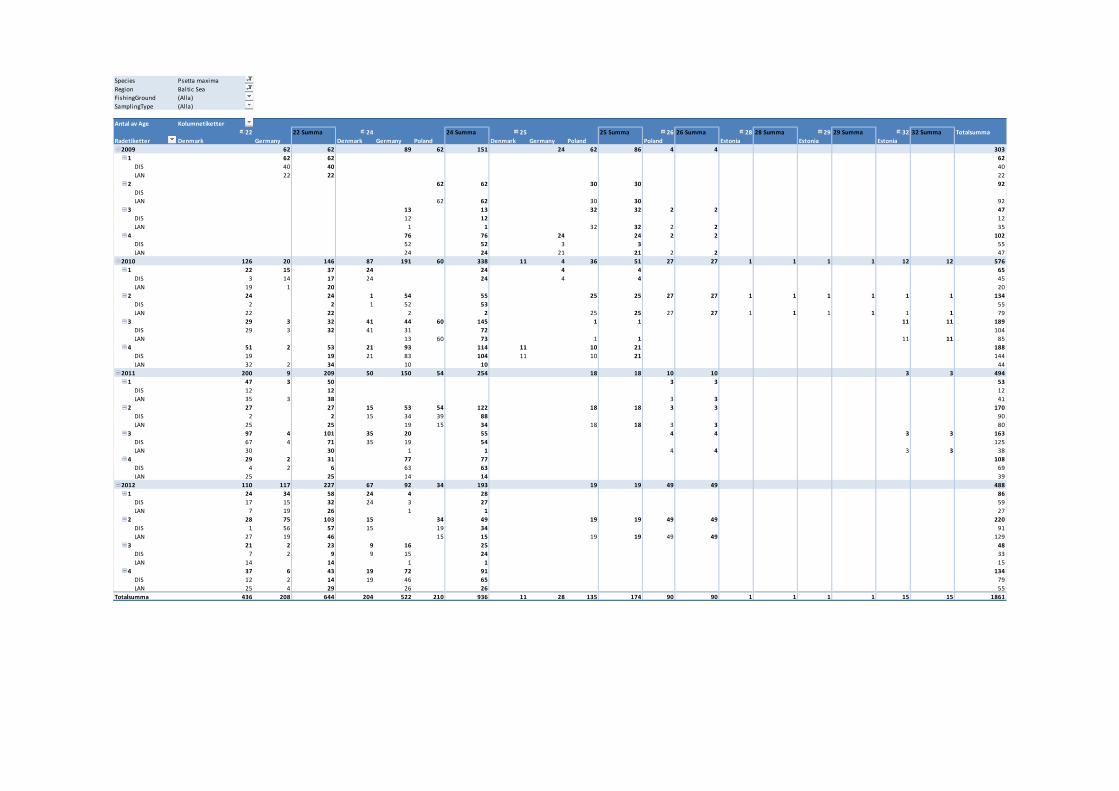
Species Psetta maxima
Region Baltic Sea
FishingGround (Alla)
SamplingType (Alla)
Antal av Age Kolumnetiketter
22 22 Summa 24 24 Summa 25 25 Summa 26 26 Summa 28 28 Summa 29 29 Summa 32 32 Summa Totalsumma
Radetiketter Denmark Germany Denmark Germany Poland Denmark Germany Poland Poland Estonia Estonia Estonia
2009 62 62 89 62 151 24 62 86 4 4 303
1 62 62 62
DIS 40 40 40
LAN 22 22 22
2 62 62 30 30 92
DIS
LAN 62 62 30 30 92
3 13 13 32 32 2 2 47
DIS 12 12 12
LAN 1 1 32 32 2 2 35
4 76 76 24 24 2 2 102
DIS 52 52 3 3 55
LAN 24 24 21 21 2 2 47
2010 126 20 146 87 191 60 338 11 4 36 51 27 27 1 1 1 1 12 12 576
1 22 15 37 24 24 4 4 65
DIS 3 14 17 24 24 4 4 45
LAN 19 1 20 20
2 24 24 1 54 55 25 25 27 27 1 1 1 1 1 1 134
DIS 2 2 1 52 53 55
LAN 22 22 2 2 25 25 27 27 1 1 1 1 1 1 79
3 29 3 32 41 44 60 145 1 1 11 11 189
DIS 29 3 32 41 31 72 104
LAN 13 60 73 1 1 11 11 85
4 51 2 53 21 93 114 11 10 21 188
DIS 19 19 21 83 104 11 10 21 144
LAN 32 2 34 10 10 44
2011 200 9 209 50 150 54 254 18 18 10 10 3 3 494
1 47 3 50 3 3 53
DIS 12 12 12
LAN 35 3 38 3 3 41
2 27 27 15 53 54 122 18 18 3 3 170
DIS 2 2 15 34 39 88 90
LAN 25 25 19 15 34 18 18 3 3 80
3 97 4 101 35 20 55 4 4 3 3 163
DIS 67 4 71 35 19 54 125
LAN 30 30 1 1 4 4 3 3 38
4 29 2 31 77 77 108
DIS 4 2 6 63 63 69
LAN 25 25 14 14 39
2012 110 117 227 67 92 34 193 19 19 49 49 488
1 24 34 58 24 4 28 86
DIS 17 15 32 24 3 27 59
LAN 7 19 26 1 1 27
2 28 75 103 15 34 49 19 19 49 49 220
DIS 1 56 57 15 19 34 91
LAN 27 19 46 15 15 19 19 49 49 129
3 21 2 23 9 16 25 48
DIS 7 2 9 9 15 24 33
LAN 14 14 1 1 15
4 37 6 43 19 72 91 134
DIS 12 2 14 19 46 65 79
LAN 25 4 29 26 26 55
Totalsumma 436 208 644 204 522 210 936 11 28 135 174 90 90 1 1 1 1 15 15 1861
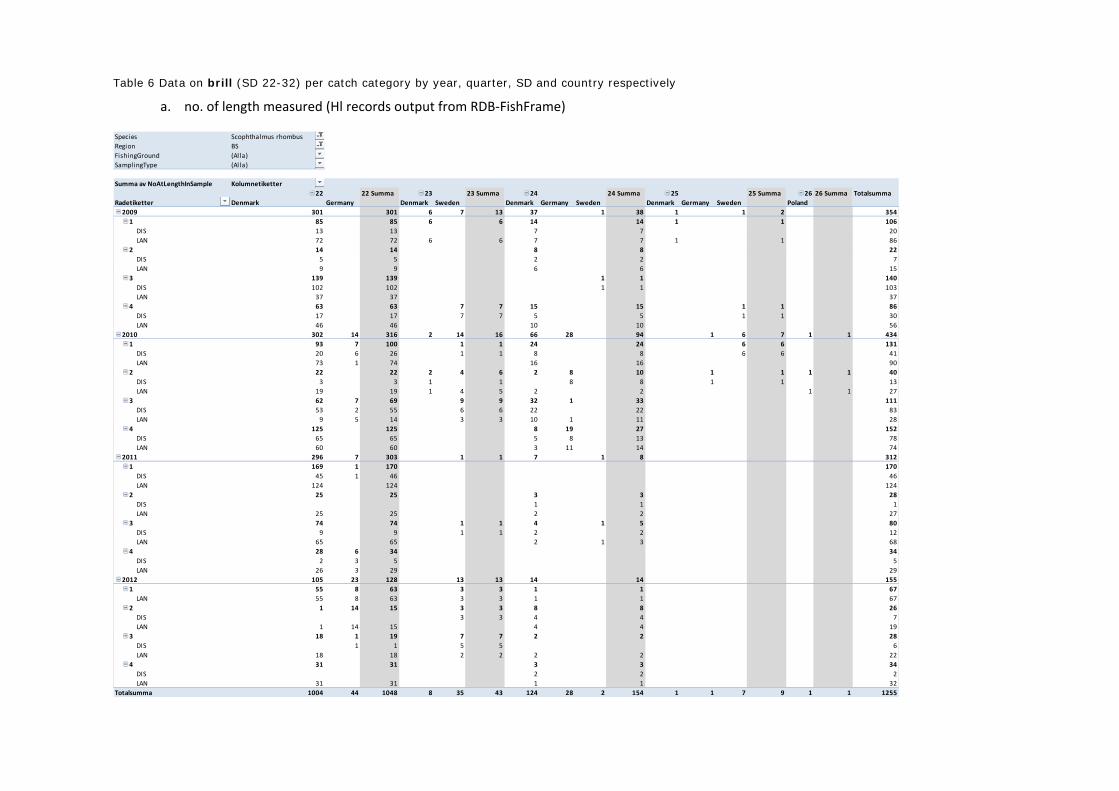
Table 6 Data on brill (SD 22-32) per catch category by year, quarter, SD and country respectively
a. no. of length measured (Hl records output from RDB‐FishFrame)
Species Scophthalmus rhombus
Region BS
FishingGround (Alla)
SamplingType (Alla)
Summa av NoAtLengthInSample Kolumnetiketter
22 22 Summa 23 23 Summa 24 24 Summa 25 25 Summa 26 26 Summa Totalsumma
Radetiketter Denmark Germany Denmark Sweden Denmark Germany Sweden Denmark Germany Sweden Poland
2009 301 301 6 7 13 37 1 38 1 1 2 354
1 85 85 6 6 14 14 1 1 106
DIS 13 13 7 7 20
LAN 72 72 6 6 7 7 1 1 86
2 14 14 8 8 22
DIS 5 5 2 2 7
LAN 9 9 6 6 15
3 139 139 1 1 140
DIS 102 102 1 1 103
LAN 37 37 37
4 63 63 7 7 15 15 1 1 86
DIS 17 17 7 7 5 5 1 1 30
LAN 46 46 10 10 56
2010 302 14 316 2 14 16 66 28 94 1 6 7 1 1 434
1 93 7 100 1 1 24 24 6 6 131
DIS 20 6 26 1 1 8 8 6 6 41
LAN 73 1 74 16 16 90
2 22 22 2 4 6 2 8 10 1 1 1 1 40
DIS 3 3 1 1 8 8 1 1 13
LAN 19 19 1 4 5 2 2 1 1 27
3 62 7 69 9 9 32 1 33 111
DIS 53 2 55 6 6 22 22 83
LAN 9 5 14 3 3 10 1 11 28
4 125 125 8 19 27 152
DIS 65 65 5 8 13 78
LAN 60 60 3 11 14 74
2011 296 7 303 1 1 7 1 8 312
1 169 1 170 170
DIS 45 1 46 46
LAN 124 124 124
2 25 25 3 3 28
DIS 1 1 1
LAN 25 25 2 2 27
3 74 74 1 1 4 1 5 80
DIS 9 9 1 1 2 2 12
LAN 65 65 2 1 3 68
4 28 6 34 34
DIS 2 3 5 5
LAN 26 3 29 29
2012 105 23 128 13 13 14 14 155
1 55 8 63 3 3 1 1 67
LAN 55 8 63 3 3 1 1 67
2 1 14 15 3 3 8 8 26
DIS 3 3 4 4 7
LAN 1 14 15 4 4 19
3 18 1 19 7 7 2 2 28
DIS 1 1 5 5 6
LAN 18 18 2 2 2 2 22
4 31 31 3 3 34
DIS 2 2 2
LAN 31 31 1 1 32
Totalsumma 1004 44 1048 8 35 43 124 28 2 154 1 1 7 9 1 1 1255
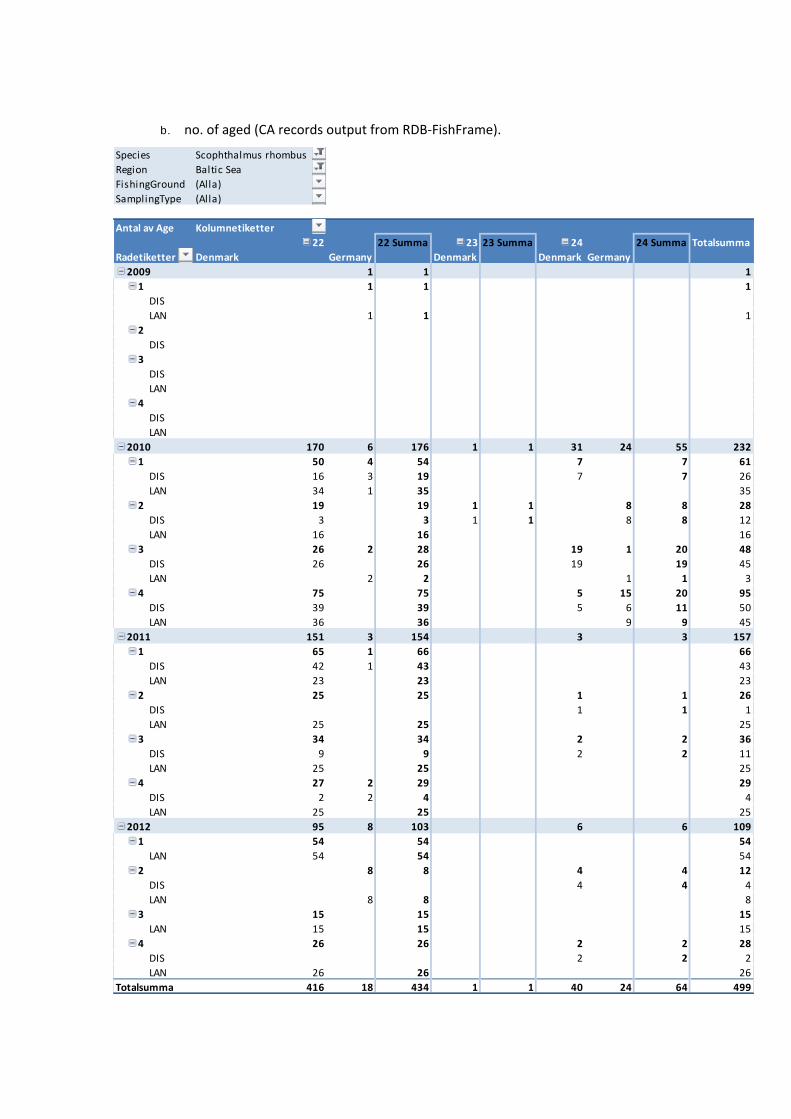
b. no. of aged (CA records output from RDB‐FishFrame).
Species Scophthalmus rhombus
Region Baltic Sea
FishingGround (Alla)
SamplingType (Alla)
Antal av Age Kolumnetiketter
22 22 Summa 23 23 Summa 24 24 Summa Totalsumma
Radetiketter Denmark Germany Denmark Denmark Germany
2009 1 1 1
1 1 1 1
DIS
LAN 1 1 1
2
DIS
3
DIS
LAN
4
DIS
LAN
2010 170 6 176 1 1 31 24 55 232
1 50 4 54 7 7 61
DIS 16 3 19 7 7 26
LAN 34 1 35 35
2 19 19 1 1 8 8 28
DIS 3 3 1 1 8 8 12
LAN 16 16 16
3 26 2 28 19 1 20 48
DIS 26 26 19 19 45
LAN 2 2 1 1 3
4 75 75 5 15 20 95
DIS 39 39 5 6 11 50
LAN 36 36 9 9 45
2011 151 3 154 3 3 157
1 65 1 66 66
DIS 42 1 43 43
LAN 23 23 23
2 25 25 1 1 26
DIS 1 1 1
LAN 25 25 25
3 34 34 2 2 36
DIS 9 9 2 2 11
LAN 25 25 25
4 27 2 29 29
DIS 2 2 4 4
LAN 25 25 25
2012 95 8 103 6 6 109
1 54 54 54
LAN 54 54 54
2 8 8 4 4 12
DIS 4 4 4
LAN 8 8 8
3 15 15 15
LAN 15 15 15
4 26 26 2 2 28
DIS 2 2 2
LAN 26 26 26
Totalsumma 416 18 434 1 1 40 24 64 499
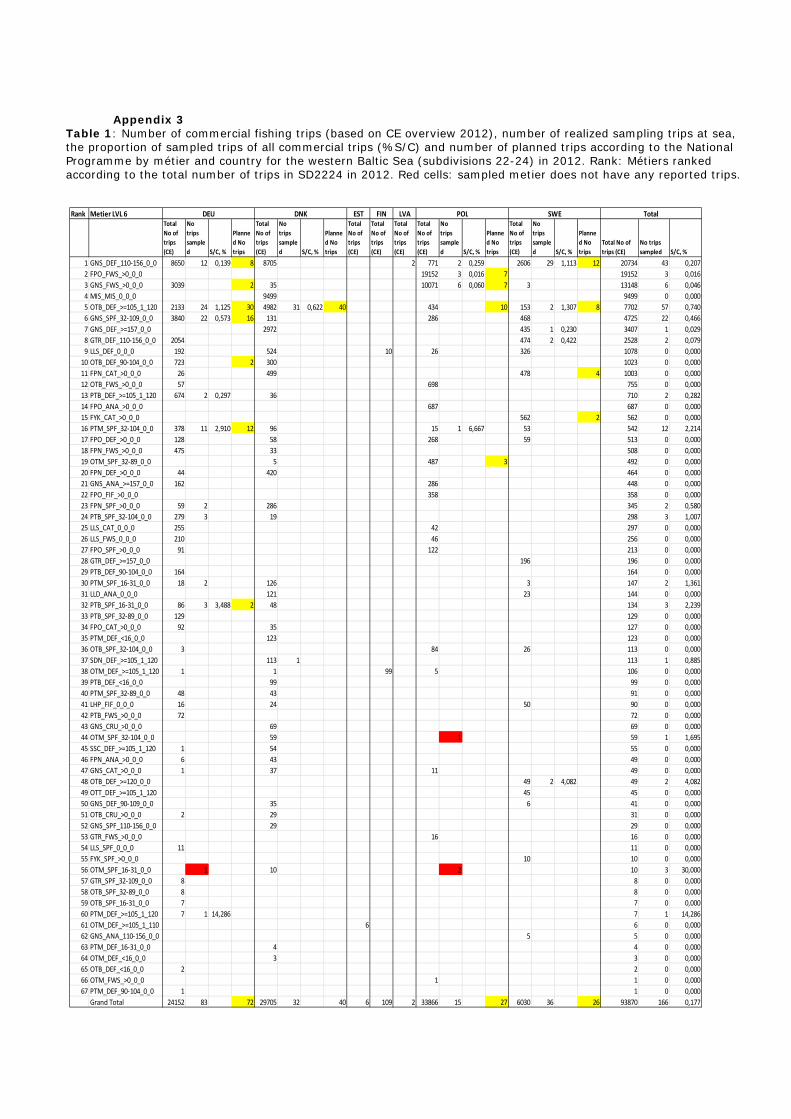
Appendix 3 Table 1: Number of commercial fishing trips (based on CE overview 2012), number of realized sampling trips at sea, the proportion of sampled trips of all commercial trips (%S/C) and number of planned trips according to the National Programme by métier and country for the western Baltic Sea (subdivisions 22-24) in 2012. Rank: Métiers ranked according to the total number of trips in SD2224 in 2012. Red cells: sampled metier does not have any reported trips.
Rank Metier LVL 6 EST FIN LVATotal
No of
trips
(CE)
No
trips
sample
d S/C, %
Planne
d No
trips
Total
No of
trips
(CE)
No
trips
sample
d S/C, %
Planne
d No
trips
Total
No of
trips
(CE)
Total
No of
trips
(CE)
Total
No of
trips
(CE)
Total
No of
trips
(CE)
No
trips
sample
d S/C, %
Planne
d No
trips
Total
No of
trips
(CE)
No
trips
sample
d S/C, %
Planne
d No
trips
Total No of
trips (CE)
No trips
sampled S/C, %
1 GNS_DEF_110‐156_0_0 8650 12 0,139 8 8705 2 771 2 0,259 2606 29 1,113 12 20734 43 0,207
2 FPO_FWS_>0_0_0 19152 3 0,016 7 19152 3 0,016
3 GNS_FWS_>0_0_0 3039 2 35 10071 6 0,060 7 3 13148 6 0,046
4 MIS_MIS_0_0_0 9499 9499 0 0,000
5 OTB_DEF_>=105_1_120 2133 24 1,125 30 4982 31 0,622 40 434 10 153 2 1,307 8 7702 57 0,740
6 GNS_SPF_32‐109_0_0 3840 22 0,573 16 131 286 468 4725 22 0,466
7 GNS_DEF_>=157_0_0 2972 435 1 0,230 3407 1 0,029
8 GTR_DEF_110‐156_0_0 2054 474 2 0,422 2528 2 0,079
9 LLS_DEF_0_0_0 192 524 10 26 326 1078 0 0,000
10 OTB_DEF_90‐104_0_0 723 2 300 1023 0 0,000
11 FPN_CAT_>0_0_0 26 499 478 4 1003 0 0,000
12 OTB_FWS_>0_0_0 57 698 755 0 0,000
13 PTB_DEF_>=105_1_120 674 2 0,297 36 710 2 0,282
14 FPO_ANA_>0_0_0 687 687 0 0,000
15 FYK_CAT_>0_0_0 562 2 562 0 0,000
16 PTM_SPF_32‐104_0_0 378 11 2,910 12 96 15 1 6,667 53 542 12 2,214
17 FPO_DEF_>0_0_0 128 58 268 59 513 0 0,000
18 FPN_FWS_>0_0_0 475 33 508 0 0,000
19 OTM_SPF_32‐89_0_0 5 487 3 492 0 0,000
20 FPN_DEF_>0_0_0 44 420 464 0 0,000
21 GNS_ANA_>=157_0_0 162 286 448 0 0,000
22 FPO_FIF_>0_0_0 358 358 0 0,000
23 FPN_SPF_>0_0_0 59 2 286 345 2 0,580
24 PTB_SPF_32‐104_0_0 279 3 19 298 3 1,007
25 LLS_CAT_0_0_0 255 42 297 0 0,000
26 LLS_FWS_0_0_0 210 46 256 0 0,000
27 FPO_SPF_>0_0_0 91 122 213 0 0,000
28 GTR_DEF_>=157_0_0 196 196 0 0,000
29 PTB_DEF_90‐104_0_0 164 164 0 0,000
30 PTM_SPF_16‐31_0_0 18 2 126 3 147 2 1,361
31 LLD_ANA_0_0_0 121 23 144 0 0,000
32 PTB_SPF_16‐31_0_0 86 3 3,488 2 48 134 3 2,239
33 PTB_SPF_32‐89_0_0 129 129 0 0,000
34 FPO_CAT_>0_0_0 92 35 127 0 0,000
35 PTM_DEF_<16_0_0 123 123 0 0,000
36 OTB_SPF_32‐104_0_0 3 84 26 113 0 0,000
37 SDN_DEF_>=105_1_120 113 1 113 1 0,885
38 OTM_DEF_>=105_1_120 1 1 99 5 106 0 0,000
39 PTB_DEF_<16_0_0 99 99 0 0,000
40 PTM_SPF_32‐89_0_0 48 43 91 0 0,000
41 LHP_FIF_0_0_0 16 24 50 90 0 0,000
42 PTB_FWS_>0_0_0 72 72 0 0,000
43 GNS_CRU_>0_0_0 69 69 0 0,000
44 OTM_SPF_32‐104_0_0 59 1 59 1 1,695
45 SSC_DEF_>=105_1_120 1 54 55 0 0,000
46 FPN_ANA_>0_0_0 6 43 49 0 0,000
47 GNS_CAT_>0_0_0 1 37 11 49 0 0,000
48 OTB_DEF_>=120_0_0 49 2 4,082 49 2 4,082
49 OTT_DEF_>=105_1_120 45 45 0 0,000
50 GNS_DEF_90‐109_0_0 35 6 41 0 0,000
51 OTB_CRU_>0_0_0 2 29 31 0 0,000
52 GNS_SPF_110‐156_0_0 29 29 0 0,000
53 GTR_FWS_>0_0_0 16 16 0 0,000
54 LLS_SPF_0_0_0 11 11 0 0,000
55 FYK_SPF_>0_0_0 10 10 0 0,000
56 OTM_SPF_16‐31_0_0 1 10 2 10 3 30,000
57 GTR_SPF_32‐109_0_0 8 8 0 0,000
58 OTB_SPF_32‐89_0_0 8 8 0 0,000
59 OTB_SPF_16‐31_0_0 7 7 0 0,000
60 PTM_DEF_>=105_1_120 7 1 14,286 7 1 14,286
61 OTM_DEF_>=105_1_110 6 6 0 0,000
62 GNS_ANA_110‐156_0_0 5 5 0 0,000
63 PTM_DEF_16‐31_0_0 4 4 0 0,000
64 OTM_DEF_<16_0_0 3 3 0 0,000
65 OTB_DEF_<16_0_0 2 2 0 0,000
66 OTM_FWS_>0_0_0 1 1 0 0,000
67 PTM_DEF_90‐104_0_0 1 1 0 0,000
Grand Total 24152 83 72 29705 32 40 6 109 2 33866 15 27 6030 36 26 93870 166 0,177
DEU DNK POL SWE Total
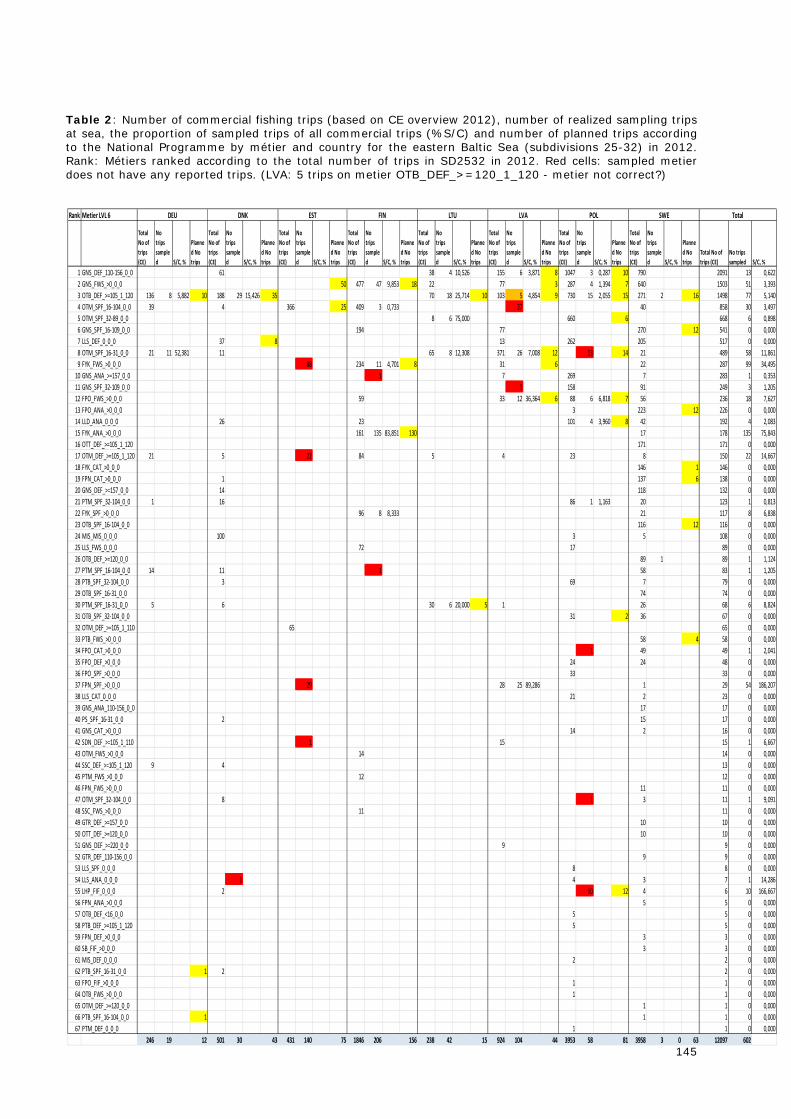
145
Table 2: Number of commercial fishing trips (based on CE overview 2012), number of realized sampling trips at sea, the proportion of sampled trips of all commercial trips (%S/C) and number of planned trips according to the National Programme by métier and country for the eastern Baltic Sea (subdivisions 25-32) in 2012. Rank: Métiers ranked according to the total number of trips in SD2532 in 2012. Red cells: sampled metier does not have any reported trips. (LVA: 5 trips on metier OTB_DEF_>=120_1_120 - metier not correct?)
Rank Metier LVL 6
Total
No of
trips
(CE)
No
trips
sample
d S/C, %
Planne
d No
trips
Total
No of
trips
(CE)
No
trips
sample
d S/C, %
Planne
d No
trips
Total
No of
trips
(CE)
No
trips
sample
d S/C, %
Planne
d No
trips
Total
No of
trips
(CE)
No
trips
sample
d S/C, %
Planne
d No
trips
Total
No of
trips
(CE)
No
trips
sample
d S/C, %
Planne
d No
trips
Total
No of
trips
(CE)
No
trips
sample
d S/C, %
Planne
d No
trips
Total
No of
trips
(CE)
No
trips
sample
d S/C, %
Planne
d No
trips
Total
No of
trips
(CE)
No
trips
sample
d S/C, %
Planne
d No
trips
Total No of
trips (CE)
No trips
sampled S/C, %
1 GNS_DEF_110‐156_0_0 61 38 4 10,526 155 6 3,871 8 1047 3 0,287 10 790 2091 13 0,622
2 GNS_FWS_>0_0_0 50 477 47 9,853 18 22 77 3 287 4 1,394 7 640 1503 51 3,393
3 OTB_DEF_>=105_1_120 136 8 5,882 10 188 29 15,426 35 70 18 25,714 10 103 5 4,854 9 730 15 2,055 15 271 2 16 1498 77 5,140
4 OTM_SPF_16‐104_0_0 39 4 366 25 409 3 0,733 27 40 858 30 3,497
5 OTM_SPF_32‐89_0_0 8 6 75,000 660 6 668 6 0,898
6 GNS_SPF_16‐109_0_0 194 77 270 12 541 0 0,000
7 LLS_DEF_0_0_0 37 8 13 262 205 517 0 0,000
8 OTM_SPF_16‐31_0_0 21 11 52,381 11 65 8 12,308 371 26 7,008 12 13 14 21 489 58 11,861
9 FYK_FWS_>0_0_0 88 234 11 4,701 8 31 6 22 287 99 34,495
10 GNS_ANA_>=157_0_0 1 7 269 7 283 1 0,353
11 GNS_SPF_32‐109_0_0 3 158 91 249 3 1,205
12 FPO_FWS_>0_0_0 59 33 12 36,364 6 88 6 6,818 7 56 236 18 7,627
13 FPO_ANA_>0_0_0 3 223 12 226 0 0,000
14 LLD_ANA_0_0_0 26 23 101 4 3,960 8 42 192 4 2,083
15 FYK_ANA_>0_0_0 161 135 83,851 130 17 178 135 75,843
16 OTT_DEF_>=105_1_120 171 171 0 0,000
17 OTM_DEF_>=105_1_120 21 5 22 84 5 4 23 8 150 22 14,667
18 FYK_CAT_>0_0_0 146 1 146 0 0,000
19 FPN_CAT_>0_0_0 1 137 6 138 0 0,000
20 GNS_DEF_>=157_0_0 14 118 132 0 0,000
21 PTM_SPF_32‐104_0_0 1 16 86 1 1,163 20 123 1 0,813
22 FYK_SPF_>0_0_0 96 8 8,333 21 117 8 6,838
23 OTB_SPF_16‐104_0_0 116 12 116 0 0,000
24 MIS_MIS_0_0_0 100 3 5 108 0 0,000
25 LLS_FWS_0_0_0 72 17 89 0 0,000
26 OTB_DEF_>=120_0_0 89 1 89 1 1,124
27 PTM_SPF_16‐104_0_0 14 11 1 58 83 1 1,205
28 PTB_SPF_32‐104_0_0 3 69 7 79 0 0,000
29 OTB_SPF_16‐31_0_0 74 74 0 0,000
30 PTM_SPF_16‐31_0_0 5 6 30 6 20,000 5 1 26 68 6 8,824
31 OTB_SPF_32‐104_0_0 31 2 36 67 0 0,000
32 OTM_DEF_>=105_1_110 65 65 0 0,000
33 PTB_FWS_>0_0_0 58 4 58 0 0,000
34 FPO_CAT_>0_0_0 1 49 49 1 2,041
35 FPO_DEF_>0_0_0 24 24 48 0 0,000
36 FPO_SPF_>0_0_0 33 33 0 0,000
37 FPN_SPF_>0_0_0 29 28 25 89,286 1 29 54 186,207
38 LLS_CAT_0_0_0 21 2 23 0 0,000
39 GNS_ANA_110‐156_0_0 17 17 0 0,000
40 PS_SPF_16‐31_0_0 2 15 17 0 0,000
41 GNS_CAT_>0_0_0 14 2 16 0 0,000
42 SDN_DEF_>=105_1_110 1 15 15 1 6,667
43 OTM_FWS_>0_0_0 14 14 0 0,000
44 SSC_DEF_>=105_1_120 9 4 13 0 0,000
45 PTM_FWS_>0_0_0 12 12 0 0,000
46 FPN_FWS_>0_0_0 11 11 0 0,000
47 OTM_SPF_32‐104_0_0 8 1 3 11 1 9,091
48 SSC_FWS_>0_0_0 11 11 0 0,000
49 GTR_DEF_>=157_0_0 10 10 0 0,000
50 OTT_DEF_>=120_0_0 10 10 0 0,000
51 GNS_DEF_>=220_0_0 9 9 0 0,000
52 GTR_DEF_110‐156_0_0 9 9 0 0,000
53 LLS_SPF_0_0_0 8 8 0 0,000
54 LLS_ANA_0_0_0 1 4 3 7 1 14,286
55 LHP_FIF_0_0_0 2 10 12 4 6 10 166,667
56 FPN_ANA_>0_0_0 5 5 0 0,000
57 OTB_DEF_<16_0_0 5 5 0 0,000
58 PTB_DEF_>=105_1_120 5 5 0 0,000
59 FPN_DEF_>0_0_0 3 3 0 0,000
60 SB_FIF_>0_0_0 3 3 0 0,000
61 MIS_DEF_0_0_0 2 2 0 0,000
62 PTB_SPF_16‐31_0_0 1 2 2 0 0,000
63 FPO_FIF_>0_0_0 1 1 0 0,000
64 OTB_FWS_>0_0_0 1 1 0 0,000
65 OTM_DEF_>=120_0_0 1 1 0 0,000
66 PTB_SPF_16‐104_0_0 1 1 1 0 0,000
67 PTM_DEF_0_0_0 1 1 0 0,000
246 19 12 501 30 43 431 140 75 1846 206 156 238 42 15 924 104 44 3953 58 81 3958 3 0 63 12097 602
DEU DNK POL SWE TotalEST FIN LTU LVA