Embed Size (px)
Citation preview
lable at ScienceDirect
Environmental Modelling & Software 58 (2014) 27e47
Contents lists avai
Environmental Modelling & Software
journal homepage: www.elsevier .com/locate/envsoft
Representing situational knowledge acquired from sensor data foratmospheric phenomena
Markus Stocker a,*, Elham Baranizadeh b, Harri Portin b,d, Mika Komppula d,Mauno Rönkkö a, Amar Hamed b, Annele Virtanen b, Kari Lehtinen b,d, Ari Laaksonen b,c,Mikko Kolehmainen a
a Environmental Informatics Group, Department of Environmental Science, University of Eastern Finland, P.O. Box 1627, 70211 Kuopio, FinlandbAerosol Physics Group, Department of Applied Physics, University of Eastern Finland, P.O. Box 1627, 70211 Kuopio, Finlandc Finnish Meteorological Institute, P.O. Box 503, 00101 Helsinki, Finlandd Finnish Meteorological Institute, P.O. Box 1627, 70211 Kuopio, Finland
a r t i c l e i n f o
Article history:Received 17 October 2013Received in revised form10 February 2014Accepted 3 April 2014Available online
Keywords:Environmental sensor networksSensor dataKnowledge acquisitionKnowledge representationAtmospheric phenomena
* Corresponding author. Tel.: þ358 44 500 3908; faE-mail addresses: [email protected] (M. Stocke
(E. Baranizadeh), [email protected] (H. Port(M. Komppula), [email protected] (M. Rö(A. Hamed), [email protected] (A. Virt(K. Lehtinen), [email protected] (A. Laaksonen)(M. Kolehmainen).
http://dx.doi.org/10.1016/j.envsoft.2014.04.0061364-8152/� 2014 Elsevier Ltd. All rights reserved.
a b s t r a c t
A recurrent problem in applications that build on environmental sensor networks is that of sensor dataorganization and interpretation. Organization focuses on, for instance, resolving the syntactic and se-mantic heterogeneity of sensor data. The distinguishing factor between organization and interpretationis the abstraction from sensor data with information acquired from sensor data. Such information may besituational knowledge for environmental phenomena. We discuss a generic software framework for theorganization and interpretation of sensor data and demonstrate its application to data of a large scalesensor network for the monitoring of atmospheric phenomena. The results show that software supportfor the organization and interpretation of sensor data is valuable to scientists in scientific computingworkflows. Explicitly represented situational knowledge is also useful to client software systems as it canbe queried, integrated, reasoned, visualized, or annotated.
� 2014 Elsevier Ltd. All rights reserved.
Software availability Measuring Ecosystem-Atmosphere Relations (SMEAR) is an example
Wavellite is open source, is written in Java, and was released in2013 under the Eclipse Public License (EPL 1.0). Wavellite wasdeveloped and is maintained by Markus Stocker. The Wavelliteproject page is at http://www.uef.fi/en/envi/projects/wavellite.
1. Introduction
Environmental sensor networks are an important research toolfor earth and environmental science (Hart and Martinez, 2006).They play a key role in the monitoring of the natural environmentand allow for unprecedented study of the dynamics of environ-mental systems and processes (Hill et al., 2011).
Over the past decades, many small and large scale environmentalsensor networks have been deployed. The Finnish Station for
x: þ358 17 163 191.r), [email protected]), [email protected]ö), [email protected]), [email protected], [email protected]
fora large scale sensornetworkandHart andMartinez (2006)presentseveral others. SMEAR started its operations in 1991 with measure-ments for SO2 in Eastern Lapland. It quickly grew to include severalother locations and properties of environmental phenomena,including forweather, such as temperature, humidity, orwind speed;for atmospheric gases, such as the concentration of carbon dioxide orozone; for aerosols, such as particle number concentration.
Today, SMEAR consists of four main stations: SMEAR I in EasternLapland, SMEAR II in Hyytiälä, SMEAR III in Helsinki, and SMEAR IVin Kuopio. The main stations consist of one or more substations.Substations consist of a set of sensing devices. For instance, SMEARIV consists of two substations, at Puijo and at Savilahti. The sub-station SMEAR IV-Puijo resides on top of the Puijo observationtower (62�5403200 N, 27�3903100 E), 306 m above sea level and 224mabove the surrounding lake level. The Puijo observation tower islocated in the city of Kuopio, in a semi-urban environment. Kuopiois situated in Eastern Finland, about 330 km to the northeast fromHelsinki. SMEAR IV-Puijo consists of sensing devices for themonitoring of aerosols, weather, and atmospheric gases. Sensingdevices are manufactured by various vendors, including ThermoFisher Scientific Inc., TSI Inc., and Vaisala (Leskinen et al., 2009). Inthis study, we used data by sensors of SMEAR IV-Puijo.
M. Stocker et al. / Environmental Modelling & Software 58 (2014) 27e4728
Environmental sensor networks can produce large amounts ofsyntactically and semantically heterogeneous data. SMEAR IV-Puijoalone generates approximately 2.5 million data points every day, ofwhich1millionarebya single sensor (namely theoptical clouddropletspectrometer). To ensure its utility, such data must be managed withappropriatehardwareandsoftwaresystems (Hart andMartinez, 2006;Horsburgh et al., 2009). We distinguish the class of software systemsthat organize sensor data and the class of software systems that inaddition interpret organized sensor data. The distinguishing featurebetween the two classes is the abstraction from organized sensor datawith information acquired from sensor data, for instance informationabout a monitored environmental phenomenon.
In discussing the design of a software system for publishingenvironmental observations Horsburgh et al. (2009) underscore thechallenges of persistent storage and management, data access andcommunication, data interoperability, and data discovery. Thesechallenges are typical to software systems that organize sensor data.Organization of sensor data can be achieved in variousways. Systemsmay build on conventional relational databasemanagement systems(Horsburgh et al., 2009; Junninen et al., 2009) or so-called “NoSQL”databases, such as Apache Cassandra. Systems may be tailored forstreamed data processing (Bonnet et al., 2001; Carney et al., 2002;Madden and Franklin, 2002). Systems may use advanced data andknowledge representation languages. We highlight Semantic Web(Berners-Lee et al., 2001) technologies, which have found theirapplication in sensor networks and sensor data (Sheth et al., 2008)with ontologies (Compton, 2011) and software architectures andsystems (Moraru and Mladeni�c, 2012) being developed for the pur-pose of organizing sensor data.
Software systems that interpret sensor data build on organizedsensor data and include computational techniques in, e.g., machinelearning, inference, or complex event processing, to acquire infor-mation from sensor data. In this study, information is for situationsand the acquisition of information is automated and may occur in(near) real time. Information is represented explicitly. For example,given organized observations for mean hourly concentration ofparticulate matter with diameter less than 2.5 mm (PM2.5), complexevent processing can be used to automatically and continuouslydetect situations of unhealthy exposure. The semantics of situationsare, typically, different from the semantics of observations. Spe-cifically to situations of unhealthy exposure, ‘exposure’ entails alonger time interval than mean hourly concentration and ‘un-healthy’ requires mean hourly concentration to continuouslyexceed a certain threshold.
Software systems that interpret sensor data are interesting forseveral reasons. First, the problem is harder than mere sensor dataorganization. The problem is known to various domains and severalsoftware architectures have been proposed in the literature(Clemente et al., 2013; Gorrepati et al., 2013; Conroy et al., 2011;Gaglio et al., 2007; Liu and Zhao, 2005; Whitehouse et al., 2006;Vassev and Hinchey, 2012). However, to the best of our knowledge,the work in this area is fragmented. Second, information acquiredfrom sensor data is typically ofmore value to people than sensor data(Barnaghi et al., 2012). Of specific interest in this study are scientistsand scientific computing on environmental sensor data. Third, forapplications that build on large sensor networks and/or high fre-quency sensors it may not be desirable, or practicable, to persistsensor data for offline analysis. For such applications it may be bestto acquire information over streams of sensor data, discard thesensor data, and only retain the acquired information.
The problems addressed in this study are (1) the heterogeneity ofsensor data and (2) the explicit representation of situationalknowledge automatically acquired from heterogeneous sensor datafor environmental phenomena, specifically for SMEAR. Our aim is touse Wavellite (Stocker et al., submitted for publication) and
demonstrate with a concrete application how it addresses theseproblems. Wavellite is a generic software framework aimed at theorganization and interpretation of sensor data. It supports the pro-cessing of heterogeneous sensor data to sensor observations withhomogeneous syntax and semantics; the mapping of sensor obser-vations to dataset observations and the processing of datasets; theacquisition of situational knowledge from datasets; and the repre-sentation of situational knowledge. Extending our previous work(Stocker et al., 2013), the environmental phenomena of interest inthis study are new particle formation and clouds. Hence, situations ofinterest are events of new particle formation and cloud events,occurring at Puijo. Information for such situations is acquired fromdata by sensors used for the monitoring of aerosols and weather atPuijo. To the best of our knowledge,Wavellite is unique in its supportfor the representation of situational knowledge acquired from het-erogeneous sensor data for environmental phenomena.
The contribution of this work is two-fold. First, for readersinterested in generic (and practical) approaches to the problem ofrepresenting situational knowledge acquired from sensor data, thiswork presents Wavellite and its application for a concrete use casein aerosol science, with real sensors and sensor data as well as usingvarious computational methods, including machine learning. Sec-ond, for aerosol scientists and, more generally, scientists in domainsin which sensors play an important role, this work presents asoftware system that integrates the processes of sensor data or-ganization and sensor data interpretation. Specifically to aerosolscientists who study new particle formation, this work describes asoftware system that could support their workflows.
The paper is structured as follows. In Section 2 we provide abrief overview of Wavellite, specifically the logical structure of itsarchitecture. In Section 3 we present the concrete implementationof the architecture. In Section 4 we briefly discuss how the imple-mentation can be used in applications. In Section 5 we present ourexperiment on SMEAR sensor data and the representation of situ-ational knowledge for events of new particle formation and cloudevents. In Section 6 we discuss the results of our experiments andWavellite more generally. In Section 7 we present related work.Finally, Section 8 draws some concluding remarks.
2. Architecture
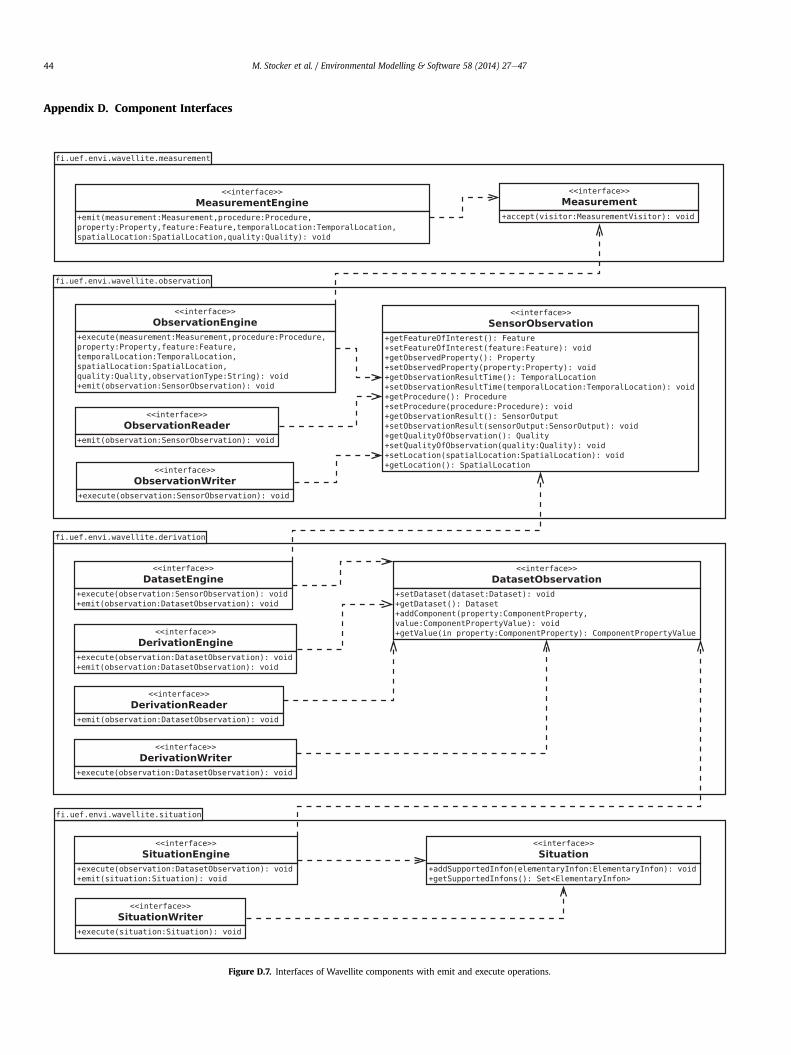
We describe the logical structure of theWavellite architecture toprovide an overview of the layers, components, and modules aswell as their responsibilities and interactions. The logical structureconsists of four layers: measurement, observation, derivation, andsituation. The four layers build on each other, frommeasurement tosituation. Each layer serves a purpose and abstracts from underly-ing complexity. Fig. 1 provides a graphical overview of the archi-tecture. Figure D.7 (Appendix D) gives an overview of the mostimportant interfaces, in particular component interfaces with emitand execute operations and operation parameters.
Layers consists of components. Components are categorized inthree broad classes: engine, reader, and writer. Components mayexecute information entities received on incoming streams andemit information entities to outgoing streams. Information entitiesare messages, specifically measurements and their contextual in-formation, sensor observations, dataset observations, and situa-tions. Components and streams form the nodes and edges,respectively, of a directed acyclic graph, known as a topology.Associated to components, the architecture includes modules.Modules are categorized in three broad classes: processing,learning, and store. Modules implement computations for purposessuch as digital signal processing, machine learning, complex eventprocessing, inference, retrieval and storage. The knowledge base isa third-party system.
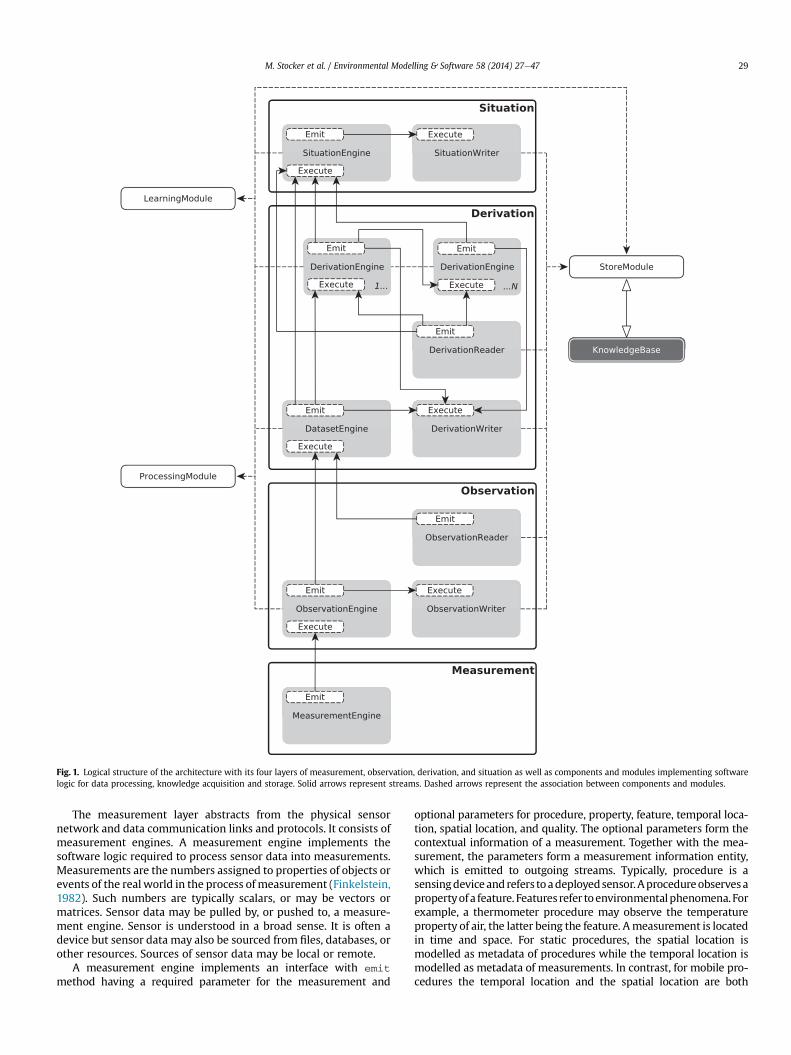
Fig. 1. Logical structure of the architecture with its four layers of measurement, observation, derivation, and situation as well as components and modules implementing softwarelogic for data processing, knowledge acquisition and storage. Solid arrows represent streams. Dashed arrows represent the association between components and modules.
M. Stocker et al. / Environmental Modelling & Software 58 (2014) 27e47 29
The measurement layer abstracts from the physical sensornetwork and data communication links and protocols. It consists ofmeasurement engines. A measurement engine implements thesoftware logic required to process sensor data into measurements.Measurements are the numbers assigned to properties of objects orevents of the real world in the process of measurement (Finkelstein,1982). Such numbers are typically scalars, or may be vectors ormatrices. Sensor data may be pulled by, or pushed to, a measure-ment engine. Sensor is understood in a broad sense. It is often adevice but sensor data may also be sourced from files, databases, orother resources. Sources of sensor data may be local or remote.
A measurement engine implements an interface with emit
method having a required parameter for the measurement and
optional parameters for procedure, property, feature, temporal loca-tion, spatial location, and quality. The optional parameters form thecontextual information of a measurement. Together with the mea-surement, the parameters form a measurement information entity,which is emitted to outgoing streams. Typically, procedure is asensingdeviceandrefers toadeployedsensor.Aprocedureobservesapropertyofa feature. Features refer toenvironmentalphenomena. Forexample, a thermometer procedure may observe the temperatureproperty of air, the latter being the feature. Ameasurement is locatedin time and space. For static procedures, the spatial location ismodelled as metadata of procedures while the temporal location ismodelled as metadata of measurements. In contrast, for mobile pro-cedures the temporal location and the spatial location are both
1 https://github.com/nathanmarz/storm/wiki/.
M. Stocker et al. / Environmental Modelling & Software 58 (2014) 27e4730
modelled as metadata of measurements. Information for the qualityof the measurement can be provided in contextual information.
The observation layer abstracts from the heterogeneity of sensordata. It consists of observation engines, observation writers, andobservation readers. Observation engines may subscribe to streamsof measurement information entities. An observation engine im-plements an interface with execute and emit methods. Thus, itexecutes measurement information entities and emits sensorobservation information entities. Observation engines translatemeasurements and related contextual information into sensor ob-servations. The semantics of sensor observations are defined by theSemantic Sensor Network Ontology (SSNO) (Compton, 2011). Thistranslation overcomes the syntactic and semantic heterogeneity ofsensor data by aligning sensor data to the syntax and semantics ofthe SSNO. Observation engines may make use of modules. Forinstance, a processing module may enrich sensor observations withinformation for their quality. Sensor observations are emitted asinformation entities to outgoing streams.
Observation writers may subscribe to streams of sensor obser-vation information entities. An observation writer implements aninterface with execute method. It executes sensor observationinformation entities and uses a store module to persist sensor ob-servations. All sensor observations generated at the observationlayer can thus be persisted. Persistence is implemented by theknowledge base. An observation writer does not further emit in-formation entities.
Observation readers implement an interface with emitmethod.An observation reader typically uses a store module to retrievesensor observations from the knowledge base. Sensor observationsare emitted as information entities to outgoing streams. However,observation readers arenot limited to retrieving sensorobservationsfrom the knowledge base. Indeed, implementations may retrievedata from any accessible resource and emit sensor observations.
The derivation layer abstracts from the sensor network dimen-sion of sensor observations. It consists of dataset engines, deriva-tion engines, derivation writers, and derivation readers. Datasetengines may subscribe to streams of sensor observation informa-tion entities. A dataset engine implements an interface withexecute and emit methods. It executes sensor observation in-formation entities and maps sensor observations to dataset obser-vations. The semantics of dataset observations are defined by theRDF Data Cube Vocabulary (QB) (Cyganiak et al., 2013). Datasetobservations are elements of datasets. Dataset observations areemitted as information entities to outgoing streams. Note thatdataset observations emitted by a dataset engine may be streameddirectly to the situation engine.
Derivation engines may subscribe to streams of dataset obser-vation information entities. A derivation engine implements aninterface with execute and emit methods. It performs compu-tations on dataset observations. Such computation amounts todataset processing, in that the dataset observations of one or moresource datasets are processed to dataset observations of a targetdataset. Derivation engines may associate to processing modules.Processing modules implement computations. Computations maybe for, e.g., despiking, aggregation, interpolation, merging, filtering.Dataset observations are emitted as information entities to out-going streams. Derivation engines can be chained in order toimplement more complex dataset processing.
Derivation writers may subscribe to streams of dataset obser-vation information entities. A derivation writer implements aninterface with execute method. It executes dataset observationinformation entities and uses a store module to persist datasetobservations. All dataset observations generated at the derivationlayer can thus be persisted. A derivation writer does not furtheremit information entities.
Derivation readers implement an interfacewith emitmethod. Aderivation reader typically uses a store module to retrieve datasetobservations from the knowledge base. Dataset observations areemitted as information entities to outgoing streams. However,derivation readers are not limited to retrieving dataset observationfrom the knowledge base. Indeed, implementations may retrievedata from any accessible resource and emit dataset observations.Note that dataset observation emitted by a derivation reader maybe streamed directly to the situation engine.
The situation layer abstracts from data. It consists of situation en-ginesandsituationwriters. Situationenginesmaysubscribe to streamsof dataset observation information entities. A situation engine imple-ments an interface with execute and emit methods. It employslearning modules to acquire situational knowledge from datasets.Learning modules perform computations over dataset observations.Computations may include methods in, e.g., machine learning orcomplex event processing. Situation engines represent situationalknowledgeas situations. The semantics of situations aredefinedby theSituation Theory Ontology (STO) (Kokar et al., 2009), which is groun-ded in Situation Theory (Barwise and Perry, 1983; Devlin, 1995). Situ-ations are emitted as information entities to outgoing streams.
Situation writers may subscribe to streams of situation infor-mation entities. A situation writer implements an interface withexecute method. It executes situation information entities anduses a store module to persist situations. All situations generated atthe situation layer can thus be persisted. A situationwriter does notfurther emit information entities.
3. Implementation
Wavellite is an implementation for the software architecturepresented in Section 2. In this section we detail the adopted ma-terials and methods. Wavellite builds on knowledge representationand reasoning, a distributed streamed data processing platform, aswell as computational techniques in digital signal processing,complex event processing, and machine learning. Wavellite isimplemented in Java.
Wavellite builds on the distributed and fault-tolerant real timecomputation system Storm to support (near) real time represen-tation of situational knowledge and distributed processing of in-formation entities. Storm provides three core abstractions: streams,spouts, and bolts. A stream is an unbounded sequence of tuples anda tuple is a named list of values.1 Both spouts and bolts are Stormprimitives that transform streams into new streams. A spout is asource of streams, i.e. a source of tuples for data (typically) readfrom an external source. Wavellite measurement engines, obser-vation readers, and derivation readers are Storm spouts. In contrastto spouts, a bolt consumes one or more streams, processes tuples,and possibly emits one or more new streams. With the exception ofmeasurement engines, Wavellite engines and writers are Stormbolts. Streams correspond to the edges while spouts and boltscorrespond to the nodes of a graph, also known as Storm topology.A Storm topology is executed by a Storm cluster, whichmay operatein local or distributed mode. In local mode, the worker nodes of aStorm cluster are simulated with threads. In contrast, in distributedmode Storm operates as a cluster of machines. The Storm topologyis generated at Wavellite application runtime from a Wavellite to-pology. A Wavellite topology is a user defined configuration for aWavellite application. It specifies the components and modules,their interaction and configuration, that are relevant to a Wavelliteapplication. A Wavellite topology is a document encoded in Java-Script Object Notation (JSON).
M. Stocker et al. / Environmental Modelling & Software 58 (2014) 27e47 31
The Wavellite observation, derivation, and situation layers buildon materials in knowledge representation, specifically the ResourceDescription Framework (RDF) (Manola et al., 2004), RDF Schema(RDFS) (Brickley et al., 2004), and Web Ontology Language (OWL 2)(Hitzler et al., 2012) SemanticWeb technologies. At the core, RDF is alanguage for representing information. RDF Schema is a semanticextension of RDF (Hayes and McBride, 2004) and provides the basicconstructs to build RDF vocabularies, also called ontologies. Ontology,defined as a formal and explicit specification of a conceptualization(Gruber, 1993), is a means to represent knowledge of a domain,meaning the concepts of some area of interest and relations that holdamong them. TheWebOntology Language, specifically OWL 2, buildson RDF and RDF Schema and introduces further constructs that allowfor the building of ontologies with richer semantics.
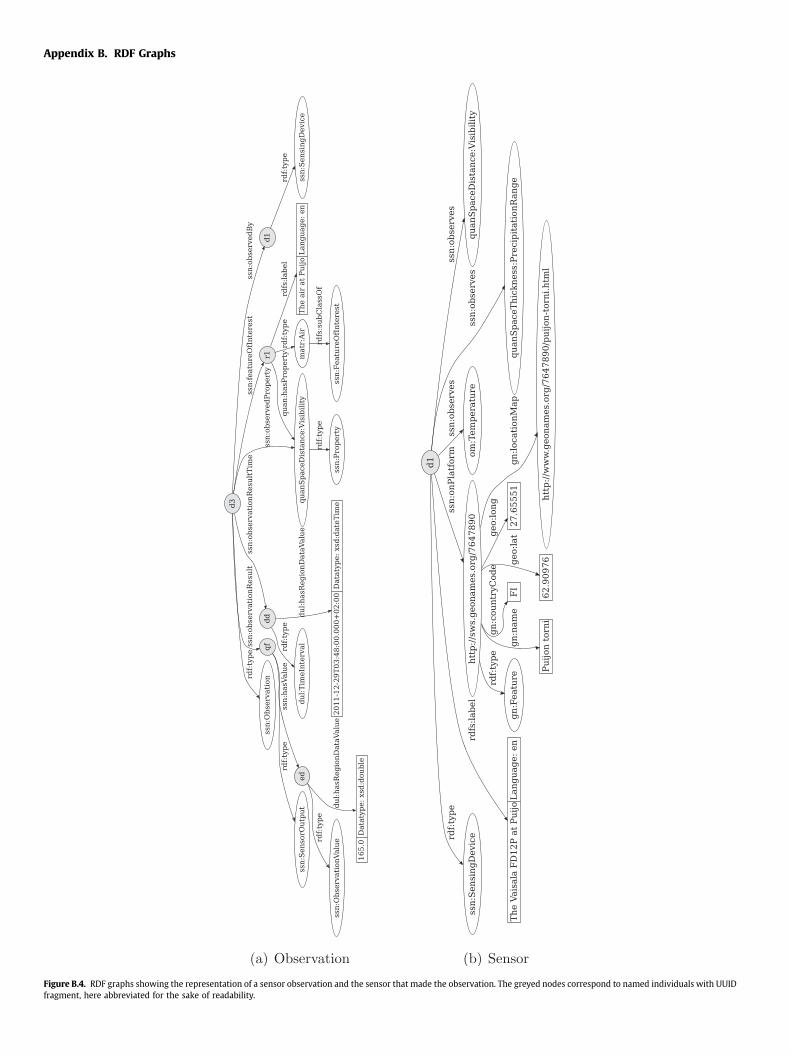
Wavellite adoptsanontology for therepresentationof informationat each layer above the measurement layer. The Semantic SensorNetwork Ontology (SSNO) is adopted at the observation layer for therepresentation of sensor observations. The SSNO defines terms usedfor the description of sensors and observations. We highlight somethat are of particular interest. The term ssn:Sensor is defined as an“entity that can follow a sensing method and thus observe someProperty of a FeatureOfInterest”.2 Typically, sensors are devices.However, computational methods and people may also be sensors.According to the ontology, the term ssn:Sensor is an exact matchwith the term ‘sensor’ defined in the OGC Sensor Model Languagestandard. Fig. 4 (b) (Appendix B) is a representation of an examplessn:Sensor. A sensor observes a ssn:Property, which is definedas “an observable Quality of an Event or Object”.3 The termssn:Property is an exactmatchwith the term ‘property’ defined inthe OGC Observations and Measurements standard. A ssn:Prop-
erty is of a ssn:FeatureOfInterest, which is defined as “anabstraction of [environmental] phenomena”.4 The term ssn:Fea-
tureOfInterest is anexactmatchwith the term ‘feature’defined inthe OGC Observations and Measurements standard. Finally, the termssn:Observation is defined in SSNO as “a Situation in which aSensing method has been used to estimate or calculate a value of aProperty of a FeatureOfInterest”.5 Fig. 4(a) (Appendix B) is the rep-resentation of an example ssn:Observation. The term ssn:Ob-
servation is a close match to the term ‘observation’ defined in theOGCObservationsandMeasurements standard.Overall, SSNOdefinesseveral dozen classes and properties. Sensor, property, feature, andobservation are of specific interest to Wavellite.
At the derivation layer, Wavellite adopts the RDF Data Cube Vo-cabulary (QB). The term qb:DataSet is defined as “a collection ofstatistical data that corresponds to a defined structure”6 and plays acentral role in the modelling of datasets at the derivation layer.Fig. 5(b) (Appendix B) is the representation of an example qb:Da-
taSet. A dataset relates to a qb:DataStructureDefinition withqb:ComponentSpecification(s). Component specifications relateto a qb:ComponentProperty and hold metadata for, e.g., theordering of component properties. Component properties specifythe dimensions of a dataset. The term qb:Observation is used tomodel dataset observations at the derivation layer. A dataset obser-vation relates to a dataset and values for the component propertiesspecified in the corresponding data structure definition. Thus, adataset is a collection of dataset observations of a defined structure.Fig. 5(a) (Appendix B) is the representation of an example
2 http://www.w3.org/2005/Incubator/ssn/ssnx/ssn#Sensor.3 http://www.w3.org/2005/Incubator/ssn/ssnx/ssn#Property.4 http://www.w3.org/2005/Incubator/ssn/ssnx/ssn#FeatureOfInterest.5 http://www.w3.org/2005/Incubator/ssn/ssnx/ssn#Observation.6 http://www.w3.org/TR/2013/CR-vocab-data-cube-20130625/#cubes-model-
datasets.
qb:Observation. QB builds on results from the Statistical Data andMetadata Exchange (SDMX) Initiative. Similar to QB, the SDMX In-formationModel defines an SDMX DataSet to be “a collection of a setof Observations that share the same dimensionality”.7
At the situation layer, Wavellite adopts the Situation TheoryOntology (STO). STO relates to the Situation Theory developed byBarwise and Perry (1983) and extended by Devlin (1995). Thetheory formalizes the semantics of situations by means of theexpression s ~ s (read “s supports s”) meaning that the infon s is“made factual” by the situation s. According to the definition byDevlin (1995), the object�R,ai,.,am,i[ is a well-defined infon if Ris an n-place relation and a1,.,am (m�n) are objects appropriate forthe argument places i1,.,im of R, and if the filling of argumentplaces i1,.,imis sufficient to satisfy the minimality conditions for R,and i ¼ 0,1 is the polarity. Minimality conditions “determine whichparticular groups of argument roles need to be filled in order toproduce an infon” (Devlin, 1995). The polarity is the ‘truth value’ ofthe infon. If i ¼ 1 then the objects a1,.,am stand in the relation R;else the objects do not stand in the relation R. Parameters, denotedas _a, make reference to arbitrary objects of a given type. Forinstance, _l and _t typically denote parameters for arbitrary objects oftype spatial location and temporal location, respectively. Anchorsare a mechanism to assign values to parameters. Hence, theparameter _t may anchor the value for the current time. The STOfollows the semantics of situations summarized here. It defines theterm sto:Situation to model situations. Figure B.6 (Appendix B)is the representation of an example sto:Situation. A situationrelates to one or more sto:ElementaryInfon via the propertysto:supportedInfon. As in Situation Theory, an elementaryinfon consists of a sto:Relation, anchors one or moresto:Object, and relates to a sto:Polarity.
Aside SSNO, QB, and STO, Wavellite also adopts the WURVOCOntology of units ofMeasure (OM) (Rijgersberg et al., 2011) tomodelquantities anddimensions aswell as theSemanticWeb for Earth andEnvironmental Terminology (SWEET) (Raskin and Pan, 2005), mostimportantly for themodellingof environmental phenomena, e.g. thefeature related to a sensor observation or the object anchored by aninfon of a situation, such as aerosol, air, or carbon dioxide.
The derivation layer performs transformations on datasets.Methods in digital signal processing (Rabiner and Gold,1975), such asfiltering, Fourier transform, interpolationoraggregation, areof interestat the derivation layer. Methods in digital signal processing may beused to, e.g., convert the observations of a dataset in time domain intoobservations of a dataset in frequency domain. Several Java librariesimplementdigital signalprocessingalgorithms, e.g. theModularAudioRecognitionFramework(MARF)or JScience.ComplexEventProcessing(CEP) (Luckham,2002) andrelated Java libraries suchasEspermayalsobe of interest at the derivation layer to process datasets.
Of particular interest at the situation layeraremethods inmachinelearning and data mining (Mitchell, 1997; Hand et al., 2001). Suchmethods play a key role in discovering situations from dataset ob-servations. An example are Multilayer Perceptron artificial neuralnetworks (MLP) (Haykin, 1999). An MLP network consists of a set ofneurons that form the input layer, one ormore hidden layers, and theoutput layerof thenetwork.MLP is trained inasupervisedmanner, i.e.by means of a labelled training dataset, using error back-propagationlearning, which consists of a forward pass and a backward passthrough the layers. In the forward pass, the signal resulting from theapplication of an input vector is propagated through the network in aforward direction and the actual response of the network at theoutput layer is recorded. In the backward pass, the recorded response
7 http://sdmx.org/docs/2_0/SDMX_2_0%20SECTION_02_InformationModel.pdf.
M. Stocker et al. / Environmental Modelling & Software 58 (2014) 27e4732
of the network at the output layer is subtracted from a desiredresponse, i.e. the label, toproduceanerror signal,which ispropagatedthrough thenetwork inabackwarddirection. In thispass thenetworkis adjusted in order to align the actual response with the desiredresponse. In supervised learning, the labelled training dataset is usedto train (calibrate) thenetwork.Once trained, thenetworkcanbeusedto classify input vectors for which the label is not known. At the sit-uation layer, a learning module may use trained neural networks inorder to classify input vectors represented as (multidimensional)dataset observations, elements of datasets of the derivation layer. Theresult of such classification allows for the detection of situations aswell as for the acquisition of situational knowledge. There existseveral Java libraries of interest to learning modules at the situationlayer. A popular example is WEKA (Hall et al., 2009).
A Wavellite store module is for a specific knowledge base. Weuse the Stardog RDF database. The Stardog RDF database imple-ments the persistence of RDF. Thus, all information entitiesgenerated at the observation, derivation, and situation layers maybe persisted via store module to the Stardog RDF database. Wave-llite can be extended with application specific store modules tosupport other RDF databases.
The Protégé Ontology Editor and Knowledge Acquisition Systemis useful for ontology management. It is particularly useful to thedesign of domain ontologies that extend the concepts and prop-erties of ontologies discussed here, e.g. extend the SSNO concept forsensor with a domain specific hierarchy of sensor types and in-dividuals representing deployed sensors.
4. Application
Wavellite can be implemented for specific applications.Figure E.8 (Appendix E) provides a schematic overview ofWavelliteapplication implementation. The process begins with a domainontology that imports SSNO, QB, and STO. The ontology is thenpopulated with domain knowledge, for instance using Protégé. Thismay require a fair amount of expertise regarding the sensornetwork infrastructure, the sensed environmental phenomena, thepurpose of sensing, and ontology engineering. The completedontology is imported by the knowledge base.
Wavellite application implementation also requires extensionsto the framework with custom (Java) program code. While anyWavellite component or module may be extended, most baseimplementations are intended to be reused.Main exceptions are themeasurement engine and the situation engine. We recall that theresponsibilityof ameasurementengine is to retrieve sensordata andto convert the data tomeasurements. The technicalities of retrievingand parsing sensor data very much depend on the sensing deviceand communication links and protocols. Thus, the base measure-mentengineexpects the implementationof theprogramlogic that isnecessary to emit measurements and their contextual information.
The responsibility of a situation engine is to implement theprogram logic necessary for the acquisition of situational knowl-edge from dataset observations as well as the representation ofsituations. Situation engines are domain specific. Their imple-mentation is determined by situational knowledge acquisitiontasks of interest to the domain. Thus, the base situation engineexpects the implementation of the program logic that is necessaryfor situational knowledge acquisition and representation.
Wavellite supports the implementation and reuse of processingand learning modules. However, the large number of methods fordata processing and data driven learning, as well as the largenumber of domain specific problems, is likely to necessitateframework extension with modules required in applications.
There are two main modes of application execution. We mayeither create a Wavellite topology and execute it on a Storm cluster
or we may use Wavellite in a (Java) application. They are aimed atdifferent modes of operation. The former is designed for applica-tions that require continuous (near) real time processing of currentsensor data. In contrast, the latter is designed for applications thatprocess historical sensor data. The use of Storm for historical data istechnically possible but practically it is more direct to assemble thenecessary program logic in a standalone application.
5. Experiment
We developed a Wavellite application for SMEAR IV-Puijo sen-sors for the acquisition and representation of situational knowledgefor events of new particle formation and could events. The appli-cation was for data by the Differential Mobility Particle Sizer(DMPS) for particle size distribution and the Present WeatherSensor (PWS) for visibility and precipitation.
New Particle Formation (NPF) and the growth of newly formedparticles have been well documented in a wide variety of envi-ronments all over the world (Kulmala et al., 2004). Aerosol particlesare known to influence quality of life, for instance by affectinghuman health (Pope III et al., 2002). Newly formed nano-sizedparticles can grow, through condensation and coagulation pro-cesses, and directly effect on Earth’s radiation balance by scatteringsunlight. Indirectly, their potential to grow large enough to act asCloud Condensation Nuclei (CCN) and their possible activation tocloud droplets results in more scattering of radiation. It is knownthat the scattering of radiation has a cooling effect on the climate(Solomon et al., 2007). However, the magnitude of indirect effectsremains the single largest uncertainty in current estimates ofanthropogenic radiative forcing (Solomon et al., 2007), leading tolarge uncertainties in the calculations of future climate change.
The study of NPF relies on methods for the identification andcharacterization of these atmospheric events. At the base of suchmethods is the measurement of particle size distribution for poly-disperse aerosols. Of specific interest are particles with diametersize ranging 10�9e10�6 m. The resulting data, as measured over thecourse of a day at a specific location, can be visualized to assess thepresence of NPF (Dal Maso et al., 2005).
Different classifications have been proposed in order to char-acterize NPF (Dal Maso et al., 2005; Hamed et al., 2007; Vana et al.,2008). The criterion established by Hamed et al. (2007) is based onevent clarity. According to the criterion, nucleation event classes 1,2, and 3 indicate strong, intermediate, and weak nucleation event(E) days, respectively. Days during which no particle formation isobserved are classified as non-event (NE). Days that are neither Enor NE are called undefined class, or class 0. The tasks of NPFidentification and characterization are typically carried out visuallyby experts (Hamed et al., 2007).
We adopt the classification proposed by Hamed et al. (2007) anddistinguish two (machine learning) classification tasks: NPF eventidentification and NPF event characterization. The former is for theclassification of days as event (E) or non-event (NE). The latter is forthe classification of event (E) days into classes 1, 2, or 3 for eventclarity. We train, validate, and test MLP artificial neural networksfor the two tasks of NPF event identification and characterization.
A could event at Puijo is considered to take place when averagehourly visibility drops below 200 m. Cloud events are further clas-sified as rainy if average hourly precipitation exceeds 0.2 mm h�1. Incontrast to NPF events, (rainy) cloud events are relatively straight-forward to detect using complex event processing.
The sensors are installed on the Puijo observation tower. ADMPS consists of a Differential Mobility Analyser (DMA) and aCondensation Particle Counter (CPC). The particles of a poly-disperse aerosol (source) are first classified according to diametersize by the DMA and then counted by the CPC (Kulkarni et al., 2011).
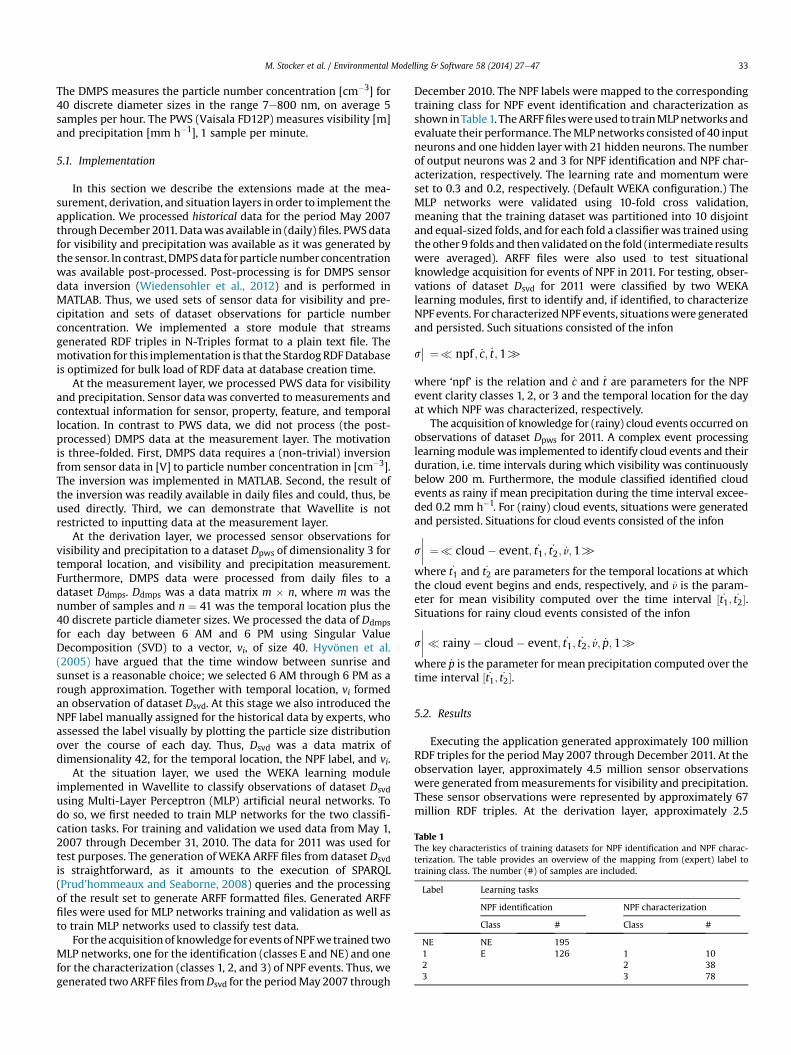
Table 1The key characteristics of training datasets for NPF identification and NPF charac-terization. The table provides an overview of the mapping from (expert) label totraining class. The number (#) of samples are included.
Label Learning tasks
NPF identification NPF characterization
Class # Class #
NE NE 1951 E 126 1 102 2 383 3 78
M. Stocker et al. / Environmental Modelling & Software 58 (2014) 27e47 33
The DMPS measures the particle number concentration [cm�3] for40 discrete diameter sizes in the range 7e800 nm, on average 5samples per hour. The PWS (Vaisala FD12P) measures visibility [m]and precipitation [mm h�1], 1 sample per minute.
5.1. Implementation
In this section we describe the extensions made at the mea-surement, derivation, and situation layers in order to implement theapplication. We processed historical data for the period May 2007throughDecember 2011. Datawas available in (daily)files. PWSdatafor visibility and precipitation was available as it was generated bythe sensor. In contrast,DMPSdata for particle number concentrationwas available post-processed. Post-processing is for DMPS sensordata inversion (Wiedensohler et al., 2012) and is performed inMATLAB. Thus, we used sets of sensor data for visibility and pre-cipitation and sets of dataset observations for particle numberconcentration. We implemented a store module that streamsgenerated RDF triples in N-Triples format to a plain text file. Themotivation for this implementation is that the StardogRDFDatabaseis optimized for bulk load of RDF data at database creation time.
At the measurement layer, we processed PWS data for visibilityand precipitation. Sensor data was converted to measurements andcontextual information for sensor, property, feature, and temporallocation. In contrast to PWS data, we did not process (the post-processed) DMPS data at the measurement layer. The motivationis three-folded. First, DMPS data requires a (non-trivial) inversionfrom sensor data in [V] to particle number concentration in [cm�3].The inversion was implemented in MATLAB. Second, the result ofthe inversion was readily available in daily files and could, thus, beused directly. Third, we can demonstrate that Wavellite is notrestricted to inputting data at the measurement layer.
At the derivation layer, we processed sensor observations forvisibility and precipitation to a dataset Dpws of dimensionality 3 fortemporal location, and visibility and precipitation measurement.Furthermore, DMPS data were processed from daily files to adataset Ddmps. Ddmps was a data matrix m � n, where m was thenumber of samples and n ¼ 41 was the temporal location plus the40 discrete particle diameter sizes. We processed the data of Ddmpsfor each day between 6 AM and 6 PM using Singular ValueDecomposition (SVD) to a vector, vi, of size 40. Hyvönen et al.(2005) have argued that the time window between sunrise andsunset is a reasonable choice; we selected 6 AM through 6 PM as arough approximation. Together with temporal location, vi formedan observation of dataset Dsvd. At this stage we also introduced theNPF label manually assigned for the historical data by experts, whoassessed the label visually by plotting the particle size distributionover the course of each day. Thus, Dsvd was a data matrix ofdimensionality 42, for the temporal location, the NPF label, and vi.
At the situation layer, we used the WEKA learning moduleimplemented in Wavellite to classify observations of dataset Dsvdusing Multi-Layer Perceptron (MLP) artificial neural networks. Todo so, we first needed to train MLP networks for the two classifi-cation tasks. For training and validation we used data from May 1,2007 through December 31, 2010. The data for 2011 was used fortest purposes. The generation of WEKA ARFF files from dataset Dsvd
is straightforward, as it amounts to the execution of SPARQL(Prud’hommeaux and Seaborne, 2008) queries and the processingof the result set to generate ARFF formatted files. Generated ARFFfiles were used for MLP networks training and validation as well asto train MLP networks used to classify test data.
For the acquisitionof knowledge forevents ofNPFwetrained twoMLP networks, one for the identification (classes E and NE) and onefor the characterization (classes 1, 2, and 3) of NPF events. Thus, wegenerated two ARFF files fromDsvd for the periodMay 2007 through
December 2010. The NPF labels were mapped to the correspondingtraining class for NPF event identification and characterization asshown inTable1. TheARFFfileswereused to trainMLPnetworks andevaluate their performance. TheMLPnetworks consisted of 40 inputneurons and one hidden layer with 21 hidden neurons. The numberof output neurons was 2 and 3 for NPF identification and NPF char-acterization, respectively. The learning rate and momentum wereset to 0.3 and 0.2, respectively. (Default WEKA configuration.) TheMLP networks were validated using 10-fold cross validation,meaning that the training dataset was partitioned into 10 disjointand equal-sized folds, and for each fold a classifierwas trained usingthe other 9 folds and thenvalidated on the fold (intermediate resultswere averaged). ARFF files were also used to test situationalknowledge acquisition for events of NPF in 2011. For testing, obser-vations of dataset Dsvd for 2011 were classified by two WEKAlearning modules, first to identify and, if identified, to characterizeNPF events. For characterizedNPF events, situationswere generatedand persisted. Such situations consisted of the infon
s�� ¼� npf ; _c; _t;1[
where ‘npf’ is the relation and _c and _t are parameters for the NPFevent clarity classes 1, 2, or 3 and the temporal location for the dayat which NPF was characterized, respectively.
The acquisition of knowledge for (rainy) cloud events occurred onobservations of dataset Dpws for 2011. A complex event processinglearningmodulewas implemented to identify cloud events and theirduration, i.e. time intervals during which visibility was continuouslybelow 200 m. Furthermore, the module classified identified cloudevents as rainy if mean precipitation during the time interval excee-ded 0.2 mm h�1. For (rainy) cloud events, situations were generatedand persisted. Situations for cloud events consisted of the infon
s
����¼� cloud� event; _t1; _t2; _v;1[
where _t1 and _t2 are parameters for the temporal locations at whichthe cloud event begins and ends, respectively, and _v is the param-eter for mean visibility computed over the time interval ½ _t1; _t2�.Situations for rainy cloud events consisted of the infon
s
����� rainy� cloud� event; _t1; _t2; _v; _p;1[
where _p is the parameter for mean precipitation computed over thetime interval ½ _t1; _t2�.
5.2. Results
Executing the application generated approximately 100 millionRDF triples for the period May 2007 through December 2011. At theobservation layer, approximately 4.5 million sensor observationswere generated frommeasurements for visibility and precipitation.These sensor observations were represented by approximately 67million RDF triples. At the derivation layer, approximately 2.5
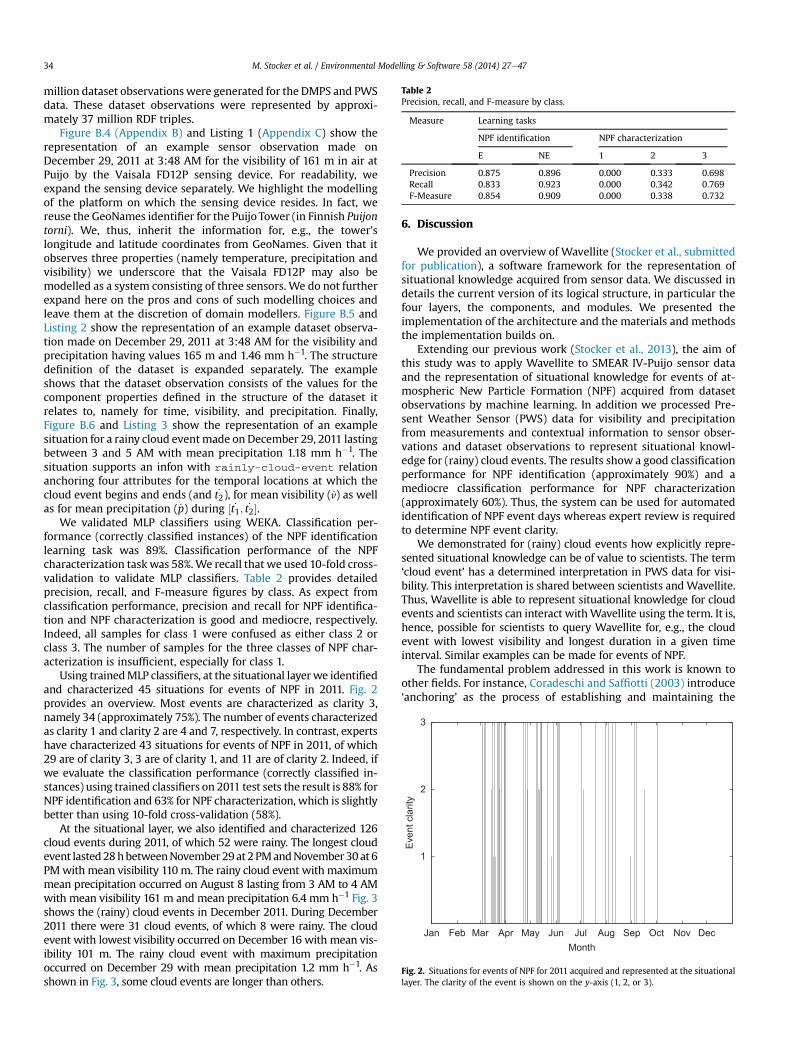
Table 2Precision, recall, and F-measure by class.
Measure Learning tasks
NPF identification NPF characterization
E NE 1 2 3
Precision 0.875 0.896 0.000 0.333 0.698Recall 0.833 0.923 0.000 0.342 0.769F-Measure 0.854 0.909 0.000 0.338 0.732
1
2
3
Jan Feb Mar Apr May Jun Jul Aug Sep Oct Nov Dec
Eve
nt c
larit
y
Month
Fig. 2. Situations for events of NPF for 2011 acquired and represented at the situationallayer. The clarity of the event is shown on the y-axis (1, 2, or 3).
M. Stocker et al. / Environmental Modelling & Software 58 (2014) 27e4734
million dataset observationswere generated for the DMPS and PWSdata. These dataset observations were represented by approxi-mately 37 million RDF triples.
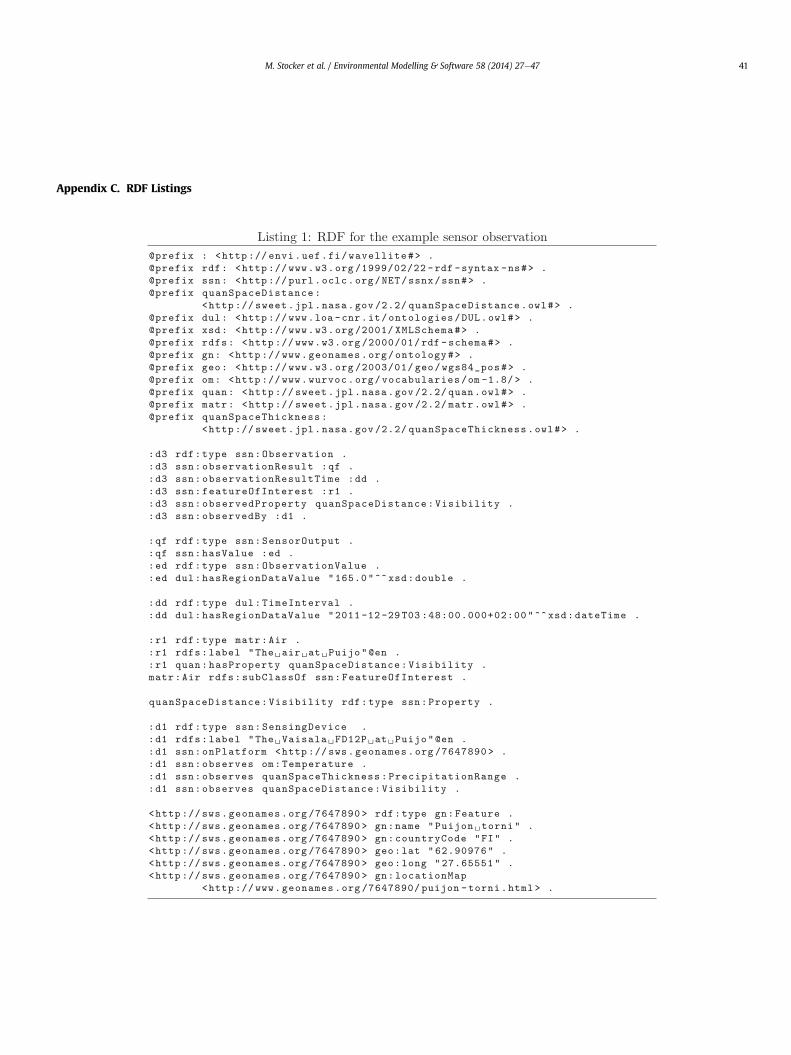
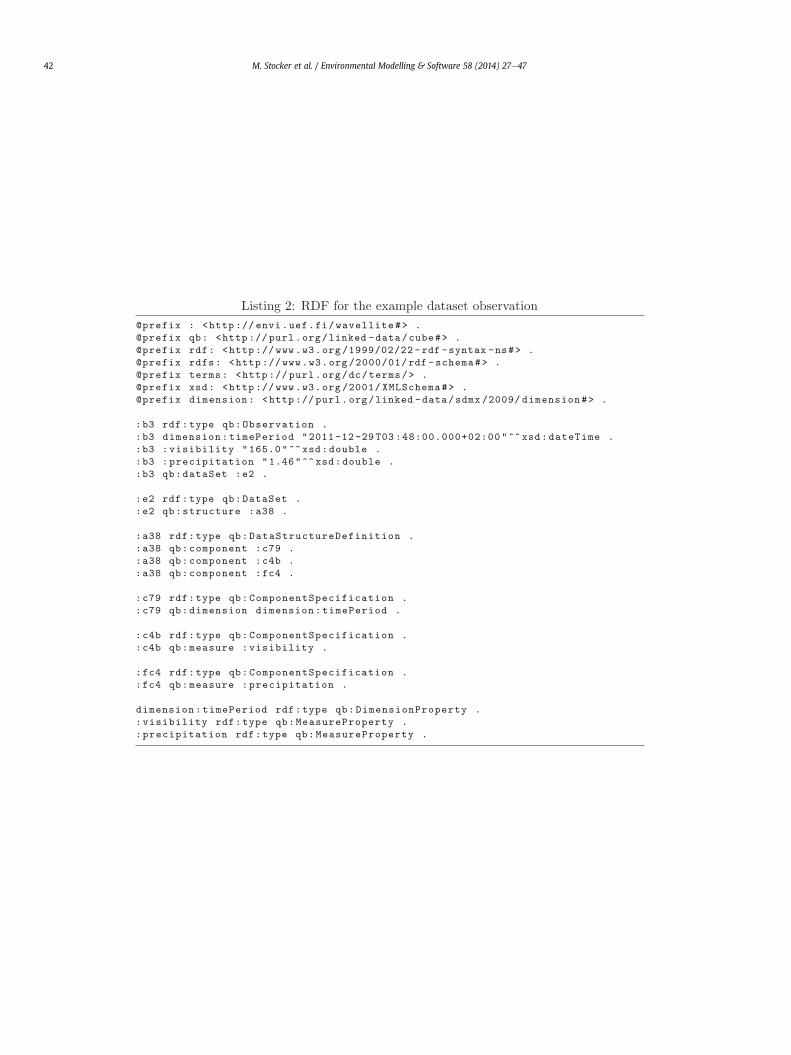
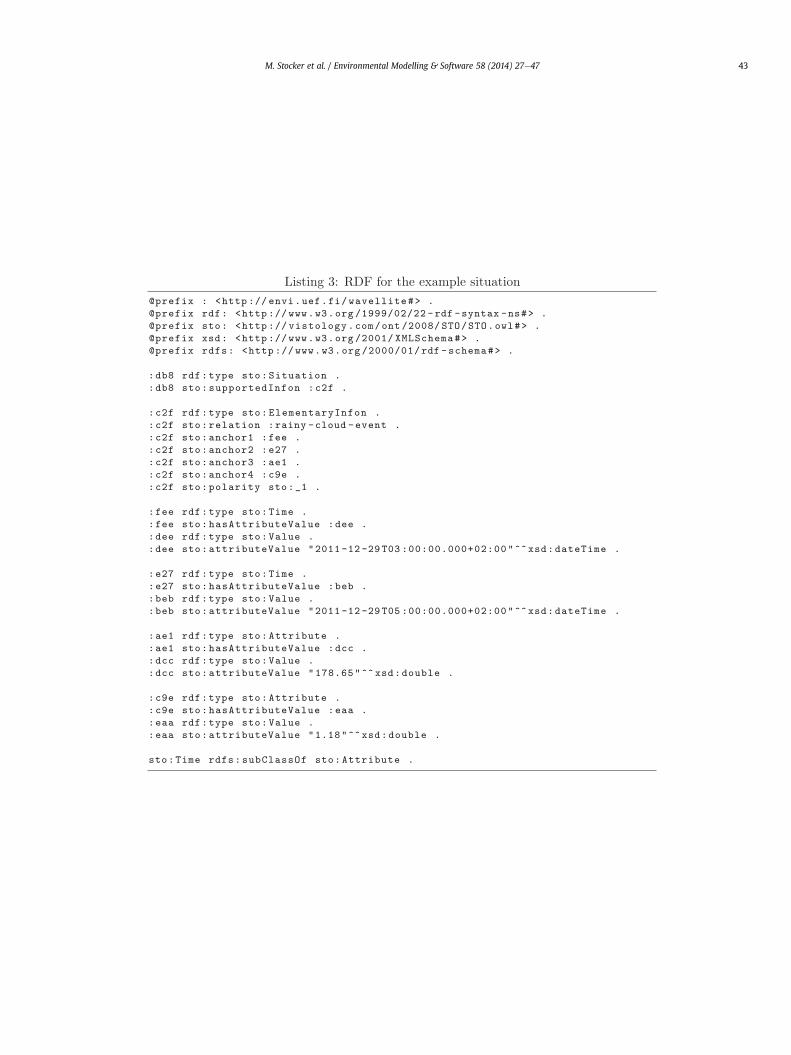
Figure B.4 (Appendix B) and Listing 1 (Appendix C) show therepresentation of an example sensor observation made onDecember 29, 2011 at 3:48 AM for the visibility of 161 m in air atPuijo by the Vaisala FD12P sensing device. For readability, weexpand the sensing device separately. We highlight the modellingof the platform on which the sensing device resides. In fact, wereuse the GeoNames identifier for the Puijo Tower (in Finnish Puijontorni). We, thus, inherit the information for, e.g., the tower’slongitude and latitude coordinates from GeoNames. Given that itobserves three properties (namely temperature, precipitation andvisibility) we underscore that the Vaisala FD12P may also bemodelled as a system consisting of three sensors. We do not furtherexpand here on the pros and cons of such modelling choices andleave them at the discretion of domain modellers. Figure B.5 andListing 2 show the representation of an example dataset observa-tion made on December 29, 2011 at 3:48 AM for the visibility andprecipitation having values 165 m and 1.46 mm h�1. The structuredefinition of the dataset is expanded separately. The exampleshows that the dataset observation consists of the values for thecomponent properties defined in the structure of the dataset itrelates to, namely for time, visibility, and precipitation. Finally,Figure B.6 and Listing 3 show the representation of an examplesituation for a rainy cloud eventmade on December 29, 2011 lastingbetween 3 and 5 AM with mean precipitation 1.18 mm h�1. Thesituation supports an infon with rainly-cloud-event relationanchoring four attributes for the temporal locations at which thecloud event begins and ends (and _t2), for mean visibility ( _v) as wellas for mean precipitation ( _p) during ½ _t1; _t2�.
We validated MLP classifiers using WEKA. Classification per-formance (correctly classified instances) of the NPF identificationlearning task was 89%. Classification performance of the NPFcharacterization taskwas 58%.We recall that we used 10-fold cross-validation to validate MLP classifiers. Table 2 provides detailedprecision, recall, and F-measure figures by class. As expect fromclassification performance, precision and recall for NPF identifica-tion and NPF characterization is good and mediocre, respectively.Indeed, all samples for class 1 were confused as either class 2 orclass 3. The number of samples for the three classes of NPF char-acterization is insufficient, especially for class 1.
Using trainedMLP classifiers, at the situational layerwe identifiedand characterized 45 situations for events of NPF in 2011. Fig. 2provides an overview. Most events are characterized as clarity 3,namely 34 (approximately 75%). The number of events characterizedas clarity 1 and clarity 2 are 4 and 7, respectively. In contrast, expertshave characterized 43 situations for events of NPF in 2011, of which29 are of clarity 3, 3 are of clarity 1, and 11 are of clarity 2. Indeed, ifwe evaluate the classification performance (correctly classified in-stances) using trained classifiers on 2011 test sets the result is 88% forNPF identification and 63% for NPF characterization, which is slightlybetter than using 10-fold cross-validation (58%).
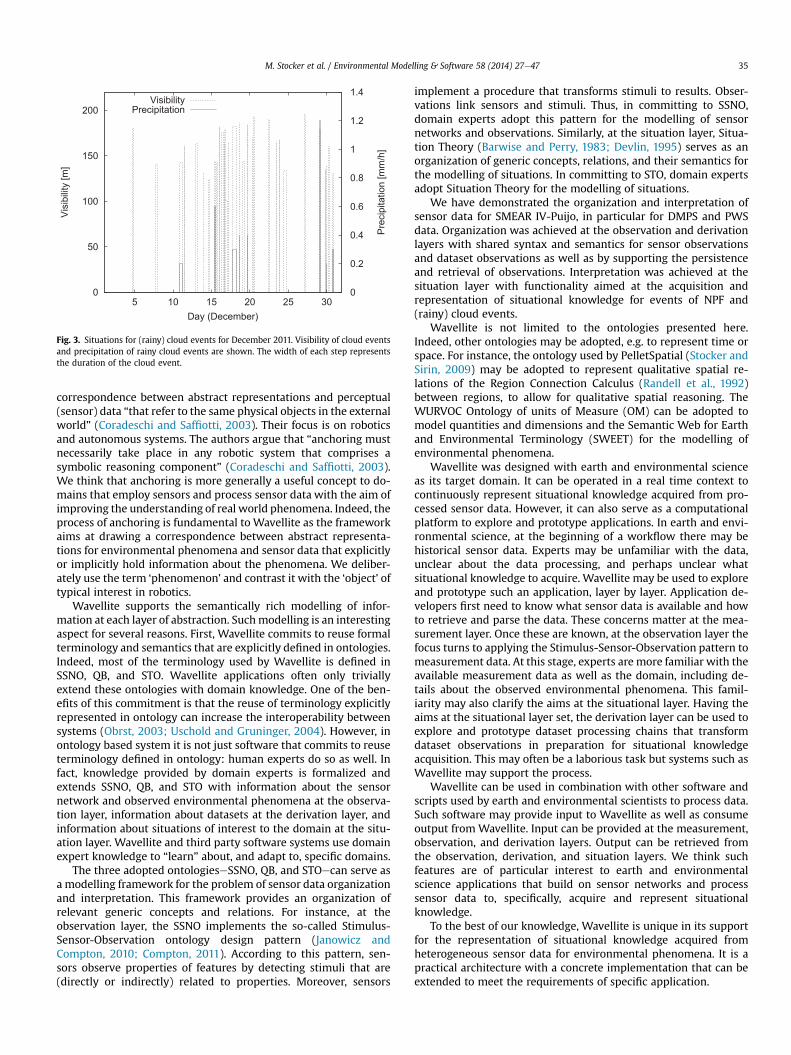
At the situational layer, we also identified and characterized 126cloud events during 2011, of which 52 were rainy. The longest cloudevent lasted28hbetweenNovember29 at 2PMandNovember30 at 6PMwith mean visibility 110 m. The rainy cloud event with maximummean precipitation occurred on August 8 lasting from 3 AM to 4 AMwith mean visibility 161 m and mean precipitation 6.4 mm h�1 Fig. 3shows the (rainy) cloud events in December 2011. During December2011 there were 31 cloud events, of which 8 were rainy. The cloudevent with lowest visibility occurred on December 16 with mean vis-ibility 101 m. The rainy cloud event with maximum precipitationoccurred on December 29 with mean precipitation 1.2 mm h�1. Asshown in Fig. 3, some cloud events are longer than others.
6. Discussion
We provided an overview of Wavellite (Stocker et al., submittedfor publication), a software framework for the representation ofsituational knowledge acquired from sensor data. We discussed indetails the current version of its logical structure, in particular thefour layers, the components, and modules. We presented theimplementation of the architecture and the materials and methodsthe implementation builds on.
Extending our previous work (Stocker et al., 2013), the aim ofthis study was to apply Wavellite to SMEAR IV-Puijo sensor dataand the representation of situational knowledge for events of at-mospheric New Particle Formation (NPF) acquired from datasetobservations by machine learning. In addition we processed Pre-sent Weather Sensor (PWS) data for visibility and precipitationfrom measurements and contextual information to sensor obser-vations and dataset observations to represent situational knowl-edge for (rainy) cloud events. The results show a good classificationperformance for NPF identification (approximately 90%) and amediocre classification performance for NPF characterization(approximately 60%). Thus, the system can be used for automatedidentification of NPF event days whereas expert review is requiredto determine NPF event clarity.
We demonstrated for (rainy) cloud events how explicitly repre-sented situational knowledge can be of value to scientists. The term‘cloud event’ has a determined interpretation in PWS data for visi-bility. This interpretation is shared between scientists andWavellite.Thus, Wavellite is able to represent situational knowledge for cloudevents and scientists can interact withWavellite using the term. It is,hence, possible for scientists to query Wavellite for, e.g., the cloudevent with lowest visibility and longest duration in a given timeinterval. Similar examples can be made for events of NPF.
The fundamental problem addressed in this work is known toother fields. For instance, Coradeschi and Saffiotti (2003) introduce‘anchoring’ as the process of establishing and maintaining the
0
50
100
150
200
5 10 15 20 25 30 0
0.2
0.4
0.6
0.8
1
1.2
1.4
Vis
ibili
ty [m
]
Pre
cipi
tatio
n [m
m/h
]
Day (December)
VisibilityPrecipitation
Fig. 3. Situations for (rainy) cloud events for December 2011. Visibility of cloud eventsand precipitation of rainy cloud events are shown. The width of each step representsthe duration of the cloud event.
M. Stocker et al. / Environmental Modelling & Software 58 (2014) 27e47 35
correspondence between abstract representations and perceptual(sensor) data “that refer to the same physical objects in the externalworld” (Coradeschi and Saffiotti, 2003). Their focus is on roboticsand autonomous systems. The authors argue that “anchoring mustnecessarily take place in any robotic system that comprises asymbolic reasoning component” (Coradeschi and Saffiotti, 2003).We think that anchoring is more generally a useful concept to do-mains that employ sensors and process sensor data with the aim ofimproving the understanding of real world phenomena. Indeed, theprocess of anchoring is fundamental to Wavellite as the frameworkaims at drawing a correspondence between abstract representa-tions for environmental phenomena and sensor data that explicitlyor implicitly hold information about the phenomena. We deliber-ately use the term ‘phenomenon’ and contrast it with the ‘object’ oftypical interest in robotics.
Wavellite supports the semantically rich modelling of infor-mation at each layer of abstraction. Suchmodelling is an interestingaspect for several reasons. First, Wavellite commits to reuse formalterminology and semantics that are explicitly defined in ontologies.Indeed, most of the terminology used by Wavellite is defined inSSNO, QB, and STO. Wavellite applications often only triviallyextend these ontologies with domain knowledge. One of the ben-efits of this commitment is that the reuse of terminology explicitlyrepresented in ontology can increase the interoperability betweensystems (Obrst, 2003; Uschold and Gruninger, 2004). However, inontology based system it is not just software that commits to reuseterminology defined in ontology: human experts do so as well. Infact, knowledge provided by domain experts is formalized andextends SSNO, QB, and STO with information about the sensornetwork and observed environmental phenomena at the observa-tion layer, information about datasets at the derivation layer, andinformation about situations of interest to the domain at the situ-ation layer. Wavellite and third party software systems use domainexpert knowledge to “learn” about, and adapt to, specific domains.
The three adopted ontologieseSSNO, QB, and STOecan serve asa modelling framework for the problem of sensor data organizationand interpretation. This framework provides an organization ofrelevant generic concepts and relations. For instance, at theobservation layer, the SSNO implements the so-called Stimulus-Sensor-Observation ontology design pattern (Janowicz andCompton, 2010; Compton, 2011). According to this pattern, sen-sors observe properties of features by detecting stimuli that are(directly or indirectly) related to properties. Moreover, sensors
implement a procedure that transforms stimuli to results. Obser-vations link sensors and stimuli. Thus, in committing to SSNO,domain experts adopt this pattern for the modelling of sensornetworks and observations. Similarly, at the situation layer, Situa-tion Theory (Barwise and Perry, 1983; Devlin, 1995) serves as anorganization of generic concepts, relations, and their semantics forthe modelling of situations. In committing to STO, domain expertsadopt Situation Theory for the modelling of situations.
We have demonstrated the organization and interpretation ofsensor data for SMEAR IV-Puijo, in particular for DMPS and PWSdata. Organization was achieved at the observation and derivationlayers with shared syntax and semantics for sensor observationsand dataset observations as well as by supporting the persistenceand retrieval of observations. Interpretation was achieved at thesituation layer with functionality aimed at the acquisition andrepresentation of situational knowledge for events of NPF and(rainy) cloud events.
Wavellite is not limited to the ontologies presented here.Indeed, other ontologies may be adopted, e.g. to represent time orspace. For instance, the ontology used by PelletSpatial (Stocker andSirin, 2009) may be adopted to represent qualitative spatial re-lations of the Region Connection Calculus (Randell et al., 1992)between regions, to allow for qualitative spatial reasoning. TheWURVOC Ontology of units of Measure (OM) can be adopted tomodel quantities and dimensions and the Semantic Web for Earthand Environmental Terminology (SWEET) for the modelling ofenvironmental phenomena.
Wavellite was designed with earth and environmental scienceas its target domain. It can be operated in a real time context tocontinuously represent situational knowledge acquired from pro-cessed sensor data. However, it can also serve as a computationalplatform to explore and prototype applications. In earth and envi-ronmental science, at the beginning of a workflow there may behistorical sensor data. Experts may be unfamiliar with the data,unclear about the data processing, and perhaps unclear whatsituational knowledge to acquire. Wavellite may be used to exploreand prototype such an application, layer by layer. Application de-velopers first need to know what sensor data is available and howto retrieve and parse the data. These concerns matter at the mea-surement layer. Once these are known, at the observation layer thefocus turns to applying the Stimulus-Sensor-Observation pattern tomeasurement data. At this stage, experts are more familiar with theavailable measurement data as well as the domain, including de-tails about the observed environmental phenomena. This famil-iarity may also clarify the aims at the situational layer. Having theaims at the situational layer set, the derivation layer can be used toexplore and prototype dataset processing chains that transformdataset observations in preparation for situational knowledgeacquisition. This may often be a laborious task but systems such asWavellite may support the process.
Wavellite can be used in combination with other software andscripts used by earth and environmental scientists to process data.Such software may provide input to Wavellite as well as consumeoutput from Wavellite. Input can be provided at the measurement,observation, and derivation layers. Output can be retrieved fromthe observation, derivation, and situation layers. We think suchfeatures are of particular interest to earth and environmentalscience applications that build on sensor networks and processsensor data to, specifically, acquire and represent situationalknowledge.
To the best of our knowledge, Wavellite is unique in its supportfor the representation of situational knowledge acquired fromheterogeneous sensor data for environmental phenomena. It is apractical architecture with a concrete implementation that can beextended to meet the requirements of specific application.
M. Stocker et al. / Environmental Modelling & Software 58 (2014) 27e4736
7. Related work
Work related to Wavellite can be organized along several lines.First, the work relates to other software architectures that aim atthe representation of knowledge acquired from sensor data. Sec-ond, Wavellite relates to the development of ontologies for sensornetworks and sensor data as well as the development of systems forthe semantic enrichment of sensor data. Third, it relates to workthat applies the SSNO, QB, or STO to domains that build on sensornetworks and sensor data. Fourth, our work relates to softwaresystems that manage, process, or mine sensor data and weredeveloped ad hoc for a specific domain and purpose, in particularthe study of atmospheric new particle formation.
Clemente et al. (2013) propose a software architecture aimed atcollision avoidance of ships in harbour areas. Their recent workrelates to previous work on a software architecture aimed at theidentification of, and reasoning about, situations (Furno et al., 2011)as well as the use of the STO to represent airport security situations(Fenza et al., 2010). The architecture presented by Clemente et al.(2013) relates to the one implemented by Wavellite in that,broadly speaking, both aim at the representation of situationalknowledge acquired from sensor data. Moreover, both architecturesleverage on the SSNO and Situation Theory. However, there areimportant differences. First, in contrast to Clemente et al. (2013)Wavellite suggests using a third ontology to model datasets and acorresponding layer at which arbitrary transformations on datasetscan be computed. Second, our target domain of application is earthand environmental sciences. Different domains pose different re-quirements on software systems with comparable aims. It isimportant to identify and characterize such differences. Third,Wavellite proposes a concrete implementation of its architectureand is released open source.
Gorrepati et al. (2013) propose a software architecture for se-mantic modelling of bird ecology. The architecture consists of aphysical layer (microphone array), an event layer (pattern match-ing, feature extraction, classification), a semantic layer (represen-tation of location, species, numbers), an awareness layer (modellingof movement, location, interaction, health), and a service layer (fortracking, behaviour, richness and diversity). Their work relates toWavellite in that raw sensor measurement data for the signal of aproperty (bird call) of a physical phenomenon (birds) is processedto knowledge for situations involving the phenomenon of interest.The work also relates to Wavellite in the target application domain.One of the main differences is that by building on generic termi-nology, Wavellite is reusable across applications. In fact, Gorrepatiet al. (2013) directly extend the top level concept owl:Thing
with domain specific terminology, e.g. Bird. Their modelling is,therefore, ad hoc for the semantic modelling of bird ecology.
As we briefly mentioned, our work also relates to the field ofrobotics, in particular to the notion of anchoring. In addition toCoradeschi and Saffiotti (2003) and Daoutis (2013), we highlightthe work by Vassev and Hinchey (2012). The authors underscorethat converting sensor data to symbolic knowledge is a challenge incognitive robotic systems. According to Vassev and Hinchey (2012),the raw sensor data of a robotic system for the measured propertiesof physical phenomena must be converted to “programming vari-ables or more complex data structures that represent collections ofsensory data” which “must be labelled with [knowledge repre-sentation] symbols.” Naturally, cognitive robotic systems have asubstantially different set of requirements and challengescompared to similar software systems designed for the organiza-tion and interpretation of environmental sensor network data.
The relevance of ontologies to sensor networks and sensor datais well documented in the literature. Sheth et al. (2008) present theSemantic Sensor Web in which sensor data is annotated with
spatial, temporal, and thematic semantic metadata. Terminologiesto describe the characteristics of sensors and sensor networks havereceived considerable attention (Avancha et al., 2004; Eid et al.,2006). Compton et al. (2009) review eleven sensor ontologies fortheir range and expressive power.
The semantic enrichment of sensor data has been studied.Moraru and Mladeni�c (2012) propose a framework that resemblesthe Wavellite measurement and observation layers. Wanner et al.(2011) present an environmental information system in whichenvironmental data, e.g. temperature measurements for a city, arestored in an OWL knowledge base. Barnaghi et al. (2009) propose asemantic model for (heterogeneous) sensor data representation,discussed using both XML and OWL. Wei and Barnaghi (2009)annotate sensor data with semantic metadata and relate sensordata with data of knowledge bases available online, such asDBpedia (Bizer et al., 2007), following the linked data principle(Berners-Lee, 2006). The principle has also been applied in worksthat aim at making sensor data accessible as linked data (Kesslerand Janowicz, 2010).
An advantage of the semantic enrichment of sensor data is thatsystems can leverage ontology and rule based reasoning to infer newknowledge from sensor data. This practice is well documented, forinstance by Sheth et al. (2008) to infer a ‘blizzard condition’; Hensonet al. (2009) to infer ‘highwinds’ observations; Stocker et al. (2011) toinfer the nutrient status of lakes; Wei and Barnaghi (2009) to inferthe approximate temperature for a city neighbouring another city forwhich the temperature is known. If a knowledge acquisition task onsensor data can be expressed using rule languages, representingsensor data in ontology is attractive, as it allows us to leverage thepowerful reasoning capabilities of inference engines. However, notall knowledge acquisition tasks on sensor data can be formalizedusing state of the art ontology and rule languages, e.g. the task of NPFidentification presented in this study.
Using the SSNO, Barnaghi et al. (2012) describe a frameworkaimed at creating perception from sensor data. The authors moti-vate their work by underscoring how data consumers “are ofteninterested in the higher-level concepts, such as events,” rather thanlow-level sensor data. Contrary to Barnaghi et al. (2012) and ourprevious work (Stocker et al., 2012a,b) herewemake use of the STOto represent knowledge at themost abstract level, leaving the SSNOat an intermediate level for the semantic enrichment of sensor data.Lefort et al. (2012) use the QB in combination with the SSNO tomodel a dataset with daily temperature sensor data. Their workrelates to the Wavellite observation and derivation layers. The cleardifference is the Wavellite situation layer. The STO has also beenused in various studies. Aside Fenza et al. (2010) who use the STO torepresent airport security situations, De Maio et al. (2012) presentan approach to identify situations represented using the STO andDoulaverakis et al. (2011) use the STO in an architecture for intel-ligent information fusion in a sensor network environment,demonstrated for the domain of security and surveillance. Incontrast, we suggest adopting the SSNO, QB, and STO at differentlevels of abstraction. Persistence of, and possibly inference on,sensor observations motivates the intermediate observation layerwhile arbitrary processing of dataset observations, as well as theirpersistence, motivates the intermediate derivation layer.
Wavellite relates to ad hoc systems that manage and processsensor data to organize such data, provide declarative query in-terfaces, and domain specific services, such as visualizations. Anexample related to this study is Smart-SMEAR (Junninen et al.,2009). Smart-SMEAR is a software system and Web interface forthe visualization of data measured at the SMEAR II station inHyytiälä, Finland. The measurement station has recorded data forgas, aerosol, and meteorological variables since 1996. Smart-SMEAR was designed and developed to manage the data, provide
M. Stocker et al. / Environmental Modelling & Software 58 (2014) 27e47 37
visualizations, support querying and export, as well as some datamining functionality. Junninen et al. (2009) provide some imple-mentation details. Of most interest here is that Smart-SMEARbuilds on classical relational database management technologies,specifically a MySQL database. As we discussed earlier, one of thekey advantages of ontology based systems such as Wavellite is thatthey reuse machine processable and interpretable terms and se-mantics defined explicitly in ontologies which can be shared acrossdomains of application. Hence, they support rich semanticmodelling of domain knowledge and increase the interoperabilitybetween human-machine systems.
The acquisition of knowledge for atmospheric new particleformation at the situation layer relates to work that applies datamining techniques on sensor data to study atmospheric new par-ticle formation. Hyvönen et al. (2005) used clustering and classifi-cation of SMEAR II sensor data to identify the key parameters thatexplain new particle formation. The authors found that just twoparameters, namely relative humidity and the condensation sink,are capable of explaining 88% of new particle formation events.Data mining techniques are relevant toWavellite learningmodules.However, with knowledge representation Wavellite goes clearlybeyond mere knowledge acquisition.
8. Conclusions
Using the Wavellite software framework (Stocker et al.,submitted for publication) for the organization and interpretationof sensor data and extending our previous work (Stocker et al.,2013), the aim of this study was to develop a Wavellite applica-tion for the representation of situational knowledge acquired fromdata by sensors of the Finnish Station for Measuring Ecosystem-Atmosphere Relations (SMEAR) for events of atmospheric newparticle formation and (rainy) cloud events.
Wavellite supports the processing of heterogeneous sensor datato sensor observations with homogeneous syntax and semantics;the mapping of sensor observations to dataset observations and theprocessing of datasets; the acquisition of situational knowledgefrom datasets; and the representation of situational knowledge.Wehave provided an overview of the current version of the logicalstructure of its architecture and thematerials andmethods adoptedby the implementation.
Our results show that Wavellite can be used to organize het-erogeneous sensor data, interpret sensor data, and represent situ-ational knowledge for atmospheric phenomena. Furthermore, theresults show that Wavellite can support scientists in the identifi-cation and characterization of atmospheric new particle formation.Knowledge automatically acquired and represented by Wavellitecan guide the manual review by scientists. The automated assess-ment can reduce the resources required in scientific computingworkflows as well as reduce individual bias in manual assessment.Moreover, the knowledge layer provided by Wavellite can be auseful resource to scientists. We have shown how situationalknowledge for (rainy) cloud events can be visualized and used tocompute statistics, such as the maximum duration of cloud eventsor maximum precipitation of rainy cloud events. Similar conclu-sions can be drawn for events of new particle formation.
Together with our previous work on Wavellite, namely torepresent situational knowledge acquired from road pavement vi-bration sensor data for vehicles (Stocker et al., 2012b) and situa-tional knowledge for the exposure to carbon monoxide in aresidential home (Stocker et al., 2012a), this study underscores thatWavellite provides a generic modelling framework for the problemof sensor data organization and interpretation. Its architecture in-cludes the key aspects of a generic solution, in particular themodelling of sensor observations, the modelling of dataset
observations, and the modelling of situational knowledge. Wave-llite frames the addressed problem and proposes a concrete ter-minology, approach, and technologies to build on.
To support the requirements of applications, the framework canbe extended with application specific program logic that includesalgorithms in, e.g., digital signal processing, complex event pro-cessing, or machine learning. Application specific knowledge isaccommodated by extension of three upper ontologies adopted inWavellite for the representation of knowledge about sensor net-works and sensor observations, the representation of datasets anddataset observations, and the representation of situational knowl-edge acquired from dataset observations. Knowledge is representedexplicitly using the terms and semantics defined in ontologies. WithSemantic Web technologies, Wavellite builds on open and de factostandard knowledge representation languages, on increasinglyknown and supported related software systems, and inherits thefunctionality for inference and query typically supported by systems.
Acknowledgement
We wish to thank the Finnish Funding Agency for Technologyand Innovation (TEKES) CLEEN SHOK programme “Measurement,Monitoring and environmental Assessment” for supporting thiswork (MMEA, decision number 427/10).
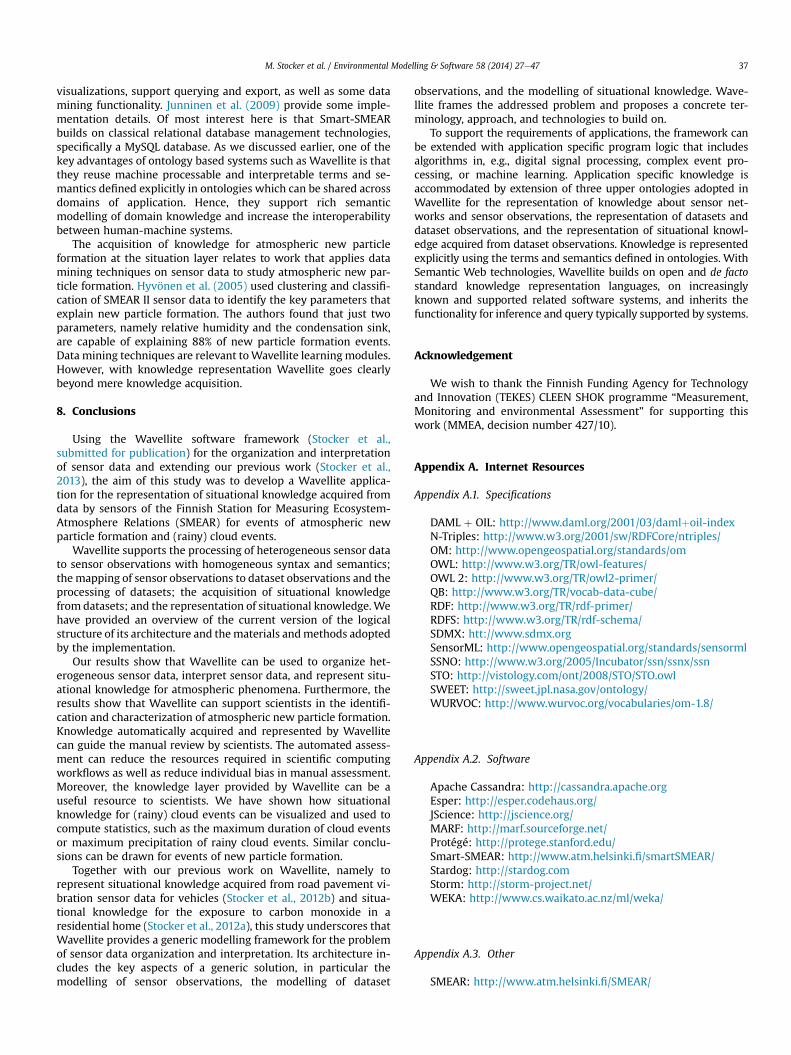
Appendix A. Internet Resources
Appendix A.1. Specifications
DAML þ OIL: http://www.daml.org/2001/03/damlþoil-indexN-Triples: http://www.w3.org/2001/sw/RDFCore/ntriples/OM: http://www.opengeospatial.org/standards/omOWL: http://www.w3.org/TR/owl-features/OWL 2: http://www.w3.org/TR/owl2-primer/QB: http://www.w3.org/TR/vocab-data-cube/RDF: http://www.w3.org/TR/rdf-primer/RDFS: http://www.w3.org/TR/rdf-schema/SDMX: htt://www.sdmx.orgSensorML: http://www.opengeospatial.org/standards/sensormlSSNO: http://www.w3.org/2005/Incubator/ssn/ssnx/ssnSTO: http://vistology.com/ont/2008/STO/STO.owlSWEET: http://sweet.jpl.nasa.gov/ontology/WURVOC: http://www.wurvoc.org/vocabularies/om-1.8/
Appendix A.2. Software
Apache Cassandra: http://cassandra.apache.orgEsper: http://esper.codehaus.org/JScience: http://jscience.org/MARF: http://marf.sourceforge.net/Protégé: http://protege.stanford.edu/Smart-SMEAR: http://www.atm.helsinki.fi/smartSMEAR/Stardog: http://stardog.comStorm: http://storm-project.net/WEKA: http://www.cs.waikato.ac.nz/ml/weka/
Appendix A.3. Other
SMEAR: http://www.atm.helsinki.fi/SMEAR/
Appendix B. RDF Graphs
Figure B.4. RDF graphs showing the representation of a sensor observation and the sensor that made the observation. The greyed nodes correspond to named individuals with UUIDfragment, here abbreviated for the sake of readability.
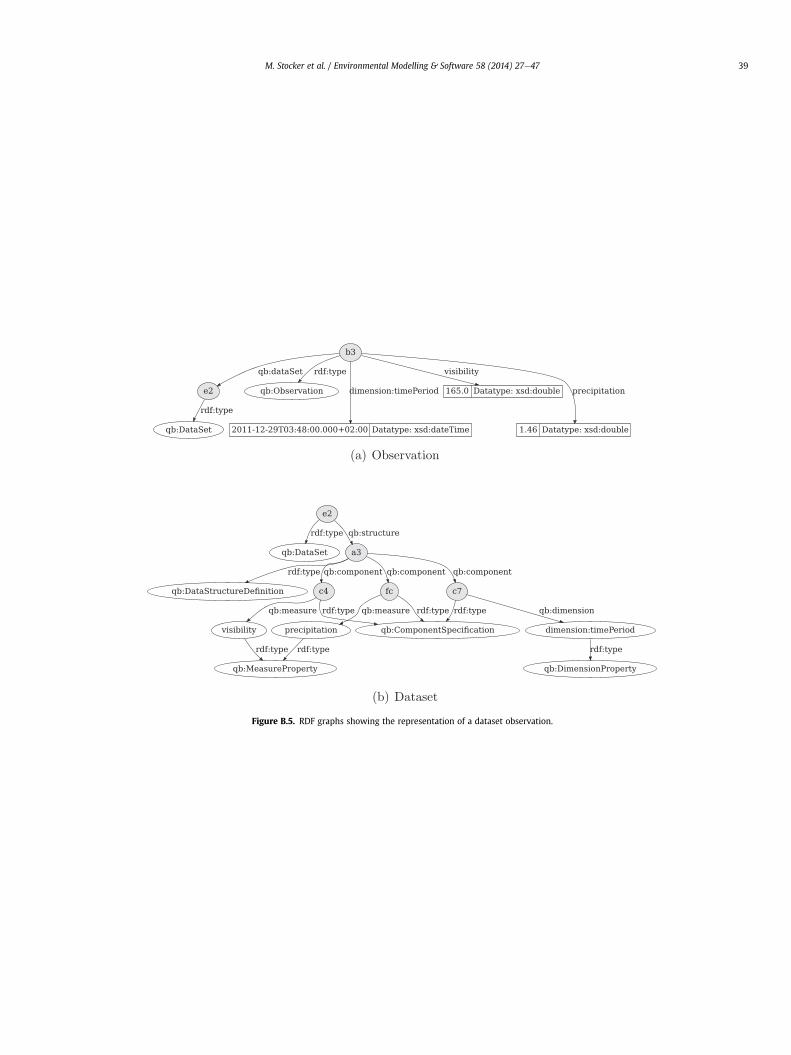
Figure B.5. RDF graphs showing the representation of a dataset observation.
M. Stocker et al. / Environmental Modelling & Software 58 (2014) 27e47 39
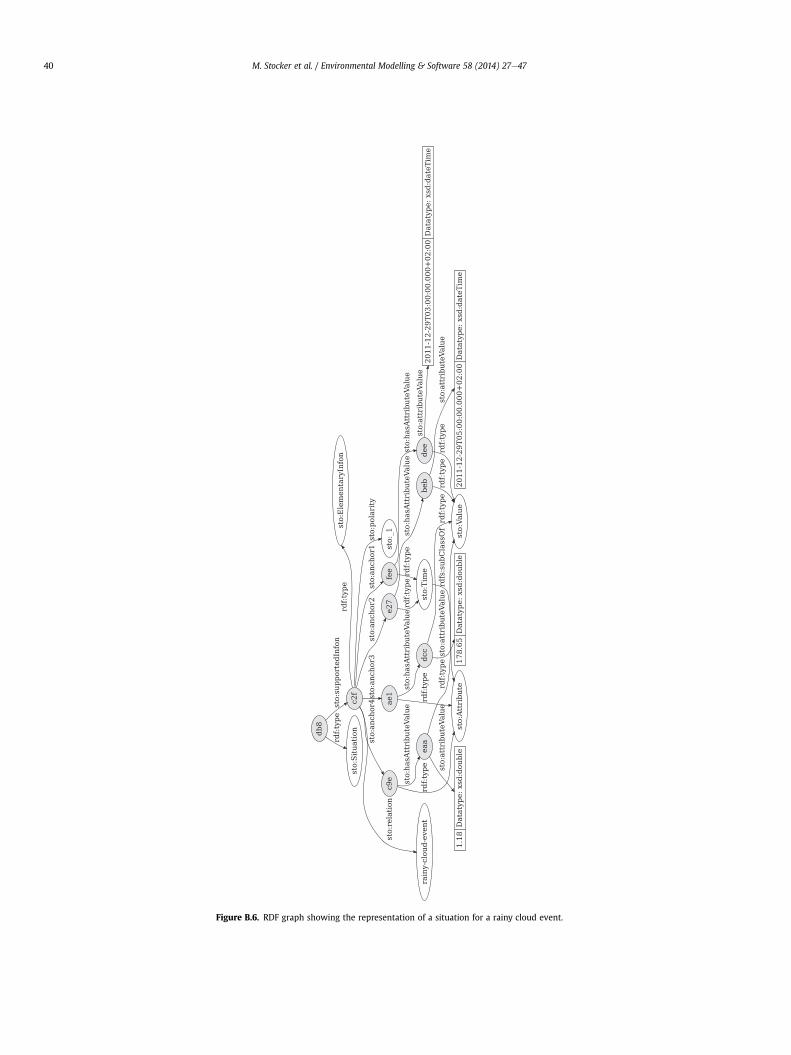
Figure B.6. RDF graph showing the representation of a situation for a rainy cloud event.
M. Stocker et al. / Environmental Modelling & Software 58 (2014) 27e4740
Appendix C. RDF Listings
M. Stocker et al. / Environmental Modelling & Software 58 (2014) 27e47 41
M. Stocker et al. / Environmental Modelling & Software 58 (2014) 27e4742
M. Stocker et al. / Environmental Modelling & Software 58 (2014) 27e47 43
Appendix D. Component Interfaces
Figure D.7. Interfaces of Wavellite components with emit and execute operations.
M. Stocker et al. / Environmental Modelling & Software 58 (2014) 27e4744
Appendix E. Application Implementation
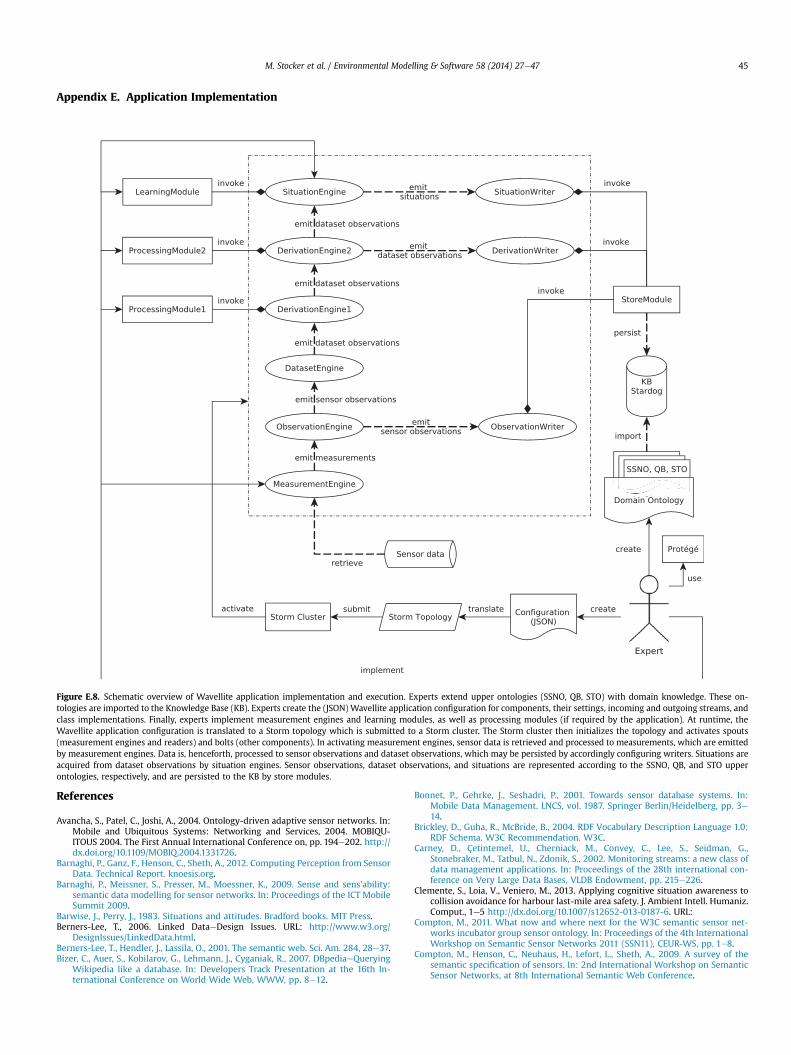
Figure E.8. Schematic overview of Wavellite application implementation and execution. Experts extend upper ontologies (SSNO, QB, STO) with domain knowledge. These on-tologies are imported to the Knowledge Base (KB). Experts create the (JSON) Wavellite application configuration for components, their settings, incoming and outgoing streams, andclass implementations. Finally, experts implement measurement engines and learning modules, as well as processing modules (if required by the application). At runtime, theWavellite application configuration is translated to a Storm topology which is submitted to a Storm cluster. The Storm cluster then initializes the topology and activates spouts(measurement engines and readers) and bolts (other components). In activating measurement engines, sensor data is retrieved and processed to measurements, which are emittedby measurement engines. Data is, henceforth, processed to sensor observations and dataset observations, which may be persisted by accordingly configuring writers. Situations areacquired from dataset observations by situation engines. Sensor observations, dataset observations, and situations are represented according to the SSNO, QB, and STO upperontologies, respectively, and are persisted to the KB by store modules.
M. Stocker et al. / Environmental Modelling & Software 58 (2014) 27e47 45
References
Avancha, S., Patel, C., Joshi, A., 2004. Ontology-driven adaptive sensor networks. In:Mobile and Ubiquitous Systems: Networking and Services, 2004. MOBIQU-ITOUS 2004. The First Annual International Conference on, pp. 194e202. http://dx.doi.org/10.1109/MOBIQ.2004.1331726.
Barnaghi, P., Ganz, F., Henson, C., Sheth, A., 2012. Computing Perception from SensorData. Technical Report. knoesis.org.
Barnaghi, P., Meissner, S., Presser, M., Moessner, K., 2009. Sense and sens’ability:semantic data modelling for sensor networks. In: Proceedings of the ICT MobileSummit 2009.
Barwise, J., Perry, J., 1983. Situations and attitudes. Bradford books. MIT Press.Berners-Lee, T., 2006. Linked DataeDesign Issues. URL: http://www.w3.org/
DesignIssues/LinkedData.html.Berners-Lee, T., Hendler, J., Lassila, O., 2001. The semantic web. Sci. Am. 284, 28e37.Bizer, C., Auer, S., Kobilarov, G., Lehmann, J., Cyganiak, R., 2007. DBpediaeQuerying
Wikipedia like a database. In: Developers Track Presentation at the 16th In-ternational Conference on World Wide Web, WWW, pp. 8e12.
Bonnet, P., Gehrke, J., Seshadri, P., 2001. Towards sensor database systems. In:Mobile Data Management. LNCS, vol. 1987. Springer Berlin/Heidelberg, pp. 3e14.
Brickley, D., Guha, R., McBride, B., 2004. RDF Vocabulary Description Language 1.0:RDF Schema. W3C Recommendation. W3C.
Carney, D., Çetintemel, U., Cherniack, M., Convey, C., Lee, S., Seidman, G.,Stonebraker, M., Tatbul, N., Zdonik, S., 2002. Monitoring streams: a new class ofdata management applications. In: Proceedings of the 28th international con-ference on Very Large Data Bases, VLDB Endowment, pp. 215e226.
Clemente, S., Loia, V., Veniero, M., 2013. Applying cognitive situation awareness tocollision avoidance for harbour last-mile area safety. J. Ambient Intell. Humaniz.Comput., 1e5 http://dx.doi.org/10.1007/s12652-013-0187-6. URL:
Compton, M., 2011. What now and where next for the W3C semantic sensor net-works incubator group sensor ontology. In: Proceedings of the 4th InternationalWorkshop on Semantic Sensor Networks 2011 (SSN11), CEUR-WS, pp. 1e8.
Compton, M., Henson, C., Neuhaus, H., Lefort, L., Sheth, A., 2009. A survey of thesemantic specification of sensors. In: 2nd International Workshop on SemanticSensor Networks, at 8th International Semantic Web Conference.
M. Stocker et al. / Environmental Modelling & Software 58 (2014) 27e4746
Conroy, K., May, G., Roantree, M., Warrington, G., Cullen, S.J., McGoldrick, A., 2011.Knowledge acquisition from sensor data in an equine environment. In: Pro-ceedings of the 13th international conference on data warehousing andknowledge discovery. Springer-Verlag, Berlin, Heidelberg, pp. 432e444.
Coradeschi, S., Saffiotti, A., 2003. An introduction to the anchoring problem. Ro-botics Aut. Syst. 43, 85e96. URL: http://www.sciencedirect.com/science/article/pii/S0921889003000216 http://dx.doi.org/10.1016/S0921-8890(03)00021-6.
Cyganiak, R., Reynolds, D., Tennison, J., 2013. The RDF Data Cube Vocabulary. W3CCandidate Recommendation. W3C.
Dal Maso, M., Kulmala, M., Riipinen, I., Wagner, R., Hussein, T., Aalto, P., Lehtinen, K.,2005. Formation and growth of fresh atmospheric aerosols: eight years ofaerosol size distribution data from SMEAR II, Hyytiala, Finland. Boreal Environ.Res. 10, 323e336.
Daoutis, M., 2013. Knowledge based perceptual anchoring. KI-Künstl. Intell., 1e4.De Maio, C., Fenza, G., Furno, D., Loia, V., 2012. Swarm-based semantic fuzzy
reasoning for situation awareness computing. In: Fuzzy Systems (FUZZ-IEEE),2012 IEEE International Conference on, pp. 1e7 http://dx.doi.org/10.1109/FUZZ-IEEE.2012.6251159.
Devlin, K., 1995. Logic and Information. Cambridge University Press.Doulaverakis, C., Konstantinou, N., Knape, T., Kompatsiaris, I., Soldatos, J., 2011. An
approach to intelligent information fusion in sensor saturated urban environ-ments. In: Intelligence and Security Informatics Conference (EISIC), 2011 Eu-ropean, pp. 108e115.
Eid, M., Liscano, R., El Saddik, A., 2006. A novel ontology for sensor networks data.In: Computational Intelligence for Measurement Systems and Applications,Proceedings of 2006 IEEE International Conference on, pp. 75e79. http://dx.doi.org/10.1109/CIMSA.2006.250753.
Fenza, G., Furno, D., Loia, V., Veniero, M., 2010. Agent-based cognitive approach toairport security situation awareness. In: Proceedings of the 2010 InternationalConference on Complex, Intelligent and Software Intensive Systems, IEEEComputer Society, pp. 1057e1062.
Finkelstein, L., 1982. Theory and Philosophy of Measurement. John Wiley & Sons.Furno, D., Loia, V., Veniero, M., Anisetti, M., Bellandi, V., Ceravolo, P., Damiani, E.,
2011. Towards an agent-based architecture for managing uncertainty in situa-tion awareness. In: Intelligent Agent (IA), 2011 IEEE Symposium on, pp. 1e6.http://dx.doi.org/10.1109/IA.2011.5953605.
Gaglio, S., Gatani, L., Lo Re, G., Ortolani, M., 2007. Understanding the environmentthrough wireless sensor networks. In: Proceedings of the 10th Congress of theItalian Association for Artificial Intelligence on AI*IA 2007: Artificial Intelligenceand Human-Oriented Computing. Springer-Verlag, Berlin, Heidelberg, pp. 72e83.
Gorrepati, R., Ali, S., Kim, D.H., 2013. Hierarchical semantic information modelingand ontology for bird ecology. Clust. Comput., 1e8 http://dx.doi.org/10.1007/s10586-013-0269-4. URL:
Gruber, T., 1993. A translation approach to portable ontology specifications. Knowl.Acquis. 5, 199e220.
Hall, M., Frank, E., Holmes, G., Pfahringer, B., Reutemann, P., Witten, I.H., 2009. TheWEKA data mining software: an update. In: SIGKDD Explorations.
Hamed, A., Joutsensaari, J., Mikkonen, S., Sogacheva, L., Dal Maso, M., Kulmala, M.,Cavalli, F., Fuzzi, S., Facchini, M., Decesari, S., et al., 2007. Nucleation and growthof new particles in Po Valley, Italy. Atmos. Chem. Phys. 7, 355e376.
Hand, D., Mannila, H., Smyth, P., 2001. Principles of Data Mining. A Bradford Book,Mit Press.
Hart, J.K., Martinez, K., 2006. Environmental sensor networks: a revolution in theearth system science? Earth-Sci. Rev. 78, 177e191. http://dx.doi.org/10.1016/j.earscirev.2006.05.001.
Hayes, P., McBride, B., 2004. RDF Semantics. W3C Recommendation. W3C.Haykin, S., 1999. Neural Networks: A Comprehensive Foundation. In: Prentice Hall
International Editions Series. Prentice Hall.Henson, C.A., Pschorr, J.K., Sheth, A.P., Thirunarayan, K., 2009. SemSOS: semantic
sensor observation service. In: Proceedings of the 2009 International Sympo-sium on Collaborative Technologies and Systems (CTS 2009), Baltimore, MD.
Hill, D.J., Liu, Y., Marini, L., Kooper, R., Rodriguez, A., Futrelle, J., Minsker, B.S.,Myers, J., McLaren, T., 2011. A virtual sensor system for user-generated, real-time environmental data products. Environ. Model. Softw. 26, 1710e1724http://dx.doi.org/10.1016/j.envsoft.2011.09.001. URL: http://www.sciencedirect.com/science/article/pii/S1364815211001988.
Hitzler, P., Krötzsch, M., Parsia, B., Patel-Schneider, P.F., Rudolph, S., 2012. OWL 2Web Ontology Language Primer, second ed. W3C Recommendation. W3C.
Horsburgh, J.S., Tarboton, D.G., Piasecki, M., Maidment, D.R., Zaslavsky, I.,Valentine, D., Whitenack, T., 2009. An integrated system for publishing envi-ronmental observations data. Environ. Model. Softw. 24, 879e888 http://dx.doi.org/10.1016/j.envsoft.2009.01.002. URL: http://www.sciencedirect.com/science/article/pii/S1364815209000036.
Hyvönen, S., Junninen, H., Laakso, L., Dal Maso, M., Grönholm, T., Bonn, B.,Keronen, P., Aalto, P., Hiltunen, V., Pohja, T., Launiainen, S., Hari, P., Mannila, H.,Kulmala, M., 2005. A look at aerosol formation using data mining techniques.Atmos. Chem. Phys. 5, 3345e3356 http://dx.doi.org/10.5194/acp-5-3345-2005.URL: http://www.atmos-chem-phys.net/5/3345/2005/.
Janowicz, K., Compton, M., 2010. The stimulus-sensor-observation ontology designpattern and its integration into the semantic sensor network ontology. In: The3rd International workshop on Semantic Sensor Networks, pp. 7e11.
Junninen, H., Lauri, A., Keronen, P., Aalto, P., 2009. Smart-SMEAR: on-line dataexploration and visualization tool for SMEAR stations. Boreal Environ. Res. 14,447e457.
Kessler, C., Janowicz, K., 2010. Linking sensor data e why, to what, and how? In:Taylor, K., Ayyagari, A., Roure, D.D. (Eds.), Proceedings of the 3rd Interna-tional Workshop on Semantic Sensor Networks (SSN10), CEUR-WS, Shanghai,China.
Kokar, M.M., Matheus, C.J., Baclawski, K., 2009. Ontology-based situation awareness.Inf. Fusion 10, 83e98.
Kulkarni, P., Baron, P.A., Willeke, K., 2011. Aerosol Measurement: Principles, Tech-niques, and Applications. Wiley.
Kulmala, M., Vehkamäki, H., Petäjä, T., Dal Maso, M., Lauri, A., Kerminen, V.,Birmili, W., McMurry, P., 2004. Formation and growth rates of ultrafine atmo-spheric particles: a review of observations. J. Aerosol Sci. 35, 143e176.
Lefort, L., Bobruk, J., Haller, A., Taylor, K., Woolf, A., 2012. A linked sensor data cubefor a 100 year homogenised daily temperature dataset. In: Henson, C., Taylor, K.,Corcho, O. (Eds.), Proceedings of the 5th International Workshop on SemanticSensor Networks, CEUR-WS, Boston, Massachusetts, pp. 1e16.
Leskinen, A., Portin, H., Komppula, M., Miettinen, P., Arola, A., Lihavainen, H.,Hatakka, J., Laaksonen, A., Lehtinen, K., 2009. Overview of the research activitiesand results at Puijo semi-urban measurement station. Boreal Env. Res. 14, 576e590.
Liu, J., Zhao, F., 2005. Towards semantic services for sensor-rich information sys-tems. In: Broadband Networks, 2005. BroadNets 2005. 2nd International Con-ference on, pp. 967e974 http://dx.doi.org/10.1109/ICBN.2005.1589709.
Luckham, D.C., 2002. The Power of Events, vol. 204. Addison-Wesley Reading.Madden, S., Franklin, M., 2002. Fjording the stream: an architecture for queries over
streaming sensor data. In: Data Engineering, 2002. Proceedings. 18th Interna-tional Conference on, pp. 555e566.
Manola, F., Miller, E., McBride, B., 2004. RDF Primer. W3C Recommendation. W3C.Mitchell, T., 1997. Machine Learning. McGraw-Hill, Boston, MA.Moraru, A., Mladeni�c, D., 2012. A framework for semantic enrichment of sensor
data. In: Information Technology Interfaces (ITI), Proceedings of the ITI 201234th International Conference on, pp. 155e160. http://dx.doi.org/10.2498/iti.2012.0481.
Obrst, L., 2003. Ontologies for semantically interoperable systems. In: Proceedingsof the twelfth international conference on Information and knowledge man-agement, ACM, New York, NY, USA, pp. 366e369. http://dx.doi.org/10.1145/956863.956932. URL.
Pope III, C.A., Burnett, R.T., Thun, M.J., Calle, E.E., Krewski, D., Ito, K., Thurston, G.D.,2002. Lung cancer, cardiopulmonary mortality, and long-term exposure to fineparticulate air pollution. JAMA: J. Am. Med. Assoc. 287, 1132e1141.
Prud’hommeaux, E., Seaborne, A., 2008. SPARQL Query Language for RDF. TechnicalReport W3C Recommendation. W3C.
Rabiner, L., Gold, B., 1975. Theory and Application of Digital Signal Processing. In:Prentice-Hall Signal Processing Series. Prentice-Hall.
Randell, D., Cui, Z., Cohn, A., 1992. A spatial logic based on regions and connec-tions. In: Nebel, B., Rich, C., Swartout, W. (Eds.), Principles of KnowledgeRepresentation and Reasoning. Morgan Kaufmann, San Mateo, CA, USA,pp. 165e176.
Raskin, R.G., Pan, M.J., 2005. Knowledge representation in the semantic web forEarth and environmental terminology (SWEET). Comput. Geosci. 31, 1119e1125.
Rijgersberg, H., Wigham, M., Top, J., 2011. How semantics can improve engineeringprocesses: a case of units of measure and quantities. Adv. Eng. Inform. 25, 276e287.
Sheth, A., Henson, C., Sahoo, S., 2008. Semantic sensor web. Internet computing.IEEE 12, 78e83. http://dx.doi.org/10.1109/MIC.2008.87.
Solomon, S., Qin, D., Manning, M., Chen, Z., Marquis, M., Averyt, K., Tignor, M.,M, H.L., 2007. Climate Change 2007: the Physical Science Basis. Contribution ofWorking Group I to the Fourth Assessment Report of the IntergovernmentalPanel on Climate Change. Cambridge University Press, Cambridge, UnitedKingdom and New York, NY, USA.
Stocker, M., Baranizadeh, E., Hamed, A., Rönkkö, M., Virtanen, A., Laaksonen, A.,Portin, H., Komppula, M., Kolehmainen, M., 2013. Acquisition and representa-tion of knowledge for atmospheric new particle formation. In: H�rebí�cek, J.,Schimak, G., Kubásek, M., Rizzoli, A.E. (Eds.), Environmental Software Systems,Fostering Information Sharing, IFIP Advances in Information and Communica-tion Technology, vol. 413. Springer, Boston, pp. 98e108.
Stocker, M., Rönkkö, M., Kolehmainen, M., 2012a. Making sense of sensor data usingontology: a discussion for residential building monitoring. In: Iliadis, L.,Maglogiannis, I., Papadopoulos, H., Karatzas, K., Sioutas, S. (Eds.), Artificial In-telligence Applications and Innovations, IFIP Advances in Information andCommunication Technology, vol. 382. Springer Boston, pp. 341e350.
Stocker, M., Rönkkö, M., Kolehmainen, M., 2012b. Making sense of sensor data usingontology: a discussion for road vehicle classification. In: Seppelt, R., Voinov, A.,Lange, S., Bankamp, D. (Eds.), 2012 International Congress on EnvironmentalModelling and Software, iEMSs, Leipzig, Germany, pp. 2387e2394.
Stocker, M., Rönkkö, M., Kolehmainen, M., 2013b. The wavellite modelling andsoftware framework for situation awareness in environmental monitoring.Environ. Monit. Assess. (submitted for publication).
Stocker, M., Rönkkö, M., Villa, F., Kolehmainen, M., 2011. The relevance of mea-surement data in environmental ontology learning. In: Environmental SoftwareSystems. Frameworks of Environment. IFIP Advances in Information andCommunication Technology, vol. 359. Springer Boston, pp. 445e453.
Stocker, M., Sirin, E., 2009. PelletSpatial: a hybrid RCC-8 and RDF/OWL reasoningand query engine. In: Hoekstra, R., Patel-Schneider, P.F. (Eds.), Proceedings ofthe 6th International Workshop on OWL: Experiences and Directions (OWLED2009), CEUR Workshop Proceedings, Chantilly, Virginia, USA.
M. Stocker et al. / Environmental Modelling & Software 58 (2014) 27e47 47
Uschold, M., Gruninger, M., 2004. Ontologies and semantics for seamless connec-tivity. SIGMOD Rec. 33, 58e64 http://dx.doi.org/10.1145/1041410.1041420. URL:
Vana, M., Ehn, M., Petäjä, T., Vuollekoski, H., Aalto, P., de Leeuw, G., Ceburnis, D.,O’Dowd, C.D., Kulmala, M., 2008. Characteristic features of air ions at MaceHead on the west coast of Ireland. Atmos. Res. 90, 278e286.
Vassev, E., Hinchey, M., 2012. Knowledge Representation for Cognitive RoboticSystems. In: 2012 15th IEEE International Symposium on Object/Component/Service-Oriented Real-Time Distributed Computing Workshops (ISORCW).IEEE, pp. 156e163.
Wanner, L., Vrochidis, S., Tonelli, S., Moßgraber, J., Bosch, H., Karppinen, A.,Myllynen, M., Rospocher, M., Bouayad-Agha, N., Bügel, U., Casamayor, G., Ertl, T.,Kompatsiaris, I., Koskentalo, T., Mille, S., Moumtzidou, A., Pianta, E., Saggion, H.,Serafini, L., Tarvainen, V., 2011. Building an environmental information systemfor personalized content delivery. In: Hrebícek, J., Schimak, G., Denzer, R. (Eds.),Environmental Software Systems. Frameworks of Environment, IFIP Advancesin Information and Communication Technology, vol. 359. Springer Boston,pp. 169e176.
Wei, W., Barnaghi, P., 2009. Semantic annotation and reasoning for sensor data.Smart Sens. Context, 66e76.
Whitehouse, K., Zhao, F., Liu, J., 2006. Semantic streams: a framework for com-posable semantic interpretation of sensor data. In: Römer, K., Karl, H.,Mattern, F. (Eds.), Wireless Sensor Networks, LNCS, vol. 3868. Springer Berlin/Heidelberg, pp. 5e20.
Wiedensohler, A., Birmili, W., Nowak, A., Sonntag, A., Weinhold, K., Merkel, M.,Wehner, B., Tuch, T., Pfeifer, S., Fiebig, M., Fjäraa, A.M., Asmi, E., Sellegri, K.,Depuy, R., Venzac, H., Villani, P., Laj, P., Aalto, P., Ogren, J.A., Swietlicki, E.,Williams, P., Roldin, P., Quincey, P., Hüglin, C., Fierz-Schmidhauser, R., Gysel, M.,Weingartner, E., Riccobono, F., Santos, S., Grüning, C., Faloon, K., Beddows, D.,Harrison, R., Monahan, C., Jennings, S.G., O’Dowd, C.D., Marinoni, A., Horn, H.G.,Keck, L., Jiang, J., Scheckman, J., McMurry, P.H., Deng, Z., Zhao, C.S.,Moerman, M., Henzing, B., de Leeuw, G., Löschau, G., Bastian, S., 2012. Mobilityparticle size spectrometers: harmonization of technical standards and datastructure to facilitate high quality long-term observations of atmospheric par-ticle number size distributions. Atmos. Meas. Tech. 5, 657e685 http://dx.doi.org/10.5194/amt-5-657-2012. URL: http://www.atmos-meas-tech.net/5/657/2012/.