Embed Size (px)
Citation preview
Research Report
Performance comparison between IB and non-IB school
students on the International Schools’ Assessment
Ling Tan
Australian Council for Educational Research
Report prepared for the International Baccalaureate by ACER February 2021
i
Table of Contents Table of Contents .......................................................................................................................................... i
List of Tables ii
List of Figures iii
EXECUTIVE SUMMARY ......................................................................................................................... 1
1. Project Overview ............................................................................................................... 4
1.1 Information on IB Schools and Students Participating in the ISA ............................................. 5
1.2 Methodology ............................................................................................................................ 7
2 Analysis of Student Performance ................................................................................... 10
2.1 How do PYP and MYP students compare to non-IB students from similar international
schools on the ISA assessment areas? .................................................................................... 10
2.2 What is the magnitude of the effect?..................................................................................... 13
2.2.1 Magnitude of Effect by Domain ..................................................................................................... 13
2.2.2 Magnitude of Effect by Sub-strand................................................................................................. 16
2.2.3 Magnitude of Effect by Region ....................................................................................................... 20
2.2.4 Country Analysis of Student Performance ...................................................................................... 26
2.3 How do the Grades 9 and 10 ISA scores of IB students align with PISA benchmarks? ........... 35
2.4 Effect of the Length of IB Authorization ................................................................................. 38
CONCLUSION .......................................................................................................................................... 40
REFERENCES .......................................................................................................................................... 42
Appendix 1: Boxplots of Non-modelled Performance of IB Students and Non-IB students by
Gender and by English-Speaking Background ............................................................. 43
Appendix 2: Regression Coefficients of IB Status from Multilevel Models ......................................... 45
Appendix 3: Regression Coefficients of IB Status from Multilevel Models by Region ....................... 47
Appendix 4: List of Countries by Regions ............................................................................................... 54
Appendix 5: Comparison of Effect Sizes by Country ............................................................................. 55
Appendix 6: Number of Students and Schools by Country ................................................................... 66
Appendix 7: ISA Sub-strand Description ................................................................................................ 75
ii
List of Tables
Table 1 Schools Programme Status .................................................................................................. 5
Table 2 IB and Non-IB Schools and Students .................................................................................. 6 Table 3 Distribution of IB and Non-IB Schools and Students by Region ........................................ 6 Table 4 Performance of IB and Non-IB Students in Mathematical Literacy ................................. 10
Table 5 Performance of IB and Non-IB Students in Reading ........................................................ 10 Table 6 Performance of IB and Non-IB Students in Narrative Writing ......................................... 11 Table 7 Performance of IB and Non-IB Students in Expository Writing ....................................... 11 Table 8 Performance of IB and Non-IB Students in Scientific Literacy ........................................ 11 Table 9 Comparison of Effect Sizes in Mathematical Literacy ...................................................... 13
Table 10 Comparison of Effect Sizes in Reading ............................................................................. 14 Table 11 Comparison of Effect Sizes in Narrative Writing .............................................................. 14 Table 12 Comparison of Effect Sizes in Expository Writing ........................................................... 15 Table 13 Comparison of Effect Sizes in Scientific Literacy ............................................................ 15 Table 14 Comparison of Effect Sizes by Mathematical Literacy Sub-strand ................................... 16
Table 15 Comparison of Effect Sizes by Reading Sub-strand .......................................................... 17
Table 16 Comparison of Effect Sizes by Narrative Writing Criteria ............................................... 18
Table 17 Comparison of Effect Sizes by Expository Writing Criteria ............................................. 18 Table 18 Comparison of Effect Sizes by Scientific Literacy Sub-strand ......................................... 19 Table 19 Comparison of Effect Sizes in Asia-Pacific ...................................................................... 20 Table 20 Comparison of Effect Sizes in Europe ............................................................................... 21
Table 21 Comparison of Effect Sizes in the Middle East ................................................................. 23 Table 22 Comparison of Effect Sizes in Africa ................................................................................ 24
Table 23 Comparison of Effect Sizes in the Americas ..................................................................... 25 Table 24 Summarised Comparison Results by Domain within a Country in Asia-Pacific .............. 29 Table 25 Summarise Comparison Results by Domain within a Country in Europe ........................ 31
Table 26 Summarise Comparison Results by Domain within a Country in the Middle East, Africa
and Americas 33
Table 27 IB Schools Grade 9 and Grade 10 Student Performance in Mathematical Literacy,
Reading and Scientific Literacy Relative to OECD PISA Performance ..................................................... 35
Table 28 Effect of Length of IB Authorization on ISA Performance .............................................. 39

iii
List of Figures
Figure 1 IB Schools Grade 9 and Grade 10 Performance in Mathematical Literacy ...................... 36
Figure 2 IB Schools Grade 9 and Grade 10 Performance in Reading ............................................. 37 Figure 3 IB Schools Grade 9 and Grade 10 Performance in Scientific Literacy ............................. 37
1
EXECUTIVE SUMMARY
This report examines the performance of students enrolled in the IB Primary Years Programme (PYP) and
the IB Middle Years Programme (MYP) on the ACER International Schools’ Assessment (ISA) compared
with non-IB students from the same ISA cohorts. The ISA is an assessment created especially for students
in international schools in Grades 3 to 10. The assessment asks both multiple-choice and open-ended
questions in the areas of writing, reading, mathematics and science, and provides international normative
information about student performance. The ISA scales for Reading, Mathematical Literacy and Scientific
Literacy are based on those developed for the internationally endorsed frameworks of the OECD's
Programme for International Student Assessment (PISA).
The IB – non-IB comparison studies, based on students who participated in the ISA were completed in
2009 and in 2011. The current study is a follow-up which was based on students who participated in ISA
assessments in 2017-18 and 2018-19. This study replicates previous studies using ISA October
2017/February 2018/May 2018 and October 2018/February 2019/May 2019 data. The analysis includes
analysis of student performance on five ISA assessment areas (Section 2.1), magnitude of effect by domain
(Section 2.2.1), magnitude of effect by sub-strand (Section 2.2.2), magnitude of effect by region (Section
2.2.3), country analysis of student performance (Section 2.2.4), PISA benchmark analysis (Section 2.3),
and multilevel analysis of effects on the length of IB authorization (Section 2.4).
For this study, in 2017-2019, of 445 schools participating in the administration of the ISA, a total of 189
PYP, 142 MYP and 148 DP schools were designated as authorised programmes. In this study, non-IB
schools were defined in two ways. A broad definition of non-IB international schools are the non-IB ISA
schools which are accredited by an association and/or have an ‘international focus’ to their curriculum
without necessarily being accredited by any particular organisation. A narrow definition of non-IB
international schools are the subset of the broad non-IB ISA schools that have a formal accreditation by an
international education board. In 2017-2019, a total of 179,198 international students participated in ISA
assessments, of which 41% were IB students, 57% were the non-IB students based on the broad definition,
and 55% were the non-IB students based on the narrow definition. By region, 43% of all students enrolled
at schools in the Asia-Pacific region, 20% of these students enrolled at schools in Europe, 27% of these
students enrolled at schools in the Middle East, and percentages of students enrolled at schools in Africa
and Americas were 5% and 6% respectively.
The key findings of this research project are summarised as follows. An analysis of student performance
among PYP and MYP students based on statistical significance test and Cohen’s d effect size showed
evidence that, on a global level, the PYP and the MYP students performed better than students from non-
IB schools in four of five ISA assessment domain areas in the majority of grade levels. The difference in
Expository Writing was significant at all grades with effect sizes ranging from 0.10 to 0.30 (comparisons
based on broad definition of non-IB students) and from 0.11 to 0.32 (comparisons based on narrow
definition of non-IB students), whereas the differences in Scientific Literacy were significant at Grades 7,
9 and 10 with effect sizes of 0.27, 0.33 and 0.61 respectively (comparisons based on broad definition of
non-IB students), and 0.33, 0.41 and 0.61 respectively (comparisons based on narrow definition of non-IB
students). No significant difference was found between the broad definition and the narrow definition of
non-IB students in the majority of IB and non-IB comparisons.
The analysis of ISA performance based on the Cohen’s d was followed by comparisons of magnitude of
effects against the results of two-level multilevel models, on a global level. After taking into account the
clustering at school level using the multilevel model, there is a lower number of significant differences
between IB and non-IB students from the results of multilevel models compared with the results from the
non-model-based Cohen's d. This is expected because the multilevel models would result in relatively larger
standard errors for estimated mean scores for IB and non-IB students. After further controlling for students’
gender and English-speaking background in the multilevel model, the magnitude of effects were found to
2
be mostly similar to those from the multilevel Model 1. The effect sizes between the two definitions of non-
IB students were also mostly similar for each multilevel model.
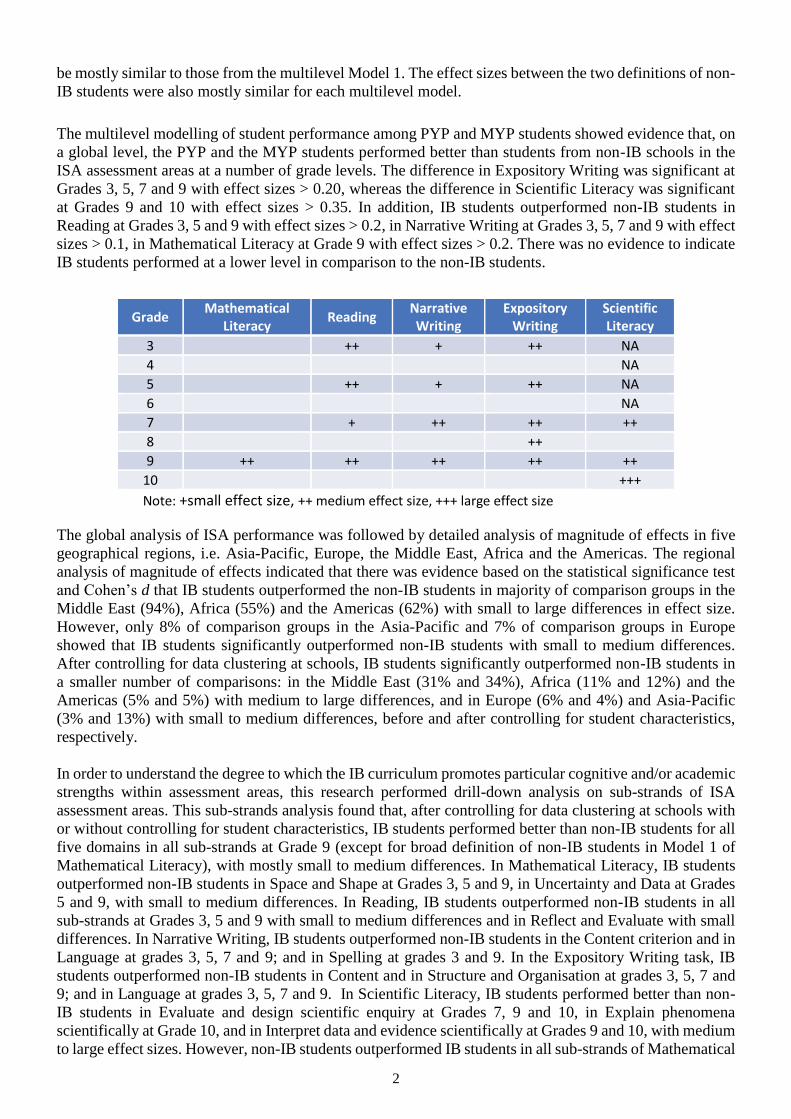
The multilevel modelling of student performance among PYP and MYP students showed evidence that, on
a global level, the PYP and the MYP students performed better than students from non-IB schools in the
ISA assessment areas at a number of grade levels. The difference in Expository Writing was significant at
Grades 3, 5, 7 and 9 with effect sizes > 0.20, whereas the difference in Scientific Literacy was significant
at Grades 9 and 10 with effect sizes > 0.35. In addition, IB students outperformed non-IB students in
Reading at Grades 3, 5 and 9 with effect sizes > 0.2, in Narrative Writing at Grades 3, 5, 7 and 9 with effect
sizes > 0.1, in Mathematical Literacy at Grade 9 with effect sizes > 0.2. There was no evidence to indicate
IB students performed at a lower level in comparison to the non-IB students.
Grade Mathematical
Literacy Reading
Narrative Writing
Expository Writing
Scientific Literacy
3 ++ + ++ NA
4 NA
5 ++ + ++ NA
6 NA
7 + ++ ++ ++
8 ++
9 ++ ++ ++ ++ ++
10 +++
Note: +small effect size, ++ medium effect size, +++ large effect size
The global analysis of ISA performance was followed by detailed analysis of magnitude of effects in five
geographical regions, i.e. Asia-Pacific, Europe, the Middle East, Africa and the Americas. The regional
analysis of magnitude of effects indicated that there was evidence based on the statistical significance test
and Cohen’s d that IB students outperformed the non-IB students in majority of comparison groups in the
Middle East (94%), Africa (55%) and the Americas (62%) with small to large differences in effect size.
However, only 8% of comparison groups in the Asia-Pacific and 7% of comparison groups in Europe
showed that IB students significantly outperformed non-IB students with small to medium differences.
After controlling for data clustering at schools, IB students significantly outperformed non-IB students in
a smaller number of comparisons: in the Middle East (31% and 34%), Africa (11% and 12%) and the
Americas (5% and 5%) with medium to large differences, and in Europe (6% and 4%) and Asia-Pacific
(3% and 13%) with small to medium differences, before and after controlling for student characteristics,
respectively.
In order to understand the degree to which the IB curriculum promotes particular cognitive and/or academic
strengths within assessment areas, this research performed drill-down analysis on sub-strands of ISA
assessment areas. This sub-strands analysis found that, after controlling for data clustering at schools with
or without controlling for student characteristics, IB students performed better than non-IB students for all
five domains in all sub-strands at Grade 9 (except for broad definition of non-IB students in Model 1 of
Mathematical Literacy), with mostly small to medium differences. In Mathematical Literacy, IB students
outperformed non-IB students in Space and Shape at Grades 3, 5 and 9, in Uncertainty and Data at Grades
5 and 9, with small to medium differences. In Reading, IB students outperformed non-IB students in all
sub-strands at Grades 3, 5 and 9 with small to medium differences and in Reflect and Evaluate with small
differences. In Narrative Writing, IB students outperformed non-IB students in the Content criterion and in
Language at grades 3, 5, 7 and 9; and in Spelling at grades 3 and 9. In the Expository Writing task, IB
students outperformed non-IB students in Content and in Structure and Organisation at grades 3, 5, 7 and
9; and in Language at grades 3, 5, 7 and 9. In Scientific Literacy, IB students performed better than non-
IB students in Evaluate and design scientific enquiry at Grades 7, 9 and 10, in Explain phenomena
scientifically at Grade 10, and in Interpret data and evidence scientifically at Grades 9 and 10, with medium
to large effect sizes. However, non-IB students outperformed IB students in all sub-strands of Mathematical
3
Literacy and Reading (except for Reflect and Evaluate) and in the language criteria of Narrative Writing at
Grade 10, with small to medium differences based on Cohen’s d. However, these differences were not
statistically significant based on the results of multilevel modelling.
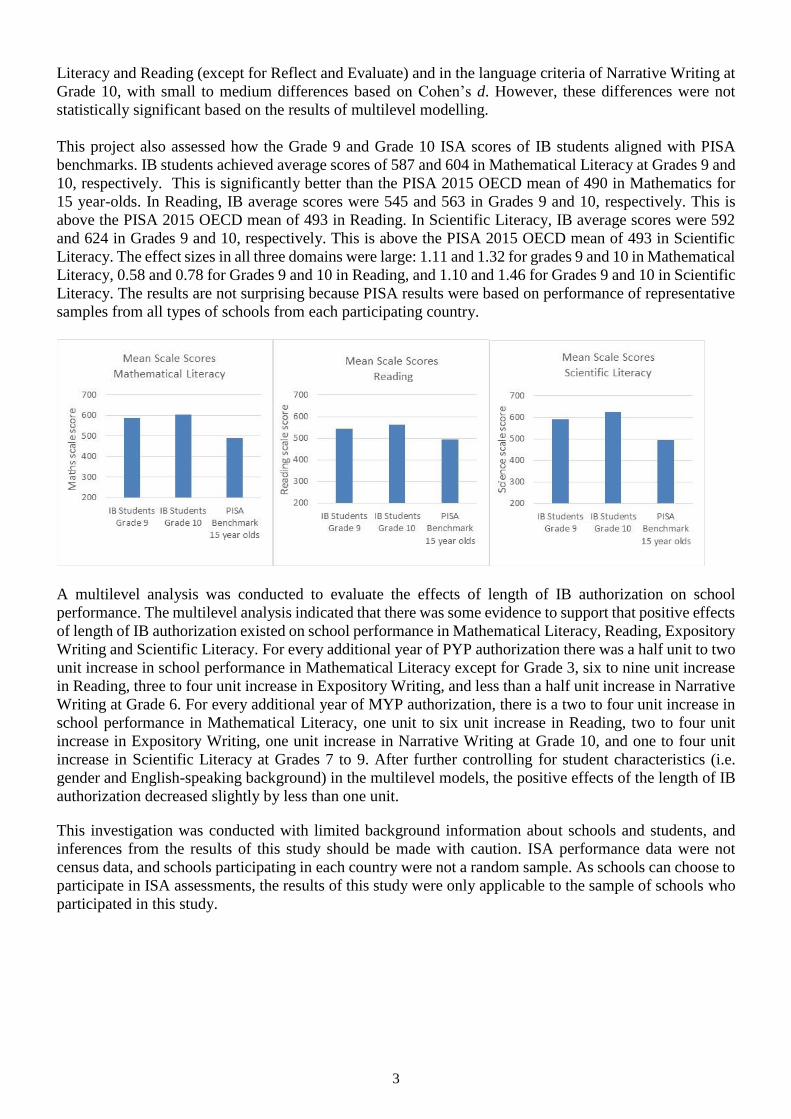
This project also assessed how the Grade 9 and Grade 10 ISA scores of IB students aligned with PISA
benchmarks. IB students achieved average scores of 587 and 604 in Mathematical Literacy at Grades 9 and
10, respectively. This is significantly better than the PISA 2015 OECD mean of 490 in Mathematics for
15 year-olds. In Reading, IB average scores were 545 and 563 in Grades 9 and 10, respectively. This is
above the PISA 2015 OECD mean of 493 in Reading. In Scientific Literacy, IB average scores were 592
and 624 in Grades 9 and 10, respectively. This is above the PISA 2015 OECD mean of 493 in Scientific
Literacy. The effect sizes in all three domains were large: 1.11 and 1.32 for grades 9 and 10 in Mathematical
Literacy, 0.58 and 0.78 for Grades 9 and 10 in Reading, and 1.10 and 1.46 for Grades 9 and 10 in Scientific
Literacy. The results are not surprising because PISA results were based on performance of representative
samples from all types of schools from each participating country.
A multilevel analysis was conducted to evaluate the effects of length of IB authorization on school
performance. The multilevel analysis indicated that there was some evidence to support that positive effects
of length of IB authorization existed on school performance in Mathematical Literacy, Reading, Expository
Writing and Scientific Literacy. For every additional year of PYP authorization there was a half unit to two
unit increase in school performance in Mathematical Literacy except for Grade 3, six to nine unit increase
in Reading, three to four unit increase in Expository Writing, and less than a half unit increase in Narrative
Writing at Grade 6. For every additional year of MYP authorization, there is a two to four unit increase in
school performance in Mathematical Literacy, one unit to six unit increase in Reading, two to four unit
increase in Expository Writing, one unit increase in Narrative Writing at Grade 10, and one to four unit
increase in Scientific Literacy at Grades 7 to 9. After further controlling for student characteristics (i.e.
gender and English-speaking background) in the multilevel models, the positive effects of the length of IB
authorization decreased slightly by less than one unit.
This investigation was conducted with limited background information about schools and students, and
inferences from the results of this study should be made with caution. ISA performance data were not
census data, and schools participating in each country were not a random sample. As schools can choose to
participate in ISA assessments, the results of this study were only applicable to the sample of schools who
participated in this study.
4
1. Project Overview
The International Baccalaureate (IB) offers a continuum of international education for children between the
ages of 3 and 19 years. The Primary Years Programme (PYP) is designed for students aged 3 to 12; the
Middle Years Programme (MYP) serves students aged 11 to 16; and the Diploma Programme (DP) is a
challenging two-year curriculum, primarily aimed at students aged 16 to 19. It leads to a qualification that
is widely recognized by the world’s leading universities. The IB curriculum was originally developed to
meet the needs of internationally mobile students. Although the IB curriculum is now offered in all types
of schools, many international schools continue to offer the IB curriculum.
The International Schools’ Assessment (ISA) is an assessment created especially for students in
international schools in Grades 3 to 10. The assessment asks both multiple-choice and open-ended
questions in the areas of writing, reading, mathematics and scientific literacy, and provides international
normative information about student performance. The Reading, Mathematical Literacy and Scientific
Literacy are based on the internationally endorsed reading, mathematical literacy and scientific literacy
frameworks of the OECD's Programme for International Student Assessment (PISA), respectively. The ISA
includes open-ended questions in Mathematical Literacy, Reading and Scientific Literacy, which require
students to construct responses, for example, to explain their reasoning, to find evidence or to justify their
opinion. Many of the schools participating in the ISA administration implement the IB curriculum,
providing an opportunity to examine the performance of PYP and MYP students in Grades 3 to 10.
This analysis is based on students who participated in the ISA in 2017-18 and 2018-19. There were three
sittings of ISA in each of these years; the first in October and the second and third sittings were in the
following year in February and May making a total of six sittings. This means that some students could be
represented in the analysis twice (i.e. in grade 3 for 2017-18, and again in grade 4 for 2018-19). As cross-
sectional analyses were performed for each grade level, a student would appear only once in any of these
analyses.
This research study compares performance of IB cohorts that participated in ISA with non-IB student
cohorts from the recent ISA data in 2017-18 and 2018-19 for Reading, Mathematical Literacy, Narrative
Writing, Expository Writing and Scientific Literacy. Scientific Literacy data for this period covers Grades
7-10 only. The replication study addresses the following research questions.
Q1. How do PYP and MYP students compare to non-IB students from similar international
schools on the ISA measures of mathematical literacy, reading, narrative writing, and expository
writing, at each grade level?
Q2. What is the magnitude of the effect?
IB and non-IB student performance by domain and sub-domain and by grade
IB and non-IB student performance by region and by country
Q3. How do IB students’ Grade 9 and Grade 10 ISA scores compare to PISA benchmarks in each
of the ISA domains?
Q4. To what degree is the length of IB implementation associated with ISA student performance
in IB schools?
5
1.1 Information on IB Schools and Students Participating in the ISA
For this study, the recent ISA assessment data from 2017-18 and 2018-19 data are merged with the IB’s
data on school authorization status, because schools may administer ISA tests every one or two years. The
data from 2019-20 are not used for this study because a number of schools did not participate the ISA
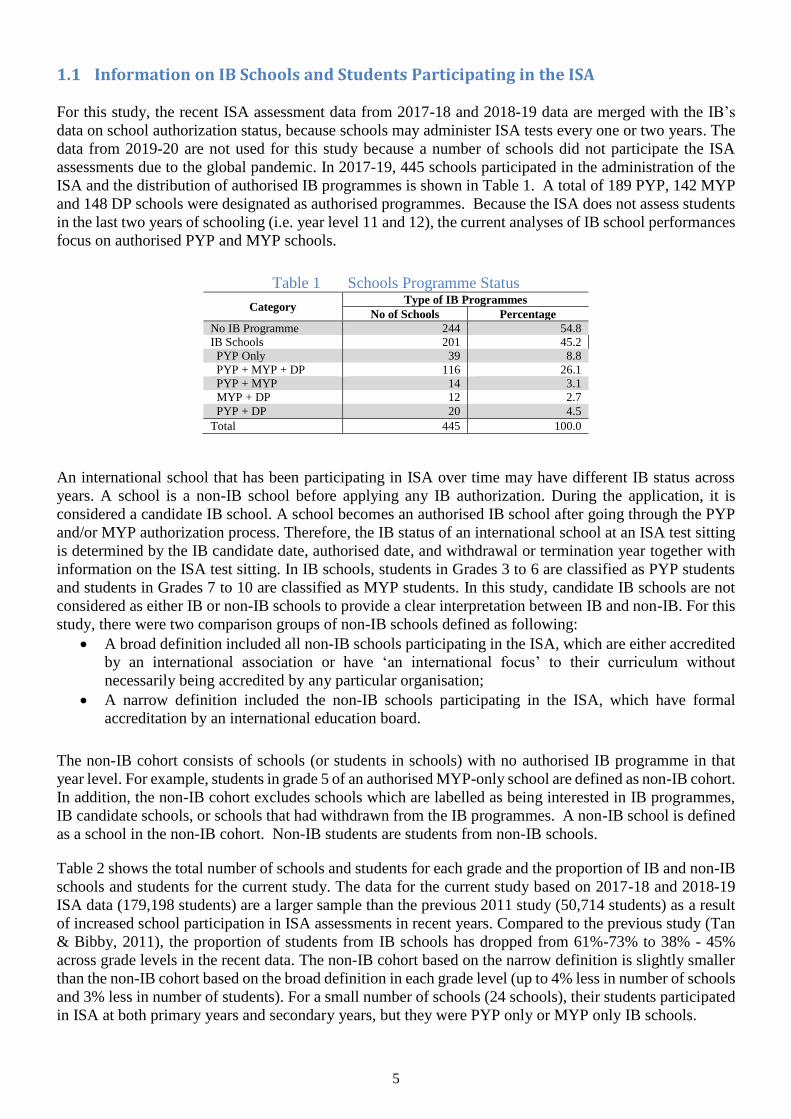
assessments due to the global pandemic. In 2017-19, 445 schools participated in the administration of the
ISA and the distribution of authorised IB programmes is shown in Table 1. A total of 189 PYP, 142 MYP
and 148 DP schools were designated as authorised programmes. Because the ISA does not assess students
in the last two years of schooling (i.e. year level 11 and 12), the current analyses of IB school performances
focus on authorised PYP and MYP schools.
Table 1 Schools Programme Status
Category Type of IB Programmes
No of Schools Percentage
No IB Programme 244 54.8
IB Schools 201 45.2
PYP Only 39 8.8
PYP + MYP + DP 116 26.1
PYP + MYP 14 3.1
MYP + DP 12 2.7
PYP + DP 20 4.5
Total 445 100.0
An international school that has been participating in ISA over time may have different IB status across
years. A school is a non-IB school before applying any IB authorization. During the application, it is
considered a candidate IB school. A school becomes an authorised IB school after going through the PYP
and/or MYP authorization process. Therefore, the IB status of an international school at an ISA test sitting
is determined by the IB candidate date, authorised date, and withdrawal or termination year together with
information on the ISA test sitting. In IB schools, students in Grades 3 to 6 are classified as PYP students
and students in Grades 7 to 10 are classified as MYP students. In this study, candidate IB schools are not
considered as either IB or non-IB schools to provide a clear interpretation between IB and non-IB. For this
study, there were two comparison groups of non-IB schools defined as following:
A broad definition included all non-IB schools participating in the ISA, which are either accredited
by an international association or have ‘an international focus’ to their curriculum without
necessarily being accredited by any particular organisation;
A narrow definition included the non-IB schools participating in the ISA, which have formal
accreditation by an international education board.
The non-IB cohort consists of schools (or students in schools) with no authorised IB programme in that
year level. For example, students in grade 5 of an authorised MYP-only school are defined as non-IB cohort.
In addition, the non-IB cohort excludes schools which are labelled as being interested in IB programmes,
IB candidate schools, or schools that had withdrawn from the IB programmes. A non-IB school is defined
as a school in the non-IB cohort. Non-IB students are students from non-IB schools.
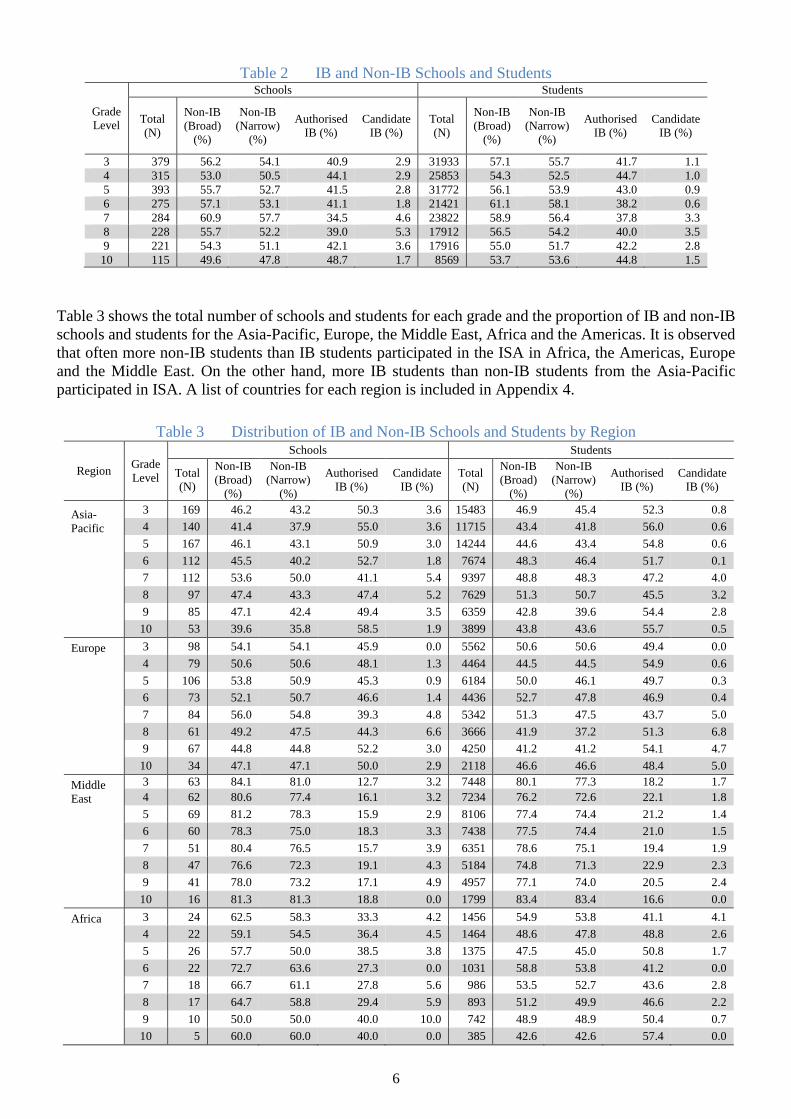
Table 2 shows the total number of schools and students for each grade and the proportion of IB and non-IB
schools and students for the current study. The data for the current study based on 2017-18 and 2018-19
ISA data (179,198 students) are a larger sample than the previous 2011 study (50,714 students) as a result
of increased school participation in ISA assessments in recent years. Compared to the previous study (Tan
& Bibby, 2011), the proportion of students from IB schools has dropped from 61%-73% to 38% - 45%
across grade levels in the recent data. The non-IB cohort based on the narrow definition is slightly smaller
than the non-IB cohort based on the broad definition in each grade level (up to 4% less in number of schools
and 3% less in number of students). For a small number of schools (24 schools), their students participated
in ISA at both primary years and secondary years, but they were PYP only or MYP only IB schools.
6
Table 2 IB and Non-IB Schools and Students
Grade
Level
Schools Students
Total
(N)
Non-IB
(Broad)
(%)
Non-IB
(Narrow)
(%)
Authorised
IB (%)
Candidate
IB (%)
Total
(N)
Non-IB
(Broad)
(%)
Non-IB
(Narrow)
(%)
Authorised
IB (%)
Candidate
IB (%)
3 379 56.2 54.1 40.9 2.9 31933 57.1 55.7 41.7 1.1
4 315 53.0 50.5 44.1 2.9 25853 54.3 52.5 44.7 1.0
5 393 55.7 52.7 41.5 2.8 31772 56.1 53.9 43.0 0.9
6 275 57.1 53.1 41.1 1.8 21421 61.1 58.1 38.2 0.6
7 284 60.9 57.7 34.5 4.6 23822 58.9 56.4 37.8 3.3
8 228 55.7 52.2 39.0 5.3 17912 56.5 54.2 40.0 3.5
9 221 54.3 51.1 42.1 3.6 17916 55.0 51.7 42.2 2.8
10 115 49.6 47.8 48.7 1.7 8569 53.7 53.6 44.8 1.5
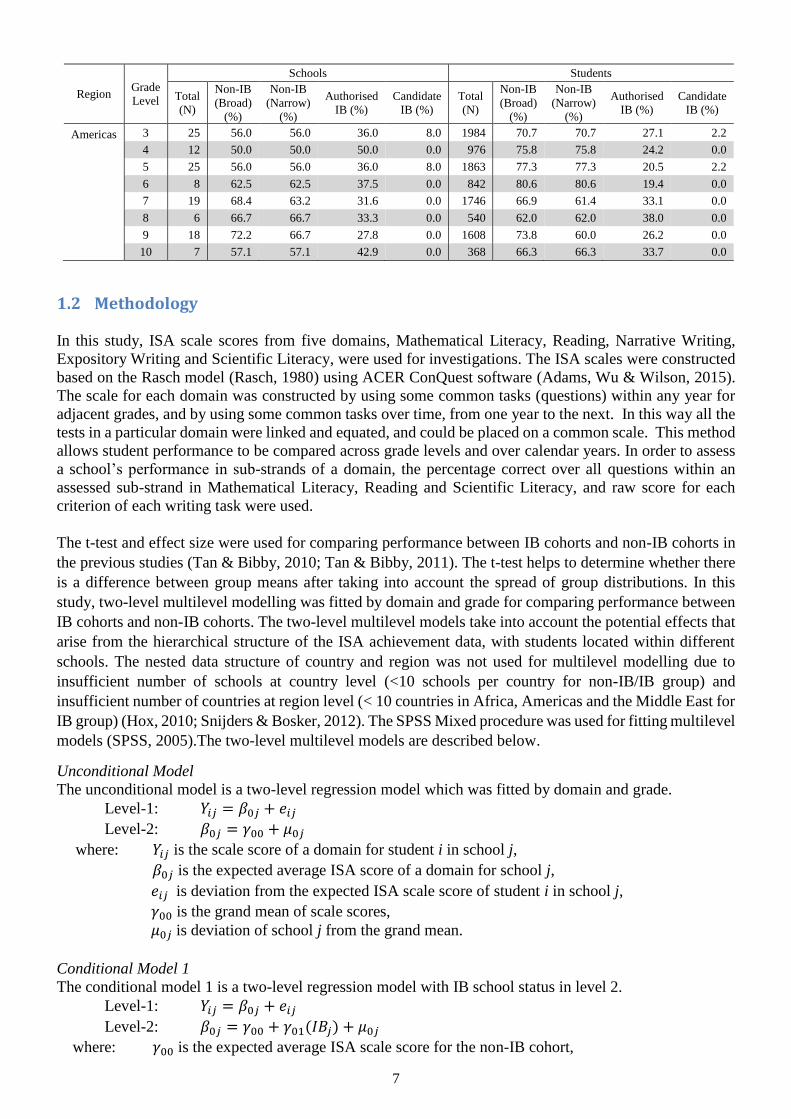
Table 3 shows the total number of schools and students for each grade and the proportion of IB and non-IB
schools and students for the Asia-Pacific, Europe, the Middle East, Africa and the Americas. It is observed
that often more non-IB students than IB students participated in the ISA in Africa, the Americas, Europe
and the Middle East. On the other hand, more IB students than non-IB students from the Asia-Pacific
participated in ISA. A list of countries for each region is included in Appendix 4.
Table 3 Distribution of IB and Non-IB Schools and Students by Region
Region Grade
Level
Schools Students
Total
(N)
Non-IB
(Broad)
(%)
Non-IB
(Narrow)
(%)
Authorised
IB (%)
Candidate
IB (%)
Total
(N)
Non-IB
(Broad)
(%)
Non-IB
(Narrow)
(%)
Authorised
IB (%)
Candidate
IB (%)
Asia-
Pacific
3 169 46.2 43.2 50.3 3.6 15483 46.9 45.4 52.3 0.8
4 140 41.4 37.9 55.0 3.6 11715 43.4 41.8 56.0 0.6
5 167 46.1 43.1 50.9 3.0 14244 44.6 43.4 54.8 0.6
6 112 45.5 40.2 52.7 1.8 7674 48.3 46.4 51.7 0.1
7 112 53.6 50.0 41.1 5.4 9397 48.8 48.3 47.2 4.0
8 97 47.4 43.3 47.4 5.2 7629 51.3 50.7 45.5 3.2
9 85 47.1 42.4 49.4 3.5 6359 42.8 39.6 54.4 2.8
10 53 39.6 35.8 58.5 1.9 3899 43.8 43.6 55.7 0.5
Europe 3 98 54.1 54.1 45.9 0.0 5562 50.6 50.6 49.4 0.0
4 79 50.6 50.6 48.1 1.3 4464 44.5 44.5 54.9 0.6
5 106 53.8 50.9 45.3 0.9 6184 50.0 46.1 49.7 0.3
6 73 52.1 50.7 46.6 1.4 4436 52.7 47.8 46.9 0.4
7 84 56.0 54.8 39.3 4.8 5342 51.3 47.5 43.7 5.0
8 61 49.2 47.5 44.3 6.6 3666 41.9 37.2 51.3 6.8
9 67 44.8 44.8 52.2 3.0 4250 41.2 41.2 54.1 4.7
10 34 47.1 47.1 50.0 2.9 2118 46.6 46.6 48.4 5.0
Middle
East
3 63 84.1 81.0 12.7 3.2 7448 80.1 77.3 18.2 1.7
4 62 80.6 77.4 16.1 3.2 7234 76.2 72.6 22.1 1.8
5 69 81.2 78.3 15.9 2.9 8106 77.4 74.4 21.2 1.4
6 60 78.3 75.0 18.3 3.3 7438 77.5 74.4 21.0 1.5
7 51 80.4 76.5 15.7 3.9 6351 78.6 75.1 19.4 1.9
8 47 76.6 72.3 19.1 4.3 5184 74.8 71.3 22.9 2.3
9 41 78.0 73.2 17.1 4.9 4957 77.1 74.0 20.5 2.4
10 16 81.3 81.3 18.8 0.0 1799 83.4 83.4 16.6 0.0
Africa 3 24 62.5 58.3 33.3 4.2 1456 54.9 53.8 41.1 4.1
4 22 59.1 54.5 36.4 4.5 1464 48.6 47.8 48.8 2.6
5 26 57.7 50.0 38.5 3.8 1375 47.5 45.0 50.8 1.7
6 22 72.7 63.6 27.3 0.0 1031 58.8 53.8 41.2 0.0
7 18 66.7 61.1 27.8 5.6 986 53.5 52.7 43.6 2.8
8 17 64.7 58.8 29.4 5.9 893 51.2 49.9 46.6 2.2
9 10 50.0 50.0 40.0 10.0 742 48.9 48.9 50.4 0.7
10 5 60.0 60.0 40.0 0.0 385 42.6 42.6 57.4 0.0
7
Region Grade
Level
Schools Students
Total
(N)
Non-IB
(Broad)
(%)
Non-IB
(Narrow)
(%)
Authorised
IB (%)
Candidate
IB (%)
Total
(N)
Non-IB
(Broad)
(%)
Non-IB
(Narrow)
(%)
Authorised
IB (%)
Candidate
IB (%)
Americas 3 25 56.0 56.0 36.0 8.0 1984 70.7 70.7 27.1 2.2
4 12 50.0 50.0 50.0 0.0 976 75.8 75.8 24.2 0.0
5 25 56.0 56.0 36.0 8.0 1863 77.3 77.3 20.5 2.2
6 8 62.5 62.5 37.5 0.0 842 80.6 80.6 19.4 0.0
7 19 68.4 63.2 31.6 0.0 1746 66.9 61.4 33.1 0.0
8 6 66.7 66.7 33.3 0.0 540 62.0 62.0 38.0 0.0
9 18 72.2 66.7 27.8 0.0 1608 73.8 60.0 26.2 0.0
10 7 57.1 57.1 42.9 0.0 368 66.3 66.3 33.7 0.0
1.2 Methodology
In this study, ISA scale scores from five domains, Mathematical Literacy, Reading, Narrative Writing,
Expository Writing and Scientific Literacy, were used for investigations. The ISA scales were constructed
based on the Rasch model (Rasch, 1980) using ACER ConQuest software (Adams, Wu & Wilson, 2015).
The scale for each domain was constructed by using some common tasks (questions) within any year for
adjacent grades, and by using some common tasks over time, from one year to the next. In this way all the
tests in a particular domain were linked and equated, and could be placed on a common scale. This method
allows student performance to be compared across grade levels and over calendar years. In order to assess
a school’s performance in sub-strands of a domain, the percentage correct over all questions within an
assessed sub-strand in Mathematical Literacy, Reading and Scientific Literacy, and raw score for each
criterion of each writing task were used.
The t-test and effect size were used for comparing performance between IB cohorts and non-IB cohorts in
the previous studies (Tan & Bibby, 2010; Tan & Bibby, 2011). The t-test helps to determine whether there
is a difference between group means after taking into account the spread of group distributions. In this
study, two-level multilevel modelling was fitted by domain and grade for comparing performance between
IB cohorts and non-IB cohorts. The two-level multilevel models take into account the potential effects that
arise from the hierarchical structure of the ISA achievement data, with students located within different
schools. The nested data structure of country and region was not used for multilevel modelling due to
insufficient number of schools at country level (<10 schools per country for non-IB/IB group) and
insufficient number of countries at region level (< 10 countries in Africa, Americas and the Middle East for
IB group) (Hox, 2010; Snijders & Bosker, 2012). The SPSS Mixed procedure was used for fitting multilevel
models (SPSS, 2005).The two-level multilevel models are described below.
Unconditional Model
The unconditional model is a two-level regression model which was fitted by domain and grade.
Level-1: 𝑌𝑖𝑗 = 𝛽0𝑗 + 𝑒𝑖𝑗
Level-2: 𝛽0𝑗 = 𝛾00 + 𝜇0𝑗
where: 𝑌𝑖𝑗 is the scale score of a domain for student i in school j,
𝛽0𝑗 is the expected average ISA score of a domain for school j,
𝑒𝑖𝑗 is deviation from the expected ISA scale score of student i in school j,
𝛾00 is the grand mean of scale scores,
𝜇0𝑗 is deviation of school j from the grand mean.
Conditional Model 1
The conditional model 1 is a two-level regression model with IB school status in level 2.
Level-1: 𝑌𝑖𝑗 = 𝛽0𝑗 + 𝑒𝑖𝑗
Level-2: 𝛽0𝑗 = 𝛾00 + 𝛾01(𝐼𝐵𝑗) + 𝜇0𝑗
where: 𝛾00 is the expected average ISA scale score for the non-IB cohort,
8
𝛾01 is the expected difference in scale score between the IB cohort and the non-IB cohort,
𝐼𝐵𝑗 is the IB status of a school j,
𝜇0𝑗 is deviation of school j from the conditional grand mean score
Conditional Model 2
The conditional model 2 is a two-level regression model with student gender and English-speaking
background (ESB) as covariate in level 1 and IB school status in level 2.
Level-1: 𝑌𝑖𝑗 = 𝛽0𝑗 + 𝛽1𝑗(𝐹𝑒𝑚𝑎𝑙𝑒𝑖𝑗) + 𝛽2𝑗(𝐸𝑆𝐵𝑖𝑗) + 𝑒𝑖𝑗
Level-2: 𝛽0𝑗 = 𝛾00 + 𝛾01(𝐼𝐵𝑗) + 𝜇0𝑗
𝛽1𝑗 = 𝛾10
𝛽2𝑗 = 𝛾20
where: 𝛽0𝑗 is the conditional mean ISA scale score for the male students from non-English
speaking background in school j,
𝛽1𝑗 is the expected difference in scale score between female students and male students,
𝛽2𝑗 is the expected difference in scale score between ESB students and non-ESB students,
𝑒𝑖𝑗 is deviation from the conditional mean ISA scale score of student i in school j,
𝛾00 is the conditional mean ISA scale score for the non-IB cohort,
𝛾01 is the expected difference in scale score between the IB cohort and the non-IB cohort,
𝐼𝐵𝑗 is the IB status of a school j,
𝜇0𝑗 is deviation of school j from the conditional grand mean score
In order to measure the magnitude of any difference, the effect size Cohen's d (Cohen, 1988) was calculated
as the difference between two means divided by a pooled standard deviation for the data:
p o o led
d
21
where 2
2
2
2
1
p o o led refers to pooled standard deviation, which is the root mean square of the two
standard deviations. When the two standard deviations are similar, the root mean square will be similar to
the simple average of the two variances. Effect size is independent of sample size. This value indicates
how much it is that the IB students are different from the comparable non-IB students. A small value close
to zero suggests it is likely that there is little difference in the mean performance of that IB cohort and the
ISA cohort. A large value suggests it is likely that the IB cohort and the ISA cohort are performing very
differently. The effect size value is categorised as follows: d < 0.1 indicates a negligible difference in
means, 0.1 ≤ d < 0.2 a small difference in means, 0.2 ≤ d < 0.5 a medium difference in means, and d ≥ 0.5
a large difference in means.
The magnitude of regression coefficients from the multilevel models is on the original scale of each ISA
domain. For the purpose of comparing to the effect sizes based on the non-model based Cohen’s d, the
regression coefficient of IB (i.e. 01) can be standardised by outcome variable (Lorah, 2018). In this report,
the regression of coefficient of IB was standardised by the pooled standard deviation.
The statistical significance level is set at 0.05 which is associated with a 95% confidence interval. A symbol
“+” was used to indicate that the performance of a subgroup from IB schools was statistically significantly
higher than the performance of a comparison group. A symbol “–” was used to indicate that the
performance of a subgroup from IB schools was statistically significantly lower than the performance of a
comparison group. In the tables of this report, estimates with medium to large effect sizes were highlighted
in bold. In addition, the following symbols were used to indicate group differences. For example, a symbol
“++” was used to indicate that the performance of a subgroup from IB schools was statistically significantly
higher than the performance of a comparison group, and the difference had a medium effect size.
9
+ Statistically significant difference (higher), small effect size (0.1 ≤ d < 0.2)
++ Statistically significant difference (higher), medium effect size (0.2 ≤ d < 0.5)
+++ Statistically significant difference (higher), large effect size (d ≥ 0.5)
– Statistically significant difference (lower), small effect size (0.1 ≤ d < 0.2)
– – Statistically significant difference (lower), medium effect size (0.2 ≤ d < 0.5)
– – – Statistically significant difference (lower), large effect size (d ≥ 0.5)
The intraclass correlation (ICC) was used to measure how strongly students in the same group resemble
each other. For multilevel models, clustering in data can be ignored if ICC and design effect across both IB
schools and non-IB schools in a grade are too small (ICC < 0.05 and design effect < 2) (Muthén & Satorra,
1995). Data analysis indicated that very small ICCs are usually caused by small number of schools (<4) in
either IB schools or non-IB schools. The ICC or the proportion of between-school variance, is calculated
as follows:
Proportion of Between School Variance =Between School Variance
Between School Variance + Within School Variance
10
2 Analysis of Student Performance
This section presents a series of analyses of ISA’s 2017-2018 and 2018-2019 data. The broad goals of these
analyses are to understand student performance on the ISA assessment areas among PYP and MYP
students, to understand magnitude of effect between IB students and non-IB students by domain and by
region, and to understand the degree to which the IB schools are associated with particular cognitive and/or
academic strengths within assessment areas.
2.1 How do PYP and MYP students compare to non-IB students from similar international schools on the ISA assessment areas?
This section shows the non-modelled average performance of IB and non-IB students in ISA Mathematical
Literacy, Reading, Narrative Writing, Expository Writing and Scientific Literacy by grade level. The
performance of non-IB students is reported for both the broad definition and the narrow definition. The
performance statistics (i.e. number of students, mean scale score, standard deviation of scale scores),
Cohen’s d and significance of difference are reported for the performance of IB and non-IB students.
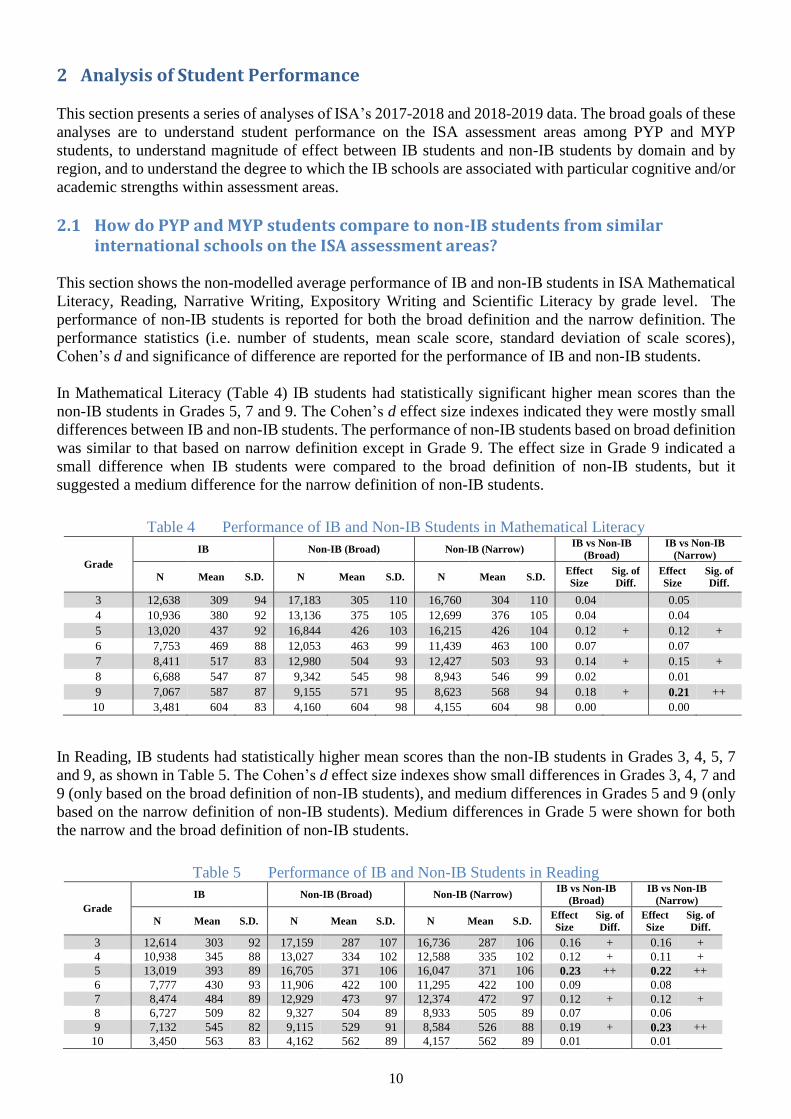
In Mathematical Literacy (Table 4) IB students had statistically significant higher mean scores than the
non-IB students in Grades 5, 7 and 9. The Cohen’s d effect size indexes indicated they were mostly small
differences between IB and non-IB students. The performance of non-IB students based on broad definition
was similar to that based on narrow definition except in Grade 9. The effect size in Grade 9 indicated a
small difference when IB students were compared to the broad definition of non-IB students, but it
suggested a medium difference for the narrow definition of non-IB students.
Table 4 Performance of IB and Non-IB Students in Mathematical Literacy
Grade
IB Non-IB (Broad) Non-IB (Narrow) IB vs Non-IB
(Broad)
IB vs Non-IB
(Narrow)
N Mean S.D. N Mean S.D. N Mean S.D. Effect
Size
Sig. of
Diff.
Effect
Size
Sig. of
Diff.
3 12,638 309 94 17,183 305 110 16,760 304 110 0.04 0.05
4 10,936 380 92 13,136 375 105 12,699 376 105 0.04 0.04
5 13,020 437 92 16,844 426 103 16,215 426 104 0.12 + 0.12 +
6 7,753 469 88 12,053 463 99 11,439 463 100 0.07 0.07
7 8,411 517 83 12,980 504 93 12,427 503 93 0.14 + 0.15 +
8 6,688 547 87 9,342 545 98 8,943 546 99 0.02 0.01
9 7,067 587 87 9,155 571 95 8,623 568 94 0.18 + 0.21 ++
10 3,481 604 83 4,160 604 98 4,155 604 98 0.00 0.00
In Reading, IB students had statistically higher mean scores than the non-IB students in Grades 3, 4, 5, 7
and 9, as shown in Table 5. The Cohen’s d effect size indexes show small differences in Grades 3, 4, 7 and
9 (only based on the broad definition of non-IB students), and medium differences in Grades 5 and 9 (only
based on the narrow definition of non-IB students). Medium differences in Grade 5 were shown for both
the narrow and the broad definition of non-IB students.
Table 5 Performance of IB and Non-IB Students in Reading
Grade
IB Non-IB (Broad) Non-IB (Narrow) IB vs Non-IB
(Broad)
IB vs Non-IB
(Narrow)
N Mean S.D. N Mean S.D. N Mean S.D. Effect
Size
Sig. of
Diff.
Effect
Size
Sig. of
Diff.
3 12,614 303 92 17,159 287 107 16,736 287 106 0.16 + 0.16 +
4 10,938 345 88 13,027 334 102 12,588 335 102 0.12 + 0.11 +
5 13,019 393 89 16,705 371 106 16,047 371 106 0.23 ++ 0.22 ++
6 7,777 430 93 11,906 422 100 11,295 422 100 0.09 0.08
7 8,474 484 89 12,929 473 97 12,374 472 97 0.12 + 0.12 +
8 6,727 509 82 9,327 504 89 8,933 505 89 0.07 0.06
9 7,132 545 82 9,115 529 91 8,584 526 88 0.19 + 0.23 ++
10 3,450 563 83 4,162 562 89 4,157 562 89 0.01 0.01
11
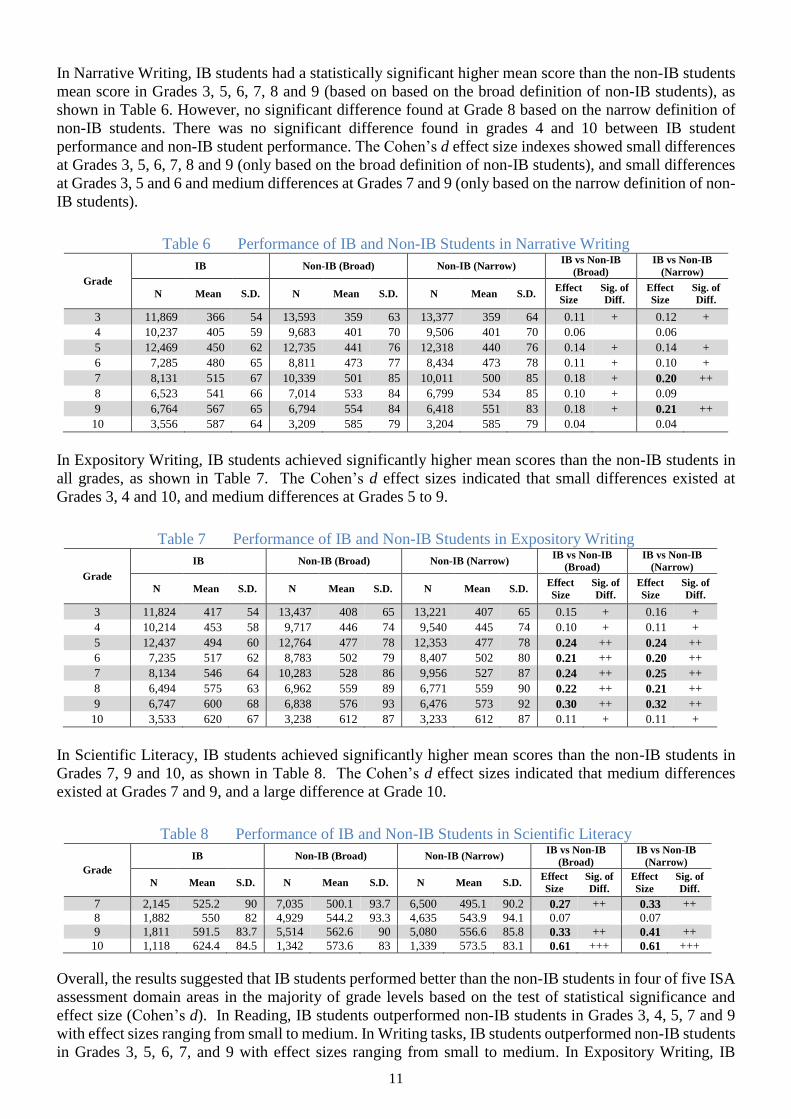
In Narrative Writing, IB students had a statistically significant higher mean score than the non-IB students
mean score in Grades 3, 5, 6, 7, 8 and 9 (based on based on the broad definition of non-IB students), as
shown in Table 6. However, no significant difference found at Grade 8 based on the narrow definition of
non-IB students. There was no significant difference found in grades 4 and 10 between IB student
performance and non-IB student performance. The Cohen’s d effect size indexes showed small differences
at Grades 3, 5, 6, 7, 8 and 9 (only based on the broad definition of non-IB students), and small differences
at Grades 3, 5 and 6 and medium differences at Grades 7 and 9 (only based on the narrow definition of non-
IB students).
Table 6 Performance of IB and Non-IB Students in Narrative Writing
Grade
IB Non-IB (Broad) Non-IB (Narrow) IB vs Non-IB
(Broad)
IB vs Non-IB
(Narrow)
N Mean S.D. N Mean S.D. N Mean S.D. Effect
Size
Sig. of
Diff.
Effect
Size
Sig. of
Diff.
3 11,869 366 54 13,593 359 63 13,377 359 64 0.11 + 0.12 +
4 10,237 405 59 9,683 401 70 9,506 401 70 0.06 0.06
5 12,469 450 62 12,735 441 76 12,318 440 76 0.14 + 0.14 +
6 7,285 480 65 8,811 473 77 8,434 473 78 0.11 + 0.10 +
7 8,131 515 67 10,339 501 85 10,011 500 85 0.18 + 0.20 ++
8 6,523 541 66 7,014 533 84 6,799 534 85 0.10 + 0.09
9 6,764 567 65 6,794 554 84 6,418 551 83 0.18 + 0.21 ++
10 3,556 587 64 3,209 585 79 3,204 585 79 0.04 0.04
In Expository Writing, IB students achieved significantly higher mean scores than the non-IB students in
all grades, as shown in Table 7. The Cohen’s d effect sizes indicated that small differences existed at
Grades 3, 4 and 10, and medium differences at Grades 5 to 9.
Table 7 Performance of IB and Non-IB Students in Expository Writing
Grade
IB Non-IB (Broad) Non-IB (Narrow) IB vs Non-IB
(Broad)
IB vs Non-IB
(Narrow)
N Mean S.D. N Mean S.D. N Mean S.D. Effect
Size
Sig. of
Diff.
Effect
Size
Sig. of
Diff.
3 11,824 417 54 13,437 408 65 13,221 407 65 0.15 + 0.16 +
4 10,214 453 58 9,717 446 74 9,540 445 74 0.10 + 0.11 +
5 12,437 494 60 12,764 477 78 12,353 477 78 0.24 ++ 0.24 ++
6 7,235 517 62 8,783 502 79 8,407 502 80 0.21 ++ 0.20 ++
7 8,134 546 64 10,283 528 86 9,956 527 87 0.24 ++ 0.25 ++
8 6,494 575 63 6,962 559 89 6,771 559 90 0.22 ++ 0.21 ++
9 6,747 600 68 6,838 576 93 6,476 573 92 0.30 ++ 0.32 ++
10 3,533 620 67 3,238 612 87 3,233 612 87 0.11 + 0.11 +
In Scientific Literacy, IB students achieved significantly higher mean scores than the non-IB students in
Grades 7, 9 and 10, as shown in Table 8. The Cohen’s d effect sizes indicated that medium differences
existed at Grades 7 and 9, and a large difference at Grade 10.
Table 8 Performance of IB and Non-IB Students in Scientific Literacy
Grade
IB Non-IB (Broad) Non-IB (Narrow) IB vs Non-IB
(Broad)
IB vs Non-IB
(Narrow)
N Mean S.D. N Mean S.D. N Mean S.D. Effect
Size
Sig. of
Diff.
Effect
Size
Sig. of
Diff.
7 2,145 525.2 90 7,035 500.1 93.7 6,500 495.1 90.2 0.27 ++ 0.33 ++
8 1,882 550 82 4,929 544.2 93.3 4,635 543.9 94.1 0.07 0.07
9 1,811 591.5 83.7 5,514 562.6 90 5,080 556.6 85.8 0.33 ++ 0.41 ++
10 1,118 624.4 84.5 1,342 573.6 83 1,339 573.5 83.1 0.61 +++ 0.61 +++
Overall, the results suggested that IB students performed better than the non-IB students in four of five ISA
assessment domain areas in the majority of grade levels based on the test of statistical significance and
effect size (Cohen’s d). In Reading, IB students outperformed non-IB students in Grades 3, 4, 5, 7 and 9
with effect sizes ranging from small to medium. In Writing tasks, IB students outperformed non-IB students
in Grades 3, 5, 6, 7, and 9 with effect sizes ranging from small to medium. In Expository Writing, IB
12
students achieved significantly higher mean scores than the non-IB students in Grades 4, 8 and 10 with
small to medium effect sizes. There was no significant difference found in Narrative Writing at Grades 4
and 10 between IB student performance and non-IB student performance. In Mathematical Literacy, IB
students performed better than non-IB students in Grades 5, 7 and 9 with mostly small effect sizes. In
Scientific Literacy, IB students performed better than non-IB students in Grades 7, 9 and 10 with effect
sizes ranging from medium to large. No significant difference was found between the broad definition and
the narrow definition of non-IB students in the majority of IB and non-IB comparisons.
13
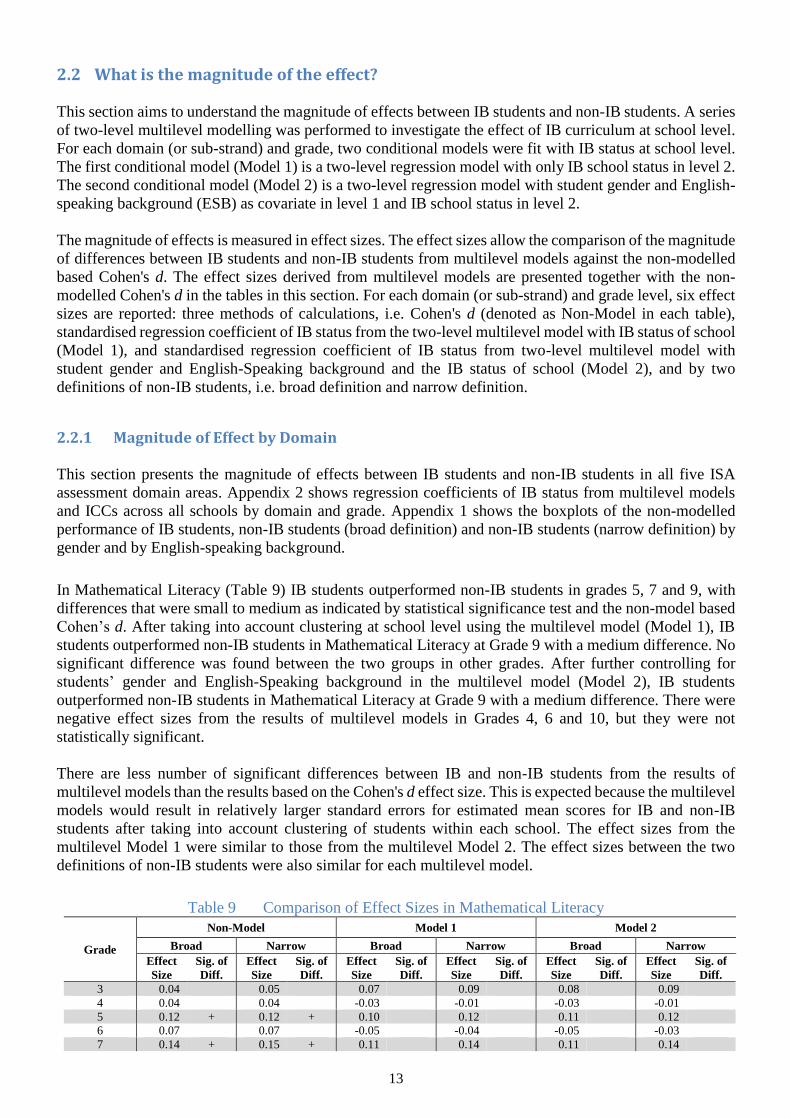
2.2 What is the magnitude of the effect?
This section aims to understand the magnitude of effects between IB students and non-IB students. A series
of two-level multilevel modelling was performed to investigate the effect of IB curriculum at school level.
For each domain (or sub-strand) and grade, two conditional models were fit with IB status at school level.
The first conditional model (Model 1) is a two-level regression model with only IB school status in level 2.
The second conditional model (Model 2) is a two-level regression model with student gender and English-
speaking background (ESB) as covariate in level 1 and IB school status in level 2.
The magnitude of effects is measured in effect sizes. The effect sizes allow the comparison of the magnitude
of differences between IB students and non-IB students from multilevel models against the non-modelled
based Cohen's d. The effect sizes derived from multilevel models are presented together with the non-
modelled Cohen's d in the tables in this section. For each domain (or sub-strand) and grade level, six effect
sizes are reported: three methods of calculations, i.e. Cohen's d (denoted as Non-Model in each table),
standardised regression coefficient of IB status from the two-level multilevel model with IB status of school
(Model 1), and standardised regression coefficient of IB status from two-level multilevel model with
student gender and English-Speaking background and the IB status of school (Model 2), and by two
definitions of non-IB students, i.e. broad definition and narrow definition.
2.2.1 Magnitude of Effect by Domain
This section presents the magnitude of effects between IB students and non-IB students in all five ISA
assessment domain areas. Appendix 2 shows regression coefficients of IB status from multilevel models
and ICCs across all schools by domain and grade. Appendix 1 shows the boxplots of the non-modelled
performance of IB students, non-IB students (broad definition) and non-IB students (narrow definition) by
gender and by English-speaking background.
In Mathematical Literacy (Table 9) IB students outperformed non-IB students in grades 5, 7 and 9, with
differences that were small to medium as indicated by statistical significance test and the non-model based
Cohen’s d. After taking into account clustering at school level using the multilevel model (Model 1), IB
students outperformed non-IB students in Mathematical Literacy at Grade 9 with a medium difference. No
significant difference was found between the two groups in other grades. After further controlling for
students’ gender and English-Speaking background in the multilevel model (Model 2), IB students
outperformed non-IB students in Mathematical Literacy at Grade 9 with a medium difference. There were
negative effect sizes from the results of multilevel models in Grades 4, 6 and 10, but they were not
statistically significant.
There are less number of significant differences between IB and non-IB students from the results of
multilevel models than the results based on the Cohen's d effect size. This is expected because the multilevel
models would result in relatively larger standard errors for estimated mean scores for IB and non-IB
students after taking into account clustering of students within each school. The effect sizes from the
multilevel Model 1 were similar to those from the multilevel Model 2. The effect sizes between the two
definitions of non-IB students were also similar for each multilevel model.
Table 9 Comparison of Effect Sizes in Mathematical Literacy
Grade
Non-Model Model 1 Model 2
Broad Narrow Broad Narrow Broad Narrow
Effect
Size
Sig. of
Diff.
Effect
Size
Sig. of
Diff.
Effect
Size
Sig. of
Diff.
Effect
Size
Sig. of
Diff.
Effect
Size
Sig. of
Diff.
Effect
Size
Sig. of
Diff.
3 0.04 0.05 0.07 0.09 0.08 0.09
4 0.04 0.04 -0.03 -0.01 -0.03 -0.01
5 0.12 + 0.12 + 0.10 0.12 0.11 0.12
6 0.07 0.07 -0.05 -0.04 -0.05 -0.03
7 0.14 + 0.15 + 0.11 0.14 0.11 0.14
14
8 0.02 0.01 0.03 0.05 0.03 0.05
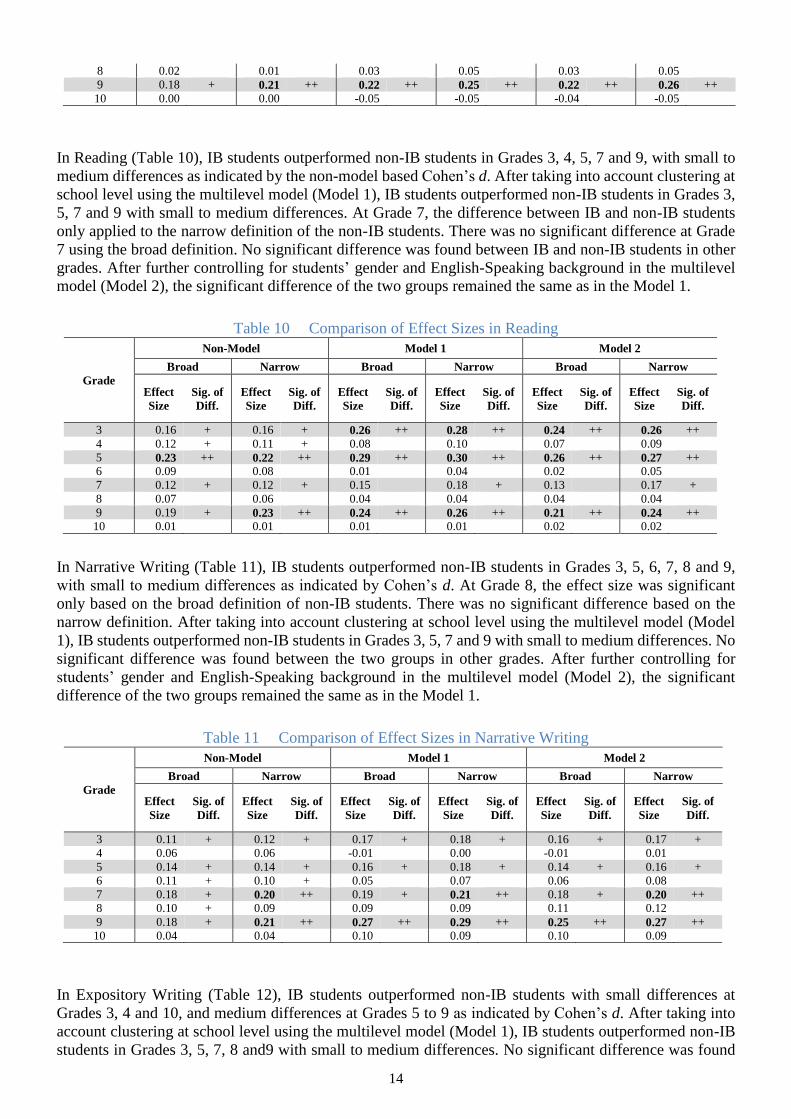
9 0.18 + 0.21 ++ 0.22 ++ 0.25 ++ 0.22 ++ 0.26 ++
10 0.00 0.00 -0.05 -0.05 -0.04 -0.05
In Reading (Table 10), IB students outperformed non-IB students in Grades 3, 4, 5, 7 and 9, with small to
medium differences as indicated by the non-model based Cohen’s d. After taking into account clustering at
school level using the multilevel model (Model 1), IB students outperformed non-IB students in Grades 3,
5, 7 and 9 with small to medium differences. At Grade 7, the difference between IB and non-IB students
only applied to the narrow definition of the non-IB students. There was no significant difference at Grade
7 using the broad definition. No significant difference was found between IB and non-IB students in other
grades. After further controlling for students’ gender and English-Speaking background in the multilevel
model (Model 2), the significant difference of the two groups remained the same as in the Model 1.
Table 10 Comparison of Effect Sizes in Reading
Grade
Non-Model Model 1 Model 2
Broad Narrow Broad Narrow Broad Narrow
Effect
Size
Sig. of
Diff.
Effect
Size
Sig. of
Diff.
Effect
Size
Sig. of
Diff.
Effect
Size
Sig. of
Diff.
Effect
Size
Sig. of
Diff.
Effect
Size
Sig. of
Diff.
3 0.16 + 0.16 + 0.26 ++ 0.28 ++ 0.24 ++ 0.26 ++
4 0.12 + 0.11 + 0.08 0.10 0.07 0.09
5 0.23 ++ 0.22 ++ 0.29 ++ 0.30 ++ 0.26 ++ 0.27 ++
6 0.09 0.08 0.01 0.04 0.02 0.05
7 0.12 + 0.12 + 0.15 0.18 + 0.13 0.17 +
8 0.07 0.06 0.04 0.04 0.04 0.04
9 0.19 + 0.23 ++ 0.24 ++ 0.26 ++ 0.21 ++ 0.24 ++
10 0.01 0.01 0.01 0.01 0.02 0.02
In Narrative Writing (Table 11), IB students outperformed non-IB students in Grades 3, 5, 6, 7, 8 and 9,
with small to medium differences as indicated by Cohen’s d. At Grade 8, the effect size was significant
only based on the broad definition of non-IB students. There was no significant difference based on the
narrow definition. After taking into account clustering at school level using the multilevel model (Model
1), IB students outperformed non-IB students in Grades 3, 5, 7 and 9 with small to medium differences. No
significant difference was found between the two groups in other grades. After further controlling for
students’ gender and English-Speaking background in the multilevel model (Model 2), the significant
difference of the two groups remained the same as in the Model 1.
Table 11 Comparison of Effect Sizes in Narrative Writing
Grade
Non-Model Model 1 Model 2
Broad Narrow Broad Narrow Broad Narrow
Effect
Size
Sig. of
Diff.
Effect
Size
Sig. of
Diff.
Effect
Size
Sig. of
Diff.
Effect
Size
Sig. of
Diff.
Effect
Size
Sig. of
Diff.
Effect
Size
Sig. of
Diff.
3 0.11 + 0.12 + 0.17 + 0.18 + 0.16 + 0.17 +
4 0.06 0.06 -0.01 0.00 -0.01 0.01
5 0.14 + 0.14 + 0.16 + 0.18 + 0.14 + 0.16 +
6 0.11 + 0.10 + 0.05 0.07 0.06 0.08
7 0.18 + 0.20 ++ 0.19 + 0.21 ++ 0.18 + 0.20 ++
8 0.10 + 0.09 0.09 0.09 0.11 0.12
9 0.18 + 0.21 ++ 0.27 ++ 0.29 ++ 0.25 ++ 0.27 ++
10 0.04 0.04 0.10 0.09 0.10 0.09
In Expository Writing (Table 12), IB students outperformed non-IB students with small differences at
Grades 3, 4 and 10, and medium differences at Grades 5 to 9 as indicated by Cohen’s d. After taking into
account clustering at school level using the multilevel model (Model 1), IB students outperformed non-IB
students in Grades 3, 5, 7, 8 and9 with small to medium differences. No significant difference was found
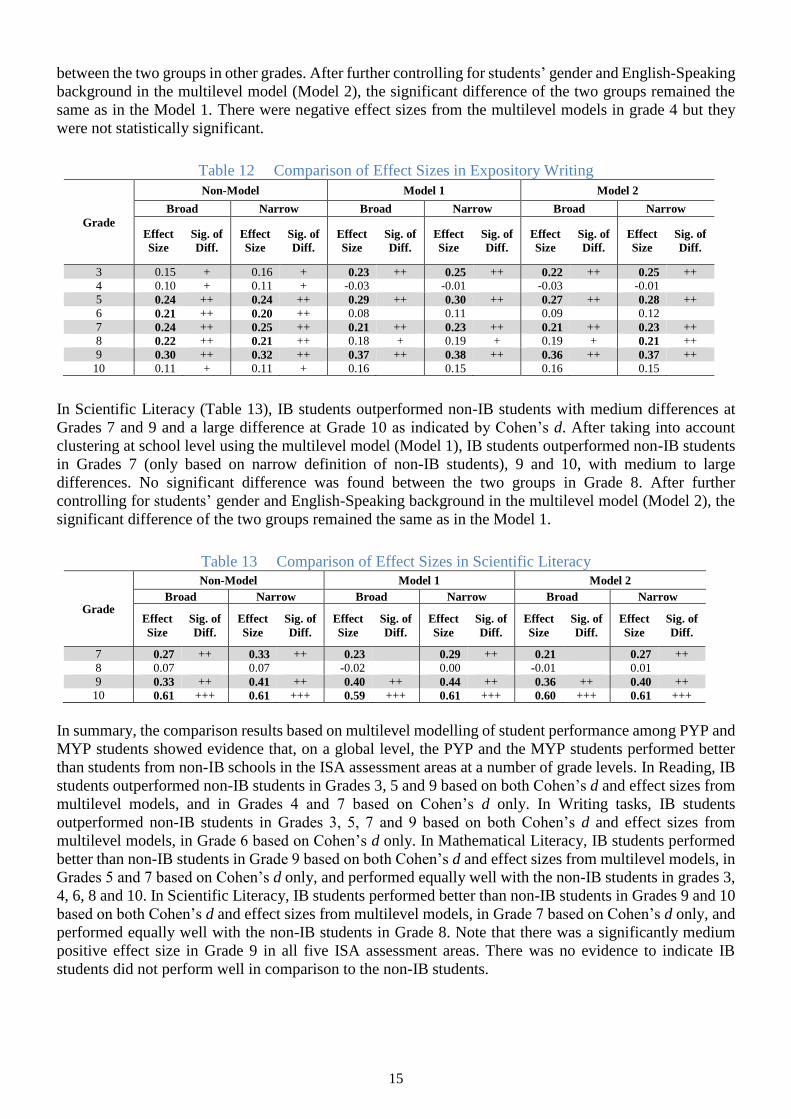
15
between the two groups in other grades. After further controlling for students’ gender and English-Speaking
background in the multilevel model (Model 2), the significant difference of the two groups remained the
same as in the Model 1. There were negative effect sizes from the multilevel models in grade 4 but they
were not statistically significant.
Table 12 Comparison of Effect Sizes in Expository Writing
Grade
Non-Model Model 1 Model 2
Broad Narrow Broad Narrow Broad Narrow
Effect
Size
Sig. of
Diff.
Effect
Size
Sig. of
Diff.
Effect
Size
Sig. of
Diff.
Effect
Size
Sig. of
Diff.
Effect
Size
Sig. of
Diff.
Effect
Size
Sig. of
Diff.
3 0.15 + 0.16 + 0.23 ++ 0.25 ++ 0.22 ++ 0.25 ++
4 0.10 + 0.11 + -0.03 -0.01 -0.03 -0.01
5 0.24 ++ 0.24 ++ 0.29 ++ 0.30 ++ 0.27 ++ 0.28 ++
6 0.21 ++ 0.20 ++ 0.08 0.11 0.09 0.12
7 0.24 ++ 0.25 ++ 0.21 ++ 0.23 ++ 0.21 ++ 0.23 ++
8 0.22 ++ 0.21 ++ 0.18 + 0.19 + 0.19 + 0.21 ++
9 0.30 ++ 0.32 ++ 0.37 ++ 0.38 ++ 0.36 ++ 0.37 ++
10 0.11 + 0.11 + 0.16 0.15 0.16 0.15
In Scientific Literacy (Table 13), IB students outperformed non-IB students with medium differences at
Grades 7 and 9 and a large difference at Grade 10 as indicated by Cohen’s d. After taking into account
clustering at school level using the multilevel model (Model 1), IB students outperformed non-IB students
in Grades 7 (only based on narrow definition of non-IB students), 9 and 10, with medium to large
differences. No significant difference was found between the two groups in Grade 8. After further
controlling for students’ gender and English-Speaking background in the multilevel model (Model 2), the
significant difference of the two groups remained the same as in the Model 1.
Table 13 Comparison of Effect Sizes in Scientific Literacy
Grade
Non-Model Model 1 Model 2
Broad Narrow Broad Narrow Broad Narrow
Effect
Size
Sig. of
Diff.
Effect
Size
Sig. of
Diff.
Effect
Size
Sig. of
Diff.
Effect
Size
Sig. of
Diff.
Effect
Size
Sig. of
Diff.
Effect
Size
Sig. of
Diff.
7 0.27 ++ 0.33 ++ 0.23 0.29 ++ 0.21 0.27 ++
8 0.07 0.07 -0.02 0.00 -0.01 0.01
9 0.33 ++ 0.41 ++ 0.40 ++ 0.44 ++ 0.36 ++ 0.40 ++
10 0.61 +++ 0.61 +++ 0.59 +++ 0.61 +++ 0.60 +++ 0.61 +++
In summary, the comparison results based on multilevel modelling of student performance among PYP and
MYP students showed evidence that, on a global level, the PYP and the MYP students performed better
than students from non-IB schools in the ISA assessment areas at a number of grade levels. In Reading, IB
students outperformed non-IB students in Grades 3, 5 and 9 based on both Cohen’s d and effect sizes from
multilevel models, and in Grades 4 and 7 based on Cohen’s d only. In Writing tasks, IB students
outperformed non-IB students in Grades 3, 5, 7 and 9 based on both Cohen’s d and effect sizes from
multilevel models, in Grade 6 based on Cohen’s d only. In Mathematical Literacy, IB students performed
better than non-IB students in Grade 9 based on both Cohen’s d and effect sizes from multilevel models, in
Grades 5 and 7 based on Cohen’s d only, and performed equally well with the non-IB students in grades 3,
4, 6, 8 and 10. In Scientific Literacy, IB students performed better than non-IB students in Grades 9 and 10
based on both Cohen’s d and effect sizes from multilevel models, in Grade 7 based on Cohen’s d only, and
performed equally well with the non-IB students in Grade 8. Note that there was a significantly medium
positive effect size in Grade 9 in all five ISA assessment areas. There was no evidence to indicate IB
students did not perform well in comparison to the non-IB students.
16
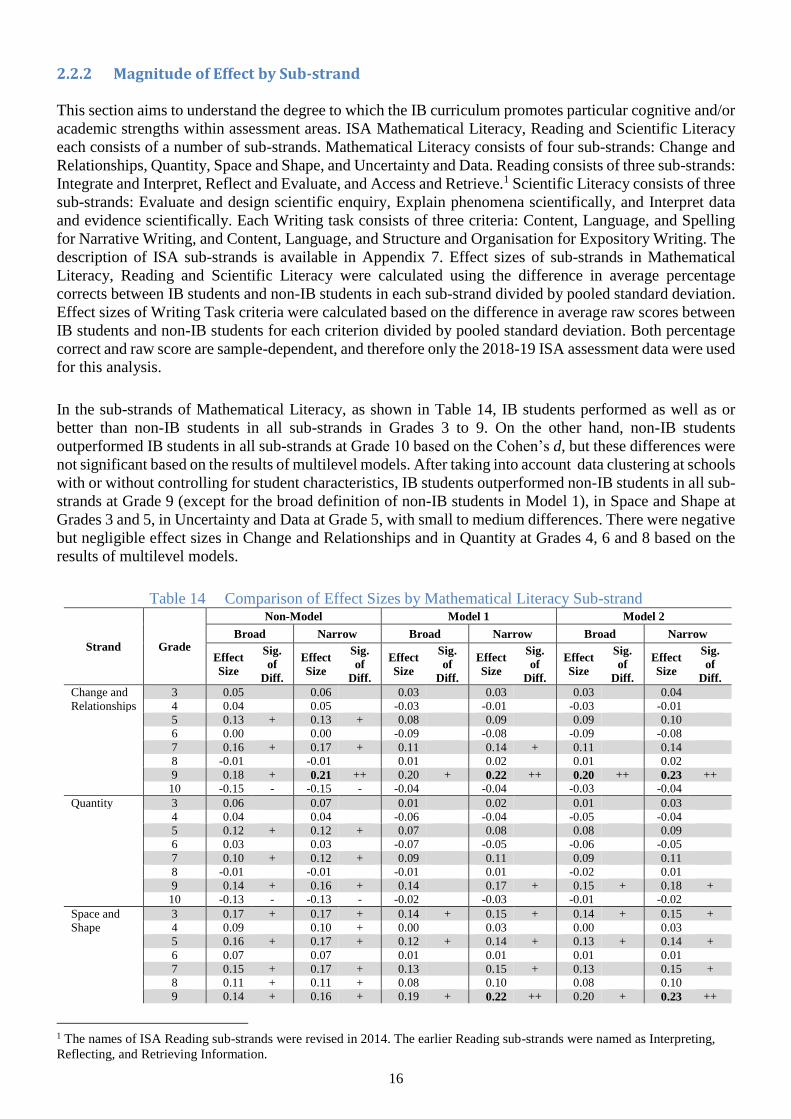
2.2.2 Magnitude of Effect by Sub-strand
This section aims to understand the degree to which the IB curriculum promotes particular cognitive and/or
academic strengths within assessment areas. ISA Mathematical Literacy, Reading and Scientific Literacy
each consists of a number of sub-strands. Mathematical Literacy consists of four sub-strands: Change and
Relationships, Quantity, Space and Shape, and Uncertainty and Data. Reading consists of three sub-strands:
Integrate and Interpret, Reflect and Evaluate, and Access and Retrieve.1 Scientific Literacy consists of three
sub-strands: Evaluate and design scientific enquiry, Explain phenomena scientifically, and Interpret data
and evidence scientifically. Each Writing task consists of three criteria: Content, Language, and Spelling
for Narrative Writing, and Content, Language, and Structure and Organisation for Expository Writing. The
description of ISA sub-strands is available in Appendix 7. Effect sizes of sub-strands in Mathematical
Literacy, Reading and Scientific Literacy were calculated using the difference in average percentage
corrects between IB students and non-IB students in each sub-strand divided by pooled standard deviation.
Effect sizes of Writing Task criteria were calculated based on the difference in average raw scores between
IB students and non-IB students for each criterion divided by pooled standard deviation. Both percentage
correct and raw score are sample-dependent, and therefore only the 2018-19 ISA assessment data were used
for this analysis.
In the sub-strands of Mathematical Literacy, as shown in Table 14, IB students performed as well as or
better than non-IB students in all sub-strands in Grades 3 to 9. On the other hand, non-IB students
outperformed IB students in all sub-strands at Grade 10 based on the Cohen’s d, but these differences were
not significant based on the results of multilevel models. After taking into account data clustering at schools
with or without controlling for student characteristics, IB students outperformed non-IB students in all sub-
strands at Grade 9 (except for the broad definition of non-IB students in Model 1), in Space and Shape at
Grades 3 and 5, in Uncertainty and Data at Grade 5, with small to medium differences. There were negative
but negligible effect sizes in Change and Relationships and in Quantity at Grades 4, 6 and 8 based on the
results of multilevel models.
Table 14 Comparison of Effect Sizes by Mathematical Literacy Sub-strand
Strand Grade
Non-Model Model 1 Model 2
Broad Narrow Broad Narrow Broad Narrow
Effect
Size
Sig.
of
Diff.
Effect
Size
Sig.
of
Diff.
Effect
Size
Sig.
of
Diff.
Effect
Size
Sig.
of
Diff.
Effect
Size
Sig.
of
Diff.
Effect
Size
Sig.
of
Diff.
Change and
Relationships
3 0.05 0.06 0.03 0.03 0.03 0.04
4 0.04 0.05 -0.03 -0.01 -0.03 -0.01
5 0.13 + 0.13 + 0.08 0.09 0.09 0.10
6 0.00 0.00 -0.09 -0.08 -0.09 -0.08
7 0.16 + 0.17 + 0.11 0.14 + 0.11 0.14
8 -0.01 -0.01 0.01 0.02 0.01 0.02
9 0.18 + 0.21 ++ 0.20 + 0.22 ++ 0.20 ++ 0.23 ++
10 -0.15 - -0.15 - -0.04 -0.04 -0.03 -0.04
Quantity 3 0.06 0.07 0.01 0.02 0.01 0.03
4 0.04 0.04 -0.06 -0.04 -0.05 -0.04
5 0.12 + 0.12 + 0.07 0.08 0.08 0.09
6 0.03 0.03 -0.07 -0.05 -0.06 -0.05
7 0.10 + 0.12 + 0.09 0.11 0.09 0.11
8 -0.01 -0.01 -0.01 0.01 -0.02 0.01
9 0.14 + 0.16 + 0.14 0.17 + 0.15 + 0.18 +
10 -0.13 - -0.13 - -0.02 -0.03 -0.01 -0.02
Space and
Shape
3 0.17 + 0.17 + 0.14 + 0.15 + 0.14 + 0.15 +
4 0.09 0.10 + 0.00 0.03 0.00 0.03
5 0.16 + 0.17 + 0.12 + 0.14 + 0.13 + 0.14 +
6 0.07 0.07 0.01 0.01 0.01 0.01
7 0.15 + 0.17 + 0.13 0.15 + 0.13 0.15 +
8 0.11 + 0.11 + 0.08 0.10 0.08 0.10
9 0.14 + 0.16 + 0.19 + 0.22 ++ 0.20 + 0.23 ++
1 The names of ISA Reading sub-strands were revised in 2014. The earlier Reading sub-strands were named as Interpreting,
Reflecting, and Retrieving Information.
17
Strand Grade
Non-Model Model 1 Model 2
Broad Narrow Broad Narrow Broad Narrow
Effect
Size
Sig.
of
Diff.
Effect
Size
Sig.
of
Diff.
Effect
Size
Sig.
of
Diff.
Effect
Size
Sig.
of
Diff.
Effect
Size
Sig.
of
Diff.
Effect
Size
Sig.
of
Diff.
10 -0.16 - -0.16 - 0.00 0.00 0.00 0.00
Uncertainty
and Data
3 0.07 0.08 0.05 0.06 0.05 0.06
4 0.06 0.07 0.01 0.02 0.01 0.02
5 0.22 ++ 0.22 ++ 0.19 + 0.19 + 0.18 + 0.19 +
6 0.14 + 0.14 + 0.05 0.06 0.05 0.06
7 0.11 + 0.13 + 0.08 0.10 0.08 0.10
8 0.03 0.03 0.02 0.04 0.02 0.04
9 0.24 ++ 0.27 ++ 0.23 ++ 0.26 ++ 0.23 ++ 0.26 ++
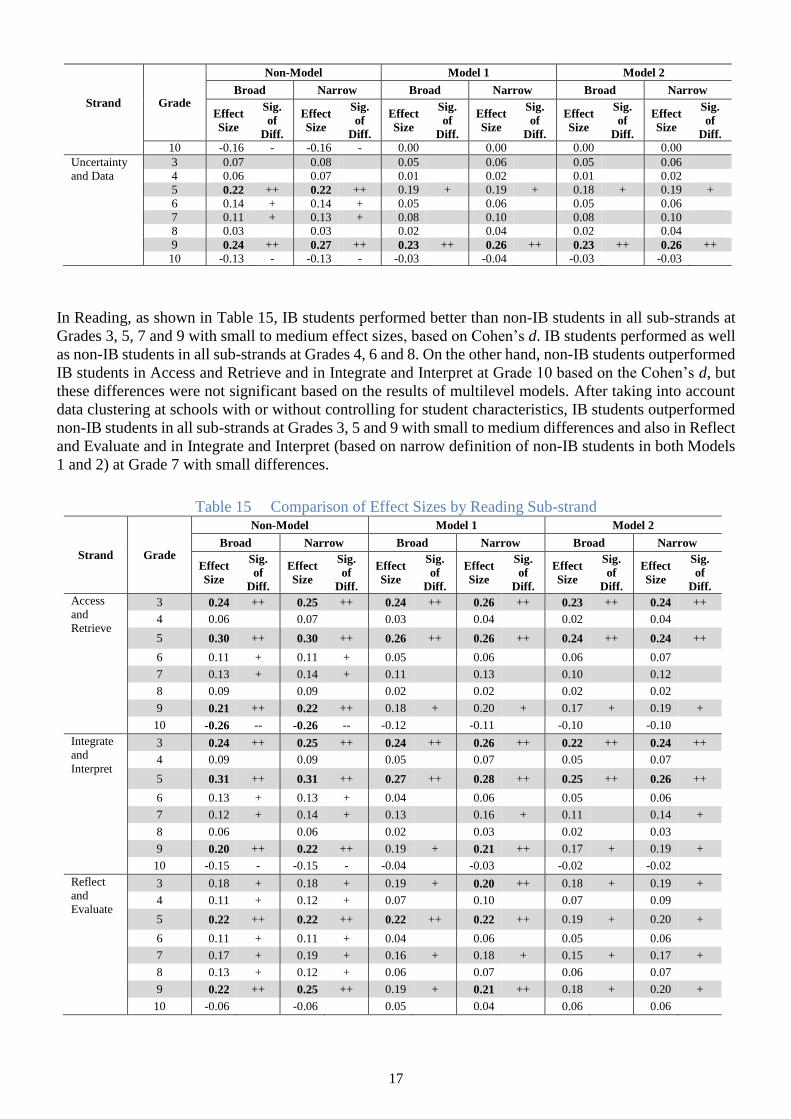
10 -0.13 - -0.13 - -0.03 -0.04 -0.03 -0.03
In Reading, as shown in Table 15, IB students performed better than non-IB students in all sub-strands at
Grades 3, 5, 7 and 9 with small to medium effect sizes, based on Cohen’s d. IB students performed as well
as non-IB students in all sub-strands at Grades 4, 6 and 8. On the other hand, non-IB students outperformed
IB students in Access and Retrieve and in Integrate and Interpret at Grade 10 based on the Cohen’s d, but
these differences were not significant based on the results of multilevel models. After taking into account
data clustering at schools with or without controlling for student characteristics, IB students outperformed
non-IB students in all sub-strands at Grades 3, 5 and 9 with small to medium differences and also in Reflect
and Evaluate and in Integrate and Interpret (based on narrow definition of non-IB students in both Models
1 and 2) at Grade 7 with small differences.
Table 15 Comparison of Effect Sizes by Reading Sub-strand
Strand Grade
Non-Model Model 1 Model 2
Broad Narrow Broad Narrow Broad Narrow
Effect
Size
Sig.
of
Diff.
Effect
Size
Sig.
of
Diff.
Effect
Size
Sig.
of
Diff.
Effect
Size
Sig.
of
Diff.
Effect
Size
Sig.
of
Diff.
Effect
Size
Sig.
of
Diff.
Access
and
Retrieve
3 0.24 ++ 0.25 ++ 0.24 ++ 0.26 ++ 0.23 ++ 0.24 ++
4 0.06 0.07 0.03 0.04 0.02 0.04
5 0.30 ++ 0.30 ++ 0.26 ++ 0.26 ++ 0.24 ++ 0.24 ++
6 0.11 + 0.11 + 0.05 0.06 0.06 0.07
7 0.13 + 0.14 + 0.11 0.13 0.10 0.12
8 0.09 0.09 0.02 0.02 0.02 0.02
9 0.21 ++ 0.22 ++ 0.18 + 0.20 + 0.17 + 0.19 +
10 -0.26 -- -0.26 -- -0.12 -0.11 -0.10 -0.10
Integrate
and
Interpret
3 0.24 ++ 0.25 ++ 0.24 ++ 0.26 ++ 0.22 ++ 0.24 ++
4 0.09 0.09 0.05 0.07 0.05 0.07
5 0.31 ++ 0.31 ++ 0.27 ++ 0.28 ++ 0.25 ++ 0.26 ++
6 0.13 + 0.13 + 0.04 0.06 0.05 0.06
7 0.12 + 0.14 + 0.13 0.16 + 0.11 0.14 +
8 0.06 0.06 0.02 0.03 0.02 0.03
9 0.20 ++ 0.22 ++ 0.19 + 0.21 ++ 0.17 + 0.19 +
10 -0.15 - -0.15 - -0.04 -0.03 -0.02 -0.02
Reflect
and
Evaluate
3 0.18 + 0.18 + 0.19 + 0.20 ++ 0.18 + 0.19 +
4 0.11 + 0.12 + 0.07 0.10 0.07 0.09
5 0.22 ++ 0.22 ++ 0.22 ++ 0.22 ++ 0.19 + 0.20 +
6 0.11 + 0.11 + 0.04 0.06 0.05 0.06
7 0.17 + 0.19 + 0.16 + 0.18 + 0.15 + 0.17 +
8 0.13 + 0.12 + 0.06 0.07 0.06 0.07
9 0.22 ++ 0.25 ++ 0.19 + 0.21 ++ 0.18 + 0.20 +
10 -0.06 -0.06 0.05 0.04 0.06 0.06
18
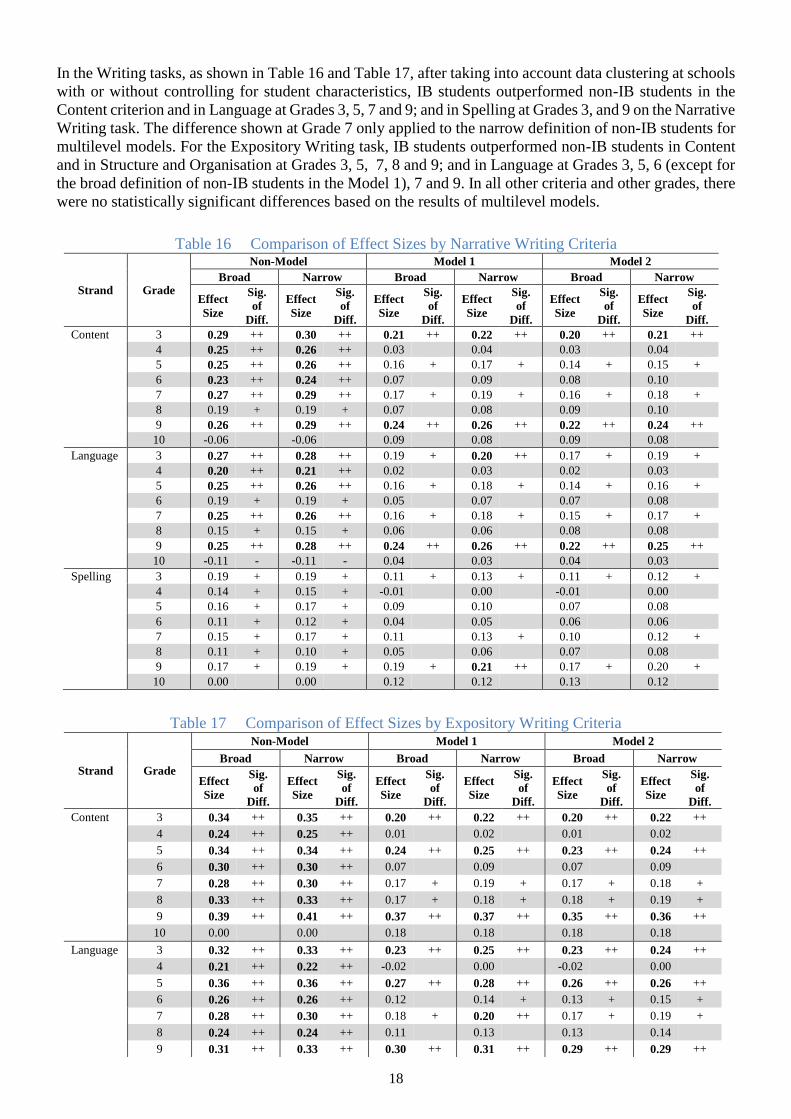
In the Writing tasks, as shown in Table 16 and Table 17, after taking into account data clustering at schools
with or without controlling for student characteristics, IB students outperformed non-IB students in the
Content criterion and in Language at Grades 3, 5, 7 and 9; and in Spelling at Grades 3, and 9 on the Narrative
Writing task. The difference shown at Grade 7 only applied to the narrow definition of non-IB students for
multilevel models. For the Expository Writing task, IB students outperformed non-IB students in Content
and in Structure and Organisation at Grades 3, 5, 7, 8 and 9; and in Language at Grades 3, 5, 6 (except for
the broad definition of non-IB students in the Model 1), 7 and 9. In all other criteria and other grades, there
were no statistically significant differences based on the results of multilevel models.
Table 16 Comparison of Effect Sizes by Narrative Writing Criteria
Strand Grade
Non-Model Model 1 Model 2
Broad Narrow Broad Narrow Broad Narrow
Effect
Size
Sig.
of
Diff.
Effect
Size
Sig.
of
Diff.
Effect
Size
Sig.
of
Diff.
Effect
Size
Sig.
of
Diff.
Effect
Size
Sig.
of
Diff.
Effect
Size
Sig.
of
Diff.
Content 3 0.29 ++ 0.30 ++ 0.21 ++ 0.22 ++ 0.20 ++ 0.21 ++
4 0.25 ++ 0.26 ++ 0.03 0.04 0.03 0.04
5 0.25 ++ 0.26 ++ 0.16 + 0.17 + 0.14 + 0.15 +
6 0.23 ++ 0.24 ++ 0.07 0.09 0.08 0.10
7 0.27 ++ 0.29 ++ 0.17 + 0.19 + 0.16 + 0.18 +
8 0.19 + 0.19 + 0.07 0.08 0.09 0.10
9 0.26 ++ 0.29 ++ 0.24 ++ 0.26 ++ 0.22 ++ 0.24 ++
10 -0.06 -0.06 0.09 0.08 0.09 0.08
Language 3 0.27 ++ 0.28 ++ 0.19 + 0.20 ++ 0.17 + 0.19 +
4 0.20 ++ 0.21 ++ 0.02 0.03 0.02 0.03
5 0.25 ++ 0.26 ++ 0.16 + 0.18 + 0.14 + 0.16 +
6 0.19 + 0.19 + 0.05 0.07 0.07 0.08
7 0.25 ++ 0.26 ++ 0.16 + 0.18 + 0.15 + 0.17 +
8 0.15 + 0.15 + 0.06 0.06 0.08 0.08
9 0.25 ++ 0.28 ++ 0.24 ++ 0.26 ++ 0.22 ++ 0.25 ++
10 -0.11 - -0.11 - 0.04 0.03 0.04 0.03
Spelling 3 0.19 + 0.19 + 0.11 + 0.13 + 0.11 + 0.12 +
4 0.14 + 0.15 + -0.01 0.00 -0.01 0.00
5 0.16 + 0.17 + 0.09 0.10 0.07 0.08
6 0.11 + 0.12 + 0.04 0.05 0.06 0.06
7 0.15 + 0.17 + 0.11 0.13 + 0.10 0.12 +
8 0.11 + 0.10 + 0.05 0.06 0.07 0.08
9 0.17 + 0.19 + 0.19 + 0.21 ++ 0.17 + 0.20 +
10 0.00 0.00 0.12 0.12 0.13 0.12
Table 17 Comparison of Effect Sizes by Expository Writing Criteria
Strand Grade
Non-Model Model 1 Model 2
Broad Narrow Broad Narrow Broad Narrow
Effect
Size
Sig.
of
Diff.
Effect
Size
Sig.
of
Diff.
Effect
Size
Sig.
of
Diff.
Effect
Size
Sig.
of
Diff.
Effect
Size
Sig.
of
Diff.
Effect
Size
Sig.
of
Diff.
Content 3 0.34 ++ 0.35 ++ 0.20 ++ 0.22 ++ 0.20 ++ 0.22 ++
4 0.24 ++ 0.25 ++ 0.01 0.02 0.01 0.02
5 0.34 ++ 0.34 ++ 0.24 ++ 0.25 ++ 0.23 ++ 0.24 ++
6 0.30 ++ 0.30 ++ 0.07 0.09 0.07 0.09
7 0.28 ++ 0.30 ++ 0.17 + 0.19 + 0.17 + 0.18 +
8 0.33 ++ 0.33 ++ 0.17 + 0.18 + 0.18 + 0.19 +
9 0.39 ++ 0.41 ++ 0.37 ++ 0.37 ++ 0.35 ++ 0.36 ++
10 0.00 0.00 0.18 0.18 0.18 0.18
Language 3 0.32 ++ 0.33 ++ 0.23 ++ 0.25 ++ 0.23 ++ 0.24 ++
4 0.21 ++ 0.22 ++ -0.02 0.00 -0.02 0.00
5 0.36 ++ 0.36 ++ 0.27 ++ 0.28 ++ 0.26 ++ 0.26 ++
6 0.26 ++ 0.26 ++ 0.12 0.14 + 0.13 + 0.15 +
7 0.28 ++ 0.30 ++ 0.18 + 0.20 ++ 0.17 + 0.19 +
8 0.24 ++ 0.24 ++ 0.11 0.13 0.13 0.14
9 0.31 ++ 0.33 ++ 0.30 ++ 0.31 ++ 0.29 ++ 0.29 ++
19
10 -0.02 -0.02 0.12 0.12 0.12 0.12
Structure 3 0.32 ++ 0.33 ++ 0.22 ++ 0.24 ++ 0.22 ++ 0.23 ++
4 0.26 ++ 0.27 ++ 0.00 0.01 0.00 0.01
5 0.36 ++ 0.37 ++ 0.25 ++ 0.26 ++ 0.24 ++ 0.25 ++
6 0.28 ++ 0.28 ++ 0.04 0.06 0.05 0.06
7 0.30 ++ 0.31 ++ 0.17 + 0.19 + 0.16 + 0.18 +
8 0.34 ++ 0.33 ++ 0.16 + 0.17 + 0.17 + 0.19 +
9 0.36 ++ 0.39 ++ 0.34 ++ 0.35 ++ 0.33 ++ 0.34 ++
10 -0.01 -0.01 0.16 0.15 0.16 0.15
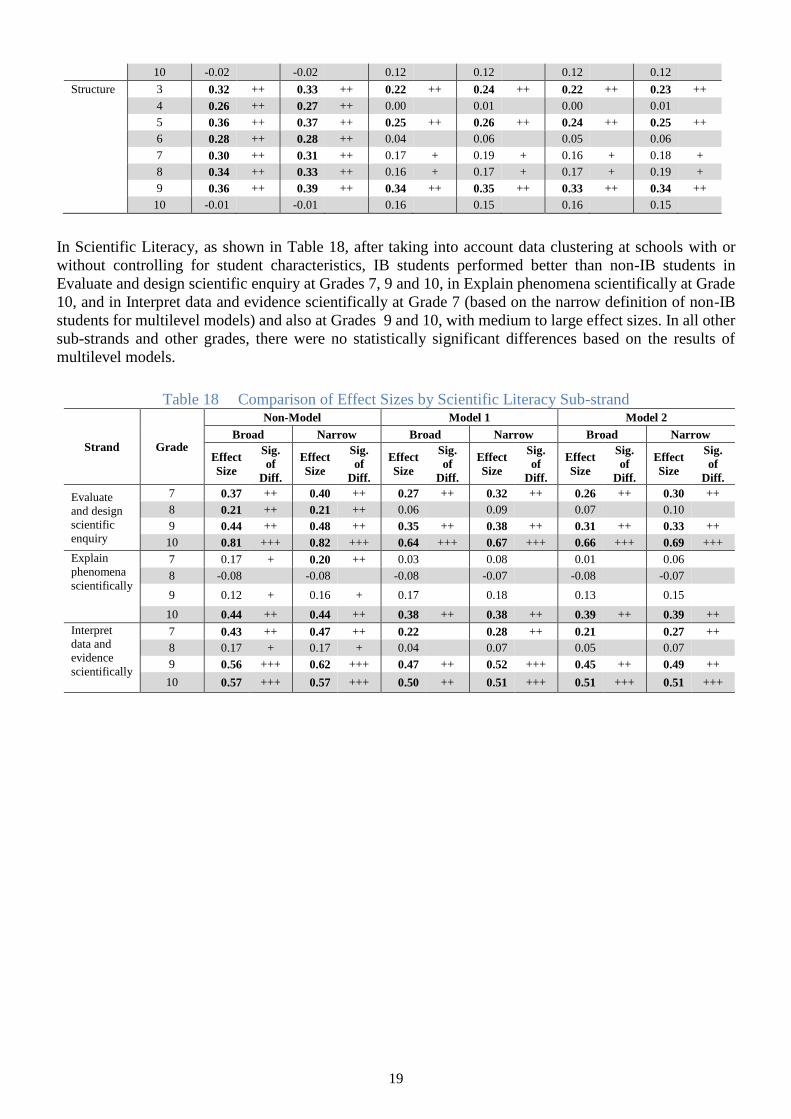
In Scientific Literacy, as shown in Table 18, after taking into account data clustering at schools with or
without controlling for student characteristics, IB students performed better than non-IB students in
Evaluate and design scientific enquiry at Grades 7, 9 and 10, in Explain phenomena scientifically at Grade
10, and in Interpret data and evidence scientifically at Grade 7 (based on the narrow definition of non-IB
students for multilevel models) and also at Grades 9 and 10, with medium to large effect sizes. In all other
sub-strands and other grades, there were no statistically significant differences based on the results of
multilevel models.
Table 18 Comparison of Effect Sizes by Scientific Literacy Sub-strand
Strand Grade
Non-Model Model 1 Model 2
Broad Narrow Broad Narrow Broad Narrow
Effect
Size
Sig.
of
Diff.
Effect
Size
Sig.
of
Diff.
Effect
Size
Sig.
of
Diff.
Effect
Size
Sig.
of
Diff.
Effect
Size
Sig.
of
Diff.
Effect
Size
Sig.
of
Diff.
Evaluate
and design
scientific
enquiry
7 0.37 ++ 0.40 ++ 0.27 ++ 0.32 ++ 0.26 ++ 0.30 ++
8 0.21 ++ 0.21 ++ 0.06 0.09 0.07 0.10
9 0.44 ++ 0.48 ++ 0.35 ++ 0.38 ++ 0.31 ++ 0.33 ++
10 0.81 +++ 0.82 +++ 0.64 +++ 0.67 +++ 0.66 +++ 0.69 +++
Explain
phenomena
scientifically
7 0.17 + 0.20 ++ 0.03 0.08 0.01 0.06
8 -0.08 -0.08 -0.08 -0.07 -0.08 -0.07
9 0.12 + 0.16 + 0.17 0.18 0.13 0.15
10 0.44 ++ 0.44 ++ 0.38 ++ 0.38 ++ 0.39 ++ 0.39 ++
Interpret
data and
evidence
scientifically
7 0.43 ++ 0.47 ++ 0.22 0.28 ++ 0.21 0.27 ++
8 0.17 + 0.17 + 0.04 0.07 0.05 0.07
9 0.56 +++ 0.62 +++ 0.47 ++ 0.52 +++ 0.45 ++ 0.49 ++
10 0.57 +++ 0.57 +++ 0.50 ++ 0.51 +++ 0.51 +++ 0.51 +++
20
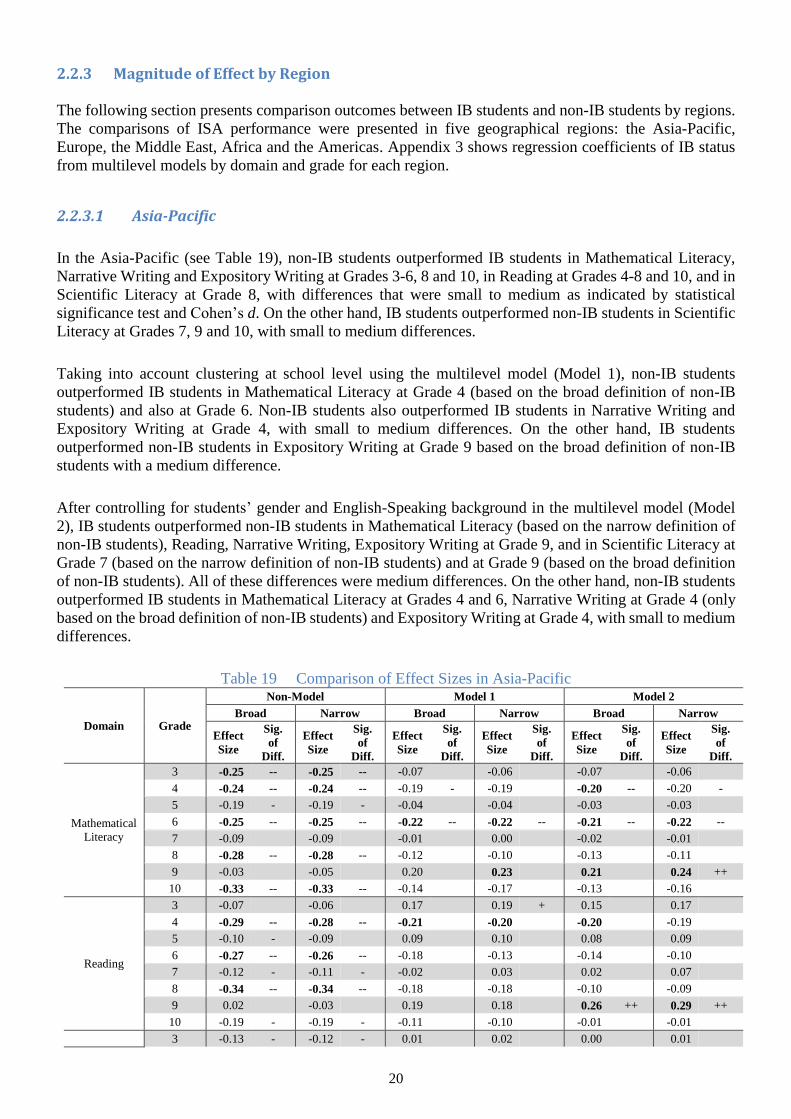
2.2.3 Magnitude of Effect by Region
The following section presents comparison outcomes between IB students and non-IB students by regions.
The comparisons of ISA performance were presented in five geographical regions: the Asia-Pacific,
Europe, the Middle East, Africa and the Americas. Appendix 3 shows regression coefficients of IB status
from multilevel models by domain and grade for each region.
2.2.3.1 Asia-Pacific
In the Asia-Pacific (see Table 19), non-IB students outperformed IB students in Mathematical Literacy,
Narrative Writing and Expository Writing at Grades 3-6, 8 and 10, in Reading at Grades 4-8 and 10, and in
Scientific Literacy at Grade 8, with differences that were small to medium as indicated by statistical
significance test and Cohen’s d. On the other hand, IB students outperformed non-IB students in Scientific
Literacy at Grades 7, 9 and 10, with small to medium differences.
Taking into account clustering at school level using the multilevel model (Model 1), non-IB students
outperformed IB students in Mathematical Literacy at Grade 4 (based on the broad definition of non-IB
students) and also at Grade 6. Non-IB students also outperformed IB students in Narrative Writing and
Expository Writing at Grade 4, with small to medium differences. On the other hand, IB students
outperformed non-IB students in Expository Writing at Grade 9 based on the broad definition of non-IB
students with a medium difference.
After controlling for students’ gender and English-Speaking background in the multilevel model (Model
2), IB students outperformed non-IB students in Mathematical Literacy (based on the narrow definition of
non-IB students), Reading, Narrative Writing, Expository Writing at Grade 9, and in Scientific Literacy at
Grade 7 (based on the narrow definition of non-IB students) and at Grade 9 (based on the broad definition
of non-IB students). All of these differences were medium differences. On the other hand, non-IB students
outperformed IB students in Mathematical Literacy at Grades 4 and 6, Narrative Writing at Grade 4 (only
based on the broad definition of non-IB students) and Expository Writing at Grade 4, with small to medium
differences.
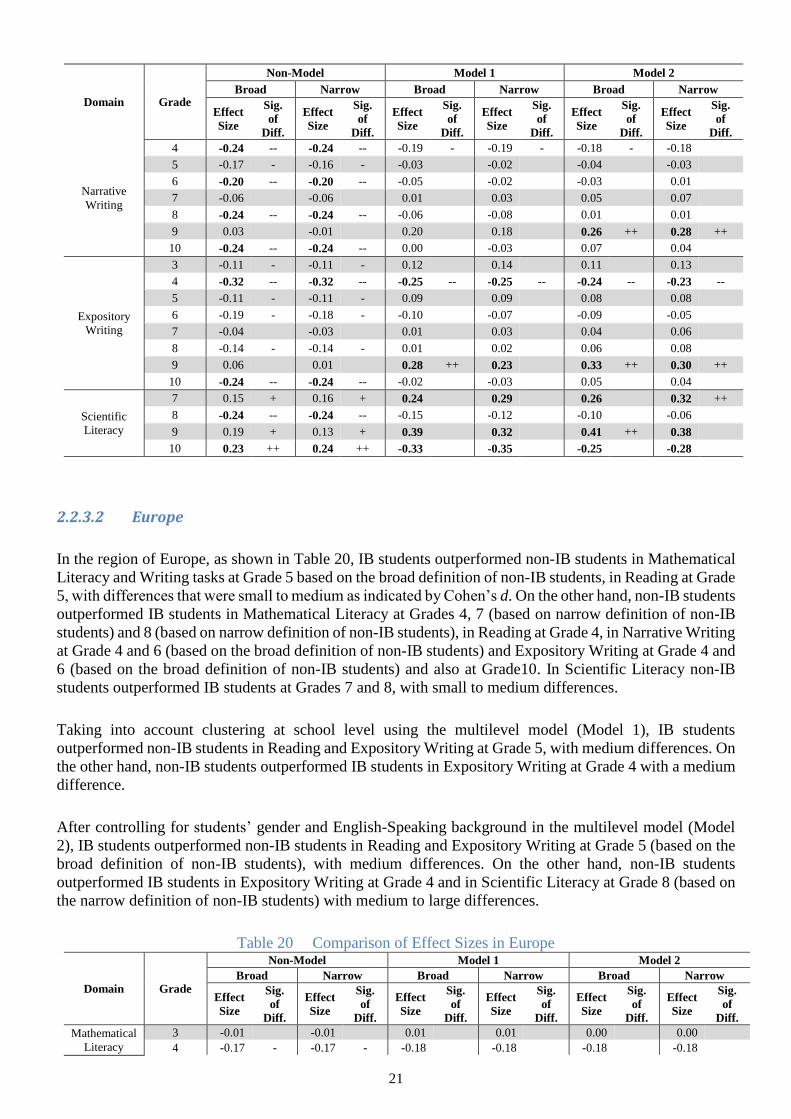
Table 19 Comparison of Effect Sizes in Asia-Pacific
Domain Grade
Non-Model Model 1 Model 2
Broad Narrow Broad Narrow Broad Narrow
Effect
Size
Sig.
of
Diff.
Effect
Size
Sig.
of
Diff.
Effect
Size
Sig.
of
Diff.
Effect
Size
Sig.
of
Diff.
Effect
Size
Sig.
of
Diff.
Effect
Size
Sig.
of
Diff.
Mathematical
Literacy
3 -0.25 -- -0.25 -- -0.07 -0.06 -0.07 -0.06
4 -0.24 -- -0.24 -- -0.19 - -0.19 -0.20 -- -0.20 -
5 -0.19 - -0.19 - -0.04 -0.04 -0.03 -0.03
6 -0.25 -- -0.25 -- -0.22 -- -0.22 -- -0.21 -- -0.22 --
7 -0.09 -0.09 -0.01 0.00 -0.02 -0.01
8 -0.28 -- -0.28 -- -0.12 -0.10 -0.13 -0.11
9 -0.03 -0.05 0.20 0.23 0.21 0.24 ++
10 -0.33 -- -0.33 -- -0.14 -0.17 -0.13 -0.16
Reading
3 -0.07 -0.06 0.17 0.19 + 0.15 0.17
4 -0.29 -- -0.28 -- -0.21 -0.20 -0.20 -0.19
5 -0.10 - -0.09 0.09 0.10 0.08 0.09
6 -0.27 -- -0.26 -- -0.18 -0.13 -0.14 -0.10
7 -0.12 - -0.11 - -0.02 0.03 0.02 0.07
8 -0.34 -- -0.34 -- -0.18 -0.18 -0.10 -0.09
9 0.02 -0.03 0.19 0.18 0.26 ++ 0.29 ++
10 -0.19 - -0.19 - -0.11 -0.10 -0.01 -0.01
3 -0.13 - -0.12 - 0.01 0.02 0.00 0.01
21
Domain Grade
Non-Model Model 1 Model 2
Broad Narrow Broad Narrow Broad Narrow
Effect
Size
Sig.
of
Diff.
Effect
Size
Sig.
of
Diff.
Effect
Size
Sig.
of
Diff.
Effect
Size
Sig.
of
Diff.
Effect
Size
Sig.
of
Diff.
Effect
Size
Sig.
of
Diff.
Narrative
Writing
4 -0.24 -- -0.24 -- -0.19 - -0.19 - -0.18 - -0.18
5 -0.17 - -0.16 - -0.03 -0.02 -0.04 -0.03
6 -0.20 -- -0.20 -- -0.05 -0.02 -0.03 0.01
7 -0.06 -0.06 0.01 0.03 0.05 0.07
8 -0.24 -- -0.24 -- -0.06 -0.08 0.01 0.01
9 0.03 -0.01 0.20 0.18 0.26 ++ 0.28 ++
10 -0.24 -- -0.24 -- 0.00 -0.03 0.07 0.04
Expository
Writing
3 -0.11 - -0.11 - 0.12 0.14 0.11 0.13
4 -0.32 -- -0.32 -- -0.25 -- -0.25 -- -0.24 -- -0.23 --
5 -0.11 - -0.11 - 0.09 0.09 0.08 0.08
6 -0.19 - -0.18 - -0.10 -0.07 -0.09 -0.05
7 -0.04 -0.03 0.01 0.03 0.04 0.06
8 -0.14 - -0.14 - 0.01 0.02 0.06 0.08
9 0.06 0.01 0.28 ++ 0.23 0.33 ++ 0.30 ++
10 -0.24 -- -0.24 -- -0.02 -0.03 0.05 0.04
Scientific
Literacy
7 0.15 + 0.16 + 0.24 0.29 0.26 0.32 ++
8 -0.24 -- -0.24 -- -0.15 -0.12 -0.10 -0.06
9 0.19 + 0.13 + 0.39 0.32 0.41 ++ 0.38
10 0.23 ++ 0.24 ++ -0.33 -0.35 -0.25 -0.28
2.2.3.2 Europe
In the region of Europe, as shown in Table 20, IB students outperformed non-IB students in Mathematical
Literacy and Writing tasks at Grade 5 based on the broad definition of non-IB students, in Reading at Grade
5, with differences that were small to medium as indicated by Cohen’s d. On the other hand, non-IB students
outperformed IB students in Mathematical Literacy at Grades 4, 7 (based on narrow definition of non-IB
students) and 8 (based on narrow definition of non-IB students), in Reading at Grade 4, in Narrative Writing
at Grade 4 and 6 (based on the broad definition of non-IB students) and Expository Writing at Grade 4 and
6 (based on the broad definition of non-IB students) and also at Grade10. In Scientific Literacy non-IB
students outperformed IB students at Grades 7 and 8, with small to medium differences.
Taking into account clustering at school level using the multilevel model (Model 1), IB students
outperformed non-IB students in Reading and Expository Writing at Grade 5, with medium differences. On
the other hand, non-IB students outperformed IB students in Expository Writing at Grade 4 with a medium
difference.
After controlling for students’ gender and English-Speaking background in the multilevel model (Model
2), IB students outperformed non-IB students in Reading and Expository Writing at Grade 5 (based on the
broad definition of non-IB students), with medium differences. On the other hand, non-IB students
outperformed IB students in Expository Writing at Grade 4 and in Scientific Literacy at Grade 8 (based on
the narrow definition of non-IB students) with medium to large differences.
Table 20 Comparison of Effect Sizes in Europe
Domain Grade
Non-Model Model 1 Model 2
Broad Narrow Broad Narrow Broad Narrow
Effect
Size
Sig.
of
Diff.
Effect
Size
Sig.
of
Diff.
Effect
Size
Sig.
of
Diff.
Effect
Size
Sig.
of
Diff.
Effect
Size
Sig.
of
Diff.
Effect
Size
Sig.
of
Diff.
Mathematical
Literacy
3 -0.01 -0.01 0.01 0.01 0.00 0.00
4 -0.17 - -0.17 - -0.18 -0.18 -0.18 -0.18
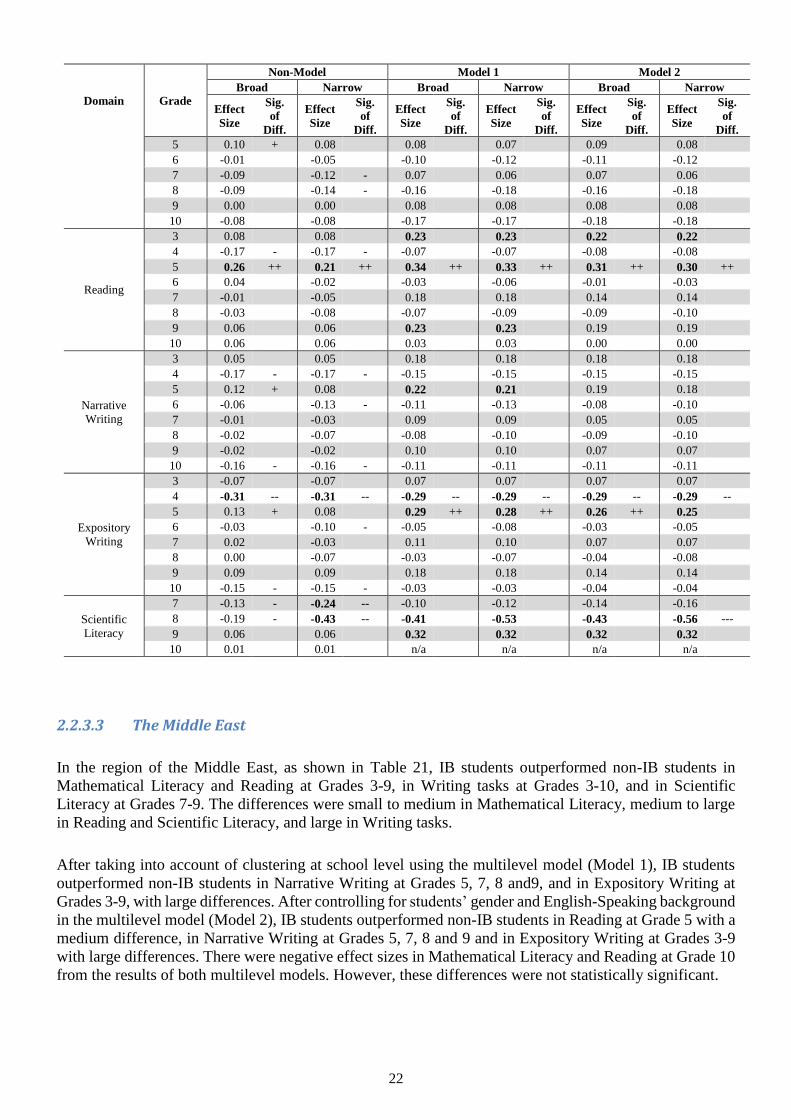
22
Domain Grade
Non-Model Model 1 Model 2
Broad Narrow Broad Narrow Broad Narrow
Effect
Size
Sig.
of
Diff.
Effect
Size
Sig.
of
Diff.
Effect
Size
Sig.
of
Diff.
Effect
Size
Sig.
of
Diff.
Effect
Size
Sig.
of
Diff.
Effect
Size
Sig.
of
Diff.
5 0.10 + 0.08 0.08 0.07 0.09 0.08
6 -0.01 -0.05 -0.10 -0.12 -0.11 -0.12
7 -0.09 -0.12 - 0.07 0.06 0.07 0.06
8 -0.09 -0.14 - -0.16 -0.18 -0.16 -0.18
9 0.00 0.00 0.08 0.08 0.08 0.08
10 -0.08 -0.08 -0.17 -0.17 -0.18 -0.18
Reading
3 0.08 0.08 0.23 0.23 0.22 0.22
4 -0.17 - -0.17 - -0.07 -0.07 -0.08 -0.08
5 0.26 ++ 0.21 ++ 0.34 ++ 0.33 ++ 0.31 ++ 0.30 ++
6 0.04 -0.02 -0.03 -0.06 -0.01 -0.03
7 -0.01 -0.05 0.18 0.18 0.14 0.14
8 -0.03 -0.08 -0.07 -0.09 -0.09 -0.10
9 0.06 0.06 0.23 0.23 0.19 0.19
10 0.06 0.06 0.03 0.03 0.00 0.00
Narrative
Writing
3 0.05 0.05 0.18 0.18 0.18 0.18
4 -0.17 - -0.17 - -0.15 -0.15 -0.15 -0.15
5 0.12 + 0.08 0.22 0.21 0.19 0.18
6 -0.06 -0.13 - -0.11 -0.13 -0.08 -0.10
7 -0.01 -0.03 0.09 0.09 0.05 0.05
8 -0.02 -0.07 -0.08 -0.10 -0.09 -0.10
9 -0.02 -0.02 0.10 0.10 0.07 0.07
10 -0.16 - -0.16 - -0.11 -0.11 -0.11 -0.11
Expository
Writing
3 -0.07 -0.07 0.07 0.07 0.07 0.07
4 -0.31 -- -0.31 -- -0.29 -- -0.29 -- -0.29 -- -0.29 --
5 0.13 + 0.08 0.29 ++ 0.28 ++ 0.26 ++ 0.25
6 -0.03 -0.10 - -0.05 -0.08 -0.03 -0.05
7 0.02 -0.03 0.11 0.10 0.07 0.07
8 0.00 -0.07 -0.03 -0.07 -0.04 -0.08
9 0.09 0.09 0.18 0.18 0.14 0.14
10 -0.15 - -0.15 - -0.03 -0.03 -0.04 -0.04
Scientific
Literacy
7 -0.13 - -0.24 -- -0.10 -0.12 -0.14 -0.16
8 -0.19 - -0.43 -- -0.41 -0.53 -0.43 -0.56 ---
9 0.06 0.06 0.32 0.32 0.32 0.32
10 0.01 0.01 n/a n/a n/a n/a
2.2.3.3 The Middle East
In the region of the Middle East, as shown in Table 21, IB students outperformed non-IB students in
Mathematical Literacy and Reading at Grades 3-9, in Writing tasks at Grades 3-10, and in Scientific
Literacy at Grades 7-9. The differences were small to medium in Mathematical Literacy, medium to large
in Reading and Scientific Literacy, and large in Writing tasks.
After taking into account of clustering at school level using the multilevel model (Model 1), IB students
outperformed non-IB students in Narrative Writing at Grades 5, 7, 8 and9, and in Expository Writing at
Grades 3-9, with large differences. After controlling for students’ gender and English-Speaking background
in the multilevel model (Model 2), IB students outperformed non-IB students in Reading at Grade 5 with a
medium difference, in Narrative Writing at Grades 5, 7, 8 and 9 and in Expository Writing at Grades 3-9
with large differences. There were negative effect sizes in Mathematical Literacy and Reading at Grade 10
from the results of both multilevel models. However, these differences were not statistically significant.
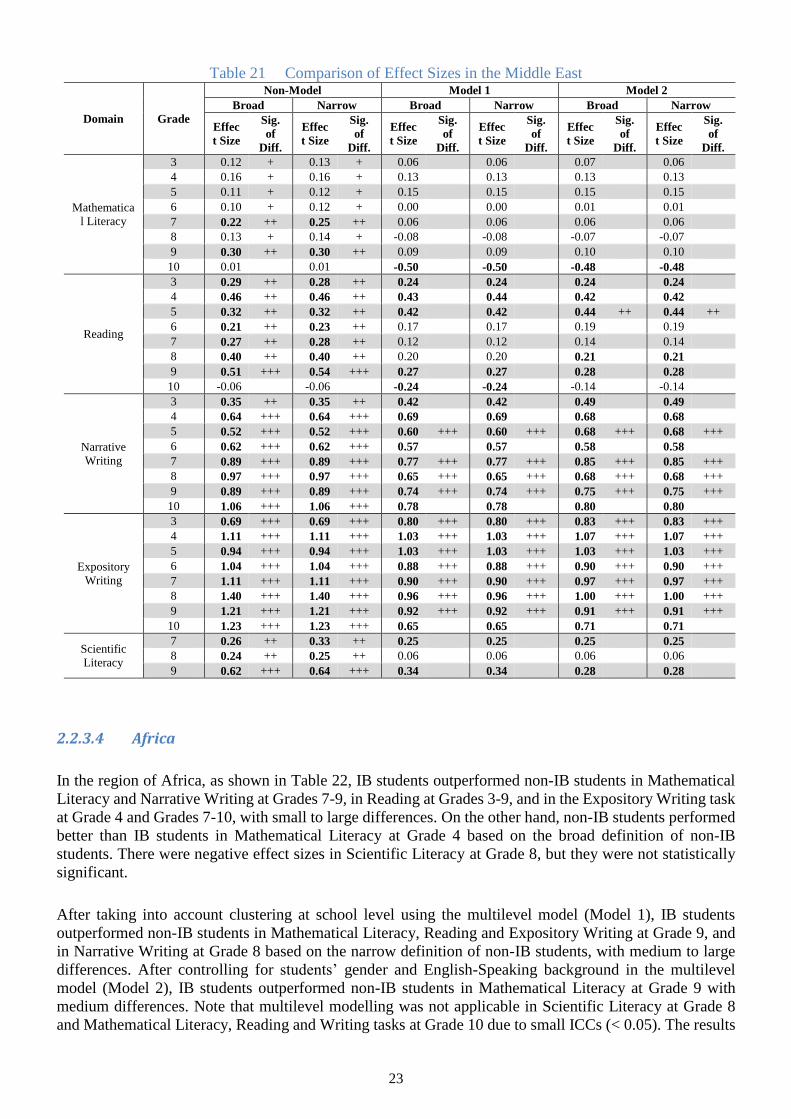
23
Table 21 Comparison of Effect Sizes in the Middle East
Domain Grade
Non-Model Model 1 Model 2
Broad Narrow Broad Narrow Broad Narrow
Effec
t Size
Sig.
of
Diff.
Effec
t Size
Sig.
of
Diff.
Effec
t Size
Sig.
of
Diff.
Effec
t Size
Sig.
of
Diff.
Effec
t Size
Sig.
of
Diff.
Effec
t Size
Sig.
of
Diff.
Mathematica
l Literacy
3 0.12 + 0.13 + 0.06 0.06 0.07 0.06
4 0.16 + 0.16 + 0.13 0.13 0.13 0.13
5 0.11 + 0.12 + 0.15 0.15 0.15 0.15
6 0.10 + 0.12 + 0.00 0.00 0.01 0.01
7 0.22 ++ 0.25 ++ 0.06 0.06 0.06 0.06
8 0.13 + 0.14 + -0.08 -0.08 -0.07 -0.07
9 0.30 ++ 0.30 ++ 0.09 0.09 0.10 0.10
10 0.01 0.01 -0.50 -0.50 -0.48 -0.48
Reading
3 0.29 ++ 0.28 ++ 0.24 0.24 0.24 0.24
4 0.46 ++ 0.46 ++ 0.43 0.44 0.42 0.42
5 0.32 ++ 0.32 ++ 0.42 0.42 0.44 ++ 0.44 ++
6 0.21 ++ 0.23 ++ 0.17 0.17 0.19 0.19
7 0.27 ++ 0.28 ++ 0.12 0.12 0.14 0.14
8 0.40 ++ 0.40 ++ 0.20 0.20 0.21 0.21
9 0.51 +++ 0.54 +++ 0.27 0.27 0.28 0.28
10 -0.06 -0.06 -0.24 -0.24 -0.14 -0.14
Narrative
Writing
3 0.35 ++ 0.35 ++ 0.42 0.42 0.49 0.49
4 0.64 +++ 0.64 +++ 0.69 0.69 0.68 0.68
5 0.52 +++ 0.52 +++ 0.60 +++ 0.60 +++ 0.68 +++ 0.68 +++
6 0.62 +++ 0.62 +++ 0.57 0.57 0.58 0.58
7 0.89 +++ 0.89 +++ 0.77 +++ 0.77 +++ 0.85 +++ 0.85 +++
8 0.97 +++ 0.97 +++ 0.65 +++ 0.65 +++ 0.68 +++ 0.68 +++
9 0.89 +++ 0.89 +++ 0.74 +++ 0.74 +++ 0.75 +++ 0.75 +++
10 1.06 +++ 1.06 +++ 0.78 0.78 0.80 0.80
Expository
Writing
3 0.69 +++ 0.69 +++ 0.80 +++ 0.80 +++ 0.83 +++ 0.83 +++
4 1.11 +++ 1.11 +++ 1.03 +++ 1.03 +++ 1.07 +++ 1.07 +++
5 0.94 +++ 0.94 +++ 1.03 +++ 1.03 +++ 1.03 +++ 1.03 +++
6 1.04 +++ 1.04 +++ 0.88 +++ 0.88 +++ 0.90 +++ 0.90 +++
7 1.11 +++ 1.11 +++ 0.90 +++ 0.90 +++ 0.97 +++ 0.97 +++
8 1.40 +++ 1.40 +++ 0.96 +++ 0.96 +++ 1.00 +++ 1.00 +++
9 1.21 +++ 1.21 +++ 0.92 +++ 0.92 +++ 0.91 +++ 0.91 +++
10 1.23 +++ 1.23 +++ 0.65 0.65 0.71 0.71
Scientific
Literacy
7 0.26 ++ 0.33 ++ 0.25 0.25 0.25 0.25
8 0.24 ++ 0.25 ++ 0.06 0.06 0.06 0.06
9 0.62 +++ 0.64 +++ 0.34 0.34 0.28 0.28
2.2.3.4 Africa
In the region of Africa, as shown in Table 22, IB students outperformed non-IB students in Mathematical
Literacy and Narrative Writing at Grades 7-9, in Reading at Grades 3-9, and in the Expository Writing task
at Grade 4 and Grades 7-10, with small to large differences. On the other hand, non-IB students performed
better than IB students in Mathematical Literacy at Grade 4 based on the broad definition of non-IB
students. There were negative effect sizes in Scientific Literacy at Grade 8, but they were not statistically
significant.
After taking into account clustering at school level using the multilevel model (Model 1), IB students
outperformed non-IB students in Mathematical Literacy, Reading and Expository Writing at Grade 9, and
in Narrative Writing at Grade 8 based on the narrow definition of non-IB students, with medium to large
differences. After controlling for students’ gender and English-Speaking background in the multilevel
model (Model 2), IB students outperformed non-IB students in Mathematical Literacy at Grade 9 with
medium differences. Note that multilevel modelling was not applicable in Scientific Literacy at Grade 8
and Mathematical Literacy, Reading and Writing tasks at Grade 10 due to small ICCs (< 0.05). The results
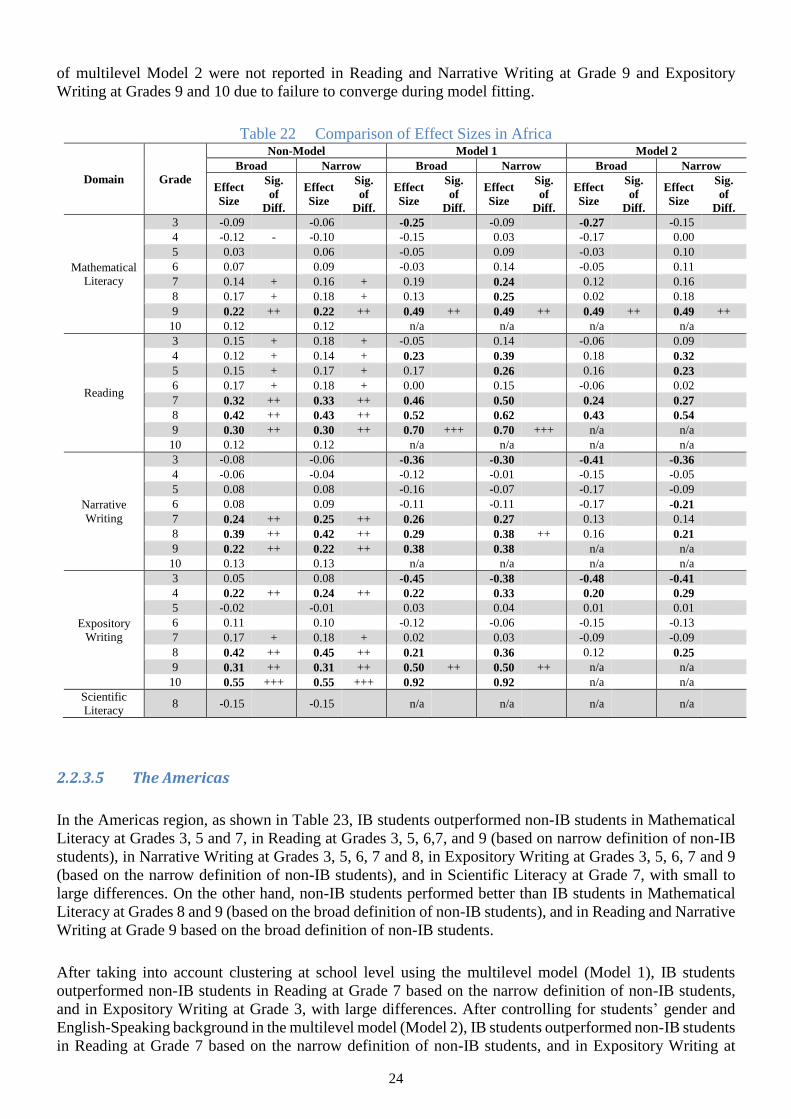
24
of multilevel Model 2 were not reported in Reading and Narrative Writing at Grade 9 and Expository
Writing at Grades 9 and 10 due to failure to converge during model fitting.
Table 22 Comparison of Effect Sizes in Africa
Domain Grade
Non-Model Model 1 Model 2
Broad Narrow Broad Narrow Broad Narrow
Effect
Size
Sig.
of
Diff.
Effect
Size
Sig.
of
Diff.
Effect
Size
Sig.
of
Diff.
Effect
Size
Sig.
of
Diff.
Effect
Size
Sig.
of
Diff.
Effect
Size
Sig.
of
Diff.
Mathematical
Literacy
3 -0.09 -0.06 -0.25 -0.09 -0.27 -0.15
4 -0.12 - -0.10 -0.15 0.03 -0.17 0.00
5 0.03 0.06 -0.05 0.09 -0.03 0.10
6 0.07 0.09 -0.03 0.14 -0.05 0.11
7 0.14 + 0.16 + 0.19 0.24 0.12 0.16
8 0.17 + 0.18 + 0.13 0.25 0.02 0.18
9 0.22 ++ 0.22 ++ 0.49 ++ 0.49 ++ 0.49 ++ 0.49 ++
10 0.12 0.12 n/a n/a n/a n/a
Reading
3 0.15 + 0.18 + -0.05 0.14 -0.06 0.09
4 0.12 + 0.14 + 0.23 0.39 0.18 0.32
5 0.15 + 0.17 + 0.17 0.26 0.16 0.23
6 0.17 + 0.18 + 0.00 0.15 -0.06 0.02
7 0.32 ++ 0.33 ++ 0.46 0.50 0.24 0.27
8 0.42 ++ 0.43 ++ 0.52 0.62 0.43 0.54
9 0.30 ++ 0.30 ++ 0.70 +++ 0.70 +++ n/a n/a
10 0.12 0.12 n/a n/a n/a n/a
Narrative
Writing
3 -0.08 -0.06 -0.36 -0.30 -0.41 -0.36
4 -0.06 -0.04 -0.12 -0.01 -0.15 -0.05
5 0.08 0.08 -0.16 -0.07 -0.17 -0.09
6 0.08 0.09 -0.11 -0.11 -0.17 -0.21
7 0.24 ++ 0.25 ++ 0.26 0.27 0.13 0.14
8 0.39 ++ 0.42 ++ 0.29 0.38 ++ 0.16 0.21
9 0.22 ++ 0.22 ++ 0.38 0.38 n/a n/a
10 0.13 0.13 n/a n/a n/a n/a
Expository
Writing
3 0.05 0.08 -0.45 -0.38 -0.48 -0.41
4 0.22 ++ 0.24 ++ 0.22 0.33 0.20 0.29
5 -0.02 -0.01 0.03 0.04 0.01 0.01
6 0.11 0.10 -0.12 -0.06 -0.15 -0.13
7 0.17 + 0.18 + 0.02 0.03 -0.09 -0.09
8 0.42 ++ 0.45 ++ 0.21 0.36 0.12 0.25
9 0.31 ++ 0.31 ++ 0.50 ++ 0.50 ++ n/a n/a
10 0.55 +++ 0.55 +++ 0.92 0.92 n/a n/a
Scientific
Literacy 8 -0.15 -0.15 n/a n/a n/a n/a
2.2.3.5 The Americas
In the Americas region, as shown in Table 23, IB students outperformed non-IB students in Mathematical
Literacy at Grades 3, 5 and 7, in Reading at Grades 3, 5, 6,7, and 9 (based on narrow definition of non-IB
students), in Narrative Writing at Grades 3, 5, 6, 7 and 8, in Expository Writing at Grades 3, 5, 6, 7 and 9
(based on the narrow definition of non-IB students), and in Scientific Literacy at Grade 7, with small to
large differences. On the other hand, non-IB students performed better than IB students in Mathematical
Literacy at Grades 8 and 9 (based on the broad definition of non-IB students), and in Reading and Narrative
Writing at Grade 9 based on the broad definition of non-IB students.
After taking into account clustering at school level using the multilevel model (Model 1), IB students
outperformed non-IB students in Reading at Grade 7 based on the narrow definition of non-IB students,
and in Expository Writing at Grade 3, with large differences. After controlling for students’ gender and
English-Speaking background in the multilevel model (Model 2), IB students outperformed non-IB students
in Reading at Grade 7 based on the narrow definition of non-IB students, and in Expository Writing at
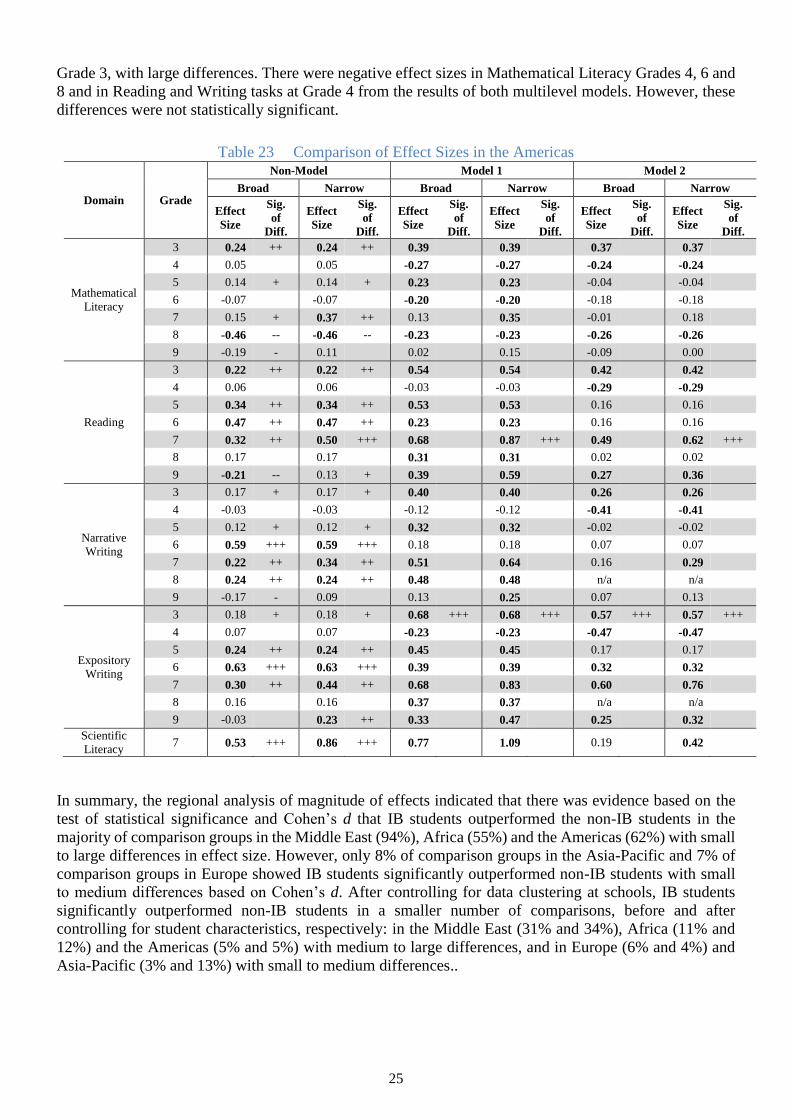
25
Grade 3, with large differences. There were negative effect sizes in Mathematical Literacy Grades 4, 6 and
8 and in Reading and Writing tasks at Grade 4 from the results of both multilevel models. However, these
differences were not statistically significant.
Table 23 Comparison of Effect Sizes in the Americas
Domain Grade
Non-Model Model 1 Model 2
Broad Narrow Broad Narrow Broad Narrow
Effect
Size
Sig.
of
Diff.
Effect
Size
Sig.
of
Diff.
Effect
Size
Sig.
of
Diff.
Effect
Size
Sig.
of
Diff.
Effect
Size
Sig.
of
Diff.
Effect
Size
Sig.
of
Diff.
Mathematical
Literacy
3 0.24 ++ 0.24 ++ 0.39 0.39 0.37 0.37
4 0.05 0.05 -0.27 -0.27 -0.24 -0.24
5 0.14 + 0.14 + 0.23 0.23 -0.04 -0.04
6 -0.07 -0.07 -0.20 -0.20 -0.18 -0.18
7 0.15 + 0.37 ++ 0.13 0.35 -0.01 0.18
8 -0.46 -- -0.46 -- -0.23 -0.23 -0.26 -0.26
9 -0.19 - 0.11 0.02 0.15 -0.09 0.00
Reading
3 0.22 ++ 0.22 ++ 0.54 0.54 0.42 0.42
4 0.06 0.06 -0.03 -0.03 -0.29 -0.29
5 0.34 ++ 0.34 ++ 0.53 0.53 0.16 0.16
6 0.47 ++ 0.47 ++ 0.23 0.23 0.16 0.16
7 0.32 ++ 0.50 +++ 0.68 0.87 +++ 0.49 0.62 +++
8 0.17 0.17 0.31 0.31 0.02 0.02
9 -0.21 -- 0.13 + 0.39 0.59 0.27 0.36
Narrative
Writing
3 0.17 + 0.17 + 0.40 0.40 0.26 0.26
4 -0.03 -0.03 -0.12 -0.12 -0.41 -0.41
5 0.12 + 0.12 + 0.32 0.32 -0.02 -0.02
6 0.59 +++ 0.59 +++ 0.18 0.18 0.07 0.07
7 0.22 ++ 0.34 ++ 0.51 0.64 0.16 0.29
8 0.24 ++ 0.24 ++ 0.48 0.48 n/a n/a
9 -0.17 - 0.09 0.13 0.25 0.07 0.13
Expository
Writing
3 0.18 + 0.18 + 0.68 +++ 0.68 +++ 0.57 +++ 0.57 +++
4 0.07 0.07 -0.23 -0.23 -0.47 -0.47
5 0.24 ++ 0.24 ++ 0.45 0.45 0.17 0.17
6 0.63 +++ 0.63 +++ 0.39 0.39 0.32 0.32
7 0.30 ++ 0.44 ++ 0.68 0.83 0.60 0.76
8 0.16 0.16 0.37 0.37 n/a n/a
9 -0.03 0.23 ++ 0.33 0.47 0.25 0.32
Scientific
Literacy 7 0.53 +++ 0.86 +++ 0.77 1.09 0.19 0.42
In summary, the regional analysis of magnitude of effects indicated that there was evidence based on the
test of statistical significance and Cohen’s d that IB students outperformed the non-IB students in the
majority of comparison groups in the Middle East (94%), Africa (55%) and the Americas (62%) with small
to large differences in effect size. However, only 8% of comparison groups in the Asia-Pacific and 7% of
comparison groups in Europe showed IB students significantly outperformed non-IB students with small
to medium differences based on Cohen’s d. After controlling for data clustering at schools, IB students
significantly outperformed non-IB students in a smaller number of comparisons, before and after
controlling for student characteristics, respectively: in the Middle East (31% and 34%), Africa (11% and
12%) and the Americas (5% and 5%) with medium to large differences, and in Europe (6% and 4%) and
Asia-Pacific (3% and 13%) with small to medium differences..
26
2.2.4 Country Analysis of Student Performance
This section presents the results of country analysis of student performance by region. For country analysis,
number of international school students within grades can be quite small in some countries. It is necessary
to remove the countries by grade with small sample sizes when comparing ISA performance between IB
students and non-IB students. Two data inclusion criteria were used to filter out the IB and non-IB
subgroups with small sample sizes. Both the criteria had to be satisfied for data inclusion. The data inclusion
criteria is applicable to any subgroup analysis. Despite the data inclusion criteria, samples collected for this
study were convenient samples based on schools participating the ISA assessments during 2017-2018 and
they were not representative of IB schools and non-IB schools in each country. Therefore cautions must be
taken in making inference from the results of this section.
Criterion 1: For inclusion, there must be at least two schools at a grade level within a subgroup.
Criterion 2: For inclusion, there must be at least 50 students at a grade level within a subgroup.
A total of 24 countries or economies were included in this analysis: Cambodia, China, Hong Kong SAR,
India, Indonesia, Japan, Malaysia, Philippines, Republic of Korea, Singapore, Thailand, and Vietnam in the
Asia-Pacific, Germany, Italy, Norway, Spain, Switzerland and United Kingdom in Europe, Oman, Saudi
Arabia, and United Arab Emirates in the Middle East, Tanzania in Africa, and Brazil and United States in
the Americas. This section presents summarised comparison results for each country. For each country, the
summarised results present the number of comparisons where IB schools outperformed non-IB schools, the
number of comparisons where non-IB schools outperformed IB schools and the number of non-significant
differences. The detailed results of each country can be found in Appendix 5. The number of schools and
students in each country are shown in Appendix 6.
Results were reported only for two grade levels (Grades 5 and 7) for Cambodia. In Cambodia, no difference
exists in data between the broad definition and the narrow definition of non-IB students. In Cambodia, 8 of
the comparisons were made based on the statistical significance test and Cohen's d, of which 7 reported no
significant differences. IB students outperformed non-IB peers in only 1 comparison, namely in Expository
Writing at Grade 5 with medium difference. After taking into account clustering at school level using the
multilevel model (Model 1), all 5 comparisons2 reported no significant differences. Comparing to the results
of Model 1, no significant difference was found after controlling students’ gender and English-Speaking
background in the multilevel model (Model 2).
In China, 32 comparisons were made based on Cohen's d for each definition of non-IB students, of which
17 reported no significant differences. IB students outperformed non-IB peers in 7 comparisons, namely in
Mathematical Literacy at Grade 8, Reading at Grade 6, Narrative Writing at Grades 6 and 7, and Expository
Writing at Grades 6-8, with effect sizes ranged from small to medium. In addition, based on the narrow
definition of non-IB students, IB students performed better than non-IB students in Reading at Grade 7 with
a small difference. After taking into account clustering at school level using the multilevel model (Model
1), all 32 comparisons reported no significant differences. The comparison results after controlling for
students’ gender and English-Speaking background in the multilevel model (Model 2) were similar to the
results of Model 1. No significant difference was found between the broad definition and narrow definition
of non-IB students based on the multilevel models.
Results were reported only for PYP levels for Hong Kong SAR. In Hong Kong SAR, 15 comparisons were
made based on Cohen's d for each definition of non-IB students. In all these comparisons, non-IB students
outperformed IB students with medium to large differences. No significant difference was found between
the broad definition and narrow definition of non-IB students. After taking into account clustering at school
level using the multilevel model (Model 1), 8 out of 15 comparisons reported no significant differences.
Non-IB students outperformed IB students in the other 7 comparisons with medium to large differences,
2 Comparing to the number of comparison based on Cohen’s d, 2 comparisons were not applicable to multilevel models due to
small ICCs. One additional comparison was not applicable due to failure to converge during model fitting.
27
namely in Mathematical Literacy and Reading at Grades 3 and 4, and in Narrative Writing at Grades 3-5.
After controlling for students’ gender and English-Speaking background in the multilevel model (Model
2), 7 out of 15 comparisons reported no significant differences. Non-IB students outperformed IB students
in the other 8 comparisons with medium to large differences, namely in Mathematical Literacy at Grades 3
and 4, and in Reading and Narrative Writing at Grades 3-5.
In India, no difference exists in data between the broad definition and the narrow definition of non-IB
students. In India, 24 comparisons were made based on Cohen's d, of which 11 reported no significant
differences. IB students outperformed non-IB peers in 13 comparisons, namely in Mathematical Literacy
at Grade 8, Reading at Grades 3-7, Narrative Writing at Grades 4-8 and Expository Writing at Grades 7 and
8, with effect sizes ranged from medium to large. After taking into account clustering at school level using
the multilevel model (Model 1), all comparisons reported no significant differences between IB students
and non-IB students. Comparing to the results of Model 1, no significant difference was found after
controlling for students’ gender and English-Speaking background in the multilevel model (Model 2).
In Indonesia, 27 comparisons were made based on Cohen's d for each definition of non-IB students, of
which 12 reported no significant differences. IB students outperformed non-IB peers in 6 comparisons,
namely in Mathematical Literacy at Grade 9, Narrative Writing and Expository Writing at Grades 3 and 4,
and Scientific Literacy at Grade 7 with effect sizes ranged from small to large. No significant difference
was found between the broad definition and narrow definition of non-IB students. After taking into account
clustering at school level using the multilevel model (Model 1), all comparisons reported no significant
differences between IB students and non-IB students. After controlling for students’ gender and English-
Speaking background in the multilevel model (Model 2), all comparisons reported no significant
differences. No significant difference was found between the broad definition and narrow definition of non-
IB students based on the multilevel models.
In Japan, 28 comparisons were made based on Cohen's d for each definition of non-IB students, of which
4 reported no significant differences. IB students outperformed non-IB peers in 5 comparisons, namely in
Mathematical Literacy at Grades 6 and 9, in Reading, Narrative Writing and Expository Writing at Grade
9 with effect sizes ranged from medium to large. In addition, based on the narrow definition of non-IB
students, IB students performed better than non-IB students in Reading at Grade 6 with a medium
difference. After taking into account clustering at school level using the multilevel model (Model 1), all
comparisons reported no significant differences based on the broad definition of non-IB students. Based on
the narrow definition of non-IB students, IB students outperformed non-IB peers in Mathematical Literacy
at Grade 9 with a large difference. After controlling for students’ gender and English-Speaking background
in the multilevel model (Model 2), IB students still outperformed non-IB peers in Mathematical Literacy at
Grade 9 with a large difference based on the narrow definition of non-IB students.
Results were reported only for three PYP grade levels (grades 4-6) for Malaysia. In Malaysia, no difference
exists in data between the broad definition and the narrow definition of non-IB students. In Malaysia, 8
comparisons were made based on Cohen's d, of which 3 reported no significant differences. Non-IB
students outperformed IB students in the other 5 comparisons with medium to large differences, namely in
Mathematical Literacy and Reading at Grades 4 and 6, and in Expository Writing at Grade 4. After taking
into account clustering at school level using the multilevel model (Model 1), 3 comparisons were made, of
which 2 reported no significant differences. Non-IB students outperformed IB students in one comparison
with large differences, namely in Expository Writing at Grade 4. Comparing to the results of Model 1, no
significant difference was found after controlling for students’ gender and English-Speaking background
in the multilevel model (Model 2).
Results were reported only for two PYP grade levels (grades 3 and 6) for the Philippines. In the Philippines,
no difference exists in data between the broad definition and the narrow definition of non-IB students. Eight
comparisons were made based on Cohen's d, of which 3 reported no significant differences. IB students
outperformed non-IB peers in 5 comparisons, namely in Mathematical Literacy and Expository Writing at
Grade 3, Reading at Grades 3 and 6, and Narrative Writing at Grade 6, with effect sizes ranging from
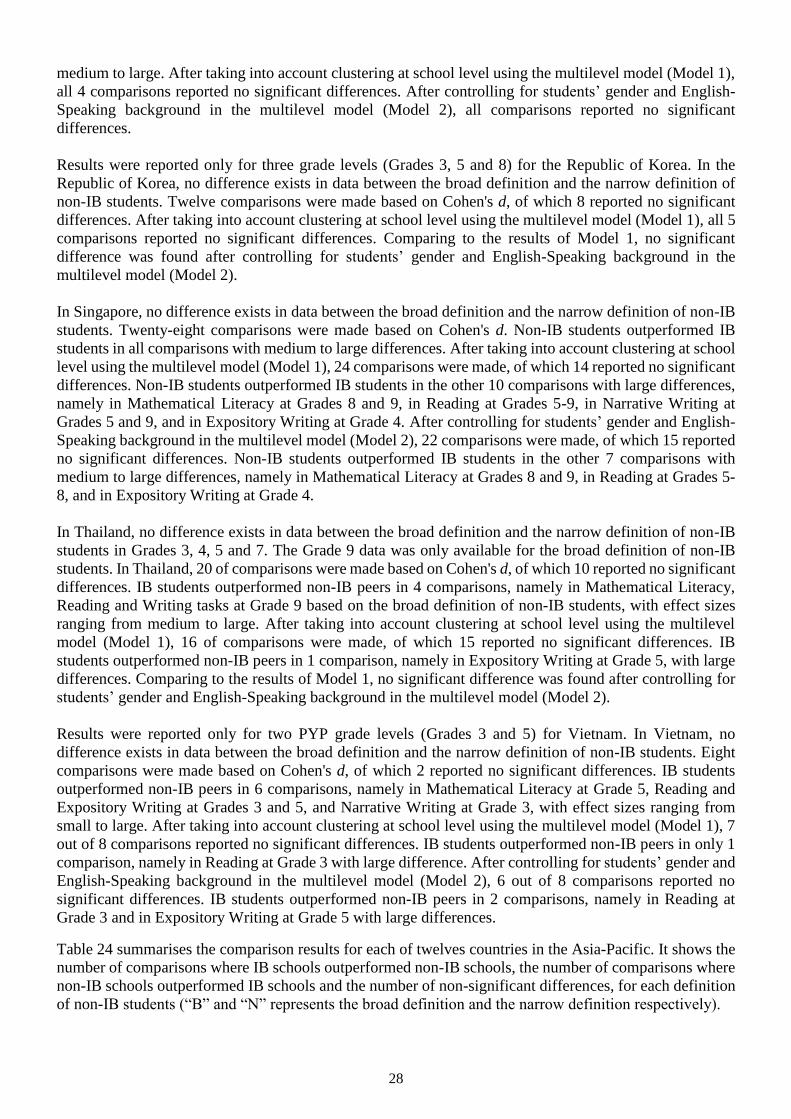
28
medium to large. After taking into account clustering at school level using the multilevel model (Model 1),
all 4 comparisons reported no significant differences. After controlling for students’ gender and English-
Speaking background in the multilevel model (Model 2), all comparisons reported no significant
differences.
Results were reported only for three grade levels (Grades 3, 5 and 8) for the Republic of Korea. In the
Republic of Korea, no difference exists in data between the broad definition and the narrow definition of
non-IB students. Twelve comparisons were made based on Cohen's d, of which 8 reported no significant
differences. After taking into account clustering at school level using the multilevel model (Model 1), all 5
comparisons reported no significant differences. Comparing to the results of Model 1, no significant
difference was found after controlling for students’ gender and English-Speaking background in the
multilevel model (Model 2).
In Singapore, no difference exists in data between the broad definition and the narrow definition of non-IB
students. Twenty-eight comparisons were made based on Cohen's d. Non-IB students outperformed IB
students in all comparisons with medium to large differences. After taking into account clustering at school
level using the multilevel model (Model 1), 24 comparisons were made, of which 14 reported no significant
differences. Non-IB students outperformed IB students in the other 10 comparisons with large differences,
namely in Mathematical Literacy at Grades 8 and 9, in Reading at Grades 5-9, in Narrative Writing at
Grades 5 and 9, and in Expository Writing at Grade 4. After controlling for students’ gender and English-
Speaking background in the multilevel model (Model 2), 22 comparisons were made, of which 15 reported
no significant differences. Non-IB students outperformed IB students in the other 7 comparisons with
medium to large differences, namely in Mathematical Literacy at Grades 8 and 9, in Reading at Grades 5-
8, and in Expository Writing at Grade 4.
In Thailand, no difference exists in data between the broad definition and the narrow definition of non-IB
students in Grades 3, 4, 5 and 7. The Grade 9 data was only available for the broad definition of non-IB
students. In Thailand, 20 of comparisons were made based on Cohen's d, of which 10 reported no significant
differences. IB students outperformed non-IB peers in 4 comparisons, namely in Mathematical Literacy,
Reading and Writing tasks at Grade 9 based on the broad definition of non-IB students, with effect sizes
ranging from medium to large. After taking into account clustering at school level using the multilevel
model (Model 1), 16 of comparisons were made, of which 15 reported no significant differences. IB
students outperformed non-IB peers in 1 comparison, namely in Expository Writing at Grade 5, with large
differences. Comparing to the results of Model 1, no significant difference was found after controlling for
students’ gender and English-Speaking background in the multilevel model (Model 2).
Results were reported only for two PYP grade levels (Grades 3 and 5) for Vietnam. In Vietnam, no
difference exists in data between the broad definition and the narrow definition of non-IB students. Eight
comparisons were made based on Cohen's d, of which 2 reported no significant differences. IB students
outperformed non-IB peers in 6 comparisons, namely in Mathematical Literacy at Grade 5, Reading and
Expository Writing at Grades 3 and 5, and Narrative Writing at Grade 3, with effect sizes ranging from
small to large. After taking into account clustering at school level using the multilevel model (Model 1), 7
out of 8 comparisons reported no significant differences. IB students outperformed non-IB peers in only 1
comparison, namely in Reading at Grade 3 with large difference. After controlling for students’ gender and
English-Speaking background in the multilevel model (Model 2), 6 out of 8 comparisons reported no
significant differences. IB students outperformed non-IB peers in 2 comparisons, namely in Reading at
Grade 3 and in Expository Writing at Grade 5 with large differences.
Table 24 summarises the comparison results for each of twelves countries in the Asia-Pacific. It shows the
number of comparisons where IB schools outperformed non-IB schools, the number of comparisons where
non-IB schools outperformed IB schools and the number of non-significant differences, for each definition
of non-IB students (“B” and “N” represents the broad definition and the narrow definition respectively).
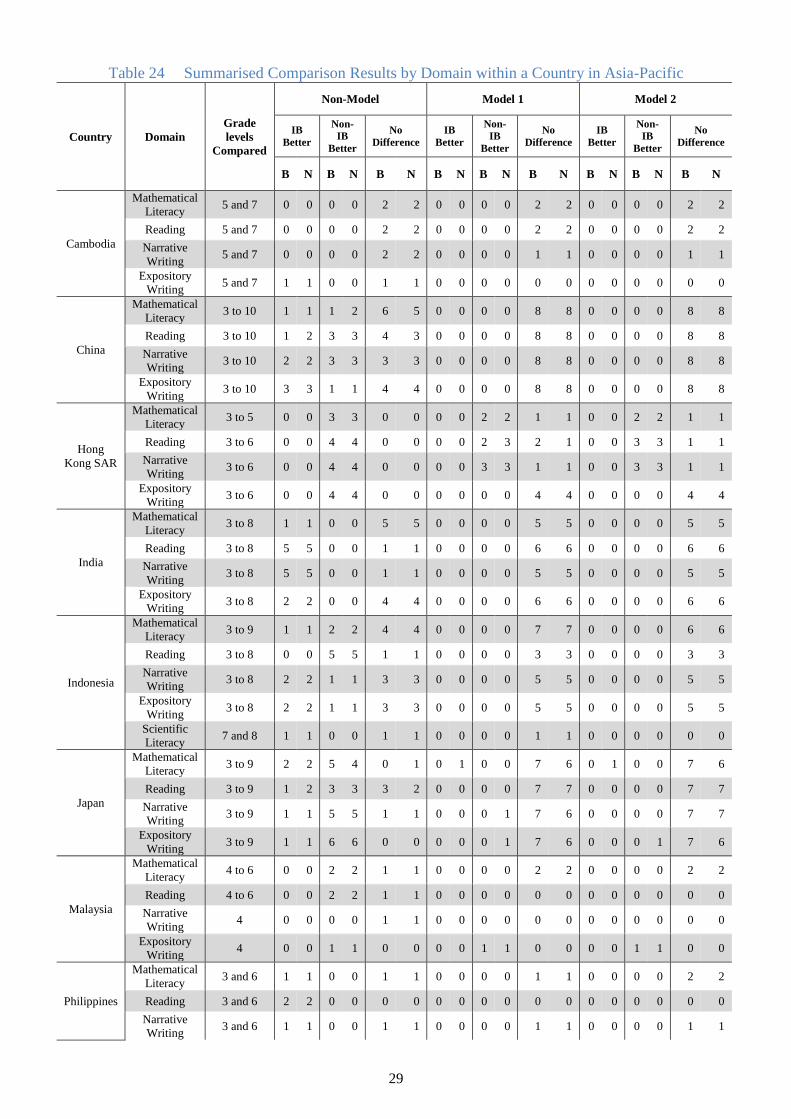
29
Table 24 Summarised Comparison Results by Domain within a Country in Asia-Pacific
Country Domain
Grade
levels
Compared
Non-Model Model 1 Model 2
IB
Better
Non-
IB
Better
No
Difference
IB
Better
Non-
IB
Better
No
Difference
IB
Better
Non-
IB
Better
No
Difference
B N B N B N B N B N B N B N B N B N
Cambodia
Mathematical
Literacy 5 and 7 0 0 0 0 2 2 0 0 0 0 2 2 0 0 0 0 2 2
Reading 5 and 7 0 0 0 0 2 2 0 0 0 0 2 2 0 0 0 0 2 2
Narrative
Writing 5 and 7 0 0 0 0 2 2 0 0 0 0 1 1 0 0 0 0 1 1
Expository
Writing 5 and 7 1 1 0 0 1 1 0 0 0 0 0 0 0 0 0 0 0 0
China
Mathematical
Literacy 3 to 10 1 1 1 2 6 5 0 0 0 0 8 8 0 0 0 0 8 8
Reading 3 to 10 1 2 3 3 4 3 0 0 0 0 8 8 0 0 0 0 8 8
Narrative
Writing 3 to 10 2 2 3 3 3 3 0 0 0 0 8 8 0 0 0 0 8 8
Expository
Writing 3 to 10 3 3 1 1 4 4 0 0 0 0 8 8 0 0 0 0 8 8
Hong
Kong SAR
Mathematical
Literacy 3 to 5 0 0 3 3 0 0 0 0 2 2 1 1 0 0 2 2 1 1
Reading 3 to 6 0 0 4 4 0 0 0 0 2 3 2 1 0 0 3 3 1 1
Narrative
Writing 3 to 6 0 0 4 4 0 0 0 0 3 3 1 1 0 0 3 3 1 1
Expository
Writing 3 to 6 0 0 4 4 0 0 0 0 0 0 4 4 0 0 0 0 4 4
India
Mathematical
Literacy 3 to 8 1 1 0 0 5 5 0 0 0 0 5 5 0 0 0 0 5 5
Reading 3 to 8 5 5 0 0 1 1 0 0 0 0 6 6 0 0 0 0 6 6
Narrative
Writing 3 to 8 5 5 0 0 1 1 0 0 0 0 5 5 0 0 0 0 5 5
Expository
Writing 3 to 8 2 2 0 0 4 4 0 0 0 0 6 6 0 0 0 0 6 6
Indonesia
Mathematical
Literacy 3 to 9 1 1 2 2 4 4 0 0 0 0 7 7 0 0 0 0 6 6
Reading 3 to 8 0 0 5 5 1 1 0 0 0 0 3 3 0 0 0 0 3 3
Narrative
Writing 3 to 8 2 2 1 1 3 3 0 0 0 0 5 5 0 0 0 0 5 5
Expository
Writing 3 to 8 2 2 1 1 3 3 0 0 0 0 5 5 0 0 0 0 5 5
Scientific
Literacy 7 and 8 1 1 0 0 1 1 0 0 0 0 1 1 0 0 0 0 0 0
Japan
Mathematical
Literacy 3 to 9 2 2 5 4 0 1 0 1 0 0 7 6 0 1 0 0 7 6
Reading 3 to 9 1 2 3 3 3 2 0 0 0 0 7 7 0 0 0 0 7 7
Narrative
Writing 3 to 9 1 1 5 5 1 1 0 0 0 1 7 6 0 0 0 0 7 7
Expository
Writing 3 to 9 1 1 6 6 0 0 0 0 0 1 7 6 0 0 0 1 7 6
Malaysia
Mathematical
Literacy 4 to 6 0 0 2 2 1 1 0 0 0 0 2 2 0 0 0 0 2 2
Reading 4 to 6 0 0 2 2 1 1 0 0 0 0 0 0 0 0 0 0 0 0
Narrative
Writing 4 0 0 0 0 1 1 0 0 0 0 0 0 0 0 0 0 0 0
Expository
Writing 4 0 0 1 1 0 0 0 0 1 1 0 0 0 0 1 1 0 0
Philippines
Mathematical
Literacy 3 and 6 1 1 0 0 1 1 0 0 0 0 1 1 0 0 0 0 2 2
Reading 3 and 6 2 2 0 0 0 0 0 0 0 0 0 0 0 0 0 0 0 0
Narrative
Writing 3 and 6 1 1 0 0 1 1 0 0 0 0 1 1 0 0 0 0 1 1
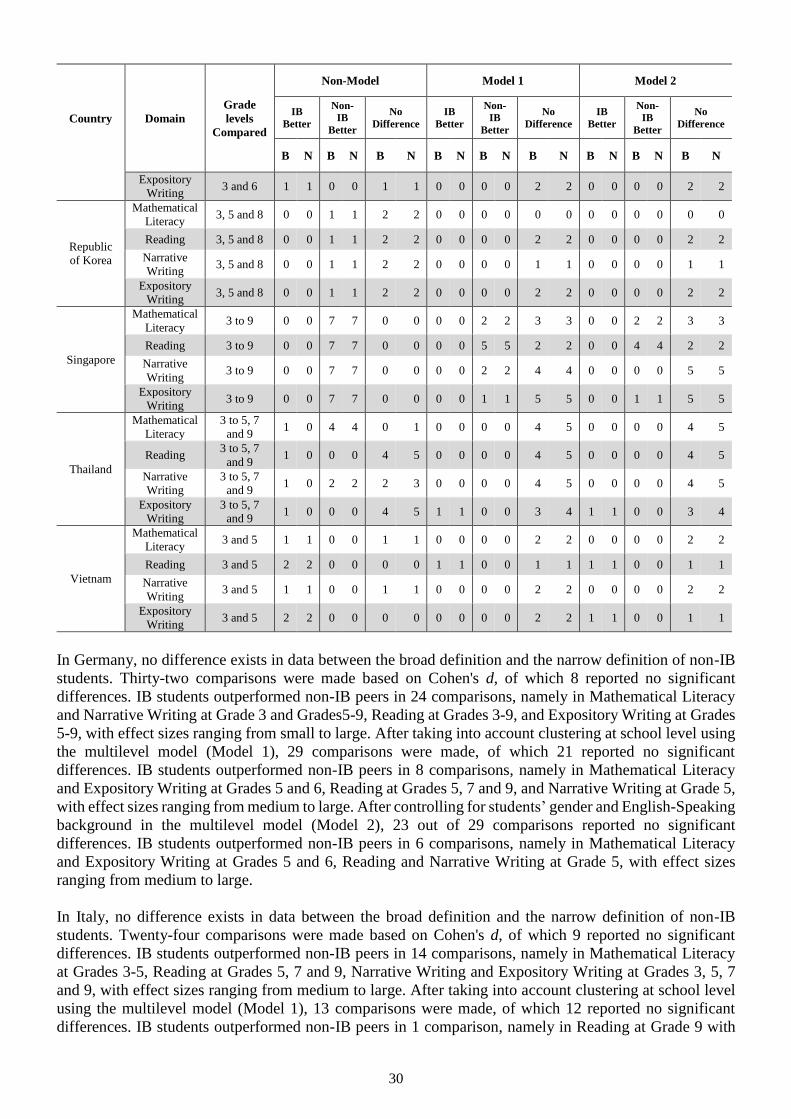
30
Country Domain
Grade
levels
Compared
Non-Model Model 1 Model 2
IB
Better
Non-
IB
Better
No
Difference
IB
Better
Non-
IB
Better
No
Difference
IB
Better
Non-
IB
Better
No
Difference
B N B N B N B N B N B N B N B N B N
Expository
Writing 3 and 6 1 1 0 0 1 1 0 0 0 0 2 2 0 0 0 0 2 2
Republic
of Korea
Mathematical
Literacy 3, 5 and 8 0 0 1 1 2 2 0 0 0 0 0 0 0 0 0 0 0 0
Reading 3, 5 and 8 0 0 1 1 2 2 0 0 0 0 2 2 0 0 0 0 2 2
Narrative
Writing 3, 5 and 8 0 0 1 1 2 2 0 0 0 0 1 1 0 0 0 0 1 1
Expository
Writing 3, 5 and 8 0 0 1 1 2 2 0 0 0 0 2 2 0 0 0 0 2 2
Singapore
Mathematical
Literacy 3 to 9 0 0 7 7 0 0 0 0 2 2 3 3 0 0 2 2 3 3
Reading 3 to 9 0 0 7 7 0 0 0 0 5 5 2 2 0 0 4 4 2 2
Narrative
Writing 3 to 9 0 0 7 7 0 0 0 0 2 2 4 4 0 0 0 0 5 5
Expository
Writing 3 to 9 0 0 7 7 0 0 0 0 1 1 5 5 0 0 1 1 5 5
Thailand
Mathematical
Literacy
3 to 5, 7
and 9 1 0 4 4 0 1 0 0 0 0 4 5 0 0 0 0 4 5
Reading 3 to 5, 7
and 9 1 0 0 0 4 5 0 0 0 0 4 5 0 0 0 0 4 5
Narrative
Writing
3 to 5, 7
and 9 1 0 2 2 2 3 0 0 0 0 4 5 0 0 0 0 4 5
Expository
Writing
3 to 5, 7
and 9 1 0 0 0 4 5 1 1 0 0 3 4 1 1 0 0 3 4
Vietnam
Mathematical
Literacy 3 and 5 1 1 0 0 1 1 0 0 0 0 2 2 0 0 0 0 2 2
Reading 3 and 5 2 2 0 0 0 0 1 1 0 0 1 1 1 1 0 0 1 1
Narrative
Writing 3 and 5 1 1 0 0 1 1 0 0 0 0 2 2 0 0 0 0 2 2
Expository
Writing 3 and 5 2 2 0 0 0 0 0 0 0 0 2 2 1 1 0 0 1 1
In Germany, no difference exists in data between the broad definition and the narrow definition of non-IB
students. Thirty-two comparisons were made based on Cohen's d, of which 8 reported no significant
differences. IB students outperformed non-IB peers in 24 comparisons, namely in Mathematical Literacy
and Narrative Writing at Grade 3 and Grades5-9, Reading at Grades 3-9, and Expository Writing at Grades
5-9, with effect sizes ranging from small to large. After taking into account clustering at school level using
the multilevel model (Model 1), 29 comparisons were made, of which 21 reported no significant
differences. IB students outperformed non-IB peers in 8 comparisons, namely in Mathematical Literacy
and Expository Writing at Grades 5 and 6, Reading at Grades 5, 7 and 9, and Narrative Writing at Grade 5,
with effect sizes ranging from medium to large. After controlling for students’ gender and English-Speaking
background in the multilevel model (Model 2), 23 out of 29 comparisons reported no significant
differences. IB students outperformed non-IB peers in 6 comparisons, namely in Mathematical Literacy
and Expository Writing at Grades 5 and 6, Reading and Narrative Writing at Grade 5, with effect sizes
ranging from medium to large.
In Italy, no difference exists in data between the broad definition and the narrow definition of non-IB
students. Twenty-four comparisons were made based on Cohen's d, of which 9 reported no significant
differences. IB students outperformed non-IB peers in 14 comparisons, namely in Mathematical Literacy
at Grades 3-5, Reading at Grades 5, 7 and 9, Narrative Writing and Expository Writing at Grades 3, 5, 7
and 9, with effect sizes ranging from medium to large. After taking into account clustering at school level
using the multilevel model (Model 1), 13 comparisons were made, of which 12 reported no significant
differences. IB students outperformed non-IB peers in 1 comparison, namely in Reading at Grade 9 with
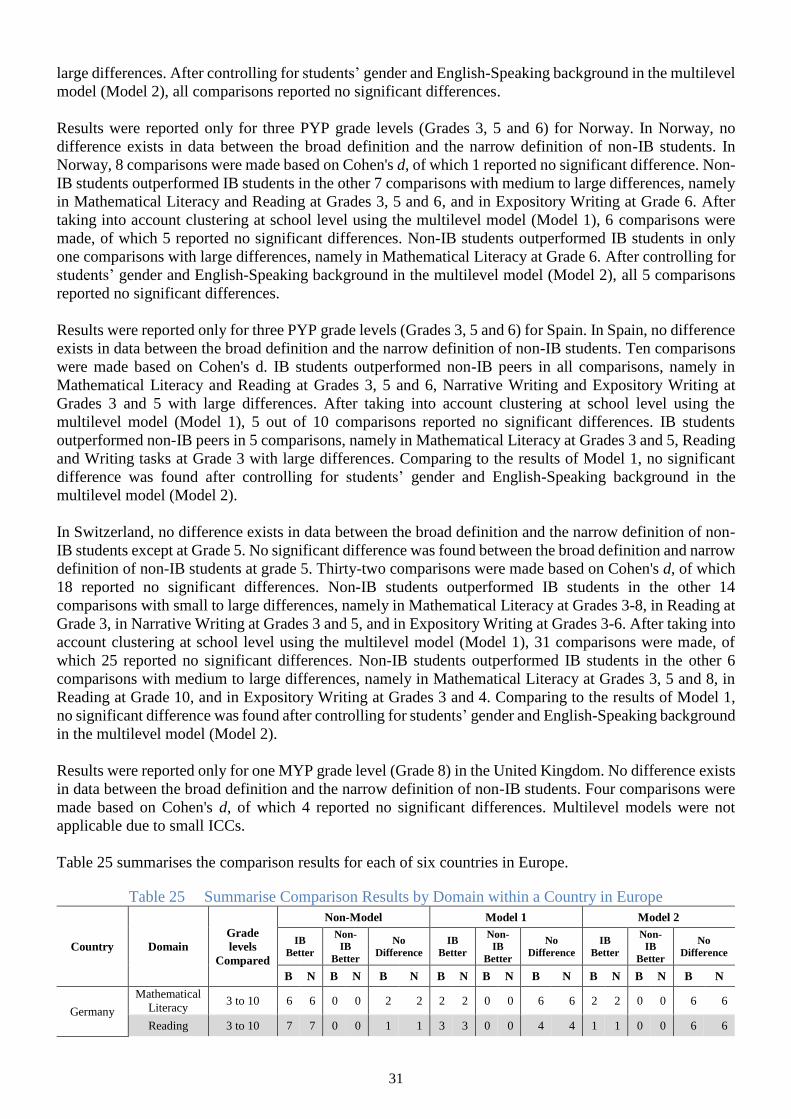
31
large differences. After controlling for students’ gender and English-Speaking background in the multilevel
model (Model 2), all comparisons reported no significant differences.
Results were reported only for three PYP grade levels (Grades 3, 5 and 6) for Norway. In Norway, no
difference exists in data between the broad definition and the narrow definition of non-IB students. In
Norway, 8 comparisons were made based on Cohen's d, of which 1 reported no significant difference. Non-
IB students outperformed IB students in the other 7 comparisons with medium to large differences, namely
in Mathematical Literacy and Reading at Grades 3, 5 and 6, and in Expository Writing at Grade 6. After
taking into account clustering at school level using the multilevel model (Model 1), 6 comparisons were
made, of which 5 reported no significant differences. Non-IB students outperformed IB students in only
one comparisons with large differences, namely in Mathematical Literacy at Grade 6. After controlling for
students’ gender and English-Speaking background in the multilevel model (Model 2), all 5 comparisons
reported no significant differences.
Results were reported only for three PYP grade levels (Grades 3, 5 and 6) for Spain. In Spain, no difference
exists in data between the broad definition and the narrow definition of non-IB students. Ten comparisons
were made based on Cohen's d. IB students outperformed non-IB peers in all comparisons, namely in
Mathematical Literacy and Reading at Grades 3, 5 and 6, Narrative Writing and Expository Writing at
Grades 3 and 5 with large differences. After taking into account clustering at school level using the
multilevel model (Model 1), 5 out of 10 comparisons reported no significant differences. IB students
outperformed non-IB peers in 5 comparisons, namely in Mathematical Literacy at Grades 3 and 5, Reading
and Writing tasks at Grade 3 with large differences. Comparing to the results of Model 1, no significant
difference was found after controlling for students’ gender and English-Speaking background in the
multilevel model (Model 2).
In Switzerland, no difference exists in data between the broad definition and the narrow definition of non-
IB students except at Grade 5. No significant difference was found between the broad definition and narrow
definition of non-IB students at grade 5. Thirty-two comparisons were made based on Cohen's d, of which
18 reported no significant differences. Non-IB students outperformed IB students in the other 14
comparisons with small to large differences, namely in Mathematical Literacy at Grades 3-8, in Reading at
Grade 3, in Narrative Writing at Grades 3 and 5, and in Expository Writing at Grades 3-6. After taking into
account clustering at school level using the multilevel model (Model 1), 31 comparisons were made, of
which 25 reported no significant differences. Non-IB students outperformed IB students in the other 6
comparisons with medium to large differences, namely in Mathematical Literacy at Grades 3, 5 and 8, in
Reading at Grade 10, and in Expository Writing at Grades 3 and 4. Comparing to the results of Model 1,
no significant difference was found after controlling for students’ gender and English-Speaking background
in the multilevel model (Model 2).
Results were reported only for one MYP grade level (Grade 8) in the United Kingdom. No difference exists
in data between the broad definition and the narrow definition of non-IB students. Four comparisons were
made based on Cohen's d, of which 4 reported no significant differences. Multilevel models were not
applicable due to small ICCs.
Table 25 summarises the comparison results for each of six countries in Europe.
Table 25 Summarise Comparison Results by Domain within a Country in Europe
Country Domain
Grade
levels
Compared
Non-Model Model 1 Model 2
IB
Better
Non-
IB
Better
No
Difference
IB
Better
Non-
IB
Better
No
Difference
IB
Better
Non-
IB
Better
No
Difference
B N B N B N B N B N B N B N B N B N
Germany
Mathematical
Literacy 3 to 10 6 6 0 0 2 2 2 2 0 0 6 6 2 2 0 0 6 6
Reading 3 to 10 7 7 0 0 1 1 3 3 0 0 4 4 1 1 0 0 6 6
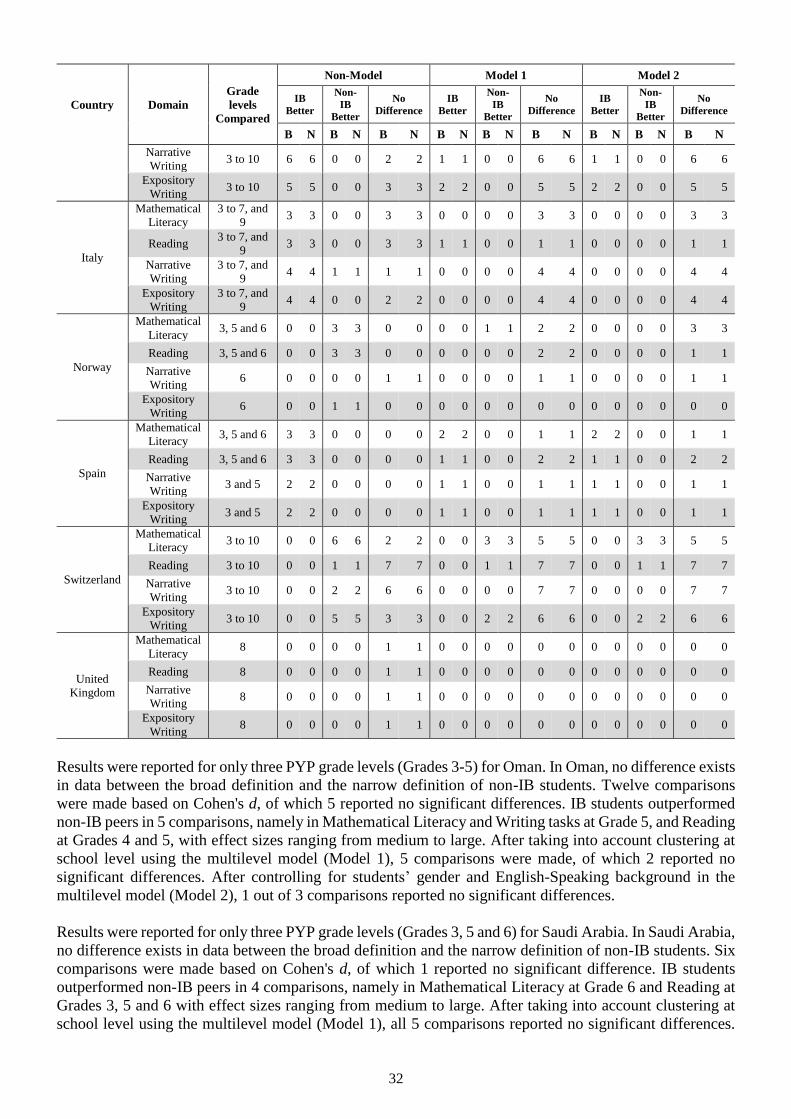
32
Country Domain
Grade
levels
Compared
Non-Model Model 1 Model 2
IB
Better
Non-
IB
Better
No
Difference
IB
Better
Non-
IB
Better
No
Difference
IB
Better
Non-
IB
Better
No
Difference
B N B N B N B N B N B N B N B N B N
Narrative
Writing 3 to 10 6 6 0 0 2 2 1 1 0 0 6 6 1 1 0 0 6 6
Expository
Writing 3 to 10 5 5 0 0 3 3 2 2 0 0 5 5 2 2 0 0 5 5
Italy
Mathematical
Literacy
3 to 7, and
9 3 3 0 0 3 3 0 0 0 0 3 3 0 0 0 0 3 3
Reading 3 to 7, and
9 3 3 0 0 3 3 1 1 0 0 1 1 0 0 0 0 1 1
Narrative
Writing
3 to 7, and
9 4 4 1 1 1 1 0 0 0 0 4 4 0 0 0 0 4 4
Expository
Writing
3 to 7, and
9 4 4 0 0 2 2 0 0 0 0 4 4 0 0 0 0 4 4
Norway
Mathematical
Literacy 3, 5 and 6 0 0 3 3 0 0 0 0 1 1 2 2 0 0 0 0 3 3
Reading 3, 5 and 6 0 0 3 3 0 0 0 0 0 0 2 2 0 0 0 0 1 1
Narrative
Writing 6 0 0 0 0 1 1 0 0 0 0 1 1 0 0 0 0 1 1
Expository
Writing 6 0 0 1 1 0 0 0 0 0 0 0 0 0 0 0 0 0 0
Spain
Mathematical
Literacy 3, 5 and 6 3 3 0 0 0 0 2 2 0 0 1 1 2 2 0 0 1 1
Reading 3, 5 and 6 3 3 0 0 0 0 1 1 0 0 2 2 1 1 0 0 2 2
Narrative
Writing 3 and 5 2 2 0 0 0 0 1 1 0 0 1 1 1 1 0 0 1 1
Expository
Writing 3 and 5 2 2 0 0 0 0 1 1 0 0 1 1 1 1 0 0 1 1
Switzerland
Mathematical
Literacy 3 to 10 0 0 6 6 2 2 0 0 3 3 5 5 0 0 3 3 5 5
Reading 3 to 10 0 0 1 1 7 7 0 0 1 1 7 7 0 0 1 1 7 7
Narrative
Writing 3 to 10 0 0 2 2 6 6 0 0 0 0 7 7 0 0 0 0 7 7
Expository
Writing 3 to 10 0 0 5 5 3 3 0 0 2 2 6 6 0 0 2 2 6 6
United
Kingdom
Mathematical
Literacy 8 0 0 0 0 1 1 0 0 0 0 0 0 0 0 0 0 0 0
Reading 8 0 0 0 0 1 1 0 0 0 0 0 0 0 0 0 0 0 0
Narrative
Writing 8 0 0 0 0 1 1 0 0 0 0 0 0 0 0 0 0 0 0
Expository
Writing 8 0 0 0 0 1 1 0 0 0 0 0 0 0 0 0 0 0 0
Results were reported for only three PYP grade levels (Grades 3-5) for Oman. In Oman, no difference exists
in data between the broad definition and the narrow definition of non-IB students. Twelve comparisons
were made based on Cohen's d, of which 5 reported no significant differences. IB students outperformed
non-IB peers in 5 comparisons, namely in Mathematical Literacy and Writing tasks at Grade 5, and Reading
at Grades 4 and 5, with effect sizes ranging from medium to large. After taking into account clustering at
school level using the multilevel model (Model 1), 5 comparisons were made, of which 2 reported no
significant differences. After controlling for students’ gender and English-Speaking background in the
multilevel model (Model 2), 1 out of 3 comparisons reported no significant differences.
Results were reported for only three PYP grade levels (Grades 3, 5 and 6) for Saudi Arabia. In Saudi Arabia,
no difference exists in data between the broad definition and the narrow definition of non-IB students. Six
comparisons were made based on Cohen's d, of which 1 reported no significant difference. IB students
outperformed non-IB peers in 4 comparisons, namely in Mathematical Literacy at Grade 6 and Reading at
Grades 3, 5 and 6 with effect sizes ranging from medium to large. After taking into account clustering at
school level using the multilevel model (Model 1), all 5 comparisons reported no significant differences.
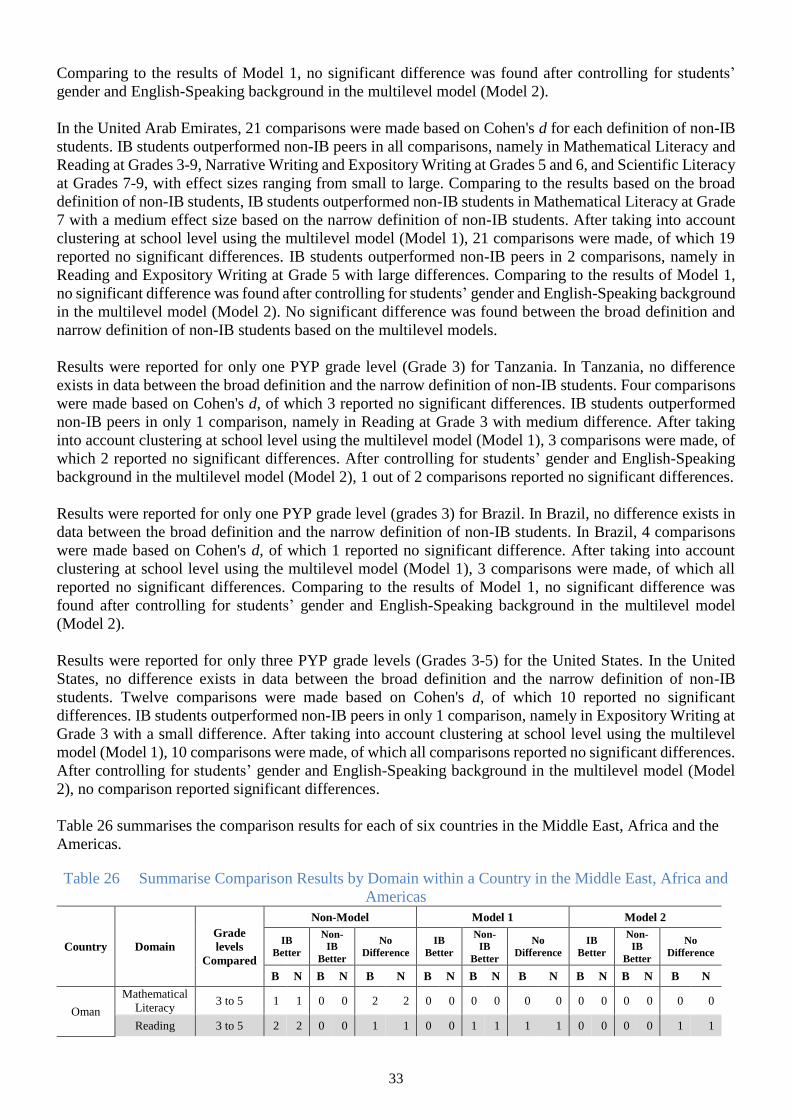
33
Comparing to the results of Model 1, no significant difference was found after controlling for students’
gender and English-Speaking background in the multilevel model (Model 2).
In the United Arab Emirates, 21 comparisons were made based on Cohen's d for each definition of non-IB
students. IB students outperformed non-IB peers in all comparisons, namely in Mathematical Literacy and
Reading at Grades 3-9, Narrative Writing and Expository Writing at Grades 5 and 6, and Scientific Literacy
at Grades 7-9, with effect sizes ranging from small to large. Comparing to the results based on the broad
definition of non-IB students, IB students outperformed non-IB students in Mathematical Literacy at Grade
7 with a medium effect size based on the narrow definition of non-IB students. After taking into account
clustering at school level using the multilevel model (Model 1), 21 comparisons were made, of which 19
reported no significant differences. IB students outperformed non-IB peers in 2 comparisons, namely in
Reading and Expository Writing at Grade 5 with large differences. Comparing to the results of Model 1,
no significant difference was found after controlling for students’ gender and English-Speaking background
in the multilevel model (Model 2). No significant difference was found between the broad definition and
narrow definition of non-IB students based on the multilevel models.
Results were reported for only one PYP grade level (Grade 3) for Tanzania. In Tanzania, no difference
exists in data between the broad definition and the narrow definition of non-IB students. Four comparisons
were made based on Cohen's d, of which 3 reported no significant differences. IB students outperformed
non-IB peers in only 1 comparison, namely in Reading at Grade 3 with medium difference. After taking
into account clustering at school level using the multilevel model (Model 1), 3 comparisons were made, of
which 2 reported no significant differences. After controlling for students’ gender and English-Speaking
background in the multilevel model (Model 2), 1 out of 2 comparisons reported no significant differences.
Results were reported for only one PYP grade level (grades 3) for Brazil. In Brazil, no difference exists in
data between the broad definition and the narrow definition of non-IB students. In Brazil, 4 comparisons
were made based on Cohen's d, of which 1 reported no significant difference. After taking into account
clustering at school level using the multilevel model (Model 1), 3 comparisons were made, of which all
reported no significant differences. Comparing to the results of Model 1, no significant difference was
found after controlling for students’ gender and English-Speaking background in the multilevel model
(Model 2).
Results were reported for only three PYP grade levels (Grades 3-5) for the United States. In the United
States, no difference exists in data between the broad definition and the narrow definition of non-IB
students. Twelve comparisons were made based on Cohen's d, of which 10 reported no significant
differences. IB students outperformed non-IB peers in only 1 comparison, namely in Expository Writing at
Grade 3 with a small difference. After taking into account clustering at school level using the multilevel
model (Model 1), 10 comparisons were made, of which all comparisons reported no significant differences.
After controlling for students’ gender and English-Speaking background in the multilevel model (Model
2), no comparison reported significant differences.
Table 26 summarises the comparison results for each of six countries in the Middle East, Africa and the
Americas.
Table 26 Summarise Comparison Results by Domain within a Country in the Middle East, Africa and
Americas
Country Domain
Grade
levels
Compared
Non-Model Model 1 Model 2
IB
Better
Non-
IB
Better
No
Difference
IB
Better
Non-
IB
Better
No
Difference
IB
Better
Non-
IB
Better
No
Difference
B N B N B N B N B N B N B N B N B N
Oman
Mathematical
Literacy 3 to 5 1 1 0 0 2 2 0 0 0 0 0 0 0 0 0 0 0 0
Reading 3 to 5 2 2 0 0 1 1 0 0 1 1 1 1 0 0 0 0 1 1
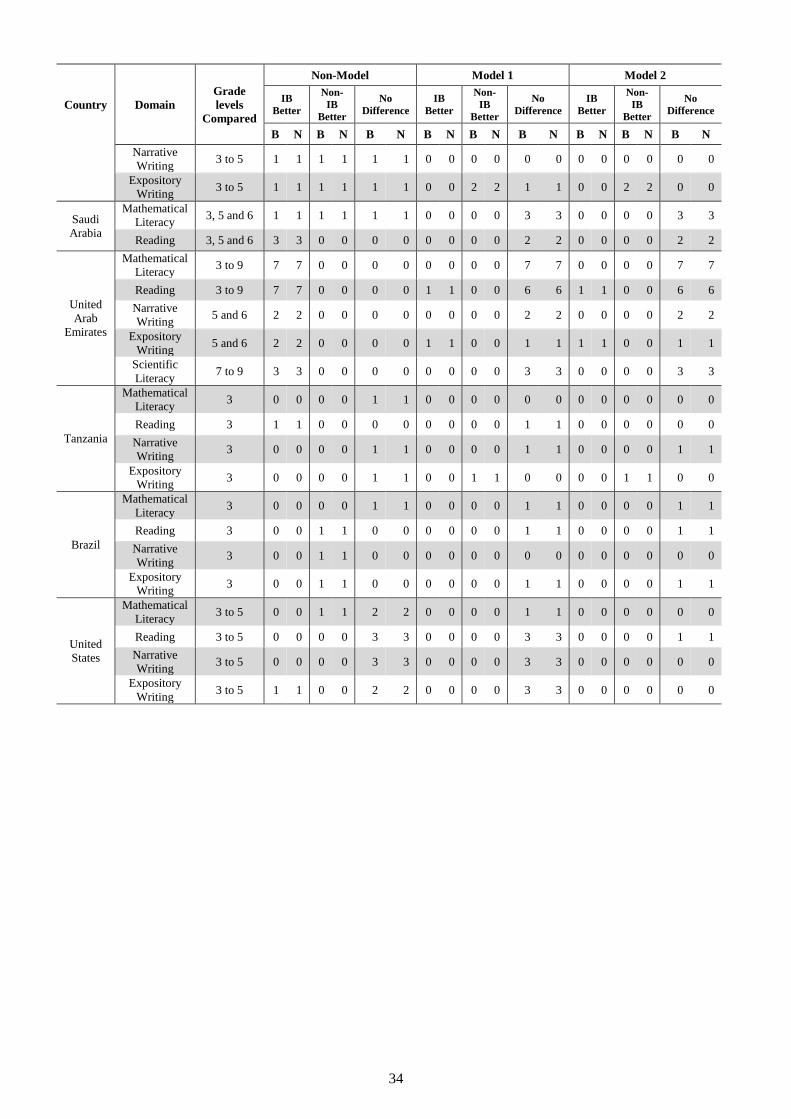
34
Country Domain
Grade
levels
Compared
Non-Model Model 1 Model 2
IB
Better
Non-
IB
Better
No
Difference
IB
Better
Non-
IB
Better
No
Difference
IB
Better
Non-
IB
Better
No
Difference
B N B N B N B N B N B N B N B N B N
Narrative
Writing 3 to 5 1 1 1 1 1 1 0 0 0 0 0 0 0 0 0 0 0 0
Expository
Writing 3 to 5 1 1 1 1 1 1 0 0 2 2 1 1 0 0 2 2 0 0
Saudi
Arabia
Mathematical
Literacy 3, 5 and 6 1 1 1 1 1 1 0 0 0 0 3 3 0 0 0 0 3 3
Reading 3, 5 and 6 3 3 0 0 0 0 0 0 0 0 2 2 0 0 0 0 2 2
United
Arab
Emirates
Mathematical
Literacy 3 to 9 7 7 0 0 0 0 0 0 0 0 7 7 0 0 0 0 7 7
Reading 3 to 9 7 7 0 0 0 0 1 1 0 0 6 6 1 1 0 0 6 6
Narrative
Writing 5 and 6 2 2 0 0 0 0 0 0 0 0 2 2 0 0 0 0 2 2
Expository
Writing 5 and 6 2 2 0 0 0 0 1 1 0 0 1 1 1 1 0 0 1 1
Scientific
Literacy 7 to 9 3 3 0 0 0 0 0 0 0 0 3 3 0 0 0 0 3 3
Tanzania
Mathematical
Literacy 3 0 0 0 0 1 1 0 0 0 0 0 0 0 0 0 0 0 0
Reading 3 1 1 0 0 0 0 0 0 0 0 1 1 0 0 0 0 0 0
Narrative
Writing 3 0 0 0 0 1 1 0 0 0 0 1 1 0 0 0 0 1 1
Expository
Writing 3 0 0 0 0 1 1 0 0 1 1 0 0 0 0 1 1 0 0
Brazil
Mathematical
Literacy 3 0 0 0 0 1 1 0 0 0 0 1 1 0 0 0 0 1 1
Reading 3 0 0 1 1 0 0 0 0 0 0 1 1 0 0 0 0 1 1
Narrative
Writing 3 0 0 1 1 0 0 0 0 0 0 0 0 0 0 0 0 0 0
Expository
Writing 3 0 0 1 1 0 0 0 0 0 0 1 1 0 0 0 0 1 1
United
States
Mathematical
Literacy 3 to 5 0 0 1 1 2 2 0 0 0 0 1 1 0 0 0 0 0 0
Reading 3 to 5 0 0 0 0 3 3 0 0 0 0 3 3 0 0 0 0 1 1
Narrative
Writing 3 to 5 0 0 0 0 3 3 0 0 0 0 3 3 0 0 0 0 0 0
Expository
Writing 3 to 5 1 1 0 0 2 2 0 0 0 0 3 3 0 0 0 0 0 0
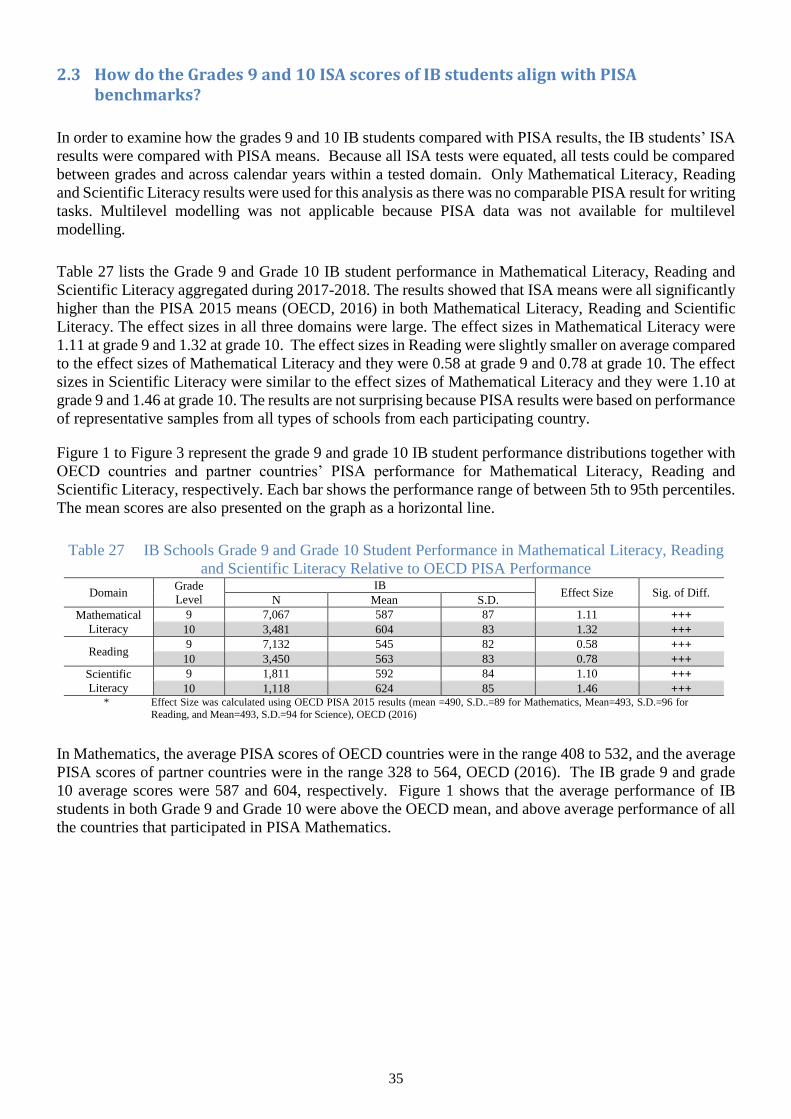
35
2.3 How do the Grades 9 and 10 ISA scores of IB students align with PISA benchmarks?
In order to examine how the grades 9 and 10 IB students compared with PISA results, the IB students’ ISA
results were compared with PISA means. Because all ISA tests were equated, all tests could be compared
between grades and across calendar years within a tested domain. Only Mathematical Literacy, Reading
and Scientific Literacy results were used for this analysis as there was no comparable PISA result for writing
tasks. Multilevel modelling was not applicable because PISA data was not available for multilevel
modelling.
Table 27 lists the Grade 9 and Grade 10 IB student performance in Mathematical Literacy, Reading and
Scientific Literacy aggregated during 2017-2018. The results showed that ISA means were all significantly
higher than the PISA 2015 means (OECD, 2016) in both Mathematical Literacy, Reading and Scientific
Literacy. The effect sizes in all three domains were large. The effect sizes in Mathematical Literacy were
1.11 at grade 9 and 1.32 at grade 10. The effect sizes in Reading were slightly smaller on average compared
to the effect sizes of Mathematical Literacy and they were 0.58 at grade 9 and 0.78 at grade 10. The effect
sizes in Scientific Literacy were similar to the effect sizes of Mathematical Literacy and they were 1.10 at
grade 9 and 1.46 at grade 10. The results are not surprising because PISA results were based on performance
of representative samples from all types of schools from each participating country.
Figure 1 to Figure 3 represent the grade 9 and grade 10 IB student performance distributions together with
OECD countries and partner countries’ PISA performance for Mathematical Literacy, Reading and
Scientific Literacy, respectively. Each bar shows the performance range of between 5th to 95th percentiles.
The mean scores are also presented on the graph as a horizontal line.
Table 27 IB Schools Grade 9 and Grade 10 Student Performance in Mathematical Literacy, Reading
and Scientific Literacy Relative to OECD PISA Performance
Domain Grade
Level
IB Effect Size Sig. of Diff.
N Mean S.D.
Mathematical
Literacy
9 7,067 587 87 1.11 +++
10 3,481 604 83 1.32 +++
Reading 9 7,132 545 82 0.58 +++
10 3,450 563 83 0.78 +++
Scientific
Literacy
9 1,811 592 84 1.10 +++
10 1,118 624 85 1.46 +++ * Effect Size was calculated using OECD PISA 2015 results (mean =490, S.D..=89 for Mathematics, Mean=493, S.D.=96 for
Reading, and Mean=493, S.D.=94 for Science), OECD (2016)
In Mathematics, the average PISA scores of OECD countries were in the range 408 to 532, and the average
PISA scores of partner countries were in the range 328 to 564, OECD (2016). The IB grade 9 and grade
10 average scores were 587 and 604, respectively. Figure 1 shows that the average performance of IB
students in both Grade 9 and Grade 10 were above the OECD mean, and above average performance of all
the countries that participated in PISA Mathematics.
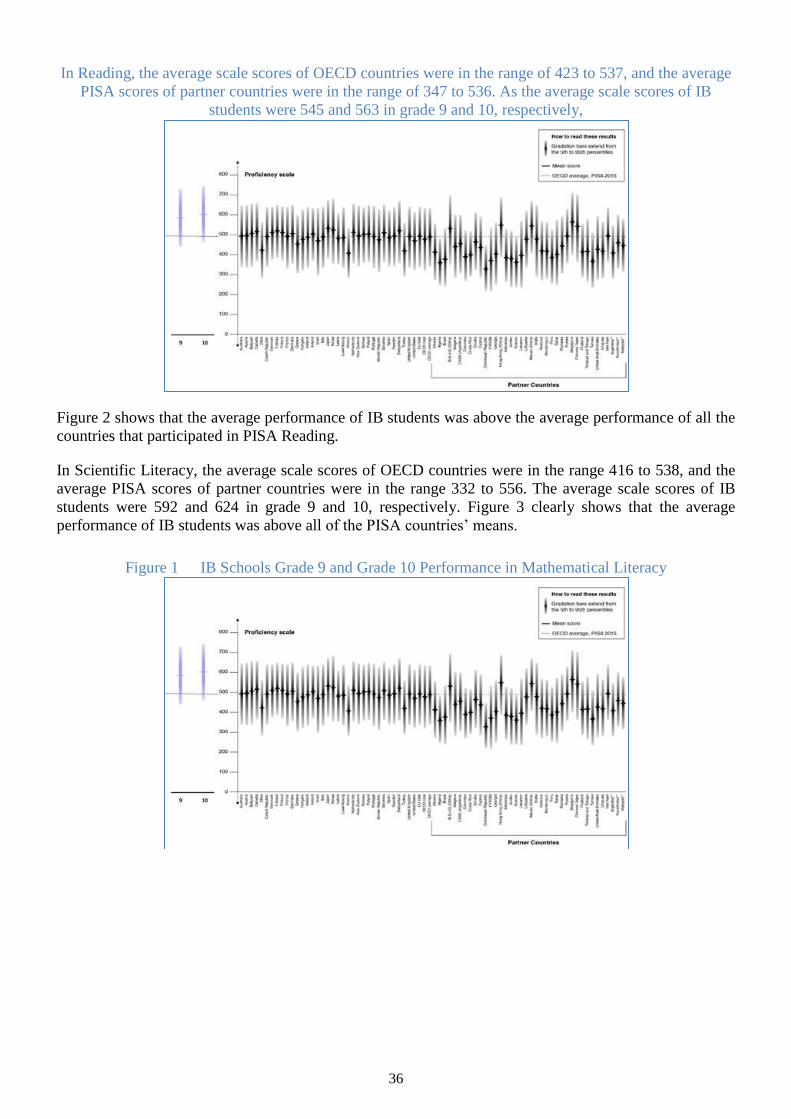
36
In Reading, the average scale scores of OECD countries were in the range of 423 to 537, and the average
PISA scores of partner countries were in the range of 347 to 536. As the average scale scores of IB
students were 545 and 563 in grade 9 and 10, respectively,
Figure 2 shows that the average performance of IB students was above the average performance of all the
countries that participated in PISA Reading.
In Scientific Literacy, the average scale scores of OECD countries were in the range 416 to 538, and the
average PISA scores of partner countries were in the range 332 to 556. The average scale scores of IB
students were 592 and 624 in grade 9 and 10, respectively. Figure 3 clearly shows that the average
performance of IB students was above all of the PISA countries’ means.
Figure 1 IB Schools Grade 9 and Grade 10 Performance in Mathematical Literacy
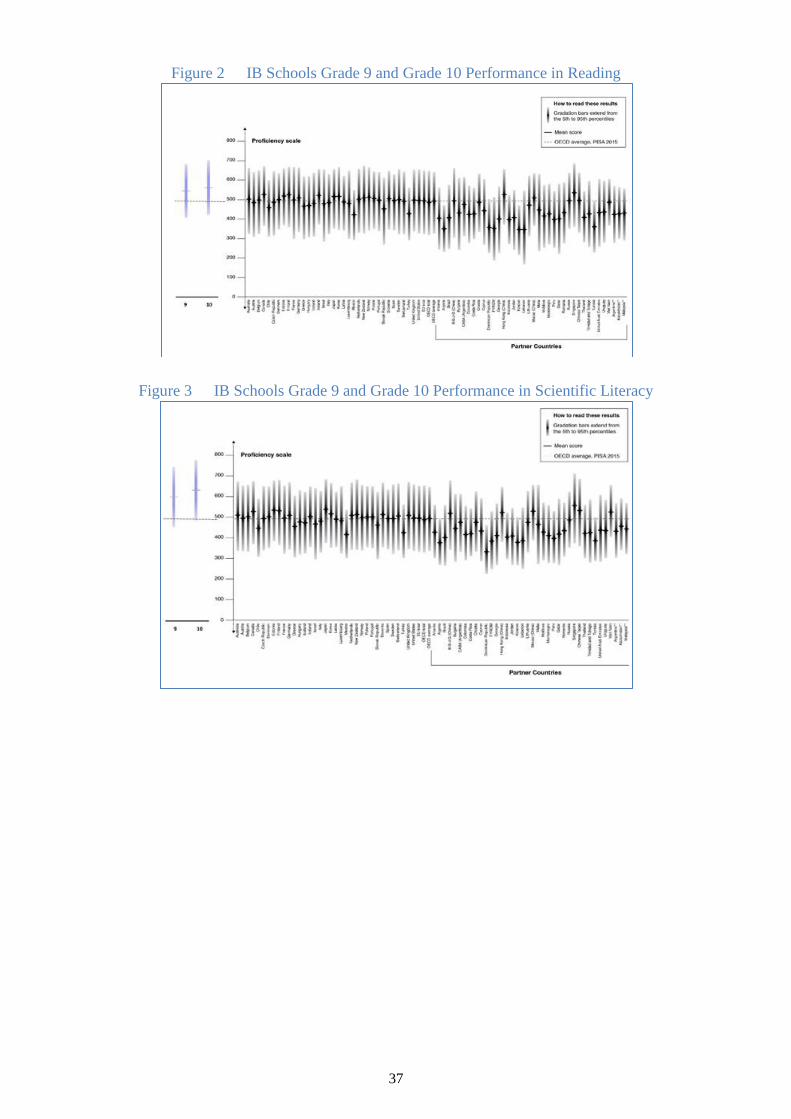
37
Figure 2 IB Schools Grade 9 and Grade 10 Performance in Reading
Figure 3 IB Schools Grade 9 and Grade 10 Performance in Scientific Literacy
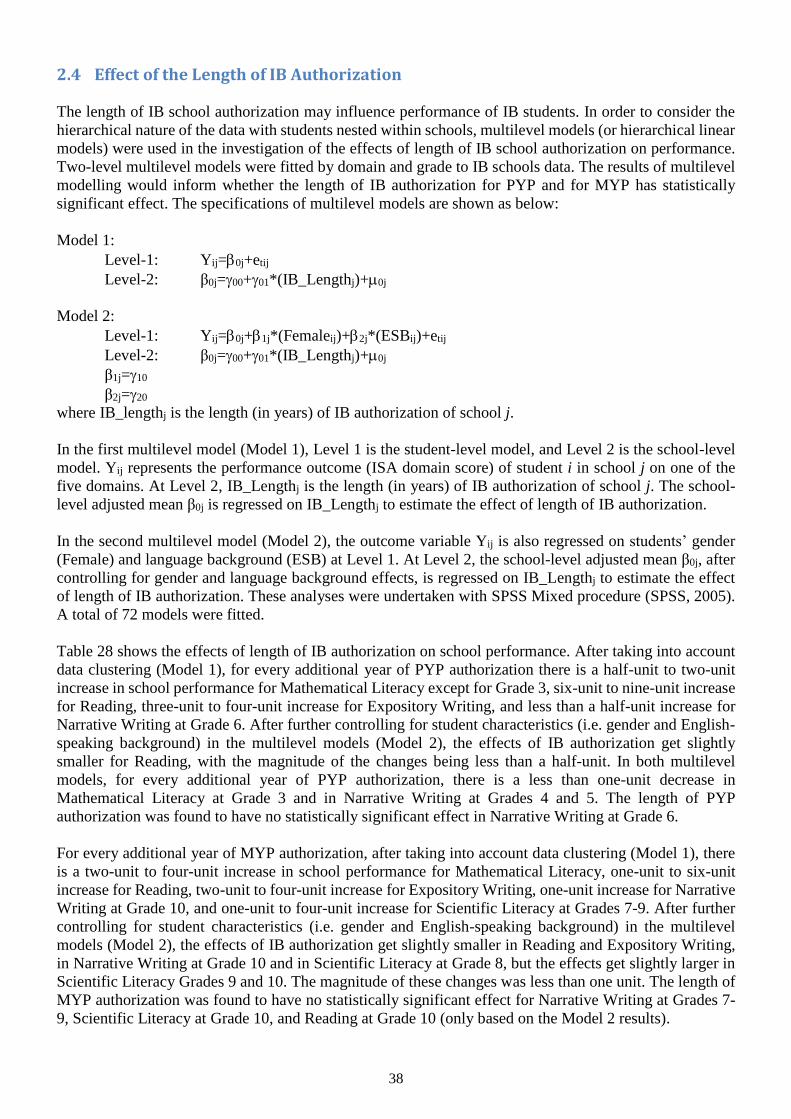
38
2.4 Effect of the Length of IB Authorization
The length of IB school authorization may influence performance of IB students. In order to consider the
hierarchical nature of the data with students nested within schools, multilevel models (or hierarchical linear
models) were used in the investigation of the effects of length of IB school authorization on performance.
Two-level multilevel models were fitted by domain and grade to IB schools data. The results of multilevel
modelling would inform whether the length of IB authorization for PYP and for MYP has statistically
significant effect. The specifications of multilevel models are shown as below:
Model 1:
Level-1: Yij=0j+etij
Level-2: β0j=00+01*(IB_Lengthj)+0j
Model 2:
Level-1: Yij=0j+1j*(Femaleij)+2j*(ESBij)+etij
Level-2: β0j=00+01*(IB_Lengthj)+0j
β1j=10
β2j=20
where IB_lengthj is the length (in years) of IB authorization of school j.
In the first multilevel model (Model 1), Level 1 is the student-level model, and Level 2 is the school-level
model. Yij represents the performance outcome (ISA domain score) of student i in school j on one of the
five domains. At Level 2, IB_Lengthj is the length (in years) of IB authorization of school j. The school-
level adjusted mean β0j is regressed on IB_Lengthj to estimate the effect of length of IB authorization.
In the second multilevel model (Model 2), the outcome variable Yij is also regressed on students’ gender
(Female) and language background (ESB) at Level 1. At Level 2, the school-level adjusted mean β0j, after
controlling for gender and language background effects, is regressed on IB_Lengthj to estimate the effect
of length of IB authorization. These analyses were undertaken with SPSS Mixed procedure (SPSS, 2005).
A total of 72 models were fitted.
Table 28 shows the effects of length of IB authorization on school performance. After taking into account
data clustering (Model 1), for every additional year of PYP authorization there is a half-unit to two-unit
increase in school performance for Mathematical Literacy except for Grade 3, six-unit to nine-unit increase
for Reading, three-unit to four-unit increase for Expository Writing, and less than a half-unit increase for
Narrative Writing at Grade 6. After further controlling for student characteristics (i.e. gender and English-
speaking background) in the multilevel models (Model 2), the effects of IB authorization get slightly
smaller for Reading, with the magnitude of the changes being less than a half-unit. In both multilevel
models, for every additional year of PYP authorization, there is a less than one-unit decrease in
Mathematical Literacy at Grade 3 and in Narrative Writing at Grades 4 and 5. The length of PYP
authorization was found to have no statistically significant effect in Narrative Writing at Grade 6.
For every additional year of MYP authorization, after taking into account data clustering (Model 1), there
is a two-unit to four-unit increase in school performance for Mathematical Literacy, one-unit to six-unit
increase for Reading, two-unit to four-unit increase for Expository Writing, one-unit increase for Narrative
Writing at Grade 10, and one-unit to four-unit increase for Scientific Literacy at Grades 7-9. After further
controlling for student characteristics (i.e. gender and English-speaking background) in the multilevel
models (Model 2), the effects of IB authorization get slightly smaller in Reading and Expository Writing,
in Narrative Writing at Grade 10 and in Scientific Literacy at Grade 8, but the effects get slightly larger in
Scientific Literacy Grades 9 and 10. The magnitude of these changes was less than one unit. The length of
MYP authorization was found to have no statistically significant effect for Narrative Writing at Grades 7-
9, Scientific Literacy at Grade 10, and Reading at Grade 10 (only based on the Model 2 results).
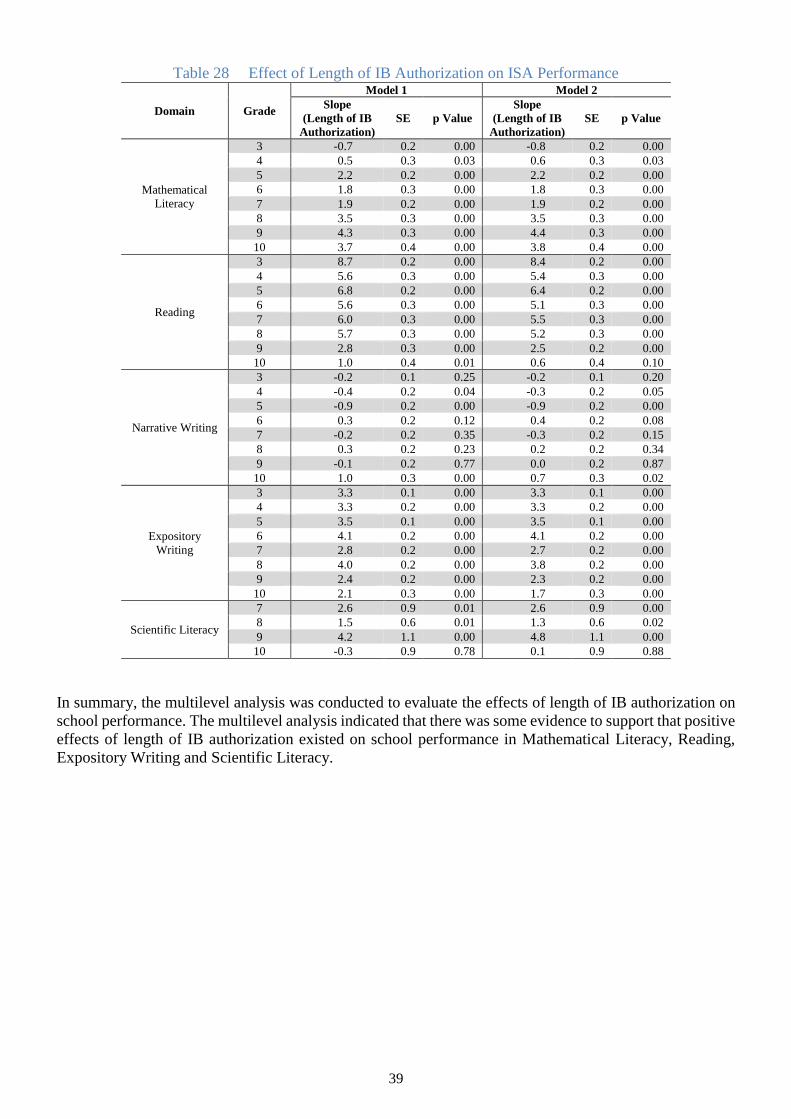
39
Table 28 Effect of Length of IB Authorization on ISA Performance
Domain Grade
Model 1 Model 2
Slope
(Length of IB
Authorization)
SE p Value
Slope
(Length of IB
Authorization)
SE p Value
Mathematical
Literacy
3 -0.7 0.2 0.00 -0.8 0.2 0.00
4 0.5 0.3 0.03 0.6 0.3 0.03
5 2.2 0.2 0.00 2.2 0.2 0.00
6 1.8 0.3 0.00 1.8 0.3 0.00
7 1.9 0.2 0.00 1.9 0.2 0.00
8 3.5 0.3 0.00 3.5 0.3 0.00
9 4.3 0.3 0.00 4.4 0.3 0.00
10 3.7 0.4 0.00 3.8 0.4 0.00
Reading
3 8.7 0.2 0.00 8.4 0.2 0.00
4 5.6 0.3 0.00 5.4 0.3 0.00
5 6.8 0.2 0.00 6.4 0.2 0.00
6 5.6 0.3 0.00 5.1 0.3 0.00
7 6.0 0.3 0.00 5.5 0.3 0.00
8 5.7 0.3 0.00 5.2 0.3 0.00
9 2.8 0.3 0.00 2.5 0.2 0.00
10 1.0 0.4 0.01 0.6 0.4 0.10
Narrative Writing
3 -0.2 0.1 0.25 -0.2 0.1 0.20
4 -0.4 0.2 0.04 -0.3 0.2 0.05
5 -0.9 0.2 0.00 -0.9 0.2 0.00
6 0.3 0.2 0.12 0.4 0.2 0.08
7 -0.2 0.2 0.35 -0.3 0.2 0.15
8 0.3 0.2 0.23 0.2 0.2 0.34
9 -0.1 0.2 0.77 0.0 0.2 0.87
10 1.0 0.3 0.00 0.7 0.3 0.02
Expository
Writing
3 3.3 0.1 0.00 3.3 0.1 0.00
4 3.3 0.2 0.00 3.3 0.2 0.00
5 3.5 0.1 0.00 3.5 0.1 0.00
6 4.1 0.2 0.00 4.1 0.2 0.00
7 2.8 0.2 0.00 2.7 0.2 0.00
8 4.0 0.2 0.00 3.8 0.2 0.00
9 2.4 0.2 0.00 2.3 0.2 0.00
10 2.1 0.3 0.00 1.7 0.3 0.00
Scientific Literacy
7 2.6 0.9 0.01 2.6 0.9 0.00
8 1.5 0.6 0.01 1.3 0.6 0.02
9 4.2 1.1 0.00 4.8 1.1 0.00
10 -0.3 0.9 0.78 0.1 0.9 0.88
In summary, the multilevel analysis was conducted to evaluate the effects of length of IB authorization on
school performance. The multilevel analysis indicated that there was some evidence to support that positive
effects of length of IB authorization existed on school performance in Mathematical Literacy, Reading,
Expository Writing and Scientific Literacy.
40
CONCLUSION
This investigation on ISA assessment data in 2017-18 and 2018-19 indicated that there was evidence that
at a global level analysis, PYP and MYP students generally performed better than students from non-IB
schools in the ISA assessment areas at many grade levels, based on the Cohen’s d. After taking into account
clustering at school level using the multilevel models, there are a smaller number of significant differences
between IB and non-IB students from the results of multilevel models compared to the results based on the
Cohen's d. The effect sizes between the two definitions of non-IB students were also mostly similar for
each multilevel model. The multilevel modelling of student performance among PYP and MYP students
showed evidence that, on a global level, the PYP and the MYP students performed better than students
from non-IB schools in the ISA assessment areas at a number of grade levels. The difference in Expository
Writing was significant at Grades 3, 5, 7 and 9 with effect sizes > 0.20, whereas the difference in Scientific
Literacy was significant at Grades 9 and 10 with effect sizes > 0.35. In addition, IB students outperformed
non-IB students in Reading at Grades 3, 5 and 9 with effect sizes > 0.2, in Narrative Writing at Grades 3,
5, 7 and 9 with effect sizes > 0.1, in Mathematical Literacy at Grade 9 with effect sizes > 0.2. There was
no evidence to indicate IB students did not perform well in comparison to the non-IB students.
The regional analysis of magnitude of effects indicated that there was evidence based on Cohen’s d that IB
students outperformed the non-IB students in majority of comparison groups in the Middle East (94%),
Africa (55%) and the Americas (62%) with small to large differences in effect size. However, only 8% of
comparison groups in the Asia-Pacific and 7% of comparison groups in Europe showed IB students
significantly outperformed non-IB students with small to medium differences based on Cohen’s d. After
controlling for data clustering at schools, IB students significantly outperformed non-IB students in a
smaller number of comparisons before and after controlling for student characteristics, respectively: in the
Middle East (31% and 34%), Africa (11% and 12%) and the Americas (5% and 5%) with medium to large
differences, and in Europe (6% and 4%) and Asia-pacific (3% and 13%) with small to medium differences..
The sub-strands analysis found that, after controlling for data clustering at schools with or without
controlling for student characteristics, IB students performed better than non-IB students for all five
domains in all sub-strands at Grade 9 (except for the broad definition of non-IB students in Model 1 of
Mathematical Literacy), with mostly small to medium differences. In Mathematical Literacy, IB students
outperformed non-IB students in Space and Shape at Grades 3, 5 and 9, in Uncertainty and Data at Grades
5 and 9, with small to medium differences. In Reading, IB students outperformed non-IB students in all
sub-strands at Grades 3, 5 and 9 with small to medium differences and in Reflect and Evaluate with small
differences. In Narrative Writing, IB students outperformed non-IB students in the Content criterion and in
Language at Grades 3, 5, 7 and 9; and in Spelling at Grades 3 and 9. In Expository Writing, IB students
outperformed non-IB students in Content and in Structure and Organisation at Grades 3, 5, 7, 8 and 9; and
in Language at Grades 3, 5, 7 and 9. In Scientific Literacy, IB students performed better than non-IB
students in Evaluate and design scientific enquiry at Grades 7, 9 and 10, in Explain phenomena scientifically
at Grade 10, and in Interpret data and evidence scientifically at Grades 9 and 10, with medium to large
effect sizes. However, non-IB students outperformed IB students in sub-strands of Mathematical Literacy,
Reading and in the language criteria of Narrative Writing at Grade 10, with small to medium differences
based on Cohen’s d. However, these differences were not statistically significant based on the results of
multilevel modelling.
The multilevel analysis was conducted to evaluate the effects of length of IB authorization on school
performance. The multilevel analysis indicated that there was some evidence to support that positive effects
of length of IB authorization existed on school performance in Mathematical Literacy, Reading, Expository
Writing and Scientific Literacy. For every additional year of PYP authorization there is a half-unit to two-
unit increase in school performance in Mathematical Literacy except for Grade 3, six to nine-unit increase
in Reading, three to four-unit increase in Expository Writing, and less than a half-unit increase in Narrative
Writing at Grade 6. For every additional year of MYP authorization, there is a two to four-unit increase in
school performance in Mathematical Literacy, one-unit to six-unit increase in Reading, two-unit to four-
unit increase in Expository Writing, one-unit increase in Narrative Writing at Grade 10, and one-unit to
41
four-unit increase in Scientific Literacy at Grades 7 to 9. After further controlling for student characteristics
(i.e. gender and English-speaking background) in the multilevel models, the effects of IB authorization can
get slightly smaller by less than one unit.
This investigation was conducted with limited background information about schools and students. ISA
performance data were not census data, and schools participating in each country were not a random sample.
Caution must be exercised in drawing conclusions from these results. As schools can choose to participate
ISA assessments, the results of this study were only applicable to the sample of schools that participated.
In the comparison of the outcomes of students, cohort performances or country performances, there were
many other factors, such as students’ socio- economic backgrounds, school size, school type, the numbers
and qualifications of teachers in a school, sources of funding and any selective enrolment policies among
others that may influence student performance to some extent. No data concerning these factors were
collected and therefore were not available to this analysis.
42
REFERENCES
ACER (2017). Guide to ISA Reports for October 2017 Administration, Appendix 5 Explanation of Terms.
Melbourne: The Australian Council for Educational Research.
Adams, R.J, Wu, M.L, and Wilson, M.R. (2015). ConQuest 4. [computer program] Camberwell:
Australian Council for Educational Research.
Cohen, J. (1988). Statistical Power Analysis for the Behavioral Sciences. Routledge.
Hallberg, K., Williams, R., Swanlund, A., and Eno, J. (2018). Short Comparative Interrupted Time Series
Using Aggregate School-Level Data in Education Research. Educational Researcher 47(5), 295–306
Hox, J. J. (2010). Multilevel analysis: Techniques and applications. Great Britain: Routledge.
Lorah, J. (2018). Effect size measures for multilevel models: Definition, interpretation, and TIMSS
example. Large-Scale Assessments in Education, 6(8).
Muthén, B. O. and Satorra, A. (1995). Complex sample data in structural equation modeling. Sociological
Methodology, 25, 267-316.
OECD (2016). PISA 2015 Results (Volume I), Excellence and Equity in Education, Paris: Organisation for
Economic Co-operation and Development.
Rasch, G (1980). Probabilistic Models for Some Intelligence and Attainment Tests. Chicago: MESA Press
(original work published 1960).
Snijders, T. A. B., & Bosker, R. J. (2012). Multilevel analysis: An introduction to basic and advanced
multilevel modeling. Thousand Oaks: Sage Publishing.
Somers, M., Zhu, P., Jacob, R., Bloom, H. (2013). The Validity and Precision of the Comparative
Interrupted Time Series Design and the Difference-in-Difference Design in Educational Evaluation.
Working Paper: Manpower Demonstration Research Corporation.
SPSS (2005). Linear Mixed-Effects Modeling in SPSS: An Introduction to the MIXED Procedure.
Technical Report.
Tan, L. & Bibby, Y. (2010). IB PYP and MYP student performance on the International Schools’
Assessment (ISA). Melbourne: Australian Council for Educational Research.
Tan, L. & Bibby, Y. (2011). IB PYP and MYP student performance on the International Schools’
Assessment (ISA). Melbourne: Australian Council for Educational Research.
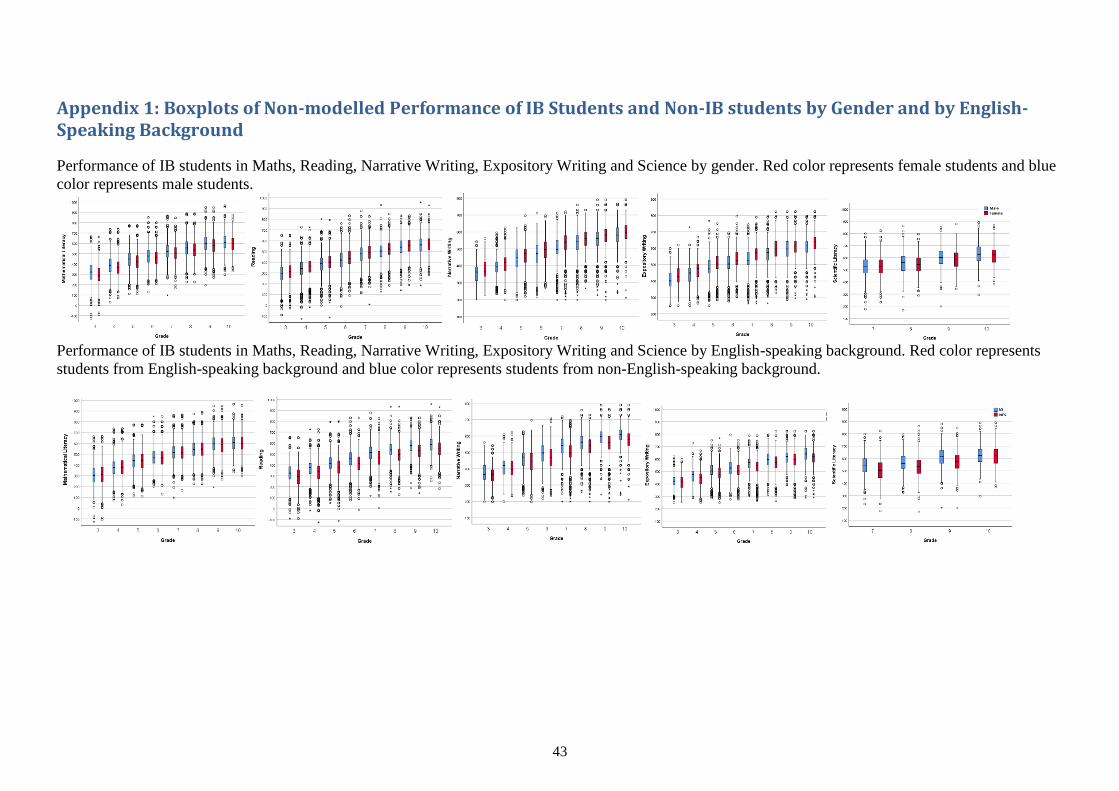
43
Appendix 1: Boxplots of Non-modelled Performance of IB Students and Non-IB students by Gender and by English-Speaking Background
Performance of IB students in Maths, Reading, Narrative Writing, Expository Writing and Science by gender. Red color represents female students and blue
color represents male students.
Performance of IB students in Maths, Reading, Narrative Writing, Expository Writing and Science by English-speaking background. Red color represents
students from English-speaking background and blue color represents students from non-English-speaking background.
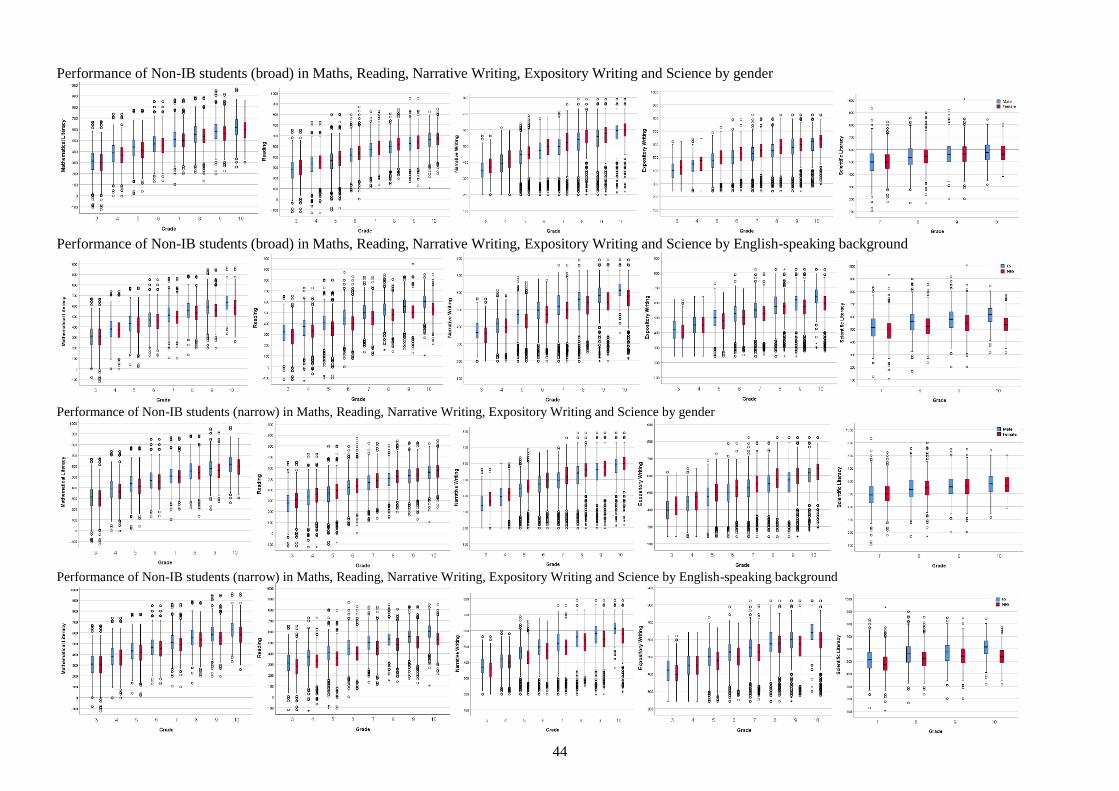
44
Performance of Non-IB students (broad) in Maths, Reading, Narrative Writing, Expository Writing and Science by gender
Performance of Non-IB students (broad) in Maths, Reading, Narrative Writing, Expository Writing and Science by English-speaking background
Performance of Non-IB students (narrow) in Maths, Reading, Narrative Writing, Expository Writing and Science by gender
Performance of Non-IB students (narrow) in Maths, Reading, Narrative Writing, Expository Writing and Science by English-speaking background
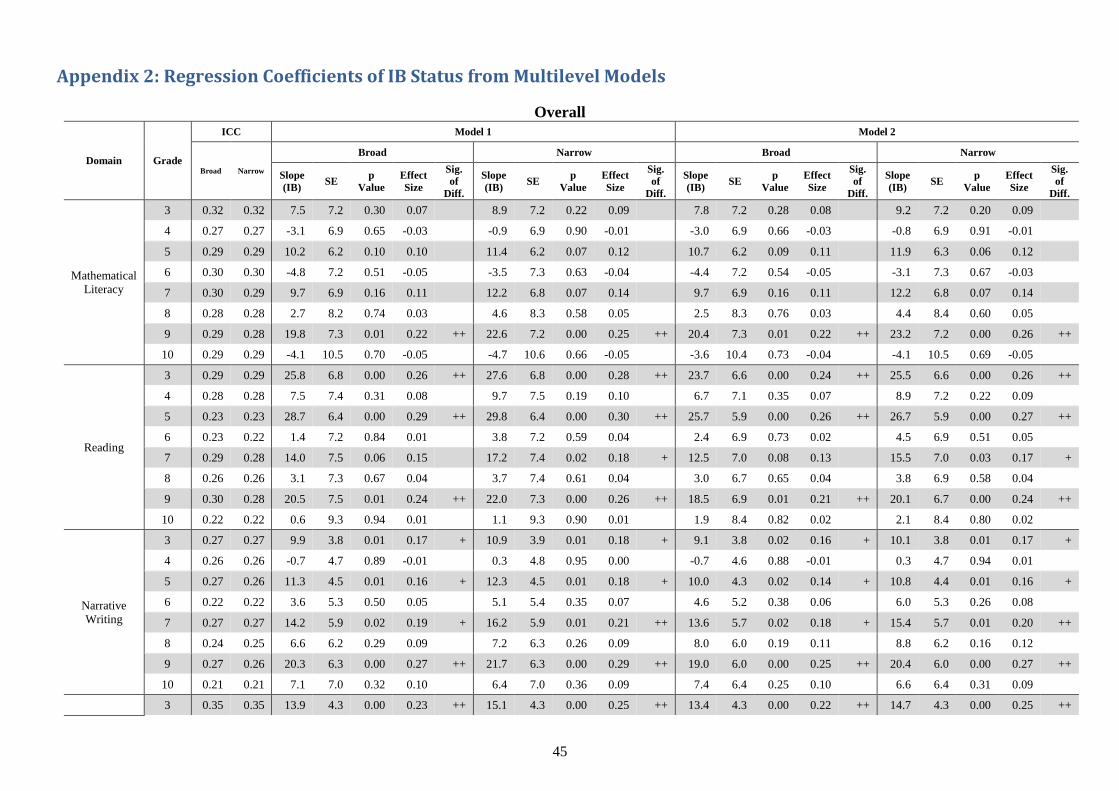
45
Appendix 2: Regression Coefficients of IB Status from Multilevel Models
Overall
Domain Grade
ICC Model 1 Model 2
Broad Narrow
Broad Narrow Broad Narrow
Slope
(IB) SE
p
Value
Effect
Size
Sig.
of
Diff.
Slope
(IB) SE
p
Value
Effect
Size
Sig.
of
Diff.
Slope
(IB) SE
p
Value
Effect
Size
Sig.
of
Diff.
Slope
(IB) SE
p
Value
Effect
Size
Sig.
of
Diff.
Mathematical
Literacy
3 0.32 0.32 7.5 7.2 0.30 0.07 8.9 7.2 0.22 0.09 7.8 7.2 0.28 0.08 9.2 7.2 0.20 0.09
4 0.27 0.27 -3.1 6.9 0.65 -0.03 -0.9 6.9 0.90 -0.01 -3.0 6.9 0.66 -0.03 -0.8 6.9 0.91 -0.01
5 0.29 0.29 10.2 6.2 0.10 0.10 11.4 6.2 0.07 0.12 10.7 6.2 0.09 0.11 11.9 6.3 0.06 0.12
6 0.30 0.30 -4.8 7.2 0.51 -0.05 -3.5 7.3 0.63 -0.04 -4.4 7.2 0.54 -0.05 -3.1 7.3 0.67 -0.03
7 0.30 0.29 9.7 6.9 0.16 0.11 12.2 6.8 0.07 0.14 9.7 6.9 0.16 0.11 12.2 6.8 0.07 0.14
8 0.28 0.28 2.7 8.2 0.74 0.03 4.6 8.3 0.58 0.05 2.5 8.3 0.76 0.03 4.4 8.4 0.60 0.05
9 0.29 0.28 19.8 7.3 0.01 0.22 ++ 22.6 7.2 0.00 0.25 ++ 20.4 7.3 0.01 0.22 ++ 23.2 7.2 0.00 0.26 ++
10 0.29 0.29 -4.1 10.5 0.70 -0.05 -4.7 10.6 0.66 -0.05 -3.6 10.4 0.73 -0.04 -4.1 10.5 0.69 -0.05
Reading
3 0.29 0.29 25.8 6.8 0.00 0.26 ++ 27.6 6.8 0.00 0.28 ++ 23.7 6.6 0.00 0.24 ++ 25.5 6.6 0.00 0.26 ++
4 0.28 0.28 7.5 7.4 0.31 0.08 9.7 7.5 0.19 0.10 6.7 7.1 0.35 0.07 8.9 7.2 0.22 0.09
5 0.23 0.23 28.7 6.4 0.00 0.29 ++ 29.8 6.4 0.00 0.30 ++ 25.7 5.9 0.00 0.26 ++ 26.7 5.9 0.00 0.27 ++
6 0.23 0.22 1.4 7.2 0.84 0.01 3.8 7.2 0.59 0.04 2.4 6.9 0.73 0.02 4.5 6.9 0.51 0.05
7 0.29 0.28 14.0 7.5 0.06 0.15 17.2 7.4 0.02 0.18 + 12.5 7.0 0.08 0.13 15.5 7.0 0.03 0.17 +
8 0.26 0.26 3.1 7.3 0.67 0.04 3.7 7.4 0.61 0.04 3.0 6.7 0.65 0.04 3.8 6.9 0.58 0.04
9 0.30 0.28 20.5 7.5 0.01 0.24 ++ 22.0 7.3 0.00 0.26 ++ 18.5 6.9 0.01 0.21 ++ 20.1 6.7 0.00 0.24 ++
10 0.22 0.22 0.6 9.3 0.94 0.01 1.1 9.3 0.90 0.01 1.9 8.4 0.82 0.02 2.1 8.4 0.80 0.02
Narrative
Writing
3 0.27 0.27 9.9 3.8 0.01 0.17 + 10.9 3.9 0.01 0.18 + 9.1 3.8 0.02 0.16 + 10.1 3.8 0.01 0.17 +
4 0.26 0.26 -0.7 4.7 0.89 -0.01 0.3 4.8 0.95 0.00 -0.7 4.6 0.88 -0.01 0.3 4.7 0.94 0.01
5 0.27 0.26 11.3 4.5 0.01 0.16 + 12.3 4.5 0.01 0.18 + 10.0 4.3 0.02 0.14 + 10.8 4.4 0.01 0.16 +
6 0.22 0.22 3.6 5.3 0.50 0.05 5.1 5.4 0.35 0.07 4.6 5.2 0.38 0.06 6.0 5.3 0.26 0.08
7 0.27 0.27 14.2 5.9 0.02 0.19 + 16.2 5.9 0.01 0.21 ++ 13.6 5.7 0.02 0.18 + 15.4 5.7 0.01 0.20 ++
8 0.24 0.25 6.6 6.2 0.29 0.09 7.2 6.3 0.26 0.09 8.0 6.0 0.19 0.11 8.8 6.2 0.16 0.12
9 0.27 0.26 20.3 6.3 0.00 0.27 ++ 21.7 6.3 0.00 0.29 ++ 19.0 6.0 0.00 0.25 ++ 20.4 6.0 0.00 0.27 ++
10 0.21 0.21 7.1 7.0 0.32 0.10 6.4 7.0 0.36 0.09 7.4 6.4 0.25 0.10 6.6 6.4 0.31 0.09
3 0.35 0.35 13.9 4.3 0.00 0.23 ++ 15.1 4.3 0.00 0.25 ++ 13.4 4.3 0.00 0.22 ++ 14.7 4.3 0.00 0.25 ++

46
Domain Grade
ICC Model 1 Model 2
Broad Narrow
Broad Narrow Broad Narrow
Slope
(IB) SE
p
Value
Effect
Size
Sig.
of
Diff.
Slope
(IB) SE
p
Value
Effect
Size
Sig.
of
Diff.
Slope
(IB) SE
p
Value
Effect
Size
Sig.
of
Diff.
Slope
(IB) SE
p
Value
Effect
Size
Sig.
of
Diff.
Expository
Writing
4 0.36 0.36 -1.7 5.3 0.75 -0.03 -0.5 5.4 0.93 -0.01 -1.7 5.3 0.75 -0.03 -0.5 5.3 0.93 -0.01
5 0.35 0.35 20.1 4.9 0.00 0.29 ++ 20.6 4.9 0.00 0.30 ++ 19.1 4.8 0.00 0.27 ++ 19.6 4.8 0.00 0.28 ++
6 0.30 0.29 5.8 5.8 0.32 0.08 8.0 5.9 0.18 0.11 6.4 5.7 0.27 0.09 8.4 5.9 0.15 0.12
7 0.33 0.33 16.1 6.4 0.01 0.21 ++ 17.8 6.4 0.01 0.23 ++ 15.6 6.3 0.01 0.21 ++ 17.3 6.3 0.01 0.23 ++
8 0.30 0.30 13.9 6.7 0.04 0.18 + 15.1 6.7 0.03 0.19 + 14.9 6.6 0.03 0.19 + 16.2 6.7 0.02 0.21 ++
9 0.33 0.32 30.4 7.2 0.00 0.37 ++ 31.1 7.2 0.00 0.38 ++ 29.1 7.1 0.00 0.36 ++ 29.7 7.1 0.00 0.37 ++
10 0.21 0.21 12.1 7.8 0.13 0.16 11.9 7.9 0.13 0.15 12.2 7.5 0.11 0.16 11.8 7.5 0.12 0.15
Scientific
Literacy
7 0.33 0.30 20.7 12.8 0.11 0.23 26.4 12.1 0.03 0.29 ++ 19.0 12.6 0.13 0.21 24.7 12.0 0.04 0.27 ++
8 0.31 0.31 -1.4 13.3 0.92 -0.02 0.3 13.6 0.98 0.00 -1.1 13.1 0.93 -0.01 0.9 13.4 0.95 0.01
9 0.29 0.25 35.0 12.8 0.01 0.40 ++ 37.3 11.7 0.00 0.44 ++ 31.4 12.4 0.01 0.36 ++ 33.8 11.5 0.00 0.40 ++
10 0.35 0.35 49.3 17.6 0.01 0.59 +++ 51.1 17.7 0.01 0.61 +++ 50.2 16.5 0.01 0.60 +++ 51.5 16.6 0.00 0.61 +++
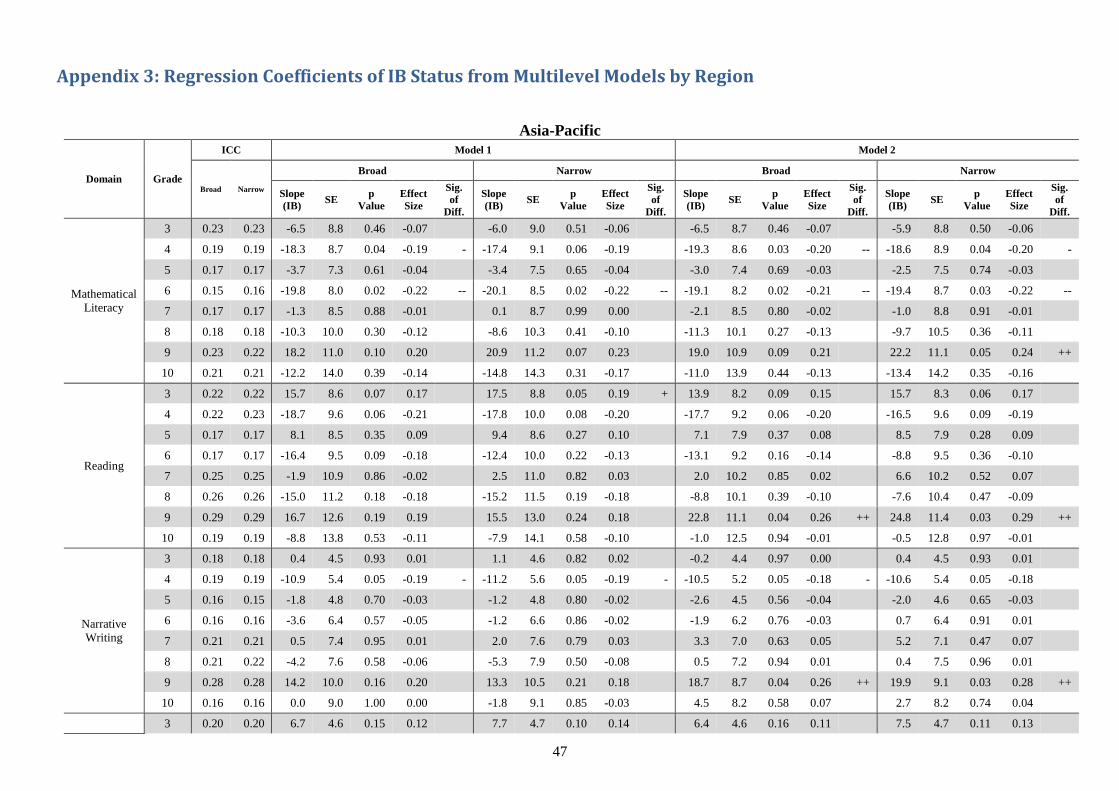
47
Appendix 3: Regression Coefficients of IB Status from Multilevel Models by Region
Asia-Pacific
Domain Grade
ICC Model 1 Model 2
Broad Narrow
Broad Narrow Broad Narrow
Slope
(IB) SE
p
Value
Effect
Size
Sig.
of
Diff.
Slope
(IB) SE
p
Value
Effect
Size
Sig.
of
Diff.
Slope
(IB) SE
p
Value
Effect
Size
Sig.
of
Diff.
Slope
(IB) SE
p
Value
Effect
Size
Sig.
of
Diff.
Mathematical
Literacy
3 0.23 0.23 -6.5 8.8 0.46 -0.07 -6.0 9.0 0.51 -0.06 -6.5 8.7 0.46 -0.07 -5.9 8.8 0.50 -0.06
4 0.19 0.19 -18.3 8.7 0.04 -0.19 - -17.4 9.1 0.06 -0.19 -19.3 8.6 0.03 -0.20 -- -18.6 8.9 0.04 -0.20 -
5 0.17 0.17 -3.7 7.3 0.61 -0.04 -3.4 7.5 0.65 -0.04 -3.0 7.4 0.69 -0.03 -2.5 7.5 0.74 -0.03
6 0.15 0.16 -19.8 8.0 0.02 -0.22 -- -20.1 8.5 0.02 -0.22 -- -19.1 8.2 0.02 -0.21 -- -19.4 8.7 0.03 -0.22 --
7 0.17 0.17 -1.3 8.5 0.88 -0.01 0.1 8.7 0.99 0.00 -2.1 8.5 0.80 -0.02 -1.0 8.8 0.91 -0.01
8 0.18 0.18 -10.3 10.0 0.30 -0.12 -8.6 10.3 0.41 -0.10 -11.3 10.1 0.27 -0.13 -9.7 10.5 0.36 -0.11
9 0.23 0.22 18.2 11.0 0.10 0.20 20.9 11.2 0.07 0.23 19.0 10.9 0.09 0.21 22.2 11.1 0.05 0.24 ++
10 0.21 0.21 -12.2 14.0 0.39 -0.14 -14.8 14.3 0.31 -0.17 -11.0 13.9 0.44 -0.13 -13.4 14.2 0.35 -0.16
Reading
3 0.22 0.22 15.7 8.6 0.07 0.17 17.5 8.8 0.05 0.19 + 13.9 8.2 0.09 0.15 15.7 8.3 0.06 0.17
4 0.22 0.23 -18.7 9.6 0.06 -0.21 -17.8 10.0 0.08 -0.20 -17.7 9.2 0.06 -0.20 -16.5 9.6 0.09 -0.19
5 0.17 0.17 8.1 8.5 0.35 0.09 9.4 8.6 0.27 0.10 7.1 7.9 0.37 0.08 8.5 7.9 0.28 0.09
6 0.17 0.17 -16.4 9.5 0.09 -0.18 -12.4 10.0 0.22 -0.13 -13.1 9.2 0.16 -0.14 -8.8 9.5 0.36 -0.10
7 0.25 0.25 -1.9 10.9 0.86 -0.02 2.5 11.0 0.82 0.03 2.0 10.2 0.85 0.02 6.6 10.2 0.52 0.07
8 0.26 0.26 -15.0 11.2 0.18 -0.18 -15.2 11.5 0.19 -0.18 -8.8 10.1 0.39 -0.10 -7.6 10.4 0.47 -0.09
9 0.29 0.29 16.7 12.6 0.19 0.19 15.5 13.0 0.24 0.18 22.8 11.1 0.04 0.26 ++ 24.8 11.4 0.03 0.29 ++
10 0.19 0.19 -8.8 13.8 0.53 -0.11 -7.9 14.1 0.58 -0.10 -1.0 12.5 0.94 -0.01 -0.5 12.8 0.97 -0.01
Narrative
Writing
3 0.18 0.18 0.4 4.5 0.93 0.01 1.1 4.6 0.82 0.02 -0.2 4.4 0.97 0.00 0.4 4.5 0.93 0.01
4 0.19 0.19 -10.9 5.4 0.05 -0.19 - -11.2 5.6 0.05 -0.19 - -10.5 5.2 0.05 -0.18 - -10.6 5.4 0.05 -0.18
5 0.16 0.15 -1.8 4.8 0.70 -0.03 -1.2 4.8 0.80 -0.02 -2.6 4.5 0.56 -0.04 -2.0 4.6 0.65 -0.03
6 0.16 0.16 -3.6 6.4 0.57 -0.05 -1.2 6.6 0.86 -0.02 -1.9 6.2 0.76 -0.03 0.7 6.4 0.91 0.01
7 0.21 0.21 0.5 7.4 0.95 0.01 2.0 7.6 0.79 0.03 3.3 7.0 0.63 0.05 5.2 7.1 0.47 0.07
8 0.21 0.22 -4.2 7.6 0.58 -0.06 -5.3 7.9 0.50 -0.08 0.5 7.2 0.94 0.01 0.4 7.5 0.96 0.01
9 0.28 0.28 14.2 10.0 0.16 0.20 13.3 10.5 0.21 0.18 18.7 8.7 0.04 0.26 ++ 19.9 9.1 0.03 0.28 ++
10 0.16 0.16 0.0 9.0 1.00 0.00 -1.8 9.1 0.85 -0.03 4.5 8.2 0.58 0.07 2.7 8.2 0.74 0.04
3 0.20 0.20 6.7 4.6 0.15 0.12 7.7 4.7 0.10 0.14 6.4 4.6 0.16 0.11 7.5 4.7 0.11 0.13
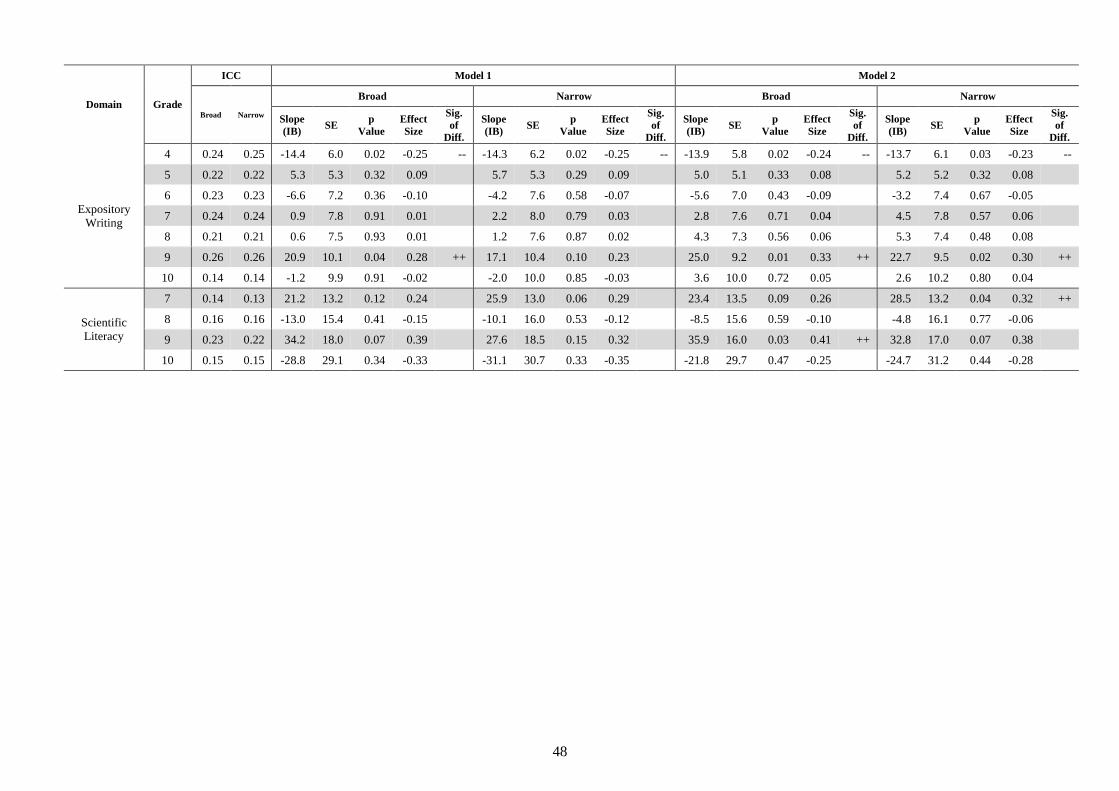
48
Domain Grade
ICC Model 1 Model 2
Broad Narrow
Broad Narrow Broad Narrow
Slope
(IB) SE
p
Value
Effect
Size
Sig.
of
Diff.
Slope
(IB) SE
p
Value
Effect
Size
Sig.
of
Diff.
Slope
(IB) SE
p
Value
Effect
Size
Sig.
of
Diff.
Slope
(IB) SE
p
Value
Effect
Size
Sig.
of
Diff.
Expository
Writing
4 0.24 0.25 -14.4 6.0 0.02 -0.25 -- -14.3 6.2 0.02 -0.25 -- -13.9 5.8 0.02 -0.24 -- -13.7 6.1 0.03 -0.23 --
5 0.22 0.22 5.3 5.3 0.32 0.09 5.7 5.3 0.29 0.09 5.0 5.1 0.33 0.08 5.2 5.2 0.32 0.08
6 0.23 0.23 -6.6 7.2 0.36 -0.10 -4.2 7.6 0.58 -0.07 -5.6 7.0 0.43 -0.09 -3.2 7.4 0.67 -0.05
7 0.24 0.24 0.9 7.8 0.91 0.01 2.2 8.0 0.79 0.03 2.8 7.6 0.71 0.04 4.5 7.8 0.57 0.06
8 0.21 0.21 0.6 7.5 0.93 0.01 1.2 7.6 0.87 0.02 4.3 7.3 0.56 0.06 5.3 7.4 0.48 0.08
9 0.26 0.26 20.9 10.1 0.04 0.28 ++ 17.1 10.4 0.10 0.23 25.0 9.2 0.01 0.33 ++ 22.7 9.5 0.02 0.30 ++
10 0.14 0.14 -1.2 9.9 0.91 -0.02 -2.0 10.0 0.85 -0.03 3.6 10.0 0.72 0.05 2.6 10.2 0.80 0.04
Scientific
Literacy
7 0.14 0.13 21.2 13.2 0.12 0.24 25.9 13.0 0.06 0.29 23.4 13.5 0.09 0.26 28.5 13.2 0.04 0.32 ++
8 0.16 0.16 -13.0 15.4 0.41 -0.15 -10.1 16.0 0.53 -0.12 -8.5 15.6 0.59 -0.10 -4.8 16.1 0.77 -0.06
9 0.23 0.22 34.2 18.0 0.07 0.39 27.6 18.5 0.15 0.32 35.9 16.0 0.03 0.41 ++ 32.8 17.0 0.07 0.38
10 0.15 0.15 -28.8 29.1 0.34 -0.33 -31.1 30.7 0.33 -0.35 -21.8 29.7 0.47 -0.25 -24.7 31.2 0.44 -0.28
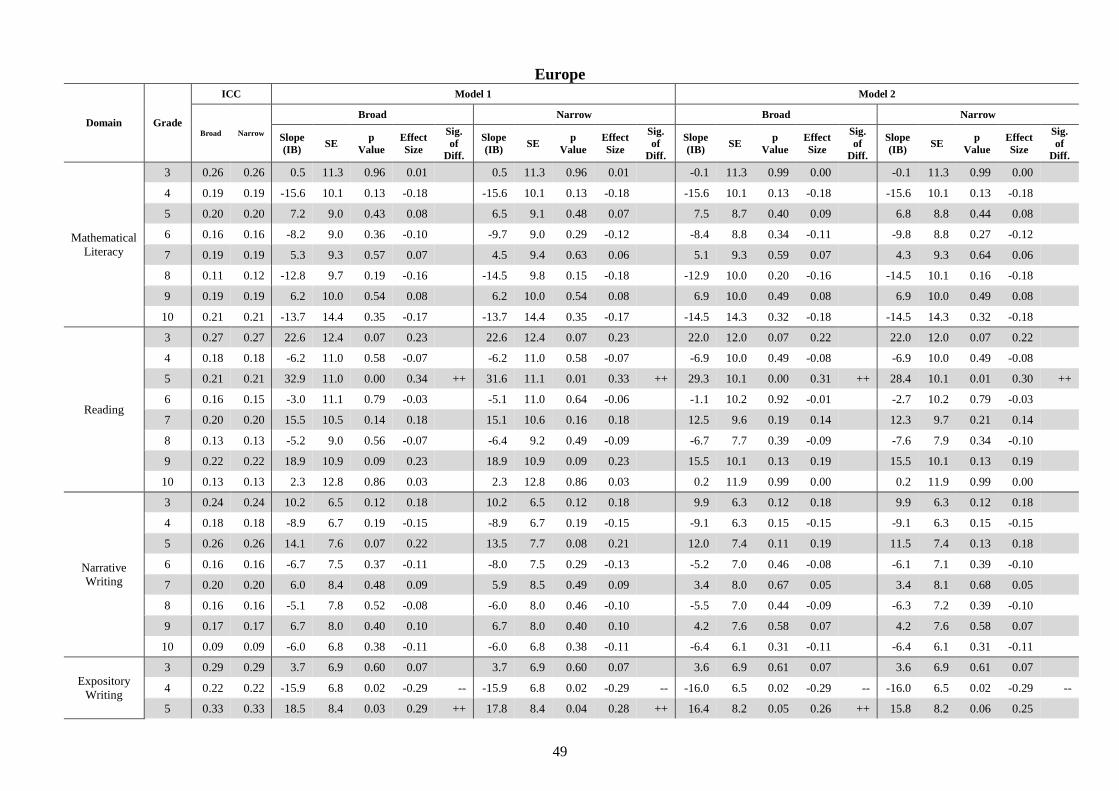
49
Europe
Domain Grade
ICC Model 1 Model 2
Broad Narrow
Broad Narrow Broad Narrow
Slope
(IB) SE
p
Value
Effect
Size
Sig.
of
Diff.
Slope
(IB) SE
p
Value
Effect
Size
Sig.
of
Diff.
Slope
(IB) SE
p
Value
Effect
Size
Sig.
of
Diff.
Slope
(IB) SE
p
Value
Effect
Size
Sig.
of
Diff.
Mathematical
Literacy
3 0.26 0.26 0.5 11.3 0.96 0.01 0.5 11.3 0.96 0.01 -0.1 11.3 0.99 0.00 -0.1 11.3 0.99 0.00
4 0.19 0.19 -15.6 10.1 0.13 -0.18 -15.6 10.1 0.13 -0.18 -15.6 10.1 0.13 -0.18 -15.6 10.1 0.13 -0.18
5 0.20 0.20 7.2 9.0 0.43 0.08 6.5 9.1 0.48 0.07 7.5 8.7 0.40 0.09 6.8 8.8 0.44 0.08
6 0.16 0.16 -8.2 9.0 0.36 -0.10 -9.7 9.0 0.29 -0.12 -8.4 8.8 0.34 -0.11 -9.8 8.8 0.27 -0.12
7 0.19 0.19 5.3 9.3 0.57 0.07 4.5 9.4 0.63 0.06 5.1 9.3 0.59 0.07 4.3 9.3 0.64 0.06
8 0.11 0.12 -12.8 9.7 0.19 -0.16 -14.5 9.8 0.15 -0.18 -12.9 10.0 0.20 -0.16 -14.5 10.1 0.16 -0.18
9 0.19 0.19 6.2 10.0 0.54 0.08 6.2 10.0 0.54 0.08 6.9 10.0 0.49 0.08 6.9 10.0 0.49 0.08
10 0.21 0.21 -13.7 14.4 0.35 -0.17 -13.7 14.4 0.35 -0.17 -14.5 14.3 0.32 -0.18 -14.5 14.3 0.32 -0.18
Reading
3 0.27 0.27 22.6 12.4 0.07 0.23 22.6 12.4 0.07 0.23 22.0 12.0 0.07 0.22 22.0 12.0 0.07 0.22
4 0.18 0.18 -6.2 11.0 0.58 -0.07 -6.2 11.0 0.58 -0.07 -6.9 10.0 0.49 -0.08 -6.9 10.0 0.49 -0.08
5 0.21 0.21 32.9 11.0 0.00 0.34 ++ 31.6 11.1 0.01 0.33 ++ 29.3 10.1 0.00 0.31 ++ 28.4 10.1 0.01 0.30 ++
6 0.16 0.15 -3.0 11.1 0.79 -0.03 -5.1 11.0 0.64 -0.06 -1.1 10.2 0.92 -0.01 -2.7 10.2 0.79 -0.03
7 0.20 0.20 15.5 10.5 0.14 0.18 15.1 10.6 0.16 0.18 12.5 9.6 0.19 0.14 12.3 9.7 0.21 0.14
8 0.13 0.13 -5.2 9.0 0.56 -0.07 -6.4 9.2 0.49 -0.09 -6.7 7.7 0.39 -0.09 -7.6 7.9 0.34 -0.10
9 0.22 0.22 18.9 10.9 0.09 0.23 18.9 10.9 0.09 0.23 15.5 10.1 0.13 0.19 15.5 10.1 0.13 0.19
10 0.13 0.13 2.3 12.8 0.86 0.03 2.3 12.8 0.86 0.03 0.2 11.9 0.99 0.00 0.2 11.9 0.99 0.00
Narrative
Writing
3 0.24 0.24 10.2 6.5 0.12 0.18 10.2 6.5 0.12 0.18 9.9 6.3 0.12 0.18 9.9 6.3 0.12 0.18
4 0.18 0.18 -8.9 6.7 0.19 -0.15 -8.9 6.7 0.19 -0.15 -9.1 6.3 0.15 -0.15 -9.1 6.3 0.15 -0.15
5 0.26 0.26 14.1 7.6 0.07 0.22 13.5 7.7 0.08 0.21 12.0 7.4 0.11 0.19 11.5 7.4 0.13 0.18
6 0.16 0.16 -6.7 7.5 0.37 -0.11 -8.0 7.5 0.29 -0.13 -5.2 7.0 0.46 -0.08 -6.1 7.1 0.39 -0.10
7 0.20 0.20 6.0 8.4 0.48 0.09 5.9 8.5 0.49 0.09 3.4 8.0 0.67 0.05 3.4 8.1 0.68 0.05
8 0.16 0.16 -5.1 7.8 0.52 -0.08 -6.0 8.0 0.46 -0.10 -5.5 7.0 0.44 -0.09 -6.3 7.2 0.39 -0.10
9 0.17 0.17 6.7 8.0 0.40 0.10 6.7 8.0 0.40 0.10 4.2 7.6 0.58 0.07 4.2 7.6 0.58 0.07
10 0.09 0.09 -6.0 6.8 0.38 -0.11 -6.0 6.8 0.38 -0.11 -6.4 6.1 0.31 -0.11 -6.4 6.1 0.31 -0.11
Expository
Writing
3 0.29 0.29 3.7 6.9 0.60 0.07 3.7 6.9 0.60 0.07 3.6 6.9 0.61 0.07 3.6 6.9 0.61 0.07
4 0.22 0.22 -15.9 6.8 0.02 -0.29 -- -15.9 6.8 0.02 -0.29 -- -16.0 6.5 0.02 -0.29 -- -16.0 6.5 0.02 -0.29 --
5 0.33 0.33 18.5 8.4 0.03 0.29 ++ 17.8 8.4 0.04 0.28 ++ 16.4 8.2 0.05 0.26 ++ 15.8 8.2 0.06 0.25
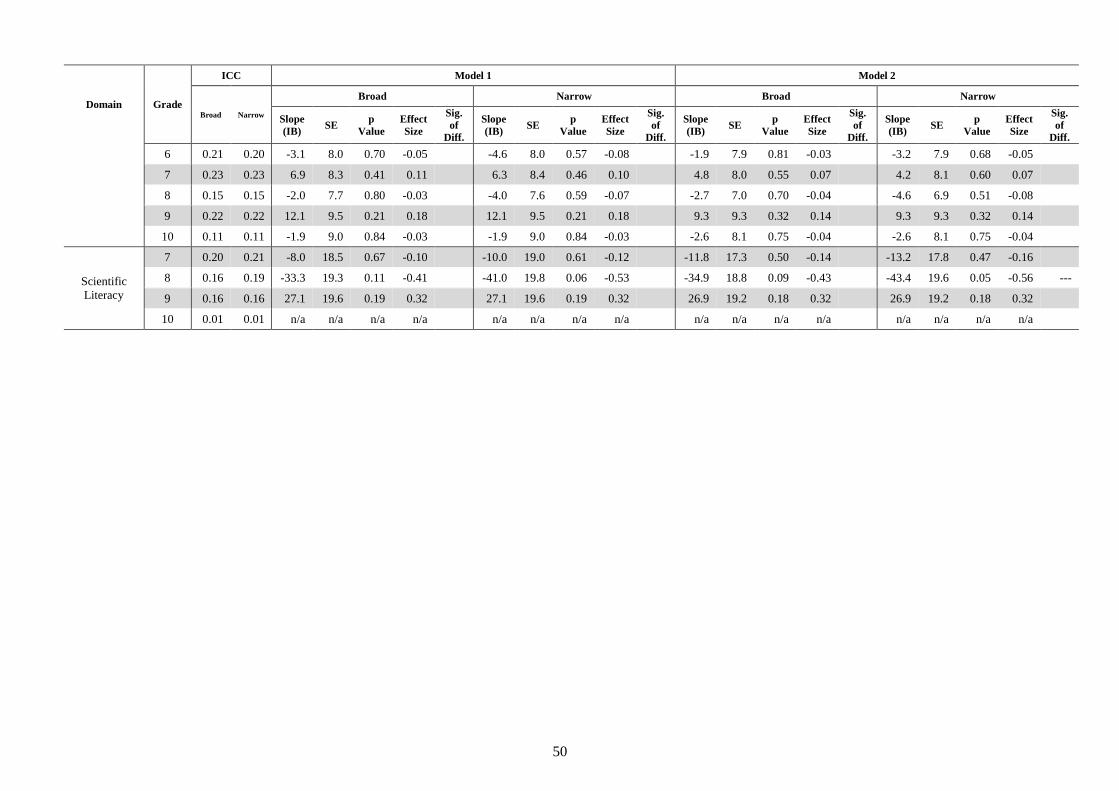
50
Domain Grade
ICC Model 1 Model 2
Broad Narrow
Broad Narrow Broad Narrow
Slope
(IB) SE
p
Value
Effect
Size
Sig.
of
Diff.
Slope
(IB) SE
p
Value
Effect
Size
Sig.
of
Diff.
Slope
(IB) SE
p
Value
Effect
Size
Sig.
of
Diff.
Slope
(IB) SE
p
Value
Effect
Size
Sig.
of
Diff.
6 0.21 0.20 -3.1 8.0 0.70 -0.05 -4.6 8.0 0.57 -0.08 -1.9 7.9 0.81 -0.03 -3.2 7.9 0.68 -0.05
7 0.23 0.23 6.9 8.3 0.41 0.11 6.3 8.4 0.46 0.10 4.8 8.0 0.55 0.07 4.2 8.1 0.60 0.07
8 0.15 0.15 -2.0 7.7 0.80 -0.03 -4.0 7.6 0.59 -0.07 -2.7 7.0 0.70 -0.04 -4.6 6.9 0.51 -0.08
9 0.22 0.22 12.1 9.5 0.21 0.18 12.1 9.5 0.21 0.18 9.3 9.3 0.32 0.14 9.3 9.3 0.32 0.14
10 0.11 0.11 -1.9 9.0 0.84 -0.03 -1.9 9.0 0.84 -0.03 -2.6 8.1 0.75 -0.04 -2.6 8.1 0.75 -0.04
Scientific
Literacy
7 0.20 0.21 -8.0 18.5 0.67 -0.10 -10.0 19.0 0.61 -0.12 -11.8 17.3 0.50 -0.14 -13.2 17.8 0.47 -0.16
8 0.16 0.19 -33.3 19.3 0.11 -0.41 -41.0 19.8 0.06 -0.53 -34.9 18.8 0.09 -0.43 -43.4 19.6 0.05 -0.56 ---
9 0.16 0.16 27.1 19.6 0.19 0.32 27.1 19.6 0.19 0.32 26.9 19.2 0.18 0.32 26.9 19.2 0.18 0.32
10 0.01 0.01 n/a n/a n/a n/a n/a n/a n/a n/a n/a n/a n/a n/a n/a n/a n/a n/a
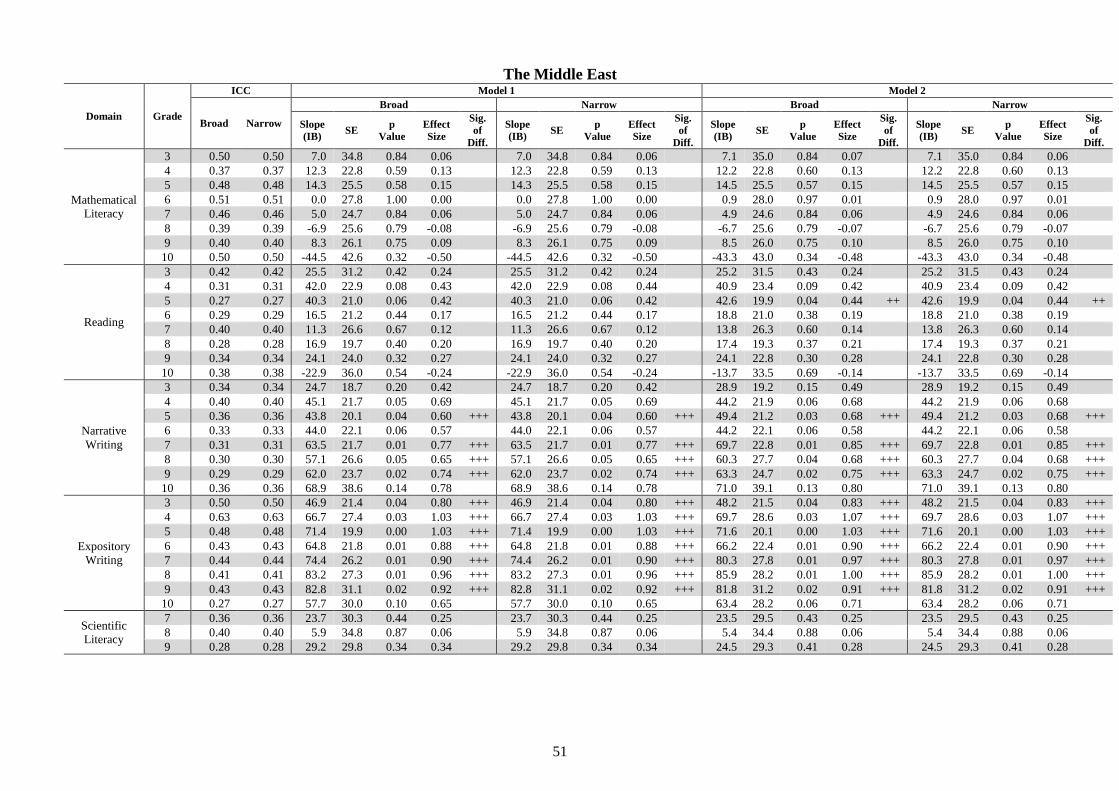
51
The Middle East
Domain Grade
ICC Model 1 Model 2
Broad Narrow
Broad Narrow Broad Narrow
Slope
(IB) SE
p
Value
Effect
Size
Sig.
of
Diff.
Slope
(IB) SE
p
Value
Effect
Size
Sig.
of
Diff.
Slope
(IB) SE
p
Value
Effect
Size
Sig.
of
Diff.
Slope
(IB) SE
p
Value
Effect
Size
Sig.
of
Diff.
Mathematical
Literacy
3 0.50 0.50 7.0 34.8 0.84 0.06 7.0 34.8 0.84 0.06 7.1 35.0 0.84 0.07 7.1 35.0 0.84 0.06
4 0.37 0.37 12.3 22.8 0.59 0.13 12.3 22.8 0.59 0.13 12.2 22.8 0.60 0.13 12.2 22.8 0.60 0.13
5 0.48 0.48 14.3 25.5 0.58 0.15 14.3 25.5 0.58 0.15 14.5 25.5 0.57 0.15 14.5 25.5 0.57 0.15
6 0.51 0.51 0.0 27.8 1.00 0.00 0.0 27.8 1.00 0.00 0.9 28.0 0.97 0.01 0.9 28.0 0.97 0.01
7 0.46 0.46 5.0 24.7 0.84 0.06 5.0 24.7 0.84 0.06 4.9 24.6 0.84 0.06 4.9 24.6 0.84 0.06
8 0.39 0.39 -6.9 25.6 0.79 -0.08 -6.9 25.6 0.79 -0.08 -6.7 25.6 0.79 -0.07 -6.7 25.6 0.79 -0.07
9 0.40 0.40 8.3 26.1 0.75 0.09 8.3 26.1 0.75 0.09 8.5 26.0 0.75 0.10 8.5 26.0 0.75 0.10
10 0.50 0.50 -44.5 42.6 0.32 -0.50 -44.5 42.6 0.32 -0.50 -43.3 43.0 0.34 -0.48 -43.3 43.0 0.34 -0.48
Reading
3 0.42 0.42 25.5 31.2 0.42 0.24 25.5 31.2 0.42 0.24 25.2 31.5 0.43 0.24 25.2 31.5 0.43 0.24
4 0.31 0.31 42.0 22.9 0.08 0.43 42.0 22.9 0.08 0.44 40.9 23.4 0.09 0.42 40.9 23.4 0.09 0.42
5 0.27 0.27 40.3 21.0 0.06 0.42 40.3 21.0 0.06 0.42 42.6 19.9 0.04 0.44 ++ 42.6 19.9 0.04 0.44 ++
6 0.29 0.29 16.5 21.2 0.44 0.17 16.5 21.2 0.44 0.17 18.8 21.0 0.38 0.19 18.8 21.0 0.38 0.19
7 0.40 0.40 11.3 26.6 0.67 0.12 11.3 26.6 0.67 0.12 13.8 26.3 0.60 0.14 13.8 26.3 0.60 0.14
8 0.28 0.28 16.9 19.7 0.40 0.20 16.9 19.7 0.40 0.20 17.4 19.3 0.37 0.21 17.4 19.3 0.37 0.21
9 0.34 0.34 24.1 24.0 0.32 0.27 24.1 24.0 0.32 0.27 24.1 22.8 0.30 0.28 24.1 22.8 0.30 0.28
10 0.38 0.38 -22.9 36.0 0.54 -0.24 -22.9 36.0 0.54 -0.24 -13.7 33.5 0.69 -0.14 -13.7 33.5 0.69 -0.14
Narrative
Writing
3 0.34 0.34 24.7 18.7 0.20 0.42 24.7 18.7 0.20 0.42 28.9 19.2 0.15 0.49 28.9 19.2 0.15 0.49
4 0.40 0.40 45.1 21.7 0.05 0.69 45.1 21.7 0.05 0.69 44.2 21.9 0.06 0.68 44.2 21.9 0.06 0.68
5 0.36 0.36 43.8 20.1 0.04 0.60 +++ 43.8 20.1 0.04 0.60 +++ 49.4 21.2 0.03 0.68 +++ 49.4 21.2 0.03 0.68 +++
6 0.33 0.33 44.0 22.1 0.06 0.57 44.0 22.1 0.06 0.57 44.2 22.1 0.06 0.58 44.2 22.1 0.06 0.58
7 0.31 0.31 63.5 21.7 0.01 0.77 +++ 63.5 21.7 0.01 0.77 +++ 69.7 22.8 0.01 0.85 +++ 69.7 22.8 0.01 0.85 +++
8 0.30 0.30 57.1 26.6 0.05 0.65 +++ 57.1 26.6 0.05 0.65 +++ 60.3 27.7 0.04 0.68 +++ 60.3 27.7 0.04 0.68 +++
9 0.29 0.29 62.0 23.7 0.02 0.74 +++ 62.0 23.7 0.02 0.74 +++ 63.3 24.7 0.02 0.75 +++ 63.3 24.7 0.02 0.75 +++
10 0.36 0.36 68.9 38.6 0.14 0.78 68.9 38.6 0.14 0.78 71.0 39.1 0.13 0.80 71.0 39.1 0.13 0.80
Expository
Writing
3 0.50 0.50 46.9 21.4 0.04 0.80 +++ 46.9 21.4 0.04 0.80 +++ 48.2 21.5 0.04 0.83 +++ 48.2 21.5 0.04 0.83 +++
4 0.63 0.63 66.7 27.4 0.03 1.03 +++ 66.7 27.4 0.03 1.03 +++ 69.7 28.6 0.03 1.07 +++ 69.7 28.6 0.03 1.07 +++
5 0.48 0.48 71.4 19.9 0.00 1.03 +++ 71.4 19.9 0.00 1.03 +++ 71.6 20.1 0.00 1.03 +++ 71.6 20.1 0.00 1.03 +++
6 0.43 0.43 64.8 21.8 0.01 0.88 +++ 64.8 21.8 0.01 0.88 +++ 66.2 22.4 0.01 0.90 +++ 66.2 22.4 0.01 0.90 +++
7 0.44 0.44 74.4 26.2 0.01 0.90 +++ 74.4 26.2 0.01 0.90 +++ 80.3 27.8 0.01 0.97 +++ 80.3 27.8 0.01 0.97 +++
8 0.41 0.41 83.2 27.3 0.01 0.96 +++ 83.2 27.3 0.01 0.96 +++ 85.9 28.2 0.01 1.00 +++ 85.9 28.2 0.01 1.00 +++
9 0.43 0.43 82.8 31.1 0.02 0.92 +++ 82.8 31.1 0.02 0.92 +++ 81.8 31.2 0.02 0.91 +++ 81.8 31.2 0.02 0.91 +++
10 0.27 0.27 57.7 30.0 0.10 0.65 57.7 30.0 0.10 0.65 63.4 28.2 0.06 0.71 63.4 28.2 0.06 0.71
Scientific
Literacy
7 0.36 0.36 23.7 30.3 0.44 0.25 23.7 30.3 0.44 0.25 23.5 29.5 0.43 0.25 23.5 29.5 0.43 0.25
8 0.40 0.40 5.9 34.8 0.87 0.06 5.9 34.8 0.87 0.06 5.4 34.4 0.88 0.06 5.4 34.4 0.88 0.06
9 0.28 0.28 29.2 29.8 0.34 0.34 29.2 29.8 0.34 0.34 24.5 29.3 0.41 0.28 24.5 29.3 0.41 0.28
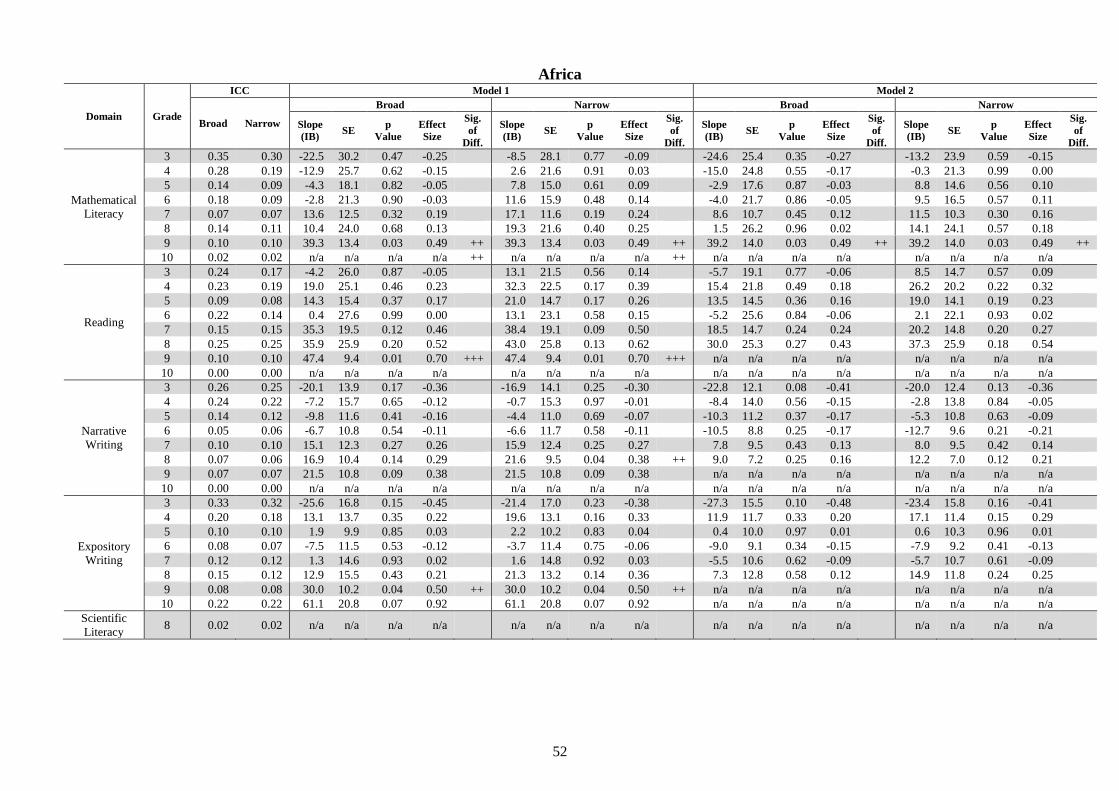
52
Africa
Domain Grade
ICC Model 1 Model 2
Broad Narrow
Broad Narrow Broad Narrow
Slope
(IB) SE
p
Value
Effect
Size
Sig.
of
Diff.
Slope
(IB) SE
p
Value
Effect
Size
Sig.
of
Diff.
Slope
(IB) SE
p
Value
Effect
Size
Sig.
of
Diff.
Slope
(IB) SE
p
Value
Effect
Size
Sig.
of
Diff.
Mathematical
Literacy
3 0.35 0.30 -22.5 30.2 0.47 -0.25 -8.5 28.1 0.77 -0.09 -24.6 25.4 0.35 -0.27 -13.2 23.9 0.59 -0.15
4 0.28 0.19 -12.9 25.7 0.62 -0.15 2.6 21.6 0.91 0.03 -15.0 24.8 0.55 -0.17 -0.3 21.3 0.99 0.00
5 0.14 0.09 -4.3 18.1 0.82 -0.05 7.8 15.0 0.61 0.09 -2.9 17.6 0.87 -0.03 8.8 14.6 0.56 0.10
6 0.18 0.09 -2.8 21.3 0.90 -0.03 11.6 15.9 0.48 0.14 -4.0 21.7 0.86 -0.05 9.5 16.5 0.57 0.11
7 0.07 0.07 13.6 12.5 0.32 0.19 17.1 11.6 0.19 0.24 8.6 10.7 0.45 0.12 11.5 10.3 0.30 0.16
8 0.14 0.11 10.4 24.0 0.68 0.13 19.3 21.6 0.40 0.25 1.5 26.2 0.96 0.02 14.1 24.1 0.57 0.18
9 0.10 0.10 39.3 13.4 0.03 0.49 ++ 39.3 13.4 0.03 0.49 ++ 39.2 14.0 0.03 0.49 ++ 39.2 14.0 0.03 0.49 ++
10 0.02 0.02 n/a n/a n/a n/a ++ n/a n/a n/a n/a ++ n/a n/a n/a n/a n/a n/a n/a n/a
Reading
3 0.24 0.17 -4.2 26.0 0.87 -0.05 13.1 21.5 0.56 0.14 -5.7 19.1 0.77 -0.06 8.5 14.7 0.57 0.09
4 0.23 0.19 19.0 25.1 0.46 0.23 32.3 22.5 0.17 0.39 15.4 21.8 0.49 0.18 26.2 20.2 0.22 0.32
5 0.09 0.08 14.3 15.4 0.37 0.17 21.0 14.7 0.17 0.26 13.5 14.5 0.36 0.16 19.0 14.1 0.19 0.23
6 0.22 0.14 0.4 27.6 0.99 0.00 13.1 23.1 0.58 0.15 -5.2 25.6 0.84 -0.06 2.1 22.1 0.93 0.02
7 0.15 0.15 35.3 19.5 0.12 0.46 38.4 19.1 0.09 0.50 18.5 14.7 0.24 0.24 20.2 14.8 0.20 0.27
8 0.25 0.25 35.9 25.9 0.20 0.52 43.0 25.8 0.13 0.62 30.0 25.3 0.27 0.43 37.3 25.9 0.18 0.54
9 0.10 0.10 47.4 9.4 0.01 0.70 +++ 47.4 9.4 0.01 0.70 +++ n/a n/a n/a n/a n/a n/a n/a n/a
10 0.00 0.00 n/a n/a n/a n/a n/a n/a n/a n/a n/a n/a n/a n/a n/a n/a n/a n/a
Narrative
Writing
3 0.26 0.25 -20.1 13.9 0.17 -0.36 -16.9 14.1 0.25 -0.30 -22.8 12.1 0.08 -0.41 -20.0 12.4 0.13 -0.36
4 0.24 0.22 -7.2 15.7 0.65 -0.12 -0.7 15.3 0.97 -0.01 -8.4 14.0 0.56 -0.15 -2.8 13.8 0.84 -0.05
5 0.14 0.12 -9.8 11.6 0.41 -0.16 -4.4 11.0 0.69 -0.07 -10.3 11.2 0.37 -0.17 -5.3 10.8 0.63 -0.09
6 0.05 0.06 -6.7 10.8 0.54 -0.11 -6.6 11.7 0.58 -0.11 -10.5 8.8 0.25 -0.17 -12.7 9.6 0.21 -0.21
7 0.10 0.10 15.1 12.3 0.27 0.26 15.9 12.4 0.25 0.27 7.8 9.5 0.43 0.13 8.0 9.5 0.42 0.14
8 0.07 0.06 16.9 10.4 0.14 0.29 21.6 9.5 0.04 0.38 ++ 9.0 7.2 0.25 0.16 12.2 7.0 0.12 0.21
9 0.07 0.07 21.5 10.8 0.09 0.38 21.5 10.8 0.09 0.38 n/a n/a n/a n/a n/a n/a n/a n/a
10 0.00 0.00 n/a n/a n/a n/a n/a n/a n/a n/a n/a n/a n/a n/a n/a n/a n/a n/a
Expository
Writing
3 0.33 0.32 -25.6 16.8 0.15 -0.45 -21.4 17.0 0.23 -0.38 -27.3 15.5 0.10 -0.48 -23.4 15.8 0.16 -0.41
4 0.20 0.18 13.1 13.7 0.35 0.22 19.6 13.1 0.16 0.33 11.9 11.7 0.33 0.20 17.1 11.4 0.15 0.29
5 0.10 0.10 1.9 9.9 0.85 0.03 2.2 10.2 0.83 0.04 0.4 10.0 0.97 0.01 0.6 10.3 0.96 0.01
6 0.08 0.07 -7.5 11.5 0.53 -0.12 -3.7 11.4 0.75 -0.06 -9.0 9.1 0.34 -0.15 -7.9 9.2 0.41 -0.13
7 0.12 0.12 1.3 14.6 0.93 0.02 1.6 14.8 0.92 0.03 -5.5 10.6 0.62 -0.09 -5.7 10.7 0.61 -0.09
8 0.15 0.12 12.9 15.5 0.43 0.21 21.3 13.2 0.14 0.36 7.3 12.8 0.58 0.12 14.9 11.8 0.24 0.25
9 0.08 0.08 30.0 10.2 0.04 0.50 ++ 30.0 10.2 0.04 0.50 ++ n/a n/a n/a n/a n/a n/a n/a n/a
10 0.22 0.22 61.1 20.8 0.07 0.92 61.1 20.8 0.07 0.92 n/a n/a n/a n/a n/a n/a n/a n/a
Scientific
Literacy 8 0.02 0.02 n/a n/a n/a n/a n/a n/a n/a n/a n/a n/a n/a n/a n/a n/a n/a n/a
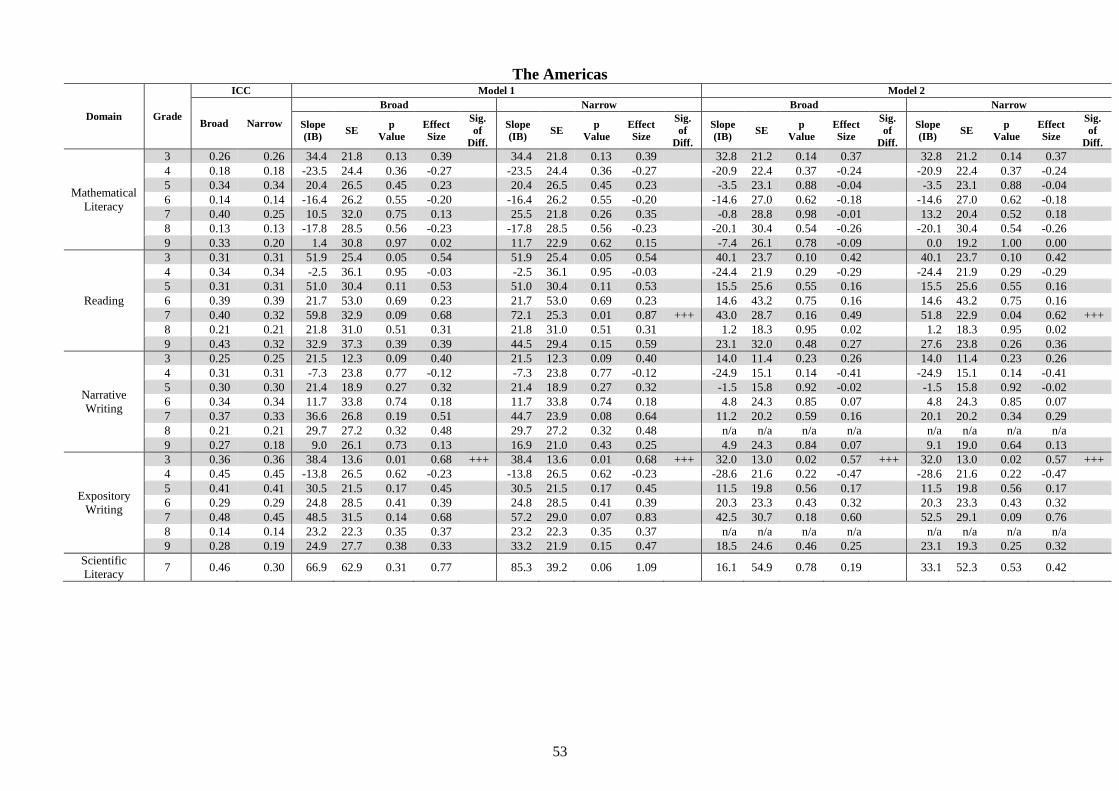
53
The Americas
Domain Grade
ICC Model 1 Model 2
Broad Narrow
Broad Narrow Broad Narrow
Slope
(IB) SE
p
Value
Effect
Size
Sig.
of
Diff.
Slope
(IB) SE
p
Value
Effect
Size
Sig.
of
Diff.
Slope
(IB) SE
p
Value
Effect
Size
Sig.
of
Diff.
Slope
(IB) SE
p
Value
Effect
Size
Sig.
of
Diff.
Mathematical
Literacy
3 0.26 0.26 34.4 21.8 0.13 0.39 34.4 21.8 0.13 0.39 32.8 21.2 0.14 0.37 32.8 21.2 0.14 0.37
4 0.18 0.18 -23.5 24.4 0.36 -0.27 -23.5 24.4 0.36 -0.27 -20.9 22.4 0.37 -0.24 -20.9 22.4 0.37 -0.24
5 0.34 0.34 20.4 26.5 0.45 0.23 20.4 26.5 0.45 0.23 -3.5 23.1 0.88 -0.04 -3.5 23.1 0.88 -0.04
6 0.14 0.14 -16.4 26.2 0.55 -0.20 -16.4 26.2 0.55 -0.20 -14.6 27.0 0.62 -0.18 -14.6 27.0 0.62 -0.18
7 0.40 0.25 10.5 32.0 0.75 0.13 25.5 21.8 0.26 0.35 -0.8 28.8 0.98 -0.01 13.2 20.4 0.52 0.18
8 0.13 0.13 -17.8 28.5 0.56 -0.23 -17.8 28.5 0.56 -0.23 -20.1 30.4 0.54 -0.26 -20.1 30.4 0.54 -0.26
9 0.33 0.20 1.4 30.8 0.97 0.02 11.7 22.9 0.62 0.15 -7.4 26.1 0.78 -0.09 0.0 19.2 1.00 0.00
Reading
3 0.31 0.31 51.9 25.4 0.05 0.54 51.9 25.4 0.05 0.54 40.1 23.7 0.10 0.42 40.1 23.7 0.10 0.42
4 0.34 0.34 -2.5 36.1 0.95 -0.03 -2.5 36.1 0.95 -0.03 -24.4 21.9 0.29 -0.29 -24.4 21.9 0.29 -0.29
5 0.31 0.31 51.0 30.4 0.11 0.53 51.0 30.4 0.11 0.53 15.5 25.6 0.55 0.16 15.5 25.6 0.55 0.16
6 0.39 0.39 21.7 53.0 0.69 0.23 21.7 53.0 0.69 0.23 14.6 43.2 0.75 0.16 14.6 43.2 0.75 0.16
7 0.40 0.32 59.8 32.9 0.09 0.68 72.1 25.3 0.01 0.87 +++ 43.0 28.7 0.16 0.49 51.8 22.9 0.04 0.62 +++
8 0.21 0.21 21.8 31.0 0.51 0.31 21.8 31.0 0.51 0.31 1.2 18.3 0.95 0.02 1.2 18.3 0.95 0.02
9 0.43 0.32 32.9 37.3 0.39 0.39 44.5 29.4 0.15 0.59 23.1 32.0 0.48 0.27 27.6 23.8 0.26 0.36
Narrative
Writing
3 0.25 0.25 21.5 12.3 0.09 0.40 21.5 12.3 0.09 0.40 14.0 11.4 0.23 0.26 14.0 11.4 0.23 0.26
4 0.31 0.31 -7.3 23.8 0.77 -0.12 -7.3 23.8 0.77 -0.12 -24.9 15.1 0.14 -0.41 -24.9 15.1 0.14 -0.41
5 0.30 0.30 21.4 18.9 0.27 0.32 21.4 18.9 0.27 0.32 -1.5 15.8 0.92 -0.02 -1.5 15.8 0.92 -0.02
6 0.34 0.34 11.7 33.8 0.74 0.18 11.7 33.8 0.74 0.18 4.8 24.3 0.85 0.07 4.8 24.3 0.85 0.07
7 0.37 0.33 36.6 26.8 0.19 0.51 44.7 23.9 0.08 0.64 11.2 20.2 0.59 0.16 20.1 20.2 0.34 0.29
8 0.21 0.21 29.7 27.2 0.32 0.48 29.7 27.2 0.32 0.48 n/a n/a n/a n/a n/a n/a n/a n/a
9 0.27 0.18 9.0 26.1 0.73 0.13 16.9 21.0 0.43 0.25 4.9 24.3 0.84 0.07 9.1 19.0 0.64 0.13
Expository
Writing
3 0.36 0.36 38.4 13.6 0.01 0.68 +++ 38.4 13.6 0.01 0.68 +++ 32.0 13.0 0.02 0.57 +++ 32.0 13.0 0.02 0.57 +++
4 0.45 0.45 -13.8 26.5 0.62 -0.23 -13.8 26.5 0.62 -0.23 -28.6 21.6 0.22 -0.47 -28.6 21.6 0.22 -0.47
5 0.41 0.41 30.5 21.5 0.17 0.45 30.5 21.5 0.17 0.45 11.5 19.8 0.56 0.17 11.5 19.8 0.56 0.17
6 0.29 0.29 24.8 28.5 0.41 0.39 24.8 28.5 0.41 0.39 20.3 23.3 0.43 0.32 20.3 23.3 0.43 0.32
7 0.48 0.45 48.5 31.5 0.14 0.68 57.2 29.0 0.07 0.83 42.5 30.7 0.18 0.60 52.5 29.1 0.09 0.76
8 0.14 0.14 23.2 22.3 0.35 0.37 23.2 22.3 0.35 0.37 n/a n/a n/a n/a n/a n/a n/a n/a
9 0.28 0.19 24.9 27.7 0.38 0.33 33.2 21.9 0.15 0.47 18.5 24.6 0.46 0.25 23.1 19.3 0.25 0.32
Scientific
Literacy 7 0.46 0.30 66.9 62.9 0.31 0.77 85.3 39.2 0.06 1.09 16.1 54.9 0.78 0.19 33.1 52.3 0.53 0.42
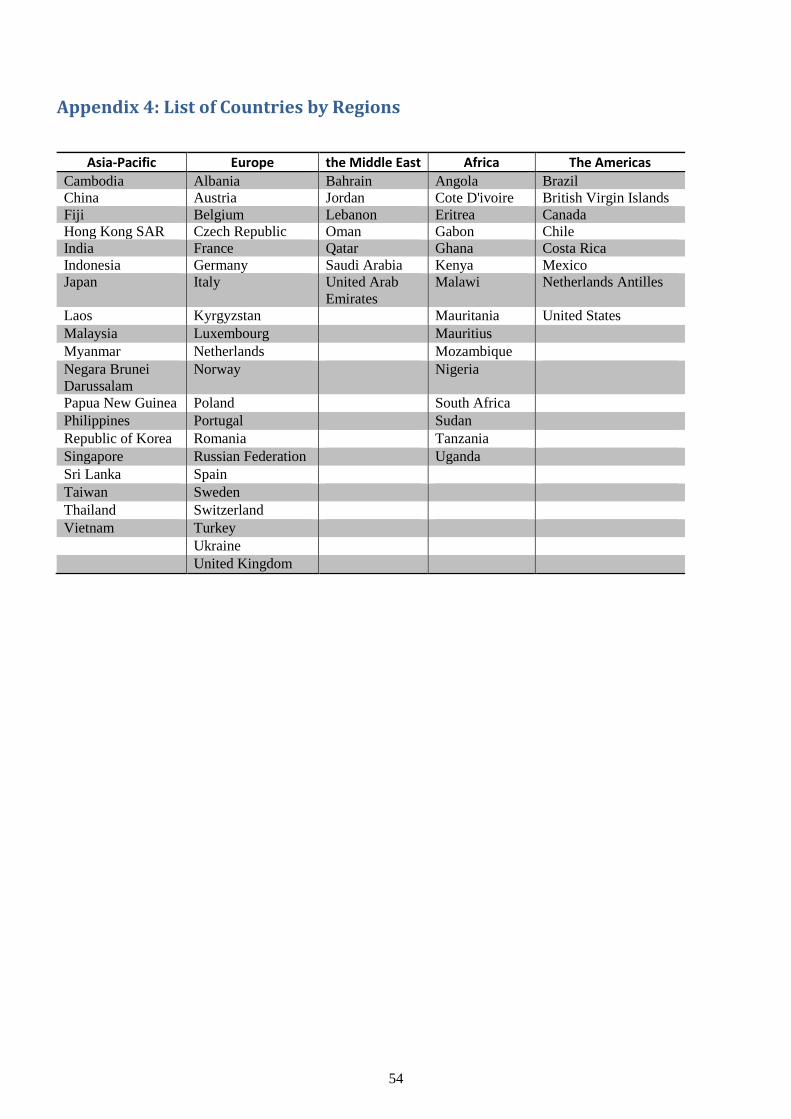
54
Appendix 4: List of Countries by Regions
Asia-Pacific Europe the Middle East Africa The Americas
Cambodia Albania Bahrain Angola Brazil
China Austria Jordan Cote D'ivoire British Virgin Islands
Fiji Belgium Lebanon Eritrea Canada
Hong Kong SAR Czech Republic Oman Gabon Chile
India France Qatar Ghana Costa Rica
Indonesia Germany Saudi Arabia Kenya Mexico
Japan Italy United Arab
Emirates
Malawi Netherlands Antilles
Laos Kyrgyzstan Mauritania United States
Malaysia Luxembourg Mauritius
Myanmar Netherlands Mozambique
Negara Brunei
Darussalam
Norway Nigeria
Papua New Guinea Poland South Africa
Philippines Portugal Sudan Republic of Korea Romania Tanzania Singapore Russian Federation Uganda Sri Lanka Spain Taiwan Sweden Thailand Switzerland Vietnam Turkey
Ukraine United Kingdom
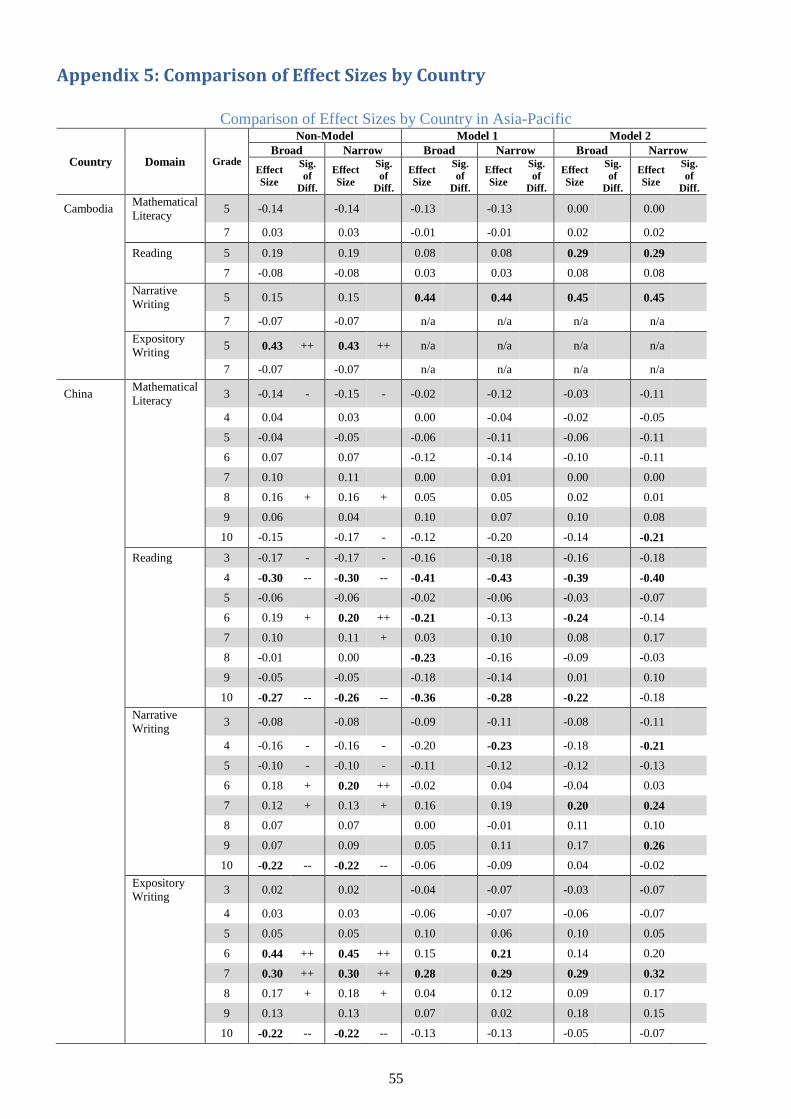
55
Appendix 5: Comparison of Effect Sizes by Country
Comparison of Effect Sizes by Country in Asia-Pacific
Country Domain Grade
Non-Model Model 1 Model 2
Broad Narrow Broad Narrow Broad Narrow
Effect
Size
Sig.
of
Diff.
Effect
Size
Sig.
of
Diff.
Effect
Size
Sig.
of
Diff.
Effect
Size
Sig.
of
Diff.
Effect
Size
Sig.
of
Diff.
Effect
Size
Sig.
of
Diff.
Cambodia Mathematical
Literacy 5 -0.14 -0.14 -0.13 -0.13 0.00 0.00
7 0.03 0.03 -0.01 -0.01 0.02 0.02
Reading 5 0.19 0.19 0.08 0.08 0.29 0.29
7 -0.08 -0.08 0.03 0.03 0.08 0.08
Narrative
Writing 5 0.15 0.15 0.44 0.44 0.45 0.45
7 -0.07 -0.07 n/a n/a n/a n/a
Expository
Writing 5 0.43 ++ 0.43 ++ n/a n/a n/a n/a
7 -0.07 -0.07 n/a n/a n/a n/a
China Mathematical
Literacy 3 -0.14 - -0.15 - -0.02 -0.12 -0.03 -0.11
4 0.04 0.03 0.00 -0.04 -0.02 -0.05
5 -0.04 -0.05 -0.06 -0.11 -0.06 -0.11
6 0.07 0.07 -0.12 -0.14 -0.10 -0.11
7 0.10 0.11 0.00 0.01 0.00 0.00
8 0.16 + 0.16 + 0.05 0.05 0.02 0.01
9 0.06 0.04 0.10 0.07 0.10 0.08
10 -0.15 -0.17 - -0.12 -0.20 -0.14 -0.21
Reading 3 -0.17 - -0.17 - -0.16 -0.18 -0.16 -0.18
4 -0.30 -- -0.30 -- -0.41 -0.43 -0.39 -0.40
5 -0.06 -0.06 -0.02 -0.06 -0.03 -0.07
6 0.19 + 0.20 ++ -0.21 -0.13 -0.24 -0.14
7 0.10 0.11 + 0.03 0.10 0.08 0.17
8 -0.01 0.00 -0.23 -0.16 -0.09 -0.03
9 -0.05 -0.05 -0.18 -0.14 0.01 0.10
10 -0.27 -- -0.26 -- -0.36 -0.28 -0.22 -0.18
Narrative
Writing 3 -0.08 -0.08 -0.09 -0.11 -0.08 -0.11
4 -0.16 - -0.16 - -0.20 -0.23 -0.18 -0.21
5 -0.10 - -0.10 - -0.11 -0.12 -0.12 -0.13
6 0.18 + 0.20 ++ -0.02 0.04 -0.04 0.03
7 0.12 + 0.13 + 0.16 0.19 0.20 0.24
8 0.07 0.07 0.00 -0.01 0.11 0.10
9 0.07 0.09 0.05 0.11 0.17 0.26
10 -0.22 -- -0.22 -- -0.06 -0.09 0.04 -0.02
Expository
Writing 3 0.02 0.02 -0.04 -0.07 -0.03 -0.07
4 0.03 0.03 -0.06 -0.07 -0.06 -0.07
5 0.05 0.05 0.10 0.06 0.10 0.05
6 0.44 ++ 0.45 ++ 0.15 0.21 0.14 0.20
7 0.30 ++ 0.30 ++ 0.28 0.29 0.29 0.32
8 0.17 + 0.18 + 0.04 0.12 0.09 0.17
9 0.13 0.13 0.07 0.02 0.18 0.15
10 -0.22 -- -0.22 -- -0.13 -0.13 -0.05 -0.07
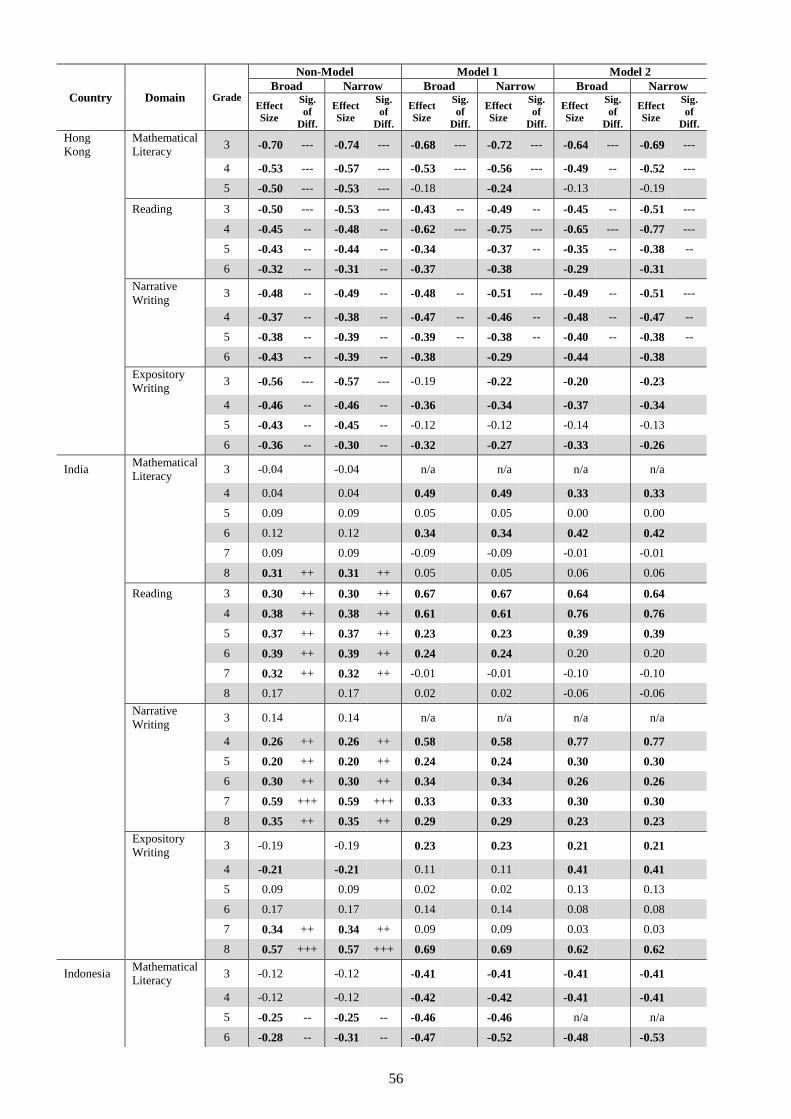
56
Country Domain Grade
Non-Model Model 1 Model 2
Broad Narrow Broad Narrow Broad Narrow
Effect
Size
Sig.
of
Diff.
Effect
Size
Sig.
of
Diff.
Effect
Size
Sig.
of
Diff.
Effect
Size
Sig.
of
Diff.
Effect
Size
Sig.
of
Diff.
Effect
Size
Sig.
of
Diff.
Hong
Kong
Mathematical
Literacy 3 -0.70 --- -0.74 --- -0.68 --- -0.72 --- -0.64 --- -0.69 ---
4 -0.53 --- -0.57 --- -0.53 --- -0.56 --- -0.49 -- -0.52 ---
5 -0.50 --- -0.53 --- -0.18 -0.24 -0.13 -0.19
Reading 3 -0.50 --- -0.53 --- -0.43 -- -0.49 -- -0.45 -- -0.51 ---
4 -0.45 -- -0.48 -- -0.62 --- -0.75 --- -0.65 --- -0.77 ---
5 -0.43 -- -0.44 -- -0.34 -0.37 -- -0.35 -- -0.38 --
6 -0.32 -- -0.31 -- -0.37 -0.38 -0.29 -0.31
Narrative
Writing 3 -0.48 -- -0.49 -- -0.48 -- -0.51 --- -0.49 -- -0.51 ---
4 -0.37 -- -0.38 -- -0.47 -- -0.46 -- -0.48 -- -0.47 --
5 -0.38 -- -0.39 -- -0.39 -- -0.38 -- -0.40 -- -0.38 --
6 -0.43 -- -0.39 -- -0.38 -0.29 -0.44 -0.38
Expository
Writing 3 -0.56 --- -0.57 --- -0.19 -0.22 -0.20 -0.23
4 -0.46 -- -0.46 -- -0.36 -0.34 -0.37 -0.34
5 -0.43 -- -0.45 -- -0.12 -0.12 -0.14 -0.13
6 -0.36 -- -0.30 -- -0.32 -0.27 -0.33 -0.26
India Mathematical
Literacy 3 -0.04 -0.04 n/a n/a n/a n/a
4 0.04 0.04 0.49 0.49 0.33 0.33
5 0.09 0.09 0.05 0.05 0.00 0.00
6 0.12 0.12 0.34 0.34 0.42 0.42
7 0.09 0.09 -0.09 -0.09 -0.01 -0.01
8 0.31 ++ 0.31 ++ 0.05 0.05 0.06 0.06
Reading 3 0.30 ++ 0.30 ++ 0.67 0.67 0.64 0.64
4 0.38 ++ 0.38 ++ 0.61 0.61 0.76 0.76
5 0.37 ++ 0.37 ++ 0.23 0.23 0.39 0.39
6 0.39 ++ 0.39 ++ 0.24 0.24 0.20 0.20
7 0.32 ++ 0.32 ++ -0.01 -0.01 -0.10 -0.10
8 0.17 0.17 0.02 0.02 -0.06 -0.06
Narrative
Writing 3 0.14 0.14 n/a n/a n/a n/a
4 0.26 ++ 0.26 ++ 0.58 0.58 0.77 0.77
5 0.20 ++ 0.20 ++ 0.24 0.24 0.30 0.30
6 0.30 ++ 0.30 ++ 0.34 0.34 0.26 0.26
7 0.59 +++ 0.59 +++ 0.33 0.33 0.30 0.30
8 0.35 ++ 0.35 ++ 0.29 0.29 0.23 0.23
Expository
Writing 3 -0.19 -0.19 0.23 0.23 0.21 0.21
4 -0.21 -0.21 0.11 0.11 0.41 0.41
5 0.09 0.09 0.02 0.02 0.13 0.13
6 0.17 0.17 0.14 0.14 0.08 0.08
7 0.34 ++ 0.34 ++ 0.09 0.09 0.03 0.03
8 0.57 +++ 0.57 +++ 0.69 0.69 0.62 0.62
Indonesia Mathematical
Literacy 3 -0.12 -0.12 -0.41 -0.41 -0.41 -0.41
4 -0.12 -0.12 -0.42 -0.42 -0.41 -0.41
5 -0.25 -- -0.25 -- -0.46 -0.46 n/a n/a
6 -0.28 -- -0.31 -- -0.47 -0.52 -0.48 -0.53
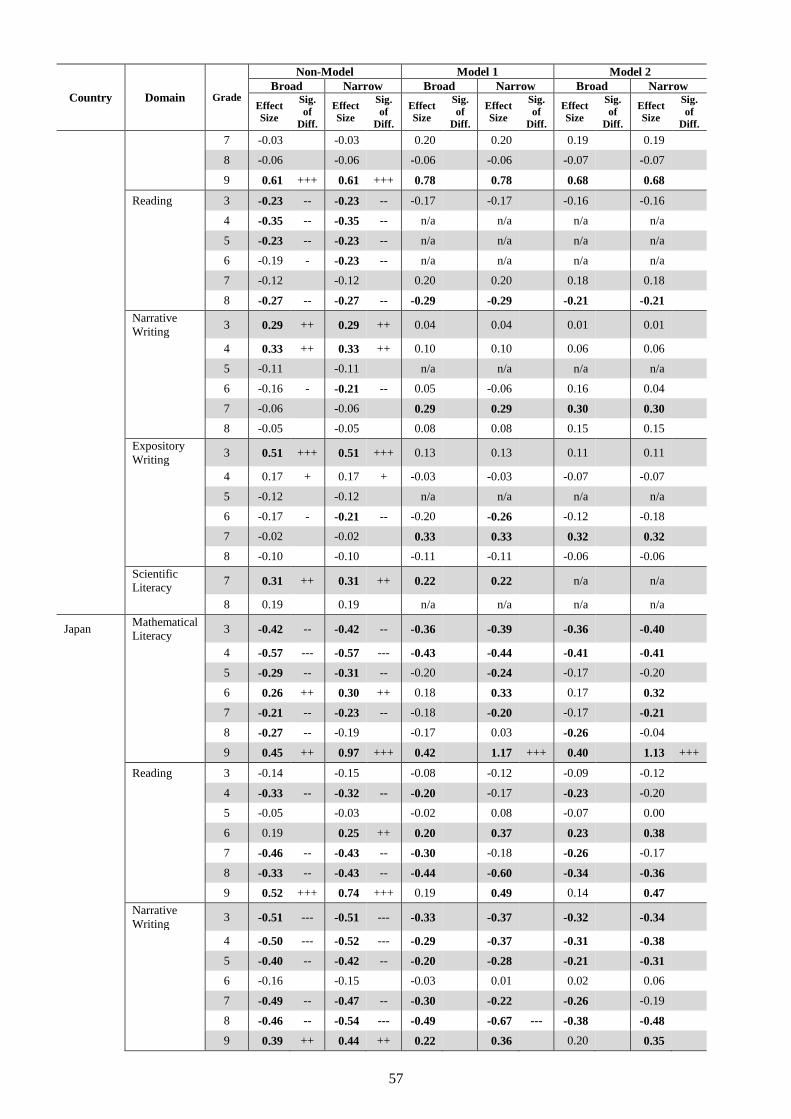
57
Country Domain Grade
Non-Model Model 1 Model 2
Broad Narrow Broad Narrow Broad Narrow
Effect
Size
Sig.
of
Diff.
Effect
Size
Sig.
of
Diff.
Effect
Size
Sig.
of
Diff.
Effect
Size
Sig.
of
Diff.
Effect
Size
Sig.
of
Diff.
Effect
Size
Sig.
of
Diff.
7 -0.03 -0.03 0.20 0.20 0.19 0.19
8 -0.06 -0.06 -0.06 -0.06 -0.07 -0.07
9 0.61 +++ 0.61 +++ 0.78 0.78 0.68 0.68
Reading 3 -0.23 -- -0.23 -- -0.17 -0.17 -0.16 -0.16
4 -0.35 -- -0.35 -- n/a n/a n/a n/a
5 -0.23 -- -0.23 -- n/a n/a n/a n/a
6 -0.19 - -0.23 -- n/a n/a n/a n/a
7 -0.12 -0.12 0.20 0.20 0.18 0.18
8 -0.27 -- -0.27 -- -0.29 -0.29 -0.21 -0.21
Narrative
Writing 3 0.29 ++ 0.29 ++ 0.04 0.04 0.01 0.01
4 0.33 ++ 0.33 ++ 0.10 0.10 0.06 0.06
5 -0.11 -0.11 n/a n/a n/a n/a
6 -0.16 - -0.21 -- 0.05 -0.06 0.16 0.04
7 -0.06 -0.06 0.29 0.29 0.30 0.30
8 -0.05 -0.05 0.08 0.08 0.15 0.15
Expository
Writing 3 0.51 +++ 0.51 +++ 0.13 0.13 0.11 0.11
4 0.17 + 0.17 + -0.03 -0.03 -0.07 -0.07
5 -0.12 -0.12 n/a n/a n/a n/a
6 -0.17 - -0.21 -- -0.20 -0.26 -0.12 -0.18
7 -0.02 -0.02 0.33 0.33 0.32 0.32
8 -0.10 -0.10 -0.11 -0.11 -0.06 -0.06
Scientific
Literacy 7 0.31 ++ 0.31 ++ 0.22 0.22 n/a n/a
8 0.19 0.19 n/a n/a n/a n/a
Japan Mathematical
Literacy 3 -0.42 -- -0.42 -- -0.36 -0.39 -0.36 -0.40
4 -0.57 --- -0.57 --- -0.43 -0.44 -0.41 -0.41
5 -0.29 -- -0.31 -- -0.20 -0.24 -0.17 -0.20
6 0.26 ++ 0.30 ++ 0.18 0.33 0.17 0.32
7 -0.21 -- -0.23 -- -0.18 -0.20 -0.17 -0.21
8 -0.27 -- -0.19 -0.17 0.03 -0.26 -0.04
9 0.45 ++ 0.97 +++ 0.42 1.17 +++ 0.40 1.13 +++
Reading 3 -0.14 -0.15 -0.08 -0.12 -0.09 -0.12
4 -0.33 -- -0.32 -- -0.20 -0.17 -0.23 -0.20
5 -0.05 -0.03 -0.02 0.08 -0.07 0.00
6 0.19 0.25 ++ 0.20 0.37 0.23 0.38
7 -0.46 -- -0.43 -- -0.30 -0.18 -0.26 -0.17
8 -0.33 -- -0.43 -- -0.44 -0.60 -0.34 -0.36
9 0.52 +++ 0.74 +++ 0.19 0.49 0.14 0.47
Narrative
Writing 3 -0.51 --- -0.51 --- -0.33 -0.37 -0.32 -0.34
4 -0.50 --- -0.52 --- -0.29 -0.37 -0.31 -0.38
5 -0.40 -- -0.42 -- -0.20 -0.28 -0.21 -0.31
6 -0.16 -0.15 -0.03 0.01 0.02 0.06
7 -0.49 -- -0.47 -- -0.30 -0.22 -0.26 -0.19
8 -0.46 -- -0.54 --- -0.49 -0.67 --- -0.38 -0.48
9 0.39 ++ 0.44 ++ 0.22 0.36 0.20 0.35
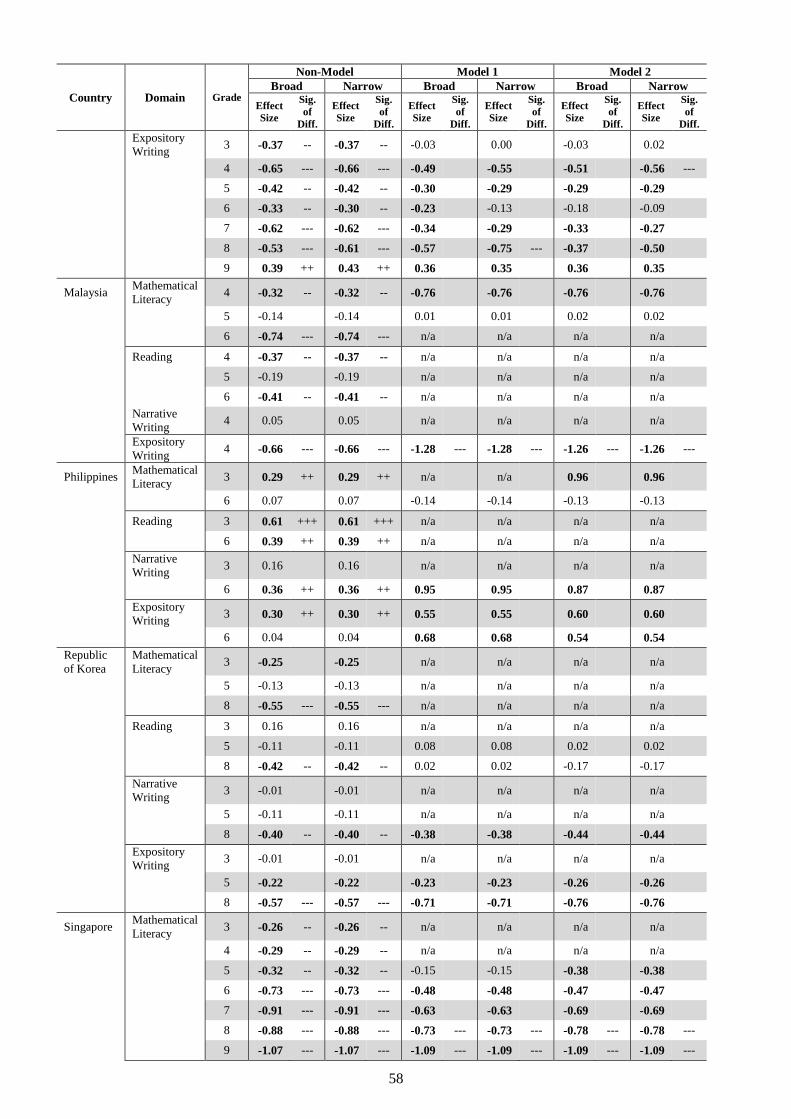
58
Country Domain Grade
Non-Model Model 1 Model 2
Broad Narrow Broad Narrow Broad Narrow
Effect
Size
Sig.
of
Diff.
Effect
Size
Sig.
of
Diff.
Effect
Size
Sig.
of
Diff.
Effect
Size
Sig.
of
Diff.
Effect
Size
Sig.
of
Diff.
Effect
Size
Sig.
of
Diff.
Expository
Writing 3 -0.37 -- -0.37 -- -0.03 0.00 -0.03 0.02
4 -0.65 --- -0.66 --- -0.49 -0.55 -0.51 -0.56 ---
5 -0.42 -- -0.42 -- -0.30 -0.29 -0.29 -0.29
6 -0.33 -- -0.30 -- -0.23 -0.13 -0.18 -0.09
7 -0.62 --- -0.62 --- -0.34 -0.29 -0.33 -0.27
8 -0.53 --- -0.61 --- -0.57 -0.75 --- -0.37 -0.50
9 0.39 ++ 0.43 ++ 0.36 0.35 0.36 0.35
Malaysia Mathematical
Literacy 4 -0.32 -- -0.32 -- -0.76 -0.76 -0.76 -0.76
5 -0.14 -0.14 0.01 0.01 0.02 0.02
6 -0.74 --- -0.74 --- n/a n/a n/a n/a
Reading 4 -0.37 -- -0.37 -- n/a n/a n/a n/a
5 -0.19 -0.19 n/a n/a n/a n/a
6 -0.41 -- -0.41 -- n/a n/a n/a n/a
Narrative
Writing 4 0.05 0.05 n/a n/a n/a n/a
Expository
Writing 4 -0.66 --- -0.66 --- -1.28 --- -1.28 --- -1.26 --- -1.26 ---
Philippines Mathematical
Literacy 3 0.29 ++ 0.29 ++ n/a n/a 0.96 0.96
6 0.07 0.07 -0.14 -0.14 -0.13 -0.13
Reading 3 0.61 +++ 0.61 +++ n/a n/a n/a n/a
6 0.39 ++ 0.39 ++ n/a n/a n/a n/a
Narrative
Writing 3 0.16 0.16 n/a n/a n/a n/a
6 0.36 ++ 0.36 ++ 0.95 0.95 0.87 0.87
Expository
Writing 3 0.30 ++ 0.30 ++ 0.55 0.55 0.60 0.60
6 0.04 0.04 0.68 0.68 0.54 0.54
Republic
of Korea
Mathematical
Literacy 3 -0.25 -0.25 n/a n/a n/a n/a
5 -0.13 -0.13 n/a n/a n/a n/a
8 -0.55 --- -0.55 --- n/a n/a n/a n/a
Reading 3 0.16 0.16 n/a n/a n/a n/a
5 -0.11 -0.11 0.08 0.08 0.02 0.02
8 -0.42 -- -0.42 -- 0.02 0.02 -0.17 -0.17
Narrative
Writing 3 -0.01 -0.01 n/a n/a n/a n/a
5 -0.11 -0.11 n/a n/a n/a n/a
8 -0.40 -- -0.40 -- -0.38 -0.38 -0.44 -0.44
Expository
Writing 3 -0.01 -0.01 n/a n/a n/a n/a
5 -0.22 -0.22 -0.23 -0.23 -0.26 -0.26
8 -0.57 --- -0.57 --- -0.71 -0.71 -0.76 -0.76
Singapore Mathematical
Literacy 3 -0.26 -- -0.26 -- n/a n/a n/a n/a
4 -0.29 -- -0.29 -- n/a n/a n/a n/a
5 -0.32 -- -0.32 -- -0.15 -0.15 -0.38 -0.38
6 -0.73 --- -0.73 --- -0.48 -0.48 -0.47 -0.47
7 -0.91 --- -0.91 --- -0.63 -0.63 -0.69 -0.69
8 -0.88 --- -0.88 --- -0.73 --- -0.73 --- -0.78 --- -0.78 ---
9 -1.07 --- -1.07 --- -1.09 --- -1.09 --- -1.09 --- -1.09 ---
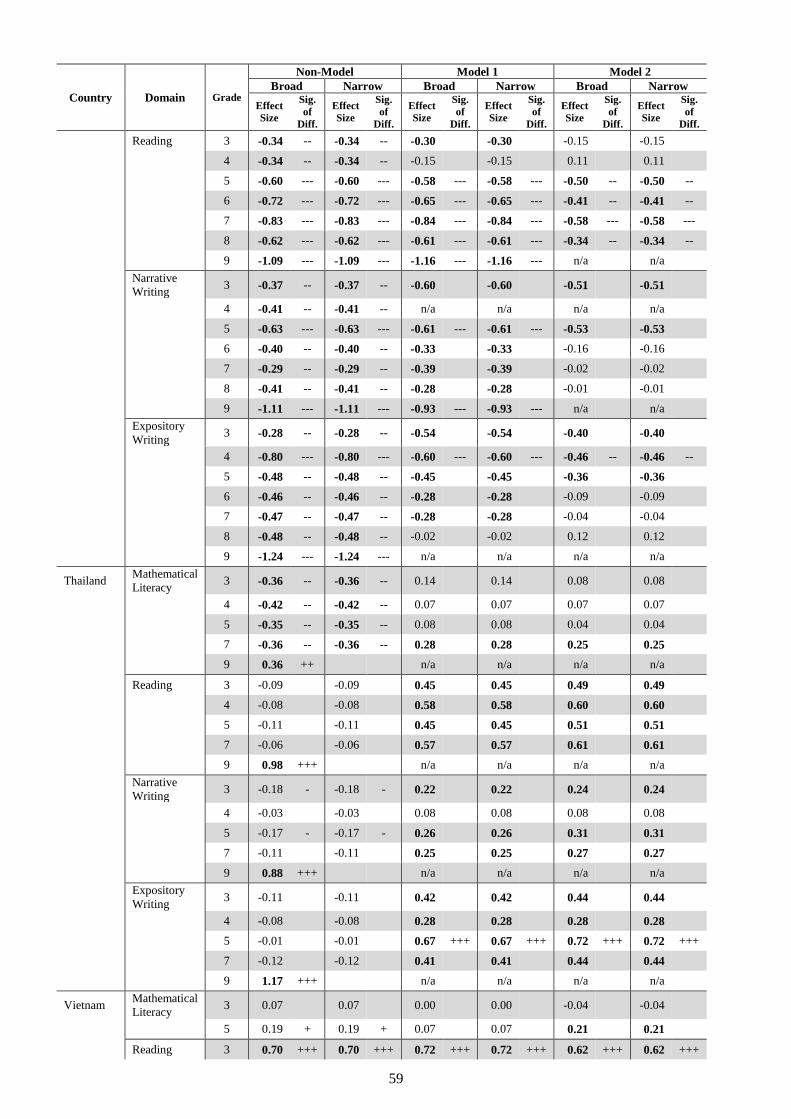
59
Country Domain Grade
Non-Model Model 1 Model 2
Broad Narrow Broad Narrow Broad Narrow
Effect
Size
Sig.
of
Diff.
Effect
Size
Sig.
of
Diff.
Effect
Size
Sig.
of
Diff.
Effect
Size
Sig.
of
Diff.
Effect
Size
Sig.
of
Diff.
Effect
Size
Sig.
of
Diff.
Reading 3 -0.34 -- -0.34 -- -0.30 -0.30 -0.15 -0.15
4 -0.34 -- -0.34 -- -0.15 -0.15 0.11 0.11
5 -0.60 --- -0.60 --- -0.58 --- -0.58 --- -0.50 -- -0.50 --
6 -0.72 --- -0.72 --- -0.65 --- -0.65 --- -0.41 -- -0.41 --
7 -0.83 --- -0.83 --- -0.84 --- -0.84 --- -0.58 --- -0.58 ---
8 -0.62 --- -0.62 --- -0.61 --- -0.61 --- -0.34 -- -0.34 --
9 -1.09 --- -1.09 --- -1.16 --- -1.16 --- n/a n/a
Narrative
Writing 3 -0.37 -- -0.37 -- -0.60 -0.60 -0.51 -0.51
4 -0.41 -- -0.41 -- n/a n/a n/a n/a
5 -0.63 --- -0.63 --- -0.61 --- -0.61 --- -0.53 -0.53
6 -0.40 -- -0.40 -- -0.33 -0.33 -0.16 -0.16
7 -0.29 -- -0.29 -- -0.39 -0.39 -0.02 -0.02
8 -0.41 -- -0.41 -- -0.28 -0.28 -0.01 -0.01
9 -1.11 --- -1.11 --- -0.93 --- -0.93 --- n/a n/a
Expository
Writing 3 -0.28 -- -0.28 -- -0.54 -0.54 -0.40 -0.40
4 -0.80 --- -0.80 --- -0.60 --- -0.60 --- -0.46 -- -0.46 --
5 -0.48 -- -0.48 -- -0.45 -0.45 -0.36 -0.36
6 -0.46 -- -0.46 -- -0.28 -0.28 -0.09 -0.09
7 -0.47 -- -0.47 -- -0.28 -0.28 -0.04 -0.04
8 -0.48 -- -0.48 -- -0.02 -0.02 0.12 0.12
9 -1.24 --- -1.24 --- n/a n/a n/a n/a
Thailand Mathematical
Literacy 3 -0.36 -- -0.36 -- 0.14 0.14 0.08 0.08
4 -0.42 -- -0.42 -- 0.07 0.07 0.07 0.07
5 -0.35 -- -0.35 -- 0.08 0.08 0.04 0.04
7 -0.36 -- -0.36 -- 0.28 0.28 0.25 0.25
9 0.36 ++ n/a n/a n/a n/a
Reading 3 -0.09 -0.09 0.45 0.45 0.49 0.49
4 -0.08 -0.08 0.58 0.58 0.60 0.60
5 -0.11 -0.11 0.45 0.45 0.51 0.51
7 -0.06 -0.06 0.57 0.57 0.61 0.61
9 0.98 +++ n/a n/a n/a n/a
Narrative
Writing 3 -0.18 - -0.18 - 0.22 0.22 0.24 0.24
4 -0.03 -0.03 0.08 0.08 0.08 0.08
5 -0.17 - -0.17 - 0.26 0.26 0.31 0.31
7 -0.11 -0.11 0.25 0.25 0.27 0.27
9 0.88 +++ n/a n/a n/a n/a
Expository
Writing 3 -0.11 -0.11 0.42 0.42 0.44 0.44
4 -0.08 -0.08 0.28 0.28 0.28 0.28
5 -0.01 -0.01 0.67 +++ 0.67 +++ 0.72 +++ 0.72 +++
7 -0.12 -0.12 0.41 0.41 0.44 0.44
9 1.17 +++ n/a n/a n/a n/a
Vietnam Mathematical
Literacy 3 0.07 0.07 0.00 0.00 -0.04 -0.04
5 0.19 + 0.19 + 0.07 0.07 0.21 0.21
Reading 3 0.70 +++ 0.70 +++ 0.72 +++ 0.72 +++ 0.62 +++ 0.62 +++
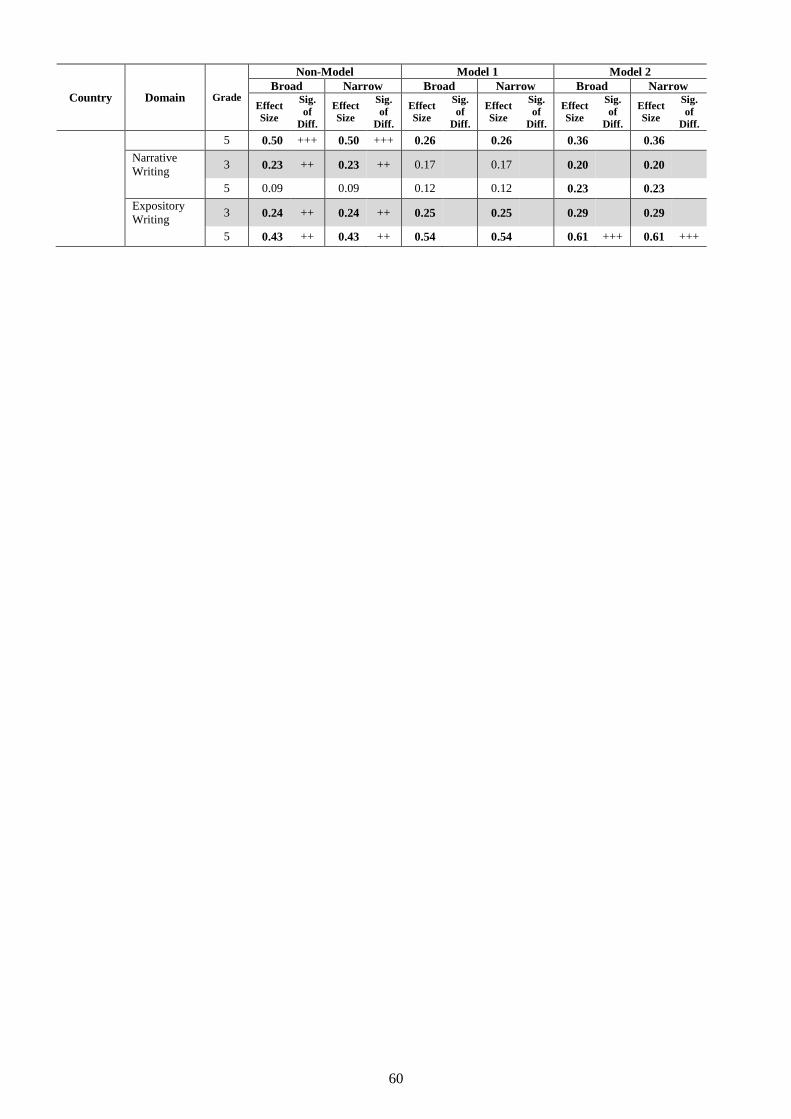
60
Country Domain Grade
Non-Model Model 1 Model 2
Broad Narrow Broad Narrow Broad Narrow
Effect
Size
Sig.
of
Diff.
Effect
Size
Sig.
of
Diff.
Effect
Size
Sig.
of
Diff.
Effect
Size
Sig.
of
Diff.
Effect
Size
Sig.
of
Diff.
Effect
Size
Sig.
of
Diff.
5 0.50 +++ 0.50 +++ 0.26 0.26 0.36 0.36
Narrative
Writing 3 0.23 ++ 0.23 ++ 0.17 0.17 0.20 0.20
5 0.09 0.09 0.12 0.12 0.23 0.23
Expository
Writing 3 0.24 ++ 0.24 ++ 0.25 0.25 0.29 0.29
5 0.43 ++ 0.43 ++ 0.54 0.54 0.61 +++ 0.61 +++
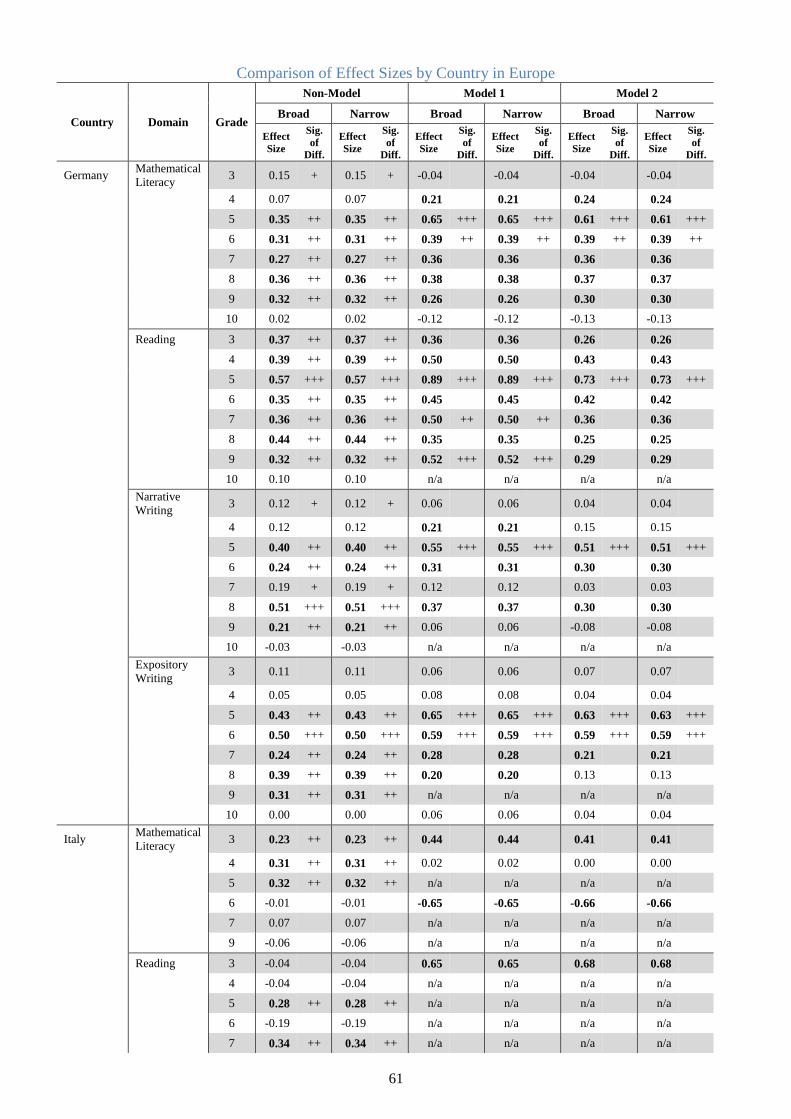
61
Comparison of Effect Sizes by Country in Europe
Country Domain Grade
Non-Model Model 1 Model 2
Broad Narrow Broad Narrow Broad Narrow
Effect
Size
Sig.
of
Diff.
Effect
Size
Sig.
of
Diff.
Effect
Size
Sig.
of
Diff.
Effect
Size
Sig.
of
Diff.
Effect
Size
Sig.
of
Diff.
Effect
Size
Sig.
of
Diff.
Germany Mathematical
Literacy 3 0.15 + 0.15 + -0.04 -0.04 -0.04 -0.04
4 0.07 0.07 0.21 0.21 0.24 0.24
5 0.35 ++ 0.35 ++ 0.65 +++ 0.65 +++ 0.61 +++ 0.61 +++
6 0.31 ++ 0.31 ++ 0.39 ++ 0.39 ++ 0.39 ++ 0.39 ++
7 0.27 ++ 0.27 ++ 0.36 0.36 0.36 0.36
8 0.36 ++ 0.36 ++ 0.38 0.38 0.37 0.37
9 0.32 ++ 0.32 ++ 0.26 0.26 0.30 0.30
10 0.02 0.02 -0.12 -0.12 -0.13 -0.13
Reading 3 0.37 ++ 0.37 ++ 0.36 0.36 0.26 0.26
4 0.39 ++ 0.39 ++ 0.50 0.50 0.43 0.43
5 0.57 +++ 0.57 +++ 0.89 +++ 0.89 +++ 0.73 +++ 0.73 +++
6 0.35 ++ 0.35 ++ 0.45 0.45 0.42 0.42
7 0.36 ++ 0.36 ++ 0.50 ++ 0.50 ++ 0.36 0.36
8 0.44 ++ 0.44 ++ 0.35 0.35 0.25 0.25
9 0.32 ++ 0.32 ++ 0.52 +++ 0.52 +++ 0.29 0.29
10 0.10 0.10 n/a n/a n/a n/a
Narrative
Writing 3 0.12 + 0.12 + 0.06 0.06 0.04 0.04
4 0.12 0.12 0.21 0.21 0.15 0.15
5 0.40 ++ 0.40 ++ 0.55 +++ 0.55 +++ 0.51 +++ 0.51 +++
6 0.24 ++ 0.24 ++ 0.31 0.31 0.30 0.30
7 0.19 + 0.19 + 0.12 0.12 0.03 0.03
8 0.51 +++ 0.51 +++ 0.37 0.37 0.30 0.30
9 0.21 ++ 0.21 ++ 0.06 0.06 -0.08 -0.08
10 -0.03 -0.03 n/a n/a n/a n/a
Expository
Writing 3 0.11 0.11 0.06 0.06 0.07 0.07
4 0.05 0.05 0.08 0.08 0.04 0.04
5 0.43 ++ 0.43 ++ 0.65 +++ 0.65 +++ 0.63 +++ 0.63 +++
6 0.50 +++ 0.50 +++ 0.59 +++ 0.59 +++ 0.59 +++ 0.59 +++
7 0.24 ++ 0.24 ++ 0.28 0.28 0.21 0.21
8 0.39 ++ 0.39 ++ 0.20 0.20 0.13 0.13
9 0.31 ++ 0.31 ++ n/a n/a n/a n/a
10 0.00 0.00 0.06 0.06 0.04 0.04
Italy Mathematical
Literacy 3 0.23 ++ 0.23 ++ 0.44 0.44 0.41 0.41
4 0.31 ++ 0.31 ++ 0.02 0.02 0.00 0.00
5 0.32 ++ 0.32 ++ n/a n/a n/a n/a
6 -0.01 -0.01 -0.65 -0.65 -0.66 -0.66
7 0.07 0.07 n/a n/a n/a n/a
9 -0.06 -0.06 n/a n/a n/a n/a
Reading 3 -0.04 -0.04 0.65 0.65 0.68 0.68
4 -0.04 -0.04 n/a n/a n/a n/a
5 0.28 ++ 0.28 ++ n/a n/a n/a n/a
6 -0.19 -0.19 n/a n/a n/a n/a
7 0.34 ++ 0.34 ++ n/a n/a n/a n/a
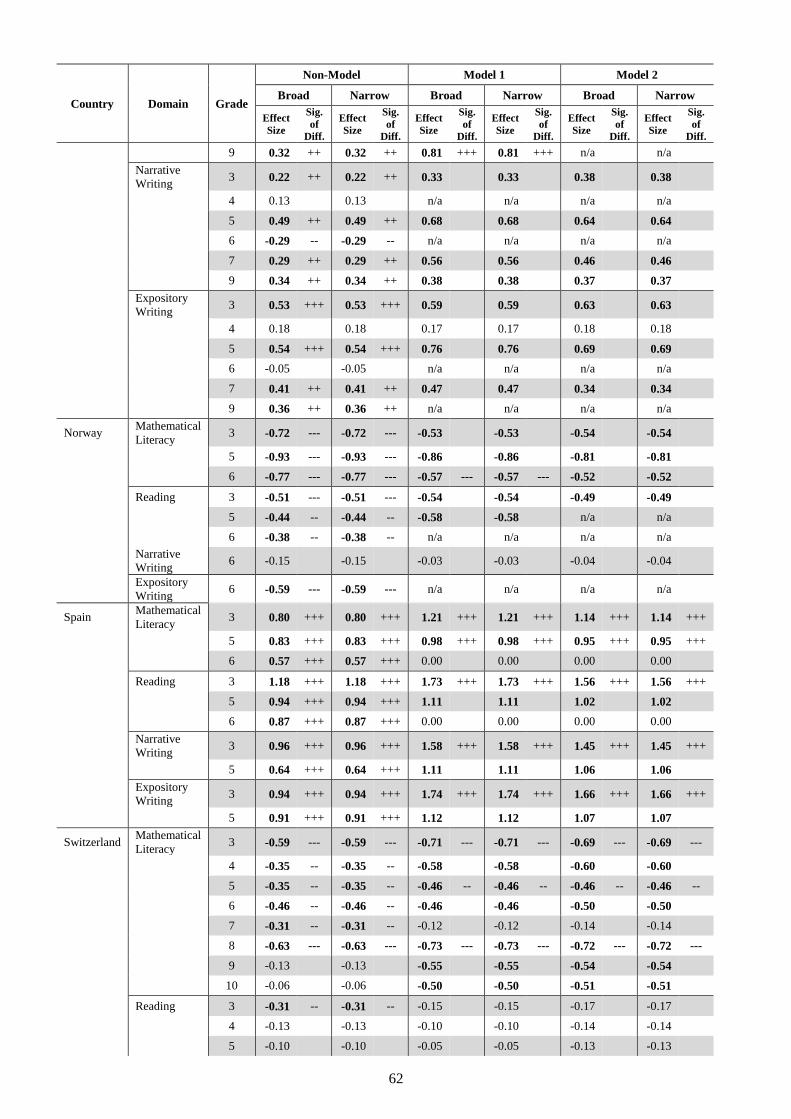
62
Country Domain Grade
Non-Model Model 1 Model 2
Broad Narrow Broad Narrow Broad Narrow
Effect
Size
Sig.
of
Diff.
Effect
Size
Sig.
of
Diff.
Effect
Size
Sig.
of
Diff.
Effect
Size
Sig.
of
Diff.
Effect
Size
Sig.
of
Diff.
Effect
Size
Sig.
of
Diff.
9 0.32 ++ 0.32 ++ 0.81 +++ 0.81 +++ n/a n/a
Narrative
Writing 3 0.22 ++ 0.22 ++ 0.33 0.33 0.38 0.38
4 0.13 0.13 n/a n/a n/a n/a
5 0.49 ++ 0.49 ++ 0.68 0.68 0.64 0.64
6 -0.29 -- -0.29 -- n/a n/a n/a n/a
7 0.29 ++ 0.29 ++ 0.56 0.56 0.46 0.46
9 0.34 ++ 0.34 ++ 0.38 0.38 0.37 0.37
Expository
Writing 3 0.53 +++ 0.53 +++ 0.59 0.59 0.63 0.63
4 0.18 0.18 0.17 0.17 0.18 0.18
5 0.54 +++ 0.54 +++ 0.76 0.76 0.69 0.69
6 -0.05 -0.05 n/a n/a n/a n/a
7 0.41 ++ 0.41 ++ 0.47 0.47 0.34 0.34
9 0.36 ++ 0.36 ++ n/a n/a n/a n/a
Norway Mathematical
Literacy 3 -0.72 --- -0.72 --- -0.53 -0.53 -0.54 -0.54
5 -0.93 --- -0.93 --- -0.86 -0.86 -0.81 -0.81
6 -0.77 --- -0.77 --- -0.57 --- -0.57 --- -0.52 -0.52
Reading 3 -0.51 --- -0.51 --- -0.54 -0.54 -0.49 -0.49
5 -0.44 -- -0.44 -- -0.58 -0.58 n/a n/a
6 -0.38 -- -0.38 -- n/a n/a n/a n/a
Narrative
Writing 6 -0.15 -0.15 -0.03 -0.03 -0.04 -0.04
Expository
Writing 6 -0.59 --- -0.59 --- n/a n/a n/a n/a
Spain Mathematical
Literacy 3 0.80 +++ 0.80 +++ 1.21 +++ 1.21 +++ 1.14 +++ 1.14 +++
5 0.83 +++ 0.83 +++ 0.98 +++ 0.98 +++ 0.95 +++ 0.95 +++
6 0.57 +++ 0.57 +++ 0.00 0.00 0.00 0.00
Reading 3 1.18 +++ 1.18 +++ 1.73 +++ 1.73 +++ 1.56 +++ 1.56 +++
5 0.94 +++ 0.94 +++ 1.11 1.11 1.02 1.02
6 0.87 +++ 0.87 +++ 0.00 0.00 0.00 0.00
Narrative
Writing 3 0.96 +++ 0.96 +++ 1.58 +++ 1.58 +++ 1.45 +++ 1.45 +++
5 0.64 +++ 0.64 +++ 1.11 1.11 1.06 1.06
Expository
Writing 3 0.94 +++ 0.94 +++ 1.74 +++ 1.74 +++ 1.66 +++ 1.66 +++
5 0.91 +++ 0.91 +++ 1.12 1.12 1.07 1.07
Switzerland Mathematical
Literacy 3 -0.59 --- -0.59 --- -0.71 --- -0.71 --- -0.69 --- -0.69 ---
4 -0.35 -- -0.35 -- -0.58 -0.58 -0.60 -0.60
5 -0.35 -- -0.35 -- -0.46 -- -0.46 -- -0.46 -- -0.46 --
6 -0.46 -- -0.46 -- -0.46 -0.46 -0.50 -0.50
7 -0.31 -- -0.31 -- -0.12 -0.12 -0.14 -0.14
8 -0.63 --- -0.63 --- -0.73 --- -0.73 --- -0.72 --- -0.72 ---
9 -0.13 -0.13 -0.55 -0.55 -0.54 -0.54
10 -0.06 -0.06 -0.50 -0.50 -0.51 -0.51
Reading 3 -0.31 -- -0.31 -- -0.15 -0.15 -0.17 -0.17
4 -0.13 -0.13 -0.10 -0.10 -0.14 -0.14
5 -0.10 -0.10 -0.05 -0.05 -0.13 -0.13
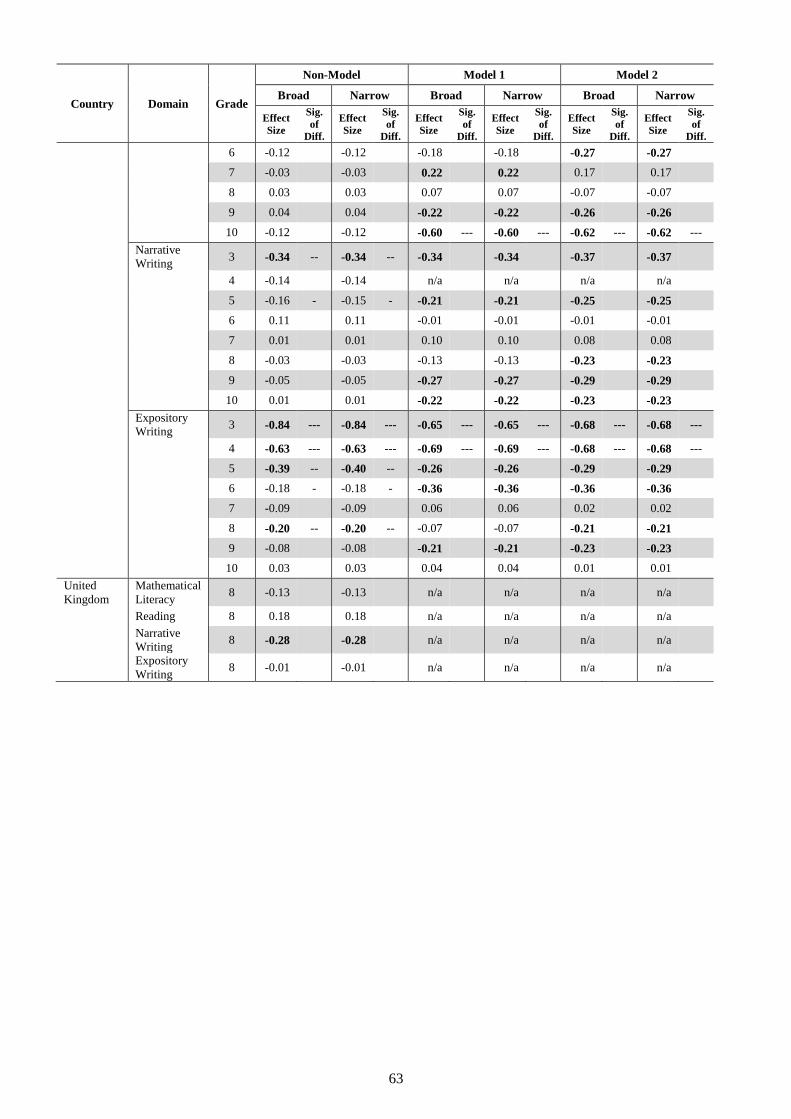
63
Country Domain Grade
Non-Model Model 1 Model 2
Broad Narrow Broad Narrow Broad Narrow
Effect
Size
Sig.
of
Diff.
Effect
Size
Sig.
of
Diff.
Effect
Size
Sig.
of
Diff.
Effect
Size
Sig.
of
Diff.
Effect
Size
Sig.
of
Diff.
Effect
Size
Sig.
of
Diff.
6 -0.12 -0.12 -0.18 -0.18 -0.27 -0.27
7 -0.03 -0.03 0.22 0.22 0.17 0.17
8 0.03 0.03 0.07 0.07 -0.07 -0.07
9 0.04 0.04 -0.22 -0.22 -0.26 -0.26
10 -0.12 -0.12 -0.60 --- -0.60 --- -0.62 --- -0.62 ---
Narrative
Writing 3 -0.34 -- -0.34 -- -0.34 -0.34 -0.37 -0.37
4 -0.14 -0.14 n/a n/a n/a n/a
5 -0.16 - -0.15 - -0.21 -0.21 -0.25 -0.25
6 0.11 0.11 -0.01 -0.01 -0.01 -0.01
7 0.01 0.01 0.10 0.10 0.08 0.08
8 -0.03 -0.03 -0.13 -0.13 -0.23 -0.23
9 -0.05 -0.05 -0.27 -0.27 -0.29 -0.29
10 0.01 0.01 -0.22 -0.22 -0.23 -0.23
Expository
Writing 3 -0.84 --- -0.84 --- -0.65 --- -0.65 --- -0.68 --- -0.68 ---
4 -0.63 --- -0.63 --- -0.69 --- -0.69 --- -0.68 --- -0.68 ---
5 -0.39 -- -0.40 -- -0.26 -0.26 -0.29 -0.29
6 -0.18 - -0.18 - -0.36 -0.36 -0.36 -0.36
7 -0.09 -0.09 0.06 0.06 0.02 0.02
8 -0.20 -- -0.20 -- -0.07 -0.07 -0.21 -0.21
9 -0.08 -0.08 -0.21 -0.21 -0.23 -0.23
10 0.03 0.03 0.04 0.04 0.01 0.01
United
Kingdom
Mathematical
Literacy 8 -0.13 -0.13 n/a n/a n/a n/a
Reading 8 0.18 0.18 n/a n/a n/a n/a
Narrative
Writing 8 -0.28 -0.28 n/a n/a n/a n/a
Expository
Writing 8 -0.01 -0.01 n/a n/a n/a n/a
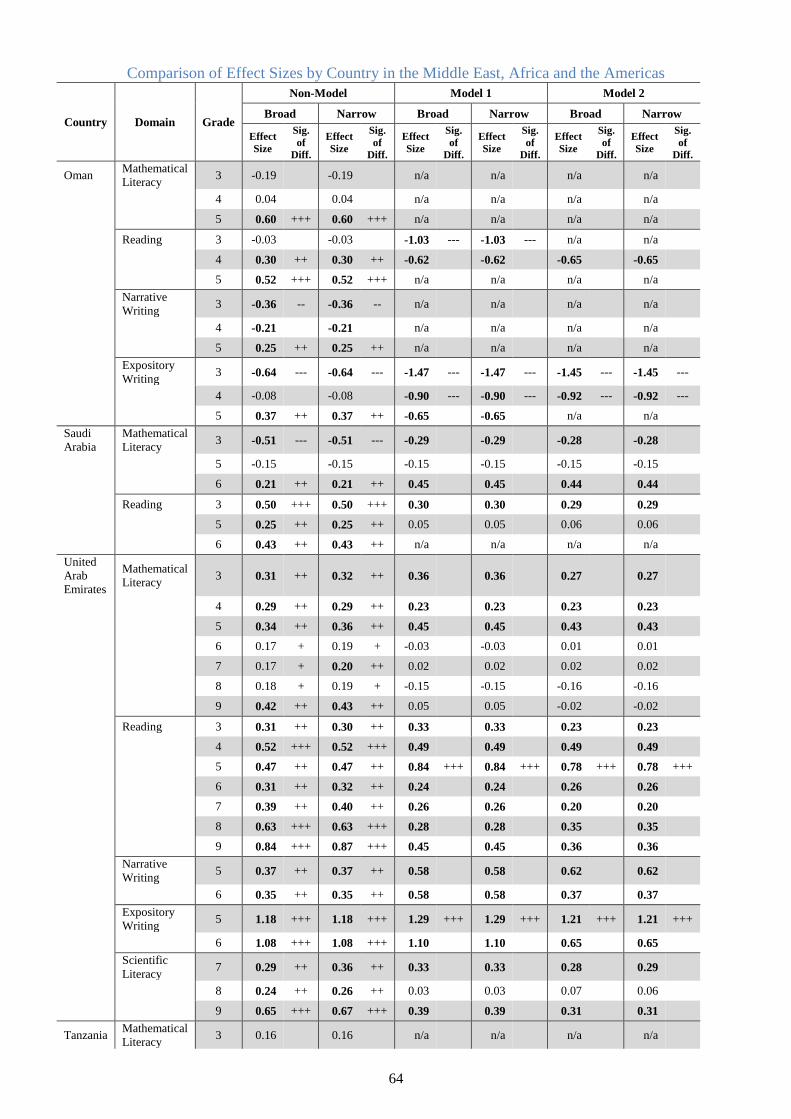
64
Comparison of Effect Sizes by Country in the Middle East, Africa and the Americas
Country Domain Grade
Non-Model Model 1 Model 2
Broad Narrow Broad Narrow Broad Narrow
Effect
Size
Sig.
of
Diff.
Effect
Size
Sig.
of
Diff.
Effect
Size
Sig.
of
Diff.
Effect
Size
Sig.
of
Diff.
Effect
Size
Sig.
of
Diff.
Effect
Size
Sig.
of
Diff.
Oman Mathematical
Literacy 3 -0.19 -0.19 n/a n/a n/a n/a
4 0.04 0.04 n/a n/a n/a n/a
5 0.60 +++ 0.60 +++ n/a n/a n/a n/a
Reading 3 -0.03 -0.03 -1.03 --- -1.03 --- n/a n/a
4 0.30 ++ 0.30 ++ -0.62 -0.62 -0.65 -0.65
5 0.52 +++ 0.52 +++ n/a n/a n/a n/a
Narrative
Writing 3 -0.36 -- -0.36 -- n/a n/a n/a n/a
4 -0.21 -0.21 n/a n/a n/a n/a
5 0.25 ++ 0.25 ++ n/a n/a n/a n/a
Expository
Writing 3 -0.64 --- -0.64 --- -1.47 --- -1.47 --- -1.45 --- -1.45 ---
4 -0.08 -0.08 -0.90 --- -0.90 --- -0.92 --- -0.92 ---
5 0.37 ++ 0.37 ++ -0.65 -0.65 n/a n/a
Saudi
Arabia
Mathematical
Literacy 3 -0.51 --- -0.51 --- -0.29 -0.29 -0.28 -0.28
5 -0.15 -0.15 -0.15 -0.15 -0.15 -0.15
6 0.21 ++ 0.21 ++ 0.45 0.45 0.44 0.44
Reading 3 0.50 +++ 0.50 +++ 0.30 0.30 0.29 0.29
5 0.25 ++ 0.25 ++ 0.05 0.05 0.06 0.06
6 0.43 ++ 0.43 ++ n/a n/a n/a n/a
United
Arab
Emirates
Mathematical
Literacy 3 0.31 ++ 0.32 ++ 0.36 0.36 0.27 0.27
4 0.29 ++ 0.29 ++ 0.23 0.23 0.23 0.23
5 0.34 ++ 0.36 ++ 0.45 0.45 0.43 0.43
6 0.17 + 0.19 + -0.03 -0.03 0.01 0.01
7 0.17 + 0.20 ++ 0.02 0.02 0.02 0.02
8 0.18 + 0.19 + -0.15 -0.15 -0.16 -0.16
9 0.42 ++ 0.43 ++ 0.05 0.05 -0.02 -0.02
Reading 3 0.31 ++ 0.30 ++ 0.33 0.33 0.23 0.23
4 0.52 +++ 0.52 +++ 0.49 0.49 0.49 0.49
5 0.47 ++ 0.47 ++ 0.84 +++ 0.84 +++ 0.78 +++ 0.78 +++
6 0.31 ++ 0.32 ++ 0.24 0.24 0.26 0.26
7 0.39 ++ 0.40 ++ 0.26 0.26 0.20 0.20
8 0.63 +++ 0.63 +++ 0.28 0.28 0.35 0.35
9 0.84 +++ 0.87 +++ 0.45 0.45 0.36 0.36
Narrative
Writing 5 0.37 ++ 0.37 ++ 0.58 0.58 0.62 0.62
6 0.35 ++ 0.35 ++ 0.58 0.58 0.37 0.37
Expository
Writing 5 1.18 +++ 1.18 +++ 1.29 +++ 1.29 +++ 1.21 +++ 1.21 +++
6 1.08 +++ 1.08 +++ 1.10 1.10 0.65 0.65
Scientific
Literacy 7 0.29 ++ 0.36 ++ 0.33 0.33 0.28 0.29
8 0.24 ++ 0.26 ++ 0.03 0.03 0.07 0.06
9 0.65 +++ 0.67 +++ 0.39 0.39 0.31 0.31
Tanzania Mathematical
Literacy 3 0.16 0.16 n/a n/a n/a n/a
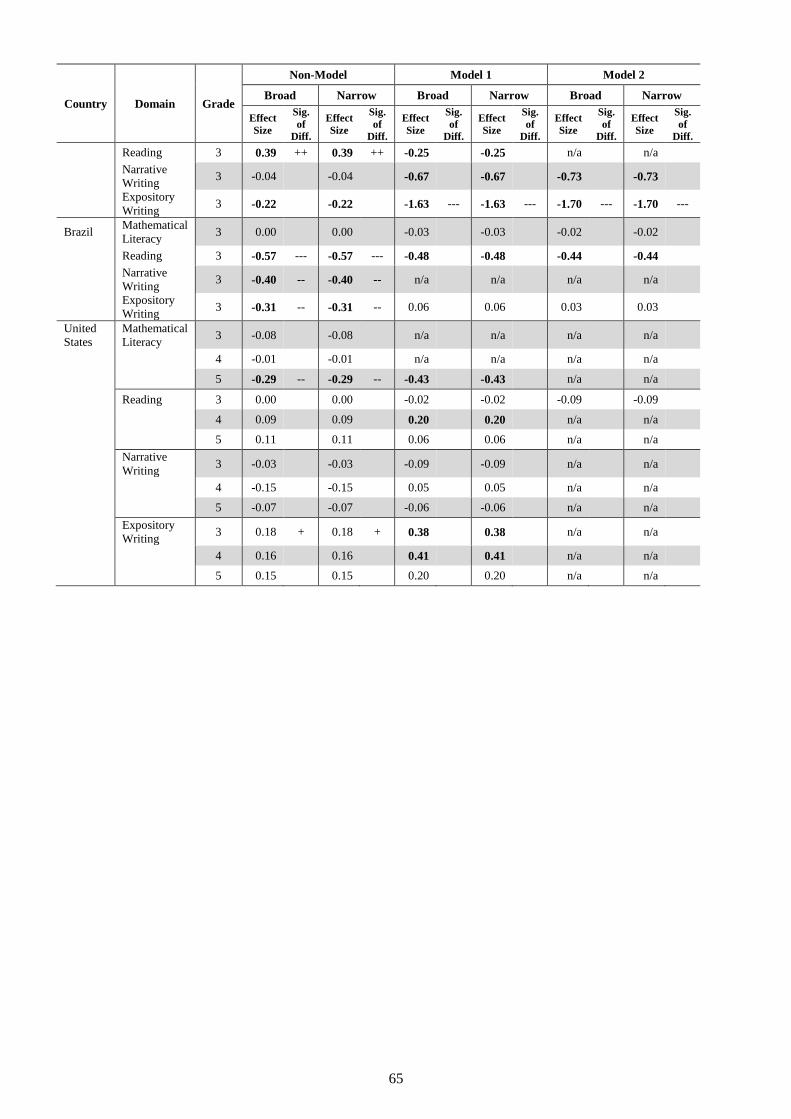
65
Country Domain Grade
Non-Model Model 1 Model 2
Broad Narrow Broad Narrow Broad Narrow
Effect
Size
Sig.
of
Diff.
Effect
Size
Sig.
of
Diff.
Effect
Size
Sig.
of
Diff.
Effect
Size
Sig.
of
Diff.
Effect
Size
Sig.
of
Diff.
Effect
Size
Sig.
of
Diff.
Reading 3 0.39 ++ 0.39 ++ -0.25 -0.25 n/a n/a
Narrative
Writing 3 -0.04 -0.04 -0.67 -0.67 -0.73 -0.73
Expository
Writing 3 -0.22 -0.22 -1.63 --- -1.63 --- -1.70 --- -1.70 ---
Brazil Mathematical
Literacy 3 0.00 0.00 -0.03 -0.03 -0.02 -0.02
Reading 3 -0.57 --- -0.57 --- -0.48 -0.48 -0.44 -0.44
Narrative
Writing 3 -0.40 -- -0.40 -- n/a n/a n/a n/a
Expository
Writing 3 -0.31 -- -0.31 -- 0.06 0.06 0.03 0.03
United
States
Mathematical
Literacy 3 -0.08 -0.08 n/a n/a n/a n/a
4 -0.01 -0.01 n/a n/a n/a n/a
5 -0.29 -- -0.29 -- -0.43 -0.43 n/a n/a
Reading 3 0.00 0.00 -0.02 -0.02 -0.09 -0.09
4 0.09 0.09 0.20 0.20 n/a n/a
5 0.11 0.11 0.06 0.06 n/a n/a
Narrative
Writing 3 -0.03 -0.03 -0.09 -0.09 n/a n/a
4 -0.15 -0.15 0.05 0.05 n/a n/a
5 -0.07 -0.07 -0.06 -0.06 n/a n/a
Expository
Writing 3 0.18 + 0.18 + 0.38 0.38 n/a n/a
4 0.16 0.16 0.41 0.41 n/a n/a
5 0.15 0.15 0.20 0.20 n/a n/a
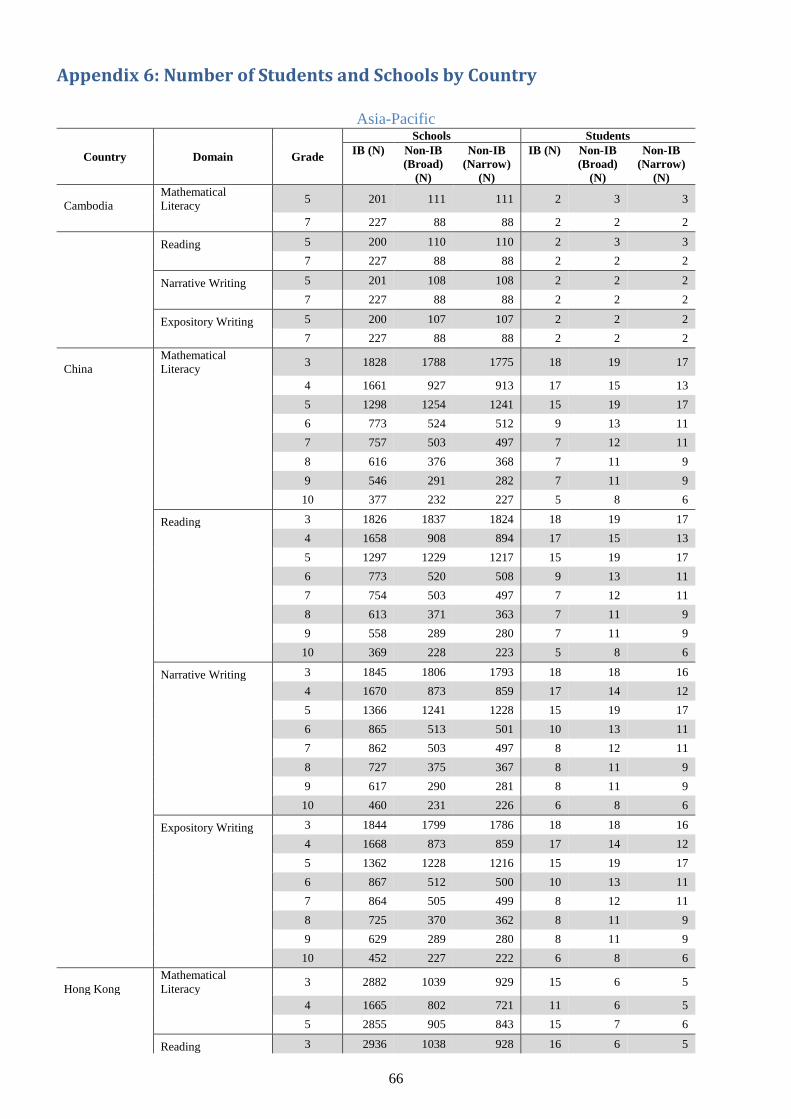
66
Appendix 6: Number of Students and Schools by Country
Asia-Pacific
Country Domain Grade
Schools Students
IB (N) Non-IB
(Broad)
(N)
Non-IB
(Narrow)
(N)
IB (N) Non-IB
(Broad)
(N)
Non-IB
(Narrow)
(N)
Cambodia
Mathematical
Literacy 5 201 111 111 2 3 3
7 227 88 88 2 2 2
Reading 5 200 110 110 2 3 3
7 227 88 88 2 2 2
Narrative Writing 5 201 108 108 2 2 2
7 227 88 88 2 2 2
Expository Writing 5 200 107 107 2 2 2
7 227 88 88 2 2 2
China
Mathematical
Literacy 3 1828 1788 1775 18 19 17
4 1661 927 913 17 15 13
5 1298 1254 1241 15 19 17
6 773 524 512 9 13 11
7 757 503 497 7 12 11
8 616 376 368 7 11 9
9 546 291 282 7 11 9
10 377 232 227 5 8 6
Reading 3 1826 1837 1824 18 19 17
4 1658 908 894 17 15 13
5 1297 1229 1217 15 19 17
6 773 520 508 9 13 11
7 754 503 497 7 12 11
8 613 371 363 7 11 9
9 558 289 280 7 11 9
10 369 228 223 5 8 6
Narrative Writing 3 1845 1806 1793 18 18 16
4 1670 873 859 17 14 12
5 1366 1241 1228 15 19 17
6 865 513 501 10 13 11
7 862 503 497 8 12 11
8 727 375 367 8 11 9
9 617 290 281 8 11 9
10 460 231 226 6 8 6
Expository Writing 3 1844 1799 1786 18 18 16
4 1668 873 859 17 14 12
5 1362 1228 1216 15 19 17
6 867 512 500 10 13 11
7 864 505 499 8 12 11
8 725 370 362 8 11 9
9 629 289 280 8 11 9
10 452 227 222 6 8 6
Hong Kong
Mathematical
Literacy 3 2882 1039 929 15 6 5
4 1665 802 721 11 6 5
5 2855 905 843 15 7 6
Reading 3 2936 1038 928 16 6 5
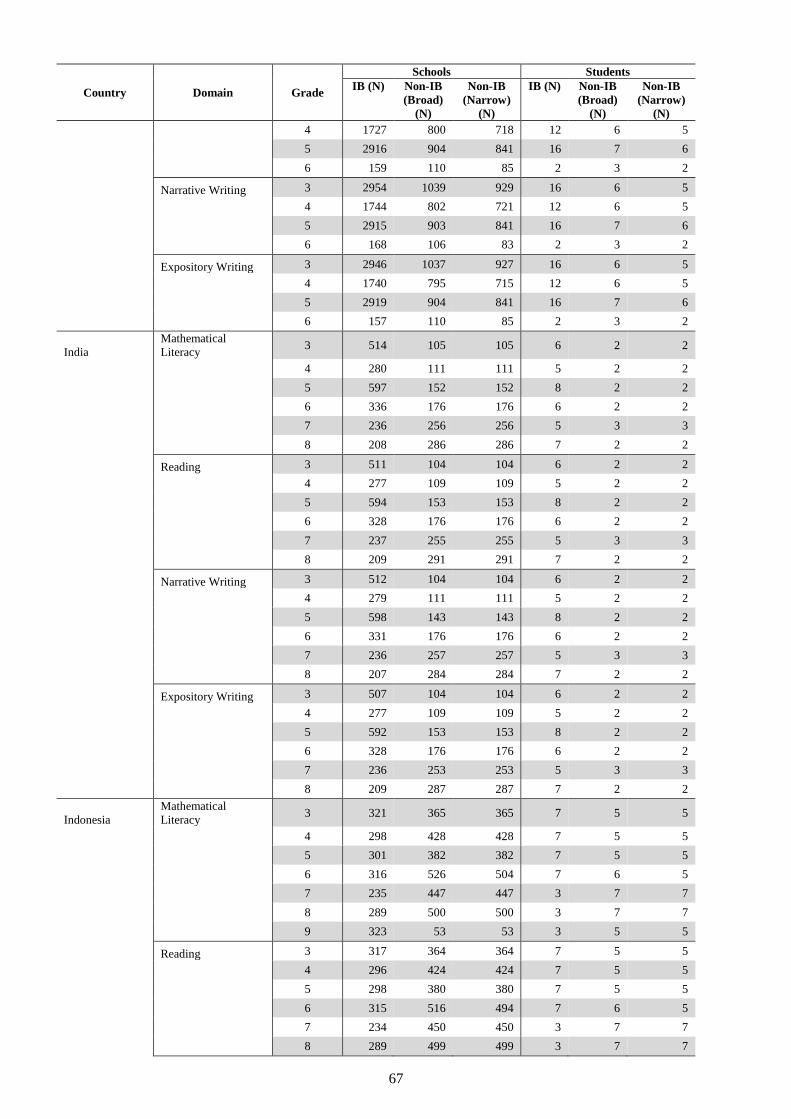
67
Country Domain Grade
Schools Students
IB (N) Non-IB
(Broad)
(N)
Non-IB
(Narrow)
(N)
IB (N) Non-IB
(Broad)
(N)
Non-IB
(Narrow)
(N)
4 1727 800 718 12 6 5
5 2916 904 841 16 7 6
6 159 110 85 2 3 2
Narrative Writing 3 2954 1039 929 16 6 5
4 1744 802 721 12 6 5
5 2915 903 841 16 7 6
6 168 106 83 2 3 2
Expository Writing 3 2946 1037 927 16 6 5
4 1740 795 715 12 6 5
5 2919 904 841 16 7 6
6 157 110 85 2 3 2
India
Mathematical
Literacy 3 514 105 105 6 2 2
4 280 111 111 5 2 2
5 597 152 152 8 2 2
6 336 176 176 6 2 2
7 236 256 256 5 3 3
8 208 286 286 7 2 2
Reading 3 511 104 104 6 2 2
4 277 109 109 5 2 2
5 594 153 153 8 2 2
6 328 176 176 6 2 2
7 237 255 255 5 3 3
8 209 291 291 7 2 2
Narrative Writing 3 512 104 104 6 2 2
4 279 111 111 5 2 2
5 598 143 143 8 2 2
6 331 176 176 6 2 2
7 236 257 257 5 3 3
8 207 284 284 7 2 2
Expository Writing 3 507 104 104 6 2 2
4 277 109 109 5 2 2
5 592 153 153 8 2 2
6 328 176 176 6 2 2
7 236 253 253 5 3 3
8 209 287 287 7 2 2
Indonesia
Mathematical
Literacy 3 321 365 365 7 5 5
4 298 428 428 7 5 5
5 301 382 382 7 5 5
6 316 526 504 7 6 5
7 235 447 447 3 7 7
8 289 500 500 3 7 7
9 323 53 53 3 5 5
Reading 3 317 364 364 7 5 5
4 296 424 424 7 5 5
5 298 380 380 7 5 5
6 315 516 494 7 6 5
7 234 450 450 3 7 7
8 289 499 499 3 7 7
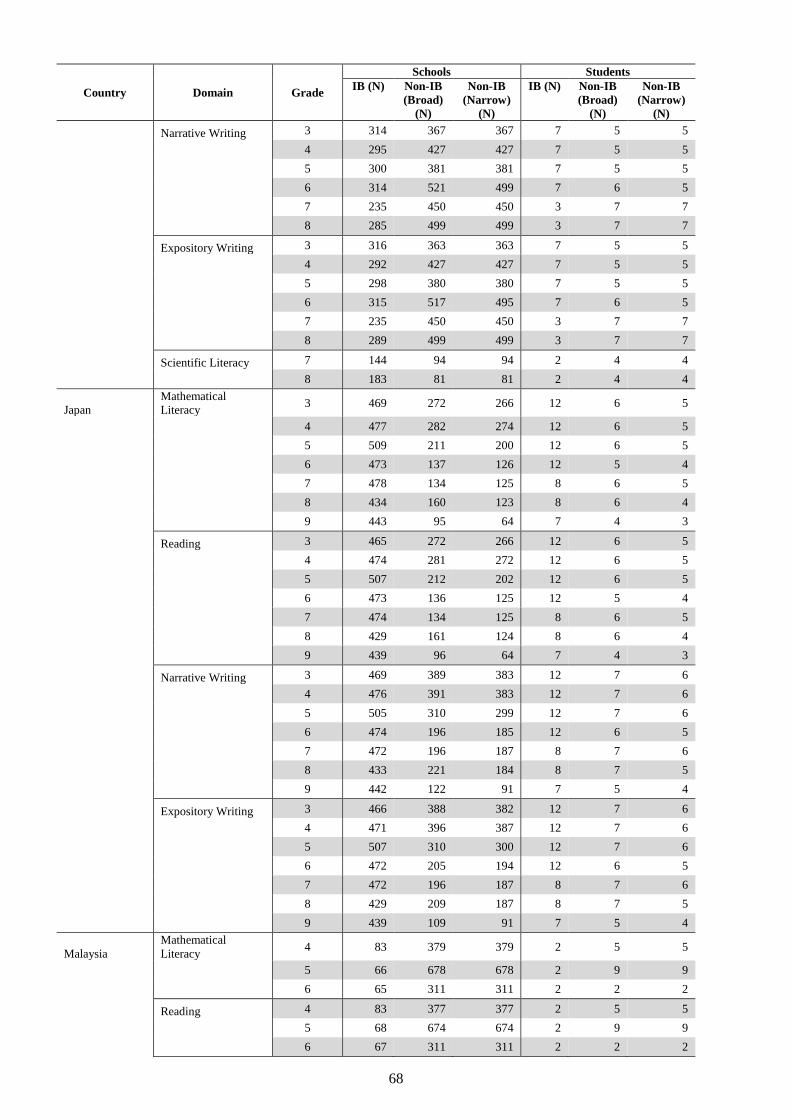
68
Country Domain Grade
Schools Students
IB (N) Non-IB
(Broad)
(N)
Non-IB
(Narrow)
(N)
IB (N) Non-IB
(Broad)
(N)
Non-IB
(Narrow)
(N)
Narrative Writing 3 314 367 367 7 5 5
4 295 427 427 7 5 5
5 300 381 381 7 5 5
6 314 521 499 7 6 5
7 235 450 450 3 7 7
8 285 499 499 3 7 7
Expository Writing 3 316 363 363 7 5 5
4 292 427 427 7 5 5
5 298 380 380 7 5 5
6 315 517 495 7 6 5
7 235 450 450 3 7 7
8 289 499 499 3 7 7
Scientific Literacy 7 144 94 94 2 4 4
8 183 81 81 2 4 4
Japan
Mathematical
Literacy 3 469 272 266 12 6 5
4 477 282 274 12 6 5
5 509 211 200 12 6 5
6 473 137 126 12 5 4
7 478 134 125 8 6 5
8 434 160 123 8 6 4
9 443 95 64 7 4 3
Reading 3 465 272 266 12 6 5
4 474 281 272 12 6 5
5 507 212 202 12 6 5
6 473 136 125 12 5 4
7 474 134 125 8 6 5
8 429 161 124 8 6 4
9 439 96 64 7 4 3
Narrative Writing 3 469 389 383 12 7 6
4 476 391 383 12 7 6
5 505 310 299 12 7 6
6 474 196 185 12 6 5
7 472 196 187 8 7 6
8 433 221 184 8 7 5
9 442 122 91 7 5 4
Expository Writing 3 466 388 382 12 7 6
4 471 396 387 12 7 6
5 507 310 300 12 7 6
6 472 205 194 12 6 5
7 472 196 187 8 7 6
8 429 209 187 8 7 5
9 439 109 91 7 5 4
Malaysia
Mathematical
Literacy 4 83 379 379 2 5 5
5 66 678 678 2 9 9
6 65 311 311 2 2 2
Reading 4 83 377 377 2 5 5
5 68 674 674 2 9 9
6 67 311 311 2 2 2
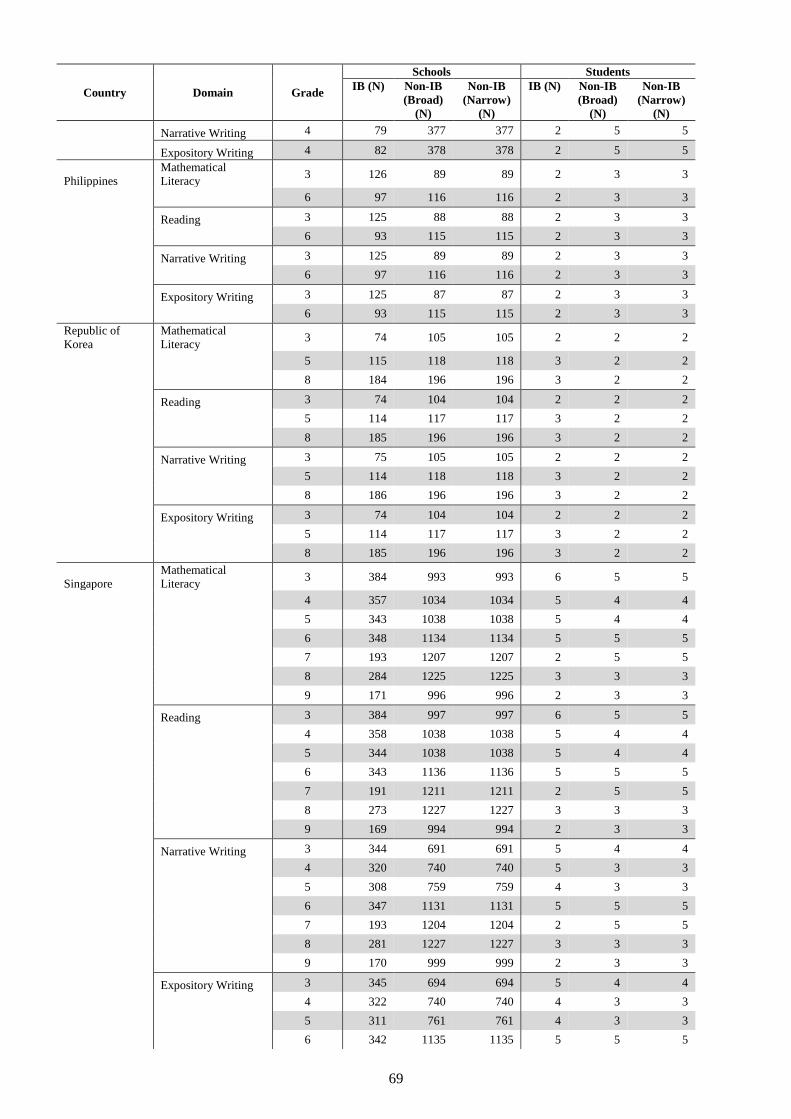
69
Country Domain Grade
Schools Students
IB (N) Non-IB
(Broad)
(N)
Non-IB
(Narrow)
(N)
IB (N) Non-IB
(Broad)
(N)
Non-IB
(Narrow)
(N)
Narrative Writing 4 79 377 377 2 5 5
Expository Writing 4 82 378 378 2 5 5
Philippines
Mathematical
Literacy 3 126 89 89 2 3 3
6 97 116 116 2 3 3
Reading 3 125 88 88 2 3 3
6 93 115 115 2 3 3
Narrative Writing 3 125 89 89 2 3 3
6 97 116 116 2 3 3
Expository Writing 3 125 87 87 2 3 3
6 93 115 115 2 3 3
Republic of
Korea
Mathematical
Literacy 3 74 105 105 2 2 2
5 115 118 118 3 2 2
8 184 196 196 3 2 2
Reading 3 74 104 104 2 2 2
5 114 117 117 3 2 2
8 185 196 196 3 2 2
Narrative Writing 3 75 105 105 2 2 2
5 114 118 118 3 2 2
8 186 196 196 3 2 2
Expository Writing 3 74 104 104 2 2 2
5 114 117 117 3 2 2
8 185 196 196 3 2 2
Singapore
Mathematical
Literacy 3 384 993 993 6 5 5
4 357 1034 1034 5 4 4
5 343 1038 1038 5 4 4
6 348 1134 1134 5 5 5
7 193 1207 1207 2 5 5
8 284 1225 1225 3 3 3
9 171 996 996 2 3 3
Reading 3 384 997 997 6 5 5
4 358 1038 1038 5 4 4
5 344 1038 1038 5 4 4
6 343 1136 1136 5 5 5
7 191 1211 1211 2 5 5
8 273 1227 1227 3 3 3
9 169 994 994 2 3 3
Narrative Writing 3 344 691 691 5 4 4
4 320 740 740 5 3 3
5 308 759 759 4 3 3
6 347 1131 1131 5 5 5
7 193 1204 1204 2 5 5
8 281 1227 1227 3 3 3
9 170 999 999 2 3 3
Expository Writing 3 345 694 694 5 4 4
4 322 740 740 4 3 3
5 311 761 761 4 3 3
6 342 1135 1135 5 5 5
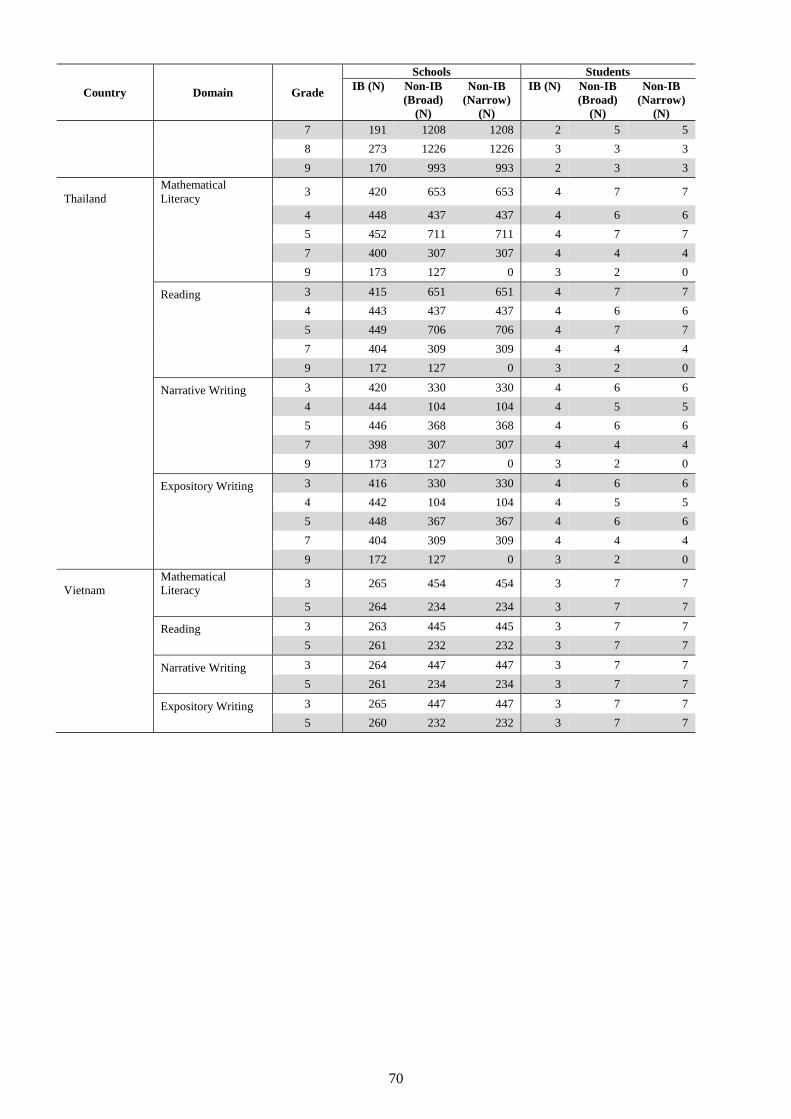
70
Country Domain Grade
Schools Students
IB (N) Non-IB
(Broad)
(N)
Non-IB
(Narrow)
(N)
IB (N) Non-IB
(Broad)
(N)
Non-IB
(Narrow)
(N)
7 191 1208 1208 2 5 5
8 273 1226 1226 3 3 3
9 170 993 993 2 3 3
Thailand
Mathematical
Literacy 3 420 653 653 4 7 7
4 448 437 437 4 6 6
5 452 711 711 4 7 7
7 400 307 307 4 4 4
9 173 127 0 3 2 0
Reading 3 415 651 651 4 7 7
4 443 437 437 4 6 6
5 449 706 706 4 7 7
7 404 309 309 4 4 4
9 172 127 0 3 2 0
Narrative Writing 3 420 330 330 4 6 6
4 444 104 104 4 5 5
5 446 368 368 4 6 6
7 398 307 307 4 4 4
9 173 127 0 3 2 0
Expository Writing 3 416 330 330 4 6 6
4 442 104 104 4 5 5
5 448 367 367 4 6 6
7 404 309 309 4 4 4
9 172 127 0 3 2 0
Vietnam
Mathematical
Literacy 3 265 454 454 3 7 7
5 264 234 234 3 7 7
Reading 3 263 445 445 3 7 7
5 261 232 232 3 7 7
Narrative Writing 3 264 447 447 3 7 7
5 261 234 234 3 7 7
Expository Writing 3 265 447 447 3 7 7
5 260 232 232 3 7 7
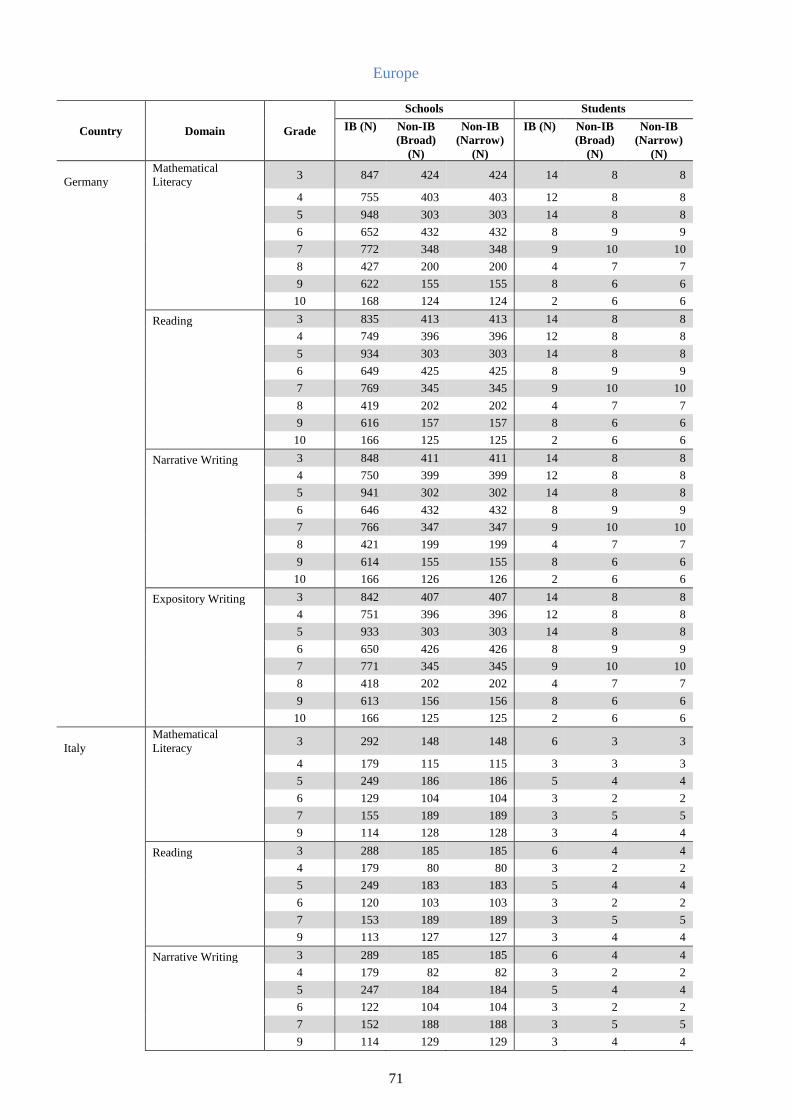
71
Europe
Country Domain Grade
Schools Students
IB (N) Non-IB
(Broad)
(N)
Non-IB
(Narrow)
(N)
IB (N) Non-IB
(Broad)
(N)
Non-IB
(Narrow)
(N)
Germany
Mathematical
Literacy 3 847 424 424 14 8 8
4 755 403 403 12 8 8
5 948 303 303 14 8 8
6 652 432 432 8 9 9
7 772 348 348 9 10 10
8 427 200 200 4 7 7
9 622 155 155 8 6 6
10 168 124 124 2 6 6
Reading 3 835 413 413 14 8 8
4 749 396 396 12 8 8
5 934 303 303 14 8 8
6 649 425 425 8 9 9
7 769 345 345 9 10 10
8 419 202 202 4 7 7
9 616 157 157 8 6 6
10 166 125 125 2 6 6
Narrative Writing 3 848 411 411 14 8 8
4 750 399 399 12 8 8
5 941 302 302 14 8 8
6 646 432 432 8 9 9
7 766 347 347 9 10 10
8 421 199 199 4 7 7
9 614 155 155 8 6 6
10 166 126 126 2 6 6
Expository Writing 3 842 407 407 14 8 8
4 751 396 396 12 8 8
5 933 303 303 14 8 8
6 650 426 426 8 9 9
7 771 345 345 9 10 10
8 418 202 202 4 7 7
9 613 156 156 8 6 6
10 166 125 125 2 6 6
Italy
Mathematical
Literacy 3 292 148 148 6 3 3
4 179 115 115 3 3 3
5 249 186 186 5 4 4
6 129 104 104 3 2 2
7 155 189 189 3 5 5
9 114 128 128 3 4 4
Reading 3 288 185 185 6 4 4
4 179 80 80 3 2 2
5 249 183 183 5 4 4
6 120 103 103 3 2 2
7 153 189 189 3 5 5
9 113 127 127 3 4 4
Narrative Writing 3 289 185 185 6 4 4
4 179 82 82 3 2 2
5 247 184 184 5 4 4
6 122 104 104 3 2 2
7 152 188 188 3 5 5
9 114 129 129 3 4 4
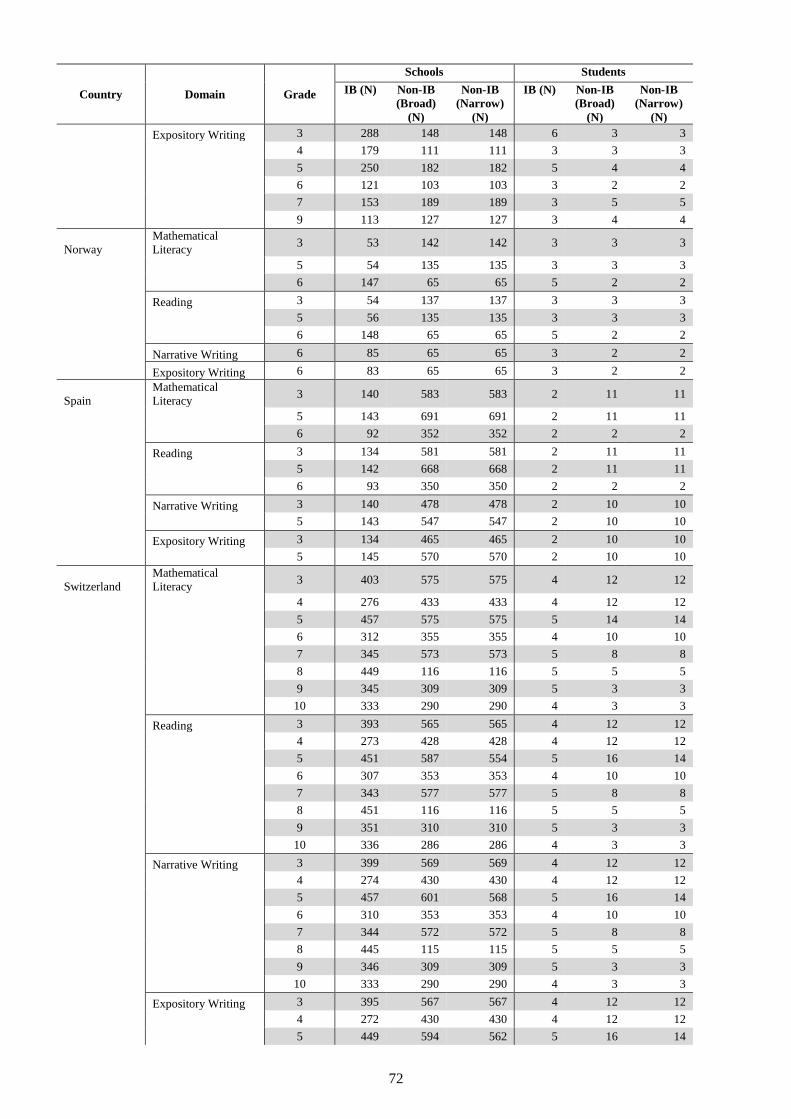
72
Country Domain Grade
Schools Students
IB (N) Non-IB
(Broad)
(N)
Non-IB
(Narrow)
(N)
IB (N) Non-IB
(Broad)
(N)
Non-IB
(Narrow)
(N)
Expository Writing 3 288 148 148 6 3 3
4 179 111 111 3 3 3
5 250 182 182 5 4 4
6 121 103 103 3 2 2
7 153 189 189 3 5 5
9 113 127 127 3 4 4
Norway
Mathematical
Literacy 3 53 142 142 3 3 3
5 54 135 135 3 3 3
6 147 65 65 5 2 2
Reading 3 54 137 137 3 3 3
5 56 135 135 3 3 3
6 148 65 65 5 2 2
Narrative Writing 6 85 65 65 3 2 2
Expository Writing 6 83 65 65 3 2 2
Spain
Mathematical
Literacy 3 140 583 583 2 11 11
5 143 691 691 2 11 11
6 92 352 352 2 2 2
Reading 3 134 581 581 2 11 11
5 142 668 668 2 11 11
6 93 350 350 2 2 2
Narrative Writing 3 140 478 478 2 10 10
5 143 547 547 2 10 10
Expository Writing 3 134 465 465 2 10 10
5 145 570 570 2 10 10
Switzerland
Mathematical
Literacy 3 403 575 575 4 12 12
4 276 433 433 4 12 12
5 457 575 575 5 14 14
6 312 355 355 4 10 10
7 345 573 573 5 8 8
8 449 116 116 5 5 5
9 345 309 309 5 3 3
10 333 290 290 4 3 3
Reading 3 393 565 565 4 12 12
4 273 428 428 4 12 12
5 451 587 554 5 16 14
6 307 353 353 4 10 10
7 343 577 577 5 8 8
8 451 116 116 5 5 5
9 351 310 310 5 3 3
10 336 286 286 4 3 3
Narrative Writing 3 399 569 569 4 12 12
4 274 430 430 4 12 12
5 457 601 568 5 16 14
6 310 353 353 4 10 10
7 344 572 572 5 8 8
8 445 115 115 5 5 5
9 346 309 309 5 3 3
10 333 290 290 4 3 3
Expository Writing 3 395 567 567 4 12 12
4 272 430 430 4 12 12
5 449 594 562 5 16 14
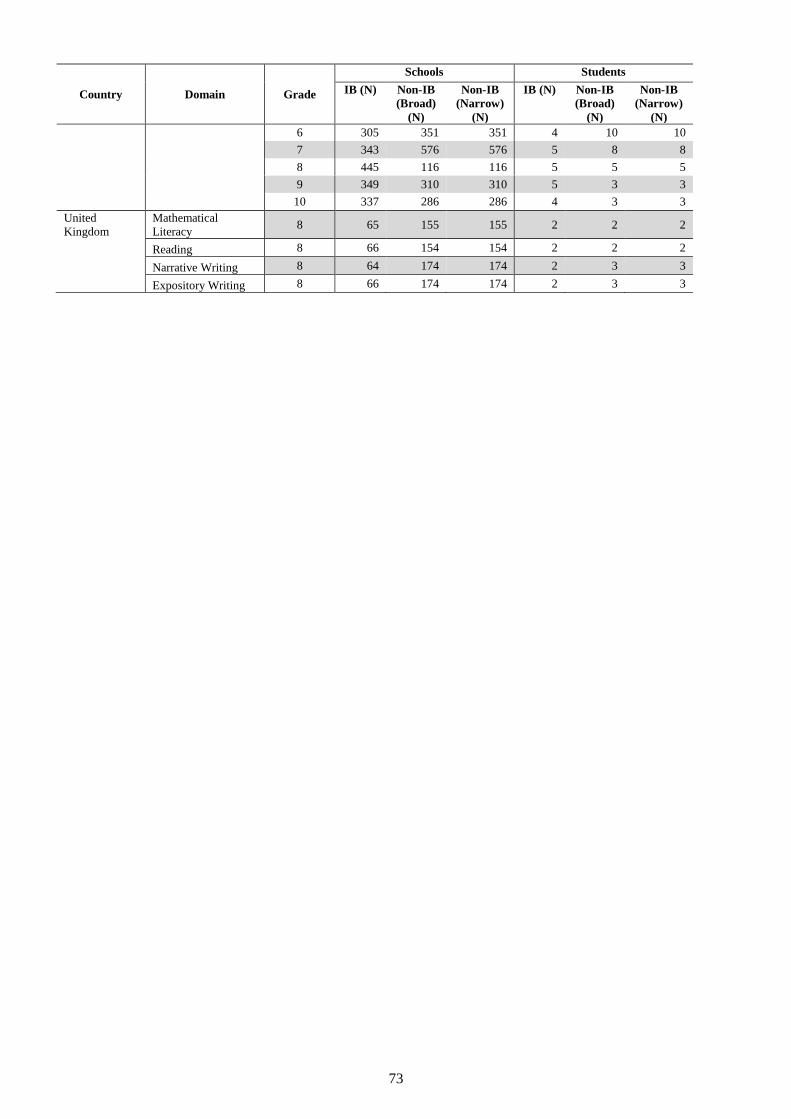
73
Country Domain Grade
Schools Students
IB (N) Non-IB
(Broad)
(N)
Non-IB
(Narrow)
(N)
IB (N) Non-IB
(Broad)
(N)
Non-IB
(Narrow)
(N)
6 305 351 351 4 10 10
7 343 576 576 5 8 8
8 445 116 116 5 5 5
9 349 310 310 5 3 3
10 337 286 286 4 3 3
United
Kingdom
Mathematical
Literacy 8 65 155 155 2 2 2
Reading 8 66 154 154 2 2 2
Narrative Writing 8 64 174 174 2 3 3
Expository Writing 8 66 174 174 2 3 3
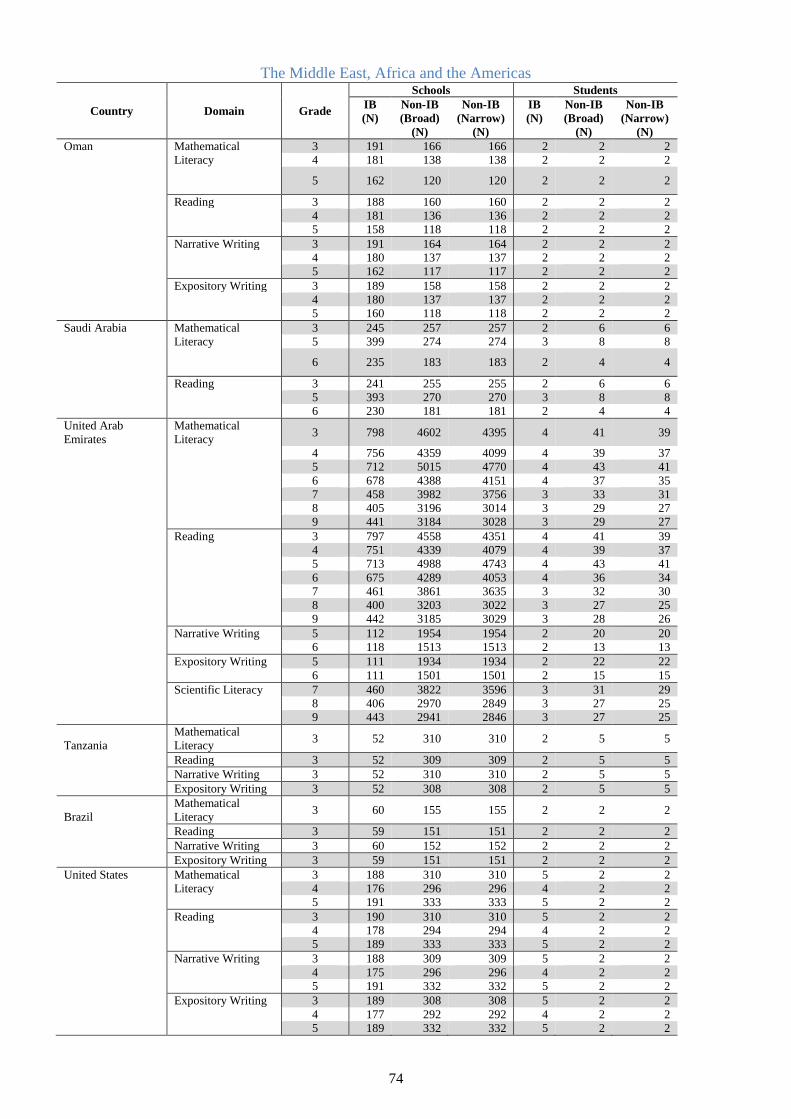
74
The Middle East, Africa and the Americas
Country Domain Grade
Schools Students
IB
(N)
Non-IB
(Broad)
(N)
Non-IB
(Narrow)
(N)
IB
(N)
Non-IB
(Broad)
(N)
Non-IB
(Narrow)
(N)
Oman Mathematical
Literacy
3 191 166 166 2 2 2
4 181 138 138 2 2 2
5 162 120 120 2 2 2
Reading 3 188 160 160 2 2 2
4 181 136 136 2 2 2
5 158 118 118 2 2 2
Narrative Writing 3 191 164 164 2 2 2
4 180 137 137 2 2 2
5 162 117 117 2 2 2
Expository Writing 3 189 158 158 2 2 2
4 180 137 137 2 2 2
5 160 118 118 2 2 2
Saudi Arabia Mathematical
Literacy
3 245 257 257 2 6 6
5 399 274 274 3 8 8
6 235 183 183 2 4 4
Reading 3 241 255 255 2 6 6
5 393 270 270 3 8 8
6 230 181 181 2 4 4
United Arab
Emirates
Mathematical
Literacy
3 798 4602 4395 4 41 39
4 756 4359 4099 4 39 37
5 712 5015 4770 4 43 41
6 678 4388 4151 4 37 35
7 458 3982 3756 3 33 31
8 405 3196 3014 3 29 27
9 441 3184 3028 3 29 27
Reading 3 797 4558 4351 4 41 39
4 751 4339 4079 4 39 37
5 713 4988 4743 4 43 41
6 675 4289 4053 4 36 34
7 461 3861 3635 3 32 30
8 400 3203 3022 3 27 25
9 442 3185 3029 3 28 26
Narrative Writing 5 112 1954 1954 2 20 20
6 118 1513 1513 2 13 13
Expository Writing 5 111 1934 1934 2 22 22
6 111 1501 1501 2 15 15
Scientific Literacy 7 460 3822 3596 3 31 29
8 406 2970 2849 3 27 25
9 443 2941 2846 3 27 25
Tanzania
Mathematical
Literacy 3 52 310 310 2 5 5
Reading 3 52 309 309 2 5 5
Narrative Writing 3 52 310 310 2 5 5
Expository Writing 3 52 308 308 2 5 5
Brazil
Mathematical
Literacy 3 60 155 155 2 2 2
Reading 3 59 151 151 2 2 2
Narrative Writing 3 60 152 152 2 2 2
Expository Writing 3 59 151 151 2 2 2
United States Mathematical
Literacy
3 188 310 310 5 2 2
4 176 296 296 4 2 2
5 191 333 333 5 2 2
Reading 3 190 310 310 5 2 2
4 178 294 294 4 2 2
5 189 333 333 5 2 2
Narrative Writing 3 188 309 309 5 2 2
4 175 296 296 4 2 2
5 191 332 332 5 2 2
Expository Writing 3 189 308 308 5 2 2
4 177 292 292 4 2 2
5 189 332 332 5 2 2
75
Appendix 7: ISA Sub-strand Description
This Appendix provides detailed descriptions of ISA sub-strands in Mathematical Literacy, Reading, and
Writing tasks. The sub-strands are used for comparing IB students to non-IB students in performance on
each assessment sub-strand/writing criterion in the analysis section. The following information is
extracted from Guide to ISA Reports for October 2017 Administration, (ACER, 2017).
Mathematical Literacy Sub-strands Uncertainty and Data This content area reflects how in real life data is commonly collected, organised,
analysed and displayed with a view to making interpretations and forming conclusions. Many decisions are
made based upon statistical analysis of data. Real life also contains elements of chance where outcomes are
not certain but based upon probabilities. Increasingly decision-making is qualified with a statement of risk
and society is presented with more and more information to make sense of.
Quantity This overarching content area also features in the three other domains to varying degrees. It
focuses on the need for quantification in order to organise the world. It is not hard to find examples of
quantification in our day-to-day living. We use money, make measurements, estimate and calculate.
Increasingly we make use of technology to assist us but we also still perform many calculations mentally
and approximately. Quantitative reasoning requires number sense: that is, having a feel for the magnitude
of numbers, using strategies and tools appropriately, and being able to check solutions for reasonableness.
Space and Shape Shapes and constructions are all around us physically as real objects but also as
representations in the form of photographs, maps and diagrams. Constructing and interpreting such
representations is an important skill. Using known geometric shapes whose mathematical properties are
known to model more complex shapes is an important problem-solving tool. Knowledge and appreciation
of the beauty and function of geometric shapes and spaces has applications reaching from art to advertising.
Change and Relationships Noticing and using patterns in number and shapes, and finding and describing
relationships between variables lies at the heart of mathematics. As organisms or populations grow and as
stock markets ebb and flow, we describe the patterns in words, in tables and sometimes in algebraic
notation. Commonly we chart the changes in graphical form. These descriptions can be linear, non-linear,
cyclic and exponential to name but a few. Being able to link between these various representations and use
the language, notation and algorithms of change and relationships is critical to making sense of the patterns
in our world.
Reading Sub-strands Access and Retrieve is defined as locating one or more pieces of information in a text.
Integrate and Interpret texts is defined as constructing meaning and drawing inferences from one or more
parts of a text.
Reflect and Evaluate is defined as relating a text to one’s experience, knowledge and ideas.
Criteria for Narrative Writing (Narrative) Narrative/Reflective – Content criterion is about the quality and range of ideas presented, the development
of plot, characters and setting, and the writer’s sense of audience and purpose. It also encompasses the
overall shaping of the piece.
Narrative/Reflective – Language criterion deals with sentence and paragraph structure, vocabulary and
punctuation, and the writer’s voice.
Narrative/Reflective – Spelling criterion takes into account students’ knowledge of phonetic and visual
spelling patterns and the range of words attempted, as well as correctness of spelling.
76
Criteria for Expository Writing (Exposition or Argument) Exposition/Argument – Content criterion looks at the depth and range of ideas presented, and at the quality
of reasoning demonstrated in the ability to provide evidence and logical argumentation in support of a
position.
Exposition/Argument – ESOL Language (English for Speakers of Other Languages) criterion is applied
to all students’ writing regardless of their language background, but focuses on the grammatical correctness
and command of English syntax, as well as sentence fluency and variation, and vocabulary.
Exposition/Argument – Structure and Organisation criterion deals with the overall structure of the
writing, for example the presence of a clear introduction, development and conclusion; and its internal
coherence, such as linking between and within paragraphs.
Scientific Literacy Sub-strands Evaluate and design scientific enquiry - This competency focuses on the ability to understand the goals
and processes of scientific enquiry in generating empirical data and reliable knowledge about the natural
world. Awareness is needed of methods of data collection by observation or experiment, in the laboratory
or in the field and how this leads to the development of models and hypotheses. Skills demonstrated by
those with this competency include the identification of questions that can be explored scientifically;
proposal and evaluation of methods for exploring a given question scientifically; and awareness of the
methods used by scientists to ensure reliability of data, to acknowledge and minimise measurement error;
and ensure conclusions are objective and can be generalised.
Explain phenomena scientifically - Demonstrating this competency involves recall and application of
appropriate scientific knowledge in a given situation. The competency includes describing or interpreting
phenomena and predicting changes. It also involves explaining the societal implications of scientific
knowledge and may involve recognising or identifying appropriate descriptions, explanations, hypotheses
and predictions.
Interpret data and evidence scientifically - Analysing and evaluating scientific data and evidence in a
variety of situations are the main areas emphasised in this competency. Some key aspects of this
competency include transforming data from one representation to another; and evaluating scientific
arguments, assumptions, evidence and reasoning from different sources (e.g. websites, journals,
newspapers, science-related texts). Students may be required to present evidence and decisions through
their own words, diagrams or other representations as appropriate. Students are required to make clear and
logical connections between evidence and conclusions or decisions.

77