Embed Size (px)
Citation preview
Research Report
Resident Survey 2018
Prepared for: London Borough of Islington
Prepared by: BMG Research
Resident Survey 2018
Prepared for: London Borough of Islington
Prepared by: BMG Research
Date: March 2018
Produced by BMG Research
© BMG Research Ltd, 2018
www.bmgresearch.co.uk
Project: 1461
Registered in England No. 2841970
Registered office:
BMG Research Beech House Greenfield Crescent Edgbaston Birmingham B15 3BE UK
Tel: +44 (0) 121 3336006
UK VAT Registration No. 580 6606 32
Birmingham Chamber of Commerce Member No. B4626
Market Research Society Company Partner
The provision of Market Research Services in accordance with ISO 20252:2012
The provision of Market Research Services in accordance with ISO 9001:2008
The International Standard for Information Security Management ISO 27001:2013
Investors in People Standard - Certificate No. WMQC 0614
Interviewer Quality Control Scheme (IQCS) Member Company
Registered under the Data Protection Act - Registration No. Z5081943
A Fair Data organisation
Cyber Essentials certification
The BMG Research logo is a trade mark of BMG Research Ltd.
Table of Contents
1 Introduction .................................................................................................................... 1
1.1 Background............................................................................................................. 1
1.2 Sampling ................................................................................................................. 1
1.3 Data ........................................................................................................................ 1
1.4 Reporting ................................................................................................................ 1
1.5 Ward groups ........................................................................................................... 3
2 Benchmarking ................................................................................................................ 4
3 Key findings ................................................................................................................... 5
3.1 Islington as a place to live ....................................................................................... 5
3.2 Perceptions of the Council ...................................................................................... 5
3.3 Perceptions of Council services .............................................................................. 5
3.4 Council budget and priorities ................................................................................... 5
3.5 Involvement in local decision making ...................................................................... 5
3.6 Community cohesion and safety perceptions .......................................................... 5
3.7 Economic and cost of living help ............................................................................. 6
3.8 Communication and information channels .............................................................. 6
4 Islington as a place to live .............................................................................................. 7
4.1 Activities for young people in Islington .................................................................. 11
5 Perceptions of the Council and Council services .......................................................... 12
5.1 Perceptions of the Council .................................................................................... 12
5.2 Perceptions of Council services ............................................................................ 14
6 Council budget and priorities ........................................................................................ 17
7 Involvement in local decision making ........................................................................... 24
8 Community cohesion and safety perceptions ............................................................... 27
9 Economic and cost of living help .................................................................................. 33
10 Communication and information channels ................................................................ 38
Resident Survey 2018
2
Table of Figures
Figure 1: Q3. Overall, how satisfied or dissatisfied are you with Islington as a place to live?
(All responses) ...................................................................................................................... 7
Figure 2: Proportion satisfied with Islington as a place to live - Over time ............................. 8
Figure 3: Satisfaction with Islington as a place to live - By key subgroups ........................... 10
Figure 4: Q5. To what extent do you agree or disagree with the following statement: There
are enough activities for young people to do in Islington? (All responses) ........................... 11
Figure 5: Q6. To what extent do you agree or disagree with the following statements? (All
responses) .......................................................................................................................... 12
Figure 6: Q4. How satisfied or dissatisfied are you with the following services and/or facilities
provided by Islington Council? (All responses) .................................................................... 14
Figure 7: Q7. In terms of this year's budget (starting in April 2018) do you think the council
will have...? (All responses) ................................................................................................. 17
Figure 8: Q8. Which of the following do you think the council should focus on to improve the
quality of life for residents? (All responses excluding None of these) .................................. 21
Figure 9: Q9. Generally speaking, would you like to be more involved in the decisions that
affect your local area? (All responses) ................................................................................ 24
Figure 10: Proportion NOT interested in being more involved - By subgroups .................... 25
Figure 11: Q10. How would you like to be involved? (All responses, those who would like to
be more involved) ............................................................................................................... 26
Figure 12: Q11. How safe or unsafe do you feel when outside in your local area AFTER
DARK? (All responses) ....................................................................................................... 27
Figure 13: Q11. How safe or unsafe do you feel when outside in your local area DURING
THE DAY? (All responses) .................................................................................................. 28
Figure 14: Proportion feeling UNSAFE - by subgroups ....................................................... 29
Figure 15: Q12. To what extent do you agree or disagree that the council is working to make
the local area safer? (All responses) ................................................................................... 30
Figure 16: Q12. To what extent do you agree or disagree that the council is working to make
the local area safer? - By ward group and gender (All responses) ...................................... 31
Figure 17: Q12. To what extent do you agree or disagree that your local area is a place
where people from different backgrounds get on well together? (All responses) ................. 32
Figure 18: Proportion agreeing that their local area is a place where people from different
backgrounds get on well together - Over time ..................................................................... 32
Figure 19: Q13/1. To what extent are you aware of the following? : The council works to
support private tenants (All responses) ............................................................................... 33
Figure 20: Q13/2. To what extent are you aware of the following? : The council is working
with partners to help people in to work (All responses) ........................................................ 34
Introduction
3
Figure 21: Q14. Have you heard that the council is building more genuinely affordable
housing in the borough? (All responses) ............................................................................. 35
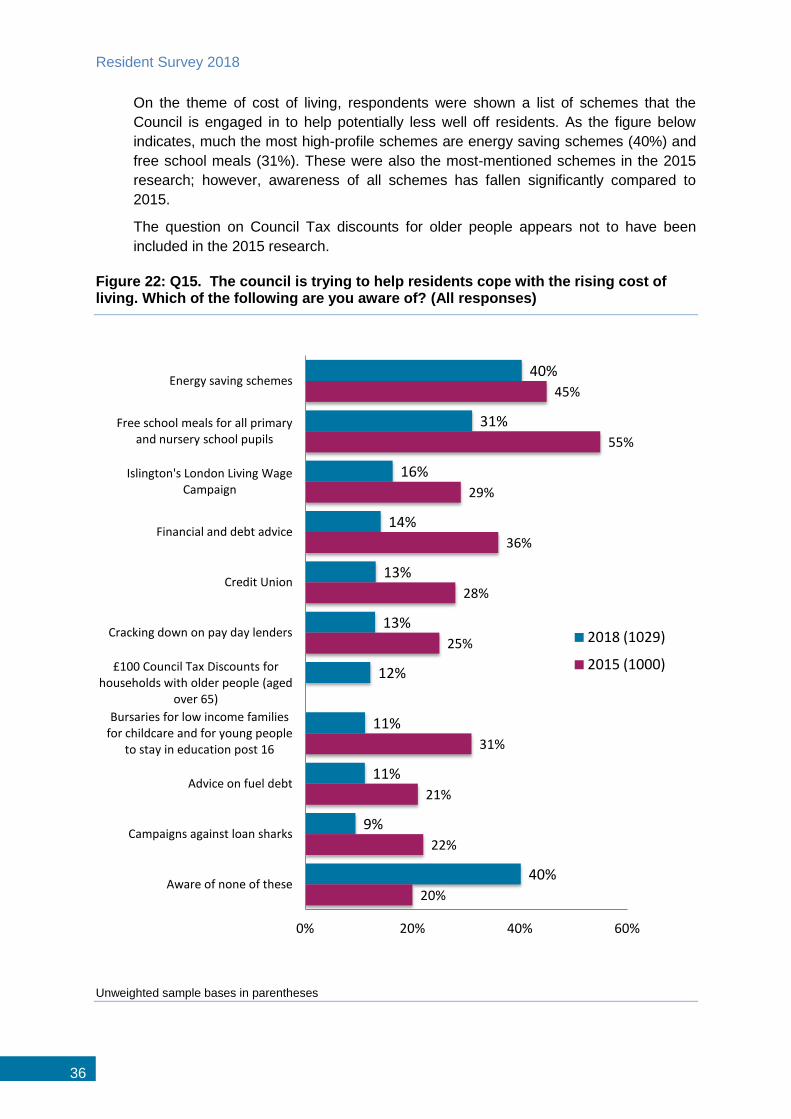
Figure 22: Q15. The council is trying to help residents cope with the rising cost of living.
Which of the following are you aware of? (All responses) ................................................... 36
Figure 23: Q16. How do you normally contact the Council? (All responses, those contacting
the Council) ......................................................................................................................... 38
Figure 24: Q17. Approximately how often do you contact the council? (All responses, those
contacting the Council) ........................................................................................................ 39
Figure 25: Q18. Which of the following online services have you used or would be happy to
use in the future so the Council have more money available to spend on your priorities? (All
responses) .......................................................................................................................... 40
Figure 26: Q19. Why do you not use the Council's website for any of the activities listed?
(All responses, those who have not used the Council website for any of the specified
activities) ............................................................................................................................. 42
Figure 27: Q20. How do you normally access the internet, if at all? (All responses) ........... 43
Figure 28: Proportion who do NOT use the internet - By age group .................................... 44
Figure 29: Q21A. How do you normally find out this sort of information? (All responses
excluding none of these) ..................................................................................................... 45
Figure 30: Q21b. How would you prefer to receive information about the council's services
and news? (All responses) .................................................................................................. 46
Table of Tables
Table 1: Islington findings benchmarked against LGA ........................................................... 4
Table 2: Perceptions of the Council - By subgroups ............................................................ 13
Table 3: Proportion satisfied with Council-provided services - Over time ............................. 15
Table 4: Satisfaction with Council-provided services - By ward group ................................. 16
Table 5: Perceptions of Council’s available budget - By subgroups ..................................... 19
Table 6: Council priorities - By children / age group / disability ............................................ 22
Table 7: Council priorities - By living status ......................................................................... 23
Table 8: Proportion aware of cost of living schemes - By household income and children / no
children ............................................................................................................................... 37
Table 9: Use of Council website - By age group and internet access .................................. 41

Introduction
1
1 Introduction
1.1 Background
This report summarises the results of the Residents Survey carried out amongst
Islington residents in January-February 2018 by BMG Research on behalf of the
London Borough of Islington. This research was carried out door-to-door by BMG
interviewers and follows previous residents research conducted by post in 2009 and
telephone in 2014 and 2015.
1.2 Sampling
Within the Index of Multiple Deprivation there are a number of domains of deprivation.
One domain which is useful by itself outside the main index is the Income Deprivation
domain. The purpose of this domain is to capture the proportion of the population
experiencing income deprivation in a small area (known as a Super Output Area
(SOA)).
The income deprivation scores at SOA level were ranked from high to low. These were
then segmented into quartiles within each ward to ensure that the bands reflected the
relative income deprivation within Islington.
To achieve these ward targets, sampling points (COAs) were selected randomly and
all addresses were identified from the postcode address file within this COA to form
the sample. Targets were set by ward proportionate to ward population, and 5-8
sampling points were selected per ward depending on the size of the ward target. A
target of approximately 10 interviews was to be achieved per sampling point. Whilst
the interviewers were able to approach any address within a sampling point, quotas
were set by age, gender, ethnicity and economic status within each ward to ensure a
representative spread by demographic profile. The survey was administered on a face-
to-face basis, using CAPI technology.
1.3 Data
In total, 1,029 interviews were completed amongst residents aged 16+. The sample
size of 1,029 is subject to a maximum standard error of ±3.05% at the 95% confidence
level on an observed statistic of 50%. Thus, for the quantitative survey, we can be 95%
confident that responses are representative of those that would have been given by
the total population of Islington, if all adult residents had completed a survey, to within
±3.05% of the percentages reported.
1.4 Reporting
Throughout this report the word “significant” is used to describe differences in the data.
This indicates where the data has been tested for statistical significance. This testing
identifies ‘real differences’ (i.e. difference that would occur if we were able to interview
all residents in the borough rather than just a sample). However, as already noted the
actual percentages reported in the data may vary by ±3.05% at the 95% confidence
level on an observed statistic of 50%.
Resident Survey 2018
2
Figures and tables are used throughout the report to assist explanation and analysis.
Although occasional anomalies appear due to ‘rounding’ differences, these are never
more than +/-1%. These occur where rating scales have been added to calculate
proportions of respondents who are, for example, satisfied (i.e. either very or fairly
satisfied).
Weights have been applied at a ward level by age and gender, using a mixture of mid-
year population estimates and the 2011 Census statistics. The final weighted data was
also checked to ensure that it was representative by ethnicity and by tenure (own
home, rent home, etc).
Comparisons are also made against previous Residents Survey findings. In making
these comparisons it should be borne in mind that the latest survey was carried out
using a different methodology (face to face interviewing rather than telephone). For
several questions, slightly different question wording / answer scales may also have
been used in 2015, and this is highlighted in the commentary throughout this report
wherever applicable.
A face to face methodology was chosen for the 2018 survey due to the increasing
difficulty in obtaining responses from younger residents by telephone. Random Digit
Dial (RDD) technology is progressively less useful for such residents due to the
declining proportion with a landline, whilst the number of telephone numbers for
younger residents available to purchase from commercial suppliers has fallen
significantly due to the requirements of the new General Data Protection Regulation
(GDPR).
Introduction
3
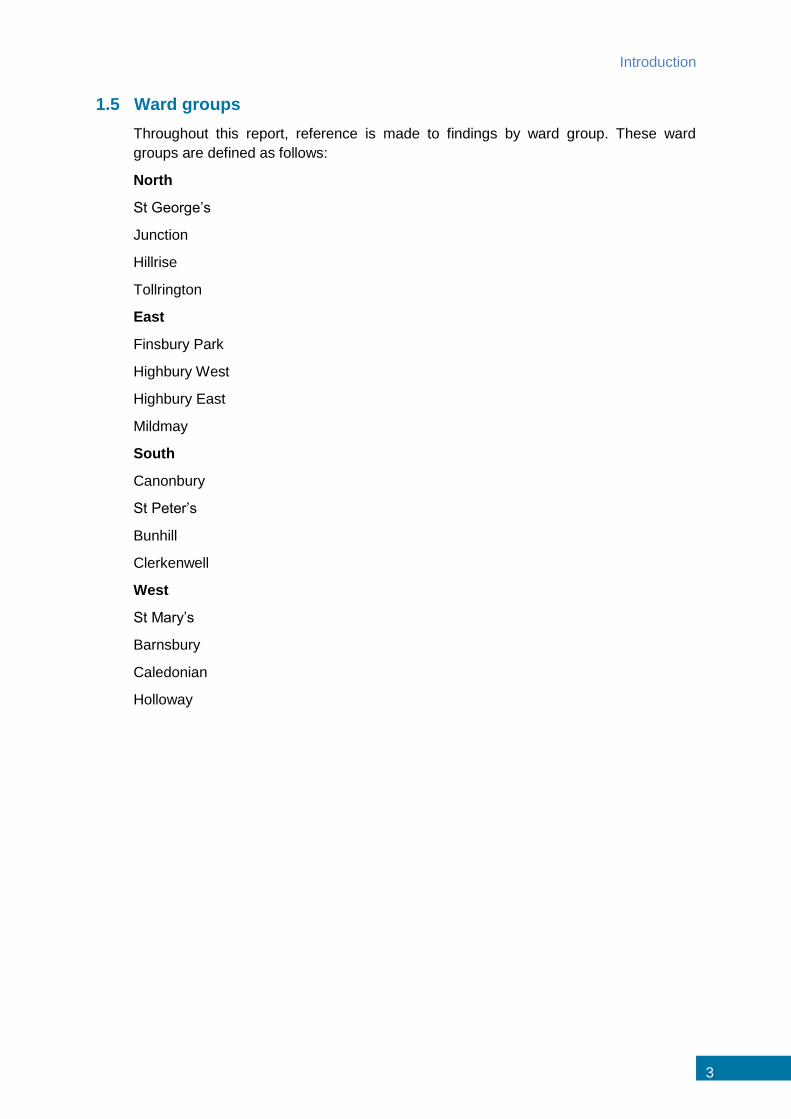
1.5 Ward groups
Throughout this report, reference is made to findings by ward group. These ward
groups are defined as follows:
North
St George’s
Junction
Hillrise
Tollrington
East
Finsbury Park
Highbury West
Highbury East
Mildmay
South
Canonbury
St Peter’s
Bunhill
Clerkenwell
West
St Mary’s
Barnsbury
Caledonian
Holloway
Resident Survey 2018
4
2 Benchmarking
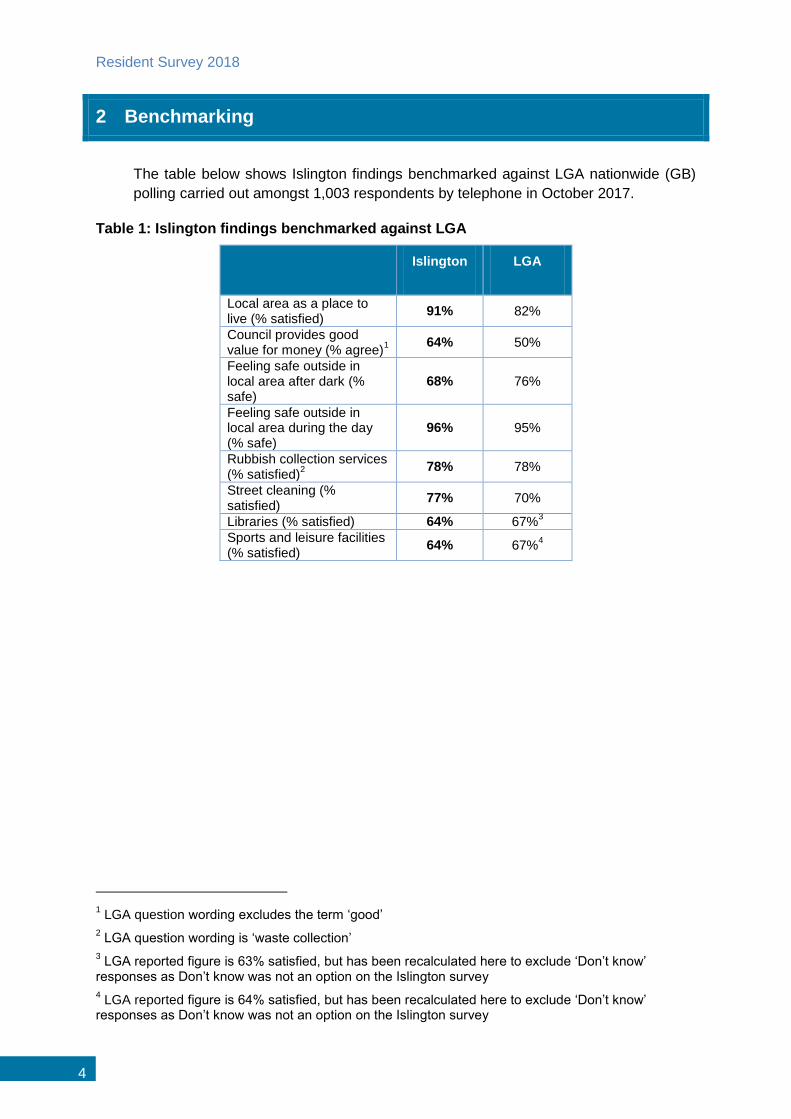
The table below shows Islington findings benchmarked against LGA nationwide (GB)
polling carried out amongst 1,003 respondents by telephone in October 2017.
Table 1: Islington findings benchmarked against LGA
Islington LGA
Local area as a place to live (% satisfied)
91% 82%
Council provides good value for money (% agree)
1
64% 50%
Feeling safe outside in local area after dark (% safe)
68% 76%
Feeling safe outside in local area during the day (% safe)
96% 95%
Rubbish collection services (% satisfied)
2
78% 78%
Street cleaning (% satisfied)
77% 70%
Libraries (% satisfied) 64% 67%3
Sports and leisure facilities (% satisfied)
64% 67%4
1 LGA question wording excludes the term ‘good’
2 LGA question wording is ‘waste collection’
3 LGA reported figure is 63% satisfied, but has been recalculated here to exclude ‘Don’t know’
responses as Don’t know was not an option on the Islington survey
4 LGA reported figure is 64% satisfied, but has been recalculated here to exclude ‘Don’t know’
responses as Don’t know was not an option on the Islington survey
Key findings
5
3 Key findings
3.1 Islington as a place to live
Nine in ten residents (91%) are satisfied with Islington as a place to live. This
represents a continuation of a positive trend in survey findings from 2009 onwards,
and is also 9% points ahead of the latest nationwide benchmark recorded in LGA
polling.
3.2 Perceptions of the Council
Around two-thirds of residents rate the Council positively on being efficient and well
run; providing good value for money; being trustworthy; and listening and responding
to residents’ concerns. No more than 13% rate the Council negatively on these
measures. Nationwide (LGA polling), 50% agree their Council(s) provide value for
money, compared to 64% of Islington residents.
3.3 Perceptions of Council services
Most residents are satisfied with services provided by the Council. Satisfaction with
services is in general higher than previous findings or similar; in particular, satisfaction
with parks and open spaces and street cleaning is up significantly compared to 2015
findings and also higher compared to all pre-2015 survey findings. Satisfaction with
street cleaning, at 77%, also compares favourably to nationwide LGA polling (70%).
3.4 Council budget and priorities
On balance, residents are much more likely to recognise that the Council will have less
money in this year’s budget than to think the Council will have more (39% cf. 13%),
although almost half (48%) believe the Council will have about the same amount of
money.
Of a given list of possible priorities for the Council, residents are much the most likely
to prioritise reducing crime and anti-social behaviour (65% mention this, compared to
36% for the next most-mentioned priority, good quality affordable housing).
3.5 Involvement in local decision making
Just under one in five (18%) state they would like to be more involved in decisions
affecting their local area; whilst a further 38% are prepared to be more involved
depending on the issues, residents are most likely to state outright that they are not
interested (43%).
3.6 Community cohesion and safety perceptions
Perceptions of safety both after dark and during the day are significantly improved
compared to 2015 findings. It should also be noted that the proportion feeling safe
after dark (68%) is lower compared to the nationwide (LGA) benchmark of 76%,
although further work is required to establish a like for like (London) benchmark.
Resident Survey 2018
6
Reducing crime and anti-social behaviour also remains the area that residents are
most likely to wish the Council to focus on (Section 3.4).
Nearly all residents (92%) agree their local area is a place where people from different
backgrounds get on well together, and this represents a positive trend compared to
survey findings from 2009 onwards.
3.7 Economic and cost of living help
Just over half (53%) are aware of the Council’s work to help private tenants at least to
some extent - the same figure (53%) also applies to awareness amongst private
tenants.
Similarly, (57%) are aware at least to some extent of the Council’s work with partners
to help people into work. Encouragingly, this awareness metric is significantly higher
amongst unemployed residents (69%).
In relation to the Council’s work in building more affordable housing in the borough,
three in ten (30%) have heard at least something. The majority (57%) have heard
nothing at all or don’t know.
Of the various schemes run by the Council to help residents cope with rising living
costs, much the most high-profile schemes are energy saving schemes (40% are
aware of this) and free school meals (31%). Awareness of nearly all schemes is
highest amongst residents with a household income of less than £15,000, although it
should be noted that even amongst this group 30% are not aware of any of the ten
schemes listed.
3.8 Communication and information channels
Telephone remains much the most-used way residents contact the Council (71% of
those contacting the Council state they normally do so in this way, compared to 27%
who use email).
In total, 65% of residents have used the Council website for at least one of a list of six
services. By contrast, approaching a quarter (22%) state they are not likely to use the
Council website for any of these services, and this rises to more than half (53%) of
residents aged 65+.
One in ten residents (10%) do not access the internet, rising to 41% of those aged
65+.
Residents are most likely to use letters, the Council website, and Islington Life to find
out about Council services and news, and these are also the leading three channels
that residents would prefer to use.
Islington as a place to live
7
4 Islington as a place to live
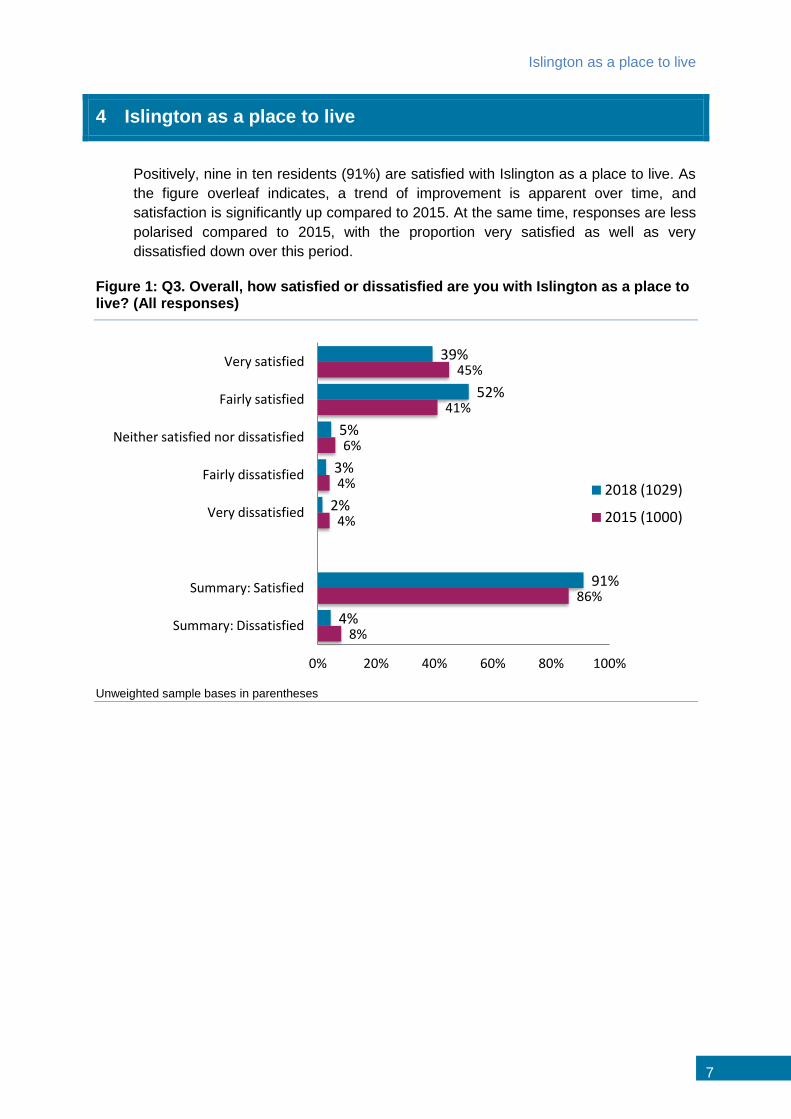
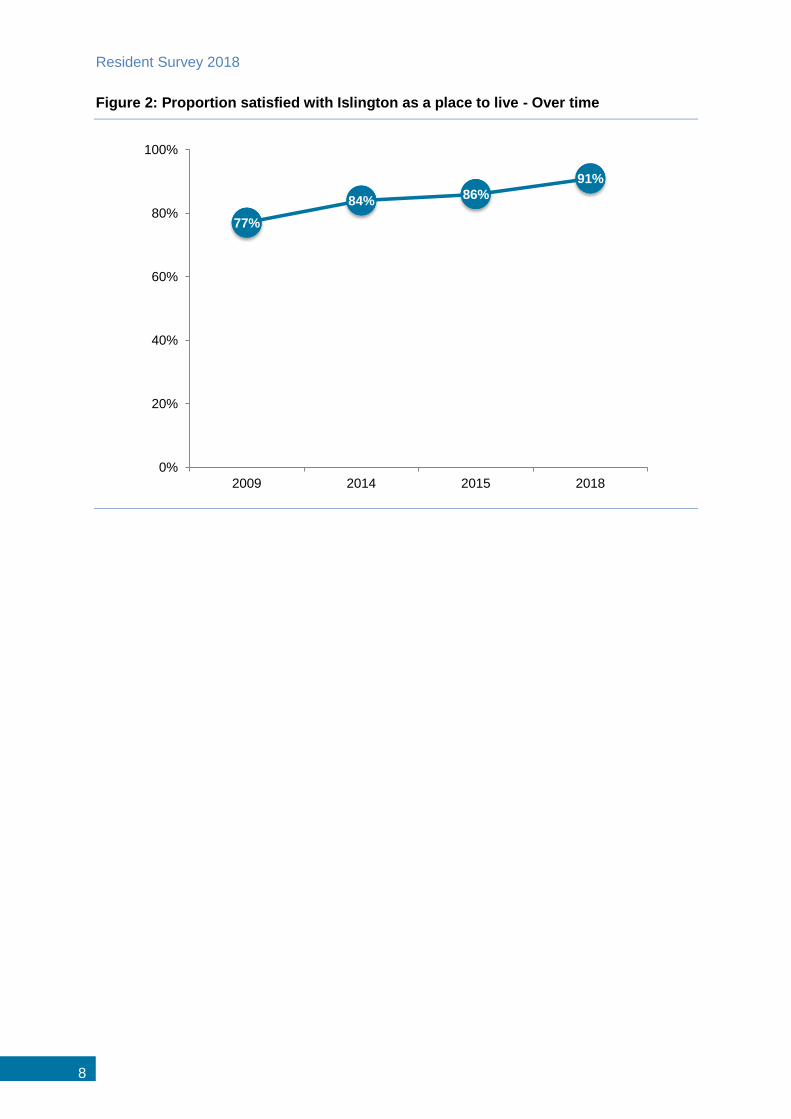
Positively, nine in ten residents (91%) are satisfied with Islington as a place to live. As
the figure overleaf indicates, a trend of improvement is apparent over time, and
satisfaction is significantly up compared to 2015. At the same time, responses are less
polarised compared to 2015, with the proportion very satisfied as well as very
dissatisfied down over this period.
Figure 1: Q3. Overall, how satisfied or dissatisfied are you with Islington as a place to live? (All responses)
Unweighted sample bases in parentheses
39%
52%
5%
3%
2%
91%
4%
45%
41%
6%
4%
4%
86%
8%
0% 20% 40% 60% 80% 100%
Very satisfied
Fairly satisfied
Neither satisfied nor dissatisfied
Fairly dissatisfied
Very dissatisfied
Summary: Satisfied
Summary: Dissatisfied
2018 (1029)
2015 (1000)
Resident Survey 2018
8
Figure 2: Proportion satisfied with Islington as a place to live - Over time
77%
84% 86%
91%
0%
20%
40%
60%
80%
100%
2009 2014 2015 2018
Islington as a place to live
9
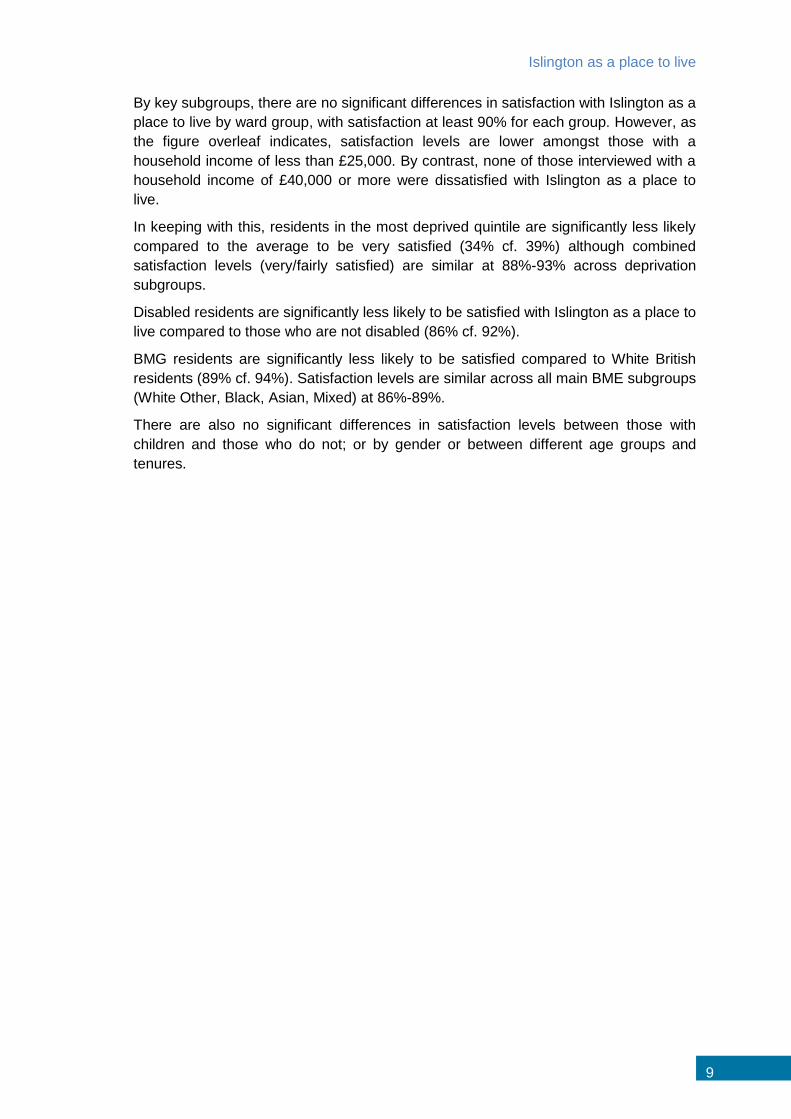
By key subgroups, there are no significant differences in satisfaction with Islington as a
place to live by ward group, with satisfaction at least 90% for each group. However, as
the figure overleaf indicates, satisfaction levels are lower amongst those with a
household income of less than £25,000. By contrast, none of those interviewed with a
household income of £40,000 or more were dissatisfied with Islington as a place to
live.
In keeping with this, residents in the most deprived quintile are significantly less likely
compared to the average to be very satisfied (34% cf. 39%) although combined
satisfaction levels (very/fairly satisfied) are similar at 88%-93% across deprivation
subgroups.
Disabled residents are significantly less likely to be satisfied with Islington as a place to
live compared to those who are not disabled (86% cf. 92%).
BMG residents are significantly less likely to be satisfied compared to White British
residents (89% cf. 94%). Satisfaction levels are similar across all main BME subgroups
(White Other, Black, Asian, Mixed) at 86%-89%.
There are also no significant differences in satisfaction levels between those with
children and those who do not; or by gender or between different age groups and
tenures.
Resident Survey 2018
10
Figure 3: Satisfaction with Islington as a place to live - By key subgroups
Unweighted sample bases in parentheses
89%
87%
95%
97%
96%
94%
89%
86%
92%
5%
9%
1%
3%
4%
3%
6%
8%
4%
6%
4%
4%
0%
3%
5%
6%
4%
0% 20% 40% 60% 80% 100%
<£14,999 (252)
£15,000 - £24,999 (131)
£25,000 - £39,999 (139)
£40,000 - £59,999 (60)
£60,000+ (113)
White British (479)
BME (535)
Yes (153)
No (869)
Satisfied Neither Dissatisfied
Household
income
Ethnicity
Disability
Islington as a place to live
11
4.1 Activities for young people in Islington
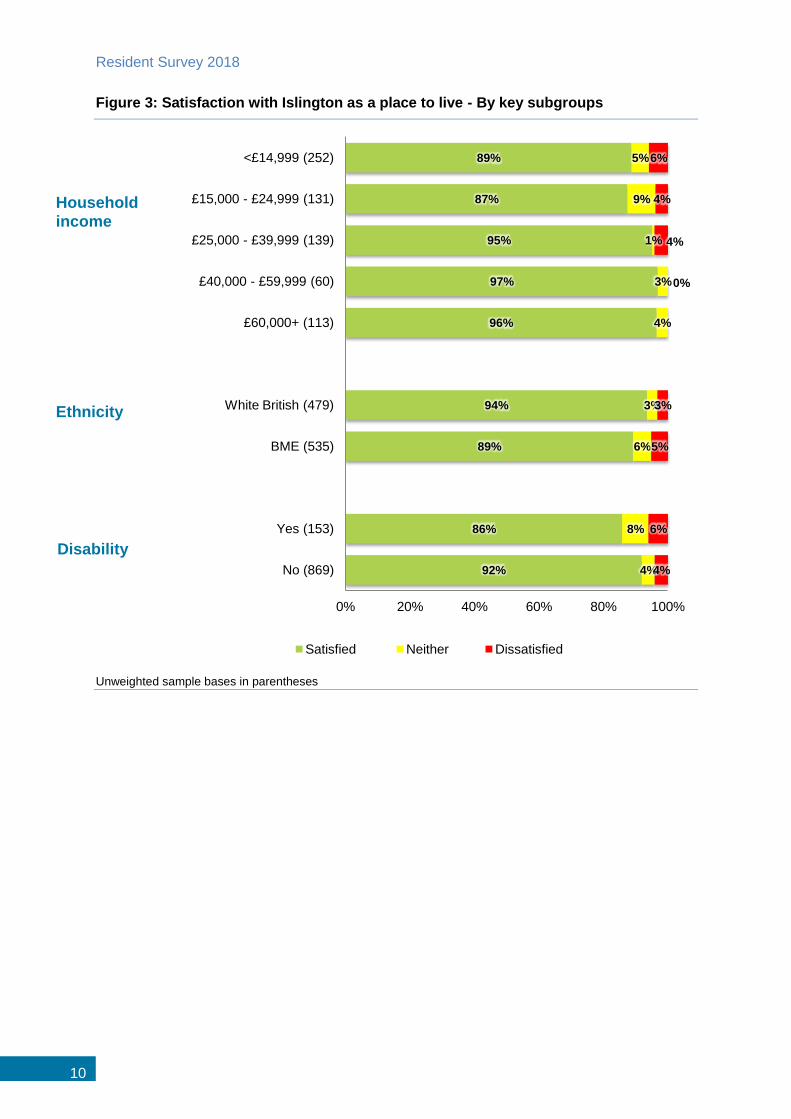
Asked whether they agree that there are enough activities for young people in
Islington, half (51%) agree, whilst 20% disagree. This is a significant improvement
compared to 2015, when 45% agreed this was the case.
Agreement is also up compared to 2014 (when 40% agreed); the question was not
included in the 2009 research.
Agreement is significantly higher compared to the average amongst 16-24 year olds
(65%, whilst 14% of this group disagree); and amongst those with children in their
household (62% agree, 21% disagree).
It is assumed in the analysis below that the 17% shown in the 2015 report as coding
‘Don’t know’ were in fact responding to an option labelled ‘Neither agree or disagree’
(i.e. the same answer scale used in the 2018 survey).
Figure 4: Q5. To what extent do you agree or disagree with the following statement: There are enough activities for young people to do in Islington? (All responses)
Unweighted sample bases in parentheses
11%
41%
29%
14%
6%
51%
20%
14%
31%
17%
18%
20%
45%
38%
0% 20% 40% 60%
Strongly agree
Tend to agree
Neither agree or disagree
Tend to disagree
Strongly disagree
Summary: Agree
Summary: Disagree
2018 (1029)
2015 (1000)
Resident Survey 2018
12
5 Perceptions of the Council and Council services
5.1 Perceptions of the Council
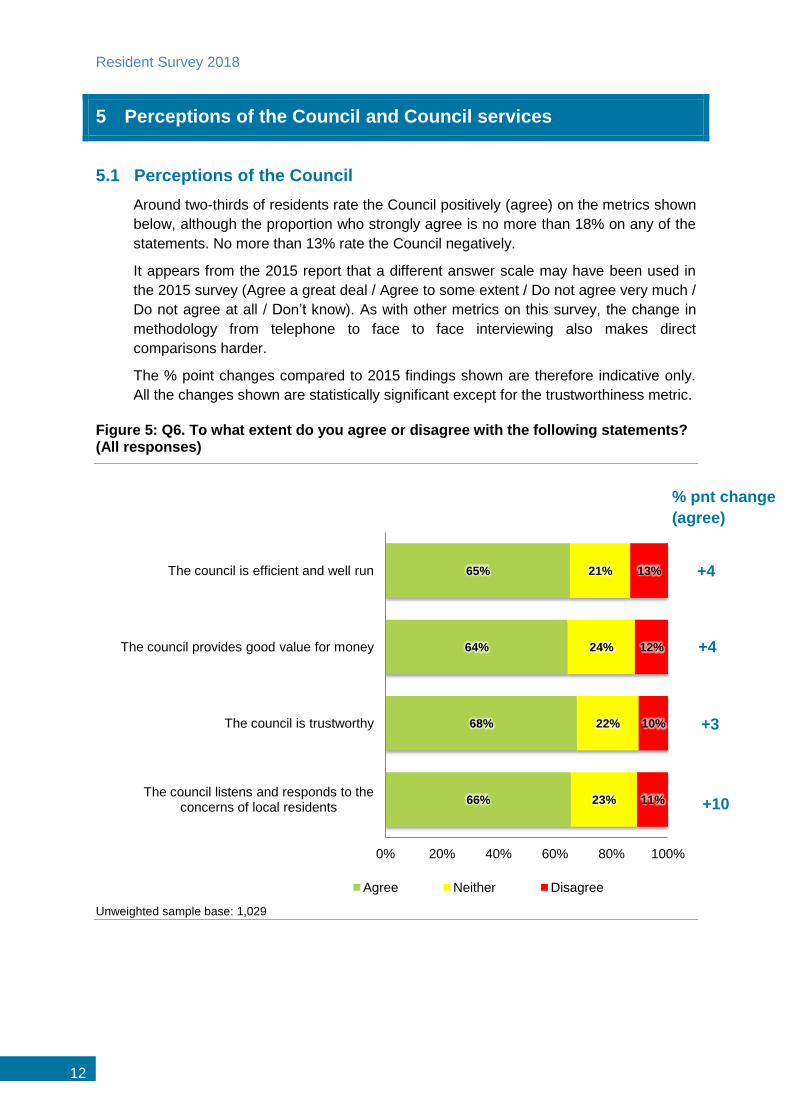
Around two-thirds of residents rate the Council positively (agree) on the metrics shown
below, although the proportion who strongly agree is no more than 18% on any of the
statements. No more than 13% rate the Council negatively.
It appears from the 2015 report that a different answer scale may have been used in
the 2015 survey (Agree a great deal / Agree to some extent / Do not agree very much /
Do not agree at all / Don’t know). As with other metrics on this survey, the change in
methodology from telephone to face to face interviewing also makes direct
comparisons harder.
The % point changes compared to 2015 findings shown are therefore indicative only.
All the changes shown are statistically significant except for the trustworthiness metric.
Figure 5: Q6. To what extent do you agree or disagree with the following statements? (All responses)
Unweighted sample base: 1,029
65%
64%
68%
66%
21%
24%
22%
23%
13%
12%
10%
11%
0% 20% 40% 60% 80% 100%
The council is efficient and well run
The council provides good value for money
The council is trustworthy
The council listens and responds to the concerns of local residents
Agree Neither Disagree
+4
+4
+3
+10
% pnt change
(agree)
Perceptions of the Council and Council services
13
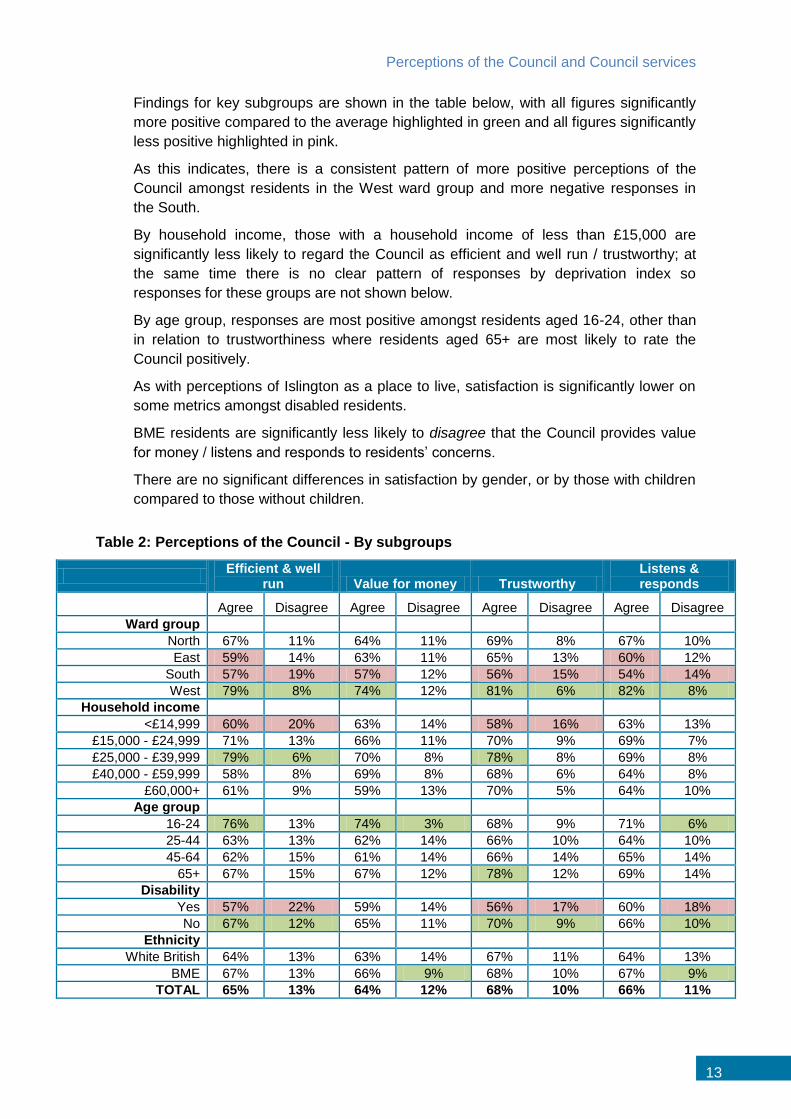
Findings for key subgroups are shown in the table below, with all figures significantly
more positive compared to the average highlighted in green and all figures significantly
less positive highlighted in pink.
As this indicates, there is a consistent pattern of more positive perceptions of the
Council amongst residents in the West ward group and more negative responses in
the South.
By household income, those with a household income of less than £15,000 are
significantly less likely to regard the Council as efficient and well run / trustworthy; at
the same time there is no clear pattern of responses by deprivation index so
responses for these groups are not shown below.
By age group, responses are most positive amongst residents aged 16-24, other than
in relation to trustworthiness where residents aged 65+ are most likely to rate the
Council positively.
As with perceptions of Islington as a place to live, satisfaction is significantly lower on
some metrics amongst disabled residents.
BME residents are significantly less likely to disagree that the Council provides value
for money / listens and responds to residents’ concerns.
There are no significant differences in satisfaction by gender, or by those with children
compared to those without children.
Table 2: Perceptions of the Council - By subgroups
Efficient & well
run Value for money Trustworthy Listens & responds
Agree Disagree Agree Disagree Agree Disagree Agree Disagree
Ward group
North 67% 11% 64% 11% 69% 8% 67% 10%
East 59% 14% 63% 11% 65% 13% 60% 12%
South 57% 19% 57% 12% 56% 15% 54% 14%
West 79% 8% 74% 12% 81% 6% 82% 8%
Household income
<£14,999 60% 20% 63% 14% 58% 16% 63% 13%
£15,000 - £24,999 71% 13% 66% 11% 70% 9% 69% 7%
£25,000 - £39,999 79% 6% 70% 8% 78% 8% 69% 8%
£40,000 - £59,999 58% 8% 69% 8% 68% 6% 64% 8%
£60,000+ 61% 9% 59% 13% 70% 5% 64% 10%
Age group
16-24 76% 13% 74% 3% 68% 9% 71% 6%
25-44 63% 13% 62% 14% 66% 10% 64% 10%
45-64 62% 15% 61% 14% 66% 14% 65% 14%
65+ 67% 15% 67% 12% 78% 12% 69% 14%
Disability
Yes 57% 22% 59% 14% 56% 17% 60% 18%
No 67% 12% 65% 11% 70% 9% 66% 10%
Ethnicity
White British 64% 13% 63% 14% 67% 11% 64% 13%
BME 67% 13% 66% 9% 68% 10% 67% 9%
TOTAL 65% 13% 64% 12% 68% 10% 66% 11%
Resident Survey 2018
14
5.2 Perceptions of Council services
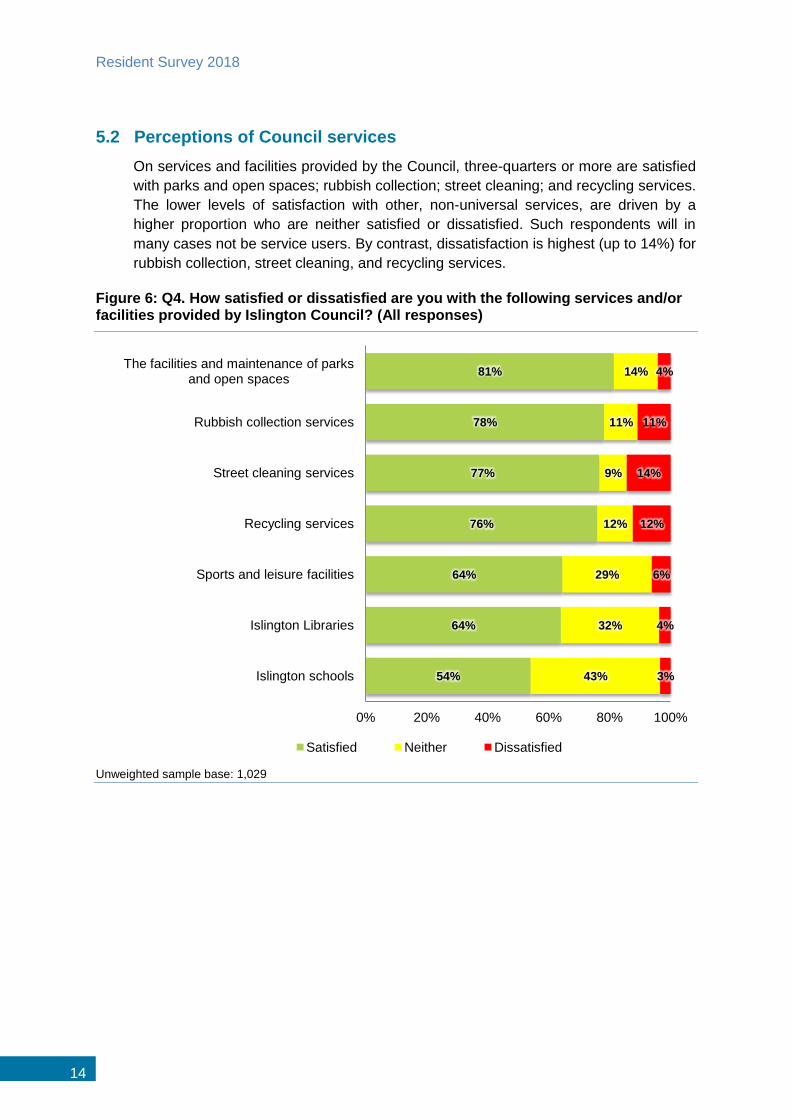
On services and facilities provided by the Council, three-quarters or more are satisfied
with parks and open spaces; rubbish collection; street cleaning; and recycling services.
The lower levels of satisfaction with other, non-universal services, are driven by a
higher proportion who are neither satisfied or dissatisfied. Such respondents will in
many cases not be service users. By contrast, dissatisfaction is highest (up to 14%) for
rubbish collection, street cleaning, and recycling services.
Figure 6: Q4. How satisfied or dissatisfied are you with the following services and/or facilities provided by Islington Council? (All responses)
Unweighted sample base: 1,029
81%
78%
77%
76%
64%
64%
54%
14%
11%
9%
12%
29%
32%
43%
4%
11%
14%
12%
6%
4%
3%
0% 20% 40% 60% 80% 100%
The facilities and maintenance of parks and open spaces
Rubbish collection services
Street cleaning services
Recycling services
Sports and leisure facilities
Islington Libraries
Islington schools
Satisfied Neither Dissatisfied
Perceptions of the Council and Council services
15
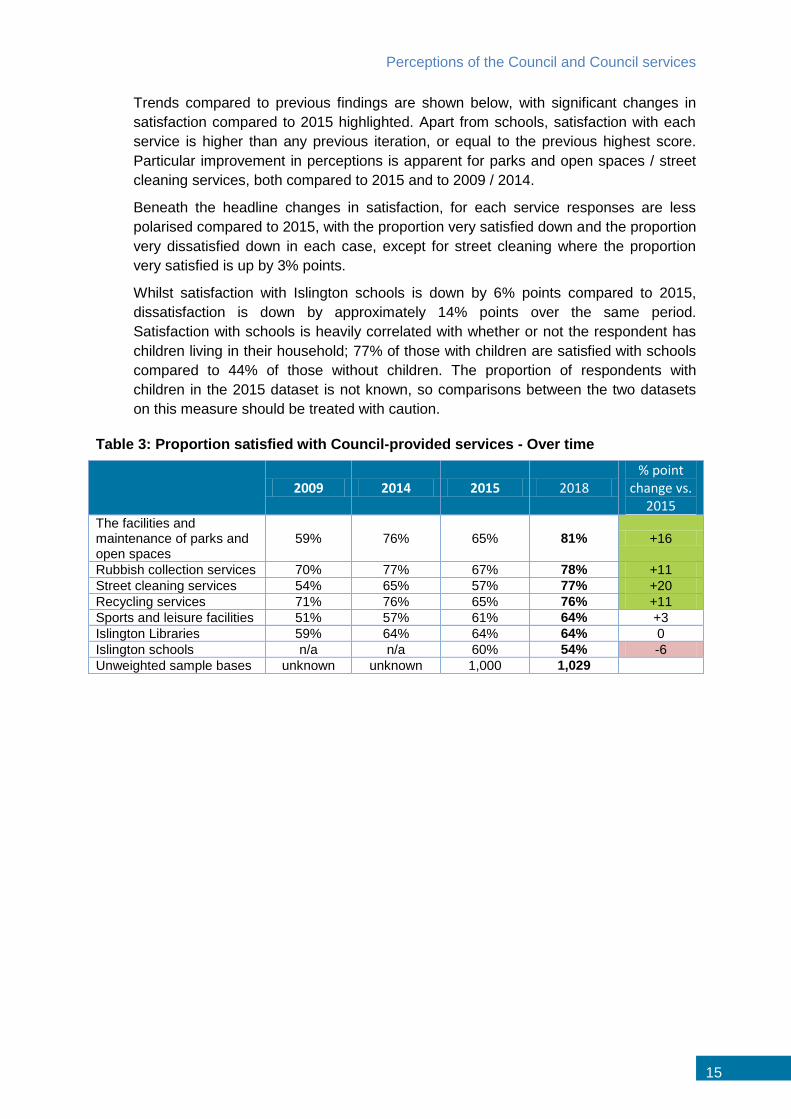
Trends compared to previous findings are shown below, with significant changes in
satisfaction compared to 2015 highlighted. Apart from schools, satisfaction with each
service is higher than any previous iteration, or equal to the previous highest score.
Particular improvement in perceptions is apparent for parks and open spaces / street
cleaning services, both compared to 2015 and to 2009 / 2014.
Beneath the headline changes in satisfaction, for each service responses are less
polarised compared to 2015, with the proportion very satisfied down and the proportion
very dissatisfied down in each case, except for street cleaning where the proportion
very satisfied is up by 3% points.
Whilst satisfaction with Islington schools is down by 6% points compared to 2015,
dissatisfaction is down by approximately 14% points over the same period.
Satisfaction with schools is heavily correlated with whether or not the respondent has
children living in their household; 77% of those with children are satisfied with schools
compared to 44% of those without children. The proportion of respondents with
children in the 2015 dataset is not known, so comparisons between the two datasets
on this measure should be treated with caution.
Table 3: Proportion satisfied with Council-provided services - Over time
2009 2014 2015 2018 % point
change vs. 2015
The facilities and maintenance of parks and open spaces
59% 76% 65% 81% +16
Rubbish collection services 70% 77% 67% 78% +11
Street cleaning services 54% 65% 57% 77% +20
Recycling services 71% 76% 65% 76% +11
Sports and leisure facilities 51% 57% 61% 64% +3
Islington Libraries 59% 64% 64% 64% 0
Islington schools n/a n/a 60% 54% -6
Unweighted sample bases unknown unknown 1,000 1,029
Resident Survey 2018
16
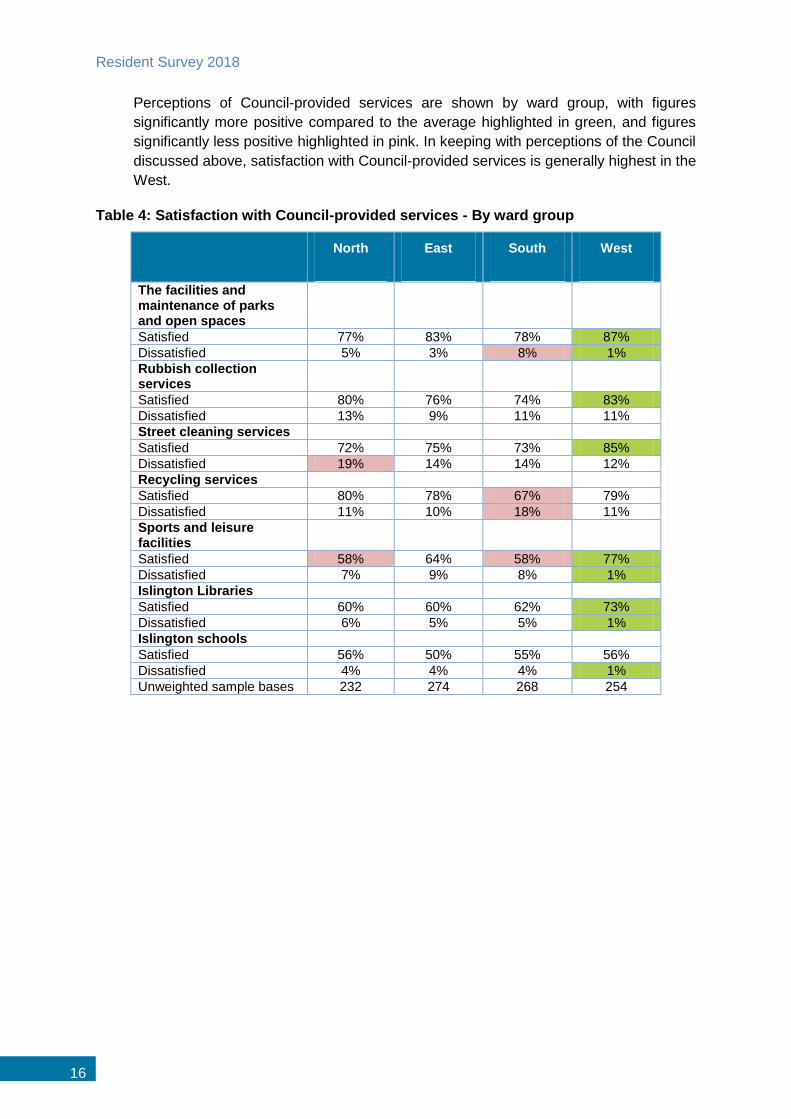
Perceptions of Council-provided services are shown by ward group, with figures
significantly more positive compared to the average highlighted in green, and figures
significantly less positive highlighted in pink. In keeping with perceptions of the Council
discussed above, satisfaction with Council-provided services is generally highest in the
West.
Table 4: Satisfaction with Council-provided services - By ward group
North East South West
The facilities and maintenance of parks and open spaces
Satisfied 77% 83% 78% 87%
Dissatisfied 5% 3% 8% 1%
Rubbish collection services
Satisfied 80% 76% 74% 83%
Dissatisfied 13% 9% 11% 11%
Street cleaning services
Satisfied 72% 75% 73% 85%
Dissatisfied 19% 14% 14% 12%
Recycling services
Satisfied 80% 78% 67% 79%
Dissatisfied 11% 10% 18% 11%
Sports and leisure facilities
Satisfied 58% 64% 58% 77%
Dissatisfied 7% 9% 8% 1%
Islington Libraries
Satisfied 60% 60% 62% 73%
Dissatisfied 6% 5% 5% 1%
Islington schools
Satisfied 56% 50% 55% 56%
Dissatisfied 4% 4% 4% 1%
Unweighted sample bases 232 274 268 254
Council budget and priorities
17
6 Council budget and priorities
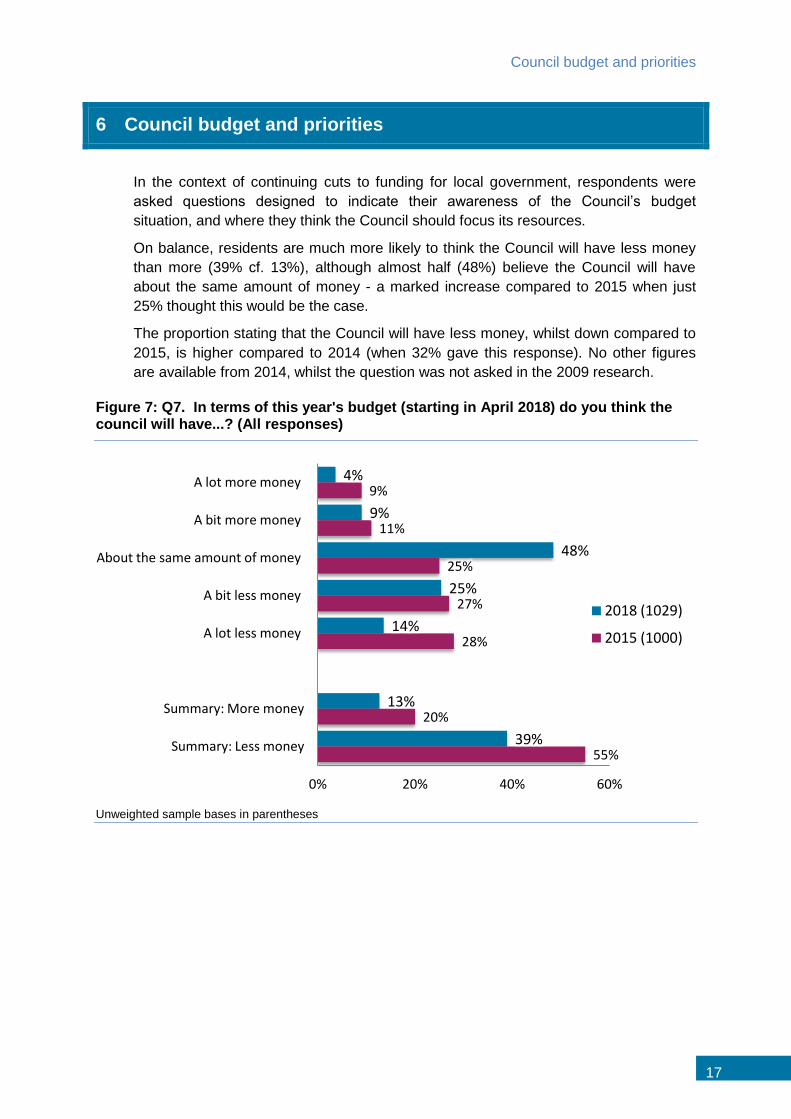
In the context of continuing cuts to funding for local government, respondents were
asked questions designed to indicate their awareness of the Council’s budget
situation, and where they think the Council should focus its resources.
On balance, residents are much more likely to think the Council will have less money
than more (39% cf. 13%), although almost half (48%) believe the Council will have
about the same amount of money - a marked increase compared to 2015 when just
25% thought this would be the case.
The proportion stating that the Council will have less money, whilst down compared to
2015, is higher compared to 2014 (when 32% gave this response). No other figures
are available from 2014, whilst the question was not asked in the 2009 research.
Figure 7: Q7. In terms of this year's budget (starting in April 2018) do you think the council will have...? (All responses)
Unweighted sample bases in parentheses
4%
9%
48%
25%
14%
13%
39%
9%
11%
25%
27%
28%
20%
55%
0% 20% 40% 60%
A lot more money
A bit more money
About the same amount of money
A bit less money
A lot less money
Summary: More money
Summary: Less money
2018 (1029)
2015 (1000)
Resident Survey 2018
18
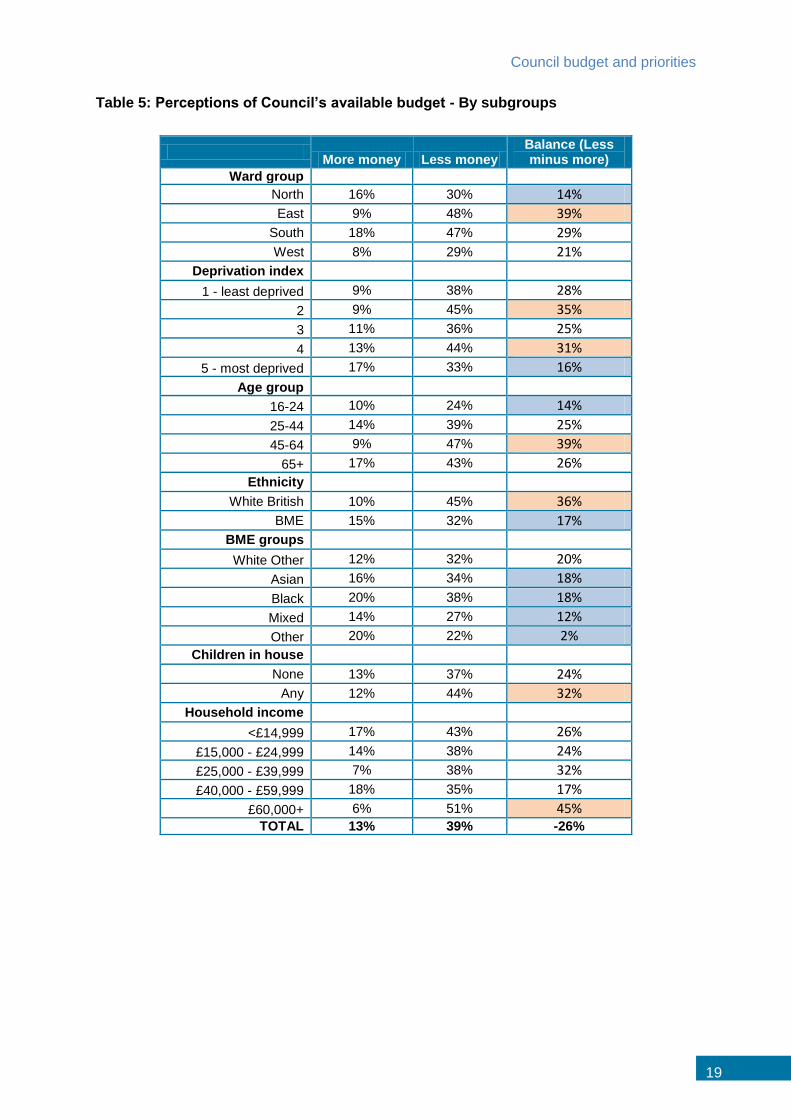
Amongst every subgroup tabulated by BMG, respondents are more likely to believe
the Council will have less money in this year’s budget as opposed to more money. The
table overleaf indicates the proportion of each group who believe the Council will have
more money, the proportion who believe the Council will have less, and the balance
between the two answers. All with a balance of less than 20%, who are therefore less
aware of the budget situation, are highlighted in blue; those with a balance of more
than 30% (more aware) are highlighted in orange.
Any apparent discrepancy in the balance calculation will be due to rounding
differences.
As the table indicates, residents in the North are less likely to be aware of the budget
situation. The same is true of those in the most deprived quintile. Those with a
household income of less than £15,000 are also significantly more likely compared to
the average to believe the Council will have more money, although are also slightly
more likely to believe the Council will have less money. This indicates that some
residents who may be most vulnerable to cuts are still not aware of the Council’s
budget situation.
BME residents also indicate lower awareness of the Council’s budget situation.
Residents with children are significantly more likely, compared to those with none, to
understand that the Council will have less money, and as such may be more aware
that there may be cuts to the services they receive.
In addition to the groups shown below, there are no significant differences in budget
perceptions by gender or disability.
Council budget and priorities
19
Table 5: Perceptions of Council’s available budget - By subgroups
More money Less money
Balance (Less minus more)
Ward group
North 16% 30% 14%
East 9% 48% 39%
South 18% 47% 29%
West 8% 29% 21%
Deprivation index
1 - least deprived 9% 38% 28%
2 9% 45% 35%
3 11% 36% 25%
4 13% 44% 31%
5 - most deprived 17% 33% 16%
Age group
16-24 10% 24% 14%
25-44 14% 39% 25%
45-64 9% 47% 39%
65+ 17% 43% 26%
Ethnicity
White British 10% 45% 36%
BME 15% 32% 17%
BME groups
White Other 12% 32% 20%
Asian 16% 34% 18%
Black 20% 38% 18%
Mixed 14% 27% 12%
Other 20% 22% 2%
Children in house
None 13% 37% 24%
Any 12% 44% 32%
Household income
<£14,999 17% 43% 26%
£15,000 - £24,999 14% 38% 24%
£25,000 - £39,999 7% 38% 32%
£40,000 - £59,999 18% 35% 17%
£60,000+ 6% 51% 45% TOTAL 13% 39% -26%
Resident Survey 2018
20
A source for concern may also be that the awareness of the budget situation does not
correlate with better perceptions of the Council; instead, the reverse appears to be the
case. Raising awareness of the budget challenge the Council faces will not therefore
necessarily lead to more positive perceptions of the Council. For example:
51% of those who disagree the Council is efficient and well run already know the
Council will have less money - compared to just 34% of those who agree the Council
is efficient and well run.
51% of those who disagree the Council provides value for money already know
the Council will have less money - compared to just 33% of those who agree.
Council budget and priorities
21
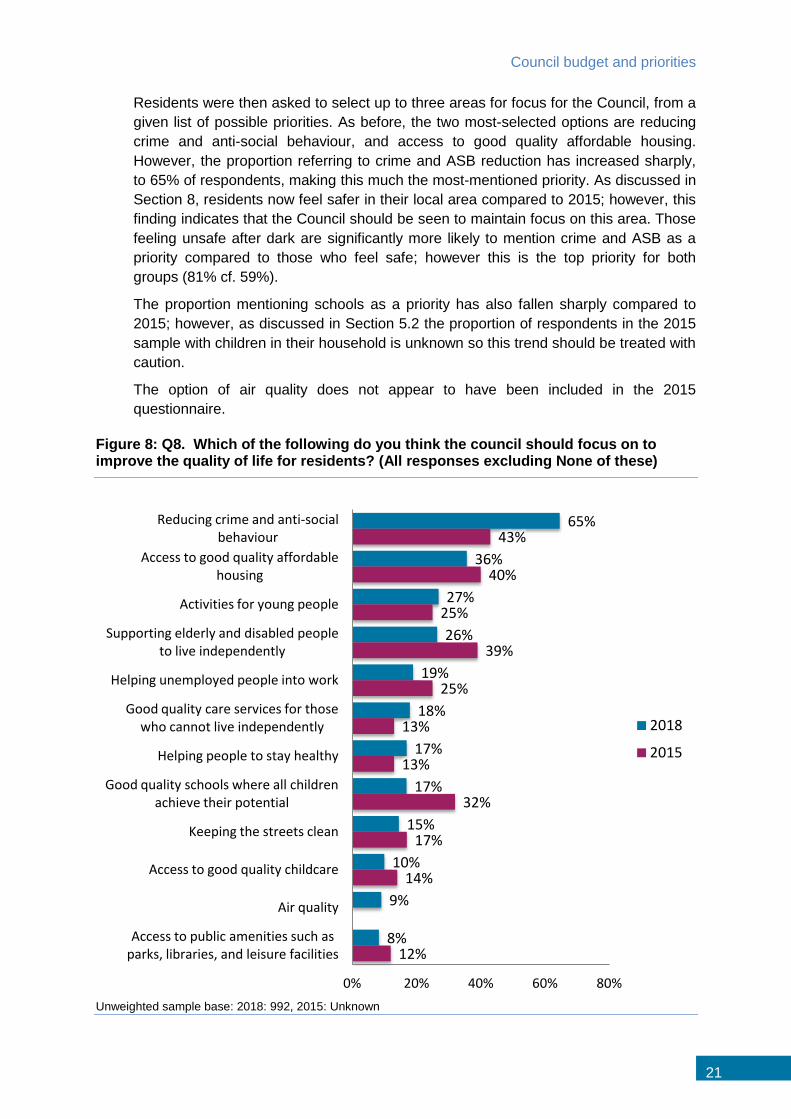
Residents were then asked to select up to three areas for focus for the Council, from a
given list of possible priorities. As before, the two most-selected options are reducing
crime and anti-social behaviour, and access to good quality affordable housing.
However, the proportion referring to crime and ASB reduction has increased sharply,
to 65% of respondents, making this much the most-mentioned priority. As discussed in
Section 8, residents now feel safer in their local area compared to 2015; however, this
finding indicates that the Council should be seen to maintain focus on this area. Those
feeling unsafe after dark are significantly more likely to mention crime and ASB as a
priority compared to those who feel safe; however this is the top priority for both
groups (81% cf. 59%).
The proportion mentioning schools as a priority has also fallen sharply compared to
2015; however, as discussed in Section 5.2 the proportion of respondents in the 2015
sample with children in their household is unknown so this trend should be treated with
caution.
The option of air quality does not appear to have been included in the 2015
questionnaire.
Figure 8: Q8. Which of the following do you think the council should focus on to improve the quality of life for residents? (All responses excluding None of these)
Unweighted sample base: 2018: 992, 2015: Unknown
65%
36%
27%
26%
19%
18%
17%
17%
15%
10%
9%
8%
43%
40%
25%
39%
25%
13%
13%
32%
17%
14%
12%
0% 20% 40% 60% 80%
Reducing crime and anti-social behaviour
Access to good quality affordable housing
Activities for young people
Supporting elderly and disabled people to live independently
Helping unemployed people into work
Good quality care services for those who cannot live independently
Helping people to stay healthy
Good quality schools where all children achieve their potential
Keeping the streets clean
Access to good quality childcare
Air quality
Access to public amenities such as parks, libraries, and leisure facilities
2018
2015
Resident Survey 2018
22
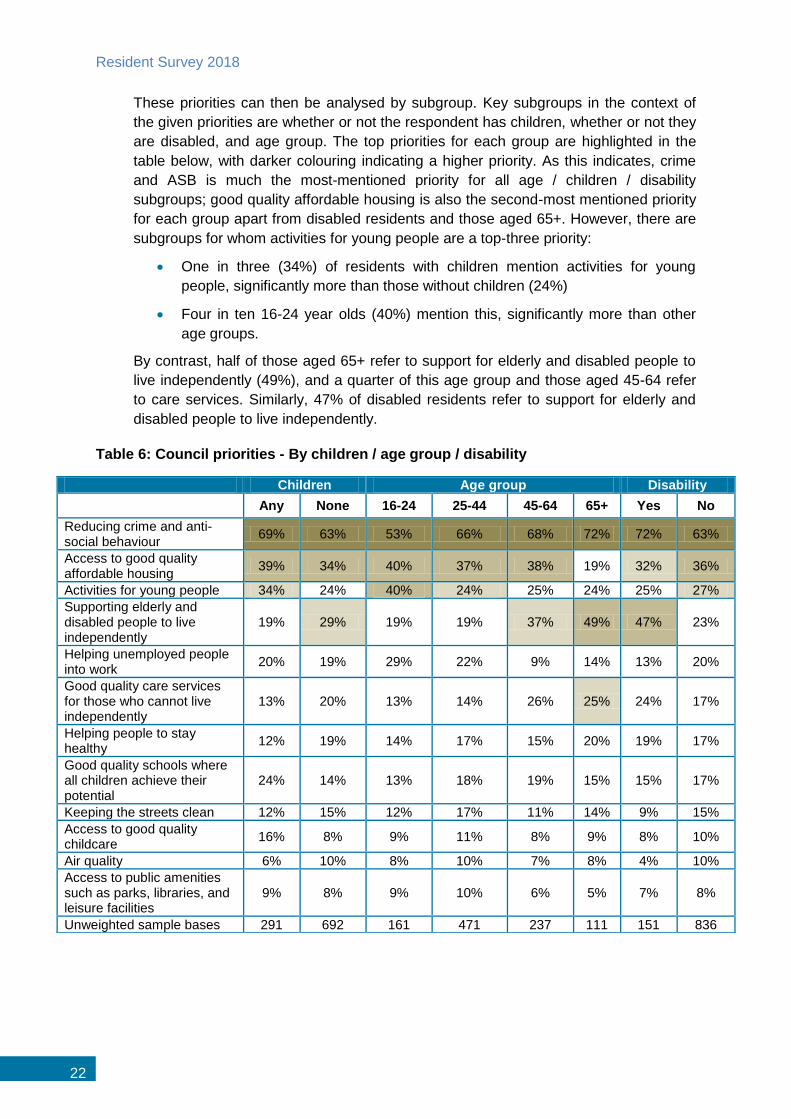
These priorities can then be analysed by subgroup. Key subgroups in the context of
the given priorities are whether or not the respondent has children, whether or not they
are disabled, and age group. The top priorities for each group are highlighted in the
table below, with darker colouring indicating a higher priority. As this indicates, crime
and ASB is much the most-mentioned priority for all age / children / disability
subgroups; good quality affordable housing is also the second-most mentioned priority
for each group apart from disabled residents and those aged 65+. However, there are
subgroups for whom activities for young people are a top-three priority:
One in three (34%) of residents with children mention activities for young
people, significantly more than those without children (24%)
Four in ten 16-24 year olds (40%) mention this, significantly more than other
age groups.
By contrast, half of those aged 65+ refer to support for elderly and disabled people to
live independently (49%), and a quarter of this age group and those aged 45-64 refer
to care services. Similarly, 47% of disabled residents refer to support for elderly and
disabled people to live independently.
Table 6: Council priorities - By children / age group / disability
Children Age group Disability
Any None 16-24 25-44 45-64 65+ Yes No
Reducing crime and anti-social behaviour
69% 63% 53% 66% 68% 72% 72% 63%
Access to good quality affordable housing
39% 34% 40% 37% 38% 19% 32% 36%
Activities for young people 34% 24% 40% 24% 25% 24% 25% 27%
Supporting elderly and disabled people to live independently
19% 29% 19% 19% 37% 49% 47% 23%
Helping unemployed people into work
20% 19% 29% 22% 9% 14% 13% 20%
Good quality care services for those who cannot live independently
13% 20% 13% 14% 26% 25% 24% 17%
Helping people to stay healthy
12% 19% 14% 17% 15% 20% 19% 17%
Good quality schools where all children achieve their potential
24% 14% 13% 18% 19% 15% 15% 17%
Keeping the streets clean 12% 15% 12% 17% 11% 14% 9% 15%
Access to good quality childcare
16% 8% 9% 11% 8% 9% 8% 10%
Air quality 6% 10% 8% 10% 7% 8% 4% 10%
Access to public amenities such as parks, libraries, and leisure facilities
9% 8% 9% 10% 6% 5% 7% 8%
Unweighted sample bases 291 692 161 471 237 111 151 836
Council budget and priorities
23
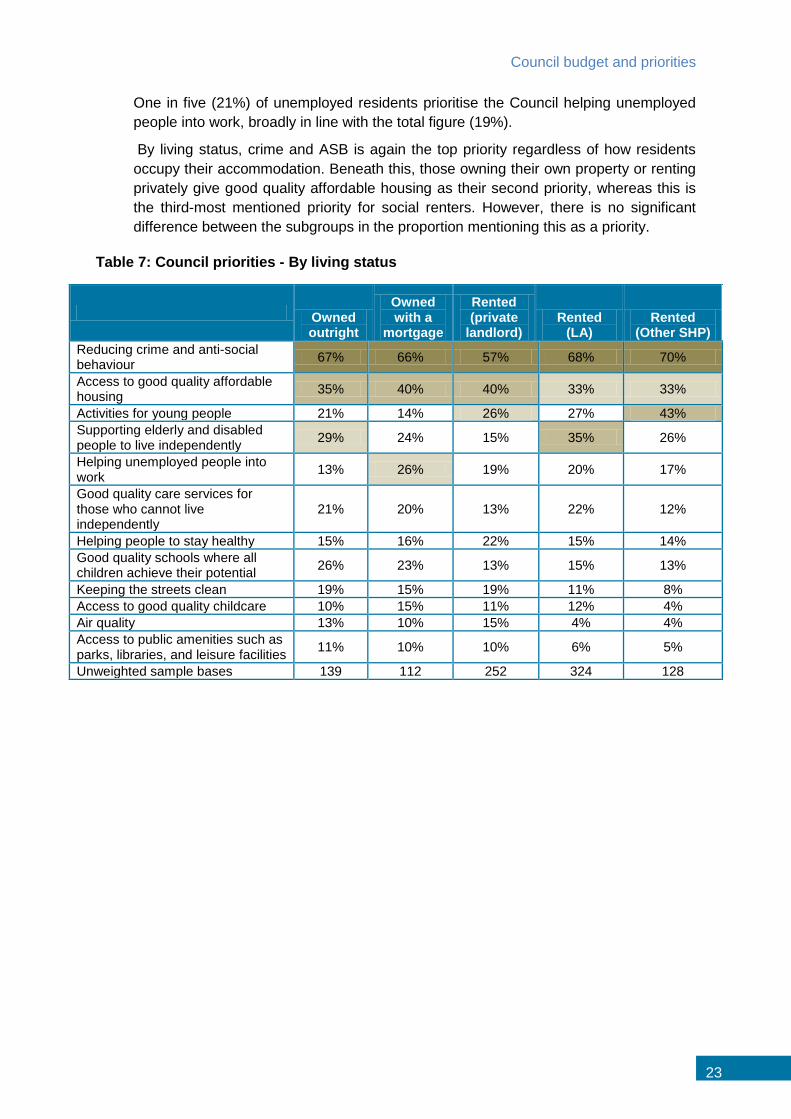
One in five (21%) of unemployed residents prioritise the Council helping unemployed
people into work, broadly in line with the total figure (19%).
By living status, crime and ASB is again the top priority regardless of how residents
occupy their accommodation. Beneath this, those owning their own property or renting
privately give good quality affordable housing as their second priority, whereas this is
the third-most mentioned priority for social renters. However, there is no significant
difference between the subgroups in the proportion mentioning this as a priority.
Table 7: Council priorities - By living status
Owned outright
Owned with a
mortgage
Rented (private
landlord) Rented
(LA) Rented
(Other SHP)
Reducing crime and anti-social behaviour
67% 66% 57% 68% 70%
Access to good quality affordable housing
35% 40% 40% 33% 33%
Activities for young people 21% 14% 26% 27% 43%
Supporting elderly and disabled people to live independently
29% 24% 15% 35% 26%
Helping unemployed people into work
13% 26% 19% 20% 17%
Good quality care services for those who cannot live independently
21% 20% 13% 22% 12%
Helping people to stay healthy 15% 16% 22% 15% 14%
Good quality schools where all children achieve their potential
26% 23% 13% 15% 13%
Keeping the streets clean 19% 15% 19% 11% 8%
Access to good quality childcare 10% 15% 11% 12% 4%
Air quality 13% 10% 15% 4% 4%
Access to public amenities such as parks, libraries, and leisure facilities
11% 10% 10% 6% 5%
Unweighted sample bases 139 112 252 324 128
Resident Survey 2018
24
7 Involvement in local decision making
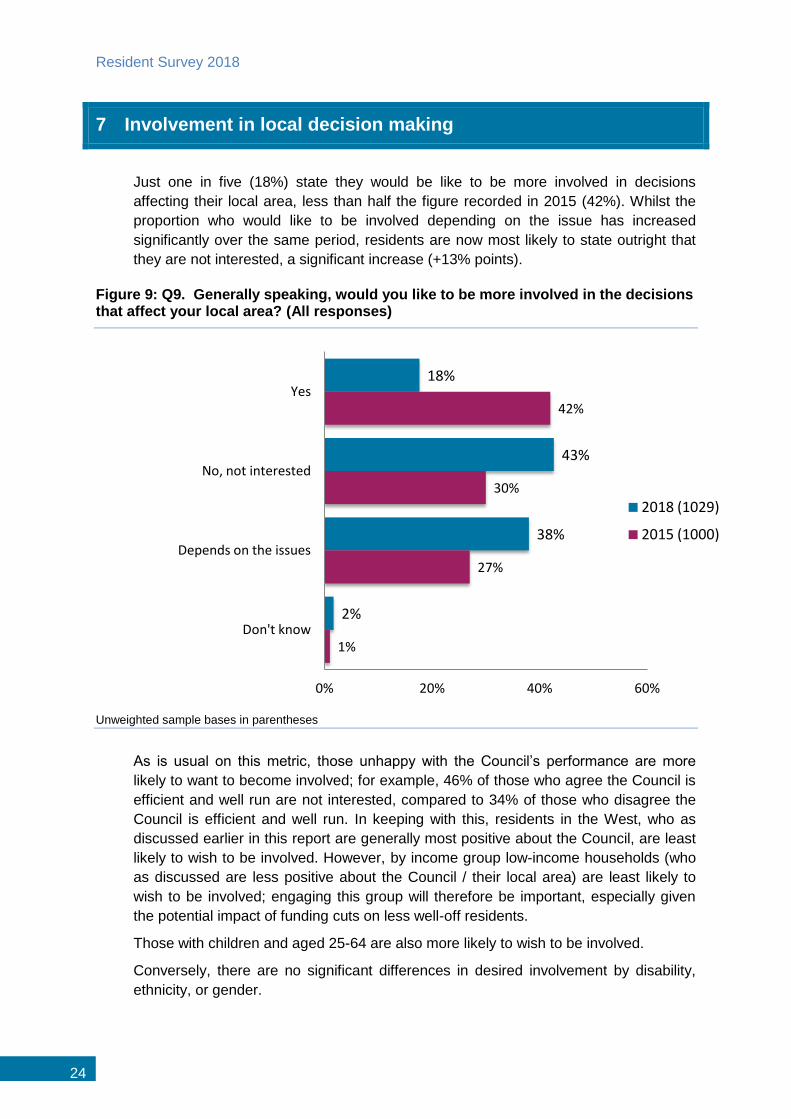
Just one in five (18%) state they would be like to be more involved in decisions
affecting their local area, less than half the figure recorded in 2015 (42%). Whilst the
proportion who would like to be involved depending on the issue has increased
significantly over the same period, residents are now most likely to state outright that
they are not interested, a significant increase (+13% points).
Figure 9: Q9. Generally speaking, would you like to be more involved in the decisions that affect your local area? (All responses)
Unweighted sample bases in parentheses
As is usual on this metric, those unhappy with the Council’s performance are more
likely to want to become involved; for example, 46% of those who agree the Council is
efficient and well run are not interested, compared to 34% of those who disagree the
Council is efficient and well run. In keeping with this, residents in the West, who as
discussed earlier in this report are generally most positive about the Council, are least
likely to wish to be involved. However, by income group low-income households (who
as discussed are less positive about the Council / their local area) are least likely to
wish to be involved; engaging this group will therefore be important, especially given
the potential impact of funding cuts on less well-off residents.
Those with children and aged 25-64 are also more likely to wish to be involved.
Conversely, there are no significant differences in desired involvement by disability,
ethnicity, or gender.
18%
43%
38%
2%
42%
30%
27%
1%
0% 20% 40% 60%
Yes
No, not interested
Depends on the issues
Don't know
2018 (1029)
2015 (1000)
Involvement in local decision making
25
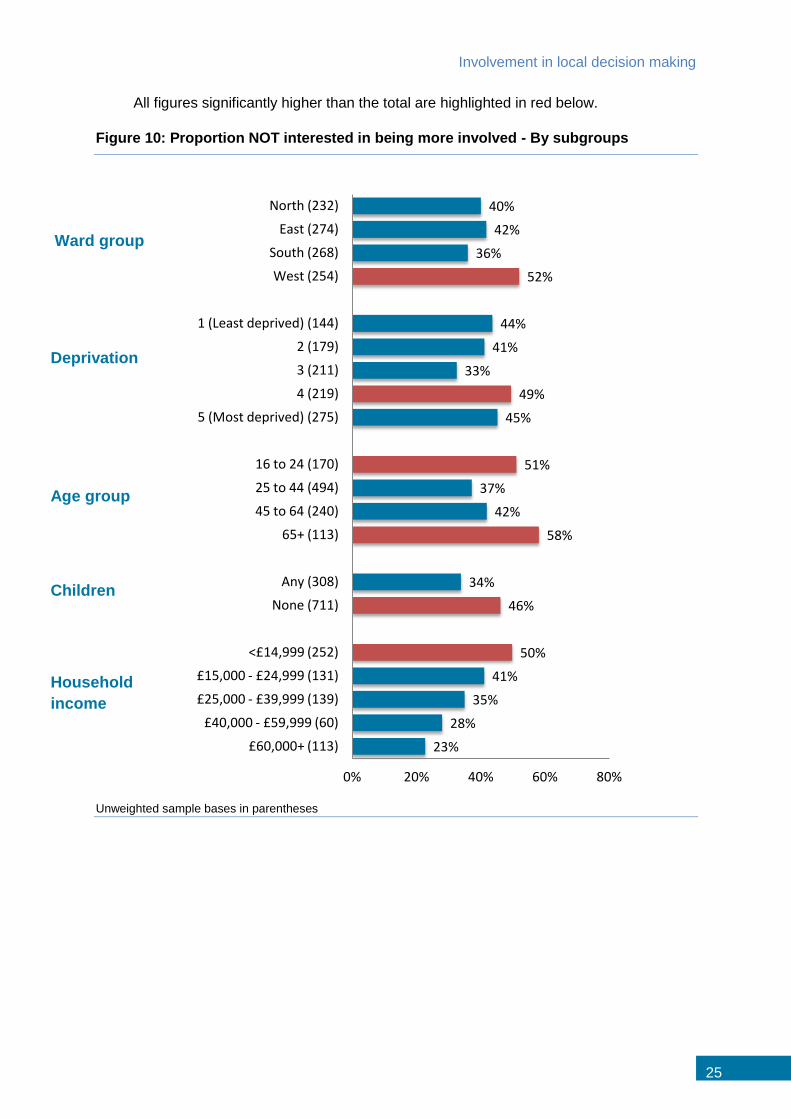
All figures significantly higher than the total are highlighted in red below.
Figure 10: Proportion NOT interested in being more involved - By subgroups
Unweighted sample bases in parentheses
40%
42%
36%
52%
44%
41%
33%
49%
45%
51%
37%
42%
58%
34%
46%
50%
41%
35%
28%
23%
0% 20% 40% 60% 80%
North (232)
East (274)
South (268)
West (254)
1 (Least deprived) (144)
2 (179)
3 (211)
4 (219)
5 (Most deprived) (275)
16 to 24 (170)
25 to 44 (494)
45 to 64 (240)
65+ (113)
Any (308)
None (711)
<£14,999 (252)
£15,000 - £24,999 (131)
£25,000 - £39,999 (139)
£40,000 - £59,999 (60)
£60,000+ (113)
Household
income
Children
Age group
Deprivation
Ward group
Resident Survey 2018
26
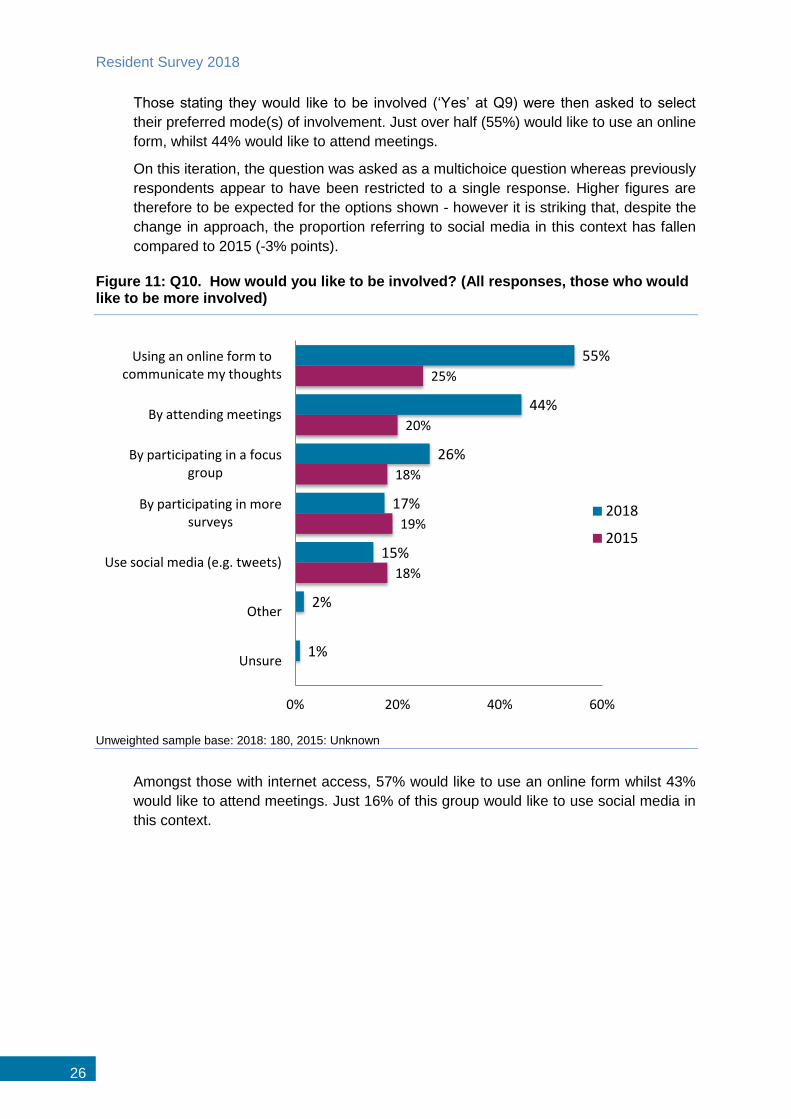
Those stating they would like to be involved (‘Yes’ at Q9) were then asked to select
their preferred mode(s) of involvement. Just over half (55%) would like to use an online
form, whilst 44% would like to attend meetings.
On this iteration, the question was asked as a multichoice question whereas previously
respondents appear to have been restricted to a single response. Higher figures are
therefore to be expected for the options shown - however it is striking that, despite the
change in approach, the proportion referring to social media in this context has fallen
compared to 2015 (-3% points).
Figure 11: Q10. How would you like to be involved? (All responses, those who would like to be more involved)
Unweighted sample base: 2018: 180, 2015: Unknown
Amongst those with internet access, 57% would like to use an online form whilst 43%
would like to attend meetings. Just 16% of this group would like to use social media in
this context.
55%
44%
26%
17%
15%
2%
1%
25%
20%
18%
19%
18%
0% 20% 40% 60%
Using an online form to communicate my thoughts
By attending meetings
By participating in a focus group
By participating in more surveys
Use social media (e.g. tweets)
Other
Unsure
2018
2015
Community cohesion and safety perceptions
27
8 Community cohesion and safety perceptions
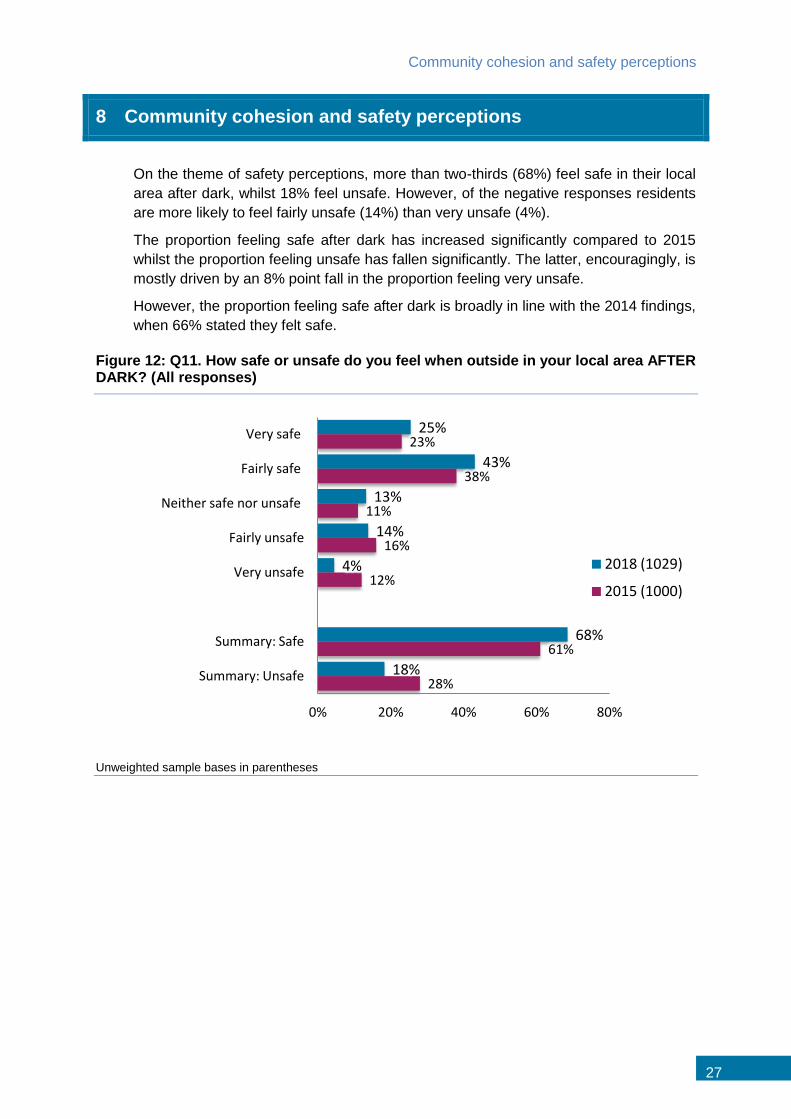
On the theme of safety perceptions, more than two-thirds (68%) feel safe in their local
area after dark, whilst 18% feel unsafe. However, of the negative responses residents
are more likely to feel fairly unsafe (14%) than very unsafe (4%).
The proportion feeling safe after dark has increased significantly compared to 2015
whilst the proportion feeling unsafe has fallen significantly. The latter, encouragingly, is
mostly driven by an 8% point fall in the proportion feeling very unsafe.
However, the proportion feeling safe after dark is broadly in line with the 2014 findings,
when 66% stated they felt safe.
Figure 12: Q11. How safe or unsafe do you feel when outside in your local area AFTER DARK? (All responses)
Unweighted sample bases in parentheses
25%
43%
13%
14%
4%
68%
18%
23%
38%
11%
16%
12%
61%
28%
0% 20% 40% 60% 80%
Very safe
Fairly safe
Neither safe nor unsafe
Fairly unsafe
Very unsafe
Summary: Safe
Summary: Unsafe
2018 (1029)
2015 (1000)
Resident Survey 2018
28
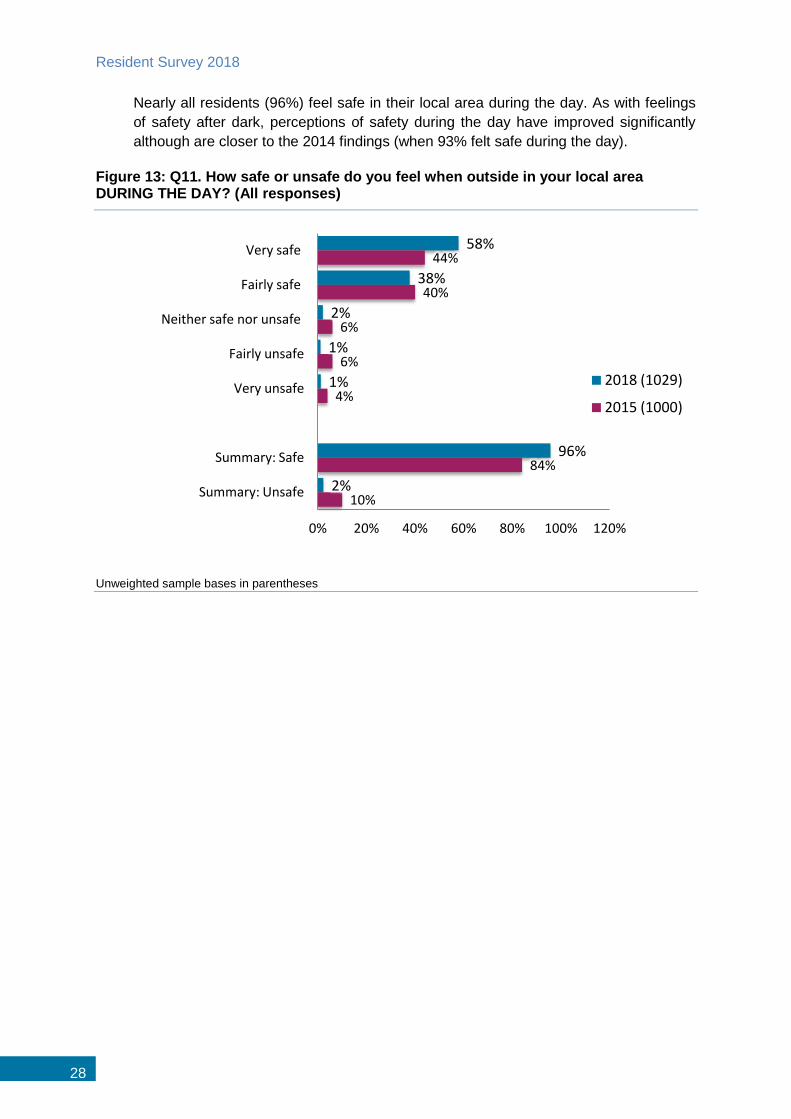
Nearly all residents (96%) feel safe in their local area during the day. As with feelings
of safety after dark, perceptions of safety during the day have improved significantly
although are closer to the 2014 findings (when 93% felt safe during the day).
Figure 13: Q11. How safe or unsafe do you feel when outside in your local area DURING THE DAY? (All responses)
Unweighted sample bases in parentheses
58%
38%
2%
1%
1%
96%
2%
44%
40%
6%
6%
4%
84%
10%
0% 20% 40% 60% 80% 100% 120%
Very safe
Fairly safe
Neither safe nor unsafe
Fairly unsafe
Very unsafe
Summary: Safe
Summary: Unsafe
2018 (1029)
2015 (1000)
Community cohesion and safety perceptions
29
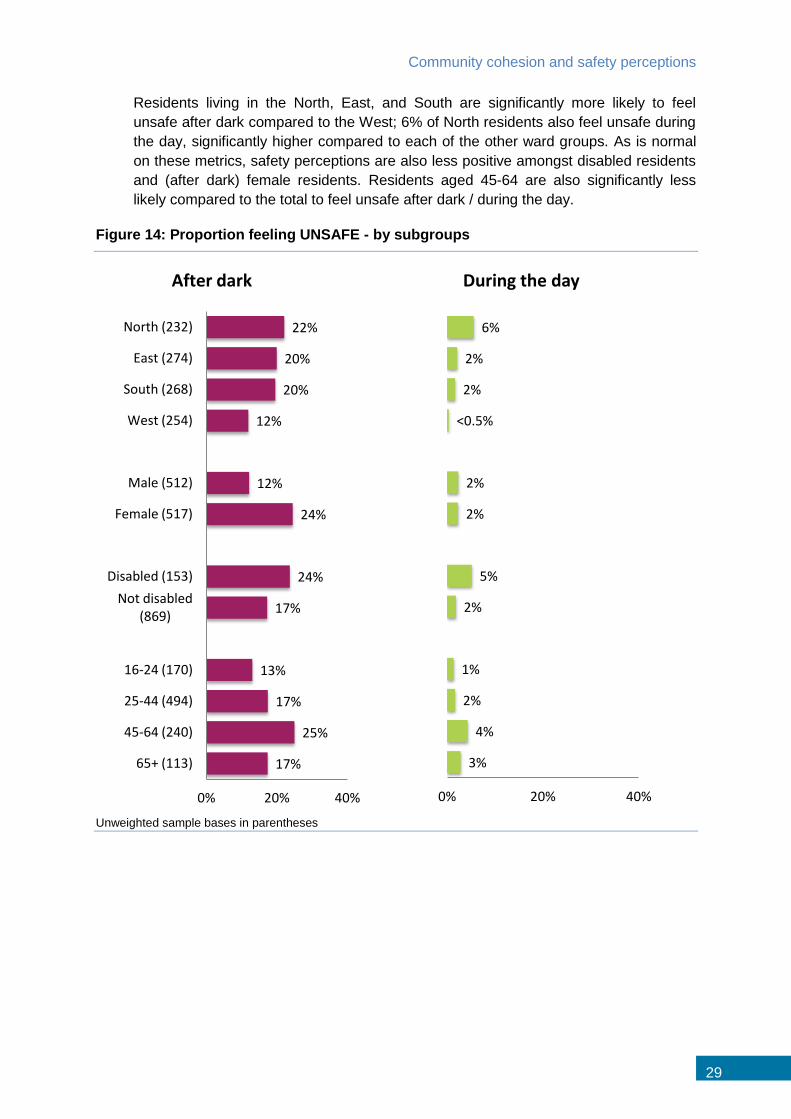
Residents living in the North, East, and South are significantly more likely to feel
unsafe after dark compared to the West; 6% of North residents also feel unsafe during
the day, significantly higher compared to each of the other ward groups. As is normal
on these metrics, safety perceptions are also less positive amongst disabled residents
and (after dark) female residents. Residents aged 45-64 are also significantly less
likely compared to the total to feel unsafe after dark / during the day.
Figure 14: Proportion feeling UNSAFE - by subgroups
Unweighted sample bases in parentheses
22%
20%
20%
12%
12%
24%
24%
17%
13%
17%
25%
17%
0% 20% 40%
North (232)
East (274)
South (268)
West (254)
Male (512)
Female (517)
Disabled (153)
Not disabled (869)
16-24 (170)
25-44 (494)
45-64 (240)
65+ (113)
After dark
6%
2%
2%
<0.5%
2%
2%
5%
2%
1%
2%
4%
3%
0% 20% 40%
During the day
Resident Survey 2018
30
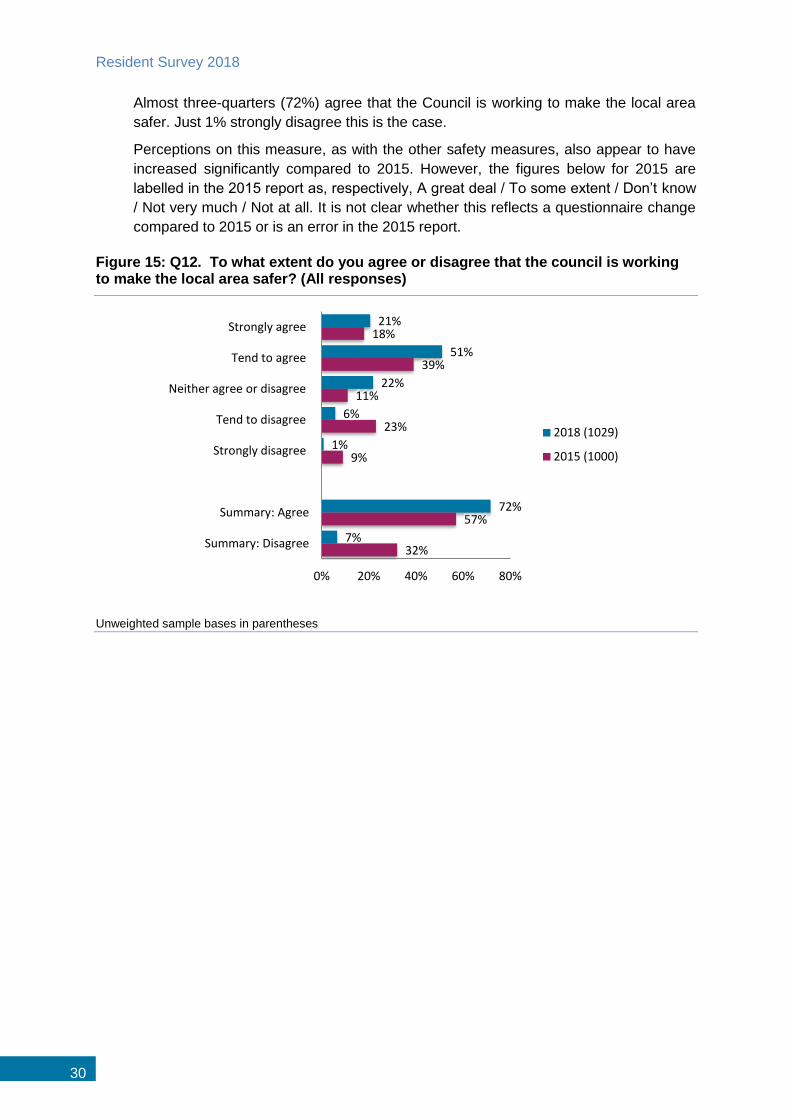
Almost three-quarters (72%) agree that the Council is working to make the local area
safer. Just 1% strongly disagree this is the case.
Perceptions on this measure, as with the other safety measures, also appear to have
increased significantly compared to 2015. However, the figures below for 2015 are
labelled in the 2015 report as, respectively, A great deal / To some extent / Don’t know
/ Not very much / Not at all. It is not clear whether this reflects a questionnaire change
compared to 2015 or is an error in the 2015 report.
Figure 15: Q12. To what extent do you agree or disagree that the council is working to make the local area safer? (All responses)
Unweighted sample bases in parentheses
21%
51%
22%
6%
1%
72%
7%
18%
39%
11%
23%
9%
57%
32%
0% 20% 40% 60% 80%
Strongly agree
Tend to agree
Neither agree or disagree
Tend to disagree
Strongly disagree
Summary: Agree
Summary: Disagree
2018 (1029)
2015 (1000)
Community cohesion and safety perceptions
31
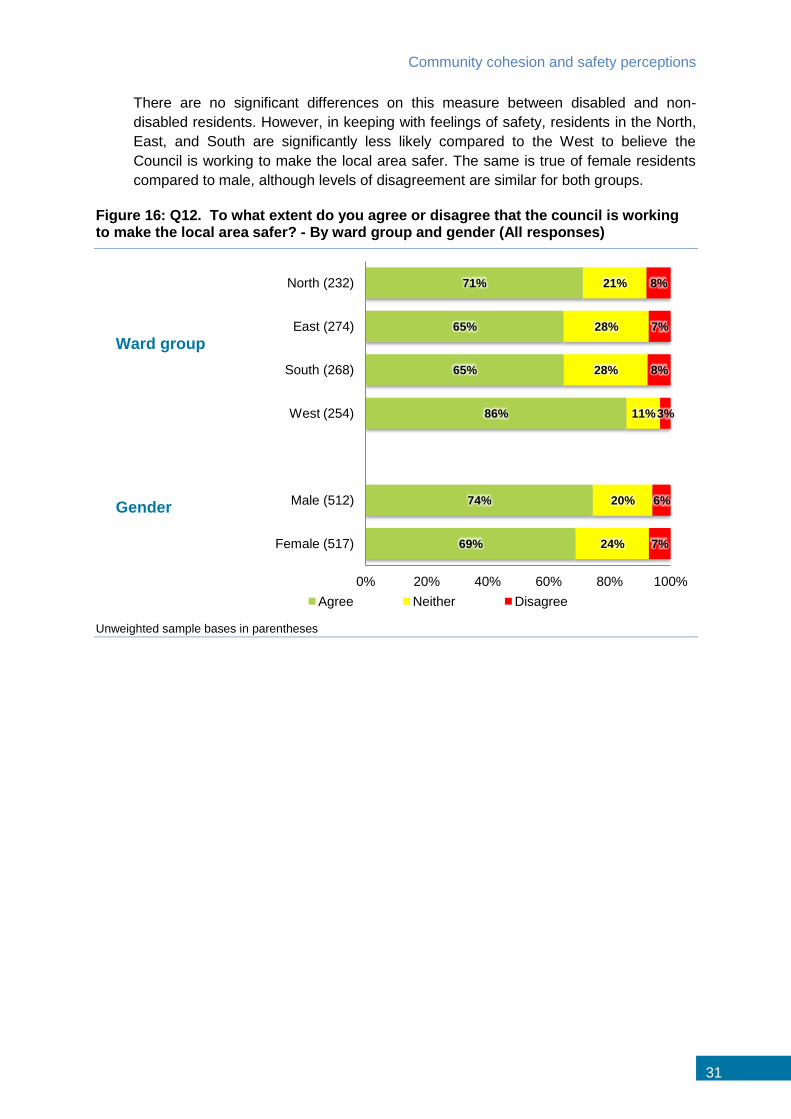
There are no significant differences on this measure between disabled and non-
disabled residents. However, in keeping with feelings of safety, residents in the North,
East, and South are significantly less likely compared to the West to believe the
Council is working to make the local area safer. The same is true of female residents
compared to male, although levels of disagreement are similar for both groups.
Figure 16: Q12. To what extent do you agree or disagree that the council is working to make the local area safer? - By ward group and gender (All responses)
Unweighted sample bases in parentheses
71%
65%
65%
86%
74%
69%
21%
28%
28%
11%
20%
24%
8%
7%
8%
3%
6%
7%
0% 20% 40% 60% 80% 100%
North (232)
East (274)
South (268)
West (254)
Male (512)
Female (517)
Agree Neither Disagree
Ward group
Gender
Resident Survey 2018
32
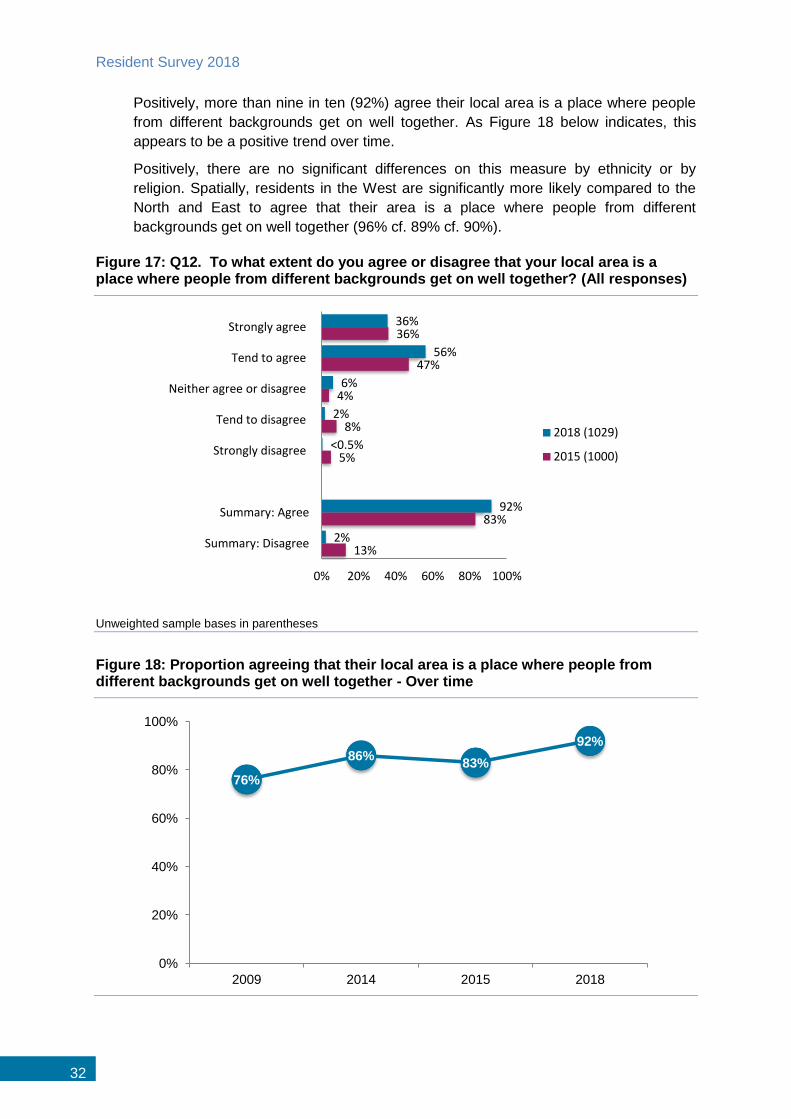
Positively, more than nine in ten (92%) agree their local area is a place where people
from different backgrounds get on well together. As Figure 18 below indicates, this
appears to be a positive trend over time.
Positively, there are no significant differences on this measure by ethnicity or by
religion. Spatially, residents in the West are significantly more likely compared to the
North and East to agree that their area is a place where people from different
backgrounds get on well together (96% cf. 89% cf. 90%).
Figure 17: Q12. To what extent do you agree or disagree that your local area is a place where people from different backgrounds get on well together? (All responses)
Unweighted sample bases in parentheses
Figure 18: Proportion agreeing that their local area is a place where people from different backgrounds get on well together - Over time
36%
56%
6%
2%
<0.5%
92%
2%
36%
47%
4%
8%
5%
83%
13%
0% 20% 40% 60% 80% 100%
Strongly agree
Tend to agree
Neither agree or disagree
Tend to disagree
Strongly disagree
Summary: Agree
Summary: Disagree
2018 (1029)
2015 (1000)
76%
86% 83%
92%
0%
20%
40%
60%
80%
100%
2009 2014 2015 2018
Economic and cost of living help
33
9 Economic and cost of living help
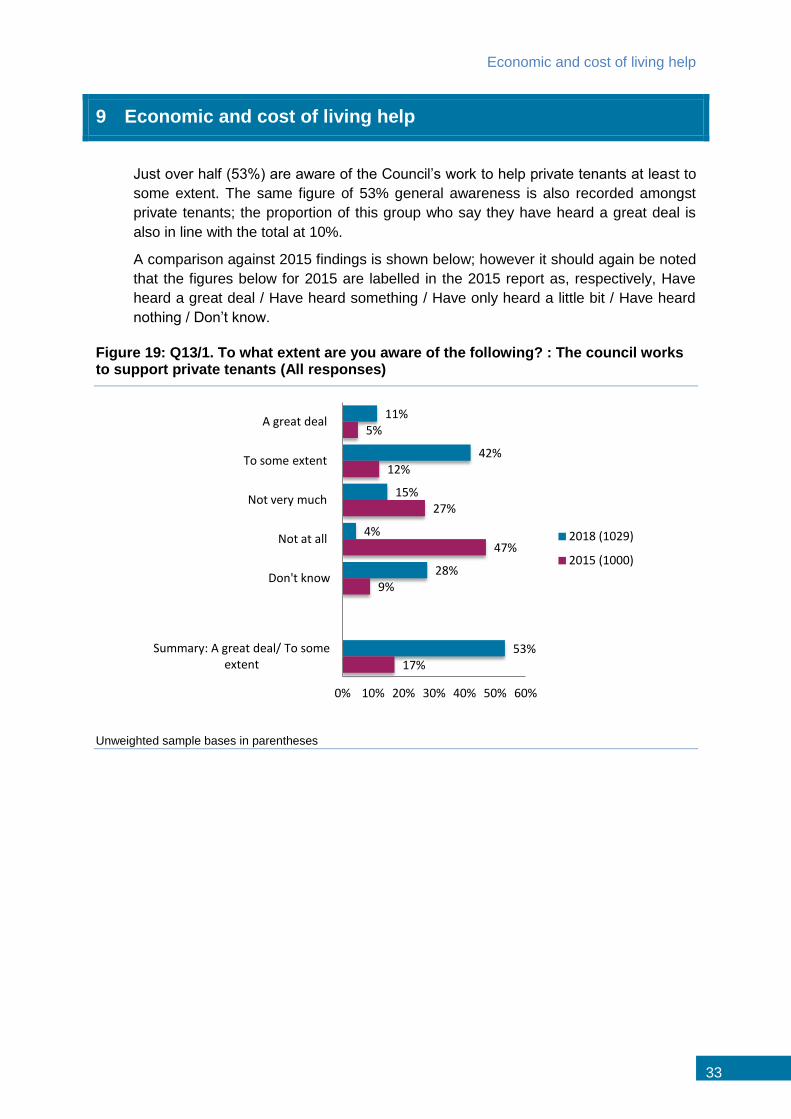
Just over half (53%) are aware of the Council’s work to help private tenants at least to
some extent. The same figure of 53% general awareness is also recorded amongst
private tenants; the proportion of this group who say they have heard a great deal is
also in line with the total at 10%.
A comparison against 2015 findings is shown below; however it should again be noted
that the figures below for 2015 are labelled in the 2015 report as, respectively, Have
heard a great deal / Have heard something / Have only heard a little bit / Have heard
nothing / Don’t know.
Figure 19: Q13/1. To what extent are you aware of the following? : The council works to support private tenants (All responses)
Unweighted sample bases in parentheses
11%
42%
15%
4%
28%
53%
5%
12%
27%
47%
9%
17%
0% 10% 20% 30% 40% 50% 60%
A great deal
To some extent
Not very much
Not at all
Don't know
Summary: A great deal/ To some extent
2018 (1029)
2015 (1000)
Resident Survey 2018
34
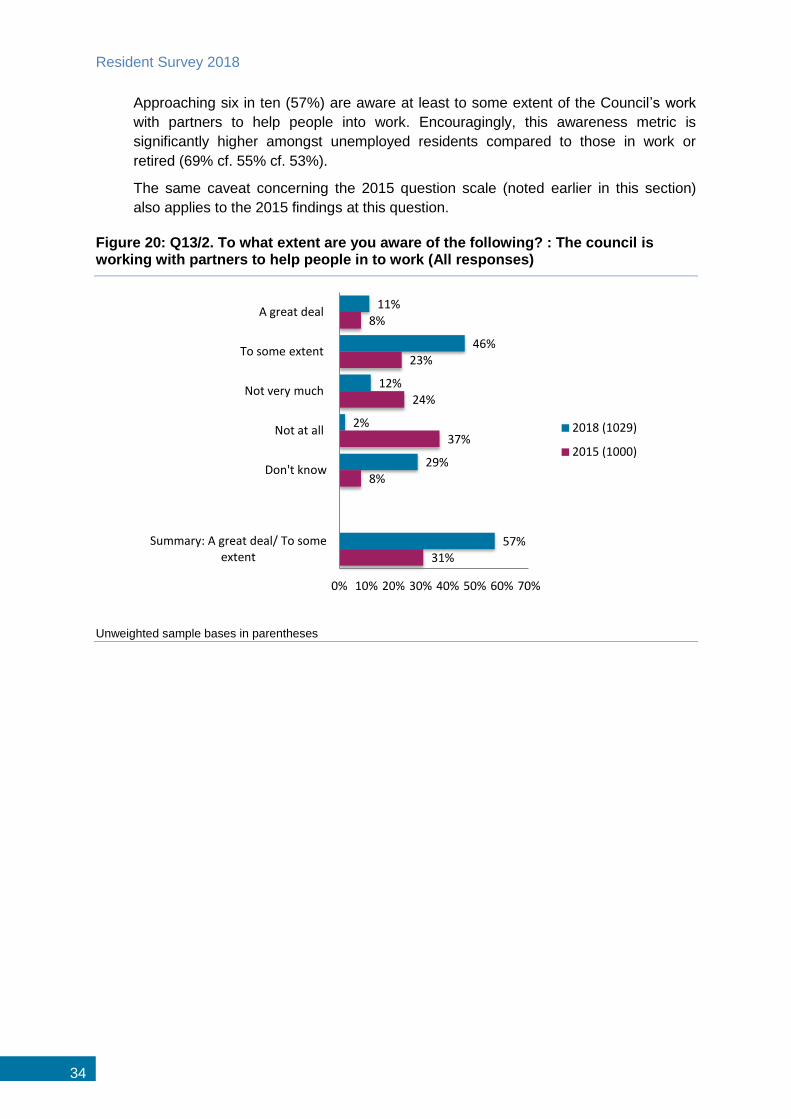
Approaching six in ten (57%) are aware at least to some extent of the Council’s work
with partners to help people into work. Encouragingly, this awareness metric is
significantly higher amongst unemployed residents compared to those in work or
retired (69% cf. 55% cf. 53%).
The same caveat concerning the 2015 question scale (noted earlier in this section)
also applies to the 2015 findings at this question.
Figure 20: Q13/2. To what extent are you aware of the following? : The council is working with partners to help people in to work (All responses)
Unweighted sample bases in parentheses
11%
46%
12%
2%
29%
57%
8%
23%
24%
37%
8%
31%
0% 10% 20% 30% 40% 50% 60% 70%
A great deal
To some extent
Not very much
Not at all
Don't know
Summary: A great deal/ To some extent
2018 (1029)
2015 (1000)
Economic and cost of living help
35
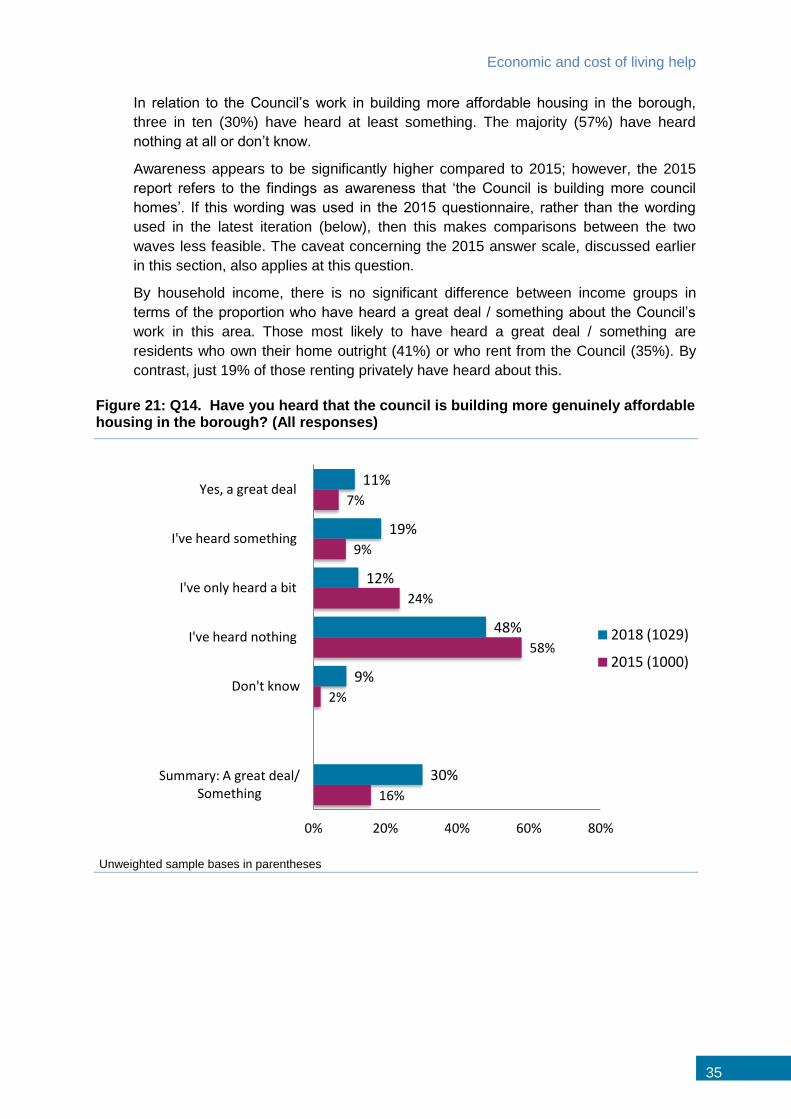
In relation to the Council’s work in building more affordable housing in the borough,
three in ten (30%) have heard at least something. The majority (57%) have heard
nothing at all or don’t know.
Awareness appears to be significantly higher compared to 2015; however, the 2015
report refers to the findings as awareness that ‘the Council is building more council
homes’. If this wording was used in the 2015 questionnaire, rather than the wording
used in the latest iteration (below), then this makes comparisons between the two
waves less feasible. The caveat concerning the 2015 answer scale, discussed earlier
in this section, also applies at this question.
By household income, there is no significant difference between income groups in
terms of the proportion who have heard a great deal / something about the Council’s
work in this area. Those most likely to have heard a great deal / something are
residents who own their home outright (41%) or who rent from the Council (35%). By
contrast, just 19% of those renting privately have heard about this.
Figure 21: Q14. Have you heard that the council is building more genuinely affordable housing in the borough? (All responses)
Unweighted sample bases in parentheses
11%
19%
12%
48%
9%
30%
7%
9%
24%
58%
2%
16%
0% 20% 40% 60% 80%
Yes, a great deal
I've heard something
I've only heard a bit
I've heard nothing
Don't know
Summary: A great deal/ Something
2018 (1029)
2015 (1000)
Resident Survey 2018
36
On the theme of cost of living, respondents were shown a list of schemes that the
Council is engaged in to help potentially less well off residents. As the figure below
indicates, much the most high-profile schemes are energy saving schemes (40%) and
free school meals (31%). These were also the most-mentioned schemes in the 2015
research; however, awareness of all schemes has fallen significantly compared to
2015.
The question on Council Tax discounts for older people appears not to have been
included in the 2015 research.
Figure 22: Q15. The council is trying to help residents cope with the rising cost of living. Which of the following are you aware of? (All responses)
Unweighted sample bases in parentheses
40%
31%
16%
14%
13%
13%
12%
11%
11%
9%
40%
45%
55%
29%
36%
28%
25%
31%
21%
22%
20%
0% 20% 40% 60%
Energy saving schemes
Free school meals for all primary and nursery school pupils
Islington's London Living Wage Campaign
Financial and debt advice
Credit Union
Cracking down on pay day lenders
£100 Council Tax Discounts for households with older people (aged
over 65)
Bursaries for low income families for childcare and for young people
to stay in education post 16
Advice on fuel debt
Campaigns against loan sharks
Aware of none of these
2018 (1029)
2015 (1000)
Economic and cost of living help
37
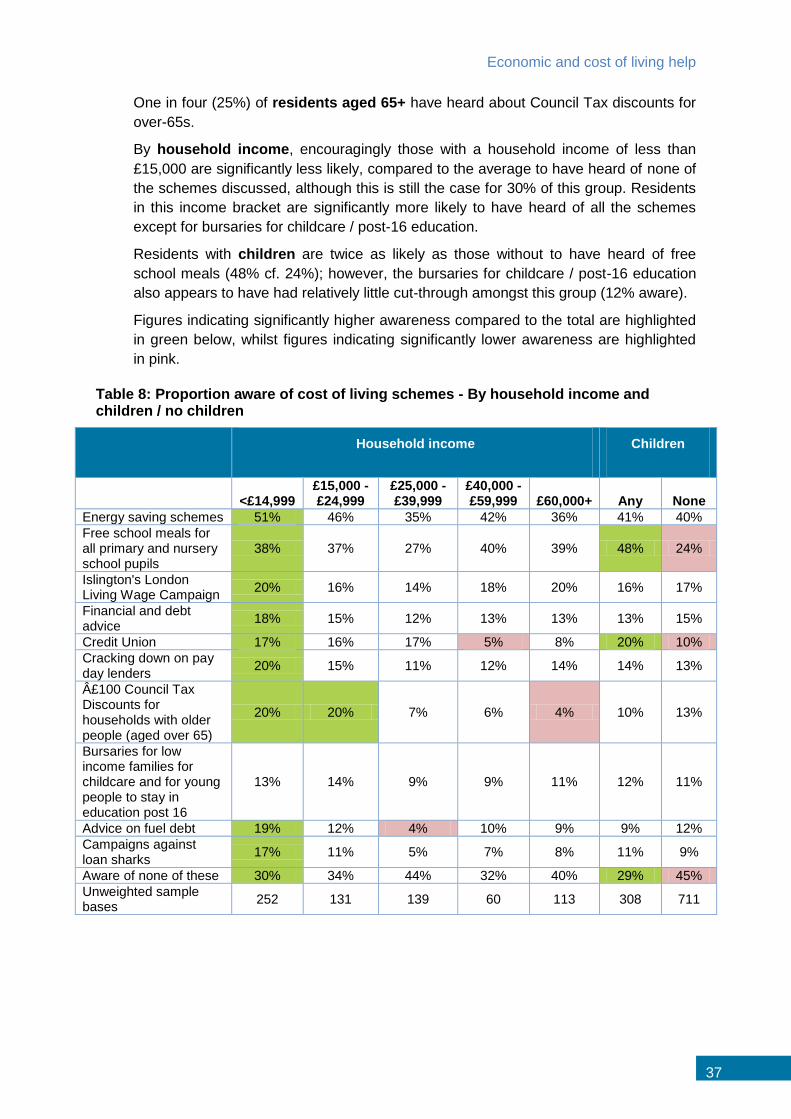
One in four (25%) of residents aged 65+ have heard about Council Tax discounts for
over-65s.
By household income, encouragingly those with a household income of less than
£15,000 are significantly less likely, compared to the average to have heard of none of
the schemes discussed, although this is still the case for 30% of this group. Residents
in this income bracket are significantly more likely to have heard of all the schemes
except for bursaries for childcare / post-16 education.
Residents with children are twice as likely as those without to have heard of free
school meals (48% cf. 24%); however, the bursaries for childcare / post-16 education
also appears to have had relatively little cut-through amongst this group (12% aware).
Figures indicating significantly higher awareness compared to the total are highlighted
in green below, whilst figures indicating significantly lower awareness are highlighted
in pink.
Table 8: Proportion aware of cost of living schemes - By household income and children / no children
Household income Children
<£14,999
£15,000 - £24,999
£25,000 - £39,999
£40,000 - £59,999 £60,000+ Any None
Energy saving schemes 51% 46% 35% 42% 36% 41% 40%
Free school meals for all primary and nursery school pupils
38% 37% 27% 40% 39% 48% 24%
Islington's London Living Wage Campaign
20% 16% 14% 18% 20% 16% 17%
Financial and debt advice
18% 15% 12% 13% 13% 13% 15%
Credit Union 17% 16% 17% 5% 8% 20% 10%
Cracking down on pay day lenders
20% 15% 11% 12% 14% 14% 13%
£100 Council Tax Discounts for households with older people (aged over 65)
20% 20% 7% 6% 4% 10% 13%
Bursaries for low income families for childcare and for young people to stay in education post 16
13% 14% 9% 9% 11% 12% 11%
Advice on fuel debt 19% 12% 4% 10% 9% 9% 12%
Campaigns against loan sharks
17% 11% 5% 7% 8% 11% 9%
Aware of none of these 30% 34% 44% 32% 40% 29% 45%
Unweighted sample bases
252 131 139 60 113 308 711
Resident Survey 2018
38
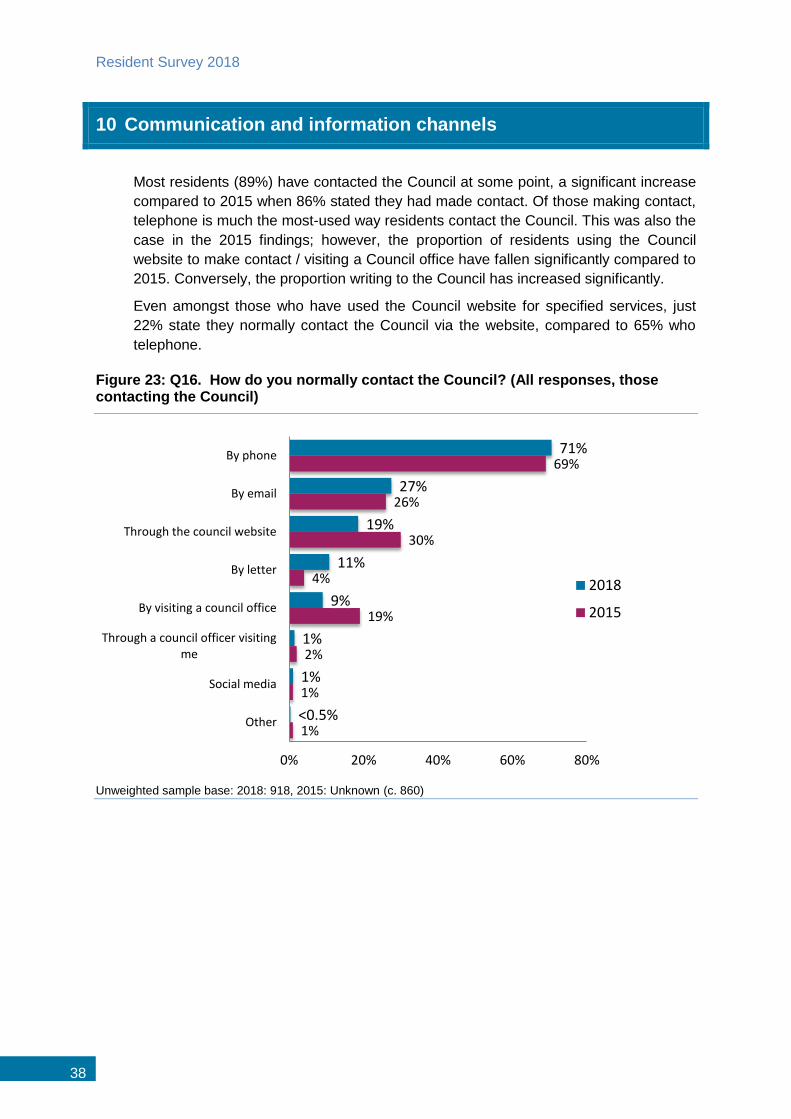
10 Communication and information channels
Most residents (89%) have contacted the Council at some point, a significant increase
compared to 2015 when 86% stated they had made contact. Of those making contact,
telephone is much the most-used way residents contact the Council. This was also the
case in the 2015 findings; however, the proportion of residents using the Council
website to make contact / visiting a Council office have fallen significantly compared to
2015. Conversely, the proportion writing to the Council has increased significantly.
Even amongst those who have used the Council website for specified services, just
22% state they normally contact the Council via the website, compared to 65% who
telephone.
Figure 23: Q16. How do you normally contact the Council? (All responses, those contacting the Council)
Unweighted sample base: 2018: 918, 2015: Unknown (c. 860)
71%
27%
19%
11%
9%
1%
1%
<0.5%
69%
26%
30%
4%
19%
2%
1%
1%
0% 20% 40% 60% 80%
By phone
By email
Through the council website
By letter
By visiting a council office
Through a council officer visiting me
Social media
Other
2018
2015
Communication and information channels
39
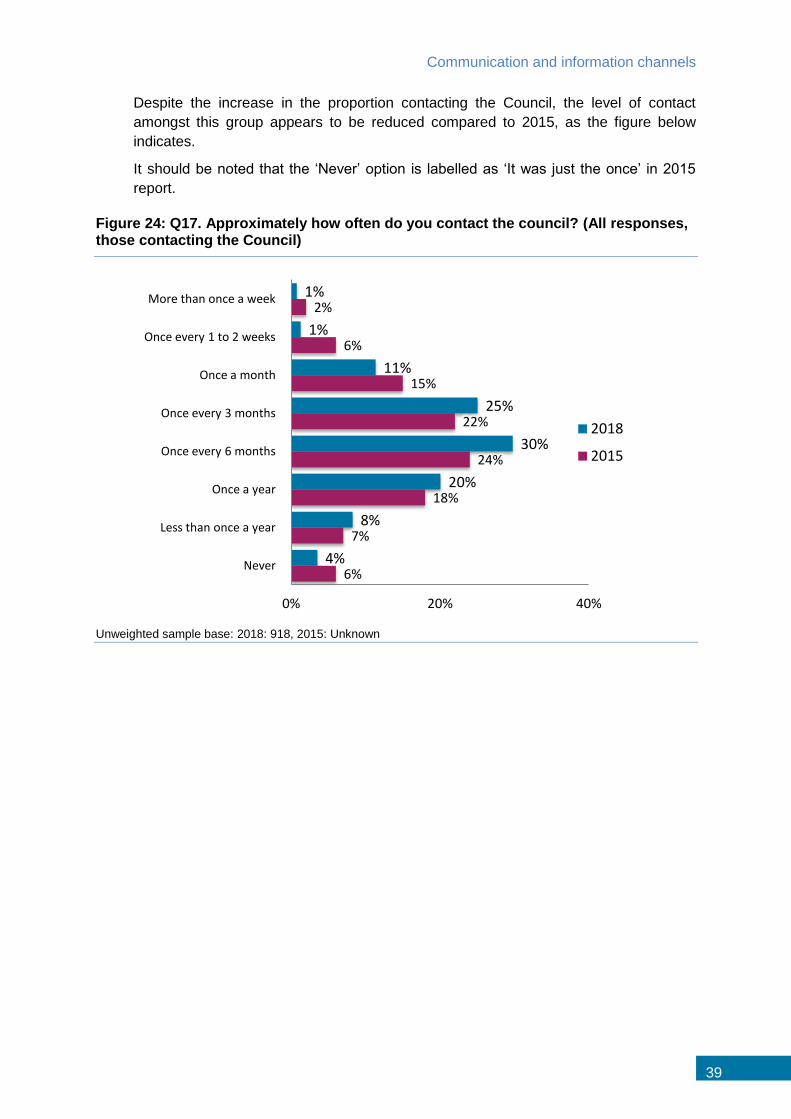
Despite the increase in the proportion contacting the Council, the level of contact
amongst this group appears to be reduced compared to 2015, as the figure below
indicates.
It should be noted that the ‘Never’ option is labelled as ‘It was just the once’ in 2015
report.
Figure 24: Q17. Approximately how often do you contact the council? (All responses, those contacting the Council)
Unweighted sample base: 2018: 918, 2015: Unknown
1%
1%
11%
25%
30%
20%
8%
4%
2%
6%
15%
22%
24%
18%
7%
6%
0% 20% 40%
More than once a week
Once every 1 to 2 weeks
Once a month
Once every 3 months
Once every 6 months
Once a year
Less than once a year
Never
2018
2015
Resident Survey 2018
40
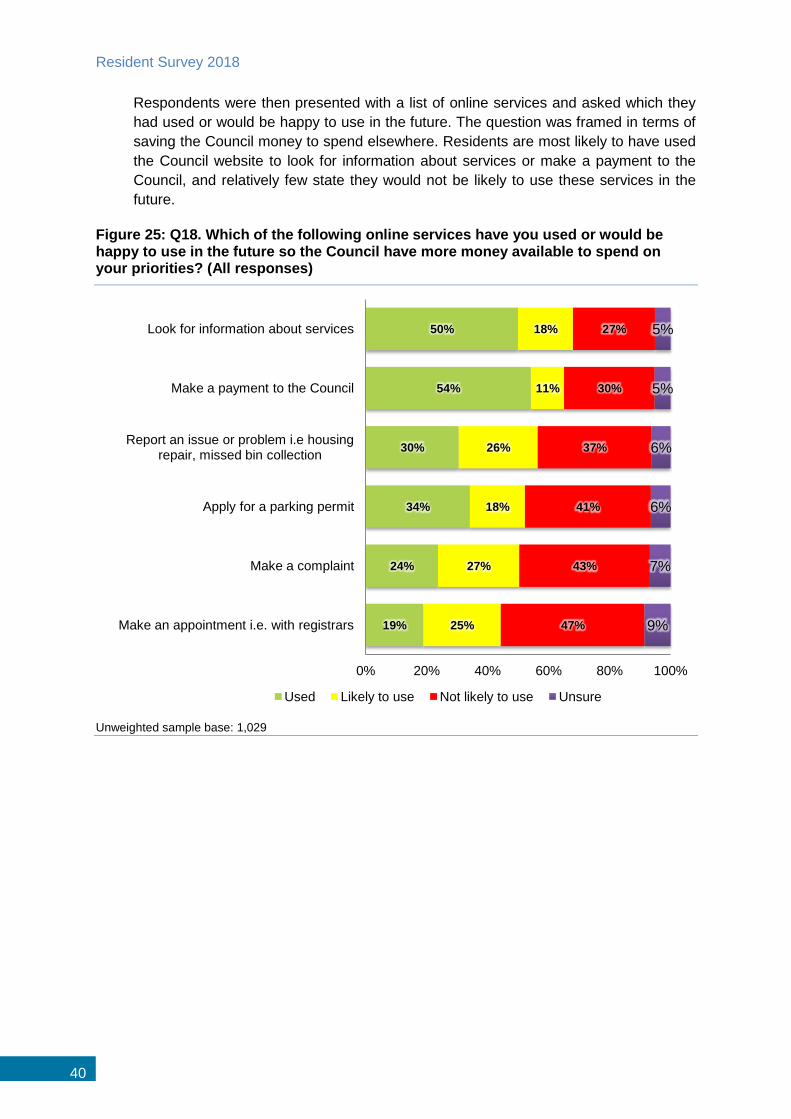
Respondents were then presented with a list of online services and asked which they
had used or would be happy to use in the future. The question was framed in terms of
saving the Council money to spend elsewhere. Residents are most likely to have used
the Council website to look for information about services or make a payment to the
Council, and relatively few state they would not be likely to use these services in the
future.
Figure 25: Q18. Which of the following online services have you used or would be happy to use in the future so the Council have more money available to spend on your priorities? (All responses)
Unweighted sample base: 1,029
50%
54%
30%
34%
24%
19%
18%
11%
26%
18%
27%
25%
27%
30%
37%
41%
43%
47%
5%
5%
6%
6%
7%
9%
0% 20% 40% 60% 80% 100%
Look for information about services
Make a payment to the Council
Report an issue or problem i.e housing repair, missed bin collection
Apply for a parking permit
Make a complaint
Make an appointment i.e. with registrars
Used Likely to use Not likely to use Unsure
Communication and information channels
41
These findings may well reflect how likely residents are to feel they are to require the
service as well as their attitude to the Council website - for example, non-drivers may
not anticipate needing a parking permit at any point in the future. However, by
combining responses to all these services, a picture can be built up of residents’
general willingness to use the website. Two-thirds (65%) have already used the
Council website for at least one of the services shown; however 22% are not likely to
use the website for any of the purposes shown.
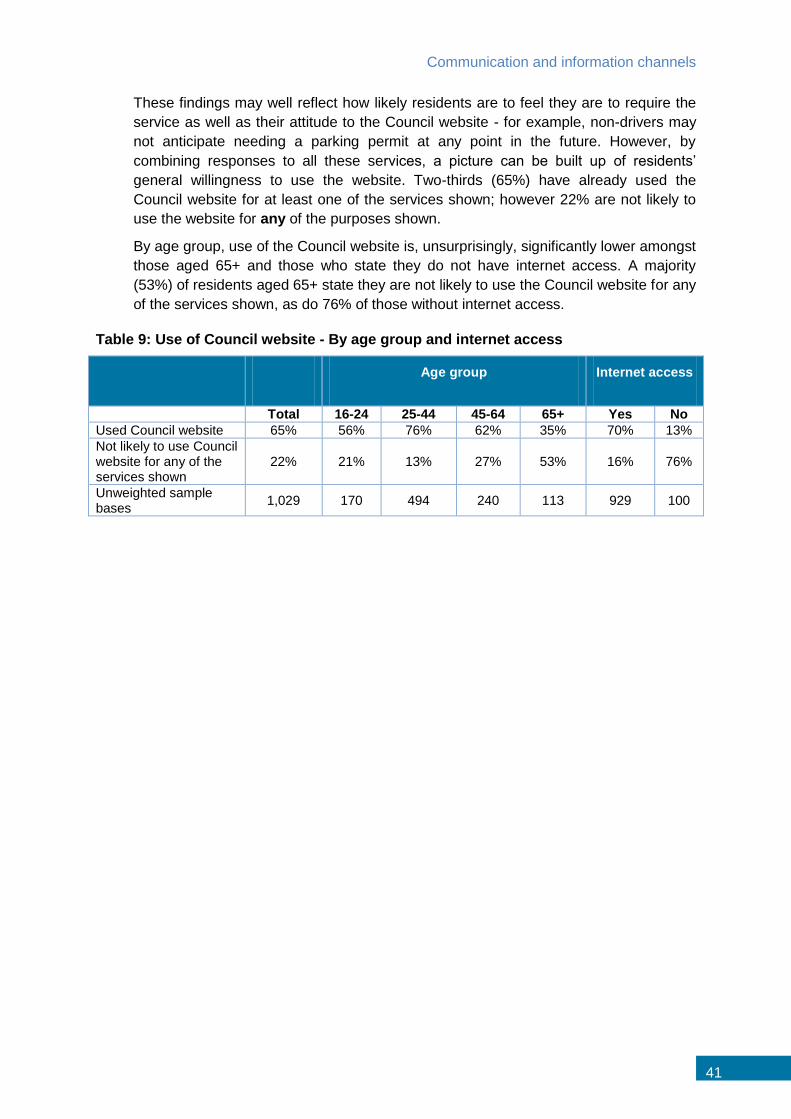
By age group, use of the Council website is, unsurprisingly, significantly lower amongst
those aged 65+ and those who state they do not have internet access. A majority
(53%) of residents aged 65+ state they are not likely to use the Council website for any
of the services shown, as do 76% of those without internet access.
Table 9: Use of Council website - By age group and internet access
Age group Internet access
Total 16-24 25-44 45-64 65+ Yes No
Used Council website 65% 56% 76% 62% 35% 70% 13%
Not likely to use Council website for any of the services shown
22% 21% 13% 27% 53% 16% 76%
Unweighted sample bases
1,029 170 494 240 113 929 100
Resident Survey 2018
42
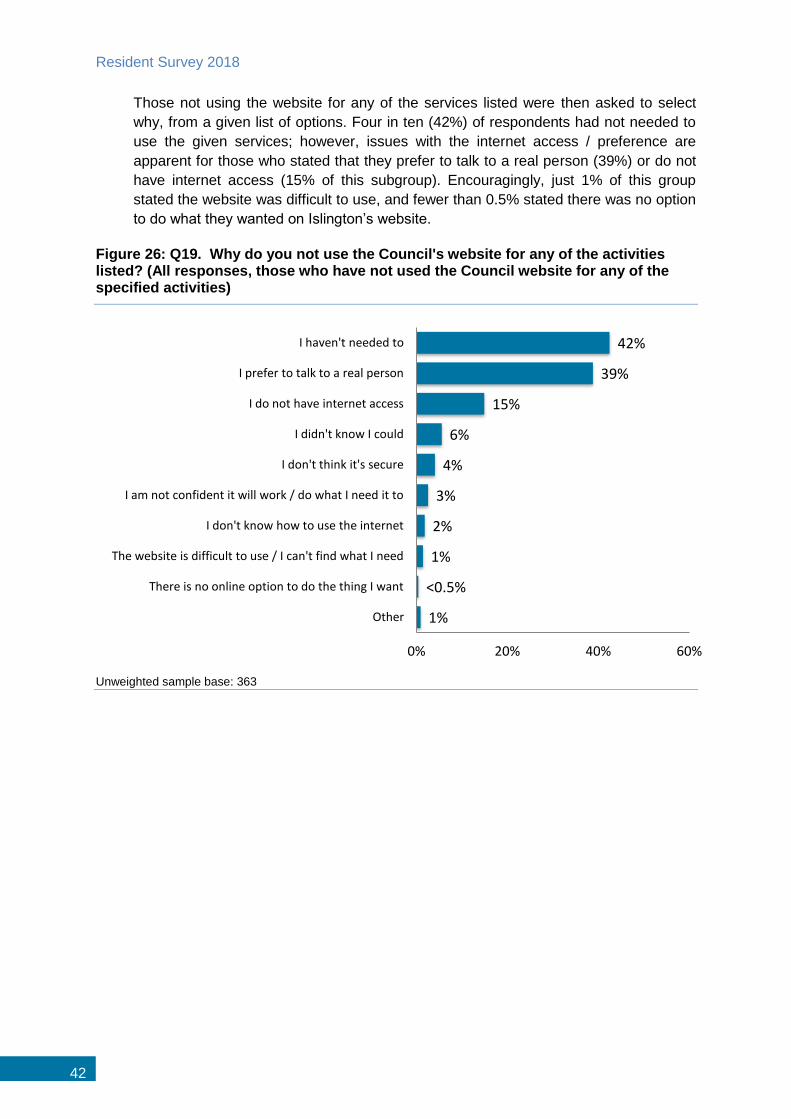
Those not using the website for any of the services listed were then asked to select
why, from a given list of options. Four in ten (42%) of respondents had not needed to
use the given services; however, issues with the internet access / preference are
apparent for those who stated that they prefer to talk to a real person (39%) or do not
have internet access (15% of this subgroup). Encouragingly, just 1% of this group
stated the website was difficult to use, and fewer than 0.5% stated there was no option
to do what they wanted on Islington’s website.
Figure 26: Q19. Why do you not use the Council's website for any of the activities listed? (All responses, those who have not used the Council website for any of the specified activities)
Unweighted sample base: 363
42%
39%
15%
6%
4%
3%
2%
1%
<0.5%
1%
0% 20% 40% 60%
I haven't needed to
I prefer to talk to a real person
I do not have internet access
I didn't know I could
I don't think it's secure
I am not confident it will work / do what I need it to
I don't know how to use the internet
The website is difficult to use / I can't find what I need
There is no online option to do the thing I want
Other
Communication and information channels
43
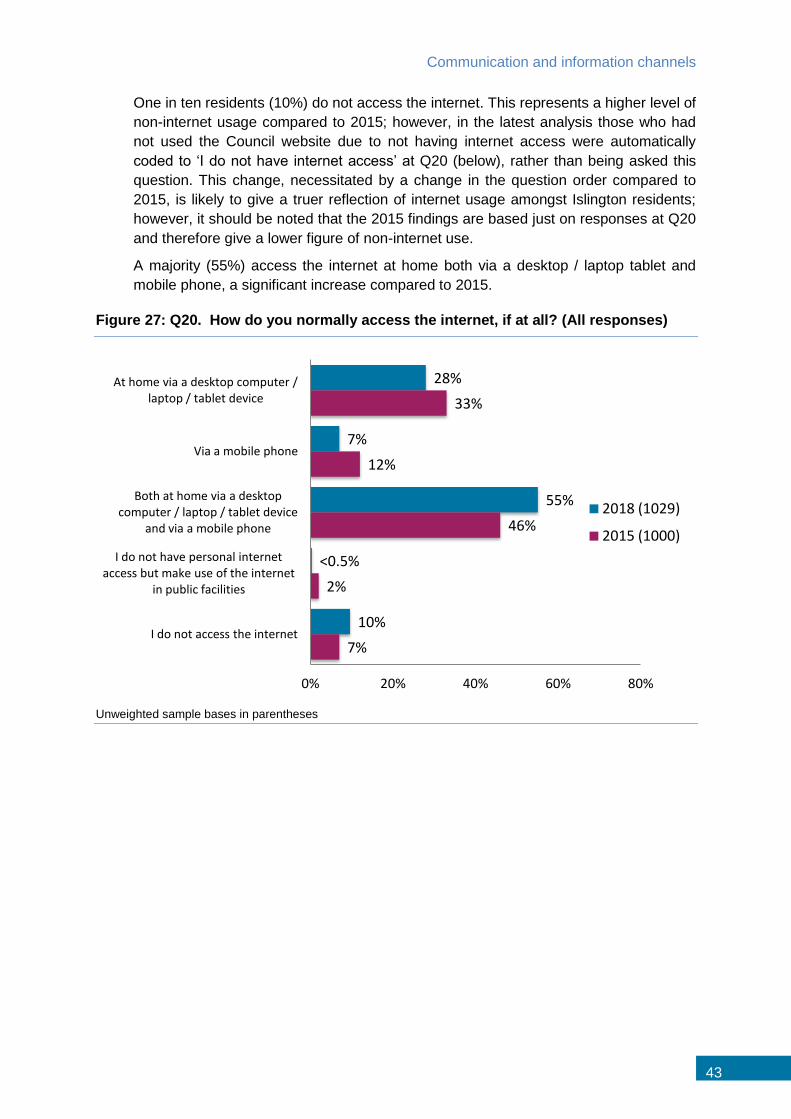
One in ten residents (10%) do not access the internet. This represents a higher level of
non-internet usage compared to 2015; however, in the latest analysis those who had
not used the Council website due to not having internet access were automatically
coded to ‘I do not have internet access’ at Q20 (below), rather than being asked this
question. This change, necessitated by a change in the question order compared to
2015, is likely to give a truer reflection of internet usage amongst Islington residents;
however, it should be noted that the 2015 findings are based just on responses at Q20
and therefore give a lower figure of non-internet use.
A majority (55%) access the internet at home both via a desktop / laptop tablet and
mobile phone, a significant increase compared to 2015.
Figure 27: Q20. How do you normally access the internet, if at all? (All responses)
Unweighted sample bases in parentheses
28%
7%
55%
<0.5%
10%
33%
12%
46%
2%
7%
0% 20% 40% 60% 80%
At home via a desktop computer / laptop / tablet device
Via a mobile phone
Both at home via a desktop computer / laptop / tablet device
and via a mobile phone
I do not have personal internet access but make use of the internet
in public facilities
I do not access the internet
2018 (1029)
2015 (1000)
Resident Survey 2018
44
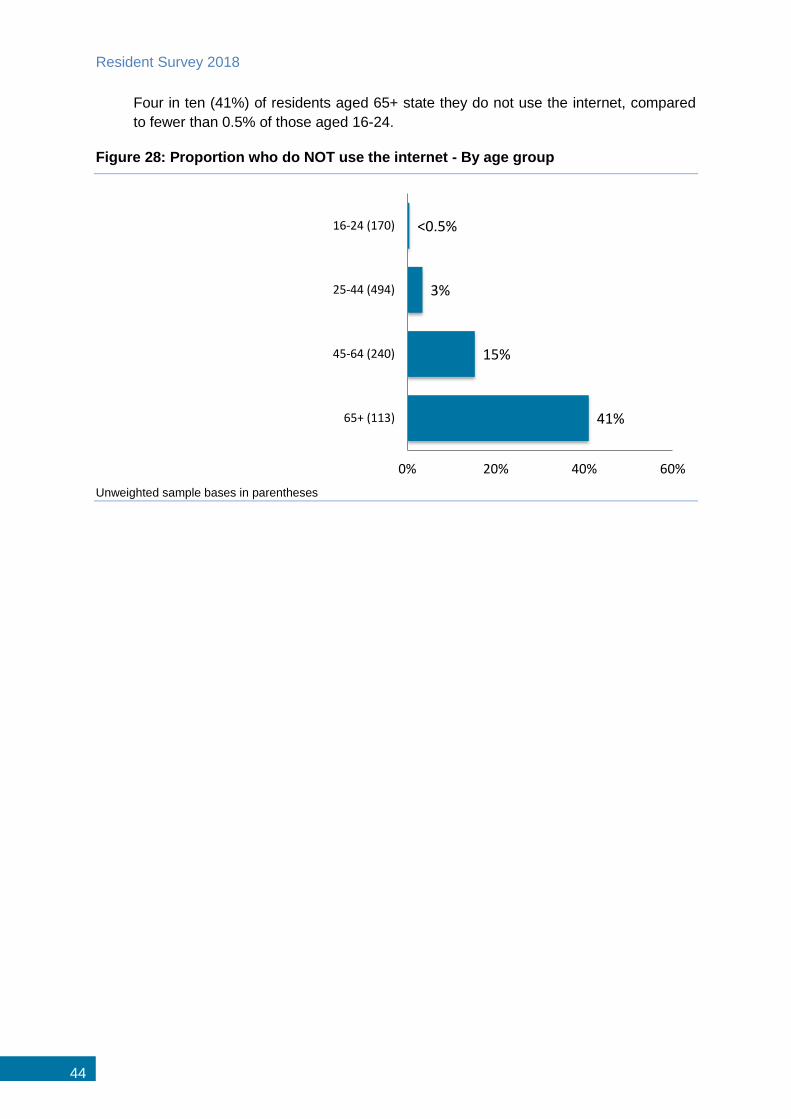
Four in ten (41%) of residents aged 65+ state they do not use the internet, compared
to fewer than 0.5% of those aged 16-24.
Figure 28: Proportion who do NOT use the internet - By age group
Unweighted sample bases in parentheses
<0.5%
3%
15%
41%
0% 20% 40% 60%
16-24 (170)
25-44 (494)
45-64 (240)
65+ (113)
Communication and information channels
45
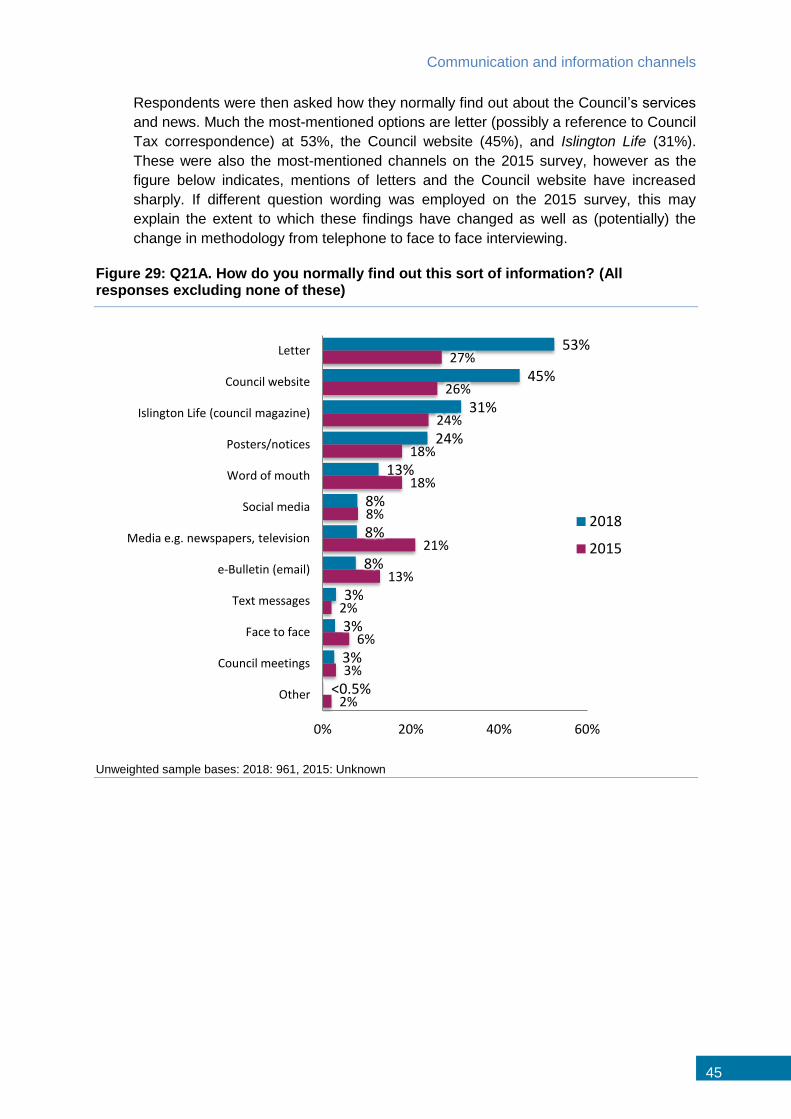
Respondents were then asked how they normally find out about the Council’s services
and news. Much the most-mentioned options are letter (possibly a reference to Council
Tax correspondence) at 53%, the Council website (45%), and Islington Life (31%).
These were also the most-mentioned channels on the 2015 survey, however as the
figure below indicates, mentions of letters and the Council website have increased
sharply. If different question wording was employed on the 2015 survey, this may
explain the extent to which these findings have changed as well as (potentially) the
change in methodology from telephone to face to face interviewing.
Figure 29: Q21A. How do you normally find out this sort of information? (All responses excluding none of these)
Unweighted sample bases: 2018: 961, 2015: Unknown
53%
45%
31%
24%
13%
8%
8%
8%
3%
3%
3%
<0.5%
27%
26%
24%
18%
18%
8%
21%
13%
2%
6%
3%
2%
0% 20% 40% 60%
Letter
Council website
Islington Life (council magazine)
Posters/notices
Word of mouth
Social media
Media e.g. newspapers, television
e-Bulletin (email)
Text messages
Face to face
Council meetings
Other
2018
2015
Resident Survey 2018
46
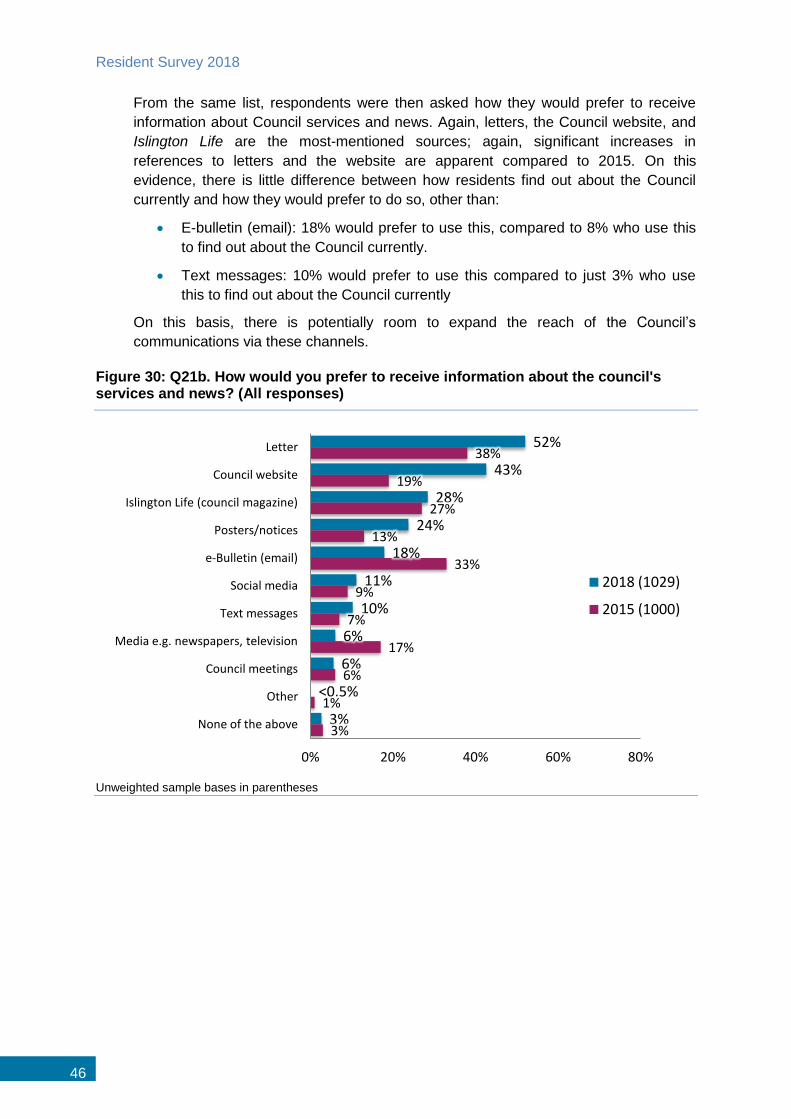
From the same list, respondents were then asked how they would prefer to receive
information about Council services and news. Again, letters, the Council website, and
Islington Life are the most-mentioned sources; again, significant increases in
references to letters and the website are apparent compared to 2015. On this
evidence, there is little difference between how residents find out about the Council
currently and how they would prefer to do so, other than:
E-bulletin (email): 18% would prefer to use this, compared to 8% who use this
to find out about the Council currently.
Text messages: 10% would prefer to use this compared to just 3% who use
this to find out about the Council currently
On this basis, there is potentially room to expand the reach of the Council’s
communications via these channels.
Figure 30: Q21b. How would you prefer to receive information about the council's services and news? (All responses)
Unweighted sample bases in parentheses
52%
43%
28%
24%
18%
11%
10%
6%
6%
<0.5%
3%
38%
19%
27%
13%
33%
9%
7%
17%
6%
1%
3%
0% 20% 40% 60% 80%
Letter
Council website
Islington Life (council magazine)
Posters/notices
e-Bulletin (email)
Social media
Text messages
Media e.g. newspapers, television
Council meetings
Other
None of the above
2018 (1029)
2015 (1000)
Communication and information channels
47
Appendix: Statement of Terms
Compliance with International Standards
BMG complies with the International Standard for Quality Management Systems
requirements (ISO 9001:2008) and the International Standard for Market, opinion and social
research service requirements (ISO 20252:2012) and The International Standard for
Information Security Management (ISO 27001:2013).
Interpretation and publication of results
The interpretation of the results as reported in this document pertain to the research problem
and are supported by the empirical findings of this research project and, where applicable,
by other data. These interpretations and recommendations are based on empirical findings
and are distinguishable from personal views and opinions.
BMG will not publish any part of these results without the written and informed consent of the
client.
Ethical practice
BMG promotes ethical practice in research: We conduct our work responsibly and in light of
the legal and moral codes of society.
We have a responsibility to maintain high scientific standards in the methods employed in
the collection and dissemination of data, in the impartial assessment and dissemination of
findings and in the maintenance of standards commensurate with professional integrity.
We recognise we have a duty of care to all those undertaking and participating in research
and strive to protect subjects from undue harm arising as a consequence of their
participation in research. This requires that subjects’ participation should be as fully informed
as possible and no group should be disadvantaged by routinely being excluded from
consideration. All adequate steps shall be taken by both agency and client to ensure that the
identity of each respondent participating in the research is protected.
With more than 25 years’ experience, BMG Research has established a strong reputation for delivering high quality research and consultancy.
BMG serves both the public and the private sector, providing market and customer insight which is vital in the development of plans, the support of campaigns and the evaluation of performance.
Innovation and development is very much at the heart of our business, and considerable attention is paid to the utilisation of the most up to date technologies and information systems to ensure that market and customer intelligence is widely shared.


![[Facility Name] RESIDENT FOOD SURVEY - Template.net · [Facility Name] RESIDENT FOOD SURVEY ... Flowchart trialled with 5 residents ... dishes) Blue plates purchased for visually](https://img.pdfslide.net/doc/110x75/5ad6b3007f8b9ab8378b4efe/facility-name-resident-food-survey-facility-name-resident-food-survey-flowchart.jpg)