Embed Size (px)
Citation preview
Legislative Oversight Committee South Carolina House of Representatives Post Office Box 11867 Columbia, South Carolina 29211 Telephone: (803) 212-6810 • Fax: (803) 212-6811
Extension Request Guidelines Restructuring & Seven-Year Plan Report
March 11, 2015
i | P a g e
EXTENSION REQUEST GUIDELINES
Background Section 1-30-10(G) requires agencies to submit an Annual Restructuring Report and Seven-Year Plan. Legislative Oversight Standard Practices 4.1 and 6.1 state the Legislative Oversight Committee (“Committee”) shall provide agencies with a uniform format for submitting their Annual Restructuring Report and Seven-Year Plan to the House. The Committee provided agencies the uniform format for these reports. The correspondence with the Report Guidelines, and the actual Report Guidelines, stated the deadline for agencies to submit their completed reports. The Committee has received a request from the agency for an extension in which to provide the agency’s completed report. Pursuant to the Committee’s Standard Practice 1.2 and Committee Rule 7.1, the following procedures apply to these types of Requests for Extension:
4.1.1 The Chairman may, for reasons he determines as good cause, provide an agency an extension to submit its Annual Restructuring Report. 4.1.2 Before the Chairman will consider a request from an agency for an extension, the agency must fully complete a Committee Extension Request form, as approved by the Committee Chairman, and provide it to the Chairman for consideration. 4.1.3 Until the agency receives a response, it should continue to complete the report to the best of its ability as if it is due on the original deadline. 6.1.1 The Chairman may, for reasons he determines as good cause, provide an agency an extension to submit its Seven-Year Plan. 6.1.2 Before the Chairman will consider a request from an agency for an extension, the agency must fully complete a Committee Extension Request form, as approved by the Committee Chairman, and provide it to the Chairman for consideration. 6.1.3 Until the agency receives a response, it should continue to complete the report to the best of its ability as if it is due on the original deadline.
Submission Process
Please complete the Extension Request Form included on the following pages. All forms should be submitted electronically to the House Legislative Oversight Committee ([email protected]) in both the original format (Word) and saved as a PDF for online reporting. The signed copy of the complete Extension Request Form should be mailed to: House Legislative Oversight Committee, Post Office Box 11867, Columbia, South Carolina 29211. Please direct any questions about this process to Jennifer Dobson ([email protected]) or Charles Appleby ([email protected]). Note the Extension Request Forms will be published online.
1 | P a g e
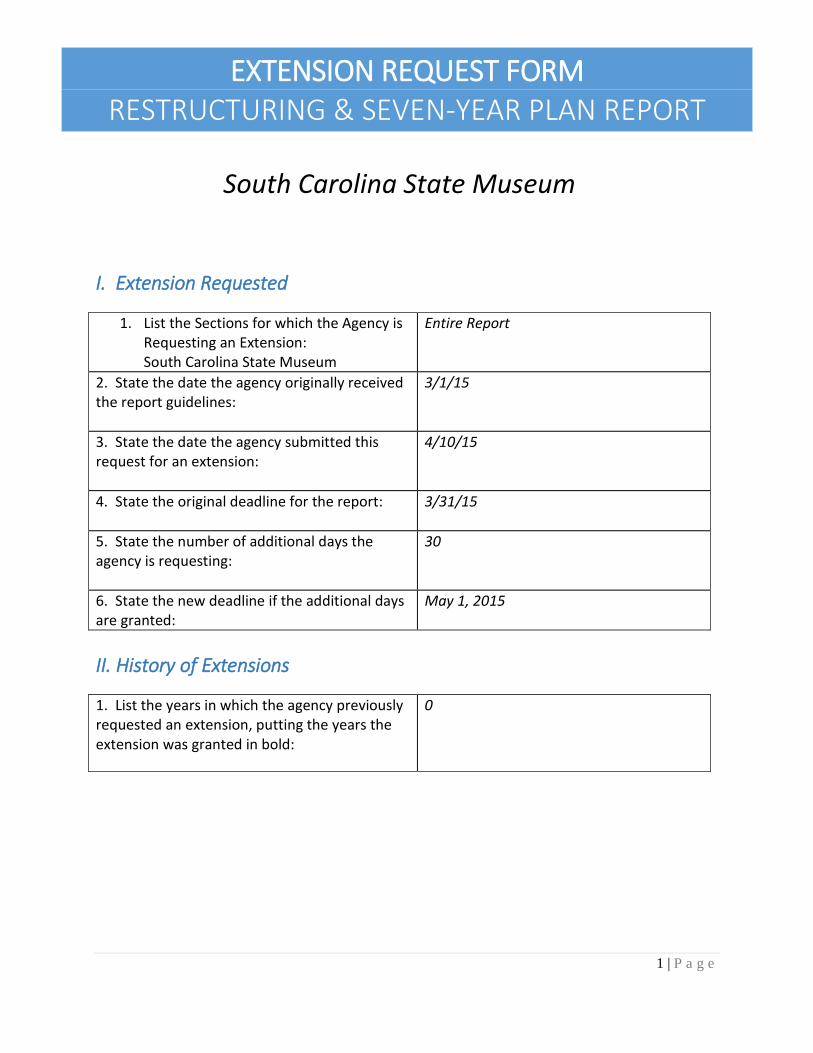
EXTENSION REQUEST FORM RESTRUCTURING & SEVEN-YEAR PLAN REPORT
South Carolina State Museum
I. Extension Requested
1. List the Sections for which the Agency is Requesting an Extension: South Carolina State Museum
Entire Report
2. State the date the agency originally received the report guidelines:
3/1/15
3. State the date the agency submitted this request for an extension:
4/10/15
4. State the original deadline for the report:
3/31/15
5. State the number of additional days the agency is requesting:
30
6. State the new deadline if the additional days are granted:
May 1, 2015
II. History of Extensions
1. List the years in which the agency previously requested an extension, putting the years the extension was granted in bold:
0
2 | P a g e
EXTENSION REQUEST FORM RESTRUCTURING & SEVEN-YEAR PLAN REPORT
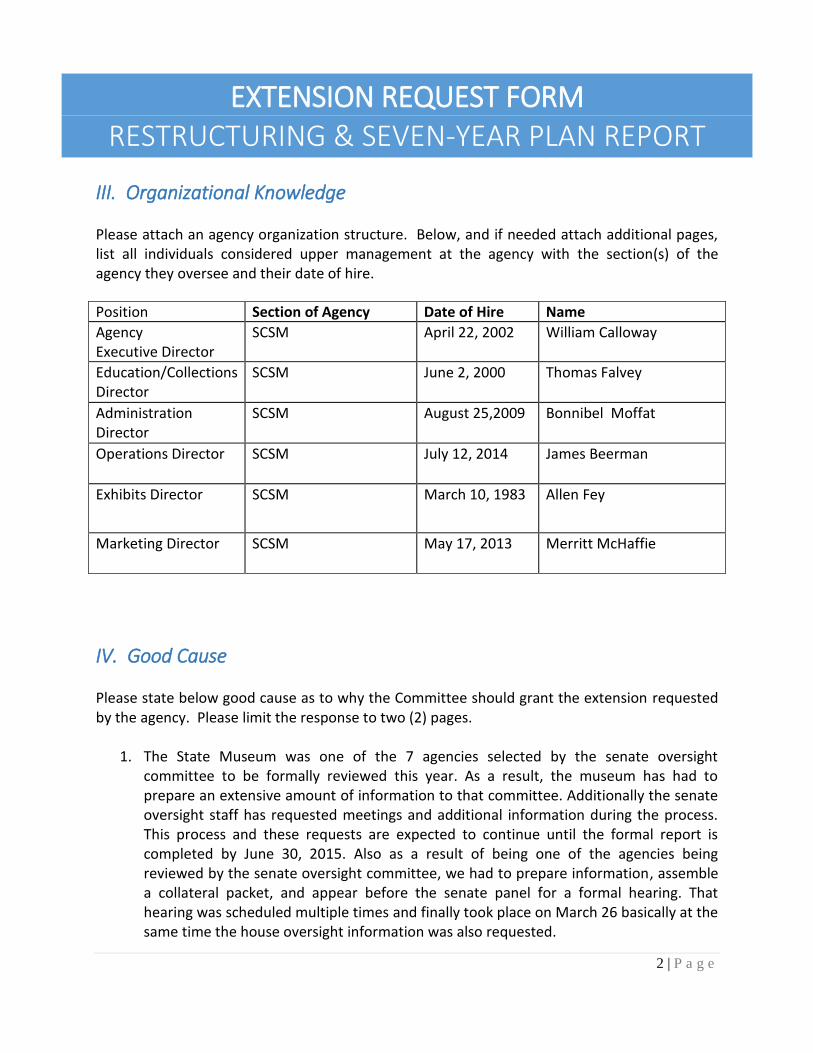
III. Organizational Knowledge Please attach an agency organization structure. Below, and if needed attach additional pages, list all individuals considered upper management at the agency with the section(s) of the agency they oversee and their date of hire.
Position Section of Agency Date of Hire Name
Agency Executive Director
SCSM April 22, 2002 William Calloway
Education/Collections Director
SCSM June 2, 2000 Thomas Falvey
Administration Director
SCSM August 25,2009 Bonnibel Moffat
Operations Director SCSM July 12, 2014 James Beerman
Exhibits Director SCSM March 10, 1983 Allen Fey
Marketing Director SCSM May 17, 2013 Merritt McHaffie
IV. Good Cause Please state below good cause as to why the Committee should grant the extension requested by the agency. Please limit the response to two (2) pages.
1. The State Museum was one of the 7 agencies selected by the senate oversight committee to be formally reviewed this year. As a result, the museum has had to prepare an extensive amount of information to that committee. Additionally the senate oversight staff has requested meetings and additional information during the process. This process and these requests are expected to continue until the formal report is completed by June 30, 2015. Also as a result of being one of the agencies being reviewed by the senate oversight committee, we had to prepare information, assemble a collateral packet, and appear before the senate panel for a formal hearing. That hearing was scheduled multiple times and finally took place on March 26 basically at the same time the house oversight information was also requested.
3 | P a g e
2. While some of the requested info by the senate and the house oversight committees
are similar the format is different. As a result we have to create new documents to comply with the house request.
3. The State Museum in August 2014 opened its long planned $23 million renovation and expansion. As a result the workload for our limited staff has dramatically increased in response to the increased visitation as well as the operations of new components such as the planetarium, the 4D theater, the observatory, the new telescope gallery, and a substantial increase in our after hour facility rental business.
4. The museum’s existing staff is less half of what it was 15 years ago when we had fewer
visitors and less operational components. There are no deputy directors, no full time assistant, and only one full time administration staff member who is responsible for finance, human resources, accounts payables, procurement and IT. As a result this requested information has to be prepared by the Agency Director with limited help from other staff. The Agency Director while also having to prepare the required info for the senate oversight committee is also in the midst of the budget cycle for the next fiscal year and is having to spend time at the state house overseeing and requesting budget support.
5. As mentioned the State Museum has just finished a renovation project that has consumed the staff time for the past ten years. This effort was the completion of the current long time plan. Some of the info requested in the forms reference future long term planning and visioning. That process done correctly should involve both the Museum Commissioners and the ancillary Museum Foundation Board of Directors. Since we are only 7 months into the operation of the “new” museum we have not had the time or more importantly collected enough data to see what the next steps are for the museum. To produce the best information requested by the report, we need to have a least some preliminary visioning exercises even though a comprehensive planning process obviously will take up to a year to complete.
4 | P a g e
EXTENSION REQUEST FORM RESTRUCTURING & SEVEN-YEAR PLAN REPORT
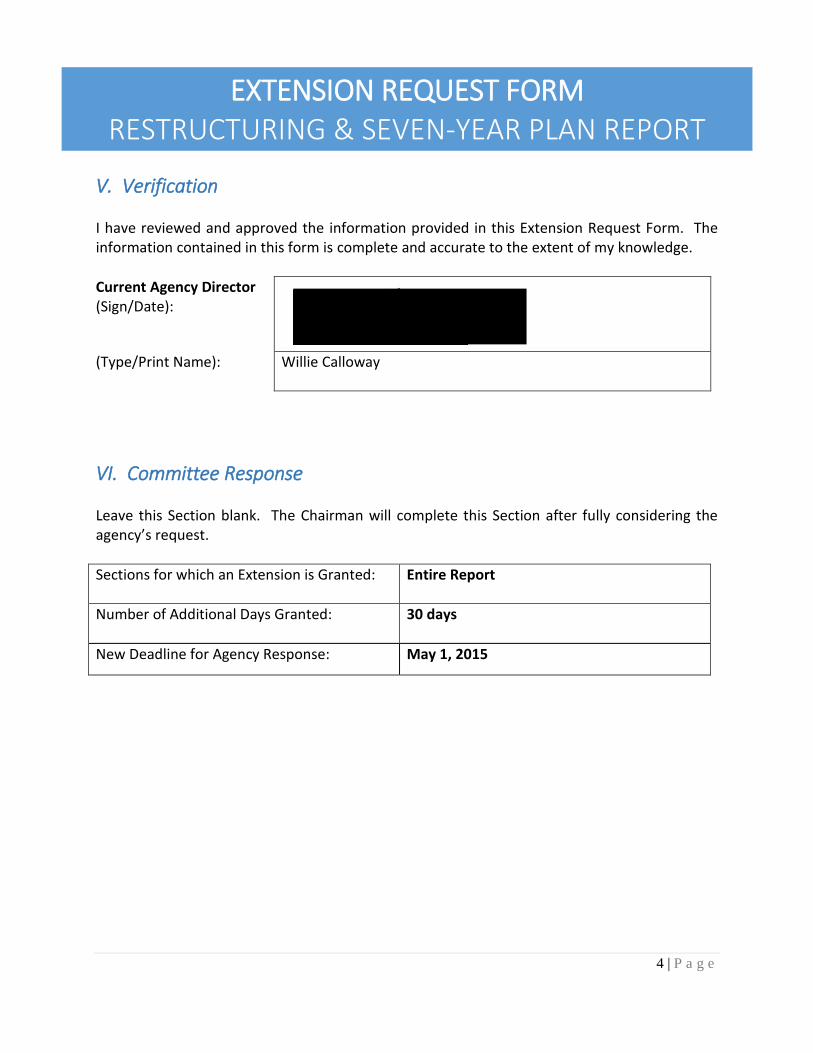
V. Verification I have reviewed and approved the information provided in this Extension Request Form. The information contained in this form is complete and accurate to the extent of my knowledge.
Current Agency Director (Sign/Date):
(Type/Print Name):
Willie Calloway
VI. Committee Response Leave this Section blank. The Chairman will complete this Section after fully considering the agency’s request.
Sections for which an Extension is Granted: Entire Report
Number of Additional Days Granted: 30 days
New Deadline for Agency Response: May 1, 2015
i | P a g e
Legislative Oversight Committee South Carolina House of Representatives Post Office Box 11867 Columbia, South Carolina 29211 Telephone: (803) 212-6810 • Fax: (803) 212-6811
Restructuring & Seven-Year Plan Report Guidelines

ii | P a g e
RESTRUCTURING & SEVEN-YEAR PLAN
South Carolina State Museum Date of Submission: Insert Date
Please provide the following for this year’s Restructuring and Seven-Year Plan Report.
Name Date of Hire Email
Agency Director Willie Calloway [email protected]
Previous Agency Director
Name Phone Email
Primary Contact: Willie Calloway 898-4930 [email protected]
Secondary Contact:
Bonnie Moffat 898-5399 [email protected]
Is the agency vested with revenue bonding authority? (re: Section 2-2-60(E))
I have reviewed and approved the enclosed 2015 Restructuring and Seven-Year Plan Report, which are complete and accurate to the extent of my knowledge.
Current Agency Director (Sign/Date):
(Type/Print Name):
Willie Calloway
If applicable, Board/Commission Chair (Sign/Date):
(Type/Print Name):
Grey Culbreath
TABLE OF CONTENTS
Insert the appropriate page numbers once the agency has completed the report.
I. Executive Summary ________________________________________________________ 1
Historical Perspective __________________________________________________ 1
Purpose, Mission & Vision ______________________________________________ 1
Key Performance Measurement Results __________________________________ 1,2
II. Organizational Profile___________________________________________________ 3,4,5
III. Laws (Statutes, Regulations, Provisos) ________________________________________ 6
IV. Reports & Reviews _______________________________________________________ 6
V. Key Performance Measurement Processes ___________________________________ 7-13
VI. Seven-Year Plan
General ____________________________________________________________ 14
Recommended Changes _____________________________________________ 14-17
Additional Information Insert Page Number
VII. Charts Appendix ________________________________________________________ 18
Excel sheets 19-32
Key Performance Measurement Charts 33-40
1 | P a g e
Does the agency already provide the information requested on this page, or similar information, in a report required by another entity? If yes, add the appropriate information to the Similar Information Requested Chart. If the agency looks in the Excel document attached, there is a template for the agency to complete for any questions which ask for the same nformation under the tab labeled, “Similar Info Requested.”
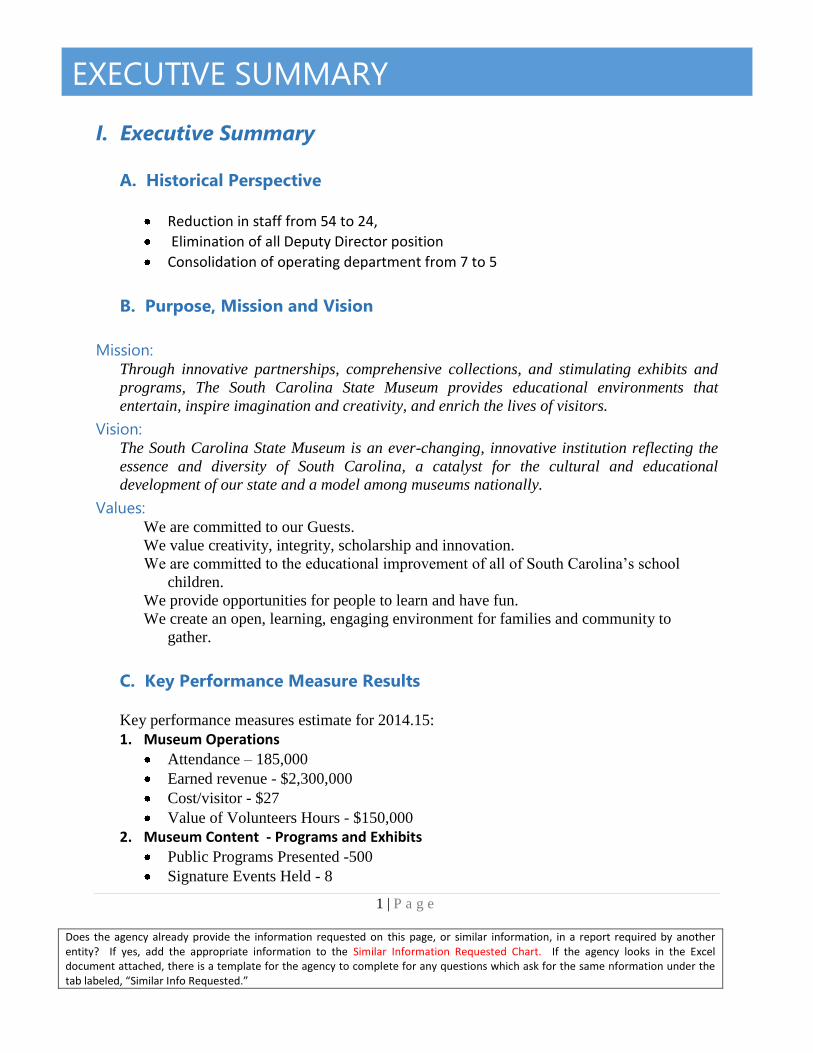
EXECUTIVE SUMMARY
I. Executive Summary
A. Historical Perspective
Reduction in staff from 54 to 24,
Elimination of all Deputy Director position
Consolidation of operating department from 7 to 5
B. Purpose, Mission and Vision
Mission: Through innovative partnerships, comprehensive collections, and stimulating exhibits and
programs, The South Carolina State Museum provides educational environments that
entertain, inspire imagination and creativity, and enrich the lives of visitors.
Vision: The South Carolina State Museum is an ever-changing, innovative institution reflecting the
essence and diversity of South Carolina, a catalyst for the cultural and educational
development of our state and a model among museums nationally.
Values: We are committed to our Guests.
We value creativity, integrity, scholarship and innovation.
We are committed to the educational improvement of all of South Carolina’s school
children.
We provide opportunities for people to learn and have fun.
We create an open, learning, engaging environment for families and community to
gather.
C. Key Performance Measure Results
Key performance measures estimate for 2014.15:
1. Museum Operations Attendance – 185,000
Earned revenue - $2,300,000
Cost/visitor - $27
Value of Volunteers Hours - $150,000
2. Museum Content - Programs and Exhibits Public Programs Presented -500
Signature Events Held - 8
2 | P a g e
Does the agency already provide the information requested on this page, or similar information, in a report required by another entity? If yes, add the appropriate information to the Similar Information Requested Chart. If the agency looks in the Excel document attached, there is a template for the agency to complete for any questions which ask for the same nformation under the tab labeled, “Similar Info Requested.”
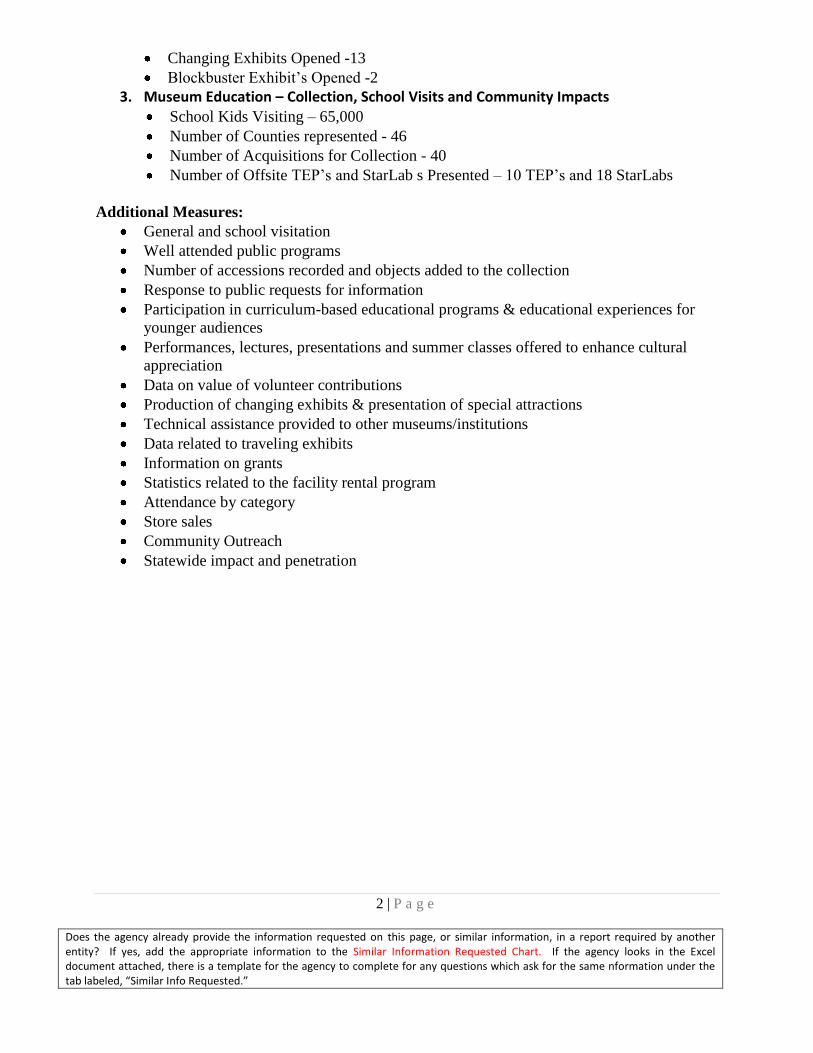
Changing Exhibits Opened -13
Blockbuster Exhibit’s Opened -2
3. Museum Education – Collection, School Visits and Community Impacts
School Kids Visiting – 65,000
Number of Counties represented - 46
Number of Acquisitions for Collection - 40
Number of Offsite TEP’s and StarLab s Presented – 10 TEP’s and 18 StarLabs
Additional Measures:
General and school visitation
Well attended public programs
Number of accessions recorded and objects added to the collection
Response to public requests for information
Participation in curriculum-based educational programs & educational experiences for
younger audiences
Performances, lectures, presentations and summer classes offered to enhance cultural
appreciation
Data on value of volunteer contributions
Production of changing exhibits & presentation of special attractions
Technical assistance provided to other museums/institutions
Data related to traveling exhibits
Information on grants
Statistics related to the facility rental program
Attendance by category
Store sales
Community Outreach
Statewide impact and penetration
3 | P a g e
Does the agency already provide the information requested on this page, or similar information, in a report required by another entity? If yes, add the appropriate information to the Similar Information Requested Chart. If the agency looks in the Excel document attached, there is a template for the agency to complete for any questions which ask for the same nformation under the tab labeled, “Similar Info Requested.”
ORGANIZATIONAL PROFILE
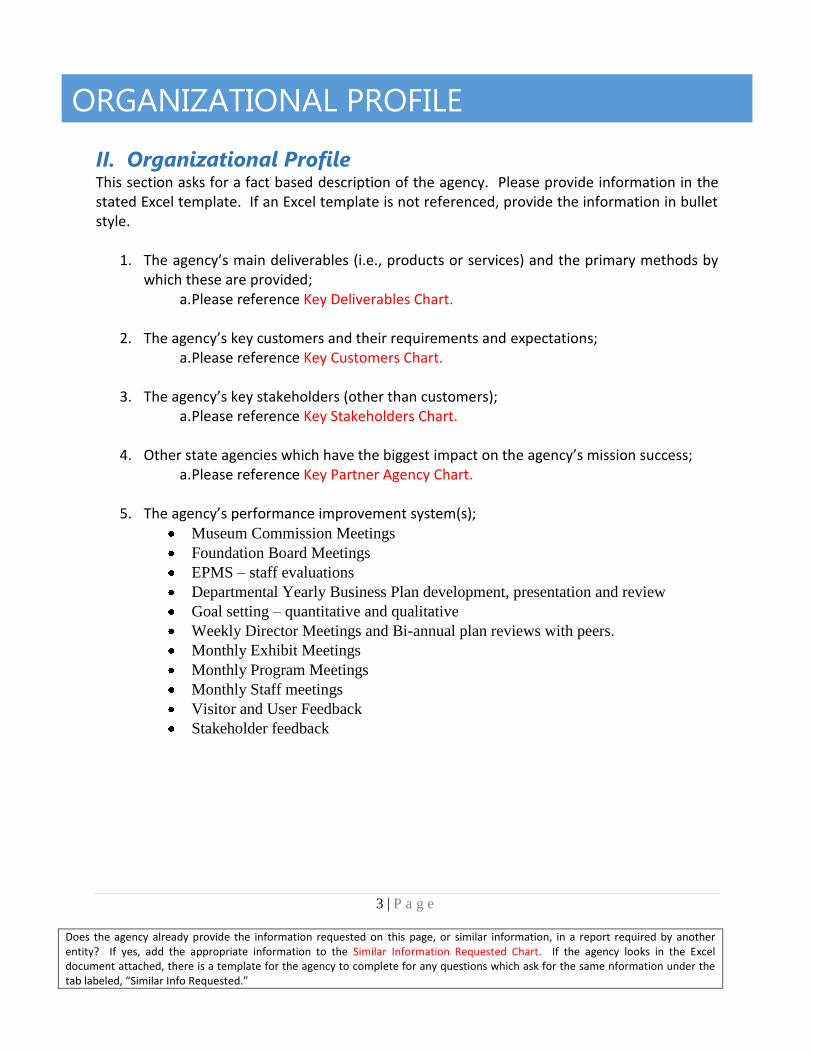
II. Organizational Profile This section asks for a fact based description of the agency. Please provide information in the stated Excel template. If an Excel template is not referenced, provide the information in bullet style.
1. The agency’s main deliverables (i.e., products or services) and the primary methods by
which these are provided; a. Please reference Key Deliverables Chart.
2. The agency’s key customers and their requirements and expectations;
a. Please reference Key Customers Chart.
3. The agency’s key stakeholders (other than customers); a. Please reference Key Stakeholders Chart.
4. Other state agencies which have the biggest impact on the agency’s mission success;
a. Please reference Key Partner Agency Chart.
5. The agency’s performance improvement system(s); Museum Commission Meetings
Foundation Board Meetings
EPMS – staff evaluations
Departmental Yearly Business Plan development, presentation and review
Goal setting – quantitative and qualitative
Weekly Director Meetings and Bi-annual plan reviews with peers.
Monthly Exhibit Meetings
Monthly Program Meetings
Monthly Staff meetings
Visitor and User Feedback
Stakeholder feedback
4 | P a g e
Does the agency already provide the information requested on this page, or similar information, in a report required by another entity? If yes, add the appropriate information to the Similar Information Requested Chart. If the agency looks in the Excel document attached, there is a template for the agency to complete for any questions which ask for the same nformation under the tab labeled, “Similar Info Requested.”
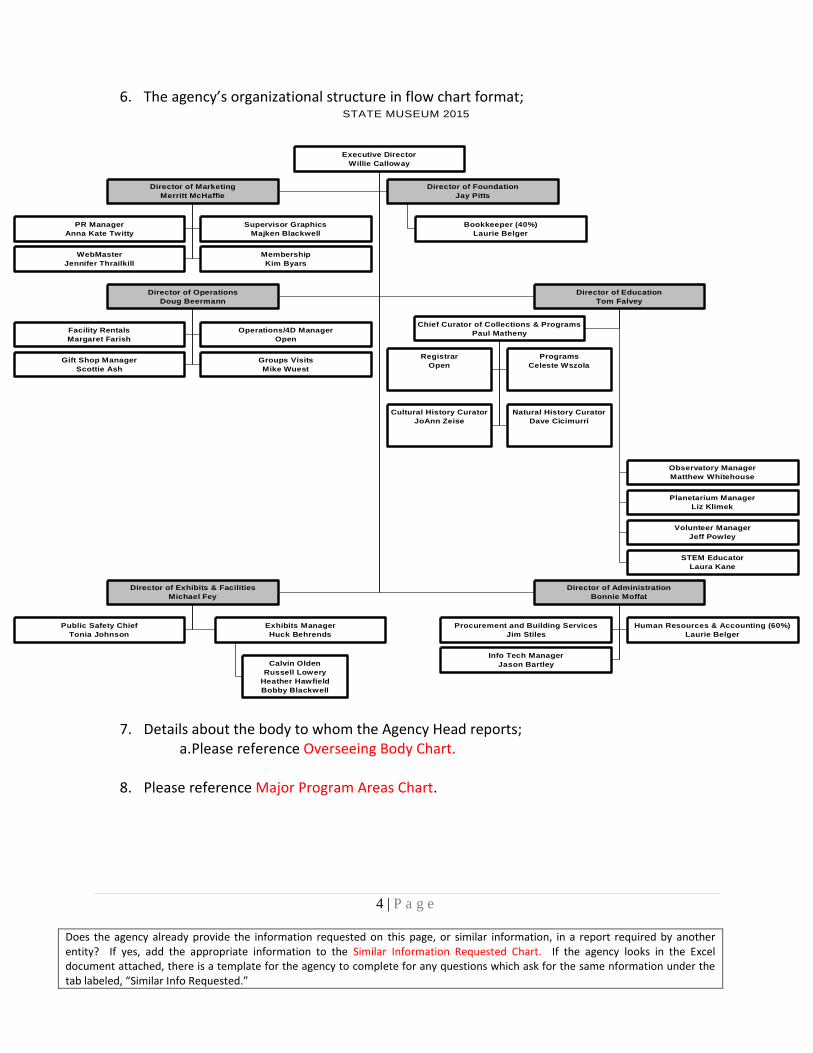
6. The agency’s organizational structure in flow chart format; STATE MUSEUM 2015
PR Manager
Anna Kate Twitty
Supervisor Graphics
Majken Blackwell
WebMaster
Jennifer Thrailkill
Membership
Kim Byars
Director of Marketing
Merritt McHaffie
Bookkeeper (40%)
Laurie Belger
Director of Foundation
Jay Pitts
Facility Rentals
Margaret Farish
Operations/4D Manager
Open
Gift Shop Manager
Scottie Ash
Groups Visits
Mike Wuest
Director of Operations
Doug Beermann
Registrar
Open
Programs
Celeste Wszola
Cultural History Curator
JoAnn Zeise
Natural History Curator
Dave Cicimurri
Chief Curator of Collections & Programs
Paul Matheny
Observatory Manager
Matthew Whitehouse
Planetarium Manager
Liz Klimek
Volunteer Manager
Jeff Powley
STEM Educator
Laura Kane
Director of Education
Tom Falvey
Public Safety Chief
Tonia Johnson
Calvin Olden
Russell Lowery
Heather Hawfield
Bobby Blackwell
Exhibits Manager
Huck Behrends
Director of Exhibits & Facilities
Michael Fey
Procurement and Building Services
Jim Stiles
Human Resources & Accounting (60%)
Laurie Belger
Info Tech Manager
Jason Bartley
Director of Administration
Bonnie Moffat
Executive Director
Willie Calloway
7. Details about the body to whom the Agency Head reports;
a. Please reference Overseeing Body Chart.
8. Please reference Major Program Areas Chart.
5 | P a g e
Does the agency already provide the information requested on this page, or similar information, in a report required by another entity? If yes, add the appropriate information to the Similar Information Requested Chart. If the agency looks in the Excel document attached, there is a template for the agency to complete for any questions which ask for the same nformation under the tab labeled, “Similar Info Requested.”
9. Please identify any emerging issues the agency anticipates may have an impact on its
operations in the upcoming five years.
Competition –
Facility – New Riverbanks Zoo expansion, Columbia Art Museum expansion,
Edventure expansion, new Bull Street retail, baseball, entertainment complex
Time/Money – Families lack of time and money for multiple options and
destinations so ALL alternative entrainment options become completion form
sporting events to out of home dining
Technology – Much of a museum experience can be replicated via technology
and internet experiences. Our exhibit galleries are woefully behind the
competition as to presentation techniques and customer expectations.
Legislative – State Appropriations, Rent Burden ($1.8 million), Increasing Awareness
Amongst Political and Community Leadership
Marketing – Reaching pre-formed Groups, effective use of Social Media, Targeted
marketing, diversity of communication channels, limited paid media dollars to effectively
broadcast our message.
Exhibits – Balance the exhibit presentations between repair of exiting galleries and
introduction of new non-fee based temporary exhibits (Traveling versus in-house
produced) with fee based temporary exhibits (Blockbusters)
Earned Revenues – Maximizing all revenue streams in a very competitive environment
especially with our store product and our facility rental programs
Staff - Limited, Stretched, Multiple responsibilities, Guest Service, Quality experience
Facility - Disrepair of Permanent Exhibits, Building Issues, Artifact Security
The Collection - Limited Acquisition Funding, Limited Storage, Inadequate Protection,
Insufficient number of curators and no conservator
Museum Foundation – Competition for private philanthropy[y with an escalating
number of non-profits that leads to a lack of fundraising success for museum operations
Information Technology – Outdated hardware and too many cumbersome, dated
software applications; limited dedicated IT staff to stay ahead of all issues such as data
security
6 | P a g e
Does the agency already provide the information requested on this page, or similar information, in a report required by another entity? If yes, add the appropriate information to the Similar Information Requested Chart. If the agency looks in the Excel document attached, there is a template for the agency to complete for any questions which ask for the same nformation under the tab labeled, “Similar Info Requested.”
ORGANIZATIONAL PROFILE
III. Laws (Statutes, Regulations, Provisos) This section asks for state and federal statutes, regulations and provisos (“Laws”) which apply to the agency.
1. Please reference Legal Standards Chart.
IV. Reports and Reviews This section asks for information about reports the agency is required to submit to a legislative entity and the agency’s internal review process.
1. Please reference Agency Reporting Requirements Chart.
2. Please reference Internal Audit Chart.
7 | P a g e
Does the agency already provide the information requested on this page, or similar information, in a report required by another entity? If yes, add the appropriate information to the Similar Information Requested Chart. If the agency looks in the Excel document attached, there is a template for the agency to complete for any questions which ask for the same nformation under the tab labeled, “Similar Info Requested.”
RESTRUCTURING REPORT
V. Key Performance Measurement Processes
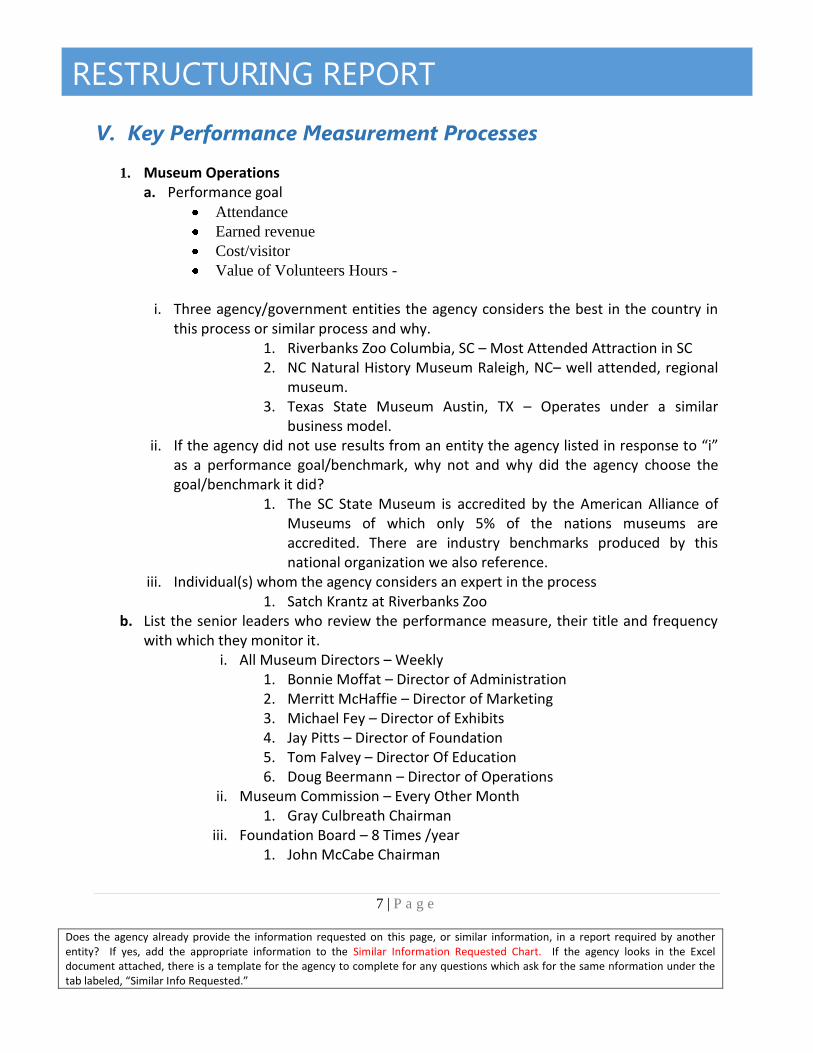
1. Museum Operations a. Performance goal
Attendance
Earned revenue
Cost/visitor
Value of Volunteers Hours -
i. Three agency/government entities the agency considers the best in the country in
this process or similar process and why. 1. Riverbanks Zoo Columbia, SC – Most Attended Attraction in SC 2. NC Natural History Museum Raleigh, NC– well attended, regional
museum. 3. Texas State Museum Austin, TX – Operates under a similar
business model. ii. If the agency did not use results from an entity the agency listed in response to “i”
as a performance goal/benchmark, why not and why did the agency choose the goal/benchmark it did?
1. The SC State Museum is accredited by the American Alliance of Museums of which only 5% of the nations museums are accredited. There are industry benchmarks produced by this national organization we also reference.
iii. Individual(s) whom the agency considers an expert in the process 1. Satch Krantz at Riverbanks Zoo
b. List the senior leaders who review the performance measure, their title and frequency with which they monitor it.
i. All Museum Directors – Weekly 1. Bonnie Moffat – Director of Administration 2. Merritt McHaffie – Director of Marketing 3. Michael Fey – Director of Exhibits 4. Jay Pitts – Director of Foundation 5. Tom Falvey – Director Of Education 6. Doug Beermann – Director of Operations
ii. Museum Commission – Every Other Month 1. Gray Culbreath Chairman
iii. Foundation Board – 8 Times /year 1. John McCabe Chairman
8 | P a g e
Does the agency already provide the information requested on this page, or similar information, in a report required by another entity? If yes, add the appropriate information to the Similar Information Requested Chart. If the agency looks in the Excel document attached, there is a template for the agency to complete for any questions which ask for the same nformation under the tab labeled, “Similar Info Requested.”
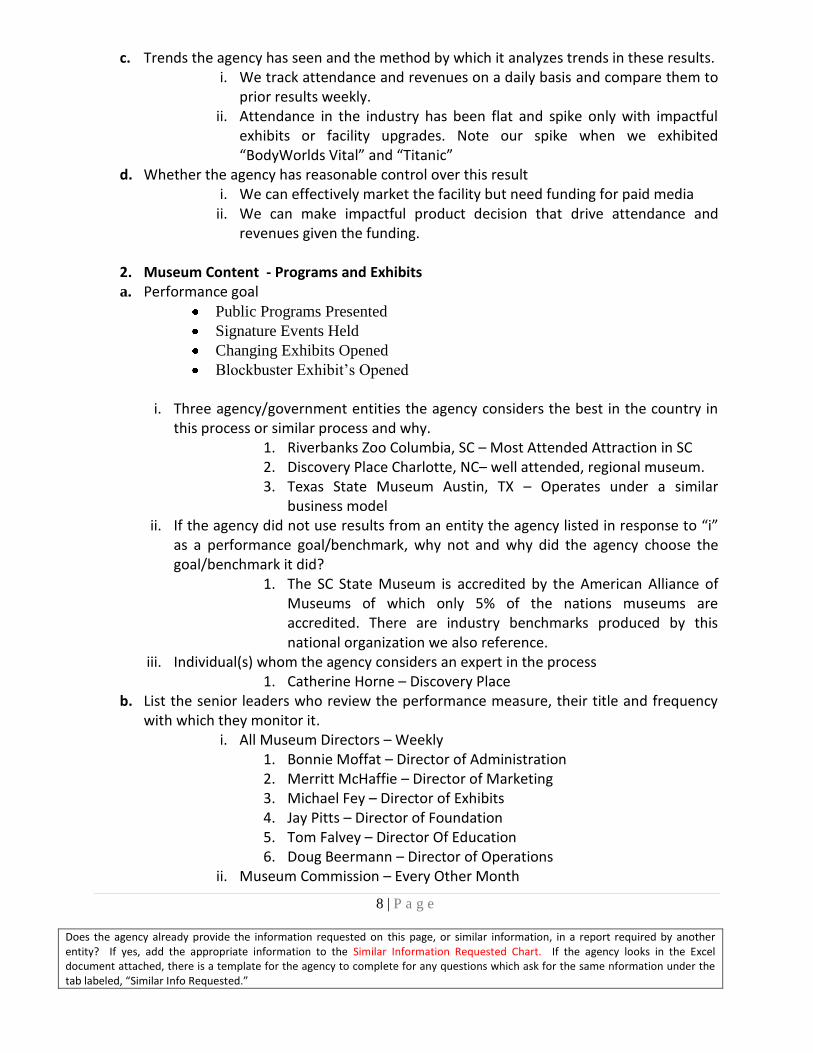
c. Trends the agency has seen and the method by which it analyzes trends in these results. i. We track attendance and revenues on a daily basis and compare them to
prior results weekly. ii. Attendance in the industry has been flat and spike only with impactful
exhibits or facility upgrades. Note our spike when we exhibited “BodyWorlds Vital” and “Titanic”
d. Whether the agency has reasonable control over this result i. We can effectively market the facility but need funding for paid media
ii. We can make impactful product decision that drive attendance and revenues given the funding.
2. Museum Content - Programs and Exhibits a. Performance goal
Public Programs Presented
Signature Events Held
Changing Exhibits Opened
Blockbuster Exhibit’s Opened
i. Three agency/government entities the agency considers the best in the country in
this process or similar process and why. 1. Riverbanks Zoo Columbia, SC – Most Attended Attraction in SC 2. Discovery Place Charlotte, NC– well attended, regional museum. 3. Texas State Museum Austin, TX – Operates under a similar
business model ii. If the agency did not use results from an entity the agency listed in response to “i”
as a performance goal/benchmark, why not and why did the agency choose the goal/benchmark it did?
1. The SC State Museum is accredited by the American Alliance of Museums of which only 5% of the nations museums are accredited. There are industry benchmarks produced by this national organization we also reference.
iii. Individual(s) whom the agency considers an expert in the process 1. Catherine Horne – Discovery Place
b. List the senior leaders who review the performance measure, their title and frequency with which they monitor it.
i. All Museum Directors – Weekly 1. Bonnie Moffat – Director of Administration 2. Merritt McHaffie – Director of Marketing 3. Michael Fey – Director of Exhibits 4. Jay Pitts – Director of Foundation 5. Tom Falvey – Director Of Education 6. Doug Beermann – Director of Operations
ii. Museum Commission – Every Other Month
9 | P a g e
Does the agency already provide the information requested on this page, or similar information, in a report required by another entity? If yes, add the appropriate information to the Similar Information Requested Chart. If the agency looks in the Excel document attached, there is a template for the agency to complete for any questions which ask for the same nformation under the tab labeled, “Similar Info Requested.”
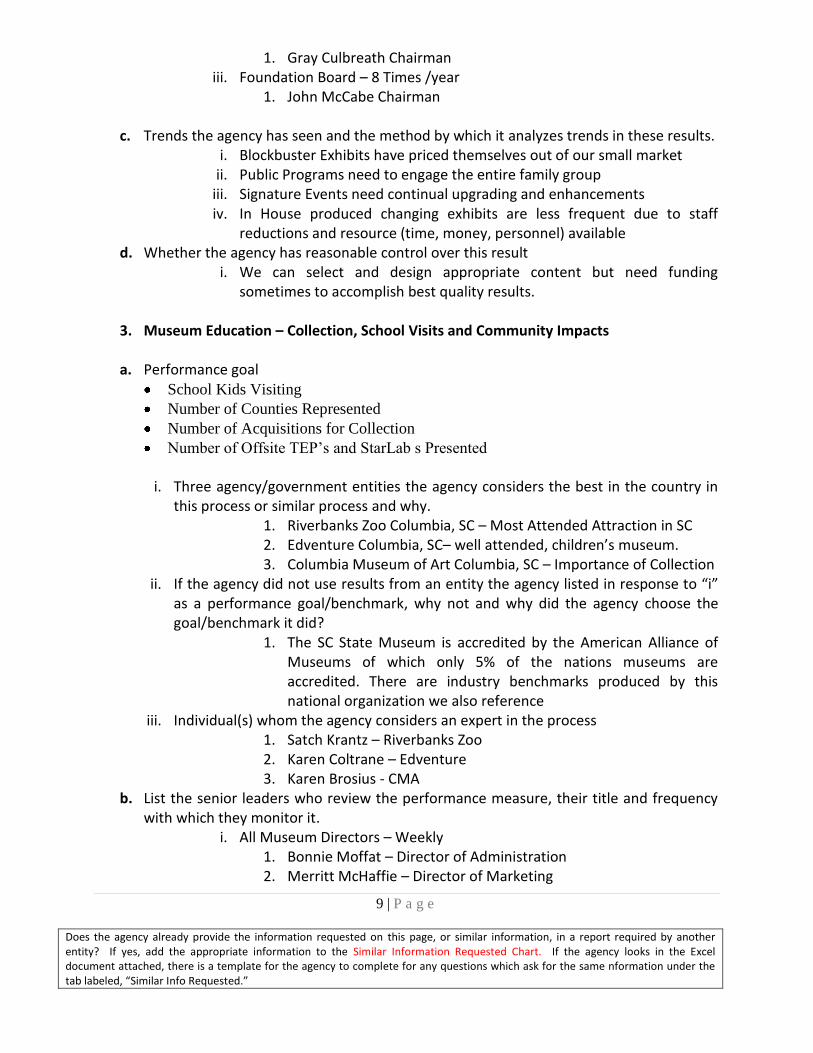
1. Gray Culbreath Chairman iii. Foundation Board – 8 Times /year
1. John McCabe Chairman
c. Trends the agency has seen and the method by which it analyzes trends in these results. i. Blockbuster Exhibits have priced themselves out of our small market
ii. Public Programs need to engage the entire family group iii. Signature Events need continual upgrading and enhancements iv. In House produced changing exhibits are less frequent due to staff
reductions and resource (time, money, personnel) available d. Whether the agency has reasonable control over this result
i. We can select and design appropriate content but need funding sometimes to accomplish best quality results.
3. Museum Education – Collection, School Visits and Community Impacts
a. Performance goal
School Kids Visiting
Number of Counties Represented
Number of Acquisitions for Collection
Number of Offsite TEP’s and StarLab s Presented
i. Three agency/government entities the agency considers the best in the country in
this process or similar process and why. 1. Riverbanks Zoo Columbia, SC – Most Attended Attraction in SC 2. Edventure Columbia, SC– well attended, children’s museum. 3. Columbia Museum of Art Columbia, SC – Importance of Collection
ii. If the agency did not use results from an entity the agency listed in response to “i” as a performance goal/benchmark, why not and why did the agency choose the goal/benchmark it did?
1. The SC State Museum is accredited by the American Alliance of Museums of which only 5% of the nations museums are accredited. There are industry benchmarks produced by this national organization we also reference
iii. Individual(s) whom the agency considers an expert in the process 1. Satch Krantz – Riverbanks Zoo 2. Karen Coltrane – Edventure 3. Karen Brosius - CMA
b. List the senior leaders who review the performance measure, their title and frequency with which they monitor it.
i. All Museum Directors – Weekly 1. Bonnie Moffat – Director of Administration 2. Merritt McHaffie – Director of Marketing
10 | P a g e
Does the agency already provide the information requested on this page, or similar information, in a report required by another entity? If yes, add the appropriate information to the Similar Information Requested Chart. If the agency looks in the Excel document attached, there is a template for the agency to complete for any questions which ask for the same nformation under the tab labeled, “Similar Info Requested.”
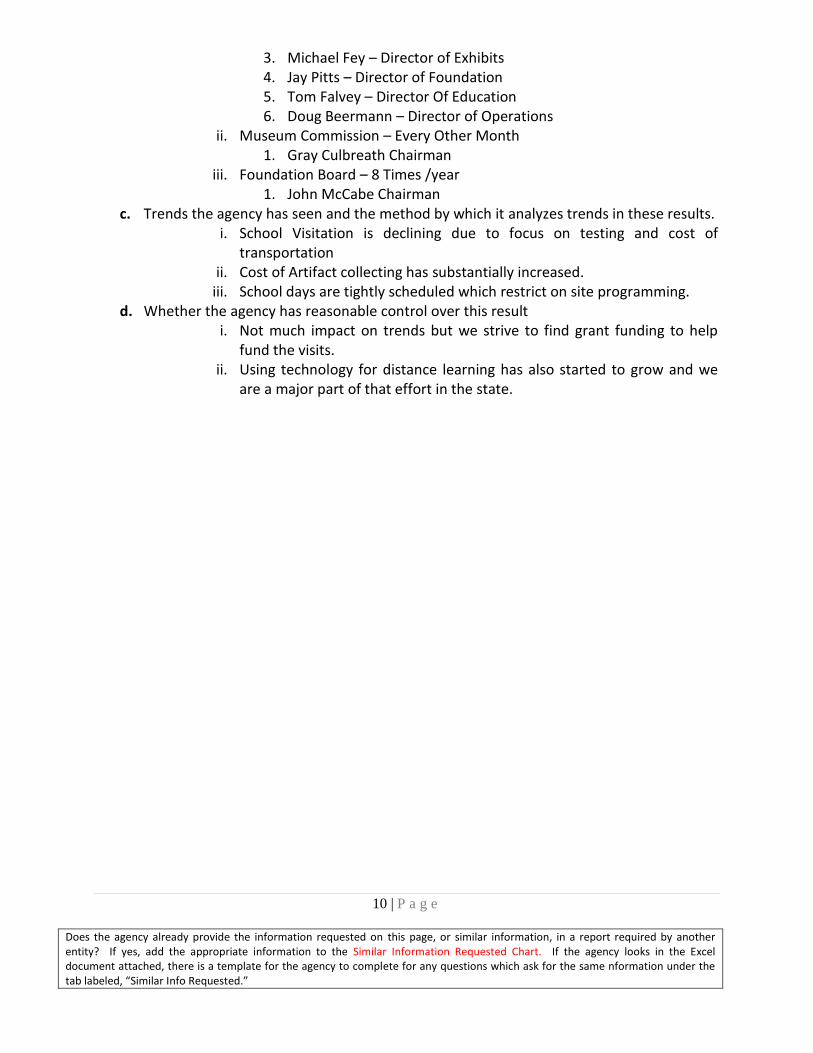
3. Michael Fey – Director of Exhibits 4. Jay Pitts – Director of Foundation 5. Tom Falvey – Director Of Education 6. Doug Beermann – Director of Operations
ii. Museum Commission – Every Other Month 1. Gray Culbreath Chairman
iii. Foundation Board – 8 Times /year 1. John McCabe Chairman
c. Trends the agency has seen and the method by which it analyzes trends in these results. i. School Visitation is declining due to focus on testing and cost of
transportation ii. Cost of Artifact collecting has substantially increased.
iii. School days are tightly scheduled which restrict on site programming. d. Whether the agency has reasonable control over this result
i. Not much impact on trends but we strive to find grant funding to help fund the visits.
ii. Using technology for distance learning has also started to grow and we are a major part of that effort in the state.

11 | P a g e
Does the agency already provide the information requested on this page, or similar information, in a report required by another entity? If yes, add the appropriate information to the Similar Information Requested Chart. If the agency looks in the Excel document attached, there is a template for the agency to complete for any questions which ask for the same nformation under the tab labeled, “Similar Info Requested.”
RESTRUCTURING REPORT
V. Key Performance Measurement Processes (cont.)
A. Results of Agency’s Key Performance Measurements
1. Mission Effectiveness Chart 5.1.1 – 5.1.10
a. Museum Operations 1. Attendance 2. Revenues 3. Reach a state wide audience
b. Museum Content 1. Participation at programs and events 2. Increase objects in collections
c. Museum Education 1. School visitation 2. Offer outreach programs TEP and StarLab
2. Mission Efficiency Chart 5.2.1 – 5.2.5
a. Museum Operations 1. Cost per Visitor 2. Volunteer Value 3. Produce graphics in-house
b. Museum Content 1. Produce numerous programs and exhibits with limited staff and
funds 2. Minimize cost/sq foot of develop
c. Museum Education 1. Reach every County in the state 2. Introduce Distance Learning 3. Partner with ETV and DOE 4. Partner with SC Science Council, SELA and NASA
3. Quality (Customer Satisfaction) Chart 5.3.1 – 5.3.7
a. Museum Operations 1. Limited Gust Complaints 2. Fast and empathic response to Guest complaints
b. Museum Content 1. Programs and Exhibits are well received
12 | P a g e
Does the agency already provide the information requested on this page, or similar information, in a report required by another entity? If yes, add the appropriate information to the Similar Information Requested Chart. If the agency looks in the Excel document attached, there is a template for the agency to complete for any questions which ask for the same nformation under the tab labeled, “Similar Info Requested.”
2. Development and production of family events such as birthday parties, camp-ins, and holiday events
c. Museum Education 1. Schools see value in field trip experience 2. Provide multi-grade level experiences 3. Respond to citizen inquires about personal items and objects
4. Workforce Engagement Chart 5.4.1
a. Museum Operations 1. Full Time: 30 staff; reduced 55% from peak of 67 staff 2. Part Time: 60 seasonal staff 3. Volunteer: 200 volunteers
b. Museum Content 1. Programs and Exhibits - Driven by curators and public programs
staff 2. Facilitated by Group visits reservations and on site interaction
c. Museum Education 1. Lessons and curriculum developed by education staff 2. Professional papers and research accomplished by curators
5. Operational/Work System Performance Chart 5.5.1
a. Museum Operations 1. 52 week , 7 day operation with multiple evening events 2. Use of partners to present programs – Story Fest, Miniature
Show, Cinco De Mayo etc b. Museum Content
1. Exhibit fabrication staff reduced from 13 to five c. Museum Education
1. Use of technology for distance learning
13 | P a g e
Does the agency already provide the information requested on this page, or similar information, in a report required by another entity? If yes, add the appropriate information to the Similar Information Requested Chart. If the agency looks in the Excel document attached, there is a template for the agency to complete for any questions which ask for the same nformation under the tab labeled, “Similar Info Requested.”
RESTRUCTURING REPORT
V. Key Performance Measurement Processes (cont.)
B. Most Critical Performance Measures
1. Museum Operations – Attendance and Earned Revenues 2. Museum Content – Number of Programs and Exhibits Presented 3. Museum Education – Number of School Visits and Acquisitions to Collection
C. Databases/Document Management
1. Dataworks Store Inventory Control Software
2. Gateway Ticketing Systems - Galaxy
3. IO Collections
4. Raisers Edge Membership Software
5. Volgistics Volunteer Scheduling Software
6. When to Work Staff Scheduling Software
D. Recommended Restructuring
1. Rent The Rent paid to the B&CB of $1,800,000 is 62% of the museum’s State appropriation
The biggest potential for cost savings to our budget would be a different approach to our building
occupancy (rent) costs.
Rent Restructuring Options
1. Pay Actual operating costs to B&CB ($1,000,000 estimate)
a. The remaining $800,000 goes into the B&CB as “other” funds to fund General Services
and all state building maintenance needs.
b. The B&CB should be appropriated these funds directly to their budget rather than
inflating costs to state agencies to fund.
2. Place all costs in the B&CB and totally remove the cost from the museum’s budget.
3. Sell the building to a private developer or the museum’s foundation.
14 | P a g e
Does the agency already provide the information requested on this page, or similar information, in a report required by another entity? If yes, add the appropriate information to the Similar Information Requested Chart. If the agency looks in the Excel document attached, there is a template for the agency to complete for any questions which ask for the same nformation under the tab labeled, “Similar Info Requested.”
SEVEN-YEAR PLAN
VI. Seven-Year Plan
A. General No, we have just completed a major renovation and expansion ($23 million) in August of 2014. The opening of the project was the completion of the existing plan that was in place. Now that the project has opened to national accolades we are poised to begin the process of development of the next long term plan. Additionally the every ten year renewal of the State Museum‘s national accreditation by AAM is due in 2017 and will also require such a plan.
B. Current/Recommended Actions
1. Describe all of the actions the agency is currently taking and plans it has for initiatives and actions during the next seven fiscal years to work to achieve greater efficiency in its operations in order to continually improve its ability to respond to the needs of the state’s citizens? In this description, provide the names of all personnel who are responsible for overseeing the actions and plans.
2. What are the anticipated cost savings and/or efficiencies that would be achieved by each action?
3. Is legislative action required to allow the department/agency to implement the current or recommended actions?
4. If legislative action is required, please explain the constitutional, statutory or regulatory changes needed.
5. Describe the agency actions that will be implemented to generate the desired outcomes for each recommendation.
6. What is the timeline for implementation of the change and realization of the anticipated benefits for each recommended action/change? Now go to Additional Questions.
15 | P a g e
Does the agency already provide the information requested on this page, or similar information, in a report required by another entity? If yes, add the appropriate information to the Similar Information Requested Chart. If the agency looks in the Excel document attached, there is a template for the agency to complete for any questions which ask for the same nformation under the tab labeled, “Similar Info Requested.”
SEVEN-YEAR PLAN
VI. Seven-Year Plan (cont.)
C. Additional Questions
1. What top three strategic objectives of the agency will have the biggest impact on the agency’s effectiveness in accomplishing its mission? a. Priority 1
Renovating and updating the 75,000 square feet of 27 year old permanent exhibits with exhibits that meet museum standards, meet visitor expectations, meet programming needs, and are reflective of current best practices in exhibit design and delivery. b. Priority 2
Increasing the security and care of the collection and the continuation of acquiring important objects for the collection that are representative of South Carolina’s history and heritage. c. Priority 3
Maximizing the educational impact of the content and programming available and closing the access gap to the museum for all South Carolina school children.
2. What are the fundamentals required to accomplish the objectives?
a. Priority 1 i. Benchmark Best Practices ii. Development of a story line iii. Development of content to convey story line iv. Pricing of the concept v. Estimate vi. Funding vii. Design viii. Construction
b. Priority 2 i. Benchmark Best Practices ii. Replacement of outdate security system iii. Obtaining funding for increased Security and floor personnel iv. Development of collecting gap analysis v. Prioritize the items/objects to collect vi. Funding and acquiring
c. Priority 3
i. Benchmark Best Practices ii. Obtaining funding for school trip transportation iii. Development and funding of technology outreach iv. Obtain funding for personnel that would go to schools v. Development of curriculum that would support classroom needs

16 | P a g e
Does the agency already provide the information requested on this page, or similar information, in a report required by another entity? If yes, add the appropriate information to the Similar Information Requested Chart. If the agency looks in the Excel document attached, there is a template for the agency to complete for any questions which ask for the same nformation under the tab labeled, “Similar Info Requested.”
3. What links on the agency website, if any, would the agency like listed in the report so the public can find more information about the agency? http://www.museum.state.sc.us/
4. Is there any additional information the agency would like to provide the Committee or public?
“Windows to New Worlds” Renovation Expansion
Overview: The State Museum is brighter than ever. On Aug. 16, 2014, the museum reopened its facility with the only observatory of its kind in the nation, one of the largest planetariums in the Southeast and the only permanent 4D theater in the state. For the first time in the nation, all three of these innovative elements plus a multidisciplinary museum are housed under one roof.
Project Components:
o BlueCross BlueShield of South Carolina Planetarium: One of the largest planetariums in the
Southeast, this massive 55-foot dome planetarium and theater takes guests on journeys to the deepest reaches of space through educational and entertaining astronomy shows, non-space films dealing with art, history or natural history and laser light shows set to music of the Beatles, Pink Floyd, U2 and more.
o Rev. Dr. Solomon Jackson, Jr 4D Theater: The only permanent theater of its kind in South Carolina,
the 4D theater couples high definition 3D digital projection movies with physical features to provide multisensory, interactive experiences for guests. Physical features are synchronized to the images displayed on the screen.
o Boeing Observatory: The observatory, equipped with a computer controlled 1926 Alvan Clark 12 3/8-
inch refracting telescope, is playing a central role in the museum’s distance learning initiatives. For the first time in the nation, remote access of a vintage telescope is being provided free-of-charge to classrooms across a state. The observatory is also available to the public for onsite solar and night sky viewing.
o Robert B. Ariail Collection of Historical Astronomy: The telescope gallery features an expansive
collection of antique astronomical instruments dating back to 1730. This incredibly rare collection has been praised by the Antique Telescope Society as the best public collection of early American telescopes in world and includes the oldest surviving American-made observatory instrument.
o Guest Services: The project enabled the museum to improve its guest services with upgraded
ticketing, an enhanced entrance and an expanded lobby. It has also helped generate increased revenue with a larger store and new facility rental opportunities.
Ticketing: More efficient ticketing system and new ticketing counter. Enhanced Entry: The new entrance of the State Museum is much larger and open,
showcases textile mill design features and celebrates South Carolina. Store: The Cotton Mill Exchange museum store is in a larger 4,000 square foot
space in the front lobby and has additional merchandise that represents every corner of South Carolina.
Rental Spaces: There are new and renovated rental spaces throughout the museum helping generate additional earned income.
Project Scope: o 25,000 square feet in new construction space, including the planetarium, student
entrance, lunch room, group visits office suite and public restrooms. o 25,000 square feet of remodeled existing museum space o 25,000 square feet of additional remodeled space acquired from DHEC
17 | P a g e
Does the agency already provide the information requested on this page, or similar information, in a report required by another entity? If yes, add the appropriate information to the Similar Information Requested Chart. If the agency looks in the Excel document attached, there is a template for the agency to complete for any questions which ask for the same nformation under the tab labeled, “Similar Info Requested.”
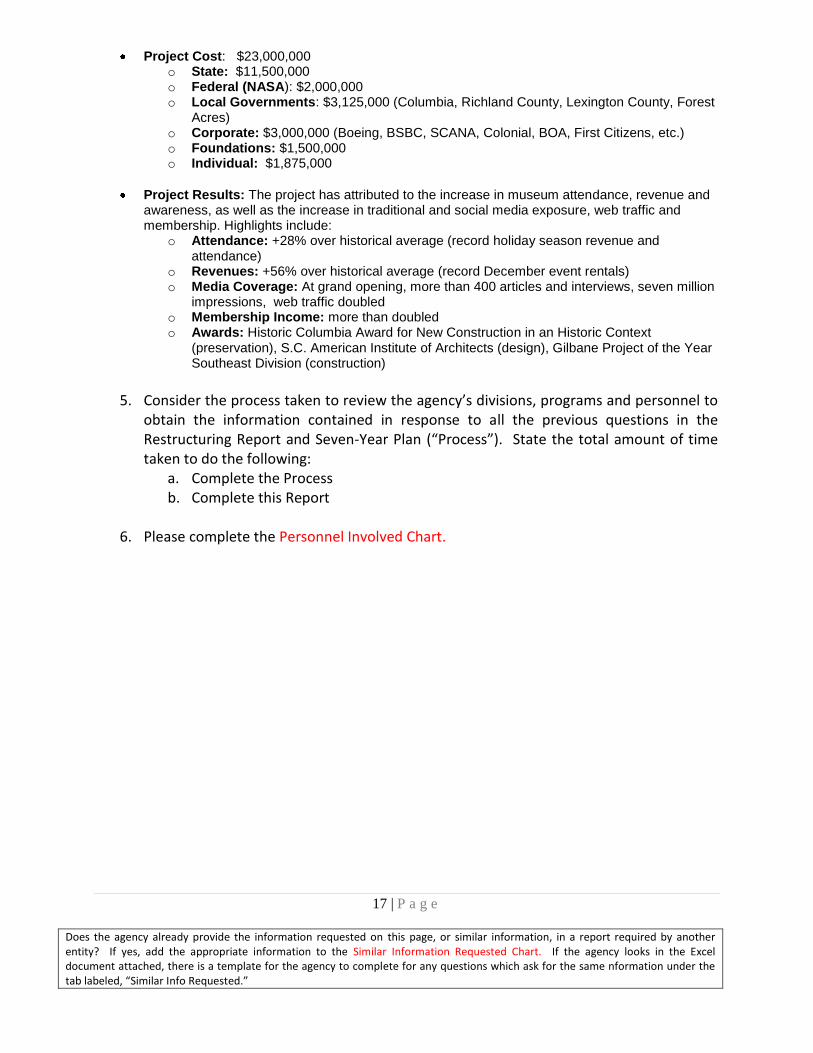
Project Cost: $23,000,000 o State: $11,500,000 o Federal (NASA): $2,000,000 o Local Governments: $3,125,000 (Columbia, Richland County, Lexington County, Forest
Acres) o Corporate: $3,000,000 (Boeing, BSBC, SCANA, Colonial, BOA, First Citizens, etc.) o Foundations: $1,500,000 o Individual: $1,875,000
Project Results: The project has attributed to the increase in museum attendance, revenue and awareness, as well as the increase in traditional and social media exposure, web traffic and membership. Highlights include:
o Attendance: +28% over historical average (record holiday season revenue and attendance)
o Revenues: +56% over historical average (record December event rentals) o Media Coverage: At grand opening, more than 400 articles and interviews, seven million
impressions, web traffic doubled o Membership Income: more than doubled o Awards: Historic Columbia Award for New Construction in an Historic Context
(preservation), S.C. American Institute of Architects (design), Gilbane Project of the Year Southeast Division (construction)
5. Consider the process taken to review the agency’s divisions, programs and personnel to
obtain the information contained in response to all the previous questions in the Restructuring Report and Seven-Year Plan (“Process”). State the total amount of time taken to do the following:
a. Complete the Process b. Complete this Report
6. Please complete the Personnel Involved Chart.
18 | P a g e
Does the agency already provide the information requested on this page, or similar information, in a report required by another entity? If yes, add the appropriate information to the Similar Information Requested Chart. If the agency looks in the Excel document attached, there is a template for the agency to complete for any questions which ask for the same nformation under the tab labeled, “Similar Info Requested.”
CHARTS APPENDIX
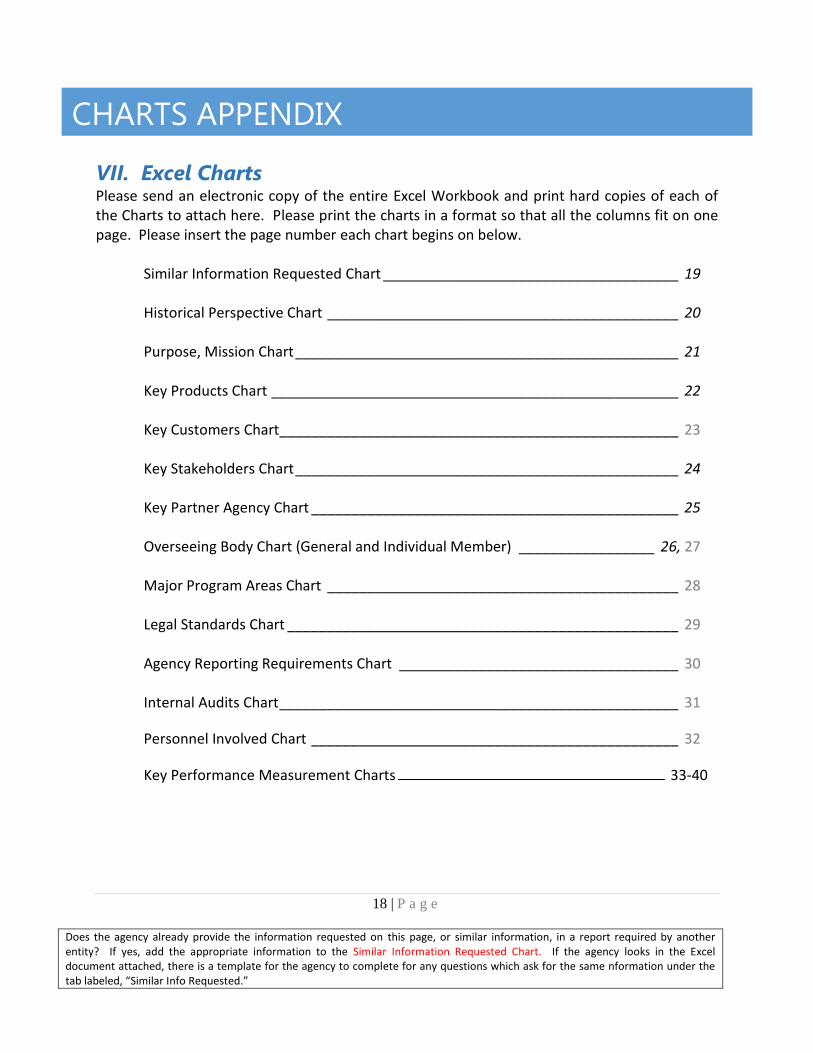
VII. Excel Charts Please send an electronic copy of the entire Excel Workbook and print hard copies of each of the Charts to attach here. Please print the charts in a format so that all the columns fit on one page. Please insert the page number each chart begins on below.
Similar Information Requested Chart _____________________________________ 19 Historical Perspective Chart ____________________________________________ 20 Purpose, Mission Chart ________________________________________________ 21 Key Products Chart ___________________________________________________ 22 Key Customers Chart __________________________________________________ 23 Key Stakeholders Chart ________________________________________________ 24 Key Partner Agency Chart ______________________________________________ 25 Overseeing Body Chart (General and Individual Member) _________________ 26, 27 Major Program Areas Chart ____________________________________________ 28 Legal Standards Chart _________________________________________________ 29 Agency Reporting Requirements Chart ___________________________________ 30 Internal Audits Chart __________________________________________________ 31
Personnel Involved Chart ______________________________________________ 32
Key Performance Measurement Charts 33-40
33
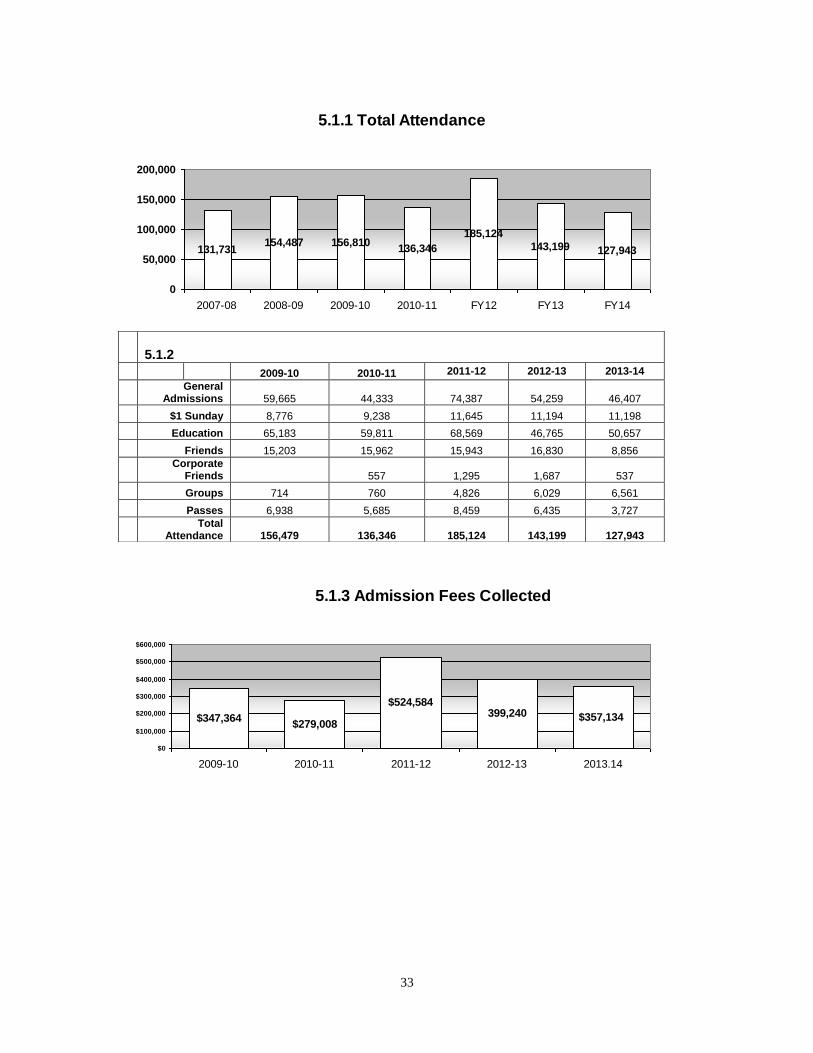
131,731154,487 156,810
136,346
185,124
143,199 127,943
0
50,000
100,000
150,000
200,000
2007-08 2008-09 2009-10 2010-11 FY12 FY13 FY14
5.1.1 Total Attendance
$347,364$279,008
$524,584399,240 $357,134
$0
$100,000
$200,000
$300,000
$400,000
$500,000
$600,000
2009-10 2010-11 2011-12 2012-13 2013.14
5.1.3 Admission Fees Collected
5.1.2
2009-10 2010-11 2011-12 2012-13 2013-14
General
Admissions 59,665 44,333 74,387 54,259 46,407
$1 Sunday 8,776 9,238 11,645 11,194 11,198
Education 65,183 59,811 68,569 46,765 50,657
Friends 15,203 15,962 15,943 16,830 8,856
Corporate
Friends 557 1,295 1,687 537
Groups 714 760 4,826 6,029 6,561
Passes 6,938 5,685 8,459 6,435 3,727
Total
Attendance 156,479 136,346 185,124 143,199 127,943

34
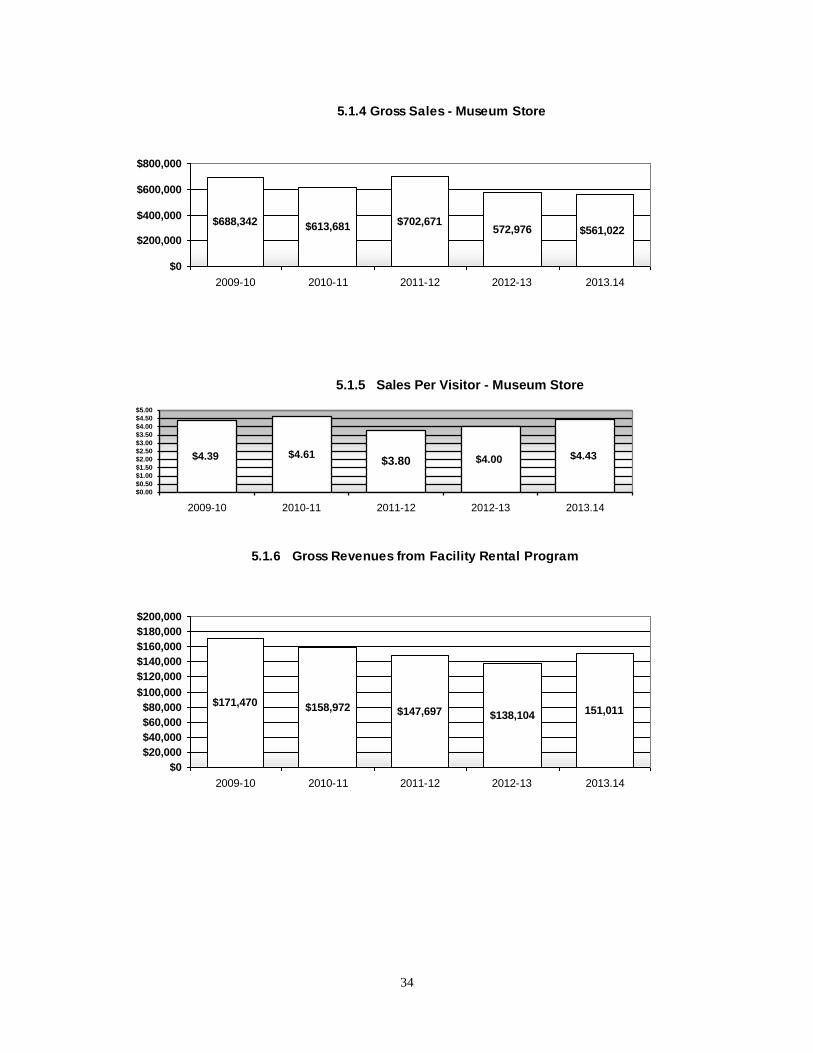
$688,342 $613,681 $702,671572,976 $561,022
$0
$200,000
$400,000
$600,000
$800,000
2009-10 2010-11 2011-12 2012-13 2013.14
5.1.4 Gross Sales - Museum Store
$4.39 $4.61 $4.00 $4.43$3.80
$0.00
$0.50
$1.00
$1.50
$2.00
$2.50
$3.00
$3.50
$4.00
$4.50
$5.00
2009-10 2010-11 2011-12 2012-13 2013.14
5.1.5 Sales Per Visitor - Museum Store
$171,470 $158,972 $147,697 $138,104 151,011
$0
$20,000
$40,000
$60,000
$80,000
$100,000
$120,000
$140,000
$160,000
$180,000
$200,000
2009-10 2010-11 2011-12 2012-13 2013.14
5.1.6 Gross Revenues from Facility Rental Program
35
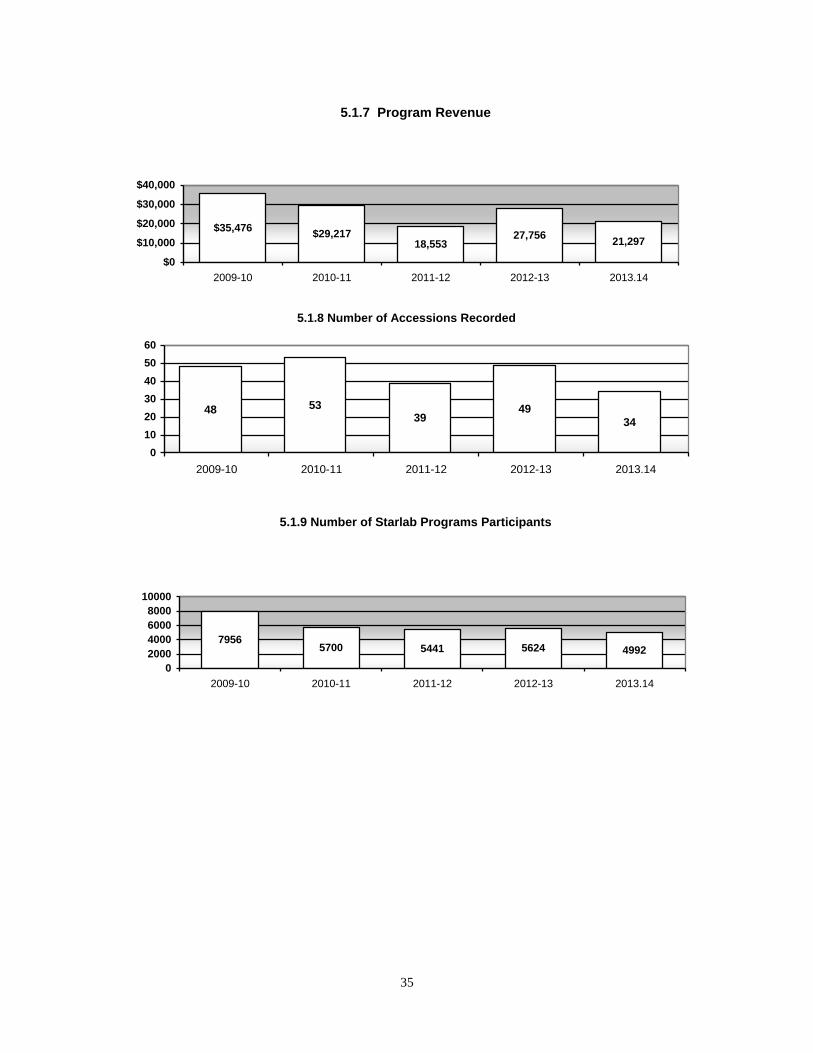
5.1.7 Program Revenue
$35,476$29,217
18,55327,756
21,297
$0
$10,000
$20,000
$30,000
$40,000
2009-10 2010-11 2011-12 2012-13 2013.14
5.1.8 Number of Accessions Recorded
48 5339
49
34
0
10
20
30
40
50
60
2009-10 2010-11 2011-12 2012-13 2013.14
5.1.9 Number of Starlab Programs Participants
79565700 5441 5624 4992
0
2000
4000
6000
8000
10000
2009-10 2010-11 2011-12 2012-13 2013.14

36
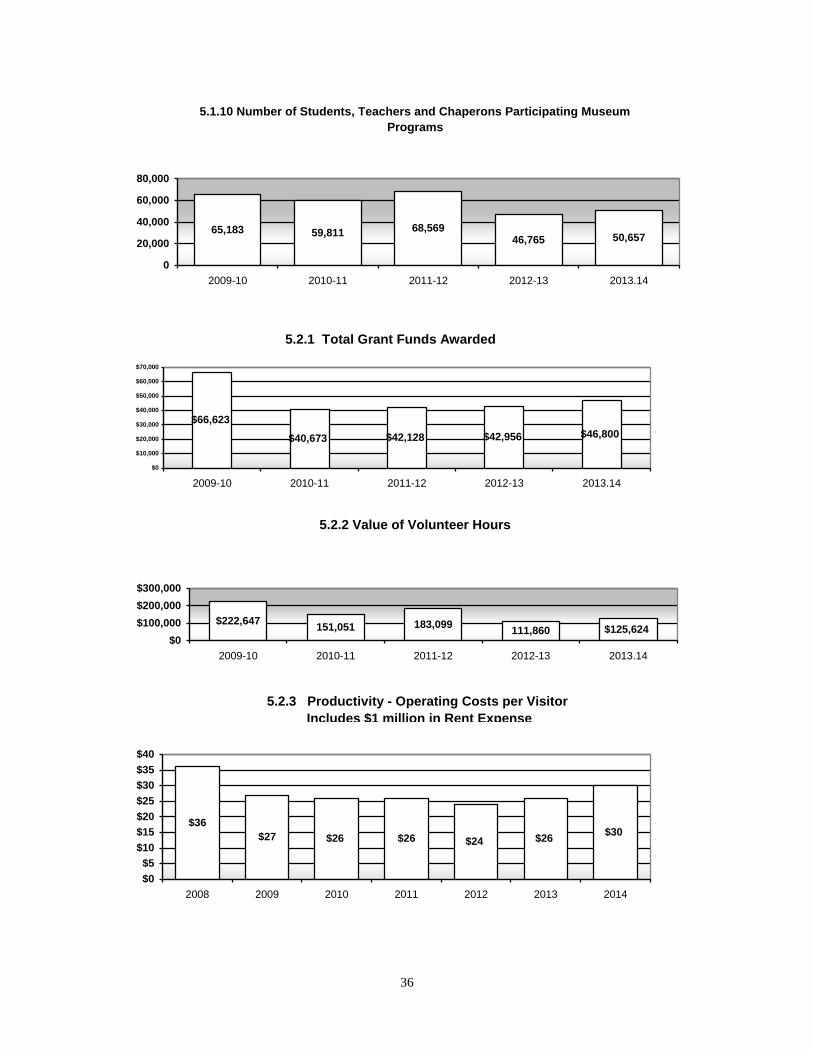
5.1.10 Number of Students, Teachers and Chaperons Participating Museum
Programs
65,183 59,811 68,56946,765 50,657
0
20,000
40,000
60,000
80,000
2009-10 2010-11 2011-12 2012-13 2013.14
$46,800$42,956$42,128$40,673
$66,623
$0
$10,000
$20,000
$30,000
$40,000
$50,000
$60,000
$70,000
2009-10 2010-11 2011-12 2012-13 2013.14
5.2.1 Total Grant Funds Awarded
5.2.2 Value of Volunteer Hours
$222,647151,051 183,099
111,860 $125,624$0
$100,000
$200,000
$300,000
2009-10 2010-11 2011-12 2012-13 2013.14
$36
$27 $26 $26 $24 $26$30
$0
$5
$10
$15
$20
$25
$30
$35
$40
2008 2009 2010 2011 2012 2013 2014
5.2.3 Productivity - Operating Costs per Visitor
Includes $1 million in Rent Expense
37
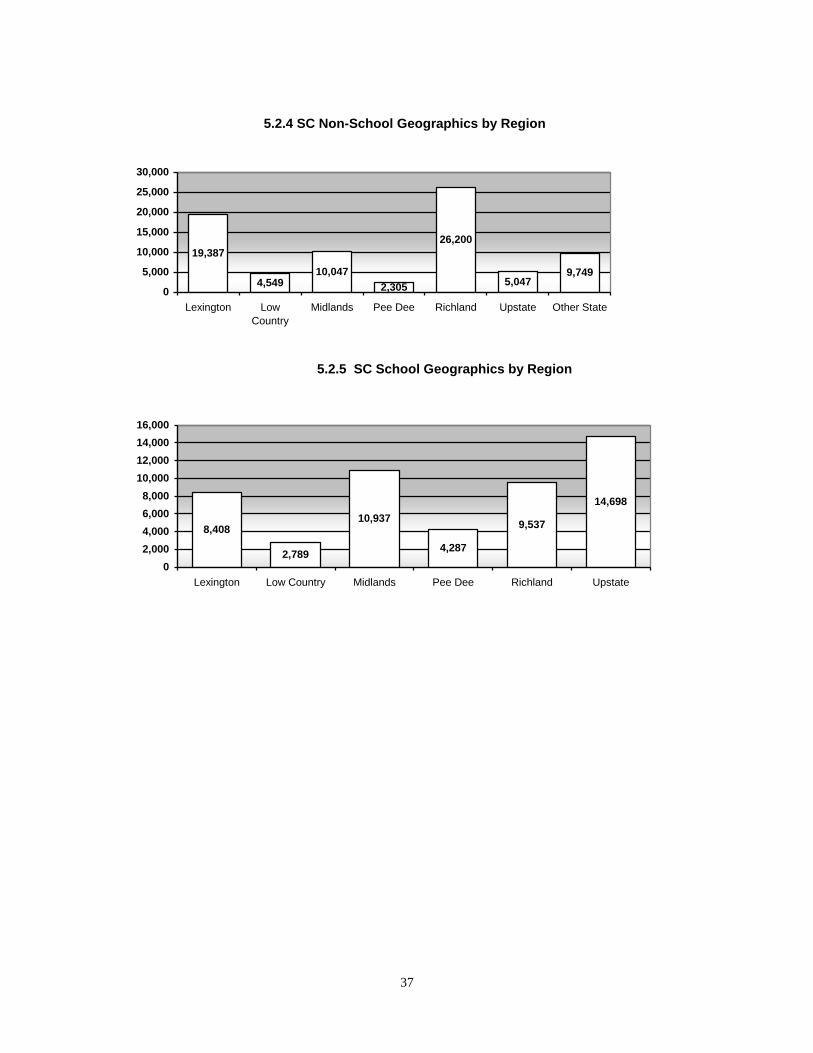
19,387
4,54910,047
2,305
26,200
5,0479,749
0
5,000
10,000
15,000
20,000
25,000
30,000
Lexington Low
Country
Midlands Pee Dee Richland Upstate Other State
5.2.4 SC Non-School Geographics by Region
8,408
2,789
10,937
4,287
9,537
14,698
0
2,000
4,000
6,000
8,000
10,000
12,000
14,000
16,000
Lexington Low Country Midlands Pee Dee Richland Upstate
5.2.5 SC School Geographics by Region

38
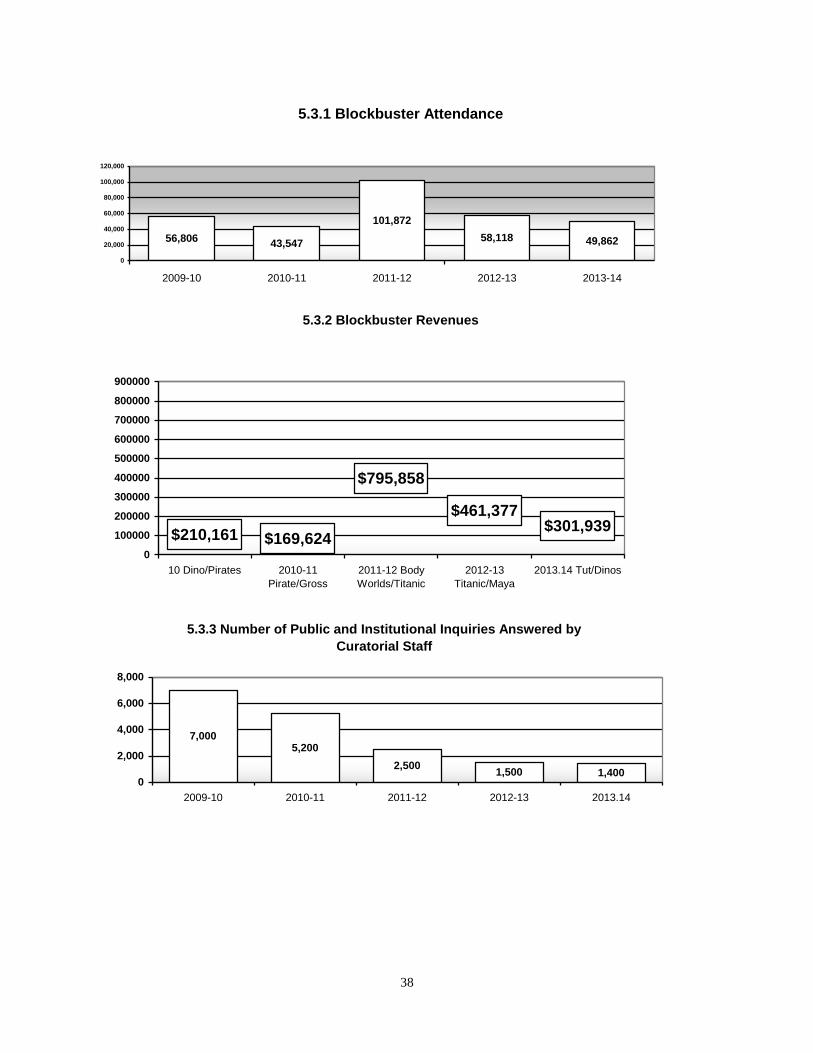
5.3.1 Blockbuster Attendance
56,80643,547
101,872
58,118 49,862
0
20,000
40,000
60,000
80,000
100,000
120,000
2009-10 2010-11 2011-12 2012-13 2013-14
5.3.2 Blockbuster Revenues
$210,161 $169,624
$795,858
$461,377$301,939
0
100000
200000
300000
400000
500000
600000
700000
800000
900000
10 Dino/Pirates 2010-11
Pirate/Gross
2011-12 Body
Worlds/Titanic
2012-13
Titanic/Maya
2013.14 Tut/Dinos
5.3.3 Number of Public and Institutional Inquiries Answered by
Curatorial Staff
7,0005,200
2,5001,500 1,400
0
2,000
4,000
6,000
8,000
2009-10 2010-11 2011-12 2012-13 2013.14
39
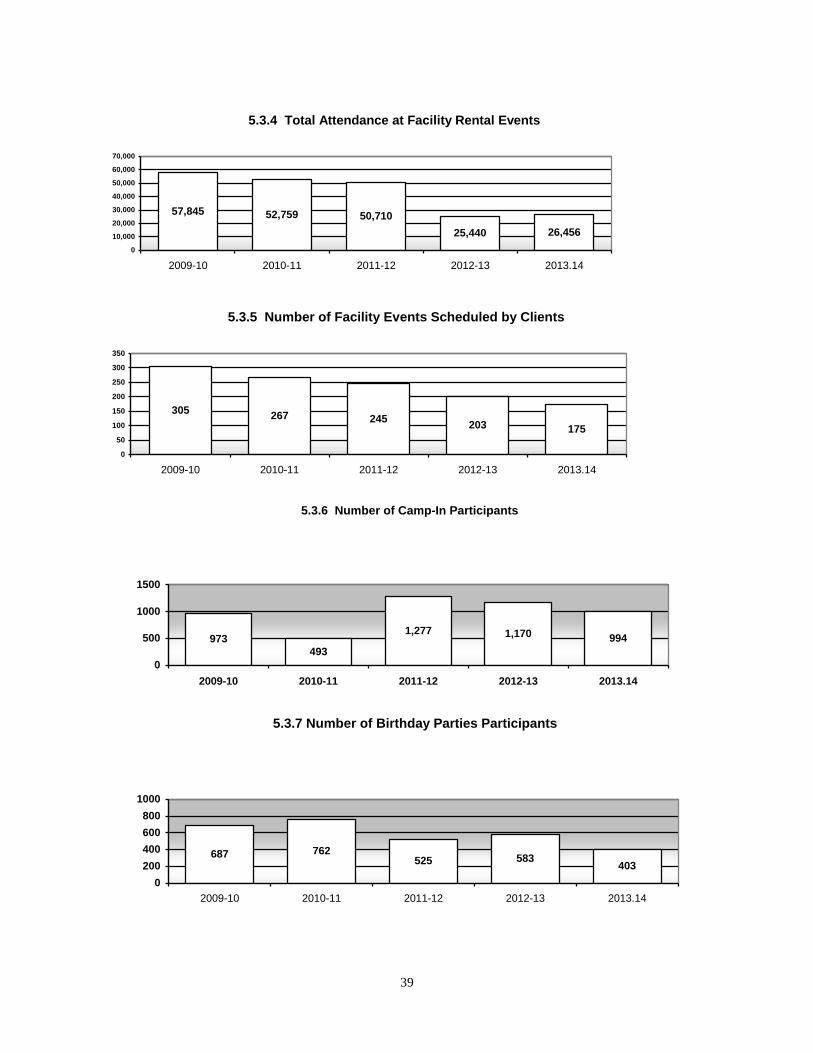
57,845 52,759 50,710
25,440 26,456
0
10,000
20,000
30,000
40,000
50,000
60,000
70,000
2009-10 2010-11 2011-12 2012-13 2013.14
5.3.4 Total Attendance at Facility Rental Events
305267 245
203 175
0
50
100
150
200
250
300
350
2009-10 2010-11 2011-12 2012-13 2013.14
5.3.5 Number of Facility Events Scheduled by Clients
5.3.6 Number of Camp-In Participants
973
493
1,277 1,170 994
0
500
1000
1500
2009-10 2010-11 2011-12 2012-13 2013.14
5.3.7 Number of Birthday Parties Participants
687 762525 583
403
0
200
400
600
800
1000
2009-10 2010-11 2011-12 2012-13 2013.14

40
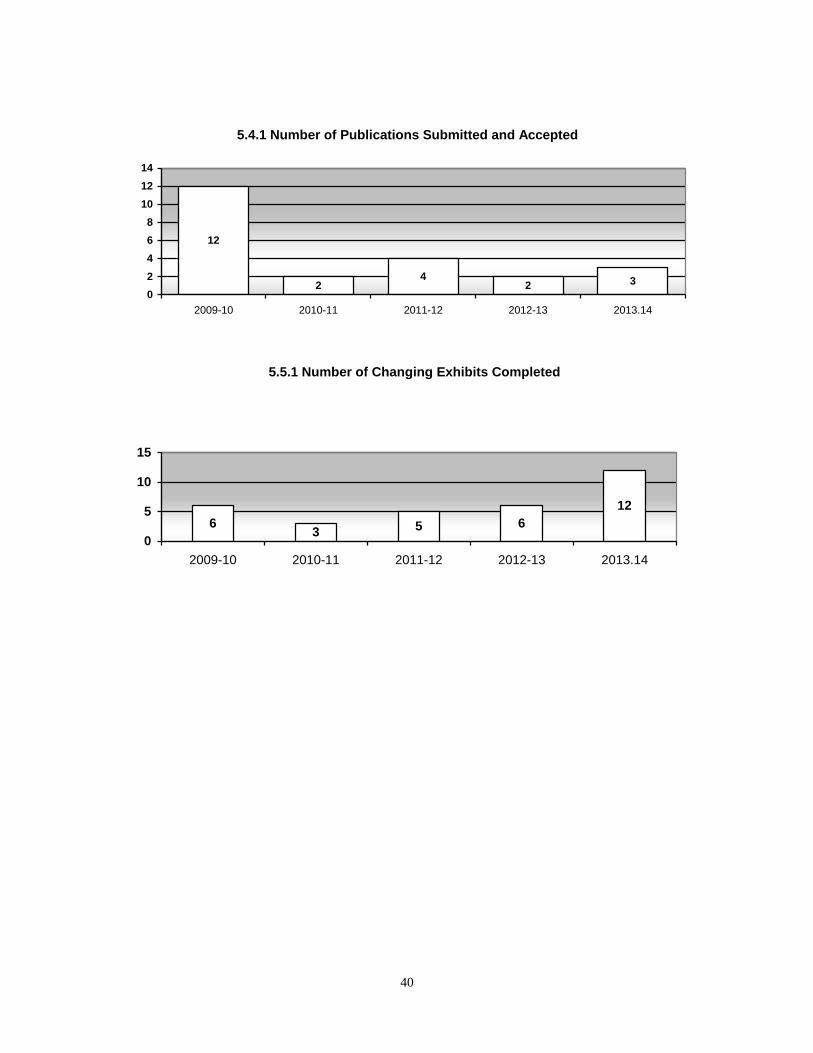
5.4.1 Number of Publications Submitted and Accepted
12
24
2 3
0
2
4
6
8
10
12
14
2009-10 2010-11 2011-12 2012-13 2013.14
5.5.1 Number of Changing Exhibits Completed
63 5 6
12
0
5
10
15
2009-10 2010-11 2011-12 2012-13 2013.14
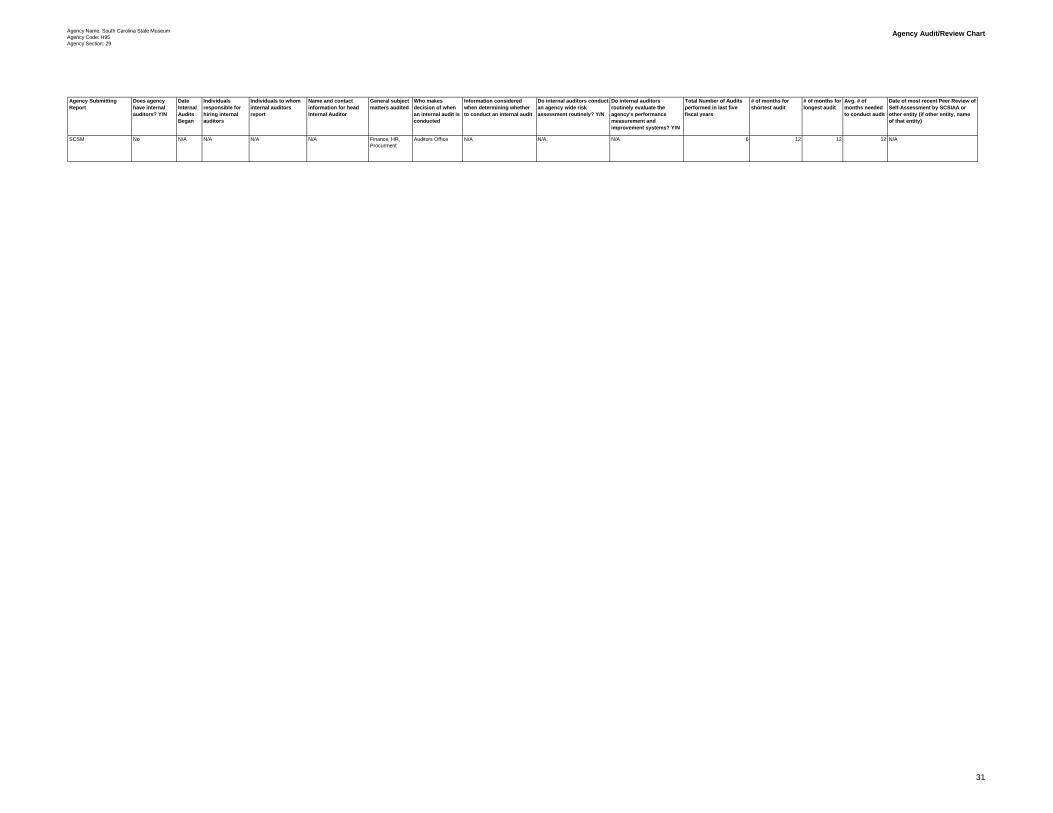
Agency Name: South Carolina State Museum
Agency Code: H95
Agency Section: 29
Agency Audit/Review Chart
Agency Submitting
Report
Does agency
have internal
auditors? Y/N
Date
Internal
Audits
Began
Individuals
responsible for
hiring internal
auditors
Individuals to whom
internal auditors
report
Name and contact
information for head
Internal Auditor
General subject
matters audited
Who makes
decision of when
an internal audit is
conducted
Information considered
when determining whether
to conduct an internal audit
Do internal auditors conduct
an agency wide risk
assessment routinely? Y/N
Do internal auditors
routinely evaluate the
agency's performance
measurement and
improvement systems? Y/N
Total Number of Audits
performed in last five
fiscal years
# of months for
shortest audit
# of months for
longest audit
Avg. # of
months needed
to conduct audit
Date of most recent Peer Review of
Self-Assessment by SCSIAA or
other entity (if other entity, name
of that entity)
SCSM No N/A N/A N/A N/A Finance, HR,
Procurment
Auditors Office N/A N/A N/A 6 12 12 12 N/A
31

33
131,731154,487 156,810
136,346
185,124
143,199 127,943
0
50,000
100,000
150,000
200,000
2007-08 2008-09 2009-10 2010-11 FY12 FY13 FY14
5.1.1 Total Attendance
$347,364$279,008
$524,584399,240 $357,134
$0
$100,000
$200,000
$300,000
$400,000
$500,000
$600,000
2009-10 2010-11 2011-12 2012-13 2013.14
5.1.3 Admission Fees Collected
5.1.2
2009-10 2010-11 2011-12 2012-13 2013-14
General
Admissions 59,665 44,333 74,387 54,259 46,407
$1 Sunday 8,776 9,238 11,645 11,194 11,198
Education 65,183 59,811 68,569 46,765 50,657
Friends 15,203 15,962 15,943 16,830 8,856
Corporate
Friends 557 1,295 1,687 537
Groups 714 760 4,826 6,029 6,561
Passes 6,938 5,685 8,459 6,435 3,727
Total
Attendance 156,479 136,346 185,124 143,199 127,943
34
$688,342 $613,681 $702,671572,976 $561,022
$0
$200,000
$400,000
$600,000
$800,000
2009-10 2010-11 2011-12 2012-13 2013.14
5.1.4 Gross Sales - Museum Store
$4.39 $4.61 $4.00 $4.43$3.80
$0.00
$0.50
$1.00
$1.50
$2.00
$2.50
$3.00
$3.50
$4.00
$4.50
$5.00
2009-10 2010-11 2011-12 2012-13 2013.14
5.1.5 Sales Per Visitor - Museum Store
$171,470 $158,972 $147,697 $138,104 151,011
$0
$20,000
$40,000
$60,000
$80,000
$100,000
$120,000
$140,000
$160,000
$180,000
$200,000
2009-10 2010-11 2011-12 2012-13 2013.14
5.1.6 Gross Revenues from Facility Rental Program

35
5.1.7 Program Revenue
$35,476$29,217
18,55327,756
21,297
$0
$10,000
$20,000
$30,000
$40,000
2009-10 2010-11 2011-12 2012-13 2013.14
5.1.8 Number of Accessions Recorded
48 5339
49
34
0
10
20
30
40
50
60
2009-10 2010-11 2011-12 2012-13 2013.14
5.1.9 Number of Starlab Programs Participants
79565700 5441 5624 4992
0
2000
4000
6000
8000
10000
2009-10 2010-11 2011-12 2012-13 2013.14
36
5.1.10 Number of Students, Teachers and Chaperons Participating Museum
Programs
65,183 59,811 68,56946,765 50,657
0
20,000
40,000
60,000
80,000
2009-10 2010-11 2011-12 2012-13 2013.14
$46,800$42,956$42,128$40,673
$66,623
$0
$10,000
$20,000
$30,000
$40,000
$50,000
$60,000
$70,000
2009-10 2010-11 2011-12 2012-13 2013.14
5.2.1 Total Grant Funds Awarded
5.2.2 Value of Volunteer Hours
$222,647151,051 183,099
111,860 $125,624$0
$100,000
$200,000
$300,000
2009-10 2010-11 2011-12 2012-13 2013.14
$36
$27 $26 $26 $24 $26$30
$0
$5
$10
$15
$20
$25
$30
$35
$40
2008 2009 2010 2011 2012 2013 2014
5.2.3 Productivity - Operating Costs per Visitor
Includes $1 million in Rent Expense

37
19,387
4,54910,047
2,305
26,200
5,0479,749
0
5,000
10,000
15,000
20,000
25,000
30,000
Lexington Low
Country
Midlands Pee Dee Richland Upstate Other State
5.2.4 SC Non-School Geographics by Region
8,408
2,789
10,937
4,287
9,537
14,698
0
2,000
4,000
6,000
8,000
10,000
12,000
14,000
16,000
Lexington Low Country Midlands Pee Dee Richland Upstate
5.2.5 SC School Geographics by Region
38
5.3.1 Blockbuster Attendance
56,80643,547
101,872
58,118 49,862
0
20,000
40,000
60,000
80,000
100,000
120,000
2009-10 2010-11 2011-12 2012-13 2013-14
5.3.2 Blockbuster Revenues
$210,161 $169,624
$795,858
$461,377$301,939
0
100000
200000
300000
400000
500000
600000
700000
800000
900000
10 Dino/Pirates 2010-11
Pirate/Gross
2011-12 Body
Worlds/Titanic
2012-13
Titanic/Maya
2013.14 Tut/Dinos
5.3.3 Number of Public and Institutional Inquiries Answered by
Curatorial Staff
7,0005,200
2,5001,500 1,400
0
2,000
4,000
6,000
8,000
2009-10 2010-11 2011-12 2012-13 2013.14

39
57,845 52,759 50,710
25,440 26,456
0
10,000
20,000
30,000
40,000
50,000
60,000
70,000
2009-10 2010-11 2011-12 2012-13 2013.14
5.3.4 Total Attendance at Facility Rental Events
305267 245
203 175
0
50
100
150
200
250
300
350
2009-10 2010-11 2011-12 2012-13 2013.14
5.3.5 Number of Facility Events Scheduled by Clients
5.3.6 Number of Camp-In Participants
973
493
1,277 1,170 994
0
500
1000
1500
2009-10 2010-11 2011-12 2012-13 2013.14
5.3.7 Number of Birthday Parties Participants
687 762525 583
403
0
200
400
600
800
1000
2009-10 2010-11 2011-12 2012-13 2013.14
40
5.4.1 Number of Publications Submitted and Accepted
12
24
2 3
0
2
4
6
8
10
12
14
2009-10 2010-11 2011-12 2012-13 2013.14
5.5.1 Number of Changing Exhibits Completed
63 5 6
12
0
5
10
15
2009-10 2010-11 2011-12 2012-13 2013.14