Embed Size (px)
Citation preview
DOI:10.22623/IJAPSA.2021.7006.WEDX8 Page 38
Rice Yield, Nutrient Uptake and Use Efficiency As Influenced By
Nitrogen and Silicon Application
Nitrogen and Silicon on rice
Aravinth Kumar.P1, M.V. Sriramachandrasekharan
2 and T.Muthukumararaja
3
1,2,3 Department of Soil Science and Agricultural Chemistry, Faculty of Agriculture, Annamalai
University, Annamalainagar-608002
Abstract
The experiment was conducted in two seasons’ kharif and Rabi 2018 in farmer’s field Kuttalam with following treatments. Factor A – Nitrogen levels (0, 50, 100, 150 kg/ha) and Factor B – silicon levels (0, 50, 100, 150 kg/ha). Totally sixteen treatments was imposed in FRBD design with three replications with test crop rice var., ADT 43 and CR1009. Grain and straw yield were recorded at harvest. Grain and straw was analyzed for nitrogen and silicon content and their uptake was computed. Silicon and nitrogen use efficiency were worked out based on yield and uptake. The outcome of the experiment showed that grain and straw increased linearly with nitrogen and silicon levels. The highest grain yield (4983, 5893 kg/ha) and straw yield (6233, 7137kg/ha) was noticed with 150 kg N/ha during kharif and rabi seasons, respectively. Similarly the highest grain yield (5291, 6054 kg ha-1) and straw yield (6520, 7482 kg ha-1) was observed with 150 kg Si /ha during kharif and rabi seasons, respectively. However when nitrogen and silicon applied together, the highest grain yield (5600, 6786 kg ha-1) and straw yield (6811, 8031 kg ha-1) was noticed with 150 kg N / ha + 150 kg Si / ha. However it was comparable with 150 kg N / ha + 100 kg Si / ha and 100 kg N / ha + 150 kg Si / ha.The highest nutrient uptake was recorded with 150 kg N / ha + 150 kg Si / ha. It was comparable with 150 kg N / ha + 100 kg Si / ha.Agronomic efficiency of N and apparent N recovery was maximum at 50 kg N/ha and 150 kg Si/ha. Agronomic efficiency of Si and apparent Si recovery was maximum with 50 kg Si/ha and 150 kg N/ha.
Key words: Rice, yield, uptake, NUE, nitrogen, silicon
I. INTRODUCTION
Rice is the staple food for about 50 per cent of the world’s population (72.7 billion) that resides in Asia where 90 per cent of the world’s rice is grown and consumed. With nearly 154 million hectares harvested each year, rice is one of the most important cereal crops in the world. It is the major source of calorie intake and the staple food for more than three billion people in the world [30].Rice is the first mostimportant crop in India where it is grown in an area of 43.79million ha-1 with a total production of 112.91 million tonesand an average productivity of 2578 kg ha-1[2].India is firstin terms of area (44.5 million ha) and second in production(172.58 million tonnes) [9].The demand for rice is steadily increasing due to an increase in global population. However, certain constraints such as water scarcity, pest infestation, inadequate fertilizer use and growing of low-yielding traditional varieties restrict yield increase [5].Soil is an important medium for plant growth which supplies nutrients to plants in addition to provide mechanical anchorage.Nitrogen (N) is an essential element and a constituent of protoplasm, proteins and chlorophyll. It plays an important role in many
International Journal of Applied and Pure Science and Agriculture (IJAPSA)
Volume 07, Issue 6, [June-2021] e-ISSN: 2394-5532, p-ISSN: 2394-823X
@IJAPSA-2021,All rights Reserved Page 39
physiological andbiochemical activities.Nitrogenous fertilizers have contributed much to the remarkable increase in food production that has occurred during the past 50 years [28].On a global scale, higher cereal yields are likely to be achieved through a combination of increased N applications in regions with low N fertilizer use. For example, the global PFPN in cereals only needs to increase at a rate of 0.1 to 0.4% yr-1 to meet cereal demand in 2025 [8].Silicic acid or ortho silicic acid (Si(OH)4, or H4SiO4) are the soluble, plant available form of silicon in soils. Rice plant absorbs Si by the roots in the form of ortho silicic acid (H4SiO4) along with water and translocated to the shoots. The potential of Si in improving crop yield has been demonstrated in many studies, especially under abiotic and biotic stress conditions (drought, heavy metals, salinity and pathogens)[11,21]. Plant available Si in the soils of tropical and subtropical areas including Vietnam is generally low[21]. Si has already been recognized as a functional nutrient for a number of crops, particularly rice and sugarcane, and plays an important role in the growth and development of crops, especially gramineae crops [15]. Si has been reported to benefit rice in a number of ways[16].Si fertilizer has been used in many countries for improving rice yield [13].Rice requires large amounts of nitrogen and silicon for growth. Apparently applied Si seems to interact favourably with other applied fertilizer nutrients (namely N, P and K) and offers the potential to improve their agronomic performance and efficiency in terms of yield response.Because of the synergistic effect, Si application has the potential to raise the optimal nitrogen (N) rate, leading to enhanced rice productivity. [31]observed that addition of calcium silicate @ 2 t ha-1 along with LCC based N application of 75 kg ha-1 registered maximum rice yield. [19]reported that combined application of 125 kg N ha-1 and 600 kg Si ha-1 registered maximum rice yield and nutrient uptake. With this background information, field experiments were conducted to know the amalgamated effect of nitrogen and silicon on rice grown in typic ustifluvent soil.
II. MATERIALS AND METHODS
The field experiments were conducted in the farmer’s holdinggeographically situated at latitude 11.10˚N and of longitude of 79.67˚E. The experimental soil belongs to sandy clay loam and taxonomically classified as Typic Ustifluvent with pH-7.25, EC- 0.15 dSm-1, organic carbon- 3.5 g kg-1, KMnO4-N- 251 kg ha-1( low), Olsen-P- 17.4 kg ha-1( medium), NH4OAc-K- 228 kg ha-1 ( medium) and available silicon- 25 mg kg-1. The treatment structure was Factor A-Nitrogen Levels (0, 50,100, 150 kg ha-1) and factor B- silicon levels (0, 50, 100, 150 kg ha-1). The experiments was conducted in factorial RBD with 3 replications during kharif and rabi seasons 2018 with test crop rice variety ADT43 and CR1009, respectively. Silicon was applied basally through magnesium silicate (37% Mg and 49% Si) as per the treatment schedule. Recommended dose of 50 kg P2O5/ha and 50 kg K2O / ha was applied to all plots through superphosphate and KCl. Nitrogen through urea was applied in split doses as per the treatment schedule.The grain yield was recorded at 14 percent moisture level and the straw yield was recorded after sun drying .The yield was expressed in kg ha-1. The grain and straw was analyzed for nitrogen, phosphorus, potassium and silicon content following the standard procedure. The respective nutrient uptake were worked out by multiplying the nutrient content with grain and straw. Based on grain yield and nutrient uptake, silicon and nitrogen use efficiency were computed.
III. RESULTS AND DISCUSSION
A. Rice yield
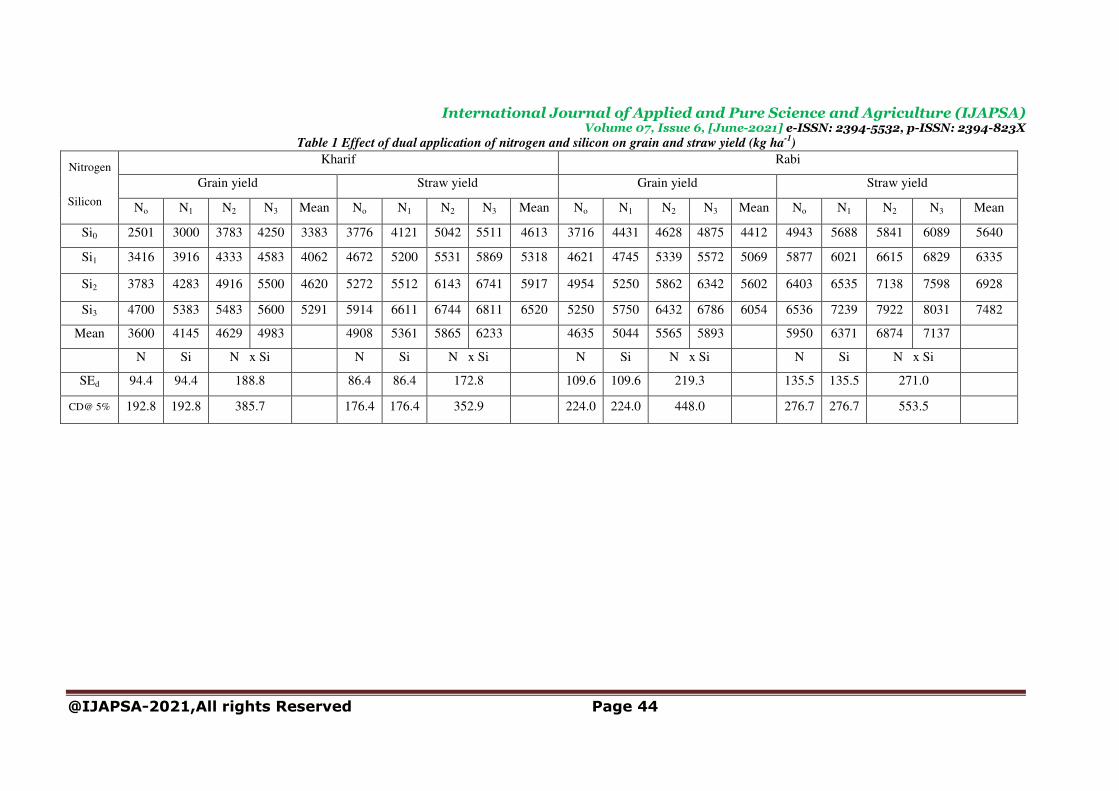
Addition of different levels of nitrogen or silicon or both caused significant increase in grain and straw yield over control in both reasons(table1). The grain yield ranged from 2501
International Journal of Applied and Pure Science and Agriculture (IJAPSA)
Volume 07, Issue 6, [June-2021] e-ISSN: 2394-5532, p-ISSN: 2394-823X
@IJAPSA-2021,All rights Reserved Page 40
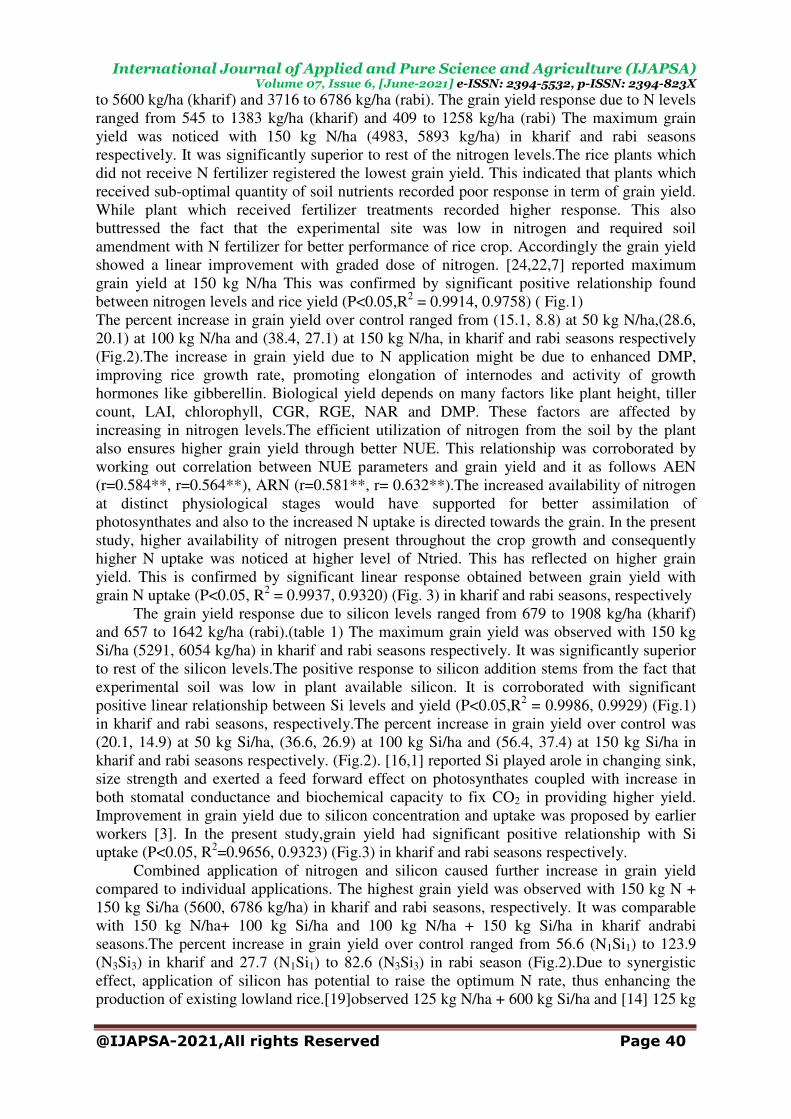
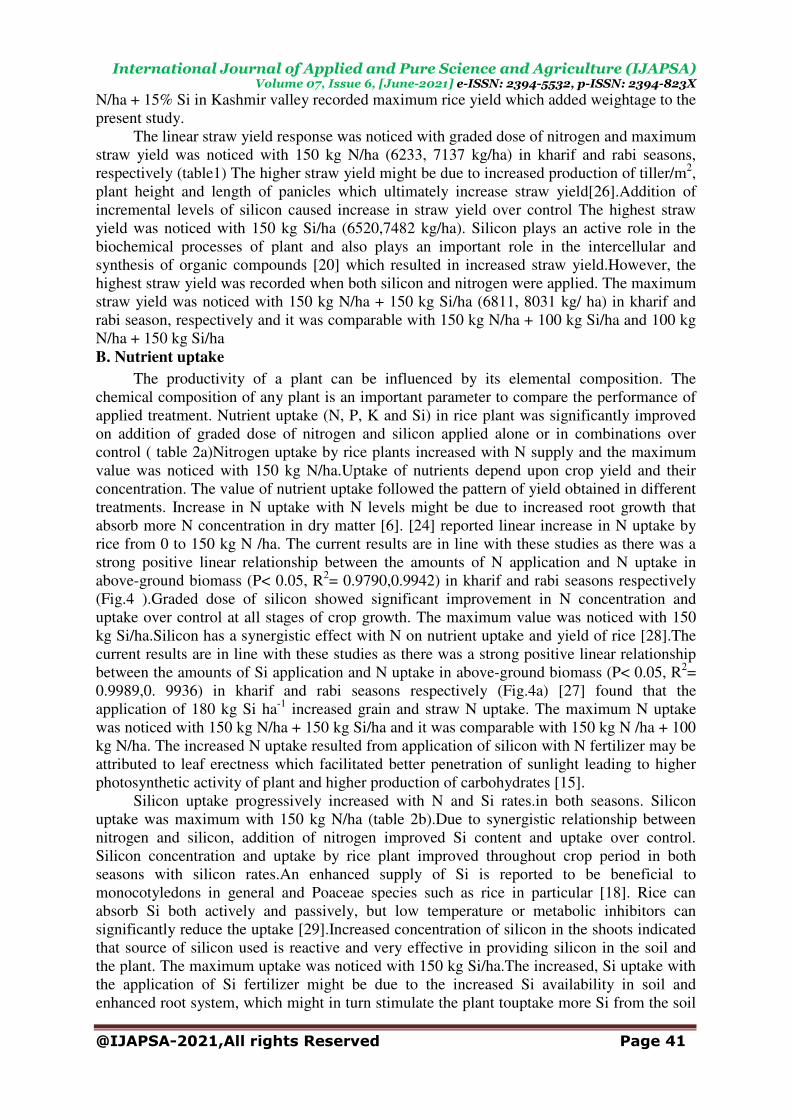
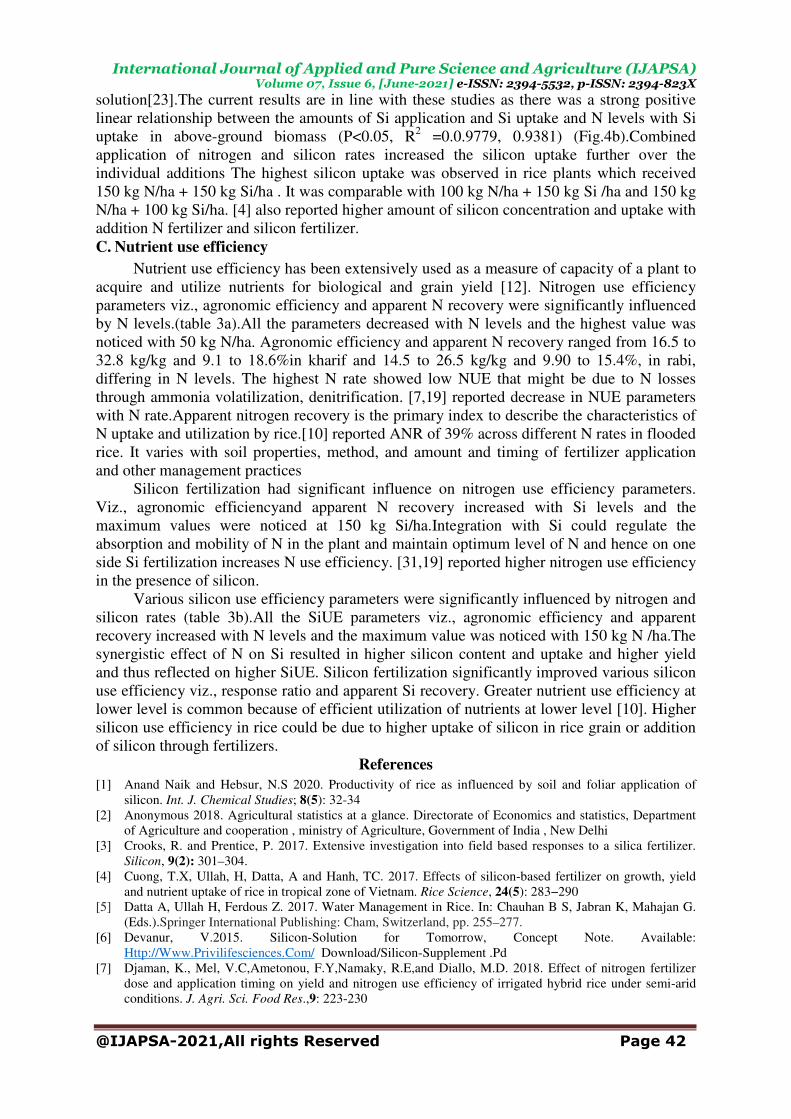
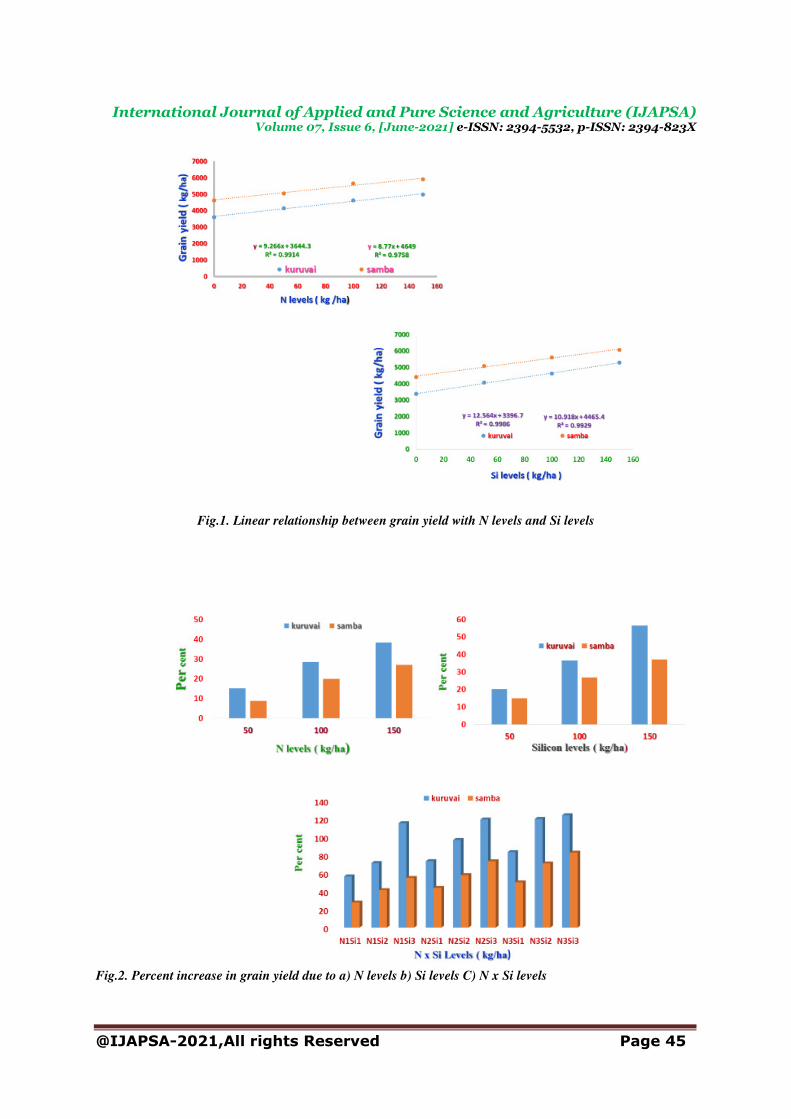
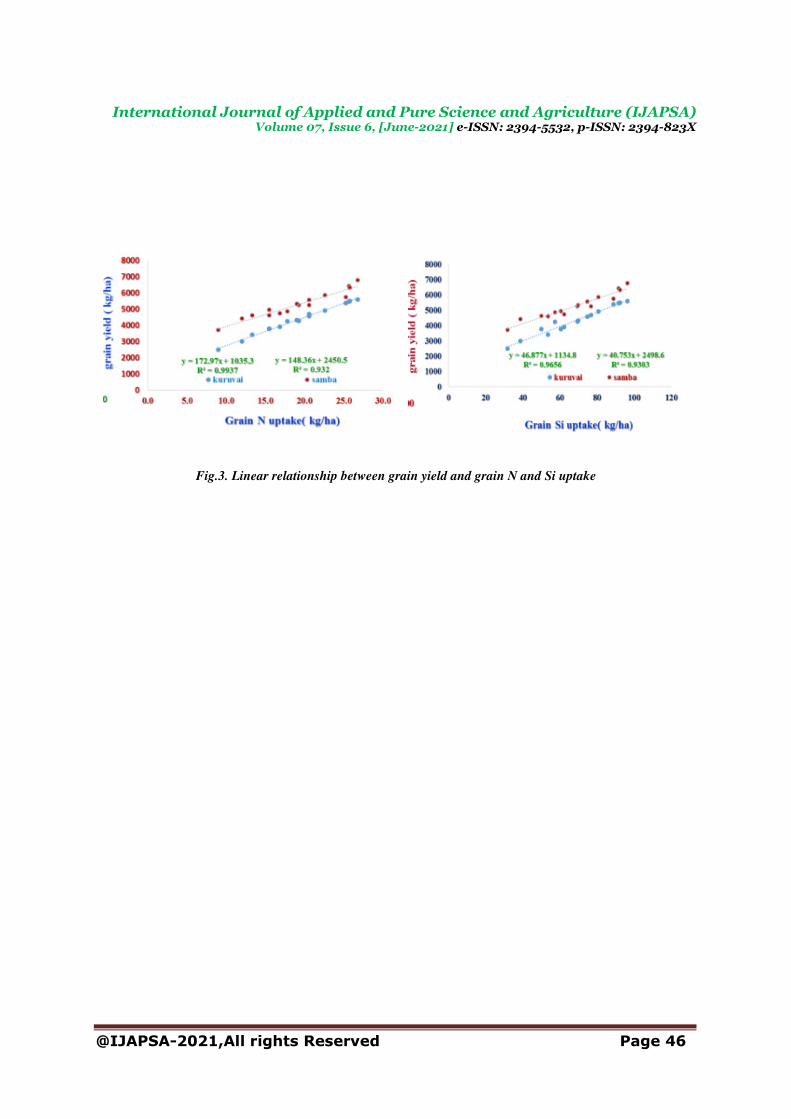
to 5600 kg/ha (kharif) and 3716 to 6786 kg/ha (rabi). The grain yield response due to N levels ranged from 545 to 1383 kg/ha (kharif) and 409 to 1258 kg/ha (rabi) The maximum grain yield was noticed with 150 kg N/ha (4983, 5893 kg/ha) in kharif and rabi seasons respectively. It was significantly superior to rest of the nitrogen levels.The rice plants which did not receive N fertilizer registered the lowest grain yield. This indicated that plants which received sub-optimal quantity of soil nutrients recorded poor response in term of grain yield. While plant which received fertilizer treatments recorded higher response. This also buttressed the fact that the experimental site was low in nitrogen and required soil amendment with N fertilizer for better performance of rice crop. Accordingly the grain yield showed a linear improvement with graded dose of nitrogen. [24,22,7] reported maximum grain yield at 150 kg N/ha This was confirmed by significant positive relationship found between nitrogen levels and rice yield (P<0.05,R2 = 0.9914, 0.9758) ( Fig.1) The percent increase in grain yield over control ranged from (15.1, 8.8) at 50 kg N/ha,(28.6, 20.1) at 100 kg N/ha and (38.4, 27.1) at 150 kg N/ha, in kharif and rabi seasons respectively (Fig.2).The increase in grain yield due to N application might be due to enhanced DMP, improving rice growth rate, promoting elongation of internodes and activity of growth hormones like gibberellin. Biological yield depends on many factors like plant height, tiller count, LAI, chlorophyll, CGR, RGE, NAR and DMP. These factors are affected by increasing in nitrogen levels.The efficient utilization of nitrogen from the soil by the plant also ensures higher grain yield through better NUE. This relationship was corroborated by working out correlation between NUE parameters and grain yield and it as follows AEN (r=0.584**, r=0.564**), ARN (r=0.581**, r= 0.632**).The increased availability of nitrogen at distinct physiological stages would have supported for better assimilation of photosynthates and also to the increased N uptake is directed towards the grain. In the present study, higher availability of nitrogen present throughout the crop growth and consequently higher N uptake was noticed at higher level of Ntried. This has reflected on higher grain yield. This is confirmed by significant linear response obtained between grain yield with grain N uptake (P<0.05, R2 = 0.9937, 0.9320) (Fig. 3) in kharif and rabi seasons, respectively
The grain yield response due to silicon levels ranged from 679 to 1908 kg/ha (kharif) and 657 to 1642 kg/ha (rabi).(table 1) The maximum grain yield was observed with 150 kg Si/ha (5291, 6054 kg/ha) in kharif and rabi seasons respectively. It was significantly superior to rest of the silicon levels.The positive response to silicon addition stems from the fact that experimental soil was low in plant available silicon. It is corroborated with significant positive linear relationship between Si levels and yield (P<0.05,R2 = 0.9986, 0.9929) (Fig.1) in kharif and rabi seasons, respectively.The percent increase in grain yield over control was (20.1, 14.9) at 50 kg Si/ha, (36.6, 26.9) at 100 kg Si/ha and (56.4, 37.4) at 150 kg Si/ha in kharif and rabi seasons respectively. (Fig.2). [16,1] reported Si played arole in changing sink, size strength and exerted a feed forward effect on photosynthates coupled with increase in both stomatal conductance and biochemical capacity to fix CO2 in providing higher yield. Improvement in grain yield due to silicon concentration and uptake was proposed by earlier workers [3]. In the present study,grain yield had significant positive relationship with Si uptake (P<0.05, R2=0.9656, 0.9323) (Fig.3) in kharif and rabi seasons respectively.
Combined application of nitrogen and silicon caused further increase in grain yield compared to individual applications. The highest grain yield was observed with 150 kg N + 150 kg Si/ha (5600, 6786 kg/ha) in kharif and rabi seasons, respectively. It was comparable with 150 kg N/ha+ 100 kg Si/ha and 100 kg N/ha + 150 kg Si/ha in kharif andrabi seasons.The percent increase in grain yield over control ranged from 56.6 (N1Si1) to 123.9 (N3Si3) in kharif and 27.7 (N1Si1) to 82.6 (N3Si3) in rabi season (Fig.2).Due to synergistic effect, application of silicon has potential to raise the optimum N rate, thus enhancing the production of existing lowland rice.[19]observed 125 kg N/ha + 600 kg Si/ha and [14] 125 kg
International Journal of Applied and Pure Science and Agriculture (IJAPSA)
Volume 07, Issue 6, [June-2021] e-ISSN: 2394-5532, p-ISSN: 2394-823X
@IJAPSA-2021,All rights Reserved Page 41
N/ha + 15% Si in Kashmir valley recorded maximum rice yield which added weightage to the present study.
The linear straw yield response was noticed with graded dose of nitrogen and maximum straw yield was noticed with 150 kg N/ha (6233, 7137 kg/ha) in kharif and rabi seasons, respectively (table1) The higher straw yield might be due to increased production of tiller/m2, plant height and length of panicles which ultimately increase straw yield[26].Addition of incremental levels of silicon caused increase in straw yield over control The highest straw yield was noticed with 150 kg Si/ha (6520,7482 kg/ha). Silicon plays an active role in the biochemical processes of plant and also plays an important role in the intercellular and synthesis of organic compounds [20] which resulted in increased straw yield.However, the highest straw yield was recorded when both silicon and nitrogen were applied. The maximum straw yield was noticed with 150 kg N/ha + 150 kg Si/ha (6811, 8031 kg/ ha) in kharif and rabi season, respectively and it was comparable with 150 kg N/ha + 100 kg Si/ha and 100 kg N/ha + 150 kg Si/ha
B. Nutrient uptake
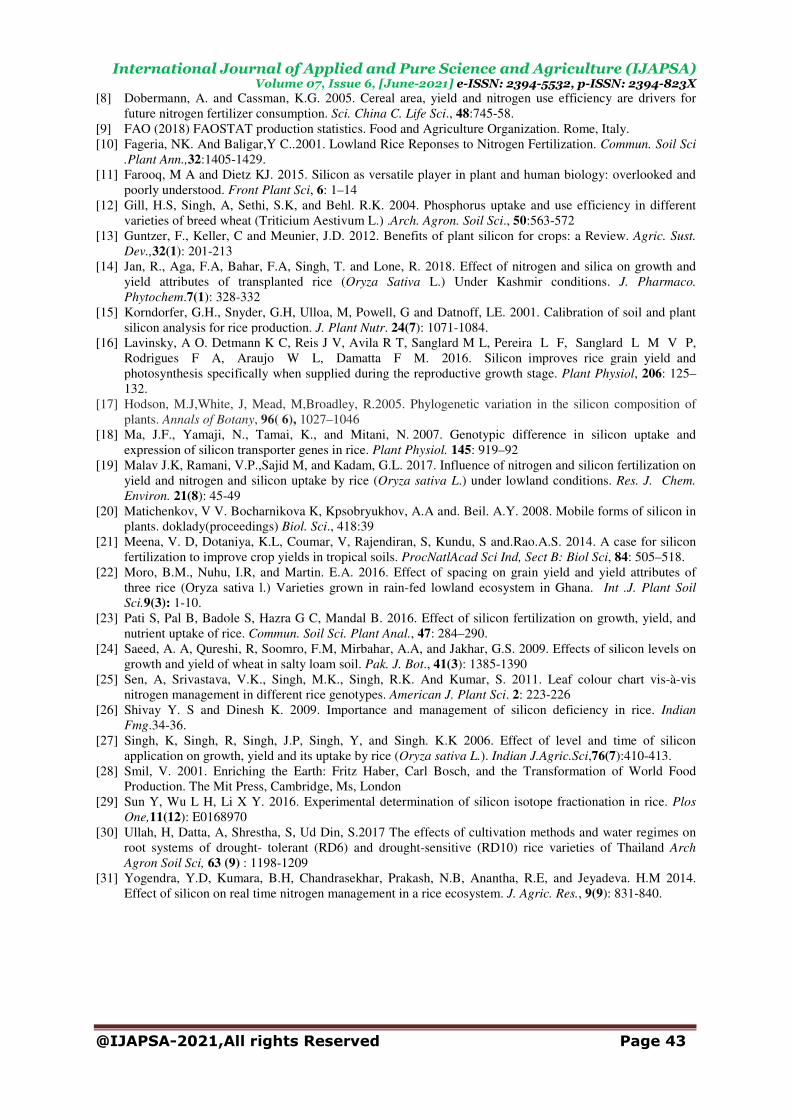
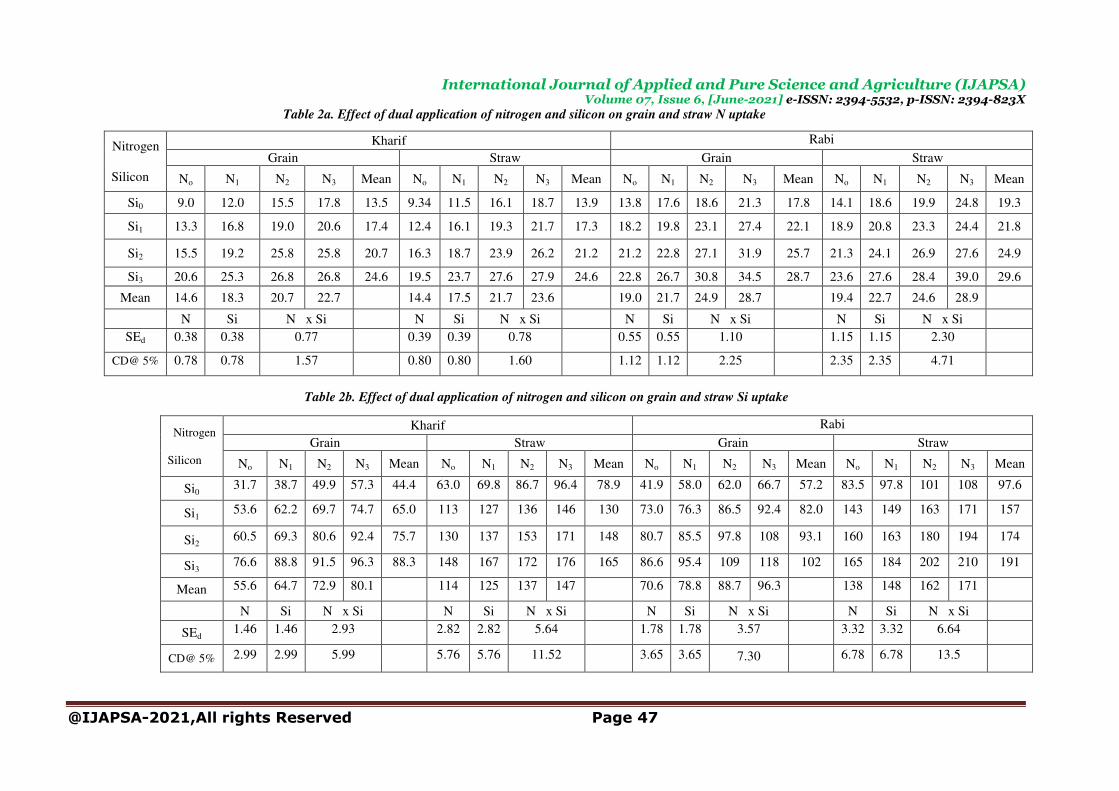
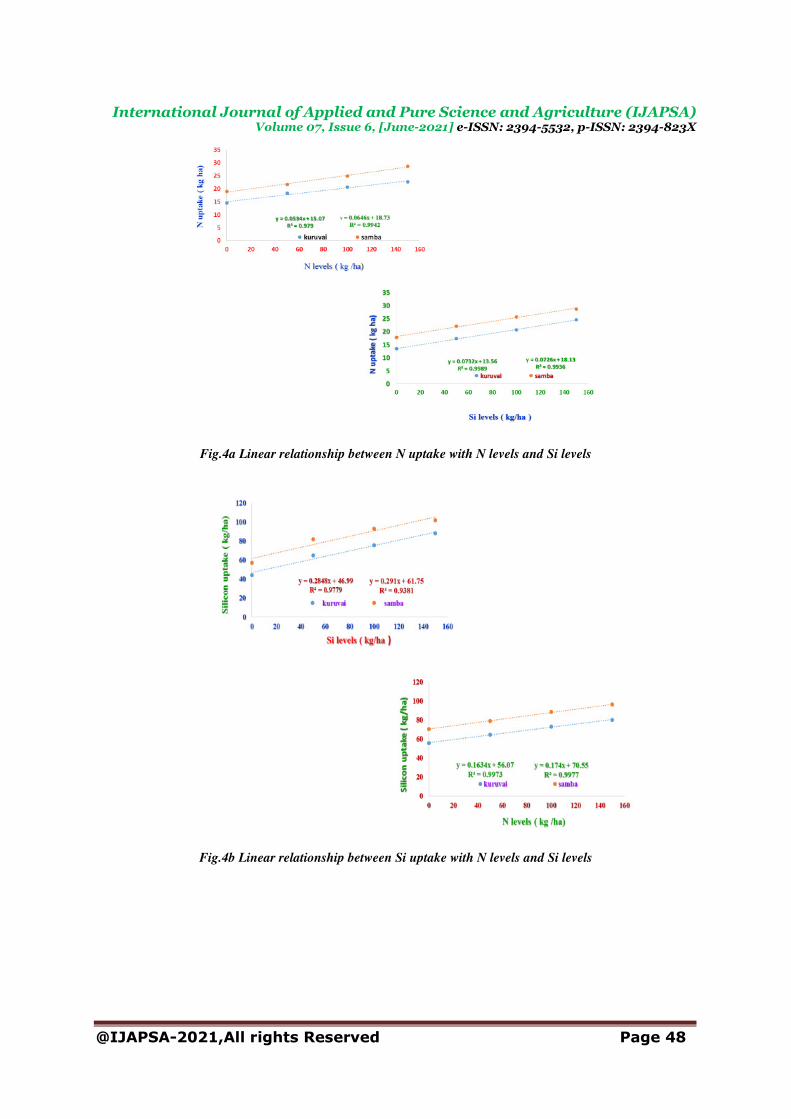
The productivity of a plant can be influenced by its elemental composition. The chemical composition of any plant is an important parameter to compare the performance of applied treatment. Nutrient uptake (N, P, K and Si) in rice plant was significantly improved on addition of graded dose of nitrogen and silicon applied alone or in combinations over control ( table 2a)Nitrogen uptake by rice plants increased with N supply and the maximum value was noticed with 150 kg N/ha.Uptake of nutrients depend upon crop yield and their concentration. The value of nutrient uptake followed the pattern of yield obtained in different treatments. Increase in N uptake with N levels might be due to increased root growth that absorb more N concentration in dry matter [6]. [24] reported linear increase in N uptake by rice from 0 to 150 kg N /ha. The current results are in line with these studies as there was a strong positive linear relationship between the amounts of N application and N uptake in above-ground biomass (P< 0.05, R2= 0.9790,0.9942) in kharif and rabi seasons respectively (Fig.4 ).Graded dose of silicon showed significant improvement in N concentration and uptake over control at all stages of crop growth. The maximum value was noticed with 150 kg Si/ha.Silicon has a synergistic effect with N on nutrient uptake and yield of rice [28].The current results are in line with these studies as there was a strong positive linear relationship between the amounts of Si application and N uptake in above-ground biomass (P< 0.05, R2= 0.9989,0. 9936) in kharif and rabi seasons respectively (Fig.4a) [27] found that the application of 180 kg Si ha-1 increased grain and straw N uptake. The maximum N uptake was noticed with 150 kg N/ha + 150 kg Si/ha and it was comparable with 150 kg N /ha + 100 kg N/ha. The increased N uptake resulted from application of silicon with N fertilizer may be attributed to leaf erectness which facilitated better penetration of sunlight leading to higher photosynthetic activity of plant and higher production of carbohydrates [15]. Silicon uptake progressively increased with N and Si rates.in both seasons. Silicon uptake was maximum with 150 kg N/ha (table 2b).Due to synergistic relationship between nitrogen and silicon, addition of nitrogen improved Si content and uptake over control. Silicon concentration and uptake by rice plant improved throughout crop period in both seasons with silicon rates.An enhanced supply of Si is reported to be beneficial to monocotyledons in general and Poaceae species such as rice in particular [18]. Rice can absorb Si both actively and passively, but low temperature or metabolic inhibitors can significantly reduce the uptake [29].Increased concentration of silicon in the shoots indicated that source of silicon used is reactive and very effective in providing silicon in the soil and the plant. The maximum uptake was noticed with 150 kg Si/ha.The increased, Si uptake with the application of Si fertilizer might be due to the increased Si availability in soil and enhanced root system, which might in turn stimulate the plant touptake more Si from the soil
International Journal of Applied and Pure Science and Agriculture (IJAPSA)
Volume 07, Issue 6, [June-2021] e-ISSN: 2394-5532, p-ISSN: 2394-823X
@IJAPSA-2021,All rights Reserved Page 42
solution[23].The current results are in line with these studies as there was a strong positive linear relationship between the amounts of Si application and Si uptake and N levels with Si uptake in above-ground biomass (P<0.05, R2 =0.0.9779, 0.9381) (Fig.4b).Combined application of nitrogen and silicon rates increased the silicon uptake further over the individual additions The highest silicon uptake was observed in rice plants which received 150 kg N/ha + 150 kg Si/ha . It was comparable with 100 kg N/ha + 150 kg Si /ha and 150 kg N/ha + 100 kg Si/ha. [4] also reported higher amount of silicon concentration and uptake with addition N fertilizer and silicon fertilizer.
C. Nutrient use efficiency
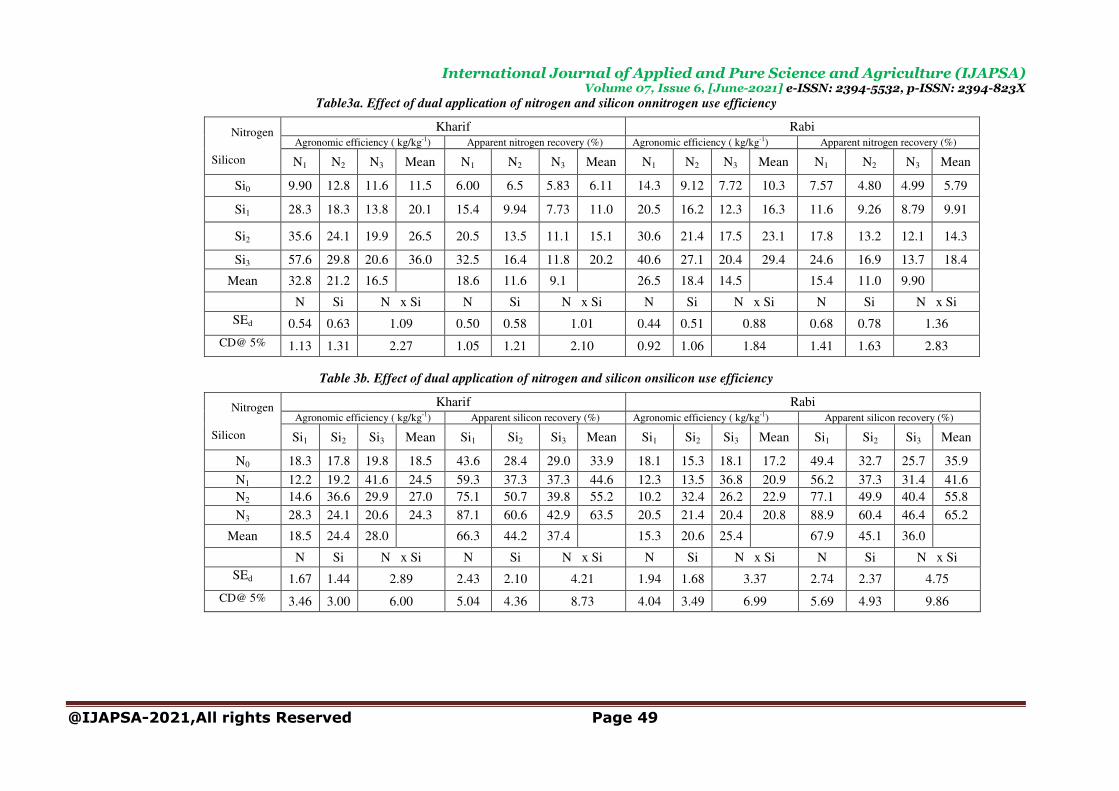
Nutrient use efficiency has been extensively used as a measure of capacity of a plant to acquire and utilize nutrients for biological and grain yield [12]. Nitrogen use efficiency parameters viz., agronomic efficiency and apparent N recovery were significantly influenced by N levels.(table 3a).All the parameters decreased with N levels and the highest value was noticed with 50 kg N/ha. Agronomic efficiency and apparent N recovery ranged from 16.5 to 32.8 kg/kg and 9.1 to 18.6%in kharif and 14.5 to 26.5 kg/kg and 9.90 to 15.4%, in rabi, differing in N levels. The highest N rate showed low NUE that might be due to N losses through ammonia volatilization, denitrification. [7,19] reported decrease in NUE parameters with N rate.Apparent nitrogen recovery is the primary index to describe the characteristics of N uptake and utilization by rice.[10] reported ANR of 39% across different N rates in flooded rice. It varies with soil properties, method, and amount and timing of fertilizer application and other management practices
Silicon fertilization had significant influence on nitrogen use efficiency parameters. Viz., agronomic efficiencyand apparent N recovery increased with Si levels and the maximum values were noticed at 150 kg Si/ha.Integration with Si could regulate the absorption and mobility of N in the plant and maintain optimum level of N and hence on one side Si fertilization increases N use efficiency. [31,19] reported higher nitrogen use efficiency in the presence of silicon.
Various silicon use efficiency parameters were significantly influenced by nitrogen and silicon rates (table 3b).All the SiUE parameters viz., agronomic efficiency and apparent recovery increased with N levels and the maximum value was noticed with 150 kg N /ha.The synergistic effect of N on Si resulted in higher silicon content and uptake and higher yield and thus reflected on higher SiUE. Silicon fertilization significantly improved various silicon use efficiency viz., response ratio and apparent Si recovery. Greater nutrient use efficiency at lower level is common because of efficient utilization of nutrients at lower level [10]. Higher silicon use efficiency in rice could be due to higher uptake of silicon in rice grain or addition of silicon through fertilizers.
References
[1] Anand Naik and Hebsur, N.S 2020. Productivity of rice as influenced by soil and foliar application of silicon. Int. J. Chemical Studies; 8(5): 32-34
[2] Anonymous 2018. Agricultural statistics at a glance. Directorate of Economics and statistics, Department of Agriculture and cooperation , ministry of Agriculture, Government of India , New Delhi
[3] Crooks, R. and Prentice, P. 2017. Extensive investigation into field based responses to a silica fertilizer. Silicon, 9(2): 301–304.
[4] Cuong, T.X, Ullah, H, Datta, A and Hanh, TC. 2017. Effects of silicon-based fertilizer on growth, yield and nutrient uptake of rice in tropical zone of Vietnam. Rice Science, 24(5): 283−290
[5] Datta A, Ullah H, Ferdous Z. 2017. Water Management in Rice. In: Chauhan B S, Jabran K, Mahajan G. (Eds.).Springer International Publishing: Cham, Switzerland, pp. 255–277.
[6] Devanur, V.2015. Silicon-Solution for Tomorrow, Concept Note. Available: Http://Www.Privilifesciences.Com/ Download/Silicon-Supplement .Pd
[7] Djaman, K., Mel, V.C,Ametonou, F.Y,Namaky, R.E,and Diallo, M.D. 2018. Effect of nitrogen fertilizer dose and application timing on yield and nitrogen use efficiency of irrigated hybrid rice under semi-arid conditions. J. Agri. Sci. Food Res.,9: 223-230
International Journal of Applied and Pure Science and Agriculture (IJAPSA)
Volume 07, Issue 6, [June-2021] e-ISSN: 2394-5532, p-ISSN: 2394-823X
@IJAPSA-2021,All rights Reserved Page 43
[8] Dobermann, A. and Cassman, K.G. 2005. Cereal area, yield and nitrogen use efficiency are drivers for future nitrogen fertilizer consumption. Sci. China C. Life Sci., 48:745-58.
[9] FAO (2018) FAOSTAT production statistics. Food and Agriculture Organization. Rome, Italy. [10] Fageria, NK. And Baligar,Y C..2001. Lowland Rice Reponses to Nitrogen Fertilization. Commun. Soil Sci
.Plant Ann.,32:1405-1429. [11] Farooq, M A and Dietz KJ. 2015. Silicon as versatile player in plant and human biology: overlooked and
poorly understood. Front Plant Sci, 6: 1–14 [12] Gill, H.S, Singh, A, Sethi, S.K, and Behl. R.K. 2004. Phosphorus uptake and use efficiency in different
varieties of breed wheat (Triticium Aestivum L.) .Arch. Agron. Soil Sci., 50:563-572 [13] Guntzer, F., Keller, C and Meunier, J.D. 2012. Benefits of plant silicon for crops: a Review. Agric. Sust.
Dev.,32(1): 201-213 [14] Jan, R., Aga, F.A, Bahar, F.A, Singh, T. and Lone, R. 2018. Effect of nitrogen and silica on growth and
yield attributes of transplanted rice (Oryza Sativa L.) Under Kashmir conditions. J. Pharmaco.
Phytochem.7(1): 328-332 [15] Korndorfer, G.H., Snyder, G.H, Ulloa, M, Powell, G and Datnoff, LE. 2001. Calibration of soil and plant
silicon analysis for rice production. J. Plant Nutr. 24(7): 1071-1084. [16] Lavinsky, A O. Detmann K C, Reis J V, Avila R T, Sanglard M L, Pereira L F, Sanglard L M V P,
Rodrigues F A, Araujo W L, Damatta F M. 2016. Silicon improves rice grain yield and photosynthesis specifically when supplied during the reproductive growth stage. Plant Physiol, 206: 125–132.
[17] Hodson, M.J,White, J, Mead, M,Broadley, R.2005. Phylogenetic variation in the silicon composition of plants. Annals of Botany, 96( 6), 1027–1046
[18] Ma, J.F., Yamaji, N., Tamai, K., and Mitani, N. 2007. Genotypic difference in silicon uptake and expression of silicon transporter genes in rice. Plant Physiol. 145: 919–92
[19] Malav J.K, Ramani, V.P.,Sajid M, and Kadam, G.L. 2017. Influence of nitrogen and silicon fertilization on yield and nitrogen and silicon uptake by rice (Oryza sativa L.) under lowland conditions. Res. J. Chem.
Environ. 21(8): 45-49 [20] Matichenkov, V V. Bocharnikova K, Kpsobryukhov, A.A and. Beil. A.Y. 2008. Mobile forms of silicon in
plants. doklady(proceedings) Biol. Sci., 418:39 [21] Meena, V. D, Dotaniya, K.L, Coumar, V, Rajendiran, S, Kundu, S and.Rao.A.S. 2014. A case for silicon
fertilization to improve crop yields in tropical soils. ProcNatlAcad Sci Ind, Sect B: Biol Sci, 84: 505–518. [22] Moro, B.M., Nuhu, I.R, and Martin. E.A. 2016. Effect of spacing on grain yield and yield attributes of
three rice (Oryza sativa l.) Varieties grown in rain-fed lowland ecosystem in Ghana. Int .J. Plant Soil
Sci.9(3): 1-10. [23] Pati S, Pal B, Badole S, Hazra G C, Mandal B. 2016. Effect of silicon fertilization on growth, yield, and
nutrient uptake of rice. Commun. Soil Sci. Plant Anal., 47: 284–290. [24] Saeed, A. A, Qureshi, R, Soomro, F.M, Mirbahar, A.A, and Jakhar, G.S. 2009. Effects of silicon levels on
growth and yield of wheat in salty loam soil. Pak. J. Bot., 41(3): 1385-1390 [25] Sen, A, Srivastava, V.K., Singh, M.K., Singh, R.K. And Kumar, S. 2011. Leaf colour chart vis-à-vis
nitrogen management in different rice genotypes. American J. Plant Sci. 2: 223-226 [26] Shivay Y. S and Dinesh K. 2009. Importance and management of silicon deficiency in rice. Indian
Fmg.34-36. [27] Singh, K, Singh, R, Singh, J.P, Singh, Y, and Singh. K.K 2006. Effect of level and time of silicon
application on growth, yield and its uptake by rice (Oryza sativa L.). Indian J.Agric.Sci,76(7):410-413. [28] Smil, V. 2001. Enriching the Earth: Fritz Haber, Carl Bosch, and the Transformation of World Food
Production. The Mit Press, Cambridge, Ms, London [29] Sun Y, Wu L H, Li X Y. 2016. Experimental determination of silicon isotope fractionation in rice. Plos
One,11(12): E0168970 [30] Ullah, H, Datta, A, Shrestha, S, Ud Din, S.2017 The effects of cultivation methods and water regimes on
root systems of drought- tolerant (RD6) and drought-sensitive (RD10) rice varieties of Thailand Arch
Agron Soil Sci, 63 (9) : 1198-1209 [31] Yogendra, Y.D, Kumara, B.H, Chandrasekhar, Prakash, N.B, Anantha, R.E, and Jeyadeva. H.M 2014.
Effect of silicon on real time nitrogen management in a rice ecosystem. J. Agric. Res., 9(9): 831-840.
International Journal of Applied and Pure Science and Agriculture (IJAPSA)
Volume 07, Issue 6, [June-2021] e-ISSN: 2394-5532, p-ISSN: 2394-823X
@IJAPSA-2021,All rights Reserved Page 44
Table 1 Effect of dual application of nitrogen and silicon on grain and straw yield (kg ha-1
)
Nitrogen
Silicon
Kharif Rabi
Grain yield Straw yield Grain yield Straw yield
No N1 N2 N3 Mean No N1 N2 N3 Mean No N1 N2 N3 Mean No N1 N2 N3 Mean
Si0 2501 3000 3783 4250 3383 3776 4121 5042 5511 4613 3716 4431 4628 4875 4412 4943 5688 5841 6089 5640
Si1 3416 3916 4333 4583 4062 4672 5200 5531 5869 5318 4621 4745 5339 5572 5069 5877 6021 6615 6829 6335
Si2 3783 4283 4916 5500 4620 5272 5512 6143 6741 5917 4954 5250 5862 6342 5602 6403 6535 7138 7598 6928
Si3 4700 5383 5483 5600 5291 5914 6611 6744 6811 6520 5250 5750 6432 6786 6054 6536 7239 7922 8031 7482
Mean 3600 4145 4629 4983 4908 5361 5865 6233 4635 5044 5565 5893 5950 6371 6874 7137
N Si N x Si N Si N x Si N Si N x Si N Si N x Si
SEd 94.4 94.4 188.8 86.4 86.4 172.8 109.6 109.6 219.3 135.5 135.5 271.0
CD@ 5% 192.8 192.8 385.7 176.4 176.4 352.9 224.0 224.0 448.0 276.7 276.7 553.5
International Journal of Applied and Pure Science and Agriculture (IJAPSA)
Volume 07, Issue 6, [June-2021] e-ISSN: 2394-5532, p-ISSN: 2394-823X
@IJAPSA-2021,All rights Reserved Page 45
Fig.1. Linear relationship between grain yield with N levels and Si levels
Fig.2. Percent increase in grain yield due to a) N levels b) Si levels C) N x Si levels
International Journal of Applied and Pure Science and Agriculture (IJAPSA)
Volume 07, Issue 6, [June-2021] e-ISSN: 2394-5532, p-ISSN: 2394-823X
@IJAPSA-2021,All rights Reserved Page 46
Fig.3. Linear relationship between grain yield and grain N and Si uptake
International Journal of Applied and Pure Science and Agriculture (IJAPSA)
Volume 07, Issue 6, [June-2021] e-ISSN: 2394-5532, p-ISSN: 2394-823X
@IJAPSA-2021,All rights Reserved Page 47
Table 2a. Effect of dual application of nitrogen and silicon on grain and straw N uptake
Table 2b. Effect of dual application of nitrogen and silicon on grain and straw Si uptake
Nitrogen
Silicon
Kharif Rabi
Grain Straw Grain Straw
No N1 N2 N3 Mean No N1 N2 N3 Mean No N1 N2 N3 Mean No N1 N2 N3 Mean
Si0 9.0 12.0 15.5 17.8 13.5 9.34 11.5 16.1 18.7 13.9 13.8 17.6 18.6 21.3 17.8 14.1 18.6 19.9 24.8 19.3
Si1 13.3 16.8 19.0 20.6 17.4 12.4 16.1 19.3 21.7 17.3 18.2 19.8 23.1 27.4 22.1 18.9 20.8 23.3 24.4 21.8
Si2 15.5 19.2 25.8 25.8 20.7 16.3 18.7 23.9 26.2 21.2 21.2 22.8 27.1 31.9 25.7 21.3 24.1 26.9 27.6 24.9
Si3 20.6 25.3 26.8 26.8 24.6 19.5 23.7 27.6 27.9 24.6 22.8 26.7 30.8 34.5 28.7 23.6 27.6 28.4 39.0 29.6
Mean 14.6 18.3 20.7 22.7 14.4 17.5 21.7 23.6 19.0 21.7 24.9 28.7 19.4 22.7 24.6 28.9
N Si N x Si N Si N x Si N Si N x Si N Si N x Si
SEd 0.38 0.38 0.77 0.39 0.39 0.78
0.55 0.55 1.10 1.15 1.15 2.30
CD@ 5% 0.78 0.78 1.57 0.80 0.80 1.60
1.12 1.12 2.25 2.35 2.35 4.71
Nitrogen
Silicon
Kharif Rabi
Grain Straw Grain Straw
No N1 N2 N3 Mean No N1 N2 N3 Mean No N1 N2 N3 Mean No N1 N2 N3 Mean
Si0 31.7 38.7 49.9 57.3 44.4 63.0 69.8 86.7 96.4 78.9 41.9 58.0 62.0 66.7 57.2 83.5 97.8 101 108 97.6
Si1 53.6 62.2 69.7 74.7 65.0 113 127 136 146 130 73.0 76.3 86.5 92.4 82.0 143 149 163 171 157
Si2 60.5 69.3 80.6 92.4 75.7 130 137 153 171 148 80.7 85.5 97.8 108 93.1 160 163 180 194 174
Si3 76.6 88.8 91.5 96.3 88.3 148 167 172 176 165 86.6 95.4 109 118 102 165 184 202 210 191
Mean 55.6 64.7 72.9 80.1 114 125 137 147 70.6 78.8 88.7 96.3 138 148 162 171
N Si N x Si N Si N x Si N Si N x Si N Si N x Si
SEd 1.46 1.46 2.93 2.82 2.82 5.64 1.78 1.78 3.57 3.32 3.32 6.64
CD@ 5% 2.99 2.99 5.99 5.76 5.76 11.52 3.65 3.65 7.30 6.78 6.78 13.5
International Journal of Applied and Pure Science and Agriculture (IJAPSA)
Volume 07, Issue 6, [June-2021] e-ISSN: 2394-5532, p-ISSN: 2394-823X
@IJAPSA-2021,All rights Reserved Page 48
Fig.4a Linear relationship between N uptake with N levels and Si levels
Fig.4b Linear relationship between Si uptake with N levels and Si levels
International Journal of Applied and Pure Science and Agriculture (IJAPSA)
Volume 07, Issue 6, [June-2021] e-ISSN: 2394-5532, p-ISSN: 2394-823X
@IJAPSA-2021,All rights Reserved Page 49
Table3a. Effect of dual application of nitrogen and silicon onnitrogen use efficiency
Table 3b. Effect of dual application of nitrogen and silicon onsilicon use efficiency
Nitrogen
Silicon
Kharif Rabi Agronomic efficiency ( kg/kg-1) Apparent nitrogen recovery (%) Agronomic efficiency ( kg/kg-1) Apparent nitrogen recovery (%)
N1 N2 N3 Mean N1 N2 N3 Mean N1 N2 N3 Mean N1 N2 N3 Mean
Si0 9.90 12.8 11.6 11.5 6.00 6.5 5.83 6.11 14.3 9.12 7.72 10.3 7.57 4.80 4.99 5.79
Si1 28.3 18.3 13.8 20.1 15.4 9.94 7.73 11.0 20.5 16.2 12.3 16.3 11.6 9.26 8.79 9.91
Si2 35.6 24.1 19.9 26.5 20.5 13.5 11.1 15.1 30.6 21.4 17.5 23.1 17.8 13.2 12.1 14.3
Si3 57.6 29.8 20.6 36.0 32.5 16.4 11.8 20.2 40.6 27.1 20.4 29.4 24.6 16.9 13.7 18.4
Mean 32.8 21.2 16.5 18.6 11.6 9.1 26.5 18.4 14.5 15.4 11.0 9.90
N Si N x Si N Si N x Si N Si N x Si N Si N x Si
SEd 0.54 0.63 1.09 0.50 0.58 1.01 0.44 0.51 0.88 0.68 0.78 1.36
CD@ 5% 1.13 1.31 2.27 1.05 1.21 2.10 0.92 1.06 1.84 1.41 1.63 2.83
Nitrogen
Silicon
Kharif Rabi Agronomic efficiency ( kg/kg-1) Apparent silicon recovery (%) Agronomic efficiency ( kg/kg-1) Apparent silicon recovery (%)
Si1 Si2 Si3 Mean Si1 Si2 Si3 Mean Si1 Si2 Si3 Mean Si1 Si2 Si3 Mean
N0 18.3 17.8 19.8 18.5 43.6 28.4 29.0 33.9 18.1 15.3 18.1 17.2 49.4 32.7 25.7 35.9
N1 12.2 19.2 41.6 24.5 59.3 37.3 37.3 44.6 12.3 13.5 36.8 20.9 56.2 37.3 31.4 41.6
N2 14.6 36.6 29.9 27.0 75.1 50.7 39.8 55.2 10.2 32.4 26.2 22.9 77.1 49.9 40.4 55.8
N3 28.3 24.1 20.6 24.3 87.1 60.6 42.9 63.5 20.5 21.4 20.4 20.8 88.9 60.4 46.4 65.2
Mean 18.5 24.4 28.0 66.3 44.2 37.4 15.3 20.6 25.4 67.9 45.1 36.0
N Si N x Si N Si N x Si N Si N x Si N Si N x Si
SEd 1.67 1.44 2.89 2.43 2.10 4.21 1.94 1.68 3.37 2.74 2.37 4.75
CD@ 5% 3.46 3.00 6.00 5.04 4.36 8.73 4.04 3.49 6.99 5.69 4.93 9.86