Embed Size (px)
Citation preview
EFFECTS OF SELECTED SURFACTANTS ON NUTRIENT
UPTAKE AND SOIL MICROBIAL COMMUNITY
___________________________________
A Thesis presented to the Faculty of the
Graduate School
at the University of Missouri-Columbia
______________________________________________________
In Partial Fulfillment
of the Requirements for the Degree
Master of Science
___________________________________
by
MONA-LISA L. BANKS
Thesis Supervisors
Dr. Robert J. Kremer, Dr. Frieda Eivazi, Dr. Kelly Nelson, and Dr. Peter P. Motavalli
DECEMBER 2011
APPROVAL PAGE
The undersigned, appointed by the dean of the Graduate School, have examined the
thesis entitled
EFFECTS OF SELECTED SURFACTANTS ON NUTRIENT UPTAKE AND SOIL
MICROBIAL COMMUNITY
presented by Mona-Lisa L. Banks,
a candidate for the degree of master of Science,
and hereby certify that, in their opinion, it is worthy of acceptance.
Dr. Robert Kremer
Dr. Frieda Eivazi
Dr. Peter Motavalli
Dr. Kelly Nelson

DEDICATION
I dedicate this thesis to my father, Mr. Stanley Banks and in memory of my mother
Mrs. Claudette Banks.
Mom and dad you both stressed the importance of education in us your children from an
early age. You toiled to provide the financial and moral support we needed, in order to
give us a decent foundation to our academic career. With this foundation, I stepped out
into the world earning and striving to make you proud parents. This thesis reflects that
dedication, and I say thank you for all your hard work and the confidence you have
always had in me.
Rest in Peace Mother
ii
ACKNOWLEDGEMENTS
I would like to acknowledge the Almighty for his continued blessing of health and
strength during the last few years as I pursued this degree. I would also like to
thank my advisors for their support in the completion of this work; Dr. Kremer, Dr.
Eivazi, Dr. Motavalli, and Dr. Nelson. To the U.S. Department of Agriculture, I
say thank you as funding was an integral component in this study. This study
was supported in part by U.S. Department of Agriculture, National Institute of
Food and Agriculture Cooperative Agreement #0211760 awarded to Lincoln
University in Missouri. Special acknowledgements to Dr. Ann Kennedy and her
staff at Washington State University, Mr. James Ortbals at the University of
Missouri Soil Microbiology Lab and Dr. Ikem, Jimmy Garth, and Robert Channer
at Lincoln University for their help in analyzing samples.
I would also like to express my sincere thanks to my family for their love and
support, especially Drs. Lurline and Dyremple Marsh who have been my role
models from such a tender age, to Dr. Nigel Hoilett for his continued guidance
and encouragement throughout this whole process, to Mr. Darren O. Grant for
your devout support and encouraging words, to all the student workers that
helped with this project (Grato Ndunguru, Chevice Thomas, Gavin Terrelong, and
Janelle Brown), and to my office mates.
iii
TABLE OF CONTENTS
ACKNOWLEDGEMENT………………………………………………………….…….ii
LIST OF TABLES…………………………………………………………………….….v
LIST OF FIGURES ............................................................................................. viii
ABSTRACT……………………………………...……………………………………...ix
Chapter
1. INTRODUCTION .................................................................................................. 1
Objectives of Study
Experimental Approach
2. LITERATURE REVIEW……………………………………………………………......15
Surfactants and Soil
Surfactants and Microbial Activity
Surfactants and Herbicides
3. EFFECTS OF SELECTED SURFACTANTS ON NUTRIENT UPTAKE IN CORN (ZEA MAYS L.)……………………………………………………………...35
Introduction
Materials and Methods
Results and Discussion
Conclusion
References
Tables and Figures
4. EFFECTS OF SELECTED SURFACTANTS, HERBICIDES,
AND SOILS ON DENATURING GRADIENT GEL
ELECTROPHORESIS PROFILES (DGGE) OF THE SOIL
MICROBIAL COMMUNITY…………………………………………………….66

iv
Introduction
Materials and Methods
Results and Discussion
Conclusion
References
Tables and Figures
5. RESPONSE OF THE SOIL MICROBIAL COMMUNITY TO SELECTED SURFACTANTS, HERBICIDES, AND SOIL TEXTURE……………………………99
Introduction
Materials and Methods
Results and Discussion
Conclusion
References
Tables and Figures
6. OVERALL SUMMARY CHAPTER………………………………………................138
7. APPENDIX………………………………………………………………………..……141
v
LIST OF TABLES
Tables Page
1.1 Soil properties for silt loam and silty clay loam………………………………8
1.2 Chemicals used and treatment rates applied to pots in greenhouse experiment (L ha-1)………………….……………………………….….………9
1.3 Treatments applied and pot numbers used in randomizing the greenhouse experiment……………………………………………………….11
1.4 Table of abbreviations…………………………………………………………13
3.1 Soil properties for silt loam and silty clay loam………………….….………56
3.2 Chemicals used and treatment rates applied to pots in greenhouse experiment (L ha-1)………………………………………..….…57
3.3 Plant macronutrient concentration (%) for corn (V8 growth stage) grown in silt loam…………………………...……………58
3.4 Plant macronutrient concentration (%) for corn (V8 growth stage) grown in silty clay loam……………………………….…59
3.5 Plant micronutrient concentration (mg kg-1) for corn (V8 growth stage) grown in silt loam………………………………...………60
3.6 Plant micronutrient concentration (mg kg-1) for corn (V8 growth stage) grown in silty clay loam…………………………….……61
3.7 Plant trace elements concentration (mg kg-1) for corn (V8 growth stage) grown in silt loam……………...…………………………62
3.8 Plant trace elements concentration (mg kg-1) for corn (V8 growth stage) grown in silty clay loam………………………….………63
4.1 Soil properties for silt loam and silty clay loam……………………………..88
4.2 Chemicals used and treatment rates applied to pots in greenhouse experiment (L ha-1)………………………….........……………89
4.3 The effect of silt loam, silty clay loam and herbicide/surfactant treatments on DNA, carbon, and nitrogen contents……………….……….90
vi
4.4 Comparison of soil microbial biomass (MB) based on PFLA analysis (Chapter 5) and soil DNA contents…………………………..……91
4.5 The effect of silt loam, silty clay loam and herbicide/surfactant treatments on height and raw volume DNA separated by PCR-DGGE analyses…………………………………………………………92
5.1 (a) Soil properties for silt loam and silty clay loam…………………….…125
5.1 (b) Chemicals used and treatment rates applied to pots in greenhouse experiment (L ha-1)…………….…………...…………………126
5.1 (c) Phospholipid fatty acids used as biomarkers for microorganisms………………………………………………………...…….127
5.2 Results of analysis of variance for microbial biomarker groupings of phospholipids fatty acid profiles based on silt loam and silty clay loam…………………………………………..……..128
5.3 (a) The effect of silt loam and treatments on microbial biomarker groupings of phospholipids fatty acid profiles.…………………………….129
5.3 (b) The effect of silt loam and treatments on microbial biomarker groupings of phospholipids fatty acid profiles.…………………………….130
5.4 (a) The effect of silty clay loam and treatments on microbial biomarker groupings of phospholipids fatty acid profiles.……………..…131
5.4 (b) The effect of silty clay loam and treatments on microbial biomarker groupings of phospholipids fatty acid profiles.…………..……132
5.5 (a) Results of analysis of variance of eigenvalues from phospholipid fatty acid profiles from silt loam and treatments.….………133
5.5 (b) Results of analysis of variance of eigenvalues from phospholipid fatty acid profiles from silty clay loam and treatments……134
7.1 Plant macronutrient uptake (µg-1 ) for corn (V8 growth stage) grown in silt loam………………………………….……142
7.2 Plant macronutrient uptake (µg-1) for corn (V8 growth stage) grown in silty clay loam………………….……………..143
7.3 Plant micronutrient concentration (µg-1) for corn (V8 growth stage) grown in silt loam……………………………………….144
vii
7.4 Plant micronutrient concentration (µg-1) for corn (V8 growth stage) grown in silty clay loam……………………………….145
viii
LIST OF FIGURES
Figures Page
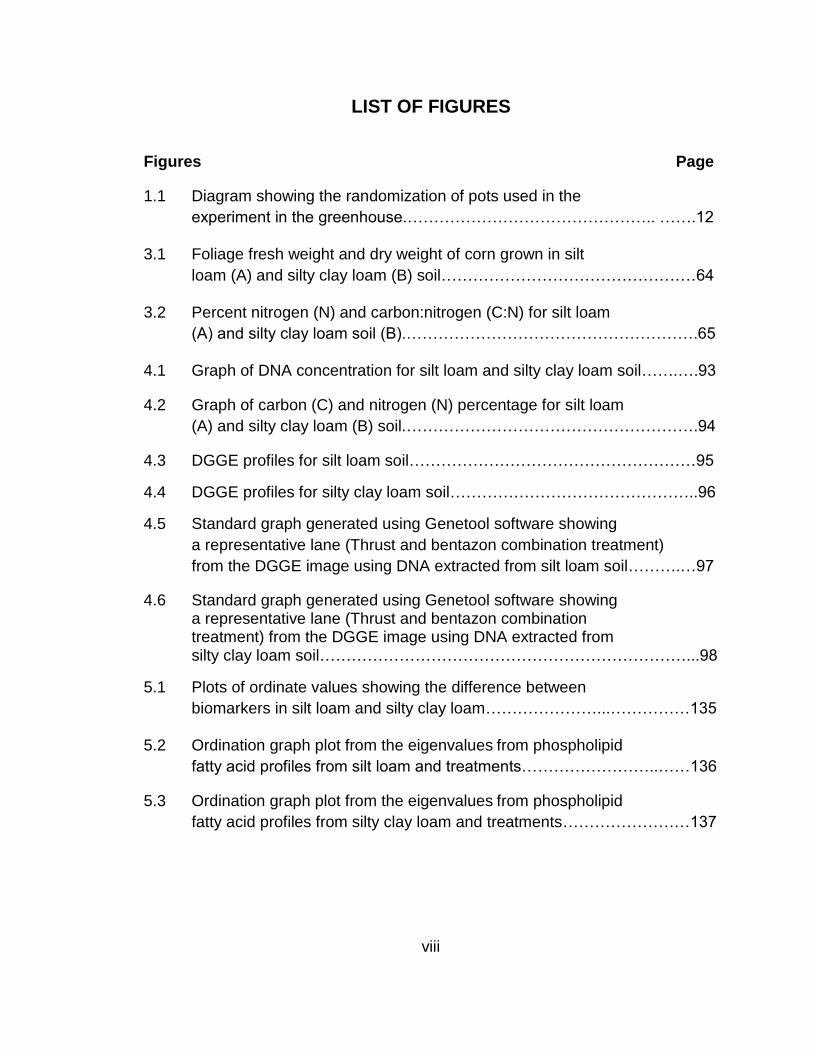
1.1 Diagram showing the randomization of pots used in the
experiment in the greenhouse.……………………………………….. …….12
3.1 Foliage fresh weight and dry weight of corn grown in silt
loam (A) and silty clay loam (B) soil…………………………………………64
3.2 Percent nitrogen (N) and carbon:nitrogen (C:N) for silt loam
(A) and silty clay loam soil (B).……………………………………………….65
4.1 Graph of DNA concentration for silt loam and silty clay loam soil…….….93
4.2 Graph of carbon (C) and nitrogen (N) percentage for silt loam
(A) and silty clay loam (B) soil.……………………………………………….94
4.3 DGGE profiles for silt loam soil………………………………………………95
4.4 DGGE profiles for silty clay loam soil………………………………………..96
4.5 Standard graph generated using Genetool software showing
a representative lane (Thrust and bentazon combination treatment)
from the DGGE image using DNA extracted from silt loam soil……….…97
4.6 Standard graph generated using Genetool software showing a representative lane (Thrust and bentazon combination treatment) from the DGGE image using DNA extracted from silty clay loam soil……………………………………………………………...98
5.1 Plots of ordinate values showing the difference between
biomarkers in silt loam and silty clay loam…………………...……………135
5.2 Ordination graph plot from the eigenvalues from phospholipid
fatty acid profiles from silt loam and treatments……………………..……136
5.3 Ordination graph plot from the eigenvalues from phospholipid
fatty acid profiles from silty clay loam and treatments……………………137
ix
ABSTRACT
Surfactants with solvent and wetting abilities are used in the formulation of
herbicides to enhance spraying capabilities. These chemicals eventually enter
into the soil and may disrupt different chemical, physical and biological
processes. The aim of this study was to examine the effects on nutrient uptake in
corn and soil microbial community due to application of surfactants at different
rates, herbicides, and surfactant-herbicide combinations in silt loam and silty clay
loam soils. Surfactants used were Activator 90, Agri-Dex and Thrust. Herbicides
used were glyphosate, atrazine, and bentazon. Corn was planted in fertilized
soils and moisture levels maintained. After seven weeks, plant foliage were
ground and stored for elemental analyses with Inductively Coupled Plasma
Emission Spectrophotometer (ICP). Soil samples were analyzed with
Polymerase Chain Reaction (PCR-DGGE) and Phospholipid Fatty Acids
analyses (PLFA) to assess microbial diversity.
The treatments did not greatly affect nutrient uptake by corn. Visual
differences between both soils and among treatments were observed with DNA
band expression, although few significant differences due to treatments were
found. PLFA biomarkers were variably affected by soils and different treatments
relative to control. In general treatments did not significantly affect plant nutrient
uptake or microbial community, perhaps as a result of the onetime application of
small quantities of chemicals. Differences between both soils reflected the
x
overall contribution of soil texture, chemical and physical characteristics.
Formulation additives should be considered when evaluating effects of pesticide
applications on plant quality and soil biology.
1
CHAPTER 1
INTRODUCTION
Over the years, use of pesticides in crop production systems has
increased about fouty fold (Ridgeway et al., 1978). These pesticides include
insecticides, fungicides and herbicides. However, the use of these pesticides
have raised concern due to potential negative impacts on the environment and
human health. Herbicides are used to eradicate unwanted plants from crop
fields and other locations. In the application of herbicide, it is often desirable to
include chemicals such as adjuvants, which have solvent and wetting abilities to
enhance spraying capabilities of the herbicide coverage over large areas. The
Weed Science Society of America defines an adjuvant as any substance in a
herbicide formulation that is added to the spray tank to modify the activity and
application characteristics of the herbicide (Hazen, 2000). Two of the main types
of adjuvants used with herbicides are surfactants and crop oil concentrates
(COC). Crop oil concentrates are a mixture of a surfactant and non-phytotoxic oil
that also reduces surface tension. This oil may be vegetable- or petroleum-
based, and keeps the leaf surface moist longer than water, allowing more time
for penetration of the herbicide into the targeted plant. This type of adjuvant is
most widely used with post-emergent herbicides.
2
The word surfactant is derived from the term “surface active agent.”
Surfactants are organic molecules, sometimes referred to as amphiphiles as they
have both a hydrophilic head and a hydrophobic tail. Surfactants function at the
interface between compounds with different solubility by lowering the surface
tension of a liquid. In doing so, the herbicide mixture is altered to an oil-like
mixture allowing for easier emulsifying, dispersing, spreading, and wetting.
There are four basic groups of surfactants: anionic, cationic, nonionic and
amphoteric. Anionic surfactants produce a negative charge and are the most
widely used accounting for 50% of the world‟s production (Salager, 2002). They
are used in detergents, soaps, and wetting agents. Cationic surfactant produces
a positive charge and is commonly used as a bactericide. Although it strongly
attaches to plant surfaces it is highly phytotoxic when not mixed with other
surfactants. Nonionic surfactants do not form an electrical charge and increase
pesticide penetration through plant cuticles. Amphoteric surfactants can have
either a positive or a negative charge depending on the pH of the spray solution.
These surfactants are seldom used in agriculture (Czarnota & Thomas, 2006) but
are widely used in pharmaceuticals and cosmetics (Nielloud & Marti-Mestres,
2000).
Surfactants have been widely studied over the years to examine their
different effects on the environment. They have proven to be positive in helping
to improve plant quality by reducing pest and weeds. However, negative effects
are associated with high toxicity of surfactants to organisms in aquatic systems
(Mann & Bidwell, 2001). The soil and its components carry out important roles
3
in the production of the food supply. The introduction of surfactants into the soil
environment may cause some chemical reactions, which may interfere with the
transport of nutrients and reduce quality of soil for microorganisms. Therefore, it
is vital that research be carried out to examine the effects of the surfactants on
plant nutrient uptake and on microbial populations and activities.
4
OBJECTIVES OF STUDY
1. Determine the effect of different surfactants on plant nutrient uptake. The
constituents of plant samples analyzed with Inductively Coupled Plasma
Emission Spectrophotometer (ICP) will determine the differences in
macronutrient, micronutrient and trace element concentrations in corn
plants as a result of different rates of applied surfactants. We hypothesize
that treatments with different chemicals used will cause variations in
nutrient uptake indirectly through direct effects on soil.
2. Examine the changes in quantity and diversity of soil microbial community
using polymerase chain reaction combined with denaturing gradient gel
electrophoresis (PCR-DGGE) in association with application of
surfactants, herbicides and soil texture. We hypothesize that the
treatments with different chemicals used will cause differences in soil
microbial community.
3. Examine the effect of different surfactants, herbicides, and soil texture on
soil microbial community composition using Phospholipid Fatty Acid
Analysis (PLFA) technology. We hypothesize that the application of
different surfactants at different rates in combination with different
herbicides results in changes in soil microbial PLFA profiles using two
different soils.
5
EXPERIMENTAL APPROACH
SOIL AND EXPERIMENTAL LOCATION
Two different soils, with silt loam and silty clay loam soil textural classes,
were chosen and used in this study to examine the interaction with surfactant on
soil microbial diversity. Silt loam soil was collected from the Lincoln University
Carver Farm near the Moreau River in Jefferson City, Missouri. It is classified as
a Wrengart silt loam (fine-silty, mixed, superactive, mesic Fragic Oxyaquic
Hapludalfs), located on the terrace of the floodplain, with a slope of 5 to 9%, very
deep and moderately well drained. Soil samples were collected from the soil
surface to a depth of 30 cm. Particle size analysis for the silt loam was % sand:
15, % silt: 65, and % clay: 20. The clay soil was collected at the University of
Missouri-Columbia Bradford Farm from a plot that previously had the topsoil
removed to expose the claypan layer or argillic horizon. The soil at this location
is classified as a Mexico silt loam (fine, smectitic, mesic Vertic Epiaqualfs) with
slope of 1 to 4% eroded and poorly drained. Collection was achieved within 35
to 85 cm of the original soil surface yielding samples with clay content of 30 to
60%. Subsequent soil textural analyses classified the collected soil textural class
as a silty clay loam. Particle size analysis for the silty clay loam was % sand: 20,
% silt: 42, and % clay: 37.5.
Representative soil samples were taken from the collection sites using
hand-held push probe. Soils were analyzed for concentrations of total organic
carbon, total nitrogen, soil test phosphorus, exchangeable potassium,
6
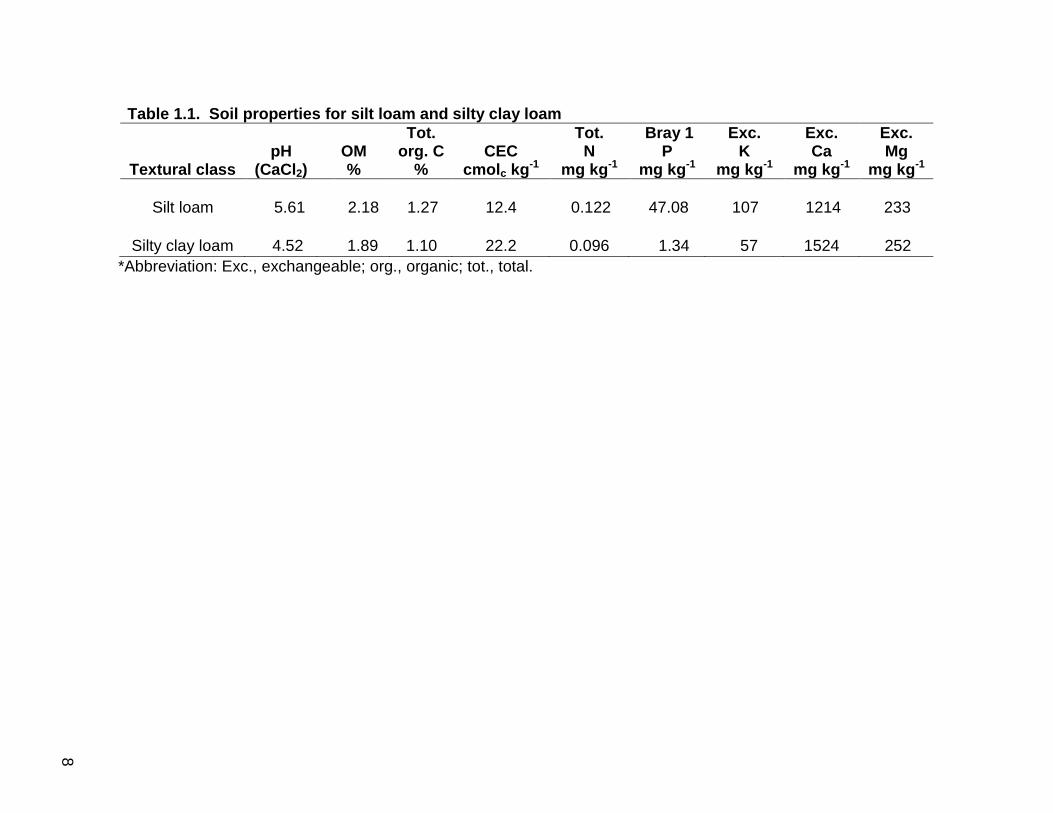
exchangeable calcium and exchangeable magnesium. Other properties such as
organic matter content, pH, and cation exchange capacity were determined for
both soils (Table 1.1). Soils were dried, passed through sieve to remove large
particles and stored at 4°C prior to the greenhouse study.
The greenhouse study was conducted at the Lincoln University Dickenson
Research Greenhouse. The greenhouse offered a controlled environment for the
study with temperature and lighting settings at suitable conditions for growing
field corn (Zea mays L. type ‘Indenta’). Field corn was chosen as it is widely
grown in Missouri. Pots were randomized on greenhouse benches (Table 1.3
and Figure 1.1). A controlled environment was used to isolate the treatment
effects. Using the greenhouse versus planting in the field eliminated interference
of factors that may have limited growth and nutrient uptake, such as pests,
diseases, drought conditions, severe heat and cold temperatures.
SURFACTANTS AND HERBICIDES USED
Three extensively used surfactants were used in the study: alkylphenol
ethoxylate plus alcohol ethoxylate (Activator 90; non-ionic; Loveland Industries,
Inc., Greeley CO), polyethoxylate (Agri-Dex; non-ionic; Helena Chemical
Company, Collierville TN) and a blend of ammonium sulfate, drift
reduction/deposition polymers and anti-foam agent (Thrust; anti-foam agent;
Loveland Industries, Inc., Greeley CO). These surfactants/adjuvants are
classified differently based on their chemical structure. Activator 90 is a non-
7
ionic surfactant, Agri-Dex is non-ionic crop oil concentrate (COC) and Thrust is a
blend of milled ammonium sulfate drift reduction/deposition and anti-foam agent.
We examined the effects of surfactants alone as well as surfactants mixed and
applied with herbicides. The herbicides used were glyphosate (Gly-4 Plus;
Universal Crop Protection Alliance LLC, Eagan MN), atrazine (AAtrex; Universal
Crop Protection Alliance LLC, Eagan MN) and bentazon (Basagran; Micro Flow
Company LLC, Memphis TN). The surfactants and herbicides are paired
together as seen in Table 1.2 as this is how they are commonly used in
agriculture application. Glyphosate‟s mode of action is inhibition of the 5-
enolpyruvylshikimimate-3-phosphate synthase (EPSPS) in the shikimic acid
pathway. Glyphosate is adsorbed to soil particles, readily degraded by soil
microbial organisms, and typically has a half-life of 50 days (Franz et al., 1997).
Atrazine and bentazon function as photosynthesis inhibitors with half-lives of 60
and 20 days, respectively. Atrazine and bentazon are both degraded by microbial
action and atrazine also by hydrolysis (WSSA, 2007).
Atrazine and bentazon were applied after planting. Glyphosate is a
preemergent, burndown herbicide and was applied accordingly. Application of
chemicals was carried out in accordance with the manufacturer‟s recommended
rates except for treatments of surfactant only, where surfactants were applied at
different rates (Table 1.2). Addition of these chemicals will help us to examine
and understand their interaction with different nutrients, and soil microbial
community diversity in different soils.
8
Table 1.1. Soil properties for silt loam and silty clay loam
Textural class pH
(CaCl2) OM %
Tot. org. C
% CEC
cmolc kg-1
Tot. N
mg kg-1
Bray 1 P
mg kg-1
Exc. K
mg kg-1
Exc. Ca
mg kg-1
Exc. Mg
mg kg-1
Silt loam 5.61 2.18 1.27 12.4 0.122 47.08 107 1214 233
Silty clay loam 4.52 1.89 1.10 22.2 0.096 1.34 57 1524 252
*Abbreviation: Exc., exchangeable; org., organic; tot., total.
8

9
Table 1.2. Chemicals used and treatment rates applied to pots in greenhouse experiment (L ha-1)
Treatment rates
Treatments Surfactant Surfactant x 2 Herbicide Surfactant + Herbicide
Activator-90 0.02 ml 0.04 ml
Glyphosate 0.0065 ml
Activator-90 + Glyphosate 0.02 ml + 0.0065 ml
Agridex 0.02 ml 0.04 ml
Atrazine 0.0167 ml
Agri-Dex + Atrazine 0.02 ml + 0.0167 ml
Thrust 0.01 g 0.02 g
Bentazon 0.0083 ml
Thrust + Bentazon 0.01 g + 0.0083 ml
Control 0 0 0 0
9
10
METHODS OF ANALYSES
Plant and soil nutrient analyses were done using the aqua regia method. The
aqua regia method is adequate for breaking down plant material (Novozamsky et al,
1996) for analyses of nutrient concentration. Plants samples were digested using an
Ethos EZ Microwave Digestion Lab-Station (Milestone Inc., Shelton, CT 06484
USA). Digested samples were diluted and appropriately stored for analyses. Total
element analyses of the samples were determined using Inductively Coupled
Plasma Emission Spectrophotometer (ICP). Total organic carbon and total nitrogen
were determined by the combustion method using a LECO TrueSpec
carbon/nitrogen analyzer (LECO Corporation, St. Joseph, MI, USA).
One of the significant roles played by soil microorganisms is metabolizing
various chemical compounds introduced to the soil such as pesticides, fertilizers and
toxic organic and inorganic substances (Susarla et al, 2002). It is important that we
understand how different surfactants affect different microbial communities in the
soil. Denaturing Gradient Gel Electrophoresis (DGGE) of Polymerase Chain
Reaction (PCR), a fingerprinting technique was used to examine how microbial
groups, based on specific gene sequences, change due to environmental and
experimental factors. Microbial cell composition markers were characterized with the
use of cell structure procedure based on detection of microbial Phospholipid Fatty
Acids (PLFA). Both methods have proven to be of valid support to traditional
methods (Ercolini, 2003).
11
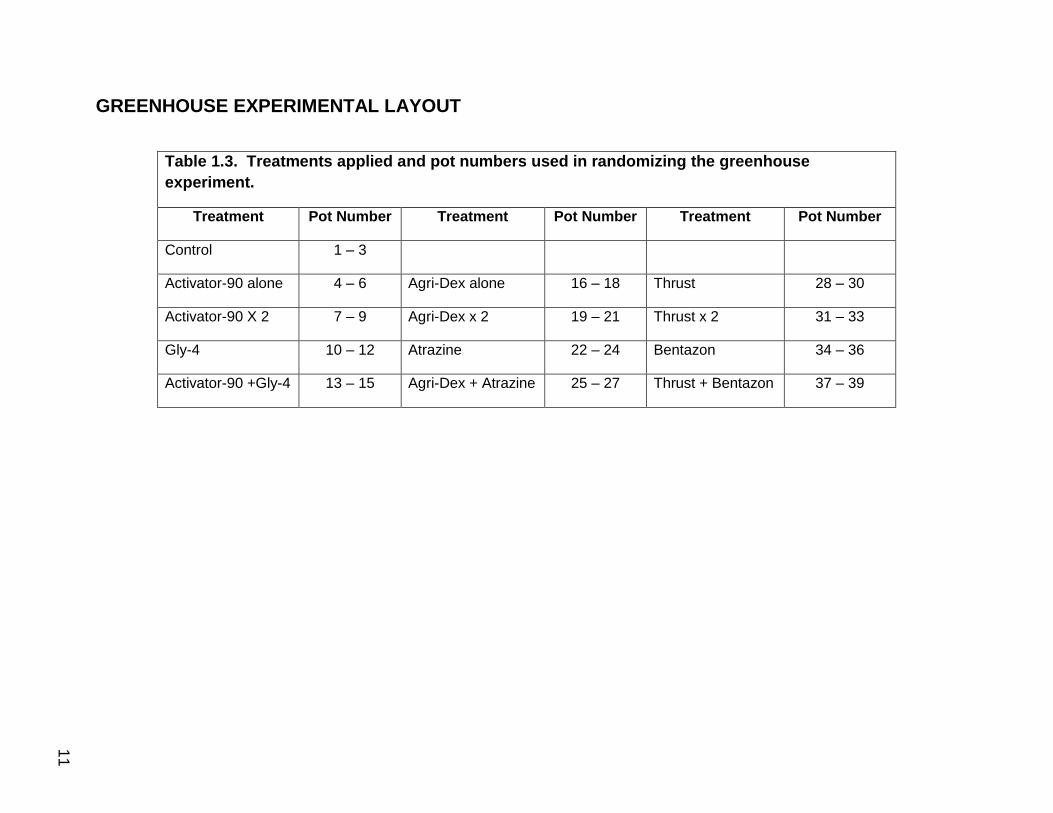
GREENHOUSE EXPERIMENTAL LAYOUT
Table 1.3. Treatments applied and pot numbers used in randomizing the greenhouse
experiment.
Treatment Pot Number Treatment Pot Number Treatment Pot Number
Control 1 – 3
Activator-90 alone 4 – 6 Agri-Dex alone 16 – 18 Thrust 28 – 30
Activator-90 X 2 7 – 9 Agri-Dex x 2 19 – 21 Thrust x 2 31 – 33
Gly-4 10 – 12 Atrazine 22 – 24 Bentazon 34 – 36
Activator-90 +Gly-4 13 – 15 Agri-Dex + Atrazine 25 – 27 Thrust + Bentazon 37 – 39
11
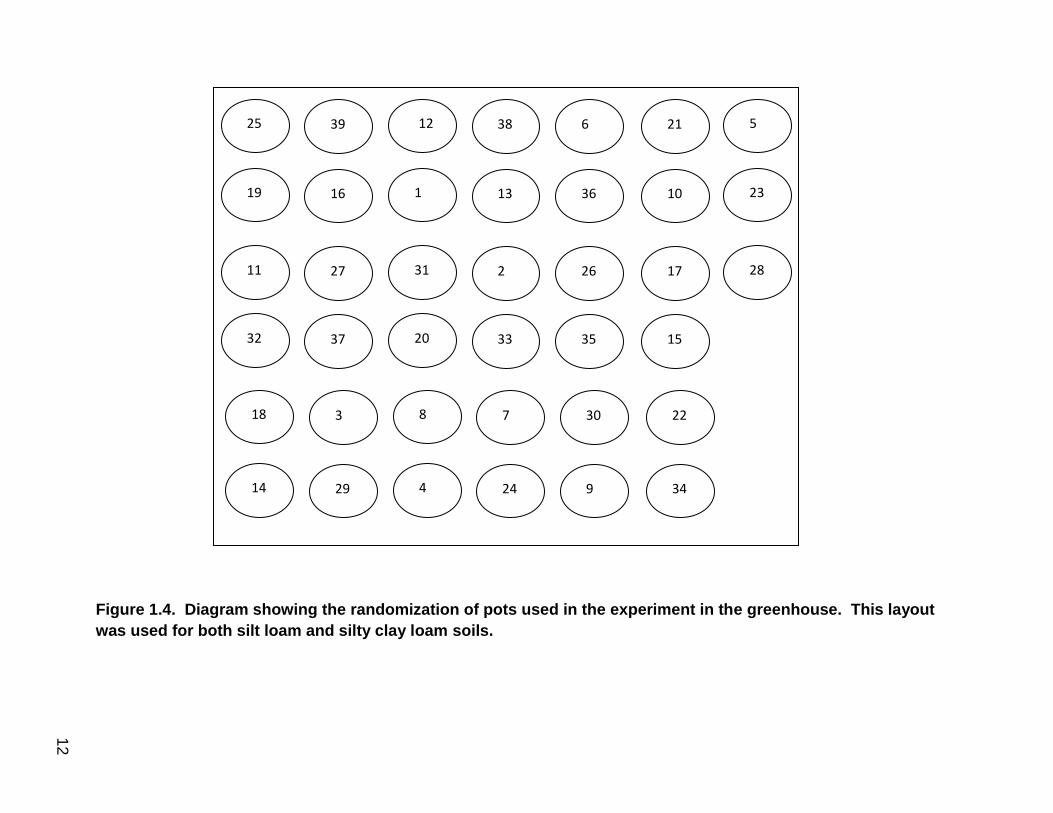
12
Figure 1.4. Diagram showing the randomization of pots used in the experiment in the greenhouse. This layout
was used for both silt loam and silty clay loam soils.
19 16 1 13 36 10 23
11 27 31 2 26 17 28
25 39 12 38 6 21 5
14 29 4 24 9 34
18 3 8 7 30 22
32 37 20 33 35 15
12
13
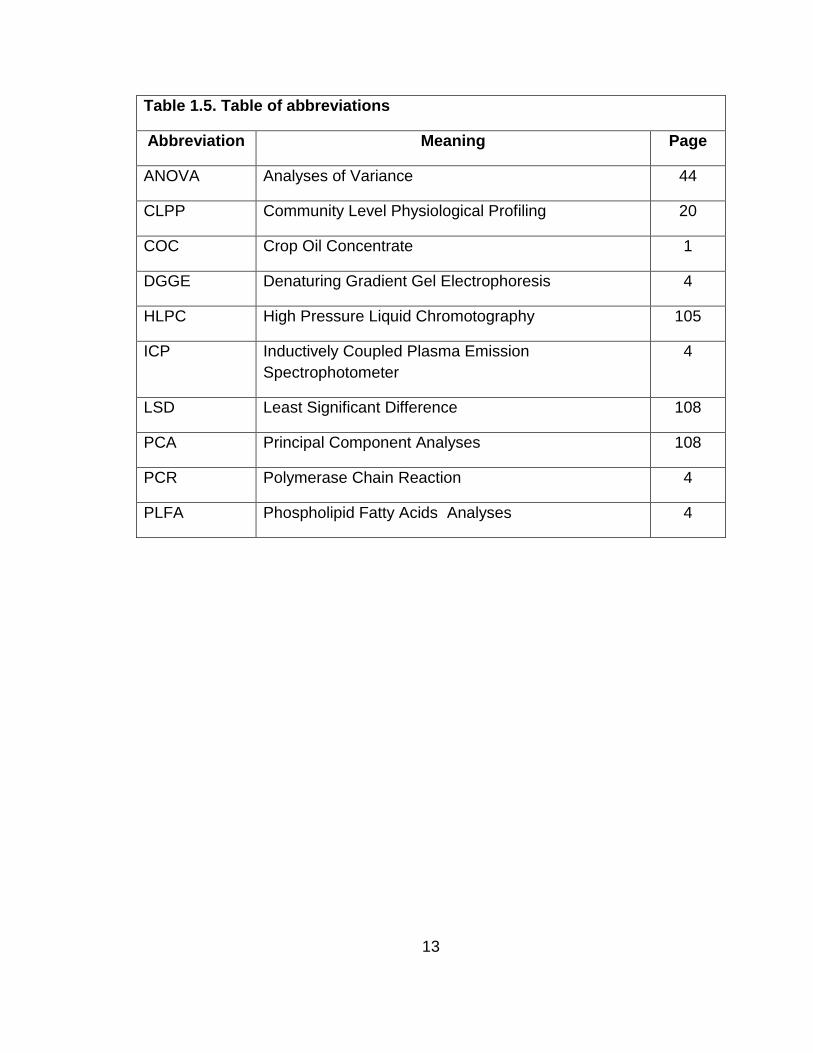
Table 1.5. Table of abbreviations
Abbreviation Meaning Page
ANOVA Analyses of Variance 44
CLPP Community Level Physiological Profiling 20
COC Crop Oil Concentrate 1
DGGE Denaturing Gradient Gel Electrophoresis 4
HLPC High Pressure Liquid Chromotography 105
ICP Inductively Coupled Plasma Emission
Spectrophotometer
4
LSD Least Significant Difference 108
PCA Principal Component Analyses 108
PCR Polymerase Chain Reaction 4
PLFA Phospholipid Fatty Acids Analyses 4
14
REFERENCES
Czarnota, M., and Thomas, P. (2006). Using Surfactants, Wetting Agents, and Adjuvants in the Greenhouse . The University of Georgia Cooperative Extension.
Ercolini, D. (2003). PCR-DGGE fingerprinting: novel strategies for detection of microbes in food. Journal of Microbilological Methods 56, 297-314.
Franz, J. E., Mao, M.K., and Sikorski, J.A. (1997). Glyphosate: a unique global
herbicide. ACS Monograph 189. Washington, DC (USA): American
Chemical Society.
Hazen, J. L. (2000). Adjuvants: Terminology, Classification, and Chemistry. Weed Technology 14, 773-784.
Mann, R. M., and Bidwell, J. R. (2001). The acute toxicity of agricultural surfactants to the tadpoles of four Australian and two exotic frogs. Environmental Pollution 114, 195-205.
Nielloud, F., and Marti-Mestres, G. (2000). Pharmaceutical emulsions and suspensions. Drug and Pharmaceutical Sciences 105, 11.
Novozamsky, I., van Eck, R., Houba, V., and van der Lee, J. (1996). Solubilization of plant tissue with nitric acid-hydrofluoric acid-hydrogen peroxide in a closed-system microwave digestor. Communications in Soil Science and Plant Analyses 27, 867-875.
Ridgeway, R. L. (1978). Pesticide use in agriculture. Environmental Health Perspectives 27, 103-112.
Salager, J. L. (2002). Surfactants - Types and Uses. Venezuela: Laboratorio FIRP Escuela de Ingenieria Quimica.
Susarla, S., Medina, V., and McCutcheon, S. (2002). Phytoremediation: An ecological solution to organic chemical contamination. Ecological Engineering 18, 647-658.
Weed Science Society of America (WSSA). (2007). Herbicide handbook, (9th edition). Champaign, IL (USA): Weed Science Society of America.
15
CHAPTER 2
LITERATURE REVIEW
SURFACTANTS AND SOIL
Surfactants are used in large amounts in different industries such as
agriculture, detergents and cosmetics to modify spreading characteristics. When
surfactants are used with agricultural chemicals they eventually enter into soil
and water systems. Soil and water contamination with hazardous compounds
has been a global problem. Surfactants entering the environment can possibly
disrupt interactions of different chemical, physical and biological processes,
which may affect aquatic and terrestrial life. Therefore, it is critical to understand
the fate, behavior and transport of surfactants upon entering the ecosystem.
There have been several scientific studies on surfactants over the years.
Because surfactants are organic molecules and subject to potential
biodegradation, most compounds have half lives of about 3 weeks or less
(Valoras et al., 1976). Valoras et al. (1976) examined the effects of soil moisture
on the degradation of nonionic surfactants. They reported that the rate of
surfactant degradation decreased when soil water content level was not suitable
for microbial growth. He also found that it was unlikely for surfactants to
16
accumulate in high concentrations in the soil and that ground water pollution is
decreased by microbial degradation of surfactants.
Surfactants have been useful in increasing the efficient and rapid uptake
of herbicides into the cuticle of plant leaves (Reddy & Singh, 1992; Riechers et
al., 1994). Surfactant interaction with various minerals have been studied to
understand their different behaviors upon entering the soil. Adsorption of
surfactants to clay particles has been reported in different studies (Hower, 1970;
Sánchez-Martín et al., 2000). Adsorption of surfactants to clay surfaces depends
on the chemistry of the surfactant and minerology of the clay. Ray et al. (1995)
demonstrated that nonionic surfactants had a greater affinity and held more
strongly to montmorillonite than kaolinite clays. Podoll (1987) showed that
sorption of poly ethylene glycose to sediments was related to the fraction of clay
and not the fraction of organic carbon.
Surfactants have also been widely studied as a source for reducing oil
contamination in the environment. In a study by Dwarakanath et al. (1999) using
laboratory soil column experiments, anionic surfactants served as a means of
remediation for nonaqueous phase liquids (NAPLs) trapped in aquifers.
Laboratory studies have been conducted on the remediation of various NAPLS
such as gasoline, transmission fluid and other chemicals with the use of
surfactants resulting in recoveries of ≤ 85%. (Ellis et al., 1986; Ang & Abdul,
1991).
17
Although there are studies demonstrating the benefits of using surfactants,
there are some concerns on the negative effects of these products. Studies
conducted by Peters et al. (1992) and Bourbonais et al. (1995) highlighted
difficulties with surfactant precipitation and removing surfactant residues from
soil. An important property of the soil is hydraulic conductivity or the ease in
which water moves through the soil. The use of surfactants has been studied
and has been recognized as a cause in decreased soil hydraulic conductivity
(Renshaw et al., 1997) since surfactants are adsorbed into clays and organic
materials. Adsorption and precipitation of surfactants to clay surfaces are
caused by formed crystals, gels, and macroelmulsion rather than microemulsion
that are better for transport and have a lower viscosity (Pope & Wade, 1995).
Non-ionic surfactants may form admicelles on clay surfaces or micelles on voids
of clays (Sánchez-Martín et al., 2000). This only occurs with uncharged
surfactants as it is independent on specific charges. Brownawell et al. (1990) and
Cano & Dorn (1996) found that the main factor involved in nonionic surfactant
adsorption was by clay swelling as opposed to organic carbon content in the soil.
This makes the compositon of the soil important to the adsorption of nonionic
surfactants. Other problems detected included pore plugging and impermeability
(Ziegenfuss, 1987) while attempting to use surfactant as a remediation agent.
There are indications that abnormal ear growth and cob length in corn could
possibly be caused by different surfactants (Nielsen et al., 2008). Growth
abnormalitities in corn are caused by several factors such as temperature stress,
nutrient difficiency, drought conditions, flooding, genetics of the plant, and poor
18
pollination. Most of these factors directly affect the soil and root system of
plants.
SURFACTANTS AND MICROBIAL ACTIVITY
A large number of microbes exist in the soil environment; millions per
gram of soil. There are different types of microbes in the soil, such as algae,
protozoa, bacteria and fungi. The functions they perform are very complex and
critical for nutrient and carbon cycling and other metabolic activities including
plant growth promotion and disease suppression. Soil microbes obtain energy
by decomposing organic residues in the soil (Paul & Clark, 1989). During
metabolism, soil microorganisms convert nutrients from organic to inorganic
forms for plant uptake. Microbes contribute to natural systems by sequestration
of carbon dioxide, soil respiration, enzymatic activities, soil aggregation, organic
matter decomposition, and nutrient mineralization (Smith, 1994). The process of
nitrogen fixation is carried out exclusively by prokaryotic microorganisms. When
conditions are compatible for plant and microbes, a symbiotic relationship for N
fixation may develop. Soil microbial populations are influenced by the quality
and quantity of substrate in the soil and by soil physical and chemical properties
and climatic conditions. They are most active in warm, moist soils with
temperatures ranging from 25°C to 35°C. Soil biological components are very
responsive to changes in the environment making microbial diversity and their
functions suitable measures for soil quality (Releeder et al., 2006). The
production or diversity of microbial communities is affected by several
19
environmental and growth factors such as moisture, temperature, nutrient
availability, and management practices (Petersen et al., 2002). Some studies
have reported that soil texture was the main factor that governed soil microbial
diversity (Girvan et al., 2003; Fang et al., 2005).
Surfactants are used in different quantities for various products such as
agricultural pesticides, detergents and cosmetics to modify spreading
characteristics (Schramm, 2001; Krogh et al., 2003). Surfactants are commonly
used as a formulation component with herbicides and other pesticides to modify
the effects or surface tension of other liquids. With application, these chemicals
eventually enter soil and water systems (Buhler, et al., 1993). Surfactants
entering the environment may possibly disrupt interactions of various chemical,
physical and biological processes. Chemical, biological, and physical properties
can be affected by changes in management practices, which can alter microbial
populations and activities (Ekenler & Tabatabai, 2003; Griffiths et al., 2004). The
addition of surfactants to the soil environment may alter microbial activity by
impacting sorption sites in the soil, competing with nutrients, increasing solubility
of pesticides, increasing toxicity or by serving as carbon sources for some
components of the microbial community. This interaction depends on the
chemical properties of the surfactant and the soil since different surfactants may
affect different microbial communities (Oros-Sichler et al., 2007). It is likely that
surfactant toxicity contributes to the composition of microbial community structure
(Lozada et al. 2007). In this particular study, the community shaping was
speculated to be attributed to the surfactants being degraded by certain
20
populations or toxicity toward other components. The effects of some nonionic
surfactants vary in different soils as the half-life may be extended. This may
affect microbial processes depending on the surfactant half-life and toxicity
(Charnay et al., 2000) which could possibly affect plant growth and soil
productivity.
Microbes are known to degrade natural and synthetic chemicals in the soil
environment (Atlas, 1986). Some chemicals are more complex than others and
may remain in the soil resulting in negative effects on various microbial
populations (Zhang et al., 2010). Through the process of biodegradation,
microorganisms reduce the effects of various contaminants and toxins on the
environment (Ying, 2006). Due to microbes sensitivity to environmental changes,
the application of chemicals may affect or alter the metabolic efficiency of
microbes (Tardioli et al., 1997; Mechri et al., 2008).
It is important that we understand the variability of composition found
within the soil ecosystem. In the past, there have been different labor intensive
and culture dependent methods used to measure microbial diversity. These
methods relied on determination of bacterial diversity based on phenotypic
characteristics through processes of isolation, culture, and identification (Atlas,
1984). Some of these methods underestimated the quantity of microbes present
due to partial detection or recovery of genetic information (Gafan et al., 2005).
Plate counts and community level physiological profiling (CLPP) are often
commonly used (Jenkinson and Powlson, 1976b; Turco et al., 1994). With
21
advances in technology, new procedures were developed to provide information
on a wider range of soil microbial diversity and to examine these as biological
indicators. Some of these procedures include phospholipid fatty acid (PLFA) and
polymerase chain reaction - denaturing gradient gel electrophoresis (PCR-
DGGE).
Phospholipid fatty acid (PLFA) differences in carbon chain length and
phospholipids are useful to recognize various microbial species (Leckie, 2005).
The variations detected based on PLFA profiles have been linked to changes in
microbial community compositions (Baah et al., 1992; Cavigelli et al., 1995;
Petersen and Klug, 1994). Management practices such as tillage, cropping
systems and addition of various chemicals have altered microbial community
structure based on PLFA profiles (Acosta-Martinez et al., 2010; Dick et al., 2010;
Ratcliff et al., 2006; Ibekwe and Kennedy, 1998). Cationic surfactants were found
to be more toxic to PLFA groups, with gram-negative affected more than gram-
positive bacteria, and that the level of toxicity was related to sorption in the soil
(Sarkar et al., 2009 and Nye et al., 1994).
Denaturing gradient gel electrophoresis (DGGE) is a fingerprinting
technique used to observe and quantify uncultured bacteria based on distinctive
gene sequences present within DNA extracted from soil. This technique has
been utilized in assessment of various natural habitats since its introduction in
the early 1990‟s (Muyzer et al., 2003; Vallaeys et al., 1997; Jensen et al., 1998;
Siqueira et al., 2005; Sadet et al., 2007). Microbial populations have been
22
successfully characterized using this technique (McGaig et al., 2001). It
separates different DNA sequences in the DNA mixture when the soil extract is
passed through a chemical denaturant after the amplification of 16S rDNA by
PCR.
Microorganisms contribute to overall ecosystem functioning through
mediation of various metabolic processes, and therefore it is important that we
understand the microbial response to the introduction of various synthetic
chemicals in to the environment. Microbial communities or sub-populations of
the community can be affected by these chemicals (Bittman et al., 2005; Ratcliff
et al., 2006; Dick et al., 2010). Application of PLFA and DGGE-PCR analyses
are ways to quantify the changes in microbial communities due to impacts of
surfactants in the environment in a more extensive manner compared with
traditional culture-based methods. Understanding the effects of surfactants on
the diversity of microbial communities using these new technologies is therefore
an area that is worth investigating.
SURFACTANTS AND HERBICIDES
The use of herbicides has been practiced as part of modern crop
production systems since their introduction in the 1940‟s (Aldrich and Kremer,
1997). It has benefited crop production by eliminating unwanted weeds and
minimizing competition for nutrients, space and light. In recent years, herbicide-
23
tolerant crops have been developed, which have some economic advantages
and have sparked an increase in the use of herbicides (Burnside, 1992). The
increased use of herbicides has become a major concern to human, animal and
environmental health (Pimentel et al., 1992).
For weed management, herbicides and surfactants are utilized to improve
weed control efficacy. Herbicides are used with formulation additives or
surfactants as it modifies spreading and absorption characteristics of the
herbicide (Schramm, 2001; Grogh et al., 2003). They are paired together based
on chemical characteristics that enhance foliar uptake of post-emergence
herbicides (Liu, 2004). This serves as one of the routes for synthetic surfactants
to enter the ecosystem (Haney, et al., 2000). A substantial amount of different
herbicides and surfactants are used commercially and all react differently in the
soil system based on their chemical composition. This may result in different
chemical, biological and physical processes in the soil that may altered when
these chemicals interact with each other (Smith and Hayden, 1982; Ray et al.;
1995).
Degradation of herbicides in the soil takes place by both microbial and
chemical processes (Fuesler & Hanafey, 1990). Microbes may use herbicide
compounds as a source of carbon with the aid of enzymes during metabolism to
convert them to forms that no longer exhibit herbicide characteristics. Li et al.
(2008) reported biological degradation was key in the degradation of bentazon
and atrazine. It was concluded that combined application of the herbicides and
24
formulation of individual herbicide with a nonionic surfactant reduced the
degradation time of the herbicides. Hydrolysis is the chemical process that
causes herbicides to sometimes change to a deactivated form in the soil when
reacting with water. Many herbicides are absorbed and translocated in plants as
a part of their mode of action. The more vigorous the plant is growing the more
herbicide it will absorb. Herbicides have different modes of actions where
inhibition of certain metabolic pathways takes place. Likewise, they differ in the
half-lives and in the way they are degraded. Similar to surfactants, many
herbicides are also adsorbed to soil particles. It is crucial to assess herbicide
fate in the environment relative to toxicity, availability to soil biological processes
including degradation, and persistence in soil. Adsorption of herbicides to soil
particles greatly depend on herbicide chemistry, soil organic matter content, clay
content, and other soil physicochemical properties (Liu et al., 2008).
Several factors affect the availability of herbicides to soil microbes
involved in degradation such as soil nutrient composition and content, pH,
temperature and moisture levels (Weber et al. 1993). Another concern is
herbicide mobility in the soil, which is affected by the physicochemical and
biological properties of the herbicides and soils (Weber et al., 2007). Sadeghi et
al. (2000) found greater leaching of atrazine in silt loam compared to a sandy
loam soil was a result of macropore flow mechanisms regardless of tillage
practice. Other research showed that certain surfactants were useful in reducing
the mobility of the specific herbicides which can result in increased degradation
and decreased risk to the environment (Hua et al., 2009).
25
Herbicides may reduce enzyme activity and populations of various
organisms in soil (Toyota et al., 1999; Sannino and Gianfreda, 2001). Some
herbicides, such as glyphosate, are easily adsorbed to clay and can be degraded
in different environments (Ahrens, 1994; Barja and dos Santos Afonso, 2005;
Pessagno, et al.; 2008). Other herbicides, such as atrazine, tend to accumulate
in the soil requiring consortia comprised of different microbial groups to
sequentially degrade the herbicide (Satsuma, 2009; Zablotowicz et al., 2002).
Haney et al. (2000) stated that glyphosate was directly and rapidly degraded by
microbes, even at high rates of application.
However, many concerns have been raised about the effects of herbicides
on microbial activity over the past several years (Upchurch et al., 1966; Charnay
et al., 2000; Haney et al., 2000). Harris et al. (1995) found that herbicides did
not affect soil microbial counts to the extent of different management practices,
such as tillage, no-tillage, and burning of crop residue. Lupwayi et al. (2010)
reported that continuous application of herbicides reflected more significant
changes in soil microbial process. Changes have been detected in bacterial and
fungal communities of soil due to application of various herbicides (Ratcliff et al.,
2006). Charnay et al. (2000) found that the degradation of herbicides was
decreased when formulated with different surfactants. Crouzet et al (2010)
concluded in a study with pure herbicide and formulated herbicide that microbial
activity was affected, but only when the chemicals were used at rates much
greater than recommended. Haney et al. (2000) saw a direct correlation with
enhancement of microbial activity and the amount of carbon and nitrogen added
26
through glyphosate treatments. Based on the literature, it would be useful to
study the impact of herbicide and surfactant formulations on the soil microbial
community structure, and nutrient uptake in soils with different texture and
chemical properties.
27
REFERENCES
Acosta-Martínez, V., Dowd, S., Sun, Y., Wester, D., and Allen, V. (2010). Pyrosequencing analysis for characterization of soil bacterial populations as affected by an integrated livestock-cotton production system. Applied Soil Ecology 45, 13–25.
Ahrens, W.A. (1994). Herbicide handbook. Seventh Edition. Champaign, IL: Weed Science Society of America, 352.
Aldrich, R.J., and Kremer, R.J. (1997). Principles in weed management. Ames, IA (USA): Iowa State University Press.
Anderson, T., Kruger, E., and Coats, J. (1994). Biological degradation of pesticide wastes in the root zone of soils collected at an agrochemical dealership. Washington, DC (USA): American Chemical Society.
Ang, C. C., and Abdul, S. A. (1991). Aqueous surfactant washing of residual oil contamination from sandy soil. Ground Water Monitoring Review 11, 121-127.
Atlas, R. M. (1984). Diversity of microbial communities. Advances in Microbial Ecology 7, 1-47 (7 p.).
Bååth, E., Frostegård A., and Fritze, H. (1992). Soil bacterial biomass, activity, phospholipid fatty acid pattern, and pH tolerance in an area polluted with alkaline dust deposition. Applied and Environmental Microbiology 58, 4026–4031.
Barja, B.C., and dos Santos Afonso, M. (2005). Aminomethylphosphonic acid and glyphosate adsorption onto goethite: A comparative study. Environmental Science and Technology 39, 585-592.
Beare, D. J. (1991). A comparison of methods for estimating soil microbial biomass carbon. Agriculture Ecosystems and Environment 34, 35–51.
Bittman, S., Forge, T. A., and Kowalenko, C. G. (2005). Responses of the bacterial and fungal biomass in a grassland soil to multi-year applications of dairy manure slurry and fertilizer. Soil Biology and Biochemistry 37, 613–623.
Bourbonais, K. A., Compeau, G. C., and MacClellan, L. K. (1995). Evaluating effectiveness of in situ flushing with surfactants. American Chemical Society Symposium Series 594, 161-177.
28
Brownawell, B., Chen, H., Collier, J., and Westall, J. C. (1990). Adsorption of organic cations to natural materials. Environmental Science and Technology 24, 1234-1241.
Buhler D. D, Randall, G. W., Koskinen, W. C. and Wyse, D. L. (1993). Atrazine and alachlor losses from subsurface tile drainage of clay loam soil. Journal of Environmental Quality 22, 583–588.
Burnside, O. (1992). Rationale for Developing Herbicide-Resistant Crops. Weed Technology , 621-625.
Cano, M., and Dorn, P. B. (1996). Sorption of two model alcohol ethoxylate surfactants to sediments. Chemosphere 33, 981-994.
Cavigelli, A. C., Robertson, P. G., and Klug, M. J. (1995). Fatty acid methyl ester (FAME) profiles as measure of soil microbial community structure. Plant and Soil 170, 99–113.
Charnay, M., Tarabelli, L., Beigel, C., and Barriuso, E. (2000). Modifications of Soil Microbial Activity and Triticonazole Biodegradation by Pesticide Formulation Addivtives. Journal of Environmental Quality 29, 1618-1624.
Crouzet, O., Batisson, I., Besse-Hoggan, P., Bardot, C., Poly, F., Bohatier, J., and Mallet, C. (2010). Soil Biology & Biochemistry Response of soil microbial communities to the herbicide mesotrione: A dose-effect microcosm approach. Soil Biology and Biochemistry 42, 193-202.
Cutright, T., and Lee, S. (1995). In situ soil remediation: bacteria or fungi? Energy Sources 17, 413-419.
Dick, R., Lorenz, N., Wojno, M., and Lane, M. (2010). Microbial dynamics in soils under long-term glyphosate tolerant cropping systems. Proceedings 19th World Congress of Soil Science, Brisbane, Australia.
Dwarakanath, V., Kostarelos, K., Pope, G. A., Shotts, D., and Wade, W. H. (1999). Anionic surfactant remediation of soil columns contaminated by nonaqueous phase liquids. Journal of Contaminant Hydrology 38, 465-488.
Ekenler, M., and Tabatabai, M. A. (2003). Tillage and residue management effects on Beta-glucosaminidase activity in soils. Soil and Biology and Biochemistry 35, 871-874.
Ellis, W., Payne, J., and Daniel, G. (1986). Treatment of contaminated soils with aqueous surfactants. Cincinnati, OH: Environmental Protection Agency, Hazardous Waste Engineering Research Laboratory.
29
Fang, M., Kremer, R. J., Motavalli, P. P., and Davis, G. (2005). Bacterial Diversity in Rhizospheres of Nontransgenic and Transgenic Corn. Applied and
Environmental Microbiology 71, 4132-4136.
Fuesler, T. F., Hanafey, M. K. (1990). Effect of Moisture on Clorimuron Degradation in Soil. Weed Science 38, 256 - 261.
Gafan, Gavin P., Lucas, Victoria S., Roberts, Graham J., Petrie, Aviva, Wilson, M., and Spratt, David A. (2005). Statistical Analyses of Complex Denaturing Gradient Gel Electrophoresis Profiles. Journal of Clinical Microbiology 43, 3971-3978.
Georgiou, G., Lin, S., and Sharma, M. (1992). Surface−Active Compounds from Microorganisms. Biotechnology 10, 60-65.
Girvan, M. S., Bullimore, J., Pretty, J. N., Osborn, A. M., and Ball. A. S. (2003). Soil type is the primary determinant of the composition of the total and active bacterial communities in arable soils. Applied and Environmental Microbiology 69, 1800–1809.
Griffiths, B. S., Kuan, H. L., Ritz, K., Glover, L. A., McCaig, A. E., and C., Fenwick. (2004). The relationship between microbial community structure and functional stability, tested experimentally in an upland pasture soil. Microbial Ecology 47, 104-113.
Haney, R., Senseman, S. A., Hons, F., and Zuberer, D. A. (2000). Effect of glyphosate on soil microbial activity and biomass. Weed Science 48, 89-93.
Harris, P. A., Schoomberg, H. H., Banks, P. A., and Giddens, J. (1995). Burning, tillage and herbicide effects on the soil microflora in a wheat-soybean double-crop sytem. Soil Biology and Biochemistry 27, 153-156.
Hasting, R. (1999). Application of denaturing Gradient Gel Electrophoresis to Microbial ecology. New Jersey.: Environmental Monitoring of Bacteria, Humana Press Inc.
Hower, W. F. (1970). Adorption of surfactants on montmorillonite. Clays and Clay Minerals 18, 97-105.
Hua, R., Spliid, N. H., Heinrichson, K., and Laursen, B. (2009). Influence of
surfactants on the leaching of bentazone in a sandy loam soil. Pest
Management Science, 65, 857-861.
Ibekwe, A. M., and Kennedy A. C. (1998). Phospholipid fatty acid profiles and carbon utilization patterns for analysis of microbial community structure under field and greenhouse conditions. FEMS Microbiology Ecology 26, 151-163.
30
Jenkinson D. S. and Powlson D. S. (1976b). The effects of biocidal treatments on metabolism in soil – V. A method of measuring soil biomass. Soil Biology and Biochemistry 8, 209-213.
Jensen, S., L. Øvreas, F. L. Daae, and V. Torsvik. (1998). Diversity in methane
enrichments from an agricultural soil revealed by DGGE separation of
PCR amplified 16S rDNA fragments. FEMS Microbiology Ecology 26, 17–
26.
Krogh, K.A., Halling-Sorensen, B., Mogensen, B. B., and Vejrup, K. V. (2003). Environmental properties and effects of nonionic surfactant adjuvants in pesticides: a review. Chemosphere 50, 871–901.
Leckie, S. E. (2005). Methods of microbial community profiling and their
application to forest soils. Forest Ecology and Management 220, 88–106.
Li, K. B., Cheng, J. T., Wang, X. F., Zhou, Y. and Liu, W. P. (2008). Degradation of herbicides atrazine and bentazone applied alone and in combination in soils. Pedosphere 18, 265-272.
Liu, Zhiqian. (2004). Effects of surfactants on foliar uptake of herbicides – a complex scenario. Colloids and Surfaces B: Biointerfaces 35, 149-153.
Liu, Z., He, Y., Xu, J., Huang, P., and Jilani, G. (2008). The ratio of clay content to total organic carbon content is a useful parameter to predict adsorption of herbicide butachlor in soils. Environmental Pollution 152, 163-171.
Lozada, M., Basile, L., and Erijman, L. (2007). Impact of non-ionic surfactant on the long-term development of lab-scale-activated sludge bacterial communities. Research in Microbiology 158, 712-717.
Lupwayi, N.Z., Brandt, S.A., Harker, K.N., O'Donovan, J.T., Clayton, G.W., and Turkington, T.K. (2010). Contrasting soil microbial responses to fertilizers and herbicides in a canola-barley rotation. Soil Biology and Biochemistry, 42, 1997-2004.
McCaig, A. E., Glover L. A., and Prosser J. I. (2001). Numerical analysis of grassland bacterial community structure under different management regimens by using 16S ribosomal DNA sequence data and denaturing gradient gel electrophoresis banding patterns. Applied and Environmental Microbiology 67, 4554–4559.
Mechri. B., Mariem, F. B., Baham, M., Elhadj S. B., and Hammami M. (2008). Change in soil properties and the soil microbial community following land spreading of olive mill wastewater affects olive trees key physiological parameters and the abundance of arbuscular mycorrhizal fungi. Soil Biology and Biochemistry 40, 152–161.
31
Muyzer, G., de Waal, E. C., and Uitterlinden, A. G. (1993). Profiling of complex microbial populations by denaturing gradient gel electrophoresis analysis of polymerase chain reaction-amplified genes coding for 16S rRNA. Applied and Environmental Microbiology 59, 695–700.
Nielsen, R., Wise, K., and Gerber, C. (2008). Arrested ears resulting from pre-tassel aplications of pesticide and spray additive combinations. West Lafayette, IN: Purdue University.
Nye, J. V., Guerin, W. F., and Boyd, S. A. (1994). Heterotrophic activity of microorganisms in soils treated with quaternary ammonium compounds. Environmental Science and Technology 28, 225-237.
Oros-Sichler, R., Costa, H., and Smalla, K. (2007). Molecular fingerprinting techniques to analyze soil microbial communities. In: van Elsas, J.D.;
Jansson, J.K.; Trevors, J.T. (eds). Modern Soil Microbiology - second edition, CRC Press, Boca Raton, FL, USA, 355-386.
Papp, C., and L.B., F. (1987). Application of microwave digestion to the analysis of peat. Analyst 112, 337-338.
Paul, E., and Clark, F. E. (1989). Soil Microbiology and Biochemistry. San Diego: Academic Press Inc.
Pessagno, R. C., Torres Sa´nchez, R. M., and dos Santos Afonso, M. (2008). Glyphosate behavior at soil and mineral - water interfaces. Environmental Pollution 153, 53–59.
Peters, R.W., Montemagno, C.D., and Shem, L. (1992). Surfactant Screening of Diesel-Contaminated Soil. Hazardous Waste and Hazardous Materials 9, 113-133.
Petersen, S. O., and Klug, M. J. (1994). Effects of sieving, storage, and incubation temperature on the phospholipid fatty acid profile of a soil microbial community. Applied and Environmental Microbiology 60, 2421–2430.
Petersen, S. O., Frohne, P., and Kennedy, A. C. (2002). Dynamics of a soil microbial community under spring wheat. Soil Science Society of America Journal 66, 826-833.
Pimentel, D., Acquay, H., Biltonen, M., Rice, P., Silva, M., Nelson, J., Lipner, V., Giordanos, S., Horowitz, A., and D‟Amore, M. (1992). Environmental and Economic Costs of Pesticide Use. American Institute of Biological Sciences 42, 750-760.
Podoll. (1987). Sorption of water-soluble oligomers on sediments. Environmental Science and Technology 21, 562-568.
32
Pope, G., and Wade, W. (1995). Lessons from enhanced oil recovery research for surfactant enhanced aquifer remediation. NAL/USDA (USA), ACS symposium series, 594, 142-176.
Ratcliff, A. W., Busse, M. D., and Shestak, C. J. (2006). Changes in microbial community structure following herbicide (glyphosate) additions to forest soils. Applied Soil Ecology 34, 114-124.
Ray, A., Ma, J., and Borst, M. (1995). Adsorption of surfactants on clays. Hazardous Waste and Hazardous Materials 12, 357-364.
Reddy, K., and Singh, M. (1992). Organosilicone adjuvant effects on glyphosate efficacy and rainfastness. Weed Technology 6, 361-365.
Releeder, R. D., Miller, J. J., Ball Coelho, B. R., and Roy, R. C. (2006). Impacts of tillage, cover crop, and nitrogen on populations of earthworms, microarthropods, and soil fungi in a cultivated fragile soil. Applied Soil Ecology 33, 243–257.
Renshaw, C. E., Zynda, G. D., and Fountain, J. C. (1997). Permeability reductions induced by sorption of surfactants. Water Resources Research 33, 371-378.
Riechers, D. E., Wax, L. M., Liebl, R. A., and Bush, D. R. (1994). Surfactant-increased glyphosate uptake into plasma membrane vesicles isolated from common lambsquarters leaves. Plant Physiology 105, 1419-1425.
Sadeghi, A. M., Isensee, A. R., and Shirmohammadi, A. (2000). Influence of soil texture and tillage on herbicide transport. Chemosphere 41, 1327-1332.
Sadet, S., Martin, C., Meunier, B., and Morgavi, D. P. (2007). PCR-DGGE analysis reveals a distinct diversity in the bacterial population attached to the rumen epithelium. Animal 1, 939–944.
Sánchez-Martín, M. J., Dorado, M. C., del Hoyo, C., and Rodríguez-Cruz, M. S. (2008). Influence of clay mineral structure and surfactant nature on the adsorption capacity of surfactants by clays. Journal of Hazardous Materials 150, 115-123.
Sarkar, B., Patra, A., Purakayastha, T., and Megharaj, M. (2009). Assessment of biological and biochemical indicators in soil under transgenic Bt and non-Bt cotton crop in a sub-tropical environment. Environmental Monitoring and Assessment 156, 595-604.
Sannino F., and Gianfreda L. (2001). Pesticide influence on soil enzymatic activities. Chemosphere 45, 417–425.
33
Satsuma, Koji. (2009). Complete biodegradation of atrazine by a microbial community isolated from a naturally derived river ecosystem (microcosm). Chemosphere 77, 590–596.
Schramm, L.L. (2001). Surfactants. Fundamentals and Applications in the
Petroleum Industry. Journal of Petroleum Science and Engineering 30,
258-259.
Sinsabaugh, R. L. (1999). Standard Soil Methods for Long Term Ecological Research. Oxford. New Yorrk: Oxford University Press.
Siqueira, José F., Rôças, Isabela N., and Rosado, Alexandre S. (2005). Application of Denaturing Gradient Gel Electrophoresis (DGGE) to the Analysis of Endodontic Infections. Journal of Endodontics 31, 775-782.
Smith, A. E., and Hayden, B. J. (1982). Carry-over of dinitramine, triallate, and trifluralin to the following spring in soils treated at different times during the fall. Bulletin of Environmental Contamination and Toxicology 29, 483-486.
Smith, J.L. (1994). Cycling of nitrogen through microbial activity. 91–120. In J.L.Hatfield and B.A. Stewart (ed.) Soil biology: Effects on soil quality. Advances in Soil Science, Lewis Publ., Boca Raton, Florida.
Tardioli, S., Ba`nne`, E. T. G., and Santori, F. (1997). Species-specific selection on soil fungal population after olive mill waste-water treatment. Chemoshpere 34, 2329–2336.
Toyota, K., Ritz, K., Kuninaga, S., and Kimura, M. (1999). Impacts of fumigation with meta-sodium upon soil microbial community structure in two Japanese soils. Soil Science and Plant Nutrition 45, 207–223.
Turco, R. F., Kennedy, A. C., and Jawson, M. D. (1994). Microbial indicators of
soil quality. In Defining soil quality for a sustainable environment. Eds. J
W Doran, D C Coleman, D F Bezdicek and B A Steward. pp. 73–90. Soil
Science Society of America Journal Special Publication 35, Madison, WI.
Upchurch, R., Selman, F., mason, D., and Kamprath, E. (1966). The Correlation of Herbicidal Activity with Soil and Climatic Factors. Weed Science Society of America 14, 42-49.
Vallaeys, T., Topp, E. Muyzer, G. Macheret, V. Laguerre, G. Rigaud, A. and Soulas. G. (1997). Evaluation of denaturing gradient gel electrophoresis in the detection of 16S rDNA sequence variation in rhizobia and methanotrophs. FEMS Microbiology Ecology 24, 279–285.
34
Valoras, N., Letey, J., Martin, J., and Osborn, J. (1976). Degradation of a nonionic surfactants in soils and peat. Riverside, CA: Department of Soil Science and Agricultural Engineering, University of California.
Weber, J. B., Best, J. A. and Gonese, J. U. (1993), Bioavailability and bioactivity of sorbed organic chemicals. In: Luxmore, R.J. and Peterson, G.A. (eds.), Sorption and Degradation of Pesticides and Organic Chemicals in Soil. Soil Science Society of America, 153−196.
Weber, J. B., Warren, R. L., Swain, L. R., and Yelverton, F. H. (2007). Physicochemical property effects of three herbicides and three soils on herbicide mobility in field lysimeters. Crop protection 26, 299-311.
Wollum, A. (1982). Cultural methods of soil microorganisms. In A. Page, Methods of Soil Analysis (2nd edition) (781-801 Part 2). American Society of Agronomy, Madison, WI.
Ying, G. G. (2006). Fate, behavior and effects of surfactants and their degradation products in the environment. Environment International 32, 417-431.
Zablotowicz, R. M., Weaver, M. A., and Locke, M. A. (2002). In: 10th Intl. Congress on the Chemistry of Crop Protection Abstr. 5a.47.
Zhang, C., Liu, X., Dong, F., Xu, J., Zheng, Y., and Li, J. (2010). Soil microbial communities response to herbicide 2,4-dichlorophenoxyacetic acid butyl ester. European Journal of Soil Biology 46, 175-180.
Ziegenfuss, P. S. (1987). The potential use of surfactant and cosolvent soil washing as adjuvant for in-situ aquifer restoration. Houston, TX: MS thesis, Rice University.
35
CHAPTER 3
EFFECTS OF SELECTED
SURFACTANTS ON NUTRIENT UPTAKE
IN CORN (ZEA MAYS L.)
INTRODUCTION
Surfactants (surface active agent) are synthetic chemicals used in various
industries for their modification properties in formulation liquids allowing for
easier emulsifying, dispersing, spreading, and wetting. These industries include
agriculture, detergency, pharmacy, and cosmetics. North America is one of the
leading consumers of surfactants and the world has seen a rapid increase in its
usage (Underwood, 2000). In the agricultural industry, surfactants are used in the
formulation of different pesticide and this has also increased in previous years
(Ridgeway et al., 1987). They are common ingredients used for herbicide
formulations to aid in the eradication of weeds. There are four different
classifications of surfactants: anionic, cationic, nonionic, and amphoteric. They
have proven to be positive in helping to improve crop quality by reducing pests
and weeds (Haller and Stocker, 2003). Surfactants used with agricultural
chemicals eventually enter into soil and water systems after application. These
36
chemicals have a half-life of three weeks or less (Valoras et al., 1976).
Biodegradation of some of these chemicals by microorganisms may reduce
adverse effects on the environment (Ying, 2006). Soil moisture influences the
degradation of surfactants, with the rate of degradation decreasing with
decreased water content as it was not suitable for microbial growth (Valoras et
al., 1976). Degradation is determined by the chemical nature of the surfactant
and the soil chemical environment relative to nutrients and oxygen (Ying, 2006;
Ang & Abdul 1992). Surfactants entering the environment can possibly disrupt
different chemical, physical and biological interactions. Therefore, it is critical that
we understand the fate, behavior and transport of surfactants upon entering the
ecosystem.
There have been studies over the years to examine effects on the
environment as it pertains to plant, soil and water contamination. Positive
aspects linked to the utilization of surfactants include their ability to increase the
efficiency and rapid uptake of herbicides into the cuticle of plant leaves (Reddy &
Singh, 1992; Riechers et al., 1994). Studies have also been conducted on their
interaction with soil moisture as a means to improve water use efficiency and
reducing nutrient loss in to the environment (Poulter, 2009). Surfactants have
also been useful in the transport or mobility of the herbicide bentazon in soil. Hua
et al. (2009) concluded that surfactants (non-ionic) were valuable in reducing the
mobility of the specific herbicides which can result in increased degradation and
decreased risk to the environment.
37
Although considerable efforts have examined how surfactants affect
aquatic and other organisms, very little has focused on surfactant effects on plant
nutrient uptake/translocation and plant growth. A study conducted on the use of
nonionic surfactants showed that these compounds increased root growth (depth
and volume) in corn (Brumbaugh and Pertersen, 2001). Pertaining to plant
nutrition, a study by Walworth & Kopec (2004) with turfgrass and bermuda grass
did not show either positive or negative effects on macronutrient and
micronutrient uptake due to surfactant application.
Likewise, some negative effects have been associated with the use of
surfactants especially in aquatic environments where nonionic surfactants
caused an increase in toxicity (Mann & Bidwell, 2001). Composition of the soil is
critical to the adsorption of surfactants as clay swelling is a main contributor to
this process (Brownawell et al.,1990; Cano and Dorn 1996). Nonionic
surfactants have shown a greater affinity and are held more strongly to
montmorillonite than kaolinite clays (Ray et al. 1995). Its also been recorded that
surfactants decrease hydraulic conductivity (Renshaw et al., 1997) as it
adsorbed onto clays and organic materials. Surfactants used as remediating
agents may cause pore plugging and impermeability (Ziegenfuss, 1987).
Abnormalities in crops are generally caused by several factors such as
temperature stress, nutrient deficiency, drought conditions, flooding, genetics of
the plant and poor pollination. However, some reports suggest possible
involvement of different surfactants in abnormalities in corn ear growth and cob
length (Nielsen et al., 2008). Recently the surfactant alkylphenol ethoxylate, a
38
component of a pyraclostrobin fungicides applied to corn to control fungal
diseases, was implicated as a causal agent of “arrested ear development” in corn
that results in improper or incomplete development of the ear (Schmitz et al.,
2011). Most reports of surfactant effects on plants deal with above-ground
vegetative or reproductive development, while few have pertained to below-
ground or root development and uptake.
Organic and synthetic surfactants as soil contaminants are influenced by
humic substances (Buffle, 1988; Koopal et al., 2004). Humic substances are
organic amphiphilic component of humus with functional groups, which play
critical roles in plant nutrition and soil fertility. Humic substances interact with
other molecules through different forces. The various chemical components
cause humic substances to vary in solubility due to pH, molecular mass, surface
activity, and aggregation (Piccolo and Mbagwu, 1989; Terashima et al., 2004;
Gamboa and Olea, 2006). Cationic surfactants bind to humic substances at very
low concentrations. The mobility of surfactant and humic substance complexes
in soil or aquatic environment is affected by variable precipitation under different
conditions (Ishiguro, 2007).
As in the case of surfactant use, the herbicides has increased over the last
few decades due to their effectiveness in weed management in nearly all crop
production systems. The main function of herbicides is to disrupt essential
metabolic pathways that are vital for plant survival, specifically targeted at weeds.
There are different categories of herbicides now available including selective,
non-selective, pre-plant and post-plant herbicide classes. One advancement by
39
the herbicide industry was the combination of active ingredients with surfactants
in herbicide formulations to ensure better mixing, uptake, spreading and retention
on plant surfaces. Several environmental factors, such as moisture, soil type,
nutrient content, pH, and temperature, influence the effectivenes of herbicides
(Smith and Hayden, 1982). Herbicide degradation or longevity in soils is greatly
influenced by microbial composition, moisture, and temperature (Laabs et al.,
2002). Under aerobic conditions surfactants are easily degraded but tend to
persist in anaerobic conditions (Fernández Cirelli, 2010). Such reactions may
influence nutrient cycling in soil.
Studies have been conducted to evaluate the fate and transport of
herbicides relative to physical, chemical and biological changes in the
environment. Some studies have shown that microbial numbers are not affected
by herbicides with different management practices (Harris et al.,1995). Haney et
al. (2000) later reported that addition of glyphosate strongly correlated with
carbon and nitrogen mineralization and did not negatively affect soil microbial
activity. Glyphosate is strongly adsorbed to soil particles with variable sorption
(as reflected by the sorption coefficient, Kd) across soil horizons (Farenhorst et
al., 2009). Atrazine, one of the most extensively used herbicides, is widely
considered persistent and may be detected in water bodies affecting aquatic
species both directly and indirectly (Graymore et al., 2001). Soil texture and
management have been shown to influence the sorption and movement of
herbicides (Sadeghi et al., 2000; Rae et al., 1998).
40
The soil has an integral role in the production of the food supply. The
introduction of surfactants into the soil environment may cause some chemical
reactions or physical changes that may interfere with the transport and
availability of nutrients to plants. Therefore the research objective was to
examine the effects of surfactants on plant nutrient uptake by determining
differences in micronutrient and macronutrient concentrations in corn plants
treated with different application rates of surfactants and surfactant-herbicide
combinations.
41
METHODS AND PROCEDURE Soils and chemicals used in study
Soil samples collected were silt loam (20 % clay) from Lincoln University
Carver Farm (38° 31‟ 36.1” N, 92° 8‟ 22.9” W) and silty clay loam (37.5 % clay)
from University of Missouri Bradford Farm (38° 53‟ 48” N, 92° 12‟ 23.5” W). Soils
were classified as Wrengart silt loam (fine-silty, mixed, active, mesic Fragic
Oxyaquic Hapludalfs) and Mexico silt loam (fine, smectitic, mesic Vertic
Epiaqualfs), respectively. The silt loam soil prior to collection was under
continuous tall fescue (Festuca arundinacea L.) with annual fertilizer applications
of N-P-K (60-30-30) for no less than five years. The silty clay loam was under
permanent broomsedge grass (Andropogon virginicus L.) due to its low pH, and
had not been fertilized recently. No known herbicide plus surfactant applications
had been made to the two sites prior to soil sampling.
Bulk soils were air dried, sieved to pass a 2-mm screen, and analyzed for
chemical and physical characteristics using standard procedures of the
University of Missouri Soil and Plant Testing Laboratory (Buchholz et al., 1983).
Soils were processed, air dried and analyzed for chemical and physical
characteristics (Table 3.1). Surfactants used in this study were alkylphenol
ethoxylate plus alcohol ethoxylate (Activator 90; non-ionic; Loveland Industries,
Inc., Greeley CO), polyethoxylate (Agri-Dex; non-ionic; Helena Chemical
Company, Collierville TN) and a blend of ammonium sulfate, drift
reduction/deposition polymers and anti-foam agent (Thrust; anti-foam agent;
Loveland Industries, Inc., Greeley CO). Herbicides used were glyphosate (Gly-
42
4 Plus; Universal Crop Protection Alliance LLC, Eagan MN), atrazine (AAtrex;
Universal Crop Protection Alliance LLC, Eagan MN), and bentazon (Basagran;
Micro Flow Company LLC, Memphis TN). Surfactants and herbicides were
applied alone and in combination to both soils. Non-treated soils were controls
(Table 3.2). Application followed label rates provided for the surfactants and
herbicides, and calculated to per pot of 4000 g soil. Treatment mixtures of
deionized water and chemical(s) were applied directly to potted soils. Some
treatments were applied prior to planting or after planting depending on the
herbicide associated with it; preemergent or postemergent.
Two-gallon pots (20.3 cm dia. by 20.3 cm in height) lined with
polyethylene plastic bags, were filled with 4000 g of air-dried soil, fertilized and
limed based on recommendations determined from soil test results. Fertilizers
used in the study to meet soil test recommendations were ammonium nitrate
(NH4NO3), ammonium phosphate ((NH4)2HPO4), potassium chloride (KCl) and
ammonium sulfate ((NH4)2SO4) used for additional nitrogen half way through the
growth period. Field capacity was calculated for each soil, were brought to field
capacity and then watered daily to maintain field capacity levels of 21 and 24%
for the silt loam and the silty clay loam, respectively. Untreated hybrid field corn
(Zea mays L. type „Indenta‟) was used as the experimental crop. Treatments
were replicated three times and arranged in a randomized complete complete
block design on greenhouse benches. In each pot, six field corn seeds were
planted and thinned to two plants per pot after two weeks of growth.
Temperature in the greenhouse varied from 18 to 27°C throughout the day.
43
Additional lighting was also provided to increase day light period. After seven
weeks of growth from seeding (8-leaf stage - V8) the corn foliage was harvested
by cutting at the soil surface. Fresh foliage weights were recorded and foliage
allowed to dry at 70 °C for 72 hours after which the dry weights were recorded.
Dried plants were ground and stored for digestion in sample bags. Soil samples
were collected, air dried and passed through a 2 mm mesh sieve (number 10)
and stored in soil sample plastic bags for digestion.
Digestion and analyses of samples
Digestion of foliage and soil samples was done using a microwave aqua
regia acid digestion method with Nitric Acid-Perchloric Acid mixture (HNO3-
HClO4) and Hydrochloric Acid- Nitric Acid-Hydrofluoric Acid (HCl-HNO3-HF)
mixture, respectively (Novozamsky et al, 1996; Papp and Fischer, 1987). Plant
and soil samples of 0.25 g were weighed into vessels and acid mixture added.
The teflon vessel was properly sealed and allowed to digest and cool for 30
minutes at 180 °C using an Ethos EZ Microwave Digestion Lab-Station
(Milestone Inc., Shelton, CT 06484 USA). Each vessel was carefully opened after
cooling and digested material filtered into a 25 ml flask. The volume of the
digested material was diluted to 25 ml with deionized water. Diluted digested
samples were stored at 4 °C until elemental analysis with an Inductively Coupled
Plasma Emission Spectrophotometer (ICP). Samples were diluted three times
prior to analyses. Along with samples, blanks, Standard Reference Materials
(SRM) and automatic recalibration of the ICP were used as quality controls.
44
Elements analyzed were phosphorus (P), potassium (K), calcium (Ca),
magnesium (Mg), sulfur (S), copper (Cu), iron (Fe), manganese (Mn),
molybdenum (Mo), zinc (Zn), aluminum (Al), chromium (Cr), sodium (Na), nickel
(Ni), and lead (Pb). Total organic carbon and total nitrogen was determined by
the combustion method using a LECO TrueSpec carbon/nitrogen analyzer
(LECO Corporation, St. Joseph, MI, USA).
Statistical analyses were used to interpret the results for the plant and soil
nutrient concentrations. The research was conducted as a factorial experiment
(three surfactants at two different rates with control, and three herbicides) in a
randomized blocked design. Each treatment was replicated three times.
Analysis of variance (ANOVA) was calculated with the PROC GLM (SAS
Institute, 2003) to examine the possible effects that surfactants might have on
nutrient uptake. The Student Newman Kuels Test was used to compare
treatment means at P≤0.05.
45
RESULTS AND DISCUSSION
There were differences in chemical and physical characteristics of the two
soils used in this. The silt loam soil had a higher pH (0.01 M CaCl2) of 5.61
compared to the silty clay loam soil pH of 4.52 (Table 5.1a), both not suitable for
corn production. Also, the silt loam soil was higher in total organic C, N, P, and K
compared to the silty clay loam. Cation exchange capacity values of the silty
clay loam were double the CEC of the silt loam soil and Mg in the silty clay loam
was higher than the silt loam.
Fresh weight and dry weight
In our analyses we examined fresh weight and dry weight for plants, and
elemental concentrations in both plants and soils. Foliage fresh and dry weights
were statistically similar among treatments (Figure 3.1, A and B). During the
greenhouse study, it was generally noted that plants in the silty clay loam were
smaller than plants grown in the silt loam, apparently reflecting differences in soil
conditions.
Textural differences between the two soils likely contribute to differences
in porosity, pore size distribution and moisture retention affecting air permeability
with the silty clay loam soil being more subject to changes in these properties
than the silt loam (Riley et al., 2005). Increased tortuosity and more tightly bound
nutrients to soil particles are conditions that can affect plant growth. Soil with
coarser particles may produce greater root growth and foliage growth than soils
46
with finer soil particles as root interception, mobility of nutrients, and air
movement is not restricted (Lapen et al., 2001).
Greater variation in fresh weight accumulation by plants grown was
apparent in the silty clay loam compared with silt loam where fresh weight
biomass was more uniform across treatments. This implies that differences
physiochemical properties of the soils may cause some variation in response to
treatments in the silty clay loam (Kumar et al., 2004). This is expected as plants
grown in soil with high clay contents may have some restrictions to conditions
suitable for plant growth and nutrient availability. There were not visual signs of
crop injury due to the treatments applied. In the early stages of growth (V4), the
silty clay loam plants exhibited limited symptoms of phosphorus deficiency by
displaying a slight purple color to leaves. After a few days symptoms were no
longer evident suggesting that at early stages (V4), when growth is vigorous, the
plant was lacking available phosphorus from the soil for translocation to
established vegetative biomass due to limited root development. This can partly
be attributed to the soil physiochemical state where nutrients are not readily
released to soil solution for plant uptake (Bagyaraj et al., 2000; Richardson,
1994).
Plant Nutrient Concentrations
Proper plant growth greatly depends on efficient plant nutrient uptake from
the soil solution. We examined various nutrients to determine specific treatment
effects. Plant tissue N and (C:N) values were not significantly different between
47
either soils or for the treatments applied to the soils. However, in the silt loam
(Figure 3.2A) N increased slightly for all treatments and C:N decreased when
compared to the control. The increase in N concentration for plants grown in silt
loam amended with the treatments may result from the use of added chemicals
as food sources for soil microorganisms thereby contributing to increased
mineralization of N (Jonasson et al., 2006). Similar values were seen in the silty
clay loam (Figure 3.2B) but the same trend was not observed. Although there
was a difference in plant fresh and dry weights, with highest biomass
accumulated when grown in silt loam, the silty clay loam plants had slightly
higher N concentrations. Silty clay loam properties including smaller pore space
and greater water holding capacity may lead to greater retention of soil solution
allowing the finer roots more time for direct access to the soil solution while, in
the silt loam, the soil solution more readily percolates through the soil volume
and likely leached to the bottom of the pot.
For the elemental concentrations determined by ICP, nutrients were
categorized as macronutrients, micronutrients and trace elements. Plant
macronutrient uptake in silt loam (Table 3.3) showed no significant difference
between treatments but nutrient concentration was higher when compared to the
control. For the surfactants, Activator-90 increased S (P=0.0001) in the silty clay
loam (Table 3.4). No difference was observed for macronutrients with Agri-Dex
application at the recommended rate in the silty clay loam for corn tissue. Thrust
significantly decreased macronutrient uptake when applied at the recommended
rates to the silty clay loam for Ca (P=0.0003), Mg (P=0.0076), and S (P=0.0001).
48
Silty clay loam receiving herbicide alone showed decreased plant macronutrient
uptake with glyphosate for P (P=0.0003) and S, and in atrazine for S. Decreased
macronutrient uptake has also been detected in previous studies (Ellis et al.,
1983; Wilson and Stewart, 1973) in which herbicides also reduced nutrient
uptake and resulted in plant growth being reduced.
As observed for macronutrients, micronutrient concentrations for corn
grown in silt loam (Table 3.5) showed no significant differences, but most
treatments increased nutrient uptake when compared to the control. An increase
in Cu concentration was noted for all treatments when compared to the control in
the silt loam soil. In the silty clay loam (Table 3.6), significance was only seen in
Cu (P=0.0081) and Zn (P=0.0313) among the different treatments. Activator-90
at the recommended rate increased micronutrient uptake, while the combination
of the Activator-90 and Gly-4 Plus decreased nutrient uptake. Glyphosate has
been reported to immobilize cationic nutrients in soil and reduce uptake into
several plants (Cakmak et al., 2009). It is interesting that apparent glyphosate
nutrient immobilization was greatest in silty clay loam with initially low nutrient
content compared with silt loam having higher nutrient contents. Thrust added to
silt loam was also related to decreases in plant uptake of Mo and Zn.
Trace element (Table 3.7 and Table 3.8) concentrations were only
significantly different between treatments for Na (P=0.0049) when plants were
grown in silt loam soil. Treatments had variably effects on trace element uptake
except for Ni where all treatments increased uptake when compared to the
49
control. In the silty clay loam, no significance was observed in the trace elements
and concentrations of all trace elements varied among treatments.
The surfactant, Activator-90, seemed to have a generally positive effect on
nutrient uptake as it increased the concentrations of micronutrients and
macronutrients in plant tissue in both the silt loam and silty clay loam. The
application of the Activator-90 at the double rate further increased macronutrient
concentration in the silt loam but not in the silty clay loam. This was not the case
for other surfactants used in the study. Agri-Dex alone and at the double rate
increased plant tissue concentration of macronutrients in the silt loam but
decreased them in the silty clay loam. Thrust decreased macronutrient
concentration in the silty clay loam but was variable for the micronutrients and
had variable effects on nutrient uptake the silt loam soil. Application of thrust at
the double rate increased nutrient uptake with silt loam, but decreased for silty
clay loam for both macronutrients and micronutrients. Overall, the effect on plant
nutrient concentration due to application of surfactants at the double rate was not
significantly different from that of the recommended rate.
Nutrient uptake (Tables 7.1 – 7.4) was variably affected by the different
application rates of surfactants, herbicides, and combination treatments.
However these effects were extremely small and not significantly different for
most elements. This may be due to the low concentrations of chemicals applied
under actual field rates that were also used in the study. The effects pose no
significant positive or negative effect to nutrient uptake or plant growth in the two
soils and one corn hybrid used in our study.
50
CONCLUSION
This study detected differences between soil types reflected in
accumulation of foliage fresh and dry weight of corn grown for 37 days. Plants
grown in the silt loam had higher fresh and dry weights than plants grown in the
silty clay loam. The carbon to nitrogen ratio of plant tissue was slightly higher
for the silt loam than the silty clay loam and also varied among the different
treatments within each soil. Nutrient uptake values for plants grown in both soils
did not differ greatly. Translocation of most of the nutrients was not significantly
affected by the different treatments applied partly due to the small amounts of
chemicals applied to soils in the study. However, we did observe that the silt
loam soil had a general increase in plant nutrient concentration while a general
decrease was observed for the silty clay loam soil. Surfactants applied at double
rates did not have significant effects relative to the recommended rates. No
consistent effect was observed for nutrient uptake in corn across the different
surfactants, herbicides, and combination treatments.
Soil textural class coupled with the chemical nature of the surfactants and
herbicides contributed to variations in nutrient uptake when compared to the
controls. When assessing effects of herbicides on plant nutrient uptake, one
should consider both active ingredient and formulation additives, including
surfactants, used during field application.
51
REFERENCES
Ang, C. C., and Abdul, S. A. (1991). Aqueous surfactant washing of residual oil
contamination from sandy soil. Ground Water Monitoring Review 11, 121-
127.
Bagyaraj, D. J., Krishnaraj, P. U., and Khanuja, S. P. S. (2000). Mineral phosphate solubilization: Agronomic implications, mechanism and molecular genetics. Proceedings of the Indian National Science Academy 66, 69-82.
Brownawell, B., Chen, H., Collier, J., and Westall, J. C. (1990). Adsorption of
organic cations to natural materials. Environmental Science and
Technology 24, 1234-1241.
Brumbaugh, E., and Peterson, M. The use if a non-ionic surfactant to alleviate
the effects of compacted soil on corn (Zea mays) yield and root growth.
Sixth International Symposium on Adjuvants for Agrochemicals – 2001
Amsterdam, Neterlands.
Buchholz, D.D., Brown, J.R., Crocker, D. K., Garret, J.D., Hanson, R.G., Lory, J.
A., Nathan, M. V., Scharf , P. C., and Wheaton, H.N. (1983). Soil test
interpretations and recommendations handbook. Revised 5/2004 ed.
University of Missouri, College of Agriculture, Department of Agronomy,
Columbia.
Buffle. J. (1988). Complexation Reactions in Aquatic Systems, Ellis Horwood
Ltd., Chichester, UK.
Cakmak, I., Yazici, A., Tutus, Y., and Ozturk, L. (2009). Glyphosate reduced
seed and leaf concentrations of calcium, manganese, magnesium, and
iron in non-glyphosate resistant soybean. European Journal of Agronomy
31, 114-119.
Cano, M., and Dorn, P. B. (1996). Sorption of two model alcohol ethoxylate
surfactants to sediments. Chemosphere 33, 981-994.
Ellis, T. W., Wilson, H. P., Mascianica, M. P., and Janssen, K, A. (1983).
Influence of Metolachlor on Sweet Corn (Zea mays saccharata) Growth
and Nutrient Accumulation. Weed Science 31, 342-347.
Farenhorst, A., McQueen, D. A. R., Saiyed, I., Hilderbrand, C., Li, S., Lobb, D. A.,
Messing, P., Schumacher, T. E., Papiernik, S. K., and Lindstrom, M. J.
52
(2009) Variations in soil properties and herbicide sorption coefficients with
depth in relation to PRZM (pesticide root zone model) calculations.
Geoderma 150, 267–277.
Fernández Cirelli, A., Ojeda, C., Castro, M. J. L. and Salgot, M. (2010).
Surfactants in Sludge-Amended Agricultural Soils: A Review. Organic
Farming, Pest Control and Remediation of Soil Pollutants Sustainable
Agriculture Reviews 1, 227-251.
Gamboa, C., and Olea, A. F. (2006). Association of cationic surfactants to humic
acid effect on the surface activity. Colloids and Surfaces A:
Physicochemical and Engineering Aspects 278, 241-245.
Graymore, M., Stagnitti, F., and Allinson, G. (2001). Impacts of atrazine in
aquatic ecosystems. Environment International 26, 483-495.
Haney, R., Senseman, S. A., Hons, F., and Zuberer, D. A. (2000). Effect of
glyphosate on soil microbial activity and biomass. Weed Science 48, 89-
93.
Haller, W. T and Stocker, R. K. (2003). Toxicity of 19 adjuvants to juvenile
Lepomis macrochirus (bluegill sunfish). Environmental Toxicology and
Chemistry 22, 615-619.
Harris, P. A., Schomberg, H. H., Banks, P. A., and Giddens, J. (1995). Burning,
tillage and herbicide effects on the soil microflora in a wheat-soybean
double-crop system. Soil Biology Biochemistry 27, 153-156.
Hua, R., Spliid, N. H., Heinrichson, K., and Laursen, B. (2009). Influence of
surfactants on the leaching of bentazone in a sandy loam soil. Pest
Management Science, 65, 857-861.
Ishiguro, M., Tan, W., and Koopal, L. K. (2007). Binding of cationic surfactants to
humic substances. Colloids and Surfaces A: Physicochemical and
Engineering Aspects 306, 29-39.
Jonassona, S., Castroa, J. and Michelsen, A. (2006). Interactions between
plants, litter and microbes in cycling of nitrogen and phosphorus in the
arctic. Soil Biology and Biochemistry 38, 526–532.
Koopal, L.K., Goloub T.P., and Davis. T.A. (2004). Binding of ionic surfactants to
purified humic acid. Journal of Colloid and Interface Science 275, 360-
367.
53
Kumar, A., Singhal, V., Joshi, B. D., and Rai, J. P. N. (2004). Lysimeteric
approach for ground water pollution control from pulp and paper mill
effluent using different soil textures. Indian Journal of Scientific and
Industrial Research 63, 429-438.
Laabs, V., Amelung, W., Pinto, A., and Zech, W. (2002). Fate of pesticides in
tropical soils of Brazil under field conditions. Journal of Environmental
Quality 31, 256-268.
Lapen, D. R., Topp, G. C., Gregorich, E. G., Hayhoe, H. N., and Curnoe, W.E.
(2001). Divisive field-scale associations between corn yields,
management, and soil information. Soil and Tillage Research 58, 193-206.
Mann, R. M., and Bidwell, J. R. (2001). The acute toxicity of agricultural
surfactants to the tadpoles of four Australian and two exotic frogs.
Environmental Pollution 114, 195-205.
Nielsen, R., Wise, K., and Gerber, C. (2008). Arrested ears resulting from pre-
tassel aplications of pesticide and spray additive combinations. West
Lafayette, IN: Purdue University.
Novozamsky, I., van Eck, R., Houba, V., and van der Lee, J. (1996). Solubilization of plant tissue with nitric acid-hydrofluoric acid-hydrogen peroxide in a closed-system microwave digestor. Communications in Soil Science and Plant Analyses 27, 867-875.
Papp, C., and Fisher, L. B. (1987). Application of microwave digestion to the analysis of peat. Analyst 112, 337-338.
Piccolo, A. and Mbagwu, J.S.C. (1989). Effects of humic substances and surfactants onthe stability of soil aggregates. Soil Science 147, 47-54.
Poulter, R.E., Duff, A.A. and Bauer, B. (2009). Quantifying surfactant interaction effects on soil moisture and turf quality. Project Report. TU08034. Horticulture Australia Limited.
Rae, J.E., Cooper, C.S., Parker, A., and Peters, A. (1998). Pesticide sorption
onto aquifer sediments. Journal of Geochemical Exploration 64, 263-276.
Ray, A. B., Ma, J., and Borst, M. (1995). Adsorption of surfactants on clays.
Hazardous Waste and Hazardous Materials 12, 357-364.
Reddy, K., and Singh, M. (1992). Organosilicone adjuvant effects on glyphosate
efficacy and rainfastness. Weed Technology 6, 361-365.
54
Renshaw, C. E., Zynda, G. D., and Fountain, J. C. (1997). Permeability
reductions induced by sorption of surfactants. Water Resources Research
33, 371-378.
Richardson, A. E. (1994). Soil microorganisms and phosphorus availability. C.E.
Pankhurst, B.M. Doulse, V.V.S.R. Gupta, P.R. Grace, Editors , Soil Biota
Management in Sustainable Farming System, CSIRO, Australia , 50–62.
Ridgeway, R. L. (1978). Pesticide use in agriculture. Environmental Health
Perspectives, 103-112.
Riechers, D. E., Wax, L. M., Liebl, R. A., and Bush, D. R. (1994). Surfactant-
increased glyphosate uptake into plasma membrane vesicles isolated
from common lambsquarters leaves. Plant Physiology 105, 1419-1425.
Riley, H. C. F., Bleken, M. A., Abrahamsen, S., Bergjord, A. K., and Bakken, A.
K. (2005). Effects of alternative tillage systems on soil quality and yield of
spring cereals on silty clay loam and sandy loam soils in the cool, wet
climate of central Norway. Soil and Tillage Research 80, 79-93.
Sadeghi, A. M., Isensee, A.R., and Shirmohammadi, A. (2000). Influence of soil
texture and tillage on herbicide transport. Chemosphere 41, 1327-32.
SAS Institute, 2003. SAS/STAT User Guide. Version 9.1. SAS Institute, Cary, NC.
Schmitz, G. L., Fassler, N. T., Fellows, G. M., Shirley, A. M., Chamblee, R. W., Finch, C. W., Storr, M. A., Vassalotti, P. M., Klingaman, T.D., Thomas, W.E., and Rathmann, D.P. (2011). Arrested ear development in corn caused by a component of certain surfactants. Agronomy Journal 103, 1697-1703.
Smith, A. E., and Hayden, B. J. (1982). Carry-over of dinitramine, triallate, and
trifluralin to the following spring in soils treated at different times during the
fall. Bulletin of Environmental Contamination and Toxicology 29, 483-486.
Terashima, M., Fukushima, M., and Tanaka, S. (2004). Influence of pH on the
surface activity of humic acid: micelle-like aggregate formation and
interfacial adsorption. Colloids and Surfaces a Physicochemical and
Engineering Aspects 247, 77–83.
Underwood, A. K. (2000). Adjuvant trends in the new millennium. Weed
Technology 14, 765–772.
55
Valoras, N., Letey, J., Martin, J., and Osborn, J. (1976). Degradation of a
nonionic surfactants in soils and peat. Riverside, CA: Department of Soil
Science and Agricultural Engineering, University of California.
Walworth, J., and Kopec, D. (2004). Aquatrols Surfactant Study on Turfgrass
Nutrient Uptake. University of Arizona College of Agriculture2004
Turfgrass and Ornamental Research Report.
Wilson, H. P., and Stewart, F. B. (1973). Relationship between Trifluralin and
Phosphorus on Transplanted Tomatoes. Weed Science 21, 150-153.
Ying, G. G. (2006). Fate, behavior and effects of surfactants and their
degradation products in the environment. Environment International 32,
417-431.
Ziegenfuss, P. S. (1987). The potential use of surfactant and cosolvent soil
washing as adjuvant for in-situ aquifer restoration. Houston, TX: MS
thesis, Rice University.
56
TABLES AND FIGURES
Table 3.1. Soil properties for silt loam and silty clay loam
Textural class pH
(CaCl2) OM %
Tot. org. C
% CEC
cmolc kg-1
Tot. N
mg kg-1
Bray 1 P
mg kg-1
Exc. K
mg kg-1
Exc. Ca
mg kg-1
Exc. Mg
mg kg-1
Silt loam 5.61 2.18 1.27 12.4 0.122 47.08 107 1214 233
Silty clay loam 4.52 1.89 1.10 22.2 0.096 1.34 57 1524 252
*Abbreviation: Exc., exchangeable; org., organic; tot., total.
56
57
Table 3.2. Chemicals used and treatment rates applied to pots in greenhouse experiment (L ha-1)
Treatment rates
Treatments Surfactant Surfactant x 2 Herbicide Surfactant + Herbicide
Activator-90 0.02 ml 0.04 ml
Glyphosate 0.0065 ml
Activator-90 + Glyphosate 0.02 ml + 0.0065 ml
Agridex 0.02 ml 0.04 ml
Atrazine 0.0167 ml
Agri-Dex + Atrazine 0.02 ml + 0.0167 ml
Thrust 0.01 g 0.02 g
Bentazon 0.0083 ml
Thrust + Bentazon 0.01 g + 0.0083 ml
Control 0 0 0 0
57
58
Act=Activator-90; Act x 2=Activator-90 doubled; Gly-4=glyphosate; Comb=Activator-90 plus glyphosate. Agri=Agri-Dex; Agri x 2=Agri-Dex doubled; Atraz=atrazine; Comb=Agri-Dex plus atrazine. Thrust; Thrust x 2=Thrust doubled; Bent=bentazon; Comb=Thrust plus atrazine. No significant differences (P=0.05) among treatments were detected based on Student Newman Kuels test.
Table 3.3. Plant macronutrient concentration (%) for corn (V8 growth stage) grown in silt loam
Treatment P K Ca Mg S
Control 0.19 1.90 0.48 0.39 0.16
Act 0.22 2.05 0.55 0.43 0.16
Act x 2 0.21 2.15 0.60 0.44 0.17
Gly-4 0.22 2.14 0.54 0.44 0.18
Comb 0.22 2.10 0.53 0.40 0.19
Control 0.19 1.90 0.48 0.39 0.16
Agri 0.22 2.23 0.54 0.42 0.16
Agri x 2 0.19 2.02 0.58 0.42 0.18
Atraz 0.20 2.19 0.55 0.40 0.16
Comb 0.22 1.88 0.54 0.39 0.19
Control 0.19 1.90 0.48 0.39 0.16
Thrust 0.22 1.77 0.51 0.45 0.16
Thrust x 2 0.22 1.90 0.55 0.45 0.16
Bent 0.22 1.96 0.55 0.38 0.18
Comb 0.21 1.76 0.50 0.35 0.16
58
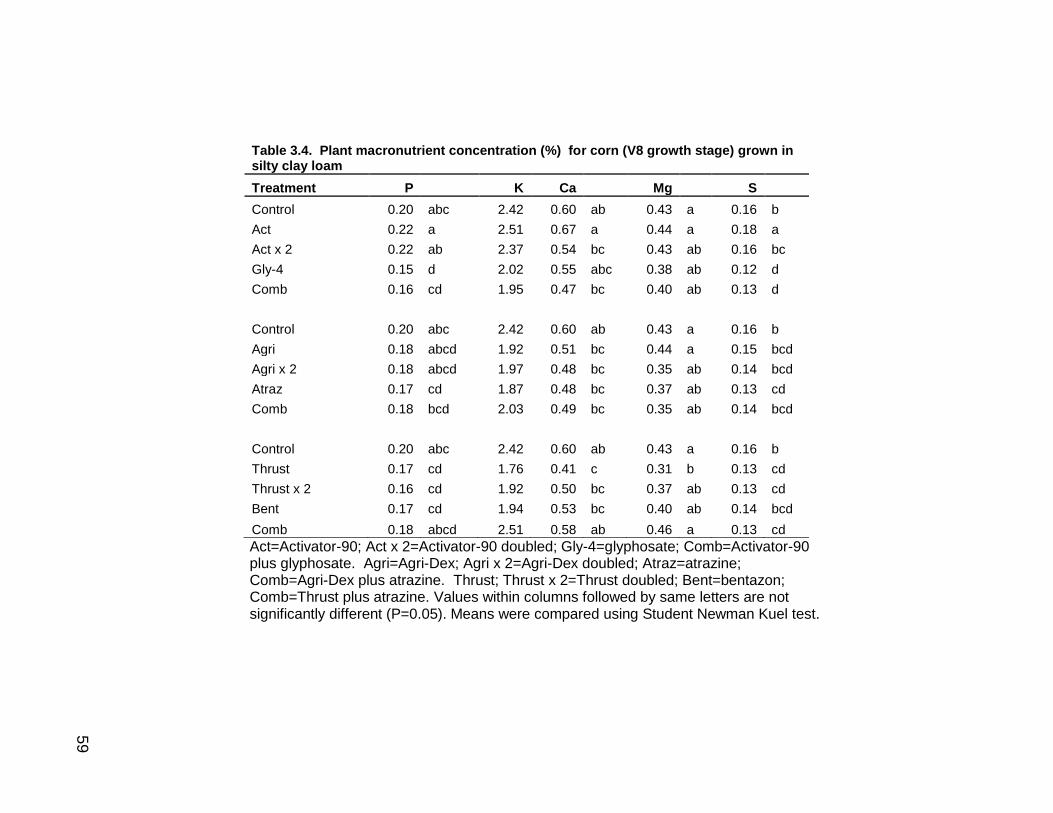
59
Table 3.4. Plant macronutrient concentration (%) for corn (V8 growth stage) grown in silty clay loam
Treatment P K Ca Mg S
Control 0.20 abc 2.42 0.60 ab 0.43 a 0.16 b
Act 0.22 a 2.51 0.67 a 0.44 a 0.18 a
Act x 2 0.22 ab 2.37 0.54 bc 0.43 ab 0.16 bc
Gly-4 0.15 d 2.02 0.55 abc 0.38 ab 0.12 d
Comb 0.16 cd 1.95 0.47 bc 0.40 ab 0.13 d
Control 0.20 abc 2.42 0.60 ab 0.43 a 0.16 b
Agri 0.18 abcd 1.92 0.51 bc 0.44 a 0.15 bcd
Agri x 2 0.18 abcd 1.97 0.48 bc 0.35 ab 0.14 bcd
Atraz 0.17 cd 1.87 0.48 bc 0.37 ab 0.13 cd
Comb 0.18 bcd 2.03 0.49 bc 0.35 ab 0.14 bcd
Control 0.20 abc 2.42 0.60 ab 0.43 a 0.16 b
Thrust 0.17 cd 1.76 0.41 c 0.31 b 0.13 cd
Thrust x 2 0.16 cd 1.92 0.50 bc 0.37 ab 0.13 cd
Bent 0.17 cd 1.94 0.53 bc 0.40 ab 0.14 bcd
Comb 0.18 abcd 2.51 0.58 ab 0.46 a 0.13 cd
Act=Activator-90; Act x 2=Activator-90 doubled; Gly-4=glyphosate; Comb=Activator-90 plus glyphosate. Agri=Agri-Dex; Agri x 2=Agri-Dex doubled; Atraz=atrazine; Comb=Agri-Dex plus atrazine. Thrust; Thrust x 2=Thrust doubled; Bent=bentazon; Comb=Thrust plus atrazine. Values within columns followed by same letters are not significantly different (P=0.05). Means were compared using Student Newman Kuel test.
59
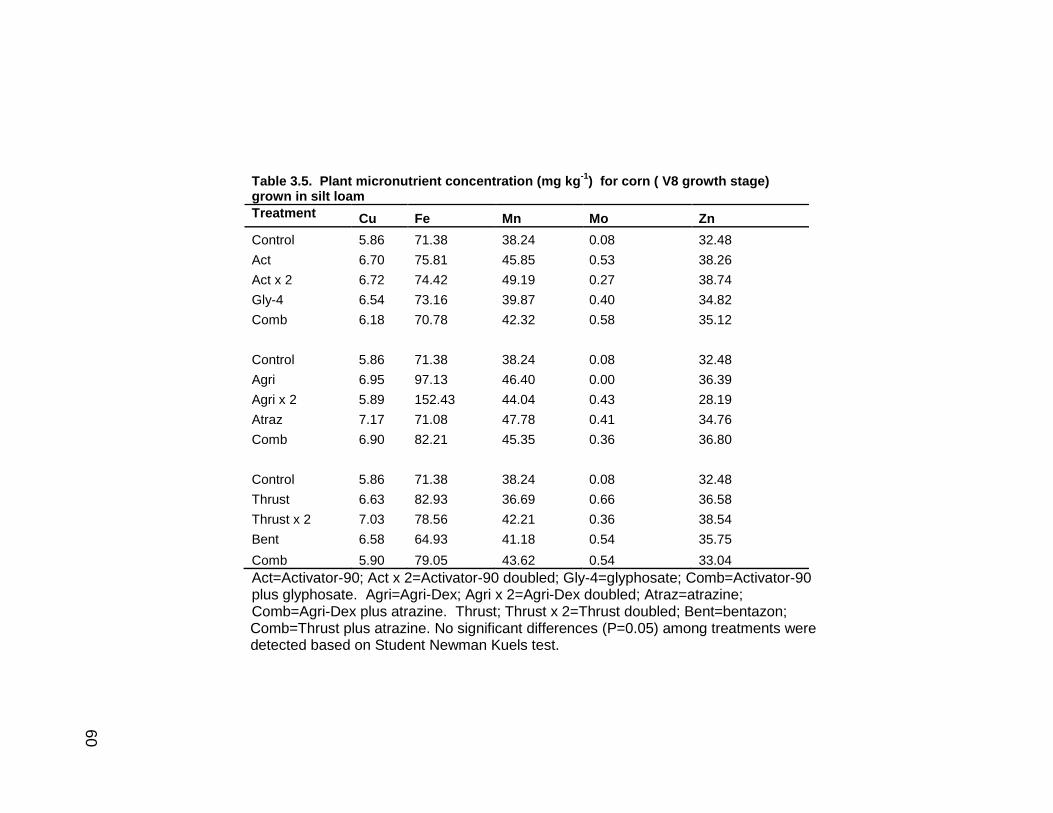
60
Table 3.5. Plant micronutrient concentration (mg kg-1
) for corn ( V8 growth stage) grown in silt loam
Treatment Cu Fe Mn Mo Zn
Control 5.86 71.38 38.24 0.08 32.48
Act 6.70 75.81 45.85 0.53 38.26
Act x 2 6.72 74.42 49.19 0.27 38.74
Gly-4 6.54 73.16 39.87 0.40 34.82
Comb 6.18 70.78 42.32 0.58 35.12
Control 5.86 71.38 38.24 0.08 32.48
Agri 6.95 97.13 46.40 0.00 36.39
Agri x 2 5.89 152.43 44.04 0.43 28.19
Atraz 7.17 71.08 47.78 0.41 34.76
Comb 6.90 82.21 45.35 0.36 36.80
Control 5.86 71.38 38.24 0.08 32.48
Thrust 6.63 82.93 36.69 0.66 36.58
Thrust x 2 7.03 78.56 42.21 0.36 38.54
Bent 6.58 64.93 41.18 0.54 35.75
Comb 5.90 79.05 43.62 0.54 33.04
Act=Activator-90; Act x 2=Activator-90 doubled; Gly-4=glyphosate; Comb=Activator-90 plus glyphosate. Agri=Agri-Dex; Agri x 2=Agri-Dex doubled; Atraz=atrazine; Comb=Agri-Dex plus atrazine. Thrust; Thrust x 2=Thrust doubled; Bent=bentazon;
Comb=Thrust plus atrazine. No significant differences (P=0.05) among treatments were detected based on Student Newman Kuels test.
60
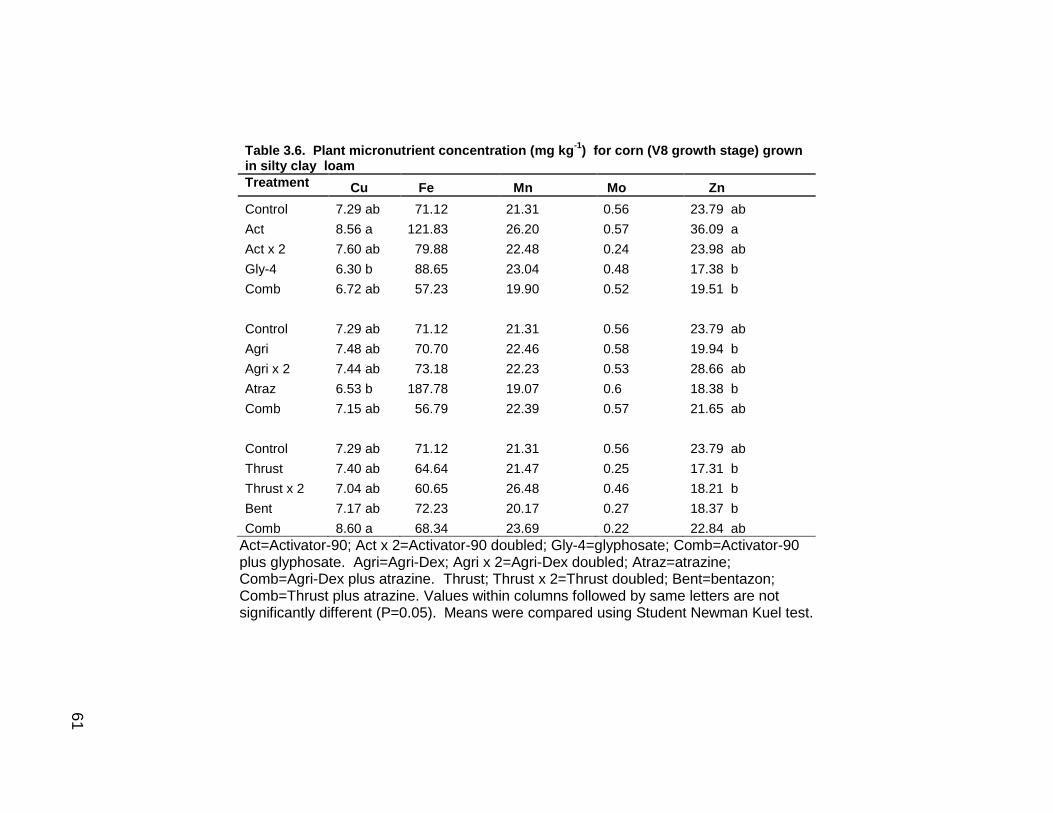
61
Table 3.6. Plant micronutrient concentration (mg kg-1
) for corn (V8 growth stage) grown in silty clay loam
Treatment Cu Fe Mn Mo Zn
Control 7.29 ab 71.12 21.31 0.56 23.79 ab
Act 8.56 a 121.83 26.20 0.57 36.09 a
Act x 2 7.60 ab 79.88 22.48 0.24 23.98 ab
Gly-4 6.30 b 88.65 23.04 0.48 17.38 b
Comb 6.72 ab 57.23 19.90 0.52 19.51 b
Control 7.29 ab 71.12 21.31 0.56 23.79 ab
Agri 7.48 ab 70.70 22.46 0.58 19.94 b
Agri x 2 7.44 ab 73.18 22.23 0.53 28.66 ab
Atraz 6.53 b 187.78 19.07 0.6 18.38 b
Comb 7.15 ab 56.79 22.39 0.57 21.65 ab
Control 7.29 ab 71.12 21.31 0.56 23.79 ab
Thrust 7.40 ab 64.64 21.47 0.25 17.31 b
Thrust x 2 7.04 ab 60.65 26.48 0.46 18.21 b
Bent 7.17 ab 72.23 20.17 0.27 18.37 b
Comb 8.60 a 68.34 23.69 0.22 22.84 ab
Act=Activator-90; Act x 2=Activator-90 doubled; Gly-4=glyphosate; Comb=Activator-90 plus glyphosate. Agri=Agri-Dex; Agri x 2=Agri-Dex doubled; Atraz=atrazine; Comb=Agri-Dex plus atrazine. Thrust; Thrust x 2=Thrust doubled; Bent=bentazon; Comb=Thrust plus atrazine. Values within columns followed by same letters are not significantly different (P=0.05). Means were compared using Student Newman Kuel test.
61
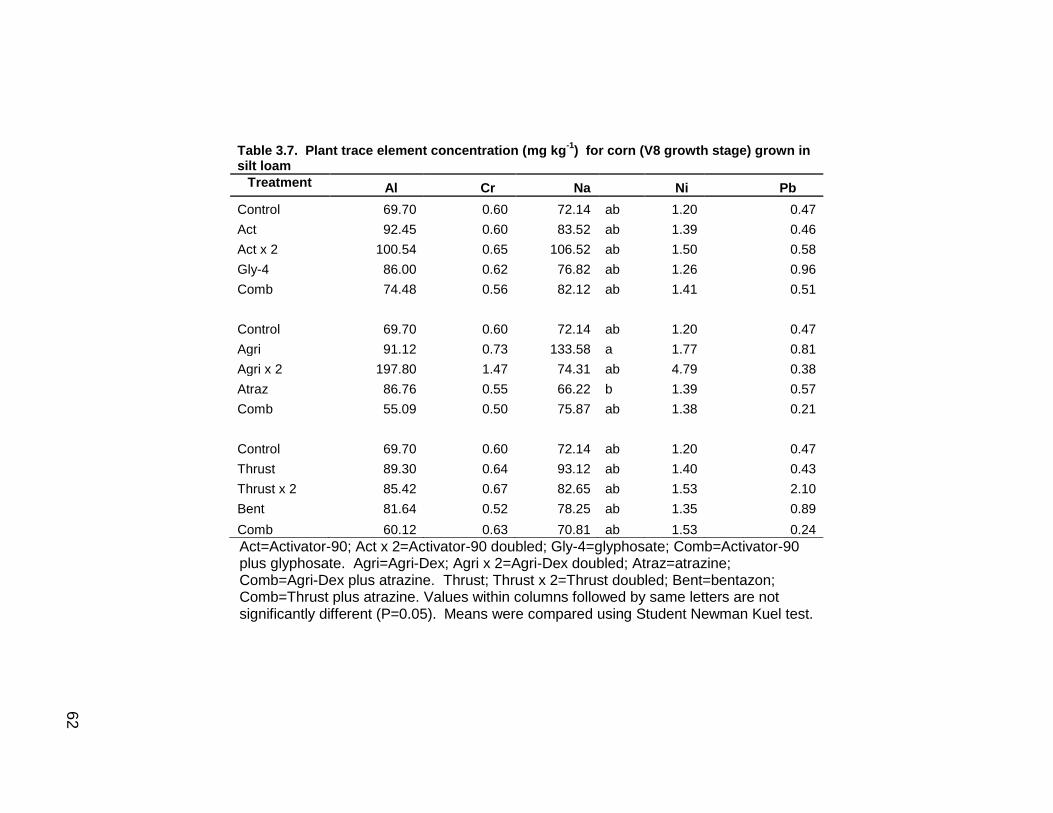
62
Table 3.7. Plant trace element concentration (mg kg-1
) for corn (V8 growth stage) grown in silt loam
Treatment Al Cr Na Ni Pb
Control 69.70 0.60 72.14 ab 1.20 0.47
Act 92.45 0.60 83.52 ab 1.39 0.46
Act x 2 100.54 0.65 106.52 ab 1.50 0.58
Gly-4 86.00 0.62 76.82 ab 1.26 0.96
Comb 74.48 0.56 82.12 ab 1.41 0.51
Control 69.70 0.60 72.14 ab 1.20 0.47
Agri 91.12 0.73 133.58 a 1.77 0.81
Agri x 2 197.80 1.47 74.31 ab 4.79 0.38
Atraz 86.76 0.55 66.22 b 1.39 0.57
Comb 55.09 0.50 75.87 ab 1.38 0.21
Control 69.70 0.60 72.14 ab 1.20 0.47
Thrust 89.30 0.64 93.12 ab 1.40 0.43
Thrust x 2 85.42 0.67 82.65 ab 1.53 2.10
Bent 81.64 0.52 78.25 ab 1.35 0.89
Comb 60.12 0.63 70.81 ab 1.53 0.24
Act=Activator-90; Act x 2=Activator-90 doubled; Gly-4=glyphosate; Comb=Activator-90 plus glyphosate. Agri=Agri-Dex; Agri x 2=Agri-Dex doubled; Atraz=atrazine; Comb=Agri-Dex plus atrazine. Thrust; Thrust x 2=Thrust doubled; Bent=bentazon; Comb=Thrust plus atrazine. Values within columns followed by same letters are not significantly different (P=0.05). Means were compared using Student Newman Kuel test.
62
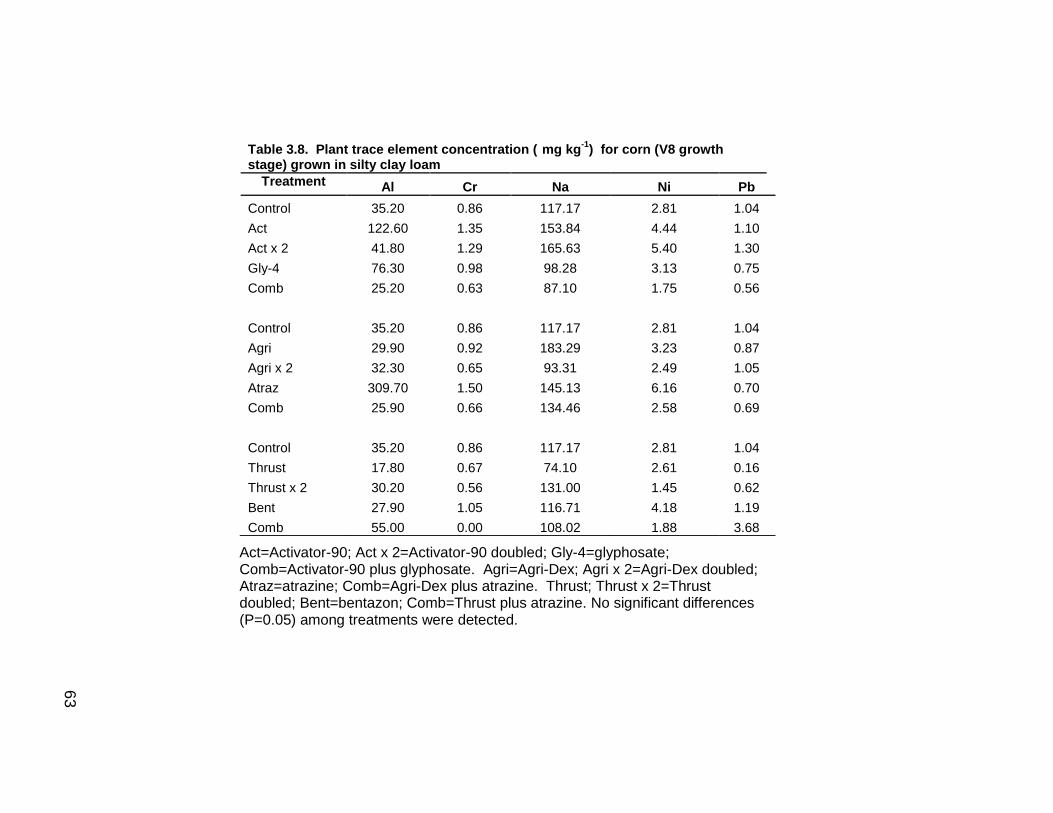
63
Act=Activator-90; Act x 2=Activator-90 doubled; Gly-4=glyphosate; Comb=Activator-90 plus glyphosate. Agri=Agri-Dex; Agri x 2=Agri-Dex doubled; Atraz=atrazine; Comb=Agri-Dex plus atrazine. Thrust; Thrust x 2=Thrust doubled; Bent=bentazon; Comb=Thrust plus atrazine. No significant differences
(P=0.05) among treatments were detected.
Table 3.8. Plant trace element concentration ( mg kg-1
) for corn (V8 growth stage) grown in silty clay loam
Treatment Al Cr Na Ni Pb
Control 35.20 0.86 117.17 2.81 1.04
Act 122.60 1.35 153.84 4.44 1.10
Act x 2 41.80 1.29 165.63 5.40 1.30
Gly-4 76.30 0.98 98.28 3.13 0.75
Comb 25.20 0.63 87.10 1.75 0.56
Control 35.20 0.86 117.17 2.81 1.04
Agri 29.90 0.92 183.29 3.23 0.87
Agri x 2 32.30 0.65 93.31 2.49 1.05
Atraz 309.70 1.50 145.13 6.16 0.70
Comb 25.90 0.66 134.46 2.58 0.69
Control 35.20 0.86 117.17 2.81 1.04
Thrust 17.80 0.67 74.10 2.61 0.16
Thrust x 2 30.20 0.56 131.00 1.45 0.62
Bent 27.90 1.05 116.71 4.18 1.19
Comb 55.00 0.00 108.02 1.88 3.68
63
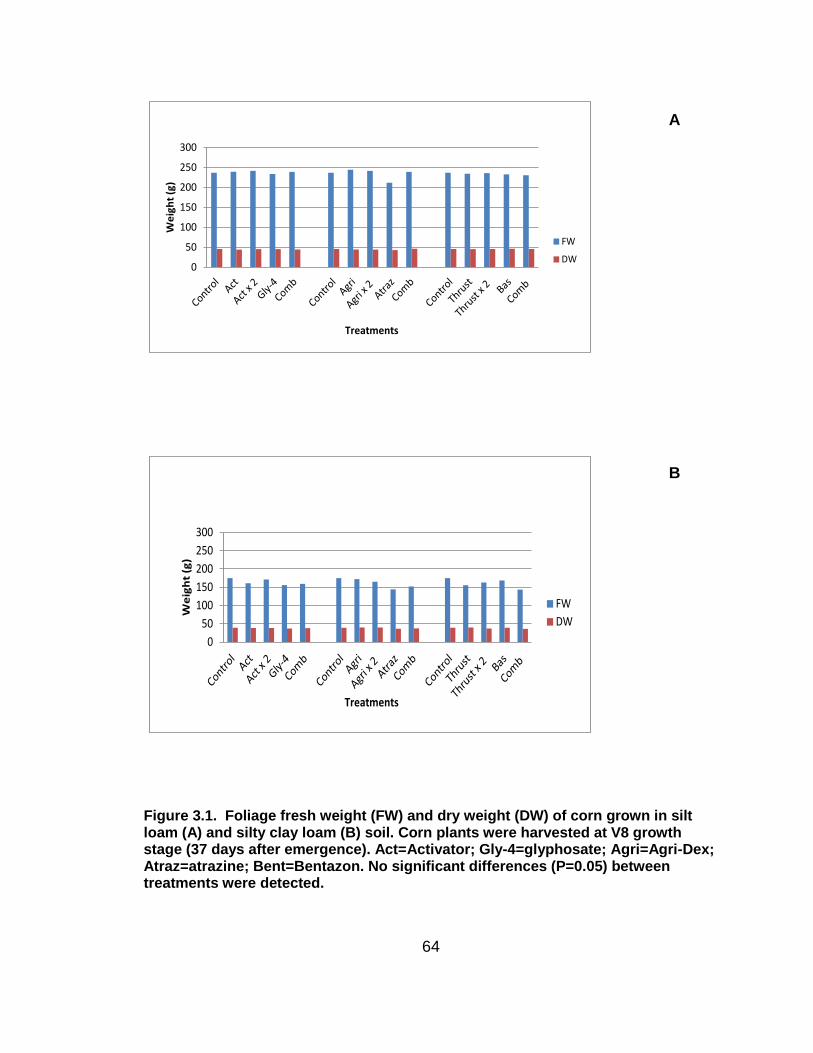
64
0
50
100
150
200
250
300
We
igh
t (g
)
Treatments
FW
DW
0
50
100
150
200
250
300
We
igh
t (g
)
Treatments
FW
DW
Figure 3.1. Foliage fresh weight (FW) and dry weight (DW) of corn grown in silt loam (A) and silty clay loam (B) soil. Corn plants were harvested at V8 growth stage (37 days after emergence). Act=Activator; Gly-4=glyphosate; Agri=Agri-Dex; Atraz=atrazine; Bent=Bentazon. No significant differences (P=0.05) between treatments were detected.
A
B
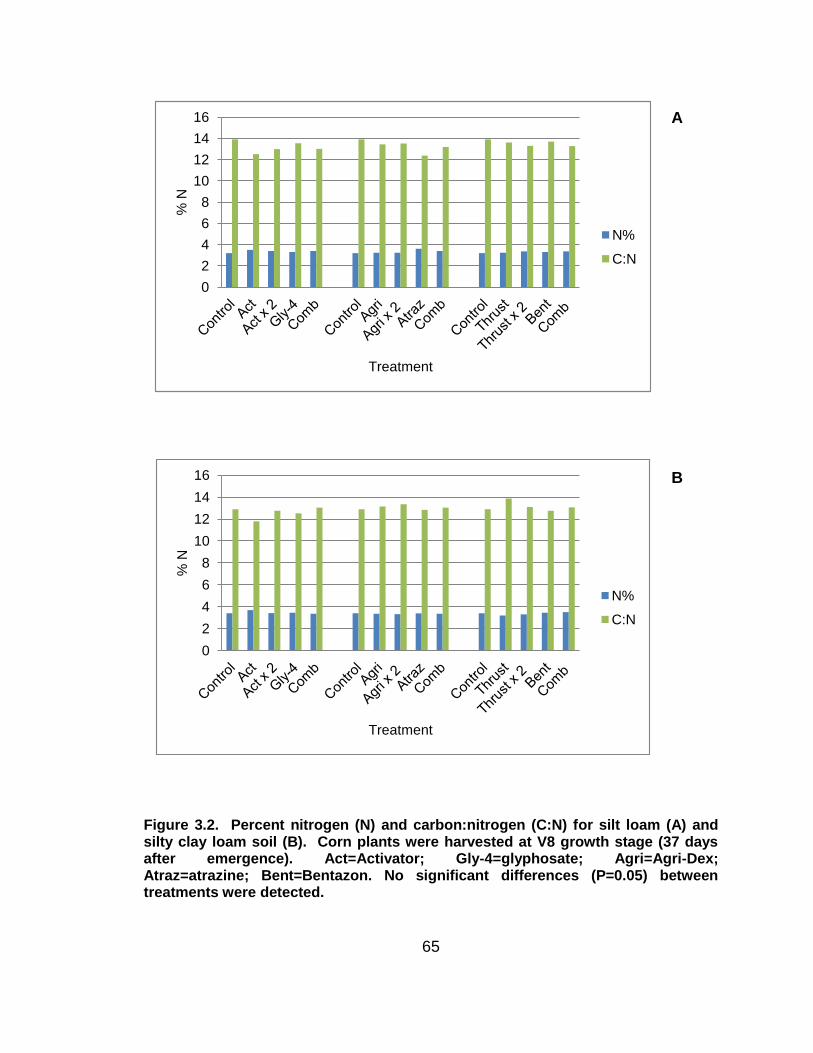
65
0
2
4
6
8
10
12
14
16
% N
Treatment
N%
C:N
0
2
4
6
8
10
12
14
16
% N
Treatment
N%
C:N
Figure 3.2. Percent nitrogen (N) and carbon:nitrogen (C:N) for silt loam (A) and silty clay loam soil (B). Corn plants were harvested at V8 growth stage (37 days after emergence). Act=Activator; Gly-4=glyphosate; Agri=Agri-Dex; Atraz=atrazine; Bent=Bentazon. No significant differences (P=0.05) between treatments were detected.
A
B
66
CHAPTER 4
EFFECTS OF SELECTED SURFACTANTS, HERBICIDES,
AND SOIL TEXTURE ON DENATURING GRADIENT GEL
ELECTROPHORESIS PROFILES (DGGE) OF THE SOIL
MICROBIAL COMMUNITY
INTRODUCTION
Soil microorganisms play an important role in soil chemical, physical and
biological processes. Soil biological parameters are often used as indicators to
assess soil productivity and quality as affected by various management practices
(Reeleeder et al., 2006). Soil microorganisms are critical components of the
ecosystem and contribute to a wide array of ecosystem functions (Hackle et al.,
2004; Wolters and Schaefer, 1996). Microorganisms have the natural capability
to degrade chemicals (Atlas, 1986). Biodegradation of chemicals, such as
surfactants and herbicides, by microorganisms is critical in reducing the
efficiency and negative impacts of these chemicals on the environment.
Degradation can be heavily influenced by environmental conditions and the
chemical nature of the substances entering soil (Ying, 2006). However, the
application of certain chemicals may result in alteration of metabolic efficiency
67
due to the sensitivity of soil microorganisms to environmental changes (Tardioli
et al., 1997 and Mechri et al., 2008). Surfactants and herbicides are widely used
in conventional cropping systems and these chemicals, due to their unique
structures and properties, can react differently when contacting the soil system
(Smith, 1982; Ray et al.; 1995).
Additions of chemicals, such as surfactants, may alter microbial activity by
impacting sorption sites in the soil, increasing solubility of pesticides, increasing
toxicity or serving as carbon or nutrient sources for some components of the
microbial community. Surfactants are used in different industries, with widest use
in detergents and agricultural pesticides. The main function of surfactants is
modification of effects or surface tension of other chemicals with which they are
combined. In agriculture, surfactants are used as formulation additives to
different pesticides due to the capability to modify spreading characteristics
(Schramm, 2001; Grogh et al., 2003). This serves as one entry point for
surfactants appearing in the soil system. Once in the soil system, the chemical
nature of the surfactants may change due to the chemistry of the soil and vice
versa. There are different surfactants used in the industry and as a result
different chemical, biological and physical process in the soil may be affected or
altered as a result of the different surfactants used. Although soil
microorganisms have the capability to naturally degrade some of the chemicals,
due to the complex structures of some chemicals they may tend to linger in the
soil system compared to naturally-occurring organic substances and possibly
impose adverse effects on certain microbial groups (Zhang et al., 2010).
68
Degradation of certain surfactant compounds, such as the alkylphenol ethoxylate
group, is mediated by microorganisms in soils and sediments after a period of
metabolic acclimation (Ying, 2006).
In crop production, surfactant usage is often associated with use of
herbicides. The surfactant and herbicides are combined together based on
chemical factors that promote surface contact with plant surfaces and increase
foliar uptake of post-emergence herbicides (Liu, 2004). Neither post-emergence
herbicides nor surfactants are routinely applied directly to soils, but a substantial
amount may contact soil during application or rainfall events (Haney, et al.,
2000). Some herbicides such as glyphosate are easily adsorbed to clay and can
be biodegraded in water and soil (Ahrens, 1994; Pessagno et al., 2008, Barja
and dos Santos Afonso, 2005). Several factors, such as nutrient composition
and content, pH, temperature and moisture levels, affect the availability of
herbicides to soil microorganisms involved in degradation (Weber et al. 1993).
Pesticides may reduce enzyme activity and populations of various organisms in
the soil (Toyota et al., 1999; Sannino and Gianfreda, 2001). In a study done by
Ratcliff et al. (2006), bacterial and fungal composition was altered due to the
application of different herbicides.
Molecular biological techniques have made analyses of microorganisms
less labor intensive while providing a more accurate or thorough description of
microbial diversity in the environment. Cultural approaches once used to
determine bacterial diversity examined phenotypic characteristics through a
69
process of isolation, culture, and identification (Atlas, 1984). In this approach,
only a small portion of the total microbial population possessing incomplete
genetic information was uncovered, thereby underestimating the actual quantity
of microorganisms present (Gafan et al., 2005). A more advanced method now
frequently used to reveal more detailed molecular/genetic information is
polymerase chain reaction (PCR) combined with denaturing gradient gel
electrophoresis (DGGE) or PCR-DGGE. The method was introduced to the field
of microbial ecology in the early 1990‟s (Muyzer et al., 2003) and has been useful
in a wide range of natural habitats (Vallaeys et al., 1997; Jensen et al., 1998;
Siqueira et al., 2005; Sadet et al., 2007). Denaturing gradient gel electrophoresis
(DGGE) is a fingerprinting technique used to observe uncultured bacteria by
quantifying the amount of distinctive DNA present. It separates different DNA
sequences in a mixture when passed through a chemical denaturant after the
amplification of the conserved gene sequence in bacteria, 16S rDNA, by PCR.
DNA sequences differ in base formation/composition giving them various thermal
properties due to the bonding between complementary or neighboring base
pairs. A staining process is used to visualize the different bands produced during
electrophoretic separation. Soil microbial populations have been successfully
characterized using this technique (McGaig et al., 2001).
Microorganisms contribute to overall ecosystem functioning through
mediation of various metabolic processes, and therefore it is important that we
understand the microbial response to the introduction of various synthetic
chemicals in the environment. Our understanding of the effects of surfactants on
70
diversity of microbial communities is very limited, therefore this is an area that is
worth investigating. The purpose of the study is to understand the association of
surfactants, herbicides and soil texture on the quantity and diversity of soil
microbial community using PCR-DGGE. We hypothesize that the treatments
with different chemicals used will cause differences in microbial composition and
activity.
71
MATERIALS AND METHODS
Soils and chemicals used in study
Bulk soil samples used in this study were a silt loam soil (20 % clay) from
the Lincoln University Carver Farm (38° 31‟ 36.1” N, 92° 8‟ 22.9” W) and a silty
clay loam soil(37.5 % clay) from the University of Missouri Bradford Farm (38°
53‟ 48” N, 92° 12‟ 23.5” W). Soils are classified as Wrengart silt loam (fine-silty,
mixed, active, mesic Fragic Oxyaquic Hapludalfs) and Mexico silt loam (fine,
smectitic, mesic Vertic Epiaqualfs), respectively. No known herbicide plus
surfactant applications had been made to the two sites prior to soil sampling.
Bulk soils were air dried, sieved to pass a 2 mm screen, and analyzed for
chemical and physical characteristics based on standard soil test procedures of
the University of Missouri Soil and Plant Testing Laboratory (Buchholz et al.,
1983) (Table 4.1). Surfactants used in this study were alkylphenol ethoxylate
plus alcohol ethoxylate (Activator 90; non-ionic; Loveland Industries, Inc.,
Greeley CO), polyethoxylate (Agri-Dex; non-ionic; Helena Chemical Company,
Collierville TN) and a blend of ammonium sulfate, drift reduction/deposition
polymers and anti-foam agent (Thrust; anti-foam agent; Loveland Industries, Inc.,
Greeley CO). The herbicides used were glyphosate (Gly-4 Plus; Universal Crop
Protection Alliance LLC, Eagan MN), atrazine (AAtrex; Universal Crop Protection
Alliance LLC, Eagan MN) and bentazon (Basagran; Micro Flow Company LLC,
Memphis TN). Surfactants and herbicides were applied alone, and in
combination to both soils: non-treated soils served as controls (Table 4.2).
72
Application followed label rates provided for the surfactants and herbicides, and
calculated to per pot of 4000 g soil. Treatment mixtures of deionized water and
chemical(s) were applied directly to soils dispensed into the pots.
Two-gallon pots (20.3 cm dia. by 20.3 cm in height) were filled with 4000 g
of air-dried soil, fertilized and limed in accordance with soil recommendations
based from soil test results. Field capacity was calculated for each soil and soils
in pots were brought to field capacity then watered daily to maintain field capacity
levels. Field corn (Zea mays L. type „Indenta‟) was used as the experimental
crop. Six seeds of field corn were planted in each pot and later thinned to two
plants per pot. Treatments were replicated three times and arranged in a
randomized complete block design on greenhouse benches. Temperature in the
greenhouse varied from 18 to 27 °C throughout the day with supplemental light to
increase day light period.. After seven weeks of growth (from seeding) the corn
foliage was harvested by cutting shoots at the soil surface, followed by careful
removal of roots from the soil. At this point very small roots were present
throughout the soil. Soil samples were collected from the root area by shaking
roots into a bag. Field moist soil was stored in soil sample plastic bags at 4 °C
and processed for analyses.
Microbial Analyses
Soils were air dried and passed through a 2-mm mesh sieve (number 10).
Total organic carbon and total nitrogen was determined with combustion using a
LECO TrueSpec carbon/nitrogen analyzer (LECO Corporation, St. Joseph, MI,
73
USA). Soil DNA was extracted from samples (0.25 g) using the Power Soil
DNA® Isolation Kit (MO BIO Laboratories, Inc). Briefly, soil was added to a
micro-bead suspension and vortexed for 10 min followed by centrifugation at
10,000 X g for 30 s; the supernatant was re-centrifuged after protein precipitation
and then purified by passing through a spin column by centrifuging at 10,000 X g
for 30 s. Soil DNA concentration (ng µl-1) was determined using Gene Quant Pro
UV spectrophotometer at 260 nm. An end volume of 50 µl was then stored for
PCR reaction at -60°C.
Bacterial primers used to amplify extracted soil 16s rDNA fragments were
F984GC-R1378 (Heuer et al., 1997). A PCR mixture of 50 µl consisting of each
primer, DNA template and REDTaq ReadyMix was used for the PCR reaction.
An Eppendorf Mastercycler Thermal Cycler (Perkin-Elmer) was used to carry out
the PCR reaction. The reaction program used was 94°C for 4 min, followed by
35 cycles of 94°C for 1 min, 55°C for 1 min, 72°C for 2 min and a final extension
at 72°C for 10 min and then held at 4°C. PCR products of the same length but
different internal sequences were obtained, which were then ready to be
separated using DGGE. A 1% agarose solution in 1x TBE (Tris-borate, boric
acid, and Na2-EDTA) buffer with ethidium bromide was used to create a gel in an
UVT tray. The gel was loaded into the electrophoresis tank and PCR standards
and products carefully added to the gel. TBE buffer was added to the tank to
cover the gel to a depth of 1mm. The tank was closed and connected to the
power supply to allow DNA to move towards the red lead (positive anode) for 2
hours at 120 V.
74
A BioRad system with 8% (wt/vol) polyacrylamide gel with linear
denaturing gradient urea formamide ranging from 37 – 57% was used to do the
DGGE. The gel was placed in an Upper Buffer Chamber and preheated to 60°C
before loading samples. DNA samples with 35 µl of the PCR products were
carefully loaded into wells of the gel. Four known bacterial markers were used
(Bacillus cereus, Bacillus pumilus, Flavobacterium balustinum and Pseudomonas
fluorescens) and added to each side of the gel. The gel was run in 1x TAE buffer
at 60°C at 130 V for 6.5 hours using BioRad Power Pac 300; removed and
stained with SYBR green I (1:10,000 dilution) in TAE (Tris acetate, sodium
acetate, and Na2-EDTA) buffer before visualization in a GeneGenius Gel
Document System under UV light. Genetool Software (Syngene) was used to
digitize the band positions and intensity for each soil treatment and estimate
diversity of microorganisms.
Statistical analyses were used to interpret the results for DNA, carbon,
nitrogen, peak height and raw volume between the silt loam and silty clay loam
soils. Analysis of variance (ANOVA) was calculated with the PROC GLM (SAS
Institute, 2003) to examine the possible effects of different treatments on DNA,
carbon, nitrogen, peak height and raw volume. ANOVA was used to determine
significant effects and, where F-values were significant (P=0.05), mean
separations were conducted using the Student Newman Kuels Test.
75
RESULTS AND DISCUSSION
There were differences in chemical and physical characteristics of the two
soils used in this study which affects the biological properties and microbial
community composition. The silt loam soil had a higher pH (0.01 M CaCl2) of
5.61 compared to the silty clay loam soil pH of 4.52 (Table 5.1a), both not
suitable for corn production. Also, the silt loam soil was higher in total organic C,
N, P, and K compared to the silty clay loam. Cation exchange capacity values of
the silty clay loam were double the CEC of the silt loam soil and Mg in the silty
clay loam was higher than the silt loam.
DNA was extracted from soil and concentrations were quantified with a
Gene Quant Pro UV spectrophotometer. Extracted soil DNA contents differed
between the silt loam and silty clay loam soils with P-values of 0.0001 and
0.0487, respectively (Figure 4.1 and Table 4.3). Previous studies have shown
that DNA extracted directly from soil may correlate with soil microbial biomass
(Marstorp et al., 2000), therefore, the soil DNA contents detected in our study
may reflect differences in microbial biomass between the silt loam and silty clay
loam (Table 4.4). This is supported by differences found in microbial biomass for
both soils determined by PLFA analysis (Chapter 5), data of which are presented
for comparison in Table 4.4. Soil DNA measurements are apparently useful in
differentiating effects of management practices on soil quality and productivity
(Reeleeder et al., 2006; Udawatta et al., 2008). Introduction of herbicide
formulations into soil as part of weed management practices may have similar
76
effects on microbial biomass measured as extracted DNA. Activator-90 applied at
both rates, glyphosate alone, Activator-90 plus glyphosate, atrazine, Agri-Dex
plus atrazine, and bentazon and bentazon plus Thrust resulted in significantly
lower soil DNA contents than the control. Soil DNA in Agri-Dex alone treated
soils was significantly higher than the control; Agri-Dex at 2X rate and both rates
of Thrust also increased soil DNA, although not significantly. In the silty clay
loam, mean separation showed no significant differences; atrazine treatment was
associated with the highest concentration of soil DNA.
Increased soil DNA resulting from atrazine treatment is in agreement with
a prior study where atrazine-degrading bacteria populations increased resulting
in rapid degradation of atrazine (Martin-Laurent et al., 2003; Zablotowicz et al.,
2006). Rapid degradation of atrazine may reduce weed control while minimizing
movement of the chemical in the environment. Herbicide-alone treatments of
glyphosate, atrazine and bentazon in the silt loam decreased DNA concentration
when compared to the non-treated control. In the silty clay loam, glyphosate
decreased DNA concentration. Herbicides may possibly adsorb to soil mineral
and organic components. This process of sorption has been reported to limit
microbial degradation due to decreased accessibility to microorganisms (Selim et
al., 1999; Koskinen et al., 2001). Herbicides can affect soil DNA, as observed in
other studies with gylphosate (Barriuso et al., 2010; Kremer and Means, 2009).
These studies showed that glyphosate affected microbial communities and
microbial processes associated with corn growth. All three surfactants applied at
label and 2x rates in both soils showed similar effects on soil DNA concentration.
77
This suggests that addition of surfactants may affect soil biological community
structure (Zhu et al., 2010). Overall, results imply that treatments differentially
affected the microbial community, particularly with the silt loam.
Carbon (C) and nitrogen (N) were analyzed for both soils for all treatments
(Figure 4.2 and Table 4.3). Carbon showed no significance in the silt loam or
silty clay loam soils. Nitrogen showed significance in both silt loam and silty clay
loam with P = 0.0005 and P = 0.0009, respectively. In the silt loam soil, the
treatments of herbicides alone and combinations of herbicide and surfactant
decreased N content when compared to the control. This indicated that these
treatments affected the mineralization of N in the silt loam soil. Higher N contents
were seen in some silty clay loam treatments receiving the same treatments.
This could have been due to soil physical and chemical properties. Nitrogen
mineralization is known to vary with soil type, physical and chemical soil
properties and different environmental parameters (Kiese et al., 2002; Singh and
Kashyap, 2007; Owen et al., 2010). Atrazine-degrading soil bacteria reportedly
mineralize N from atrazine (Zablotowicz et al., 2006), however, the amount of N
released from atrazine applied at label rate may not significantly contribute to
overall soil N and the mineralized N may be readily scavenged by the soil
bacterial community. Several studies report decreases in soil N content or in
processes that contribute to N concentration in leguminous plants (Kremer and
Means, 2009; Drew et al., 2007; Anderson et al., 2004).
78
The DGGE profiles prepared for both soils show representative lanes or
tracks resolved in the gels for each treatment (Figures 4.3 and 4.4). Each track
showed the separation of the amplified sequences of the DNA primer that differ
according to individual bacterial sequence resulting in different bands
representing the diverse bacterial components in the soil sample. Each band
represents a different microbial species based on band position. Some bands
are more prominent than others and are proportional with DNA intensity
calculated as raw volume for each band (Figures 4.5 and 4.6). In Figures 4.5 and
4.6, representing quantified band patterns resulting from DGGE of extracted DNA
from Thrust plus bentazon treated silt loam and silty clay loam, respectively, the
numbers on the x axis are migration distances for each band; the y axis
represents peak height for each band, determined on the basis of band density
using the densitometer program in the Genetool software. The area under each
peak is then determined and, with peak height, is used to calculate raw volume
as a quantitative expression for each band. At times it is hard to interpret visually
the differences between bands, and plots are a good way to quantify these
differences. Visual differences of the DGGE profiles indicated likely differences
in the bacterial communities between soils and between treated and non-treated
soils. In each figure, there is a visual difference between the control track (group
1) and the treated tracks (group 2, 3, and 4). Icoz et al. (2008), in his study with
different varieties of corn with DGGE analyses, reported that there were no
differences between varieties for microbial diversities but reported seasonal
differences. Ying (2006) suggested that upon exposure to surfactants of the
79
alkylphenol ethoxylate class (Activator 90), environmental microbial communities
undergo a period of acclimation before the onset of degradation. This suggests a
possible shift in microbial community composition to include a component
capable of degrading the surfactant compound, which may appear as an
additional DNA band on the DGGE pattern thereby altering community structure
for groups 2, 3, and 4.
Within the different groups, there are differences within each track with the
peak height and raw volume of the prominent bands. Cumulative peak height and
raw volume of bands for each track were analyzed. Both silt loam and silty clay
loam soil showed significant differences among the treatments applied to each
soil (Table 4.5). In the silt loam, the control DNA band measurements were
significantly less than for herbicide and surfactant treatments (P = 0.0001).
There were no significant differences between treatments but variations due to
treatments were apparent. In the silty clay loam, significant treatment effects
were detected for band height and raw volume (P = 0.0001). Agri-Dex and
Thrust at both rates significantly affected height and raw volume. Atrazine alone
and atrazine plus Agri-Dex showed significance in height. Microbial response to
combinations of atrazine plus Agri-Dex also significantly differed relative to raw
volume measurements. Examination of the bands or data showed variations
between the chemicals and different rates applied compared to control.
Comparing the herbicide alone treatments to the formulated treatments, there
was an increase with formulated treatments for peak height and raw volume.
This suggests that formulated herbicides may stimulate bacterial growth. Ros et
80
al. (2006) reported that formulated atrazine applications at different rates
increased bacteria numbers and resulted in different banding patterns.
Furthermore, Zablotowicz et al. (2006) suggested that atrazine-degrading
bacteria in soil increased >1000 times on exposure to atrazine at field rates,
which could likely affect microbial community composition detectable by soil DNA
analysis. Also, glyphosate released in rhizospheres of corn and soybean (Glycine
max (Merr.) L.) enhanced populations of selected Pseudomonas and
Agrobacterium species (Kremer and Means, 2009), which might also influence
soil DNA profiles.
Examination of the data comparatively for both soils, differences between
both soils for raw volume are readily apparent. The silt loam exceeded silty clay
loam in DNA band contents expressed as raw volume regardless of treatment
(Table 4.5). This indicates that soil texture is a main factor affecting diversity of
the soil bacterial community, as demonstrated in previous studies (Fang et al.,
2005; Girvan et al., 2003; Marschner et al., 2001).
81
CONCLUSION
Soil DNA contents significantly differed due to the various treatments
added in the silt loam. In the silty clay loam soil, atrazine treatment was
associated with the highest DNA concentration. This suggests that the atrazine
degrading bacteria population was increased due to atrazine mineralization
resulting in an overall higher soil DNA concentration. In both soils, herbicide-
alone treatments other than atrazine and bentazon in silty clay loam decreased
DNA concentrations. The addition of all three surfactants caused positive,
negative and neutral effects on soil DNA. Varied results were also seen for C
and N in silt loam and silty clay loam when compared to the control. Decreased
total N suggesting reduced mineralization was observed with glyphosate,
atrazine and bentazon treatments in the silt loam compared to control. The
opposite was observed in the silty clay loam suggesting that soil properties
affected N mineralization.
Visual differences were seen in the DGGE profiles between the silt loam
and silty clay loam soil. Differences with the different treatments were observed
based on the intensity of the different DNA bands. Non-treated control differed in
DNA patterns from treatments, expressed as height and raw volume of DNA
extracted from silt loam. In the silty clay loam, there were significances with the
control and treatments. Also in the silt loam, formulated treatments seemed to
stimulate bacterial growth compared to herbicide alone treatments. Difference
between both soils for DNA expressed as raw volume reflected the contribution
82
of soil type to diversity of microbial community. Differences among treatments
were mostly nonsignificant, however, trends for differential effects were noted.
The lack of definitive treatment effects may be due to the application to soil of
small quantities of chemicals, which represented actual field rates. The
application of PCR-DGGE techniques was useful to examine differences
between both soils and the different treatments applied. Based on this study in a
controlled greenhouse environment, these results should be considered in further
more rigorous field studies.
83
REFERENCES
Ahrens, W.A. (1994). Herbicide handbook. Seventh Edition. Champaign, IL: Weed Science Society of America, 352.
Anderson, A., Baldoc,k J. A., Rogers, S. L., Bellotti, W., and Gill, G. (2004) Influence of chlorsulfuron on rhizobial growth, nodule formation, and nitrogen fixation with chickpea. Australian Journal of Agricultural Research 55, 1059–1070.
Atlas, R. M. (1984). Diversity of microbial communities. Advances in Microbial Ecology 7, 1-47 (7 p.).
Atlas, R. (1986). Microbial diversity. Advances in Microbial Ecology 5, 1–25.
Barja, B.C., and dos Santos Afonso, M. (2005). Aminomethylphosphonic acid and glyphosate adsorption onto goethite: A comparative study. Environmental Science and Technology 39, 585-592.
Barriuso, J., Marín, S., and Mellado R. P. (2010). Effect of the herbicide glyphosate on glyphosate-tolerant maize rhizobacterial communities: a comparison with pre-emergency applied herbicide consisting of a combination of acetochlor and terbuthylazine. Environmental Microbiology 12, 1021-1030.
Drew, E. A., Gupta, V. V. S. R., and Roget, D. K. (200). Herbicide use, productivity, and nitrogen fixation in field pea (Pisum sativum). Australian Journal of Agricultural Research 58, 1204–1214.
Fang, M., Kremer, R. J., Motavalli, P. P., and Davis, G. (2005). Bacterial diversity in rhizospheres of nontransgenic and transgenic Corn. Applied and
Environmental Microbiology 71, 4132-4136.
Gafan, Gavin P., Lucas, Victoria S., Roberts, Graham J., Petrie, Aviva, Wilson, M., and Spratt, David A. (2005). Statistical Analyses of Complex Denaturing Gradient Gel Electrophoresis Profiles. Journal of Clinical Microbiology 43, 3971-3978.
Girvan, M. S., Bullimore, J., Pretty, J. N., Osborn, A. M., and Ball. A. S. (2003). Soil type is the primary determinant of the composition of the total and active bacterial communities in arable soils. Applied and Environmental Microbiology 69, 1800–1809.
Krogh, K. A., Halling-Sorensen, B., Mogensen, B. B., and Vejrup, K. V. (2003). Environmental properties and effects of nonionic surfactant adjuvants in pesticides: a review. Chemosphere 50, 871–901.
84
Hackl, Elene V., Galkin, Vladimir L., and Blagoi, Yurij P. (2004). DNA interaction with biologically active divalent metal ions: binding constants calculation. International Journal of Biological Macromolecules 34, 245–250.
Haney, R. L., Senseman, S. A., Hons, E. M., and Zuberer, D. A. (2000). Effect of glyphosate on soil microbial activity and biomass. Weed Science 48, 89–93.
Heuer, H., Krsek, M., Baker, P., Smalla, K., and Wellington, E. M. (1997). Analysis of actinomycete communities by specific amplification of genes encoding 16S rRNA and gel-electrophoretic separation in denaturing gradients. Applied and Environmental Microbiology 63, 3233–3241.
Icoz, I., Saxena, D., Andow, D. A., Zwahlen, C., and Stotzky, G. (2008). Microbial Populations and Enzyme Activities in Soil In Situ under Transgenic Corn Expressing Cry Proteins from Bacillus thuringiensis. Journal of Environmental Quality 37, 647–662.
Jensen, S., L. Øvreas, F. L. Daae, and V. Torsvik. (1998). Diversity in methane enrichments from an agricultural soil revealed by DGGE separation of PCR amplified 16S rDNA fragments. FEMS Microbiology Ecology 26, 17–26.
Kiese, R., Papen, H., Zumbusch, E., and Butterbachahl, K. (2002). Nitrification activity in tropical rain forest soil of the coastal lowlands and Atherton, Tablelands, Queensland, Australia. Journal of Plant Nutrition 165: 682-685.
Koskinen, W. C., Cox, L., and Yen, P. Y., 2001. Changes in sorption/bioavailability of imidacloprid metabolites in soil with incubation time. Biology and Fertility of Soils 33, 546–550.
Kremer, R. J., and Means, N. E. (2009). Glyphosate and glyphosate-resistant crop interactions with rhizosphere microorganisms. European Journal of Agronomy 31, 15-161.
Liu, Zhiqian. (2004). Effects of surfactants on foliar uptake of herbicides – a complex scenario. Colloids and Surfaces B: Biointerfaces 35, 149-153.
Marschner, P., Yang, C. H., Lieberei, R., and Crowley D.E. (2001). Soil and plant specific effects on bacterial community composition in the rhizosphere. Soil Biology and Biochemistry 33, 1437-1445.
Martin-Laurent F., Piutti S., Hallet S., Wagschal I., Philippot L., Catroux G., and Soulas G. (2003). Monitoring of atrazine treatment on soil bacterial, fungal and atrazine-degrading communities by quantitative competitive PCR. Pest Management Science 59, 259-268.
85
Marstorp, H., Guan, X., and Gong, P. (2000). Relationship between dsDNA, chloroform labile C and ergosterol in soils of different organic matter contents and pH. Soil Biology and Biochemistry 32, 879-822.
McCaig, A. E., Glover L. A., and Prosser J.I. (2001). Numerical analysis of grassland bacterial community structure under different management regimens by using 16S ribosomal DNA sequence data and denaturing gradient gel electrophoresis banding patterns. Applied and Environmental Microbiology 67, 4554–4559.
Mechri. B., Mariem, F. B., Baham, M., Elhadj S. B., and Hammami M. (2008). Change in soil properties and the soil microbial community following land spreading of olive mill wastewater affects olive trees key physiological parameters and the abundance of arbuscular mycorrhizal fungi. Soil Biology and Biochemistry 40, 152–161.
Muyzer, G., de Waal, E. C., and Uitterlinden, A. G. (1993). Profiling of complex microbial populations by denaturing gradient gel electrophoresis analysis of polymerase chain reaction-amplified genes coding for 16S rRNA. Applied and Environmental Microbiology 59, 695–700.
Owen, J. S., King, H. B., Wang, M. K., and Sun, K. L. (2010). Net nitrogen mineralization and nitrification rates in forest soil in northeastern Taiwan. Forest Ecology and Management 176, 519-530.
Pessagno, R. C., Torres Sa´nchez, R. M., and dos Santos Afonso, M. (2008). Glyphosate behavior at soil and mineral - water interfaces. Environmental Pollution, 53–59.
Ratcliff, A. W., Busse, M. D., and Shestak, C. J. (2006). Changes in microbial community structure following herbicide (glyphosate) additions to forest soils. Applied Soil Ecology 34, 114-124.
Ray, A. B., Ma, J., and. Borst, M. (1995). Adsorption of surfactants on clays. Hazardous Waste and Hazardous Materials 12, 357-364.
Reeleeder, R. D., Miller, J. J., Ball Coelho, B. R., and Roy, R. C. (2006). Impacts of tillage, cover crop, and nitrogen on populations of earthworms, microarthropods, and soil fungi in a cultivated fragile soil. Applied Soil Ecology 33, 243–257.
Ros, M., Goberna, M., Moreno, J. L., Hernandez, T., Garcı´a, C., Insam, H., and Pascual, J. A. (2006). Molecular and physiological bacterial diversity of a semi-arid soil contaminated with different levels of formulated atrazine. Applied Soil Ecology 34, 93-102.
86
Sadet, S., Martin, C., Meunier, B., and Morgavi, D. P. (2007). PCR-DGGE analysis reveals a distinct diversity in the bacterial population attached to the rumen epithelium. Animal 1, 939–944.
Sannino F., and Gianfreda L. (2001). Pesticide influence on soil enzymatic activities. Chemosphere 45, 417–425.
SAS Institute, 2003. SAS/STAT User Guide. Version 9.1. SAS Institute, Cary, NC.
Selim, H. M., Ma, L., and Zhu, H., (1999). Predicting solute transport in soils: second-order two site models. Soil Science Society of America Journal 63, 768–777.
Singh, J. S. and Kashyap, A. K. (2007). Variations in soil N-mineralization and nitrification in seasonally dry tropical forest and savanna ecosystems in Vindhyan region, India. International Society for tropical Ecology 48, 27-35.
Siqueira, José F., Rôças, Isabela N., and Rosado, Alexandre S. (2005). Application of Denaturing Gradient Gel Electrophoresis (DGGE) to the Analysis of Endodontic Infections. Journal of Endodontics 31, 775-782.
Tardioli, S., Ba`nne`, E. T. G., and Santori, F. (1997). Species-specific selection on soil fungal population after olive mill waste-water treatment. Chemoshpere 34, 2329–2336.
Toyota, K., Ritz, K., Kuninaga, S., and Kimura, M. (1999). Impacts of fumigation with meta-sodium upon soil microbial community structure in two Japanese soils. Soil Science and Plant Nutrition 45, 207–223.
Udawatta, R. P., Kremer, R. J., Adamson, B. W., and Anderson, S. H. (2008). Variations in soil aggregate stability and enzyme activities in a temperate agroforestry practice. Applied Soil Ecology 39, 153-160.
Vallaeys, T., Topp, E. Muyzer, G. Macheret, V. Laguerre, G. Rigaud, A. and Soulas. G. (1997). Evaluation of denaturing gradient gel electrophoresis in the detection of 16S rDNA sequence variation in rhizobia and methanotrophs. FEMS Microbiology Ecology 24, 279–285.
Weber, J. B., Best, J. A. and Gonese, J. U. (1993), Bioavailability and bioactivity of sorbed organic chemicals. In: Luxmore, R.J. and Peterson, G.A. (eds.), Sorption and Degradation of Pesticides and Organic Chemicals in Soil. Soil Science Society of America, 153−196.
Wolters V. and Schaefer M. (1994). Effects of acid deposition on soil organisms and decomposition processes. In Effects of acid rain on forest processes, 83–127. Eds. A. Hutterman, and D. Godbold. Wiley, New York.
87
Ying, G. G. (2006). Fate, behavior and effects of surfactants and their degradation products in the environment. Environment International 32, 417-431.
Zablotowicz, R. M., Weaver, M. A., and Locke, M. A. (2006). Microbial adaptation for accelerated atrazine mineralization/degradation in Mississippi Delta soils. Weed Science 54, 538-547.
Zhang, C., Liu, X., Dong, F., Xu, J., Zheng, Y., and Li, J. (2010). Soil microbial communities response to herbicide 2,4-dichlorophenoxyacetic acid butyl ester. European Journal of Soil Biology 46, 175-180.
Zhu, H., Singleton, D., and Aitken, M. D. (2010). Effects of Nonionic Surfactant Addition on Populations of Polycyclic Aromatic Hydrocarbon-Degrading Bacteria in a Bioreactor Treating Contaminated Soil. Environmental Science and technology 44, 7266-7271.
88
TABLES AND FIGURES
Table 4.1. Soil properties for silt loam and silty clay loam
Textural class pH
(CaCl2) OM %
Tot. org. C
% CEC
cmolc kg-1
Tot. N
mg kg-1
Bray 1 P
mg kg-1
Exc. K
mg kg-1
Exc. Ca
mg kg-1
Exc. Mg
mg kg-1
Silt loam 5.61 2.18 1.27 12.4 0.122 47.08 107 1214 233
Silty clay loam 4.52 1.89 1.10 22.2 0.096 1.34 57 1524 252
*Abbreviation: Exc., exchangeable; org., organic; tot., total.
88
89
Table 4.2. Chemicals used and treatment rates applied to pots in greenhouse experiment (L ha-1)
Treatments rates
Treatments Surfactant Surfactant x 2 Herbicide Surfactant + Herbicide
Activator-90 0.02 ml 0.04 ml
Glyphosate 0.0065 ml
Activator-90 + Glyphosate 0.02 ml + 0.0065 ml
Agridex 0.02 ml 0.04 ml
Atrazine 0.0167 ml
Agri-Dex + Atrazine 0.02 ml + 0.0167 ml
Thrust 0.01 g 0.02 g
Bentazon 0.0083 ml
Thrust + Bentazon 0.01 g + 0.0083 ml
Control 0 0 0 0
89
90
Table 4.3. The effect of silt loam, silty clay loam and herbicide/surfactant treatments on DNA, total organic carbon, and total nitrogen contents. Different letters after values within each column indicate statistical difference at P = 0.05 based on Student Newman Kuels Test.
Silt loam Silty clay loam
Treatments DNA
(ng/µl)
Total Carbon
%
Total Nitrogen
% DNA
(ng/µl)
Total Carbon
%
Total Nitrogen
%
Group 1 Control 10.90 bc 1.19 a 0.14 ab 6.17 ab 1.24 a 0.12 bc
Group 2
Act 3.93 ef 1.19 a 0.14 ab 5.80 ab 1.18 a 0.10 c
Act x 2 5.27 ef 1.19 a 0.14 ab 7.67 ab 1.26 a 0.14 ab
Gly-4 9.37 cd 1.19 a 0.13 b 5.73 ab 1.08 a 0.13 abc
Comb 6.60 def 1.18 a 0.13 b 7.83 ab 1.07 a 0.11 bc
Group 3
Agri 14.90 a 1.21 a 0.15 ab 8.17 ab 1.13 a 0.13 ab
Agri x 2 14.23 ab 1.19 a 0.14 ab 6.70 ab 1.18 a 0.15 a
Atraz 7.63 de 1.19 a 0.13 b 9.23 a 1.11 a 0.13 ab
Comb 7.23 def 1.17 a 0.13 b 7.97 ab 1.15 a 0.12 abc
Group 4
Thrust 13.57 ab 1.18 a 0.14 b 7.30 ab 1.12 a 0.12 abc
Thrust x 2 12.57 ab 1.17 a 0.14 b 7.30 ab 1.09 a 0.12 abc
Bent 6.63 def 1.18 a 0.13 b 7.03 ab 1.13 a 0.14 ab
Comb 5.73 def 1.17 a 0.13 b 6.40 ab 1.09 a 0.11 bc Act=Activator-90; Act x 2=Activator-90 doubled; Gly-4=glyphosate; Comb=Activator-90 plus glyphosate. Agri=Agri-Dex; Agri x 2=Agri-Dex doubled; Atraz=atrazine; Comb=Agri-Dex plus atrazine. Thrust; Thrust x 2=Thrust doubled; Bent=bentazon; Comb=Thrust plus atrazine.
90
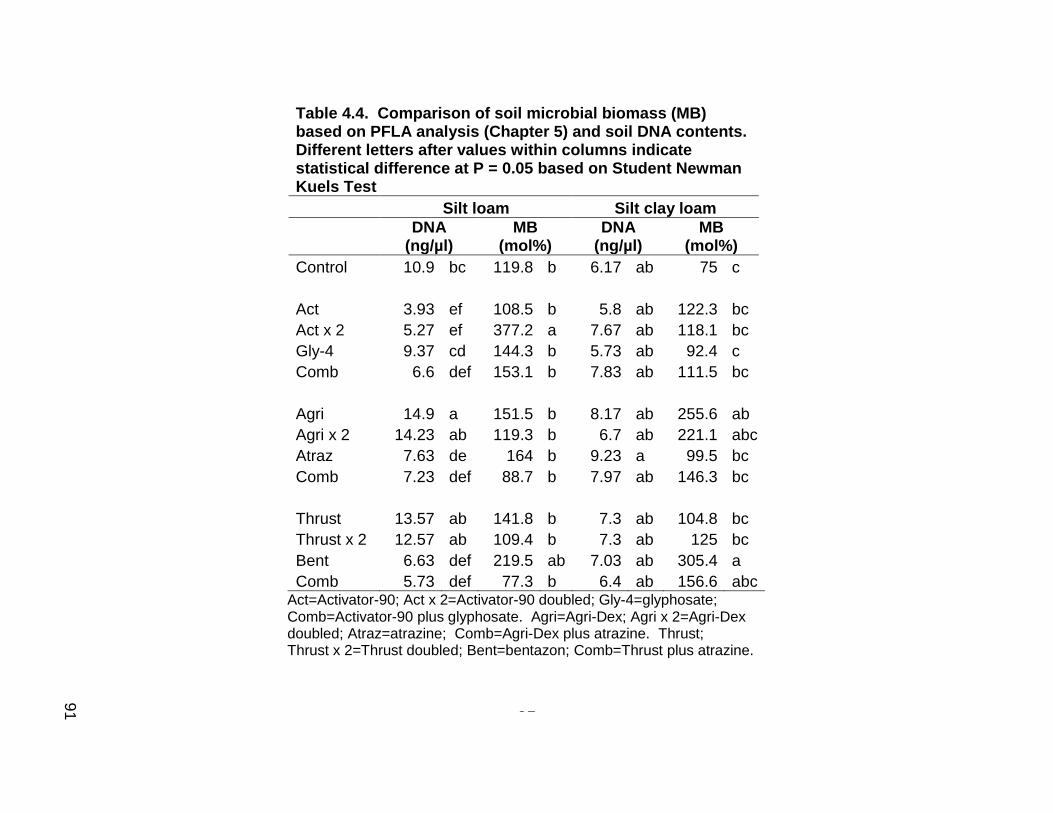
91
Table 4.4. Comparison of soil microbial biomass (MB) based on PFLA analysis (Chapter 5) and soil DNA contents. Different letters after values within columns indicate statistical difference at P = 0.05 based on Student Newman Kuels Test
Silt loam Silt clay loam
DNA
(ng/µl) MB
(mol%) DNA
(ng/µl) MB
(mol%)
Control 10.9 bc 119.8 b 6.17 ab 75 c
Act 3.93 ef 108.5 b 5.8 ab 122.3 bc
Act x 2 5.27 ef 377.2 a 7.67 ab 118.1 bc
Gly-4 9.37 cd 144.3 b 5.73 ab 92.4 c
Comb 6.6 def 153.1 b 7.83 ab 111.5 bc
Agri 14.9 a 151.5 b 8.17 ab 255.6 ab
Agri x 2 14.23 ab 119.3 b 6.7 ab 221.1 abc
Atraz 7.63 de 164 b 9.23 a 99.5 bc
Comb 7.23 def 88.7 b 7.97 ab 146.3 bc
Thrust 13.57 ab 141.8 b 7.3 ab 104.8 bc
Thrust x 2 12.57 ab 109.4 b 7.3 ab 125 bc
Bent 6.63 def 219.5 ab 7.03 ab 305.4 a
Comb 5.73 def 77.3 b 6.4 ab 156.6 abc Act=Activator-90; Act x 2=Activator-90 doubled; Gly-4=glyphosate; Comb=Activator-90 plus glyphosate. Agri=Agri-Dex; Agri x 2=Agri-Dex doubled; Atraz=atrazine; Comb=Agri-Dex plus atrazine. Thrust; Thrust x 2=Thrust doubled; Bent=bentazon; Comb=Thrust plus atrazine.
91
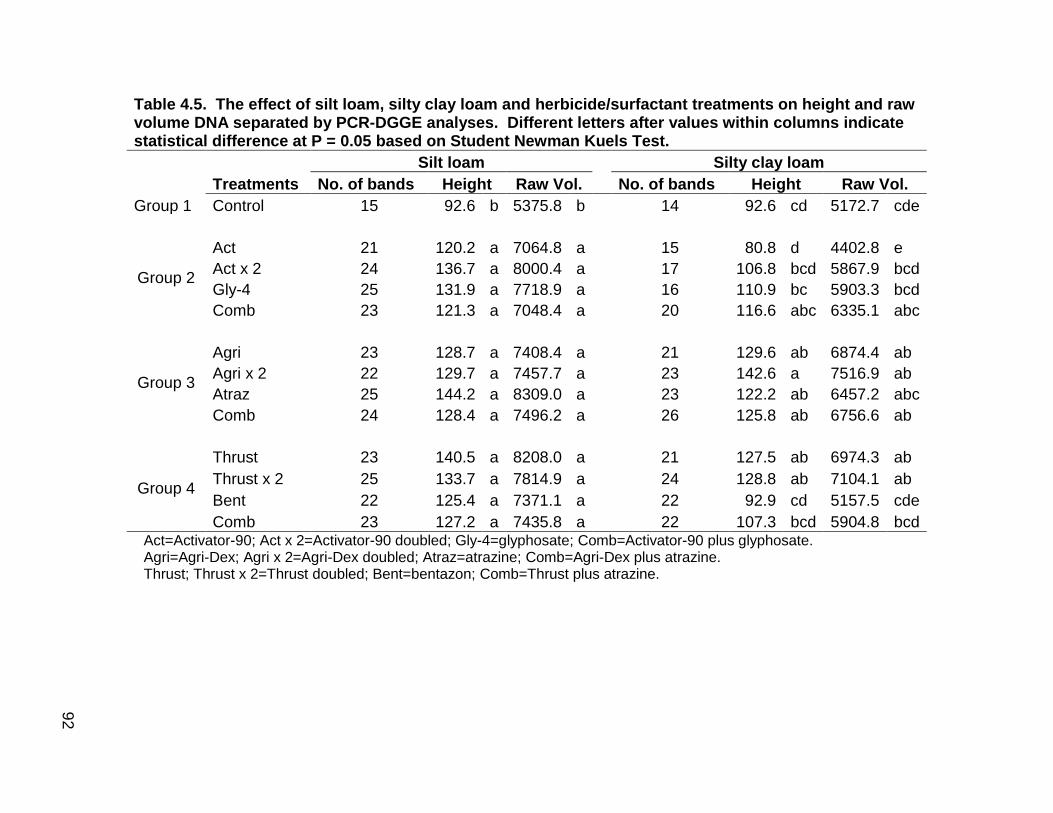
92
Table 4.5. The effect of silt loam, silty clay loam and herbicide/surfactant treatments on height and raw volume DNA separated by PCR-DGGE analyses. Different letters after values within columns indicate statistical difference at P = 0.05 based on Student Newman Kuels Test.
Silt loam Silty clay loam
Treatments No. of bands Height Raw Vol. No. of bands Height Raw Vol.
Group 1 Control 15 92.6 b 5375.8 b 14 92.6 cd 5172.7 cde
Group 2
Act 21 120.2 a 7064.8 a 15 80.8 d 4402.8 e
Act x 2 24 136.7 a 8000.4 a 17 106.8 bcd 5867.9 bcd
Gly-4 25 131.9 a 7718.9 a 16 110.9 bc 5903.3 bcd
Comb 23 121.3 a 7048.4 a 20 116.6 abc 6335.1 abc
Group 3
Agri 23 128.7 a 7408.4 a 21 129.6 ab 6874.4 ab
Agri x 2 22 129.7 a 7457.7 a 23 142.6 a 7516.9 ab
Atraz 25 144.2 a 8309.0 a 23 122.2 ab 6457.2 abc
Comb 24 128.4 a 7496.2 a 26 125.8 ab 6756.6 ab
Group 4
Thrust 23 140.5 a 8208.0 a 21 127.5 ab 6974.3 ab
Thrust x 2 25 133.7 a 7814.9 a 24 128.8 ab 7104.1 ab
Bent 22 125.4 a 7371.1 a 22 92.9 cd 5157.5 cde
Comb 23 127.2 a 7435.8 a 22 107.3 bcd 5904.8 bcd Act=Activator-90; Act x 2=Activator-90 doubled; Gly-4=glyphosate; Comb=Activator-90 plus glyphosate. Agri=Agri-Dex; Agri x 2=Agri-Dex doubled; Atraz=atrazine; Comb=Agri-Dex plus atrazine. Thrust; Thrust x 2=Thrust doubled; Bent=bentazon; Comb=Thrust plus atrazine.
92
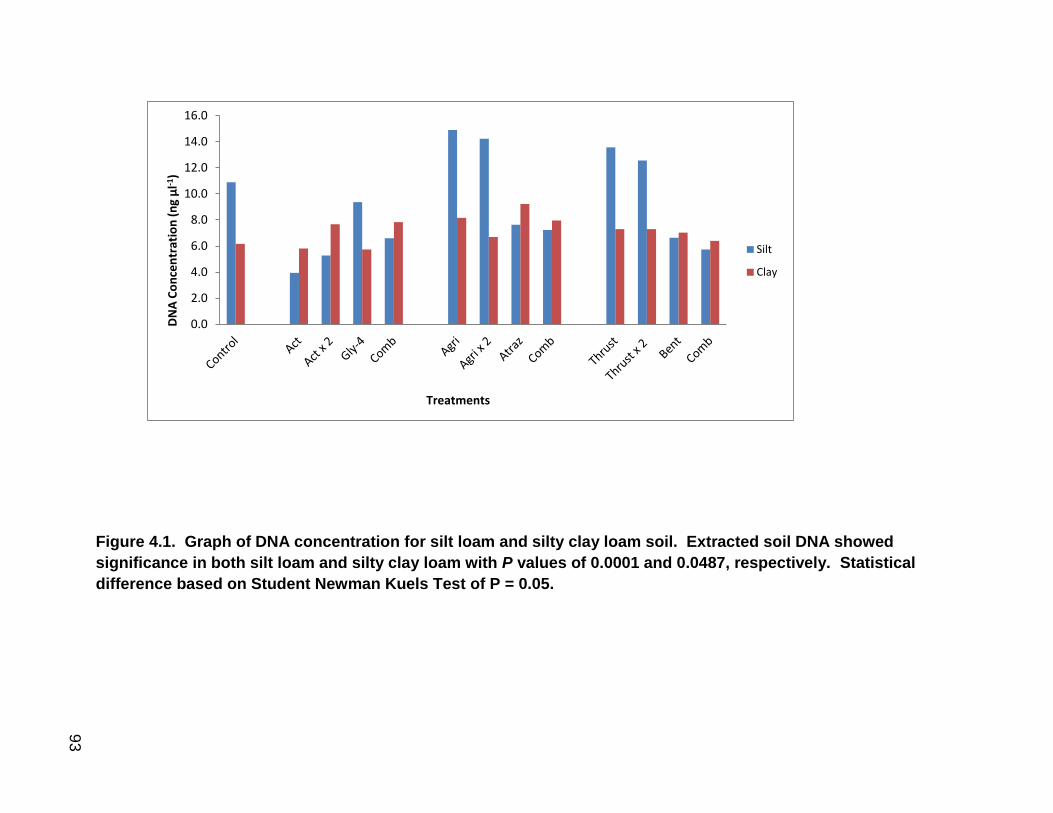
93
0.0
2.0
4.0
6.0
8.0
10.0
12.0
14.0
16.0
DN
A C
on
cen
trat
ion
(n
g µ
l-1)
Treatments
Silt
Clay
Figure 4.1. Graph of DNA concentration for silt loam and silty clay loam soil. Extracted soil DNA showed
significance in both silt loam and silty clay loam with P values of 0.0001 and 0.0487, respectively. Statistical
difference based on Student Newman Kuels Test of P = 0.05.
93
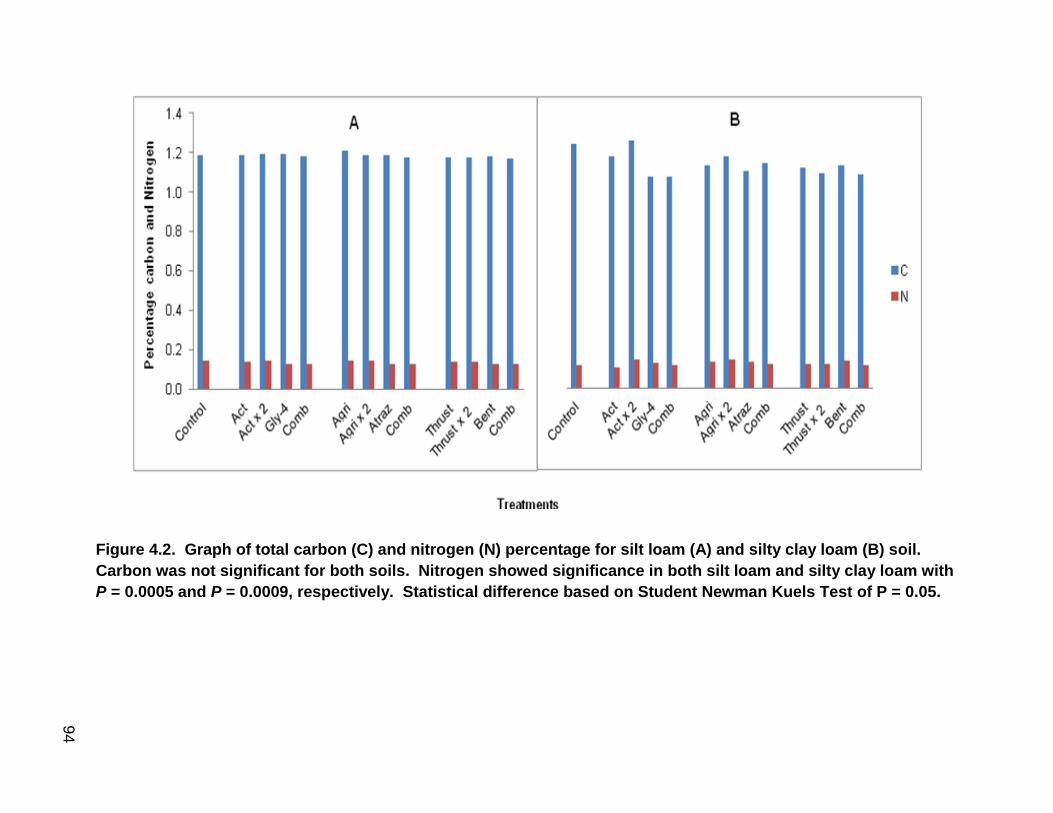
94
Figure 4.2. Graph of total carbon (C) and nitrogen (N) percentage for silt loam (A) and silty clay loam (B) soil.
Carbon was not significant for both soils. Nitrogen showed significance in both silt loam and silty clay loam with
P = 0.0005 and P = 0.0009, respectively. Statistical difference based on Student Newman Kuels Test of P = 0.05.
94
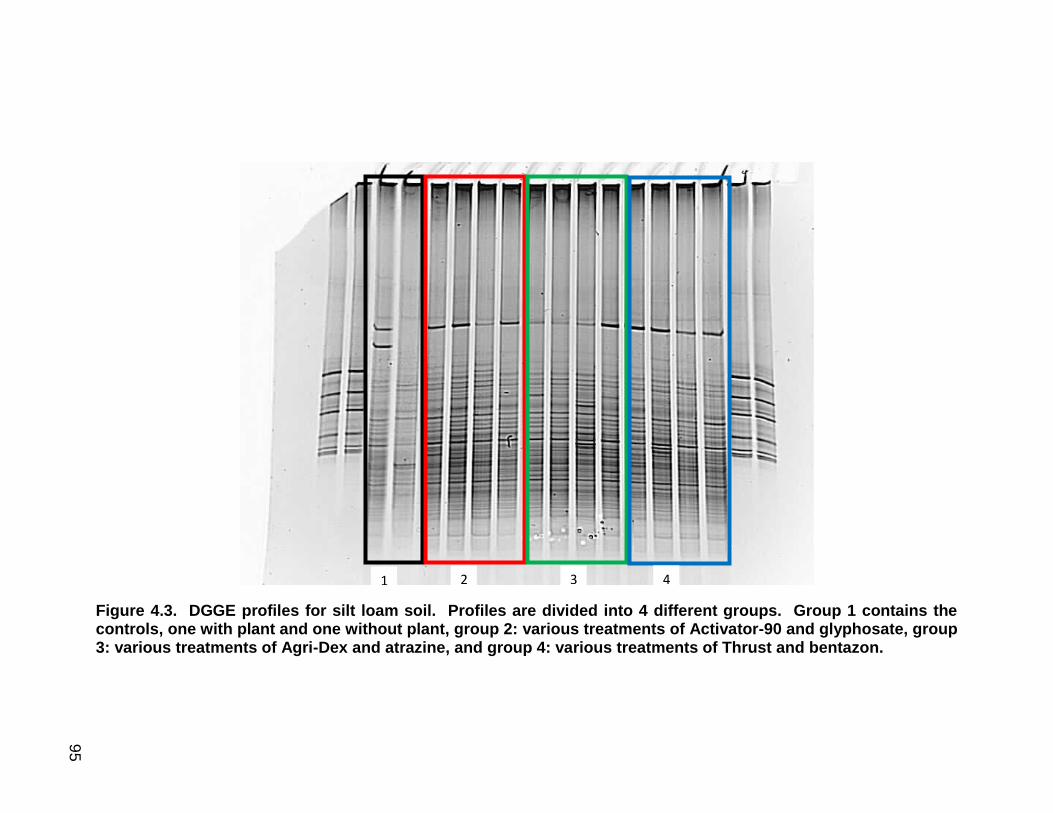
95
Figure 4.3. DGGE profiles for silt loam soil. Profiles are divided into 4 different groups. Group 1 contains the controls, one with plant and one without plant, group 2: various treatments of Activator-90 and glyphosate, group 3: various treatments of Agri-Dex and atrazine, and group 4: various treatments of Thrust and bentazon.
1 2 3 4
95
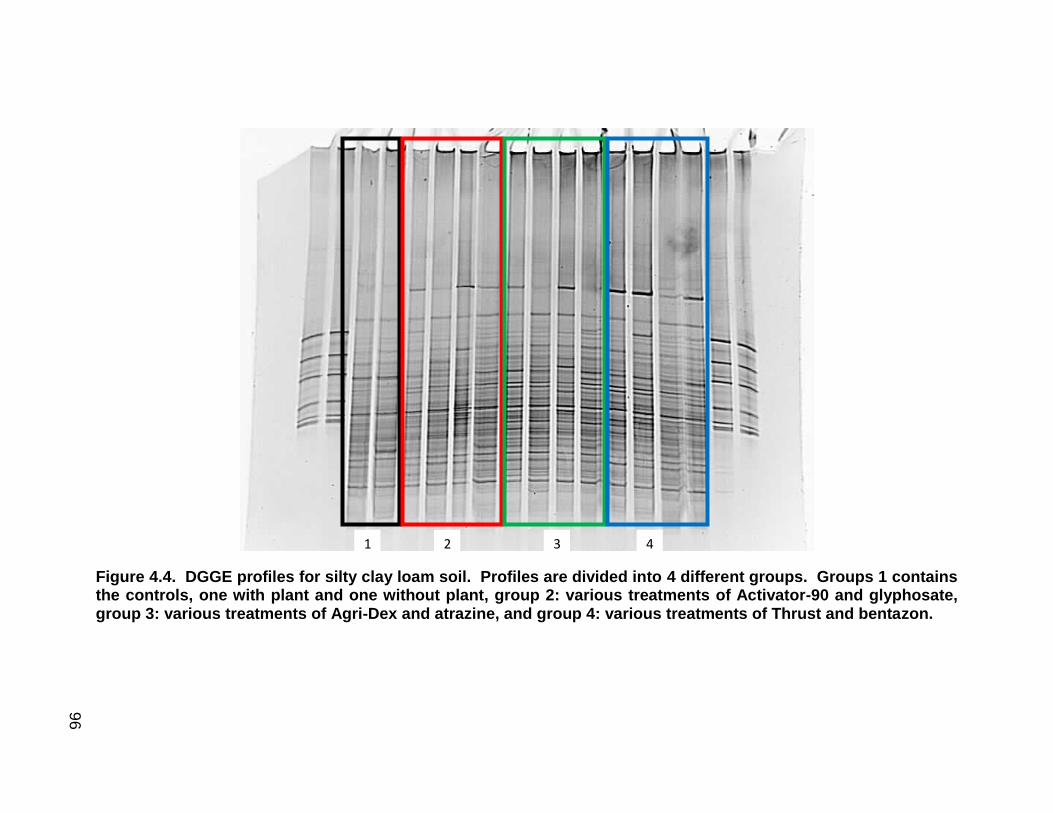
96
Figure 4.4. DGGE profiles for silty clay loam soil. Profiles are divided into 4 different groups. Groups 1 contains the controls, one with plant and one without plant, group 2: various treatments of Activator-90 and glyphosate, group 3: various treatments of Agri-Dex and atrazine, and group 4: various treatments of Thrust and bentazon.
1 2 3 4
96
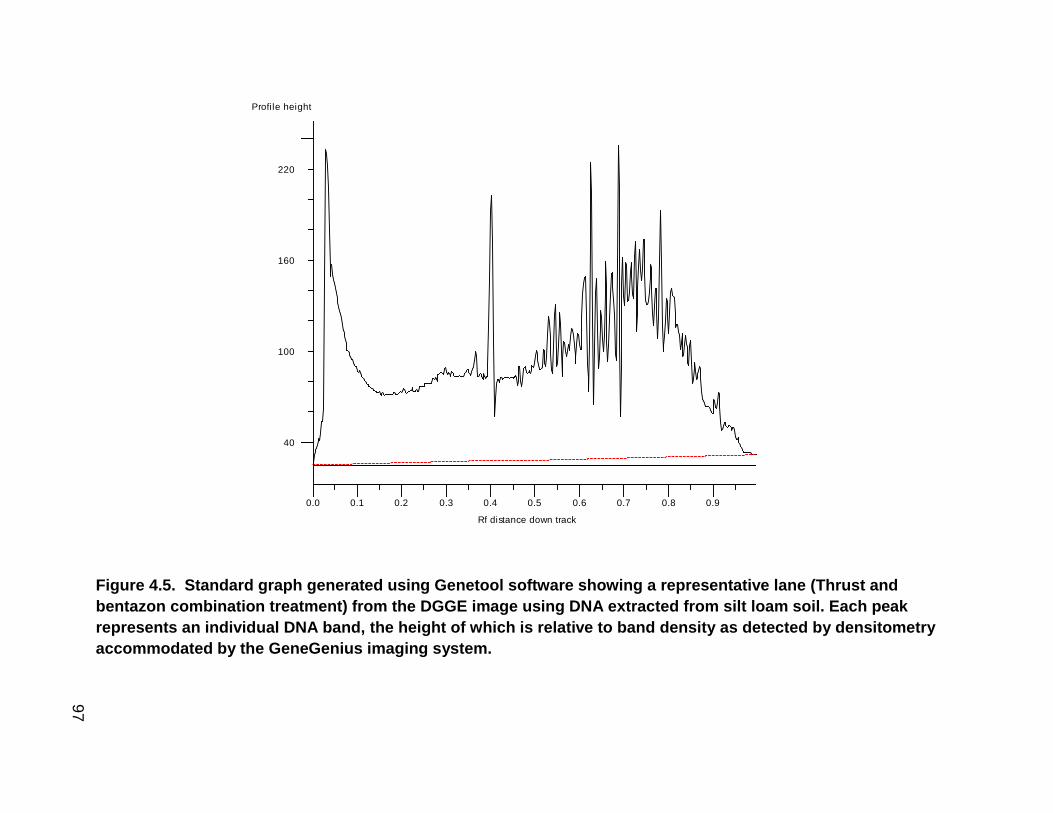
97
0.0 0.1 0.2 0.3 0.4 0.5 0.6 0.7 0.8 0.9
Rf distance down track
40
100
160
220
Profile height
Figure 4.5. Standard graph generated using Genetool software showing a representative lane (Thrust and
bentazon combination treatment) from the DGGE image using DNA extracted from silt loam soil. Each peak
represents an individual DNA band, the height of which is relative to band density as detected by densitometry
accommodated by the GeneGenius imaging system.
97
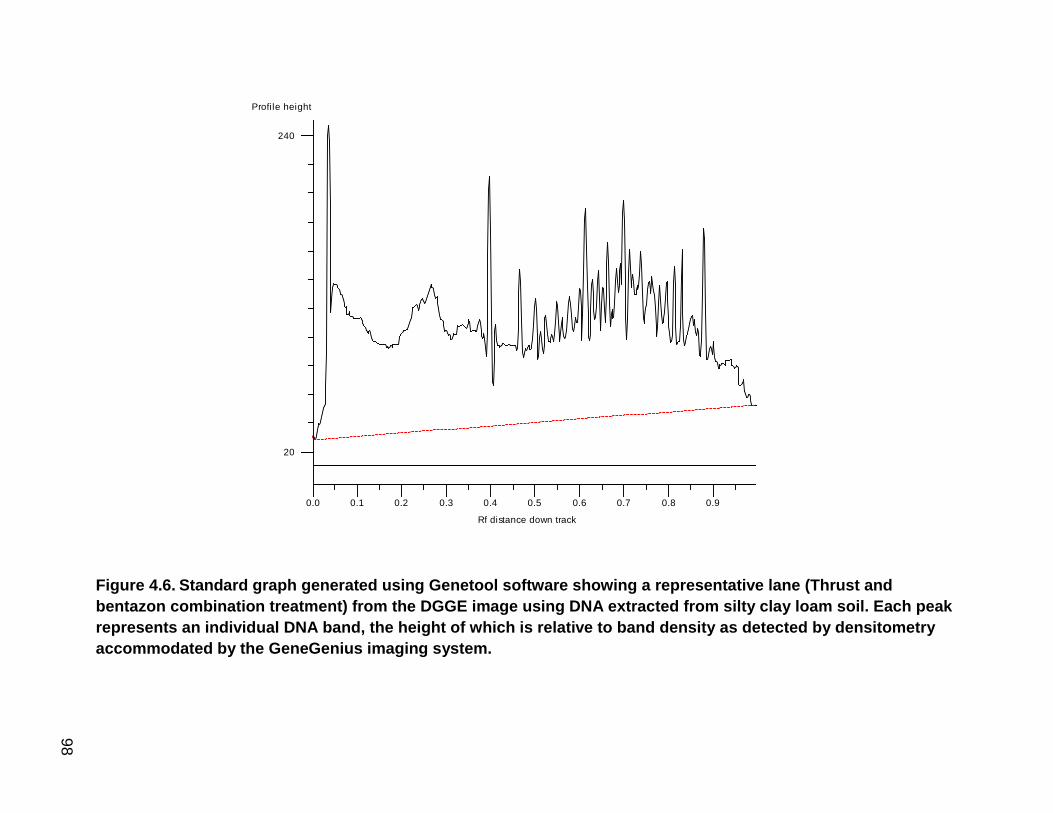
98
0.0 0.1 0.2 0.3 0.4 0.5 0.6 0.7 0.8 0.9
Rf distance down track
20
240
Profile height
Figure 4.6. Standard graph generated using Genetool software showing a representative lane (Thrust and
bentazon combination treatment) from the DGGE image using DNA extracted from silty clay loam soil. Each peak
represents an individual DNA band, the height of which is relative to band density as detected by densitometry
accommodated by the GeneGenius imaging system.
98
99
CHAPTER 5
RESPONSE OF THE SOIL MICROBIAL COMMUNITY TO
SELECTED
SURFACTANTS, HERBICIDES, AND SOIL TEXTURE
INTRODUCTION
Microbial community structure and function measurements are often used as
indicators for monitoring soil quality, because the biological constituent of soil is
sensitive to changes to the environment. Many soil processes are microbially
mediated, such as carbon and nitrogen cycling, mineralization of other nutrients,
enzymatic activities, soil aggregation, and decomposition of organic matter (Smith,
1994). Microbial community structure is affected by various environmental and
growth factors, such as moisture, temperature, nutrient availability, and management
practices (Petersen et al., 2002). Assessment of microbial communities and
100
community composition diversity within the soil ecosystem are helpful in determining
if management practices and environmental conditions are aggrading or degrading
to soils. Several labor-intensive and culture-dependent methods are used to
measure microbial biomarkers and include plate counts and community level
physiological profiling (CLPP) (Jenkinson and Powlson, 1976b; Turco et al., 1994).
Culture-independent methods including phospholipid fatty acid analysis (PLFA)
examine more of the total soil microbial community and provide information on
diversity, which can be used as an indicator of biological activity in soil. The
application of PLFA analysis is based on carbon chain lengths of phospholipids in
microbial cells, which vary among species and are useful in identification of microbial
species (Leckie, 2005). Cell membranes are composed of phospholipids and the
major microbial groups can be separated based on the long-chain fatty acid
composition unique to each group (Vestal and White, 1989). Different PLFA
patterns are associated with different microbial communities that can be distinctive
under different soil properties and thereby can be used to identify changes in
composition of microbial communities due to soil or crop management practices
(Baah et al., 1992; Cavigelli et al., 1995; Petersen and Klug, 1994).
Phospholipid fatty acid profile differences can be attributed to management
practices including tillage, cropping system, and addition of various chemicals
(Acosta-Martinez et al., 2010; Dick et al., 2010; Ratcliff et al., 2006; Ibekwe and
Kennedy, 1998). Herbicides and surfactants differ in chemical composition and
react differently when incorporated into the soil system due to soil properties and
environmental factors (Smith and Hayden, 1982; Ray et al., 1995). Bacterial and
101
fungal composition of soil may be altered due to the application of different
herbicides (Ratcliff et al., 2006). Surfactants are used in varying amounts in different
chemical products, such as agricultural pesticides, detergents and cosmetics to
modify spreading characteristics (Schramm, 2001; Krogh et al., 2003). Surfactants
are used with agricultural chemicals including herbicides and insecticides to modify
the effects of surface tension of liquid carriers in the pesticide formulation. These
chemicals eventually enter soil and water systems (Buhler, et al., 1993). Through
biodegradation pathways, microorganisms can modify the structure and activity of
some of these chemicals to reduce their adverse effect on the environment (Ying,
2006). Surfactants entering the environment can possibly disrupt interactions of
various chemical, physical and biological processes. Use of nonionic surfactants
has resulted in preferential sorption based on clay content of the soil (Podoll, 1987).
Ray et al. (1995) reported that nonionic surfactants had a greater affinity for and held
more strongly to montmorillonite clay than kaolinite. Cationic surfactants were more
toxic to gram-negative than to gram-positive bacteria and the level of toxicity was
attributed to the extent of sorption in the soil (Sarkar et al., 2009; Nye et al., 1994).
Surfactants are often used with herbicides as an additive and enhance foliar
uptake of post-emergence herbicides (Liu, 2004). These chemicals are not applied
directly to soils, but a substantial amount may contact soil during application or
rainfall events (Haney et al., 2000). Some herbicides, such as glyphosate, are easily
adsorbed to clay and can be biodegraded in water and soil (Ahrens, 1994; Pessagno
et al., 2008, Barja and dos Santos Afonso, 2005). Atrazine-degrading
microorganisms may accumulate in soil receiving frequent atrazine applications, and
102
coexist with the indigenous soil microbial community, which may metabolize the
herbicide (Satsuma, 2009; Zablotowicz et al., 2002). Herbicide degradation is
affected by soil factors including nutrient composition and content, pH, temperature
and moisture (Weber et al. 1993). In a study conducted with bentazon and atrazine,
it was concluded that biological degradation was key for both herbicides. It was also
stated that the herbicides added with a nonionic surfactant reduced the degradation
time of the herbicides, compared to the herbicides applied alone and when
herbicides were applied simultaneously, degradation time increased (Li et al., 2008).
Pesticides may reduce enzyme activity and populations of various organisms in soil
(Toyota et al., 1999; Sannino and Gianfreda, 2001). Ratcliff et al. (2006) found that
bacterial and fungal populations were altered due to the application of different
herbicides. In a study conducted with pure herbicide (mesotrione as active
ingredient) and formulated herbicide, it was concluded that microbial activity was
affected but only when the chemicals were used at rates much greater than the
recommended rate (Crouzet, et al 2010). These chemicals can directly or indirectly
affect microbial communities or sub-populations of the community and these
changes were expressed either as a short-term or long-term effect (Ratcliff et al.,
2006; Dick et al., 2010; Bittman et al., 2005). It is also likely that soil history was a
determining factor in microbial composition and responses (Girvan et al., 2004).
Application of PLFA analysis is one way to quantify the changes to the soil microbial
community due to potential impacts of pesticides and surfactants in the environment.
The objective of this study was to examine the effect of various surfactants,
herbicides, and soil texture on soil microbial community composition using PLFA

103
analysis. We hypothesize that surfactants and herbicides added to different soils will
alter soil microbial PLFA profiles.
104
MATERIALS AND METHODS
Soils and chemicals
Two soil types, a silt loam and a silty clay loam were used in this study. A
Wrengart silt loam (20% clay; fine-silty, mixed, active, mesic Fragic Oxyaquic
Hapludalfs) was collected from the Lincoln University Carver Farm, Jefferson City,
MO (38° 31‟ 36.1” N, 92° 8‟ 22.9” W). A Mexico silty clay loam (37.5% clay; fine,
smectitic, mesic Vertic Epiaqualfs) was collected from University of Missouri
Bradford Farm, Columbia, MO (38° 53‟ 48” N, 92° 12‟ 23.5” W). Bulk soils were air
dried, sieved to pass a 2 mm screen and analyzed for chemical and physical
characteristics (Buchholz et al., 1983; Table 5.1a). No known herbicide plus
surfactant applications had been made to the two sites prior to soil sampling.
Surfactants used in this study were alkylphenol ethoxylate plus alcohol
ethoxylate (Activator 90; non-ionic; Loveland Industries, Inc., Greeley CO),
polyethoxylate (Agri-Dex; non-ionic; Helena Chemical Company, Collierville TN) and
a blend of ammonium sulfate, drift reduction/deposition polymers and anti-foam
agent (Thrust; anti-foam agent; Loveland Industries, Inc., Greeley CO). The
herbicides were glyphosate (Gly-4 Plus; Universal Crop Protection Alliance LLC,
Eagan MN), atrazine (AAtrex; Universal Crop Protection Alliance LLC, Eagan MN),
and bentazon (Basagran; Micro Flow Company LLC, Memphis TN). Surfactants and
herbicides were applied to soils at label rate, either alone or in combination;
calculated to per pot of 4000 g soil (Table 5.1b). Non-treated soils served as
105
controls. Treatment mixtures of deionized water and chemical(s) were applied
directly to potted soils.
To determine effects of surfactants and herbicide-surfactant combinations on
the soil microbial community, a greenhouse experiment was conducted. Two gallon
pots (20.3 cm dia. by 20.3 cm in height) were filled with 4000g of air-dried soil,
fertilized and limed in accordance with fertility recommendations for field corn (Zea
mays) based on soil test results (Lory et al. 1998). Soils were brought to field
capacity and watered daily to maintain field capacity levels. Surfactant and
herbicide treatments were prepared at designated rates using deionized water and
were applied directly to pots. Six seeds of field corn (Zea mays L. type „Indenta‟)
were planted in each pot and later thinned to two plants per pot. Treatments were
replicated three times and arranged in a randomized complete block design on
greenhouse benches. Temperature in the greenhouse varied from 18 to 27oC
throughout the day. Additional lighting was also provided to increase day light
period. Seven weeks after seeding when small roots were found throughout the pot,
the corn foliage was harvested by cutting at the soil surface and the roots were
carefully removed from the soil. Soil samples were collected, stored in soil sample
plastic bags at 4oC and processed for PLFA.
Phospholipid Fatty Acid Analysis (PLFA)
Investigation of soil phospholipid fatty acid (PLFA) was based on the methods
of Bligh and Dyer (1959), and modified by Petersen and Klug (1994). Reagents
used in the procedure were high pressure liquid chromatography (HLPC) grade
supplied by Sigma (St. Louis, MO) unless otherwise stated. Two-gram soil samples
106
were added to Teflon-lined screw cap culture tubes (16 mm – 100 mm) and
subjected to the following series of steps; saponification at 100oC, acid methylation
at 80oC, and an alkaline wash. Long-chain fatty acids and other lipid compounds
making up methyl esters were extracted with hexane. Nonadecanoic acid methyl
ester was incorporated to allow for quantification of lipids identified on a molar basis.
Solid phase extraction was used to separate the samples for phospholipid analysis
with 100-mg silica columns (Varian, Palo Alto, CA). This was followed by
conditioning of the columns with 3 mL hexane, 1.5 mL hexane/chloroform (1:1) and
100 mL chloroform plus a slight vacuum (25.4-50.8 mm of Hg) applied to the column
after each solvent. Rinsing of the columns under vacuum was carried out with the
sequential addition of 1.5 mL chloroform/2-propanol (1:1) and 1.5 mL 2% acetic acid
in diethyl ether. Methanol (2 mL) was used to elute the phospholipids from the
columns. In preparation for PLFA extraction, the sample was evaporated in the
presence of nitrogen. The organic phase was evaporated to a dry state under
nitrogen then re-dissolved with 75 mL hexane:methyl tertiary butyl ether (1:1). A gas
chromatograph (Agilent Technologies GC 6890, Palo Alto, CA) equipped with a
fused silica column, flame ionizer detector, and integrator was used to analyze fatty
acid methyl esters. Integration and analysis of samples were operated with
ChemStation software (Agilent Technologies GC 6890, Palo Alto, CA). Microbial
Identification Systems, Inc. (Newark, DE) software provided the Eukary methods
parameters that were used for peak identification and integration of areas. Peak
chromatographic responses were converted to mol responses by using internal
standards and recalculation of responses were done as needed. Carbon chains with
107
lengths of 12 to 20 carbons are correlated with microorganisms. A relationship
determined by Bailey et al. (2002) was used to calculate biomass.
Bacteria to fungal ratio were calculated for samples. Fatty acids were
designated by the number of carbon atoms, followed by a colon, the number of
double bonds, and then by the position of the first double bond from the methyl (ω)
end of the molecules. The following relationships of fatty acid profiles with various
microorganisms are also presented in tabular form (Table 5.1c). Branched fatty
acids are indicated by „i‟ and „a‟ for iso and anteiso branching, respectively. The
prefix „cyc‟ designates cyclopropane fatty acids. Different peaks were used as
markers for bacteria: 12:0 3OH, i14:0, 15:0, a15:0, i15:0, i15:0 g, cyc15:1, i16:0,
16:1 7, cis16:1 7, trans16:1v7, a17:0, cyc17:0, i17:0, 17:1 6, i17:1 7, 18:1 7,
cis18:1 7, cis18:1 9, cyc19:0, cyc19:0, C11-12, cyc19:0, cis19:1 9 (Vestal and
White, 1989). Markers used for fungi; 16:1 5, cis16:1 5, 18:1 9, 18:2 6,
cis18:2 6, 18:2 9, 18:3 3, 18:3 6, cis18:3 6 (Federle, 1986; Wander et al.,
1995; Zelles et al., 1995; Frostegard et al., 1993; Sundh et al., 1997). Gram-positive
bacteria markers were; i14:0, i15:0, a15:0, i15:0 g, i16:0, i17:0, cis18:1 9 (O‟Leary
and Wilkinson, 1988; Wander et al., 1995; Zelles et al., 1995; Sundh et al., 1997).
Gram-negative bacteria markers were; 15:1 6c, cis16:1v7t, cy17:0, cis18:1v7;
cy19:0, cyc19:0, cis19:1v9 (Ratledge and Wilkinson, 1988; Wander et al., 1995;
Zelles et al., 1995; Sundh et al., 1997). Mycorrhizal markers were 16:1 5,
cis16:1 5, 18:2 6, cis18:2 6, 18:2 9 (Balser et al., 2005; Belen Hinojosa et
al., 2005). Ratios of the cyclopropyl fatty acids to monoenoic precursors and the
108
total saturated to total monounsaturated fatty acids we used to calculate stress
indicators (Kieft et al., 1997; Bossio and Scow, 1998; Fierer et al., 2003). Peaks
used to calculate cyclopropyl fatty acids to monoenoic precursor ratios were cyc17:0
to cis16:1 7 and cyc19:0 to cis18:1 7. The ratio of total saturated to total
monounsaturated fatty acids used the ratio of the sum of 14:0, 15:0, 16:0, 17:0, 18:0,
and 20:0 to sum of cis16:1 11, cis16:1 9, cis16:1 7, cis16:1 5, cis17:1 9,
cis17:1v8, cis17:1v7, and cis17:1 5. Monounsaturated fatty acids from 14:0 to
19:0 were also evaluated (Bossio and Scow, 1998) (Table 5.1c).
Statistical Analyses
The data for the different parameters was analyzed for different soil types and
treatments using SAS PROC GLM (2002). ANOVA was used to determine
significant effects and, where F-values were significant (P=0.05), mean separations
were conducted using Fisher‟s Protected Least Significant Difference (LSD) test.
Fatty acid percentages spanned a wide range and were log transformed for principal
component analyses (PCA) in SAS. PCA was used and a covariance analysis
between factors was performed in order to reduce data dimensionality and to
observe unknown trends with microbial populations (Tabachnick and Fidell, 2001).
PCA was used to show differences and similarities between the two soils and also
with the various treatments used in the study. Further comparison was done using
canonical analysis. Multi-dimensional plots were used to present data for better
understanding of the relationship. We adopted Kaiser‟s rule (Joliffe, 1986) and only
variables with an eigenvalue greater than one were used for further analysis when
the correlation matrix is used.
109
RESULTS AND DISCUSSION
There were differences in chemical and physical characteristics of the two
soils used in this study which affects the biological properties and microbial
community composition. The silt loam soil had a higher pH (0.01 M CaCl2) of 5.61
compared to the silty clay loam soil pH of 4.52 (Table 5.1a), both not suitable for
corn production. Also, the silt loam soil was higher in total organic C, N, P, and K
compared to the silty clay loam. Cation exchange capacity values of the silty clay
loam were double the CEC of the silt loam soil and Mg in the silty clay loam was
higher than the silt loam.
Higher concentrations of BtoF, GN, and Ana were observed in the silt loam
compared with the silty clay loam soil (Table 5.2). Furthermore, comparison of the
treatments within the different soils showed variations among the treatments.
Analysis of variance showed differences in the response of the various biomarkers
to treatments (Table 5.2). In the silt loam, treatments affected Bac (P=0.003), Fun
(P=0.0307), GN (P=0.0001), GP (P=0.0001), Aer (P=0.003), and Ana (P=0.0001)
biomarkers. The microbial populations in the silty clay loam only showed differences
due to treatment for BtoF (P=0.0342) and Mono (P=0.0367). More microbial groups
in the silt loam were affected by treatment when compared to the silty clay loam.
Biomarkers for the fatty acids were analyzed with SAS and examined for
significance (see Tables 5.3a, 5.3b, 5.4a, and 5.4b). For the silt loam soil, the
treatments affected the microbial groups differently (Tables 5.3a and 5.3b). For silt
loam, Activator-90 surfactant at the recommended rate decreased Bac, GN and Aer.
110
Activator-90 at 2X rate increased BM and Fun and decreased Bac, BtoF ratio, GN,
GP, Aer and Ana and Mono fatty acids. Glyphosate alone and combined with
Activator-90 decreased Bac, BtoF, GN, Aer, Ana, and increased GP. Agri-Dex at
the recommended rate decreased GN and Ana, and at 2X rate showed decreased
Bac, GN Aer, Ana, and increased StoM, a stress indicator. Atrazine showed a
decrease in Bac, GN, Aer, Ana, and an increase in GP. Combinations of Agri-Dex
with atrazine and Thrust with bentazon decreased Bac, GN, Aer and Ana. Thrust at
the recommended and 2X rates decreased Bac, GN, GP, Aer and Ana. Bentazon
decreased Bac, BtoF, GN, Aer, Ana and increased GP. Over all, all treatments
except Agri-Dex decreased bacterial markers relative to control. Fungi increased
with Activator-90 at 2X rate in silt loam. Bacteria to fungi ratio values decreased
relative to control for Activator-90 2X, glyphosate, Activator-90 and glyphosate
combination, and bentazon. Gram-negative bacteria biomarkers were less with all
treatments compared to control. Gram-positive bacteria biomarkers were higher
than the control for glyphosate, Activator-90 and glyphosate combination, atrazine
and bentazon and lower for Agri-Dex and atrazine combination and Thrust and
bentazon. Aerobic and anaerobic bacteria biomarkers were significantly affected by
all chemical treatments except Agri-Dex and Activator-90, respectively, applied
individually at recommended rate.
In the silty clay loam, only a few differences were observed (Tables 5.4a and
5.4b). Agri-Dex applied at the recommended rate and bentazon significantly
increased MB. All other treatments showed an increase in MB when compared to
control. The application of glyphosate and atrazine in combination with surfactants in
111
the silty clay showed an increase in MB when compared to the control. Suggested
that the presence of the surfactants may have enhanced degradation of the
herbicides resulting in higher BM (Li et al., 2008). Both rates of Agri-Dex decreased
Mono, a stress indicator. Heipieper et al. (1996), reported that a shift in
monounsaturated fatty acids from a lower number to a higher number was evidence
of stress. Bentazon and Thrust decreased Ana bacteria. In contrast, decreases in
biomarkers of the bacterial community occurred with nearly all treatments in the silt
loam. This indicates that the bacterial community was sensitive to subtle changes in
the soil environment (Pennanen et al., 1996; Wilkenson et al., 2002). A general
increase in MB developed in both soils with Activator-90 at 2X rate in the silt loam
and Agri-Dex and bentazon in the silty clay loam showing significance. Haney et al.
(2000) showed that glyphosate applied to soil did not significantly affect MB.
Glyphosate may either stimulate or inhibit soil microbial activity based on the
concentration used and on soil properties (Carlisle and Trevors, 1986). The
increases in MB suggest that the different chemicals added to soil may have been
used as carbon sources by soil microorganisms (Wardle and Ghani, 1995; Fierer et
al., 2003). Gram-positive bacteria were increased with addition of herbicides in the
silt loam, but decreased in the silty clay loam. In previous studies, the GP
component exhibited growth fluctuations during the degradation of soil-applied
herbicides (Pipke et al., 1987; Strong et al., 2002; Schmalenberger and Tebbe,
2002; Seeger et al., 2010). The application of herbicide alone to both soils had
some affect on the microbial community. Based on these reports, it is possible that
112
species composition and perhaps herbicide metabolic ability of the GP component
varied considerably between the silt loam and the silty clay loam.
Microbial stress indicators are used to detect shifts in microbial community
due to unfavorable conditions such as temperature, availability of substrate, water
availability, and toxicity caused by various substances including heavy metals.
Cyclopropane is produced under limited carbon source (Bossio and Scow, 1998).
Monoenic acids are associated with high substrate availability. Ratio of cyclopropyl
fatty acids to monoenoic fatty acids might be a good indicator for monitoring stress
on the microbial community. The ratio of total saturated to total monounsaturated
fatty acids used the ratio of the sum of 14:0, 15:0, 16:0, 17:0, 18:0, and 20:0 to sum
of cis16:1v11, cis16:1v9, cis16:1v7, cis16:1v5, cis17:1v9, cis17:1v8, cis17:1v7, and
cis17:1v5. The ratio of cyclopropyl fatty acids to monoenoic fatty acids increased
with the Activator-90 and glyphosate combination treatment in the silt loam. These
biomarkers were not significantly different for Activator-90 and glyphosate treatment
in the silty clay loam although it decreased with both application rates of Agri-Dex
(Table 5.4b).
Ordinate analysis was used to observe differences or similarities among the
treatments in the silt loam and silty clay loam soil. It was also used to graphically
display the clustering of both soils. Soil variation was observed between the silt
loam and silty clay loam. Plots of the different components showed a distinctive
separation of the microbial community of silt loam and silty clay loam soils (Figure
5.1, a-d). For the silt loam the x axis explained 81% of the variability and the y axis
113
accounted for 6% of the variability. The silty clay loam had 80% of its variability
explained in the x axis and 14% for the y axis. The differences between the two
soils based on the separation reflect different fatty acid combinations, which indicate
diverse microbial composition present in each soil. This difference may be attributed
to differences in soil physical and chemical properties, and management practices
(Table 5.1a). These findings support previous studies where the original soil
chemistry and texture were main contributors to differences detected in the diversity
of microbial community (Fang et al., 2005; Girvan et al., 2003; Marschner et al.,
2001). Fang et al. (2005), using carbon substrate utilization, also detected
differences between sandy loam and silty clay soils used to grow corn. The
separation of treatments within each soil is variable with a combination of clusters
and distinct separations observed. Another likely contributor to variations in the
microbial community is the addition of plant–based carbon substrates as root
exudates as the plant matures. Exudates may differ between soils and even within
treatments due to a combination of chemical and physical factors affecting the plant
thereby altering the microbial community (Brimecombe et al., 2001).
Similar to using ordination to view differences and similarities between the
two soils, the same approach was used to compare the different treatment effects on
PLFA patterns within each soil. Further analyses were done using eigenvalues to
determine the variance. Both positive and negative eigenvalues were observed for
both soils for all four ordinates (O1, O2, O3, and O4) for various treatments in the
data distribution pattern. Greater effects were observed in the silt loam compared to
the silty clay loam (Tables 5.5a and 5.5b) with mean separation.
114
Silt loam was significant in O3 (P = 0.0507), and O4 (P = 0.0045). Ordinate 2
was not significant (P = 0.0786), but showed difference in the mean separation. The
combination treatments, Activator-90 plus glyphosate, Agri-Dex plus atrazine;
atrazine alone; and Thrust at 2X application rate were significantly higher than the
control for O2. Ordinate 3 showed significantly higher eigenvalues for all treatments
except for Agri-Dex plus atrazine and Thrust alone. For O4, glyphosate alone
treatment was significantly different than the control. This suggests that glyphosate
may have been adsorbed to soil particles making it unavailable to microbial
degradation (Pessagno et al., 2008). Other studies demonstrated that adjuvants or
surfactants aid in the sorption of herbicide to soil by modifying the solubility limiting
bioavailability (Beighel et al., 1999; Krogh et al., 2003). In the silty clay loam no
significance between the four ordinates was detected, but different effects were
observed. Based on the mean separation, Agri-Dex at both application rates O1 (P
= 0.1048) and bentazon alone for O2 (P = 0.0856) had different effects on PLFA
compared to the control. The addition of surfactants at both application rates did not
significantly affect PLFA profiles for the silt loam or silty clay loam.
Ordination graphs were used to plot the eigenvalues of the two soils with the
different treatments (Figures 5.2 and 5.3). From the graphs plotted with O3 and O2,
the two soils showed a difference in the separation of the treatments for PLFA. The
distance between the different treatments in the ordination graph signifies
similarities; the shorter the distance the greater the similarity. In the silt loam there is
a distribution of the treatments along the y-axis (O3) with the control with negative
values and majority of treatments with greater concentrations. The clay is distributed
115
along the x-axis (O2) with the control and some treatments having similarities. This
agrees with the biomarker data reflecting more activity in the silt loam than the silt
clay loam. The microbial community structure in silt loam and silty clay loam was
altered to some extent by herbicide and surfactants applied to soil.
The ordination data for both soils in the present study did not reflect any great
significance based on the different one-time application of treatments. This may
suggest that soil properties and continuous chemical application together are
primary factors as related to microbial composition and response versus one-time
applications of surfactants and herbicides used in our study (Girvan et al., 2003;
Lupwayi et al., 2010 ; Seghers, et al., 2003; El Frantroussie., 1999).
116
CONCLUSION
The PLFA microbial analyses indicated differences in the microbial
community between the silt loam and silty clay loam soils. Total Bac mol percent
decreased in most treatments relative to the control in silt loam soil. There were few
differences among treatments in the silty clay loam. Significant differences were
seen in MB with bentazon application and in Mono for Agri-Dex at both application
rates based on mean separation. Each soil contained different combinations of the
various microbial groups. Although there was a general decrease in the total Bac
values, MB increased when most treatments were applied to both soils. Also, the
response of GP bacteria were different between both soils with the herbicide alone
treatments of glyphosate, atrazine and bentazon. There was a significant increase
in GP observed in silt loam and a general decrease observed in silty clay loam
compared to control, implying different types of GP present in each soil. In general,
no significant increases were observed for the stress indicators used in the
analyses, although a common increase was observed when compared to the
control. The application of surfactants at two different rates, herbicides and
combination treatments showed varying changes relative to non-treated controls
among the different biomarkers analyzed in the study.
Although most changes were not significantly affected by different treatments
applied, the application of relatively small quantities of chemicals, which represented
actual field rates, to soils affected the expression of treatment effects observed in
the study. The use of PLFA profiles indicated that the microbial community
responded to changes due to surfactants and herbicide treatments applied and
117
these differences due to treatment were greater for the microbial groups in the silt
loam. The treatments had much less of an impact with the silty clay. These results
show some changes in the microbial populations with additions of herbicides and
surfactants, but these changes varied with soil texture and were only for a short-term
incubation study and one application of the compounds. Further long-term studies
are needed that investigate the effect of multiple applications of herbicides and
surfactants and multiple years on the microbial community.
118
REFERENCES
Acosta-Martínez, V., Dowd, S., Sun, Y., Wester, D., and Allen, V. (2010). Pyrosequencing analysis for characterization of soil bacterial populations as affected by an integrated livestock-cotton production system. Applied Soil Ecology 45, 13–25.
Ahrens, W.A. (1994). Herbicide handbook. Seventh Edition. Champaign, IL: Weed Science Society of America, 352.
Bååth, E., Frostegård A., and Fritze, H. (1992). Soil bacterial biomass, activity, phospholipid fatty acid pattern, and pH tolerance in an area polluted with alkaline dust deposition. Applied and Environmental Microbiology 58, 4026–4031.
Bååth, E. (2003). The use of neutral lipid fatty acids to indicate the physiological
conditions of soil fungi. Microbial Ecology 45, 373-383.
Bailey, V. L., Peacock, A. D., Smith, J. L., and Bolton, H. Jr. (2002). Relationships between soil microbial biomass determined by chloroform fumigation-extraction, substrate-induced respiration, and phospholipid fatty acid analysis. Soil Biology and Biochemistry 34, 1385-1389.
Balser, T. C., Treseder, K. K., and Ekenler, M. (2005). Using lipid analysis and hyphal length to quantify AM and saprotrophic fungal abundance along a soil chronosequence. Soil Biology and Biochemistry 37, 601–604.
Barja, B.C., and dos Santos Afonso, M. (2005). Aminomethylphosphonic acid and
glyphosate adsorption onto goethite: A comparative study. Environmental
Science and Technology 39, 585-592.
Beigel C., Charnay M. P. and Barriuso E. (1999). Degradation of formulated and
unformulated triticonazole fungicide in soil: effect of application rate. Soil
Biology and Biochemistry 31, 525-534.
Belen Hinojosa, M., Carreira, J.A., Garcia-Ruiz, R., and Dick, R.P. (2005). Microbial response to heavy metal-polluted soils: community analysis from phospholipid-linked fatty acids and ester-linked fatty acids extracts. Journal of Environmental Quality 34, 1789–1800.
Bittman, S., Forge, T. A., and Kowalenko, C. G. (2005). Responses of the bacterial and fungal biomass in a grassland soil to multi-year applications of dairy manure slurry and fertilizer. Soil Biology and Biochemistry 37, 613–623.
119
Bligh, E. G., and Dyer, W. J. (1959). A rapid method of total lipid extraction and purification. Canadian Journal of Biochemistry and Physiology 37, 911–917.
Bossio, D.A., Scow, K.M., (1998). Impacts of carbon and flooding on soil microbial
communities: phospholipid fatty acid profiles and substrate utilization
patterns. Microbial Ecology 35, 265–278.
Brimecombe, M. J., De Leij, F. A. and Lynch, J. M.. (2001). The effect of root exudates on rhizosphere microbial populations, 95–140. In R. Pinton, Z.Varanini, and P. Nannipieri (ed.), The rhizosphere: biochemistry and organic substances at the soil-plant interface. Marcel-Dekker, Inc., New York, N.Y.
Bossio, D.A., and Scow, K.M. (1998). Impacts of carbon and flooding on soil microbial communities: phospholipid fatty acid profiles and substrate utilization patterns. Microbial Ecology 35, 265-278.
Buchholz, D. D., Brown, J. R., Crocker, D. K., Garret, J. D., Hanson, R. G., Lory, J. A., Nathan, M. V., Scharf , P. C., and Wheaton, H. N. (1983). Soil test interpretations and recommendations handbook. Revised 5/2004 ed. University of Missouri, College of Agriculture, Department of Agronomy, Columbia.
Buhler D. D, Randall, G. W, Koskinen, W. C and Wyse, D. L. (1993). Atrazine and alachlor losses from subsurface tile drainage of clay loam soil. Journal of Environmental Quality 22, 583–588.
Cavigelli, A. C., Robertson, P. G., and Klug, M. J. (1995). Fatty acid methyl ester (FAME) profiles as measure of soil microbial community structure. Plant and Soil 170, 99–113.
Carlisle, S. M., and Trevors, T. J. (1986). Effect of the herbicide gylphosate on respiration and hydrogen consumption in soil. Water Air and Soil Pollution 27, 391-401.
Crouzet, O., Batisson, I., Besse-Hoggan, P., Bardot, C., Poly, F., Bohatier, J., and Mallet, C. (2010). Soil Biology & Biochemistry Response of soil microbial communities to the herbicide mesotrione: A dose-effect microcosm approach. Soil Biology and Biochemistry 42, 193-202.
Dick, R., Lorenz, N., Wojno, M., and Lane, M. (2010). Microbial dynamics in soils under long-term glyphosate tolerant cropping systems. Proceedings 19th World Congress of Soil Science, Brisbane, Australia.
El Fantroussi, S., Verschuere, L., Verstraete, W. and Top, E.M. (1999) Effect of phenylurea herbicides on soil microbial communities estimated by analysis of 16S rRNA gene fingerprints and community-level physiological profiles. Applied Environmental Microbioly 65, 982-988.
120
Fang, M., Kremer, R. J., Motavalli, P. P., and Davis, G. (2005). Bacterial Diversity in Rhizospheres of Nontransgenic and Transgenic Corn. Applied and
Environmental Microbiology 71, 4132-4136.
Federle, T. W., (1986). Microbial distribution in soil. In: Megusar, F.,Gantar, M. (Eds.),. Perspectives in Microbial Ecology, Slovene Society for Microbiology, 493–498.
Fierer, N., Schimel J. P., and Holden P. A. (2003). Variations in microbial community composition through two soil depth profiles. Soil Biology and Biochemistry 35, 167-176.
Frostegård, A., Bååth, E., and Tunlid, A. (1993). Shifts in the structure of soil microbial communities in limed forests as revealed by phospholipid fatty-acid analysis. Soil Biology and Biochemistry 25, 723–730.
Frostegård, A., and Bååth, E. (1996). The use of phospholipid fatty acid analysis to estimate bacterial and fungal biomass in soil. Biology and Fertility of Soils 22, 59-65.
Girvan, M. S., Bullimore, J., Pretty, J. N., Osborn, A. M., and Ball. A. S. (2003). Soil type is the primary determinant of the composition of the total and active bacterial communities in arable soils. Applied and Environmental Microbiology 69, 1800–1809.
Grigera, M., Drijber, R., Shores-Morrow, R., and Wienhold, B. (2007). Distribution of the arbuscular mycorrhizal biomarker C16:1cis11 among neutral, glyco and phospholipids extracted from soil during the reproductive growth of corn. Soil Biology and Biochemistry 39, 1589-1596.
Haney, R., Senseman, S. A., Hons, F., and Zuberer, D. A. (2000). Effect of glyphosate on soil microbial activity and biomass. Weed Science 48, 89-93.
Heipieper, H. J., Meulenbeld, G., Oirschot, Q. V. and de Bont, J.A. M. (1996). Effect of environment factors on trans/cis ratio of unsaturated fatty acids in Pseudomonas putida S12. Applied Environmental Microbiology 62, 2773–2777.
Ibekwe, A. M., and Kennedy A. C. (1998). Phospholipid fatty acid profiles and carbon utilization patterns for analysis of microbial community structure under field and greenhouse conditions. FEMS Microbiology Ecology 26, 151-163.
Jenkinson D. S. and Powlson D. S. (1976b). The effects of biocidal treatments on metabolism in soil – V. A method of measuring soil biomass. Soil Biology and Biochemistry 8, 209-213.
Jolliffe, I. T. (1986). Principal Component Analysis. Springer-Verlag, New York, NY.
121
Khattree, R., and Naik, D.N. (1999). Applied multivariate statistics with SAS® software. Second Edition, Cary, NC. SAS Institute, Inc.
Kieft, T.L., Ringelberg, D.B., and White, D.C. (1994). Changes in esterlinked phospholipid fatty acid profiles of subsurface bacteria during starvation and desiccation in a porous medium. Applied and Environmental Microbiology 60, 3292–3299.
Krogh, K.A., Halling-Sorensen, B., Mogensen, B. B., and Vejrup, K. V. (2003). Environmental properties and effects of nonionic surfactant adjuvants in pesticides: a review. Chemosphere 50, 871–901.
Leckie, S. E. (2005). Methods of microbial community profiling and their application to forest soils. Forest Ecology and Management 220, 88–106.
Li, K. B., Cheng, J. T., Wang, X. F., Zhou, Y. and Liu, W. P. (2008). Degradation of herbicides atrazine and bentazone applied alone and in combination in soils. Pedosphere 18, 265-272.
Liu, Zhiqian. (2004). Effects of surfactants on foliar uptake of herbicides – a complex
scenario. Colloids and Surfaces B: Biointerfaces 35, 149-153.
Lory, J., Scharf, P., and Nathan, M. (1998). Interpreting Missouri soil test reports. MU Guide G9112. University of Missouri, Columbia, MO.
Lupwayi, N.Z., Brandt, S.A., Harker, K.N., O'Donovan, J.T., Clayton, G.W., and Turkington, T.K. (2010). Contrasting soil microbial responses to fertilizers and herbicides in a canola-barley rotation. Soil Biology and Biochemistry, 42, 1997-2004.
Madan, R., Pankhurst , C., Hawke, B., and Smith, S. (2002). Use of fatty acids for the identification of AM fungi and the estimation of the biomass of AM spores. Soil Biology and Biochemistry 34,125-128.
Marschner, P., Yang, C. H., Lieberei, R., and Crowley D.E. (2001). Soil and plant
specific effects on bacterial community composition in the rhizosphere. Soil
Biology and Biochemistry 33, 1437-1445.
Nye, J. V., Guerin, W. F., and Boyd, S. A. (1994). Heterotrophic activity of microorganisms in soils treated with quaternary ammonium compounds. Environmental Science and Technology 28, 225-237.
O‟Leary, W. M., and Wilkinson, S. G. (1988). Gram positive bacteria. Pages 117–202 in C. Ratlidge and S. G. Wilkinson, editors, Microbial lipids Vol. 1. Academic Press, London, UK.
122
Olsson, P. (1999). Signature fatty acids provide tools for determination of the distribution and interactions of mycorrhizal fungi in soil. FEMS Microbiology Ecology 29, 303-310.
Pennanen, T., Frostegård, Å., Fritze, H., and Bååth, E. (1996). Phospholipid Fatty Acid Composition and Heavy Metal Tolerance of Soil Microbial Communities along Two Heavy Metal-Polluted Gradients in Coniferous Forests. Applied and Environmental Microbiology, 62, 420-428.
Pessagno, R. C., Torres Sanchez, R. M., and dos Santos Afonso, M. (2008).
Glyphosate behavior at soil and mineral - water interfaces. Environmental
Pollution, 53–59.
Petersen, S. O., and Klug, M. J. (1994). Effects of sieving, storage, and incubation temperature on the phospholipid fatty acid profile of a soil microbial community. Applied and Environmental Microbiology 60, 2421–2430.
Petersen, S. O., Frohne, P., and Kennedy, A. C. (2002). Dynamics of a soil microbial community under spring wheat. Soil Science Society of America journal 66, 826-833.
Pipke, R., Amrhein, N., Jacob, G. S., Schaefer, J., and Kishore, G. M. (1987). Metabolism of glyphosate in an Arthrobacter sp. GLP-1. European Journal of Biochemistry 165, 267-273.
Podoll. R.T., Irwin, K.C., and Brendlinger, S (1987). Sorption of water-soluble oligomers on sediments. Environmental Science and Technology 21, 562-568.
Ratcliff, A. W., Busse, M. D., and Shestak, C. J. (2006). Changes in microbial community structure following herbicide (glyphosate) additions to forest soils. Applied Soil Ecology 34, 114-124.
Ratledge, C., and Wilkinson, S. G. (1988). Microbial Lipids, volume 1. London: Academic Press.
Ray, A. B., Ma, J., and Borst, M. (1995). Adsorption of surfactants on clays. Hazardous Waste and Hazardous Materials 12, 357-364.
Sannino F., and Gianfreda L. (2001). Pesticide influence on soil enzymatic
activities. Chemosphere 45, 417–425.
Sarkar, B., Patra, A., Purakayastha, T., and Megharaj, M. (2009). Assessment of biological and biochemical indicators in soil under transgenic Bt and non-Bt cotton crop in a sub-tropical environment. Environmental Monitoring and Assessment 156, 595-604.
123
Satsuma, Koji. (2009). Complete biodegradation of atrazine by a microbial community isolated from a naturally derived river ecosystem (microcosm). Chemosphere 77, 590–596.
SAS Institute. (2002). SAS/STAT User‟s Guide: Statistics. Version 8. SAS Institute, Cary, NC.
Schmalenberger, A., and Tebbe, C. C. (2002). Bacterial community composition in the rhizosphere of a transgenic, herbicide-resistant maize (Zea mays) and comparison to itsnon-transgenic cultivar Bosphore. FEMS Microbiology Ecology, 40, 29-37.
Schramm, L.L. (2001). Surfactants. Fundamentals and Applications in the Petroleum Industry. Journal of Petroleum Science and Engineering 30, 258-259.
Seeger, M., Hernández, M., Méndez, V., Ponce, B., Córdova., M., and González, M. (2010). Bacterial Degradation and bioremediation of chlorinated herbicides and biphenyls. Journal Soil Science and Plant Nutrition 10, 320-332.
Seghers, D., Verthe, K., Reheul, D., Bulcke, B., Siciliano, S., Verstraete, W., and Top, E. M. (2003). Effect of long-term herbicide applications on the bacterial community structure and function in an agricultural soil. FEMS Microbiology Ecology 46, 139-146.
Smith, A. E., and Hayden, B. J. (1982). Carry-over of dinitramine, triallate, and trifluralin to the following spring in soils treated at different times during the fall. Bulletin of Environmental Contamination and Toxicology 29, 483-486.
Smith, J.L. (1994). Cycling of nitrogen through microbial activity. 91–120. In J.L.Hatfield and B.A. Stewart (ed.) Soil biology: Effects on soil quality. Advances in Soil Science, Lewis Publ., Boca Raton, Florida.
Strong, L. C., Rosendahl, C., Johnson, G., Sadowsky, M. J., and Wackett, L. P. (2002). Arthrobacter aurescens TC1 metabolizes diverse s-triazine ring compounds. Applied and Environmental Microbiology 68, 1358-1366.
Sundh, I., Nilsson, M., and Borga, P. (1997). Variation in microbial community structure in two boreal peatlands as determined by analysis of phospholipid fatty acid profiles. Applied and Environmental Microbiology 63, 1476-1482.
Tabachnick, B. G., and Fidell, L. S. (2001). Using multivariate statistics (4th ed.). Needham Heights, MA: Allyn & Bacon.
Toyota, K., Ritz, K., Kuninaga, S., and Kimura, M. (1999) Impacts of fumigation with
meta-sodium upon soil microbial community structure in two Japanese soils.
Soil Science and Plant Nutrition 45, 207–223.
124
Turco, R. F., Kennedy, A. C., and Jawson, M. D. (1994). Microbial indicators of soil quality. In Defining soil quality for a sustainable environment. Eds. J W Doran, D C Coleman, D F Bezdicek and B A Steward. pp. 73–90. Soil Science Society of America Journal Special Publication 35, Madison, WI.
Vestal, J. R., and White, D.C. (1989). Lipid analysis in microbial ecology. Bioscience 39, 535–541.
Wander, M. M., Hedrick, D. S., Kaufman, D., Traina, S. J., Stinner, B. R., Kehrmeyer, S. R., and White, D. C. (1995). The functional significance of the microbial biomass in organic and conventionally managed soils. In: Collins, H.P., Robertson, G.P., Klug, M.J. (Eds.), The Significance and Regulation of Soil Biodiversity. Kluwer Academic Publishers, Netherlands, 87–97.
Wardle, D., and Ghani, A., (1995). Why is the strength of relationships between pairs of methods for estimating soil microbial biomass often so variable? Soil Biology and Biochemistry 27, 821–828.
Weber, J.B., Best, J.A. and Gonese, J.U., (1993), Bioavailability and bioactivity of
sorbed organic chemicals. In: Luxmore, R.J. and Peterson, G.A. (eds.),
Sorption and Degradation of Pesticides and Organic Chemicals in Soil. Soil
Science Society of America, Madison, 153−196.
Wilkinson, S. C., Anderson, J. M., Scardelis, S. P., Tisiafouli, M., Taylor, A., and Wolters, V. (2002). PLFA profiles of microbial communities in decomposing conifer litters subject to moisture stress. Soil Biology and Biochemistry 34, 198-200.
Ying, G. G. (2006). Fate, behavior and effects of surfactants and their degradation products in the environment. Environment International 32, 417-431.
Zablotowicz, R. M., Weaver, M. A., and Locke, M. A. (2002). In: 10th Intl. Congress on the Chemistry of Crop Protection Abstr. 5a.47.
Zelles, L. (1999). Fatty acid patterns of phospholipids and lipopolysaccharides in the characterisation of microbial communities in soil: a review. Biology and Fertility of Soils 29, 111-129.
Zelles, L., Bai, Q.Y., Rackwitz, R., Chadwick, D., and Beese, F. (1995). Determination of phospholipid- and lipopolysaccharide-derived fatty acids as an estimate of microbial biomass and community structures in soils. Biology and Fertility of Soils 19, 115–123.
125
TABLES AND FIGURES
Table 5.1a. Soil properties for silt loam and silty clay loam
Textural class pH
(CaCl2) OM %
Tot.org. C %
CEC cmolc kg-1
Tot. N
mg kg-1
Bray 1 P
mg kg-1
Exc. K
mg kg-1
Exc. Ca
mg kg-1
Exc. Mg
mg kg-1
Silt loam 5.61 2.18 1.27 12.4 0.122 47.08 107 1214 233
Silty clay loam 4.52 1.89 1.10 22.2 0.096 1.34 57 1524 252
*Abbreviation: Exc., exchangeable; org., organic; tot., total.
12
5
126
Table 5.1b. Chemicals used and treatment rates applied to pots in greenhouse experiment (L ha-1)
Treatment rates
Treatments Surfactant Surfactant x 2 Herbicide Surfactant + Herbicide
Activator-90 0.02 ml 0.04 ml
Glyphosate 0.0065 ml
Activator-90 + Glyphosate 0.02 ml + 0.0065 ml
Agridex 0.02 ml 0.04 ml
Atrazine 0.0167 ml
Agri-Dex + Atrazine 0.02 ml + 0.0167 ml
Thrust 0.01 g 0.02 g
Bentazon 0.0083 ml
Thrust + Bentazon 0.01 g + 0.0083 ml
Control 0 0 0 0
12
6
127
Table 5.1c. Phospholipid fatty acids used as biomarkers for microorganisms.
Indicates Reference PLFA biomarker
Bacteria Vestal and White, 1989 12:0 3OH, i14:0, 15:0, a15:0, i15:0, i15:0 g, cyc15:1, i16:0, 16:1 7,
cis16:1 7, trans16:1v7, a17:0, cyc17:0, i17:0, 17:1 6, i17:1 7, 18:1
7, cis18:1 7, cis18:1 9, cyc19:0, cyc19:0, C11-12, cyc19:0, cis19:1 9
Fungi Federle, 1986 Wander et al., 1995 Zelles et al., 1995 Frostegard et al., 1993 Sundh et al., 1997
16:1 5, cis16:1 5, 18:1 9, 18:2 6, cis18:2 6, 18:2 9, 18:3 3,
18:3 6, cis18:3 6
Gram-positive O‟Leary and Wilkinson, 1988 Wander et al., 1995 Zelles et al., 1995 Sundh et al., 1997
i14:0, i15:0, a15:0, i15:0 g, i16:0, i17:0, cis18:1 9
Gram-negative Ratledge and Wilkinson, 1988 Wander et al., 1995 Zelles et al., 1995 Sundh et al., 1997
15:1 6c, cis16:1v7t, cy17:0, cis18:1v7; cy19:0, cyc19:0, cis19:1v9
Ratio of Cyclopropyl and monoenoic fatty acid (stress indicator)
Kieft et al., 1997 Bossio and Scow, 1998 Fierer et al., 2003
cyc17:0 to cis16:1 7 and cyc19:0 to cis18:1 7
Total saturated to total monounsaturated fatty acid
Bossio and Scow, 1998 cis16:1 11, cis16:1 9, cis16:1 7, cis16:1 5, cis17:1 9, cis17:1v8,
cis17:1v7, and cis17:1 5,14:0, 15:0, 16:0, 17:0, 18:0, 20:0
12
7
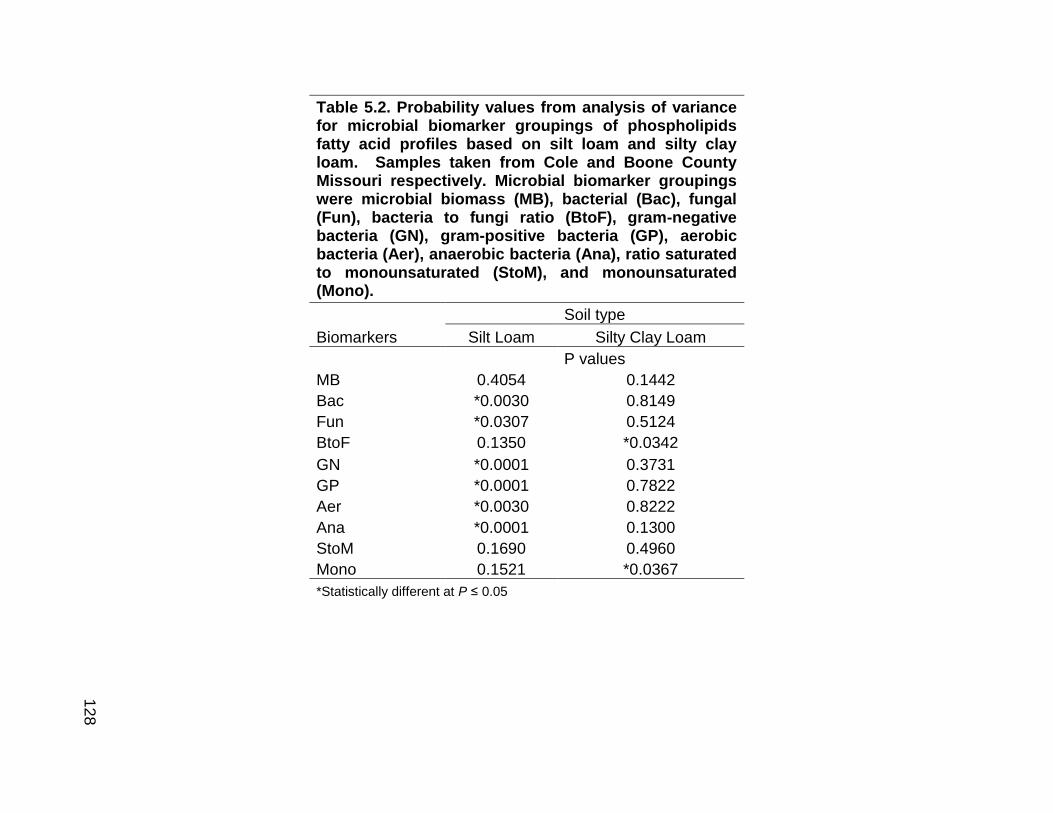
128
Table 5.2. Probability values from analysis of variance for microbial biomarker groupings of phospholipids fatty acid profiles based on silt loam and silty clay loam. Samples taken from Cole and Boone County Missouri respectively. Microbial biomarker groupings were microbial biomass (MB), bacterial (Bac), fungal (Fun), bacteria to fungi ratio (BtoF), gram-negative bacteria (GN), gram-positive bacteria (GP), aerobic bacteria (Aer), anaerobic bacteria (Ana), ratio saturated to monounsaturated (StoM), and monounsaturated (Mono).
Soil type
Biomarkers Silt Loam Silty Clay Loam
P values
MB 0.4054 0.1442
Bac *0.0030 0.8149
Fun *0.0307 0.5124
BtoF 0.1350 *0.0342
GN *0.0001 0.3731
GP *0.0001 0.7822
Aer *0.0030 0.8222
Ana *0.0001 0.1300
StoM 0.1690 0.4960
Mono 0.1521 *0.0367
*Statistically different at P ≤ 0.05
12
8
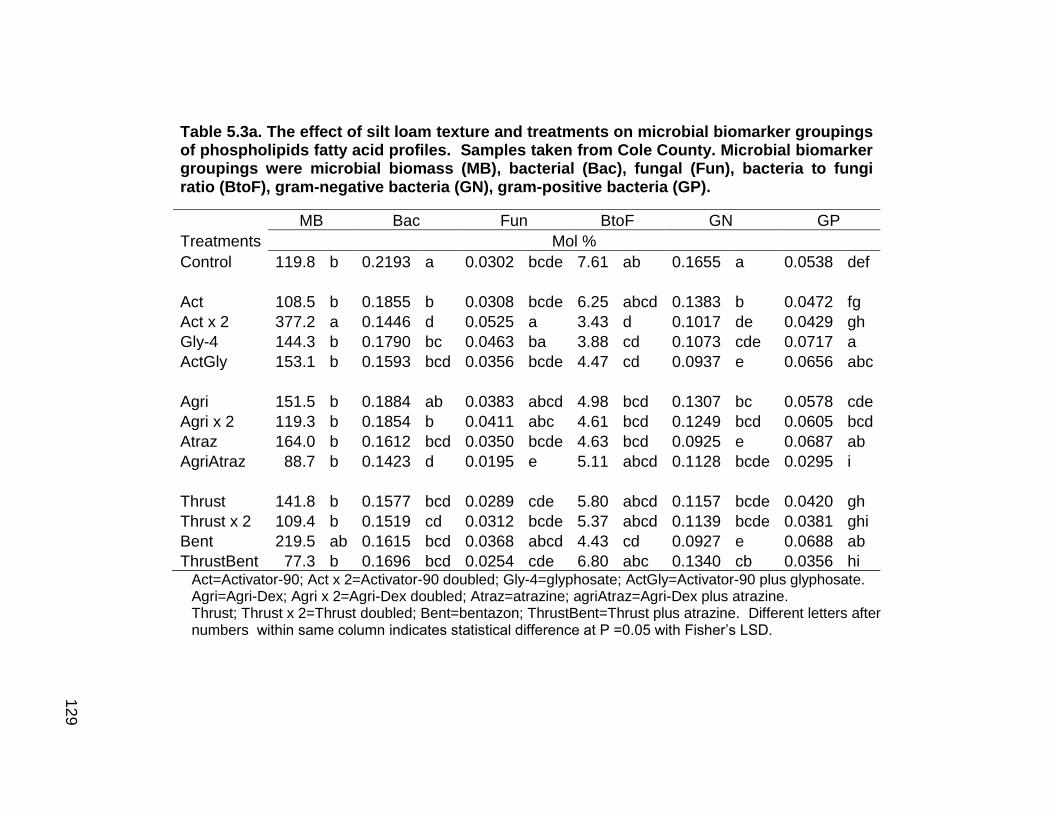
129
Table 5.3a. The effect of silt loam texture and treatments on microbial biomarker groupings of phospholipids fatty acid profiles. Samples taken from Cole County. Microbial biomarker groupings were microbial biomass (MB), bacterial (Bac), fungal (Fun), bacteria to fungi ratio (BtoF), gram-negative bacteria (GN), gram-positive bacteria (GP).
MB Bac Fun BtoF GN GP
Treatments Mol %
Control 119.8 b 0.2193 a 0.0302 bcde 7.61 ab 0.1655 a 0.0538 def
Act 108.5 b 0.1855 b 0.0308 bcde 6.25 abcd 0.1383 b 0.0472 fg
Act x 2 377.2 a 0.1446 d 0.0525 a 3.43 d 0.1017 de 0.0429 gh
Gly-4 144.3 b 0.1790 bc 0.0463 ba 3.88 cd 0.1073 cde 0.0717 a
ActGly 153.1 b 0.1593 bcd 0.0356 bcde 4.47 cd 0.0937 e 0.0656 abc
Agri 151.5 b 0.1884 ab 0.0383 abcd 4.98 bcd 0.1307 bc 0.0578 cde
Agri x 2 119.3 b 0.1854 b 0.0411 abc 4.61 bcd 0.1249 bcd 0.0605 bcd
Atraz 164.0 b 0.1612 bcd 0.0350 bcde 4.63 bcd 0.0925 e 0.0687 ab
AgriAtraz 88.7 b 0.1423 d 0.0195 e 5.11 abcd 0.1128 bcde 0.0295 i
Thrust 141.8 b 0.1577 bcd 0.0289 cde 5.80 abcd 0.1157 bcde 0.0420 gh
Thrust x 2 109.4 b 0.1519 cd 0.0312 bcde 5.37 abcd 0.1139 bcde 0.0381 ghi
Bent 219.5 ab 0.1615 bcd 0.0368 abcd 4.43 cd 0.0927 e 0.0688 ab
ThrustBent 77.3 b 0.1696 bcd 0.0254 cde 6.80 abc 0.1340 cb 0.0356 hi Act=Activator-90; Act x 2=Activator-90 doubled; Gly-4=glyphosate; ActGly=Activator-90 plus glyphosate. Agri=Agri-Dex; Agri x 2=Agri-Dex doubled; Atraz=atrazine; agriAtraz=Agri-Dex plus atrazine. Thrust; Thrust x 2=Thrust doubled; Bent=bentazon; ThrustBent=Thrust plus atrazine. Different letters after numbers within same column indicates statistical difference at P =0.05 with Fisher‟s LSD.
12
9
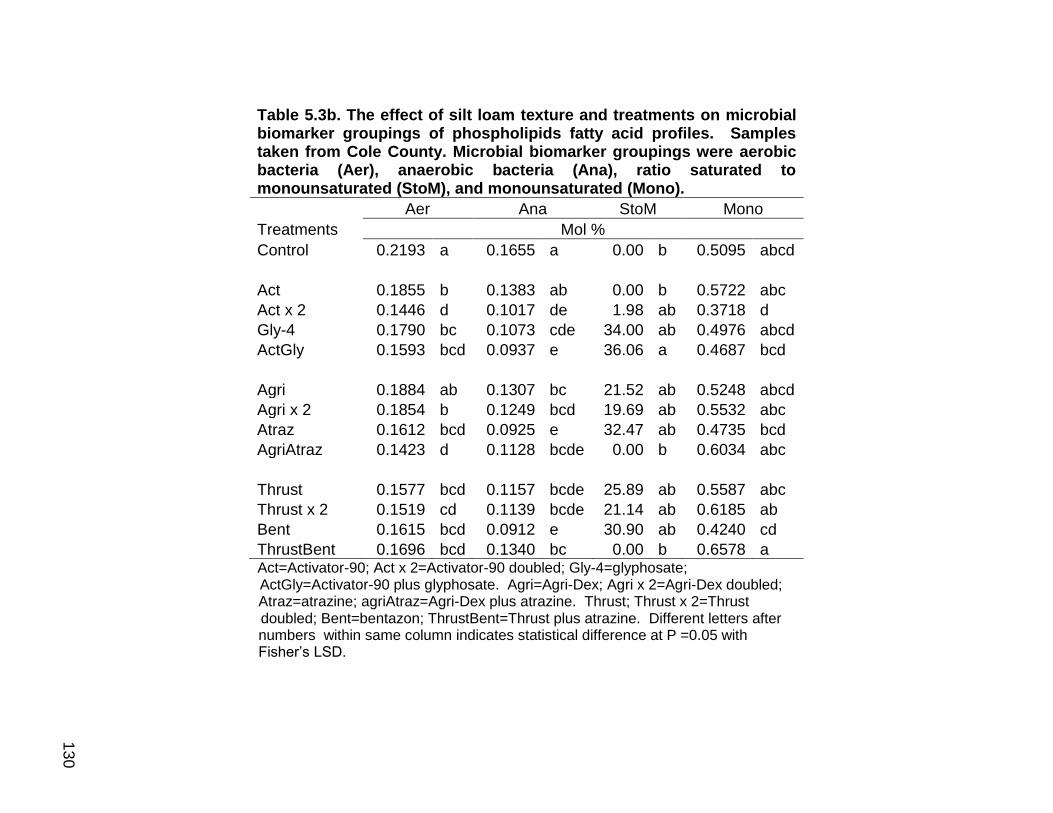
130
Table 5.3b. The effect of silt loam texture and treatments on microbial biomarker groupings of phospholipids fatty acid profiles. Samples taken from Cole County. Microbial biomarker groupings were aerobic bacteria (Aer), anaerobic bacteria (Ana), ratio saturated to monounsaturated (StoM), and monounsaturated (Mono).
Aer Ana StoM Mono
Treatments Mol %
Control 0.2193 a 0.1655 a 0.00 b 0.5095 abcd
Act 0.1855 b 0.1383 ab 0.00 b 0.5722 abc
Act x 2 0.1446 d 0.1017 de 1.98 ab 0.3718 d
Gly-4 0.1790 bc 0.1073 cde 34.00 ab 0.4976 abcd
ActGly 0.1593 bcd 0.0937 e 36.06 a 0.4687 bcd
Agri 0.1884 ab 0.1307 bc 21.52 ab 0.5248 abcd
Agri x 2 0.1854 b 0.1249 bcd 19.69 ab 0.5532 abc
Atraz 0.1612 bcd 0.0925 e 32.47 ab 0.4735 bcd
AgriAtraz 0.1423 d 0.1128 bcde 0.00 b 0.6034 abc
Thrust 0.1577 bcd 0.1157 bcde 25.89 ab 0.5587 abc
Thrust x 2 0.1519 cd 0.1139 bcde 21.14 ab 0.6185 ab
Bent 0.1615 bcd 0.0912 e 30.90 ab 0.4240 cd
ThrustBent 0.1696 bcd 0.1340 bc 0.00 b 0.6578 a Act=Activator-90; Act x 2=Activator-90 doubled; Gly-4=glyphosate;
ActGly=Activator-90 plus glyphosate. Agri=Agri-Dex; Agri x 2=Agri-Dex doubled; Atraz=atrazine; agriAtraz=Agri-Dex plus atrazine. Thrust; Thrust x 2=Thrust
doubled; Bent=bentazon; ThrustBent=Thrust plus atrazine. Different letters after numbers within same column indicates statistical difference at P =0.05 with Fisher‟s LSD.
13
0
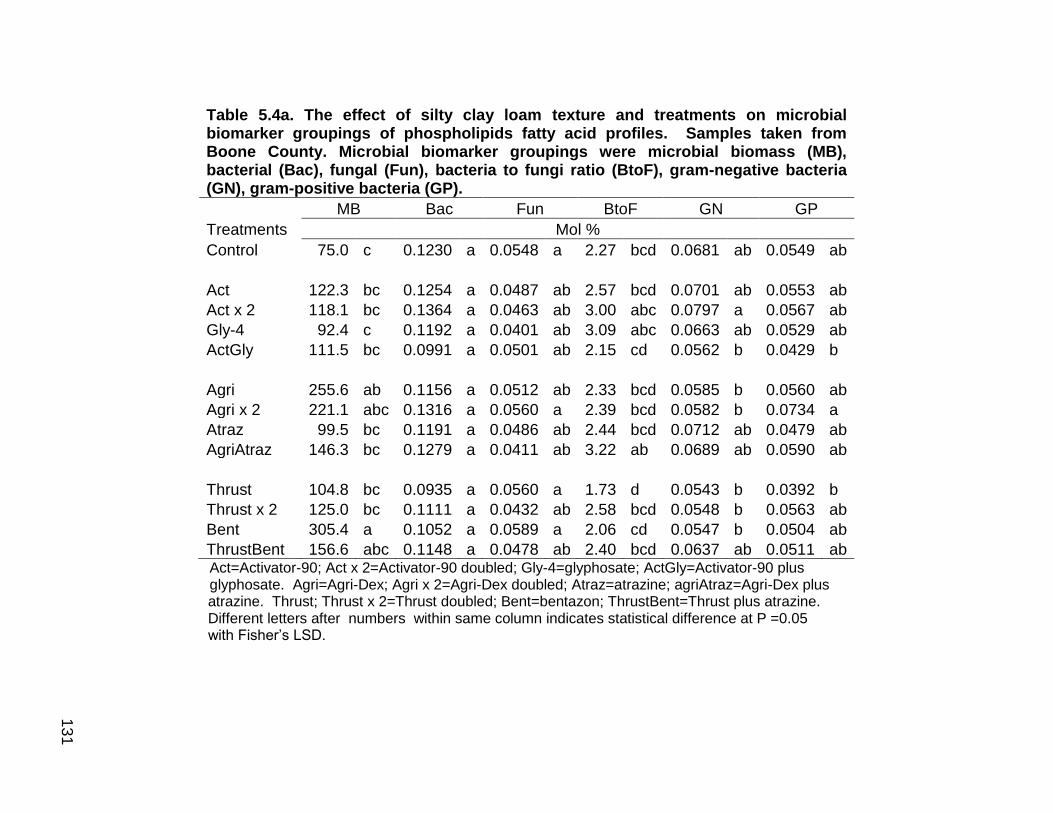
131
Table 5.4a. The effect of silty clay loam texture and treatments on microbial biomarker groupings of phospholipids fatty acid profiles. Samples taken from Boone County. Microbial biomarker groupings were microbial biomass (MB), bacterial (Bac), fungal (Fun), bacteria to fungi ratio (BtoF), gram-negative bacteria (GN), gram-positive bacteria (GP).
MB Bac Fun BtoF GN GP
Treatments Mol %
Control 75.0 c 0.1230 a 0.0548 a 2.27 bcd 0.0681 ab 0.0549 ab
Act 122.3 bc 0.1254 a 0.0487 ab 2.57 bcd 0.0701 ab 0.0553 ab
Act x 2 118.1 bc 0.1364 a 0.0463 ab 3.00 abc 0.0797 a 0.0567 ab
Gly-4 92.4 c 0.1192 a 0.0401 ab 3.09 abc 0.0663 ab 0.0529 ab
ActGly 111.5 bc 0.0991 a 0.0501 ab 2.15 cd 0.0562 b 0.0429 b
Agri 255.6 ab 0.1156 a 0.0512 ab 2.33 bcd 0.0585 b 0.0560 ab
Agri x 2 221.1 abc 0.1316 a 0.0560 a 2.39 bcd 0.0582 b 0.0734 a
Atraz 99.5 bc 0.1191 a 0.0486 ab 2.44 bcd 0.0712 ab 0.0479 ab
AgriAtraz 146.3 bc 0.1279 a 0.0411 ab 3.22 ab 0.0689 ab 0.0590 ab
Thrust 104.8 bc 0.0935 a 0.0560 a 1.73 d 0.0543 b 0.0392 b
Thrust x 2 125.0 bc 0.1111 a 0.0432 ab 2.58 bcd 0.0548 b 0.0563 ab
Bent 305.4 a 0.1052 a 0.0589 a 2.06 cd 0.0547 b 0.0504 ab
ThrustBent 156.6 abc 0.1148 a 0.0478 ab 2.40 bcd 0.0637 ab 0.0511 ab Act=Activator-90; Act x 2=Activator-90 doubled; Gly-4=glyphosate; ActGly=Activator-90 plus glyphosate. Agri=Agri-Dex; Agri x 2=Agri-Dex doubled; Atraz=atrazine; agriAtraz=Agri-Dex plus
atrazine. Thrust; Thrust x 2=Thrust doubled; Bent=bentazon; ThrustBent=Thrust plus atrazine. Different letters after numbers within same column indicates statistical difference at P =0.05 with Fisher‟s LSD.
13
1
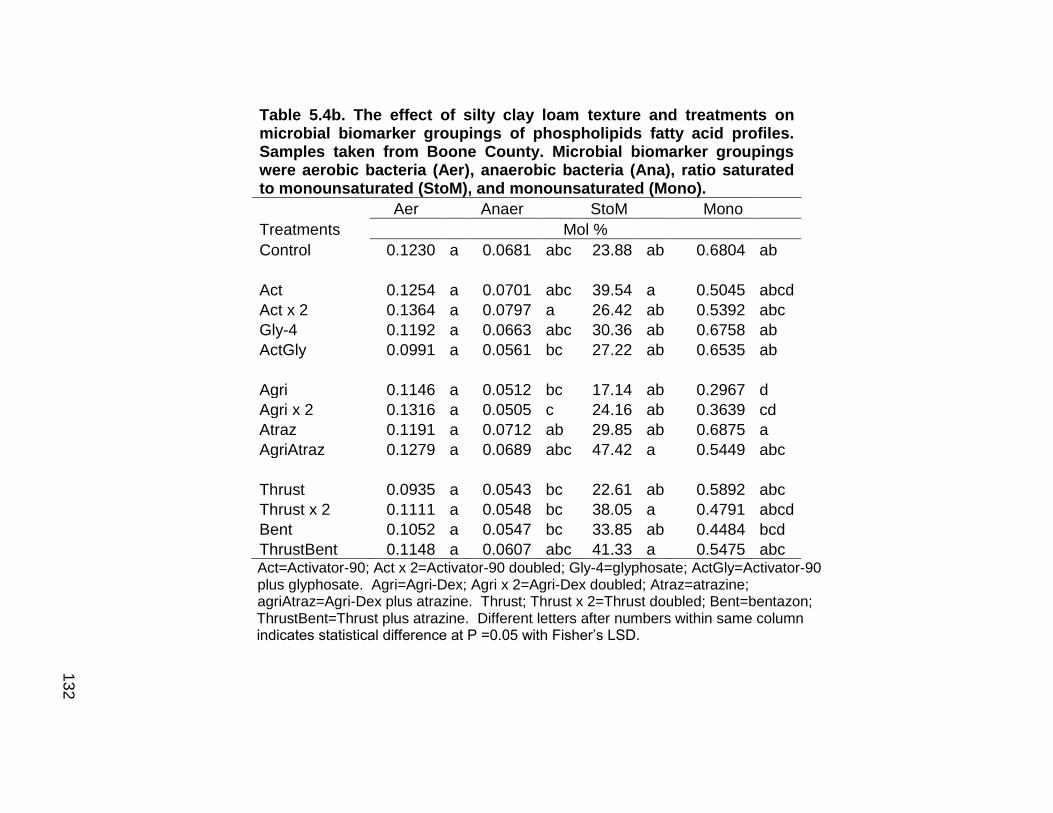
132
Table 5.4b. The effect of silty clay loam texture and treatments on microbial biomarker groupings of phospholipids fatty acid profiles. Samples taken from Boone County. Microbial biomarker groupings were aerobic bacteria (Aer), anaerobic bacteria (Ana), ratio saturated to monounsaturated (StoM), and monounsaturated (Mono).
Aer Anaer StoM Mono
Treatments Mol %
Control 0.1230 a 0.0681 abc 23.88 ab 0.6804 ab
Act 0.1254 a 0.0701 abc 39.54 a 0.5045 abcd
Act x 2 0.1364 a 0.0797 a 26.42 ab 0.5392 abc
Gly-4 0.1192 a 0.0663 abc 30.36 ab 0.6758 ab
ActGly 0.0991 a 0.0561 bc 27.22 ab 0.6535 ab
Agri 0.1146 a 0.0512 bc 17.14 ab 0.2967 d
Agri x 2 0.1316 a 0.0505 c 24.16 ab 0.3639 cd
Atraz 0.1191 a 0.0712 ab 29.85 ab 0.6875 a
AgriAtraz 0.1279 a 0.0689 abc 47.42 a 0.5449 abc
Thrust 0.0935 a 0.0543 bc 22.61 ab 0.5892 abc
Thrust x 2 0.1111 a 0.0548 bc 38.05 a 0.4791 abcd
Bent 0.1052 a 0.0547 bc 33.85 ab 0.4484 bcd
ThrustBent 0.1148 a 0.0607 abc 41.33 a 0.5475 abc Act=Activator-90; Act x 2=Activator-90 doubled; Gly-4=glyphosate; ActGly=Activator-90 plus glyphosate. Agri=Agri-Dex; Agri x 2=Agri-Dex doubled; Atraz=atrazine; agriAtraz=Agri-Dex plus atrazine. Thrust; Thrust x 2=Thrust doubled; Bent=bentazon;
ThrustBent=Thrust plus atrazine. Different letters after numbers within same column indicates statistical difference at P =0.05 with Fisher‟s LSD. 1
32
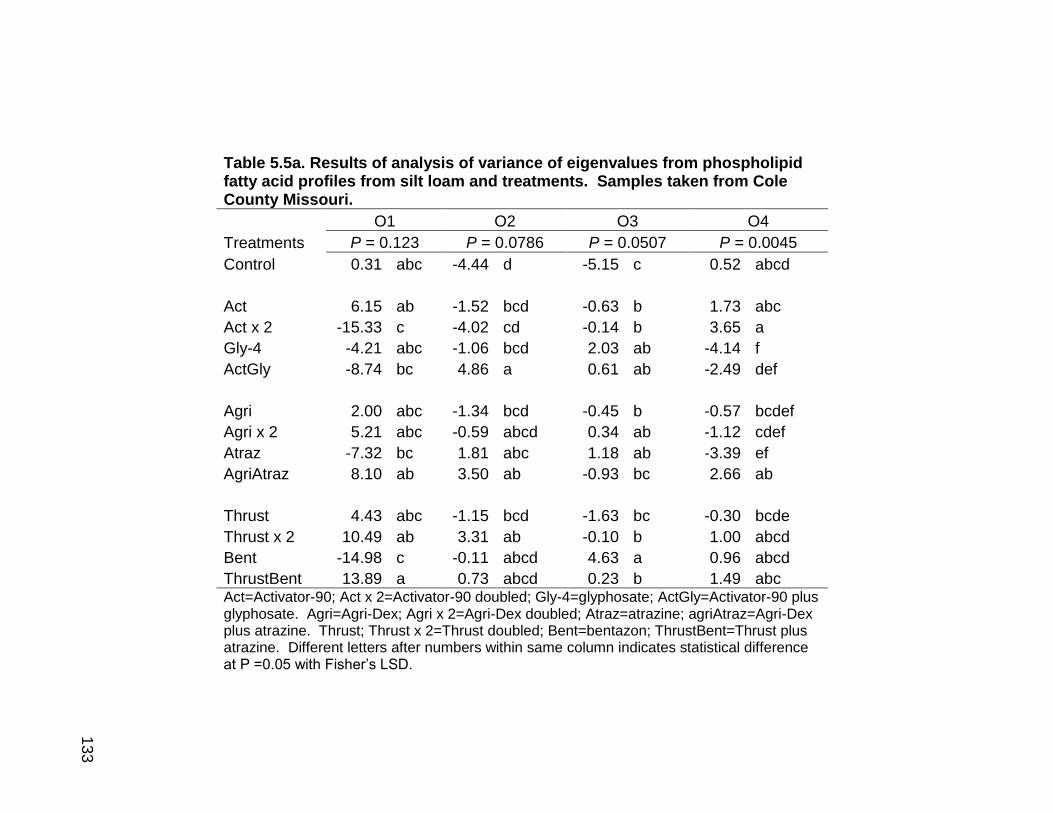
133
Table 5.5a. Results of analysis of variance of eigenvalues from phospholipid fatty acid profiles from silt loam and treatments. Samples taken from Cole County Missouri.
O1 O2 O3 O4
Treatments P = 0.123 P = 0.0786 P = 0.0507 P = 0.0045
Control 0.31 abc -4.44 d -5.15 c 0.52 abcd
Act 6.15 ab -1.52 bcd -0.63 b 1.73 abc
Act x 2 -15.33 c -4.02 cd -0.14 b 3.65 a
Gly-4 -4.21 abc -1.06 bcd 2.03 ab -4.14 f
ActGly -8.74 bc 4.86 a 0.61 ab -2.49 def
Agri 2.00 abc -1.34 bcd -0.45 b -0.57 bcdef
Agri x 2 5.21 abc -0.59 abcd 0.34 ab -1.12 cdef
Atraz -7.32 bc 1.81 abc 1.18 ab -3.39 ef
AgriAtraz 8.10 ab 3.50 ab -0.93 bc 2.66 ab
Thrust 4.43 abc -1.15 bcd -1.63 bc -0.30 bcde
Thrust x 2 10.49 ab 3.31 ab -0.10 b 1.00 abcd
Bent -14.98 c -0.11 abcd 4.63 a 0.96 abcd
ThrustBent 13.89 a 0.73 abcd 0.23 b 1.49 abc Act=Activator-90; Act x 2=Activator-90 doubled; Gly-4=glyphosate; ActGly=Activator-90 plus glyphosate. Agri=Agri-Dex; Agri x 2=Agri-Dex doubled; Atraz=atrazine; agriAtraz=Agri-Dex plus atrazine. Thrust; Thrust x 2=Thrust doubled; Bent=bentazon; ThrustBent=Thrust plus atrazine. Different letters after numbers within same column indicates statistical difference at P =0.05 with Fisher‟s LSD.
13
3

134
Table 5.5b. Results of analysis of variance of eigenvalues from phospholipid fatty acid profiles from silty clay loam and treatments. Samples taken from Boone County Missouri.
O1 O2 O3 O4
Treatments P = 0.1048 P = 0.0856 P = 0.7286 P = 0.7128
Control -15.41 c 2.11 ab 0.84 ab -0.03 a
Act 1.44 abc -3.09 abc -1.10 ab 1.07 a
Act x 2 -3.19 bc -5.23 abc -0.85 ab -0.65 a
Gly-4 -4.18 bc 3.63 ab -1.60 ab -0.34 a
ActGly -10.74 c 5.79 a 0.78 ab -1.59 a
Agri 28.32 a 6.43 a -1.06 ab 1.84 a
Agri x 2 21.79 ab 3.20 ab -0.35 ab 2.47 a
Atraz -15.62 c 2.26 ab 0.51 ab 0.30 a
AgriAtraz 0.28 abc -7.84 bc -3.45 b -0.48 a
Thrust 7.79 abc 5.87 a 1.45 ab -1.12 a
Thrust x 2 -2.45 bc -5.32 abc 0.07 ab -1.26 a
Bent 7.74 abc -10.34 c 4.02 a -0.91 a
ThrustBent -1.34 bc -5.48 abc 0.05 ab -1.31 a Act=Activator-90; Act x 2=Activator-90 doubled; Gly-4=glyphosate; ActGly=Activator-90 plus glyphosate. Agri=Agri-Dex; Agri x 2=Agri-Dex doubled; Atraz=atrazine; agriAtraz=Agri-Dex plus atrazine. Thrust; Thrust x 2=Thrust doubled; Bent=bentazon; ThrustBent=Thrust plus
atrazine. Different letters after numbers within same column indicates statistical difference at P =0.05 with Fisher‟s LSD.
13
4
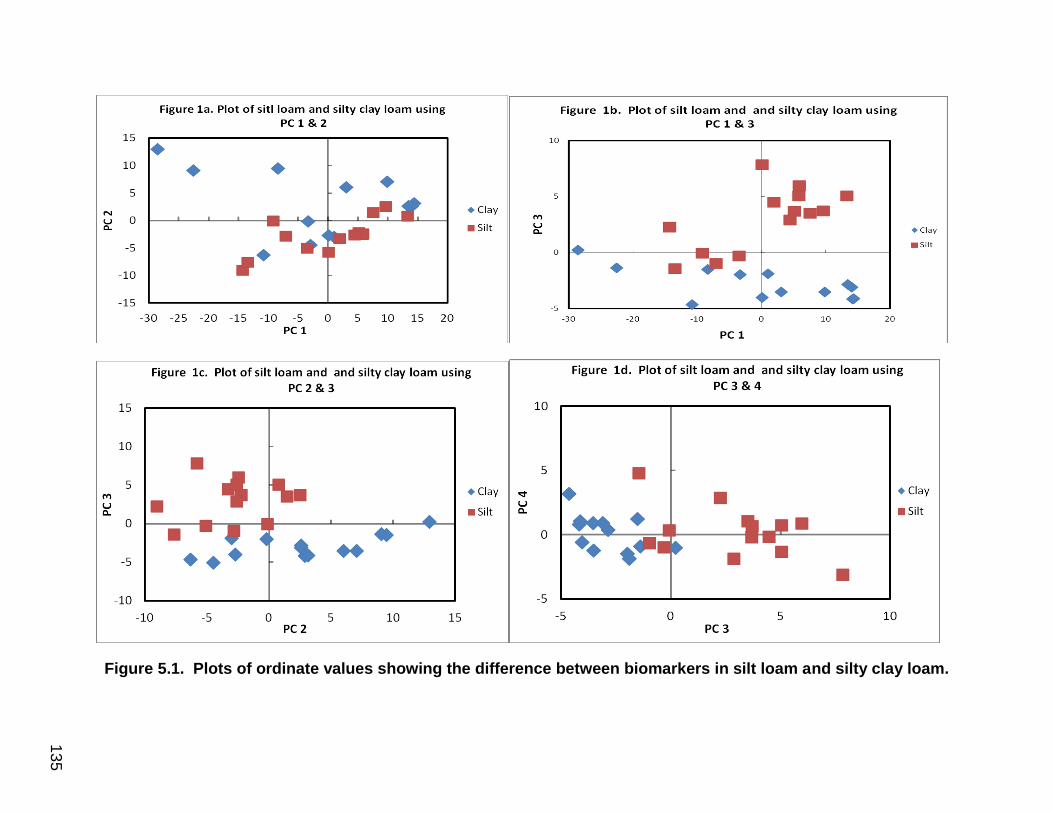
135
Figure 5.1. Plots of ordinate values showing the difference between biomarkers in silt loam and silty clay loam.
13
5
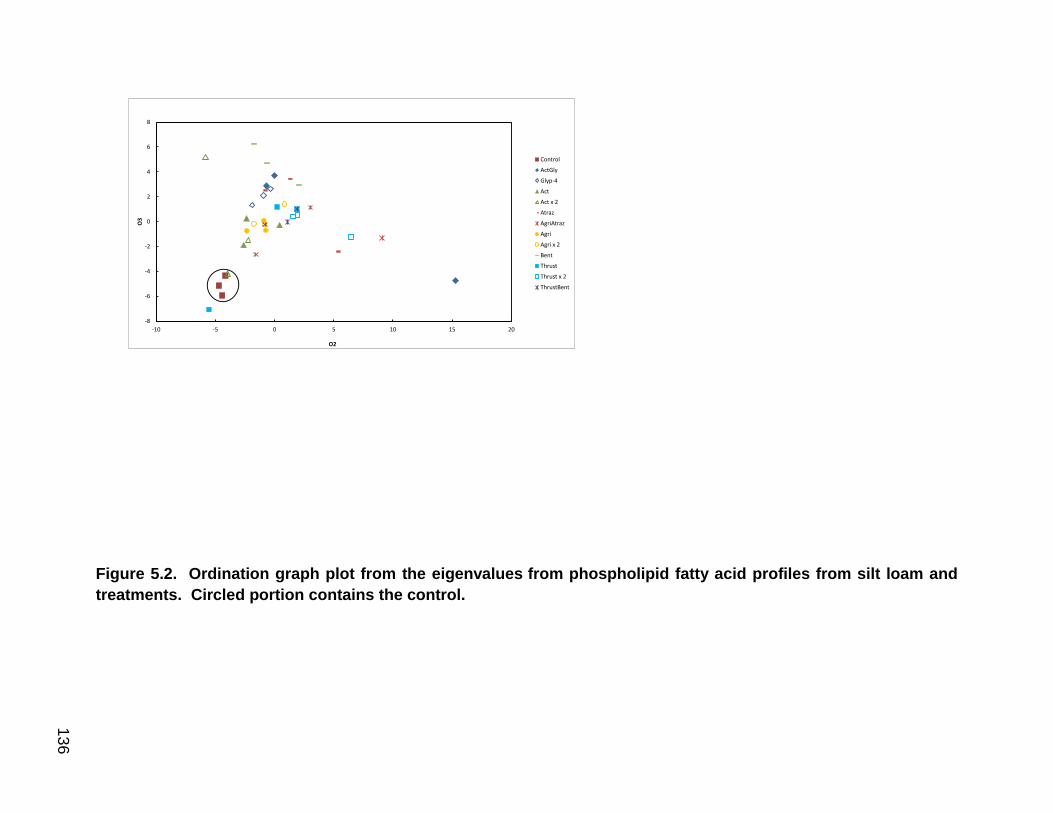
136
-8
-6
-4
-2
0
2
4
6
8
-10 -5 0 5 10 15 20
O3
O2
Control
ActGly
Glyp-4
Act
Act x 2
Atraz
AgriAtraz
Agri
Agri x 2
Bent
Thrust
Thrust x 2
ThrustBent
Figure 5.2. Ordination graph plot from the eigenvalues from phospholipid fatty acid profiles from silt loam and
treatments. Circled portion contains the control.
13
6
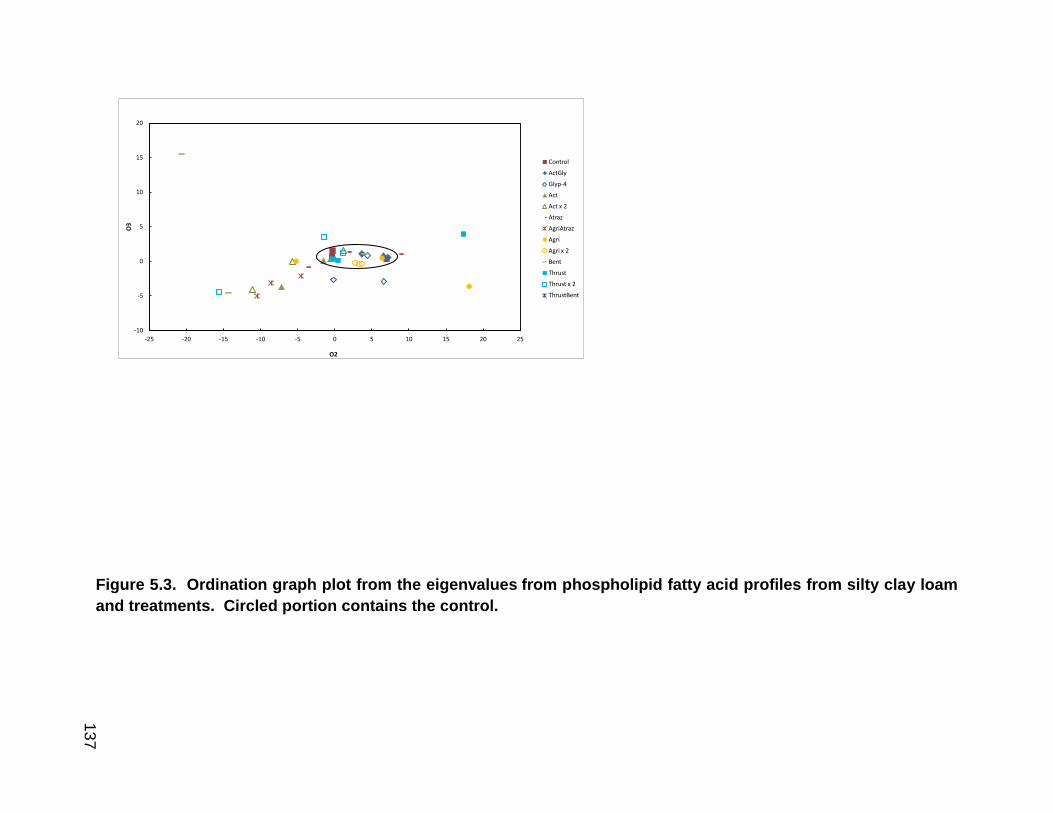
137
-10
-5
0
5
10
15
20
-25 -20 -15 -10 -5 0 5 10 15 20 25
O3
O2
Control
ActGly
Glyp-4
Act
Act x 2
Atraz
AgriAtraz
Agri
Agri x 2
Bent
Thrust
Thrust x 2
ThrustBent
Figure 5.3. Ordination graph plot from the eigenvalues from phospholipid fatty acid profiles from silty clay loam
and treatments. Circled portion contains the control.
13
7
138
CHAPTER 6
OVERALL SUMMARY
The aim of this study was to examine the effects of herbicides and surfactants
rates on nutrient concentration in corn and on the diversity of the soil microbial
community. Based on results presented in Chapters 3, 4, and 5, few significant
effects associated with the treatments were detected. However, some notable
effects with either negative, neutral or positive treatment responses compared with
non-treated, control soils were detected.
In Chapter 3, considering plant nutrient uptake, fresh and dry weight of corn
biomass differed between both soils. Soil carbon and nitrogen ratio (C:N) was
higher in the silt loam compared with silty clay loam. Nutrient concentrations in corn
did not differ between either soil. Surfactants applied at twice the recommended
rate did not significantly affect nutrient uptake for corn planted in either soil. The
various surfactant and herbicide treatments did not significantly affect nutrient
uptake by corn, suggesting that corn growth and development under adequate
nutrient availability are not negatively affected by the chemicals used in this study
applied to silt loam or silty clay loam at label rates or twice the label rate for
surfactants.
139
Chapter 4 presented results for DNA and PCR-DGGE analyses for
characterizing the soil microbial community and the potential effects of the applied
chemicals. Visual differences between both soils and among treatments were
observed in the expression of DNA band intensity, although when DNA profiles were
quantified, few significant differences due to treatment were found. Soil DNA
concentrations were significantly affected by the various treatments in silt loam but
these differences were more variable in silt clay loam soil. Differences between both
soils likely reflected the overall contribution of soil texture, chemical and physical
properties on characteristics of the microbial community.
Phospholipid fatty acid (PLFA) analytical results presented in Chapter 5
indicated differences in the microbial communities between the silt loam and the silty
clay loam soil. Microbial biomass increased for most treatments in both soils.
Based on these results, different types of bacteria appeared to be present at
different levels in both soils. The application of surfactant treatments at two rates,
and the herbicide and combination treatments variably affected different PLFA
biomarkers relative to control soils.
When herbicides are applied in the field, formulation additives should also be
considered when evaluating effects of chemical additions on the soil microbial
community. Most treatments in this study did not cause significant responses from
plant nutrient uptake or microbial community structure standpoints, perhaps as a
result of the one-time application of small quantities of chemicals applied at
recommended rates. The results from this study, conducted under greenhouse

140
conditions to simulate the field environment, suggest that future studies under actual
field conditions with multiple applications and different rates are necessary to
confirm that these responses occur under field condition or determine if other
specific factors are involved in expression of responses.

141
APPENDIX
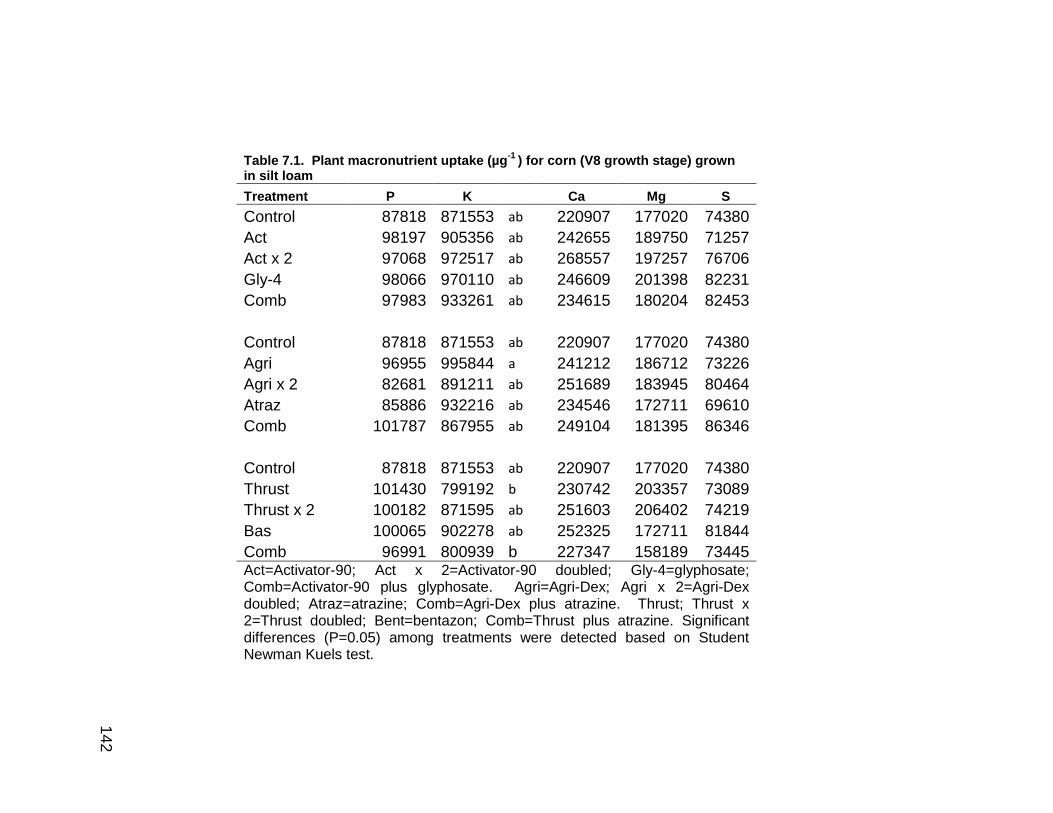
142
Table 7.1. Plant macronutrient uptake (µg-1
) for corn (V8 growth stage) grown in silt loam
Treatment P K Ca Mg S
Control 87818 871553 ab 220907 177020 74380
Act 98197 905356 ab 242655 189750 71257
Act x 2 97068 972517 ab 268557 197257 76706
Gly-4 98066 970110 ab 246609 201398 82231
Comb 97983 933261 ab 234615 180204 82453
Control 87818 871553 ab 220907 177020 74380
Agri 96955 995844 a 241212 186712 73226
Agri x 2 82681 891211 ab 251689 183945 80464
Atraz 85886 932216 ab 234546 172711 69610
Comb 101787 867955 ab 249104 181395 86346
Control 87818 871553 ab 220907 177020 74380
Thrust 101430 799192 b 230742 203357 73089
Thrust x 2 100182 871595 ab 251603 206402 74219
Bas 100065 902278 ab 252325 172711 81844
Comb 96991 800939 b 227347 158189 73445 Act=Activator-90; Act x 2=Activator-90 doubled; Gly-4=glyphosate; Comb=Activator-90 plus glyphosate. Agri=Agri-Dex; Agri x 2=Agri-Dex doubled; Atraz=atrazine; Comb=Agri-Dex plus atrazine. Thrust; Thrust x 2=Thrust doubled; Bent=bentazon; Comb=Thrust plus atrazine. Significant differences (P=0.05) among treatments were detected based on Student Newman Kuels test.
14
2
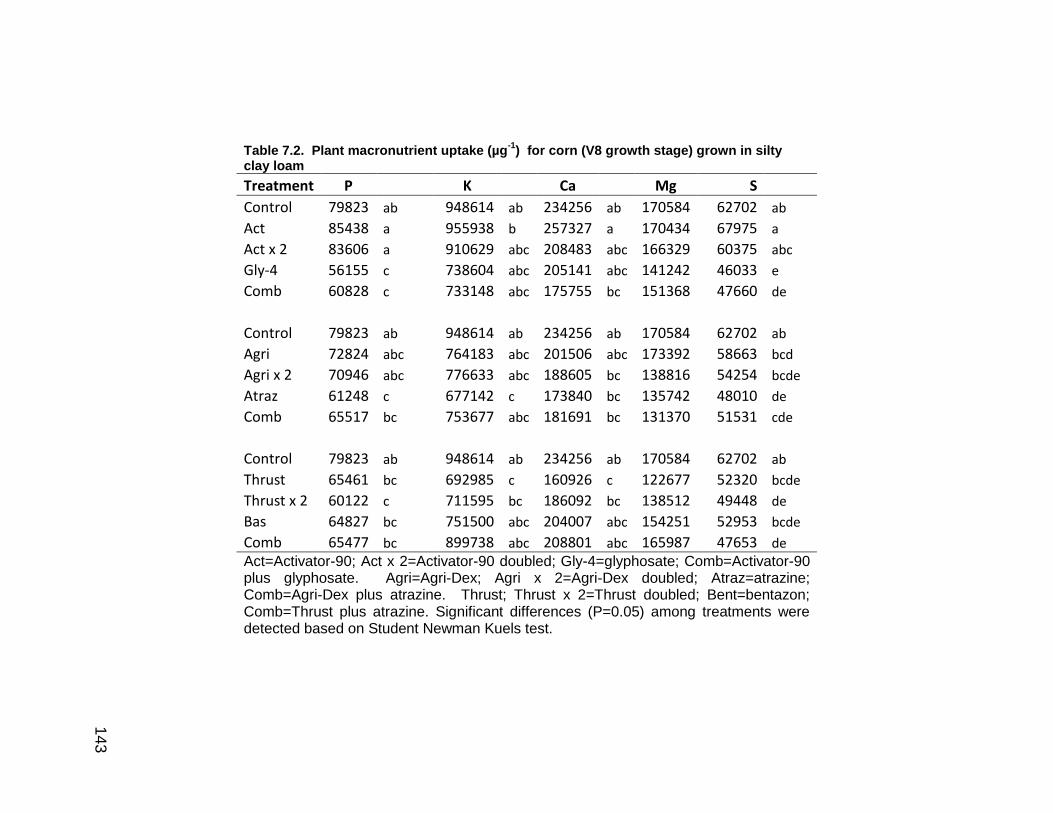
143
Table 7.2. Plant macronutrient uptake (µg-1
) for corn (V8 growth stage) grown in silty clay loam
Treatment P K Ca Mg S
Control 79823 ab 948614 ab 234256 ab 170584 62702 ab
Act 85438 a 955938 b 257327 a 170434 67975 a
Act x 2 83606 a 910629 abc 208483 abc 166329 60375 abc
Gly-4 56155 c 738604 abc 205141 abc 141242 46033 e
Comb 60828 c 733148 abc 175755 bc 151368 47660 de
Control 79823 ab 948614 ab 234256 ab 170584 62702 ab
Agri 72824 abc 764183 abc 201506 abc 173392 58663 bcd
Agri x 2 70946 abc 776633 abc 188605 bc 138816 54254 bcde
Atraz 61248 c 677142 c 173840 bc 135742 48010 de
Comb 65517 bc 753677 abc 181691 bc 131370 51531 cde
Control 79823 ab 948614 ab 234256 ab 170584 62702 ab
Thrust 65461 bc 692985 c 160926 c 122677 52320 bcde
Thrust x 2 60122 c 711595 bc 186092 bc 138512 49448 de
Bas 64827 bc 751500 abc 204007 abc 154251 52953 bcde
Comb 65477 bc 899738 abc 208801 abc 165987 47653 de Act=Activator-90; Act x 2=Activator-90 doubled; Gly-4=glyphosate; Comb=Activator-90 plus glyphosate. Agri=Agri-Dex; Agri x 2=Agri-Dex doubled; Atraz=atrazine; Comb=Agri-Dex plus atrazine. Thrust; Thrust x 2=Thrust doubled; Bent=bentazon; Comb=Thrust plus atrazine. Significant differences (P=0.05) among treatments were detected based on Student Newman Kuels test.
14
3
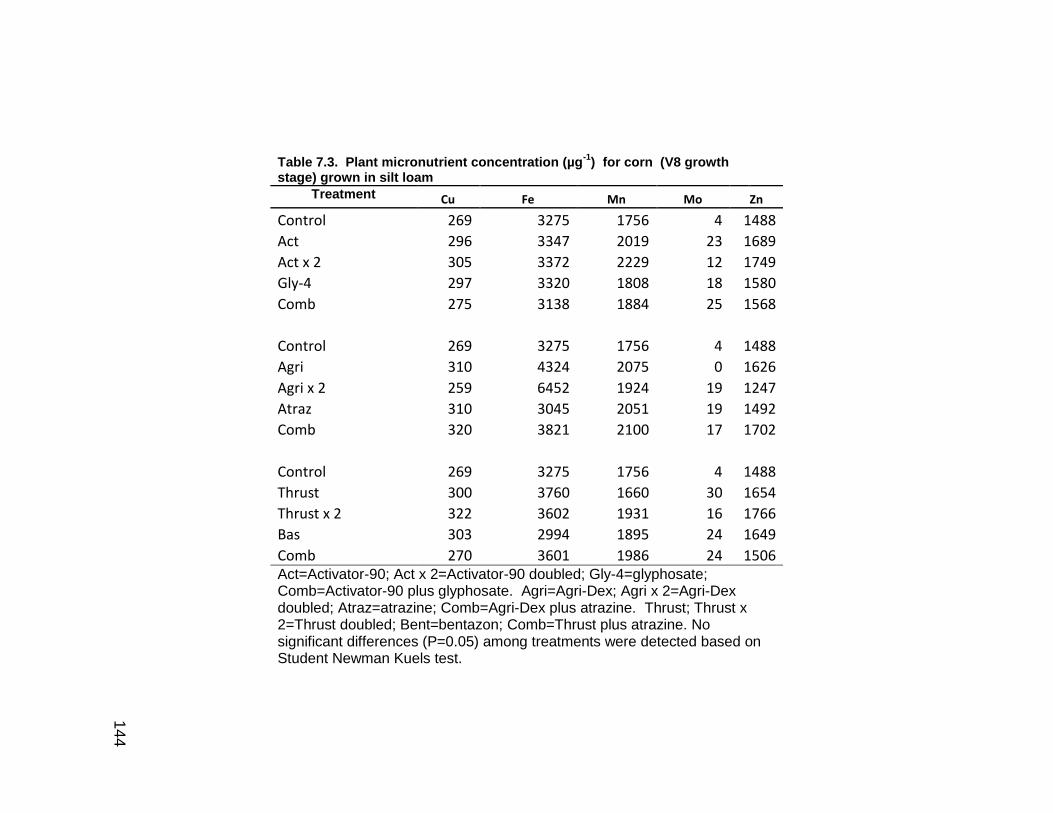
144
Table 7.3. Plant micronutrient concentration (µg-1
) for corn (V8 growth stage) grown in silt loam
Treatment Cu Fe Mn Mo Zn
Control 269 3275 1756 4 1488
Act 296 3347 2019 23 1689
Act x 2 305 3372 2229 12 1749
Gly-4 297 3320 1808 18 1580
Comb 275 3138 1884 25 1568
Control 269 3275 1756 4 1488
Agri 310 4324 2075 0 1626
Agri x 2 259 6452 1924 19 1247
Atraz 310 3045 2051 19 1492
Comb 320 3821 2100 17 1702
Control 269 3275 1756 4 1488
Thrust 300 3760 1660 30 1654
Thrust x 2 322 3602 1931 16 1766
Bas 303 2994 1895 24 1649
Comb 270 3601 1986 24 1506 Act=Activator-90; Act x 2=Activator-90 doubled; Gly-4=glyphosate; Comb=Activator-90 plus glyphosate. Agri=Agri-Dex; Agri x 2=Agri-Dex doubled; Atraz=atrazine; Comb=Agri-Dex plus atrazine. Thrust; Thrust x 2=Thrust doubled; Bent=bentazon; Comb=Thrust plus atrazine. No significant differences (P=0.05) among treatments were detected based on Student Newman Kuels test.
14
4
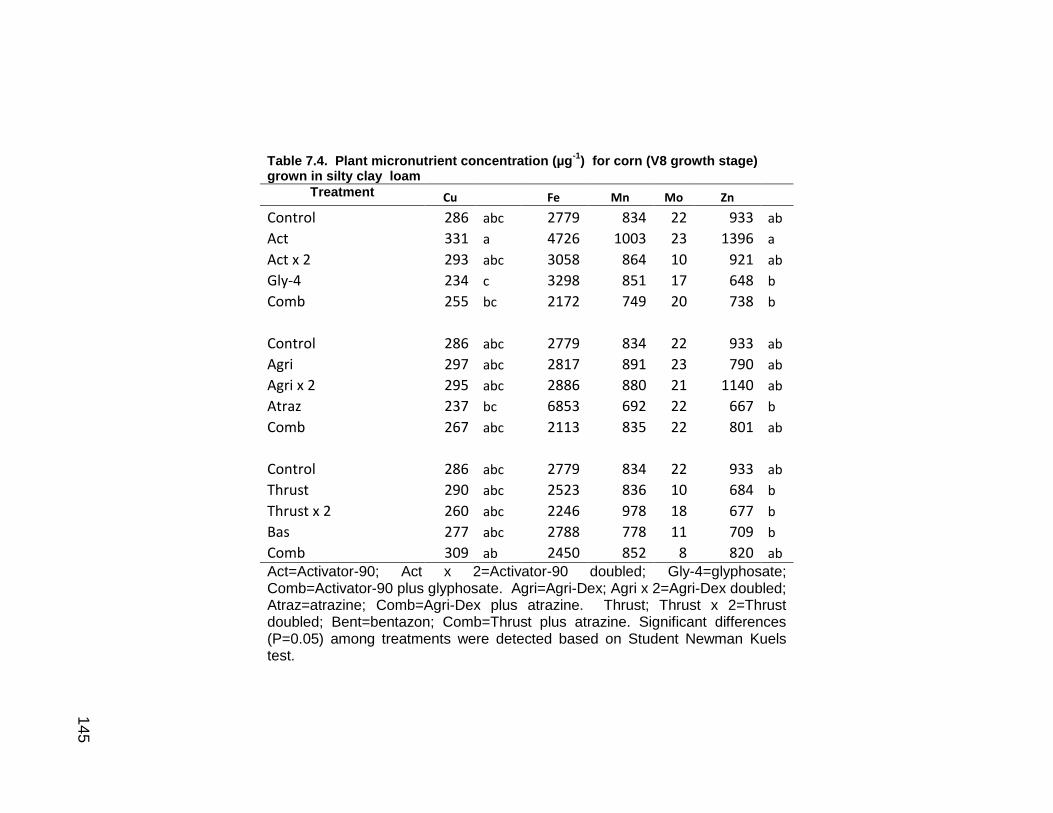
145
Table 7.4. Plant micronutrient concentration (µg-1
) for corn (V8 growth stage) grown in silty clay loam
Treatment Cu Fe Mn Mo Zn
Control 286 abc 2779 834 22 933 ab
Act 331 a 4726 1003 23 1396 a
Act x 2 293 abc 3058 864 10 921 ab
Gly-4 234 c 3298 851 17 648 b
Comb 255 bc 2172 749 20 738 b
Control 286 abc 2779 834 22 933 ab
Agri 297 abc 2817 891 23 790 ab
Agri x 2 295 abc 2886 880 21 1140 ab
Atraz 237 bc 6853 692 22 667 b
Comb 267 abc 2113 835 22 801 ab
Control 286 abc 2779 834 22 933 ab
Thrust 290 abc 2523 836 10 684 b
Thrust x 2 260 abc 2246 978 18 677 b
Bas 277 abc 2788 778 11 709 b
Comb 309 ab 2450 852 8 820 ab Act=Activator-90; Act x 2=Activator-90 doubled; Gly-4=glyphosate; Comb=Activator-90 plus glyphosate. Agri=Agri-Dex; Agri x 2=Agri-Dex doubled; Atraz=atrazine; Comb=Agri-Dex plus atrazine. Thrust; Thrust x 2=Thrust doubled; Bent=bentazon; Comb=Thrust plus atrazine. Significant differences (P=0.05) among treatments were detected based on Student Newman Kuels test.
14
5