Embed Size (px)
Citation preview
RisCura - SAVCA South African Private Equity Performance Report
As at 31 December 2018
Foreword
Market commentary
Private equity in South Africa
Methodology
Performance in South African Rands
01 02
03
04
05
06
02030405
Performance in US Dollars
Listed equity comparison (ZAR)
07
08
06
Private equity returns over time
How to use this report
09
10
0708
About 11
0910
Tableof contents
This document contains confidential information and is protected by copyright law. Copyright in all information, material and logos are protected by both national and international intellectual property laws. Accordingly, any unauthorised copying, reproduction, retransmission, distribution, dissemination, sale, publication, broadcast or other circulation, or exploitation of this material will constitute an infringement of such protection. The copyright in all material of RisCura Holdings (Pty) Ltd (“RisCura”) and all its subsidiaries shall continue to vest in RisCura. The information contained in this document is provided ‘as is’ without warranty of any kind. The entire risk as to the result and performance of the information supplied in this document is assumed by the user and in no event shall RisCura be liable for any direct, consequential, or incidental damages suffered in the course of using the information contained herein as a result of the use of, or the infringement of any copyright laws. RisCura Solutions (Pty) Ltd and RisCura Invest (Pty) Ltd are authorised financial services providers.
Foreword01.May 2019
We are pleased to release the December 2018 edition of the RisCura - SAVCA South African Private Equity Performance Report. This report tracks the performance of a representative basket of South African private equity funds and is published quarterly. The purpose of the report is to provide stakeholders in South African private equity with insight into industry returns, and to establish and maintain an authoritative benchmark for the measurement of private equity performance in this market. Since its inception in September 2010, this report has become a vital component in the marketing of the private equity industry. We would like to thank SAVCA members for making their performance data available, and for their commitment to this project.
Heleen GoussardExecutive: RisCura
Tanya van LillChief Executive Officer: SAVCA
Page 02
RisCura - SAVCA South African Private Equity Performance ReportQ4 2018
Marketcommentary
02.
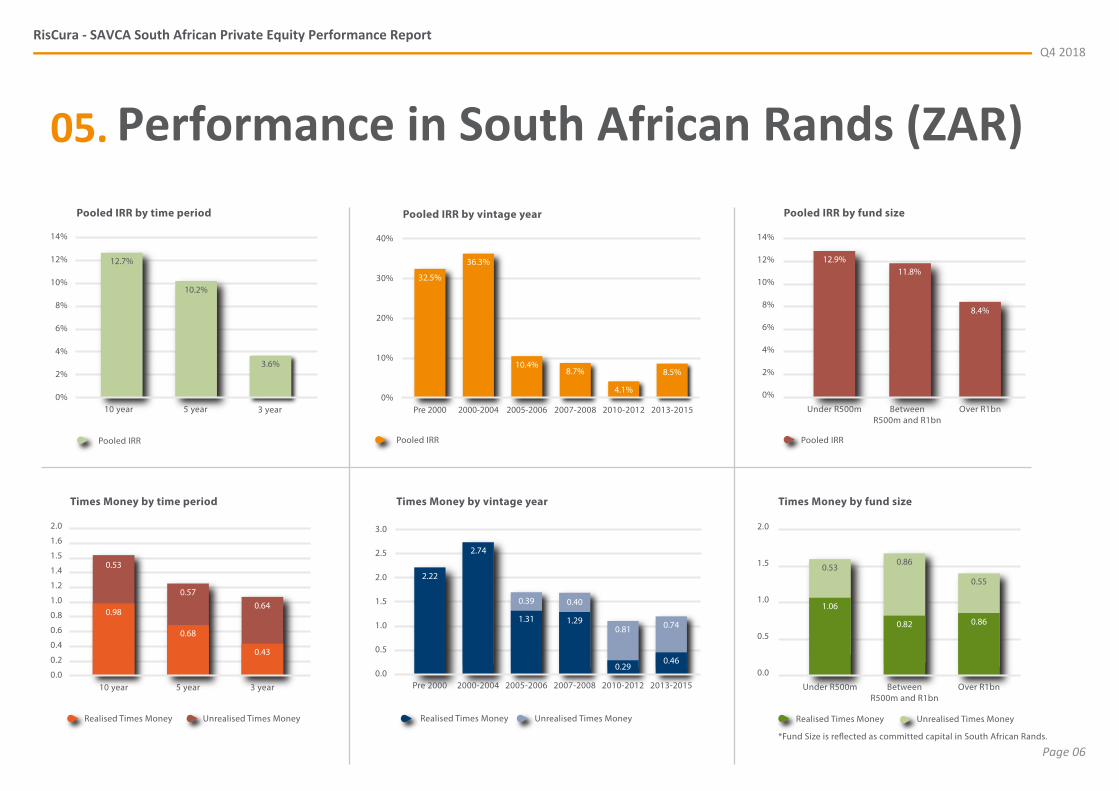
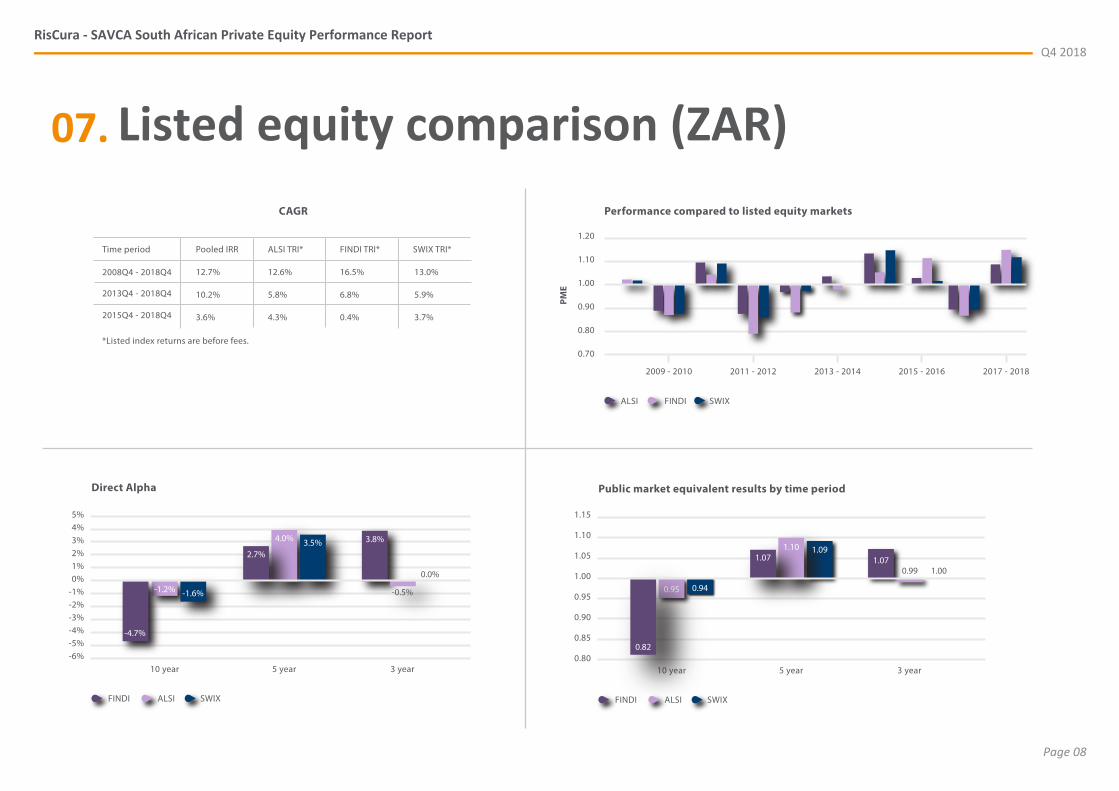
South Africa’s fourth quarter of 2018 was characterised by a weaker and more volatile Rand. In anticipation of the 2019 national elections, the Rand was further weighed down by political and policy uncertainty. Following the technical recession in the first half of 2018, South Africa’s growth profile still lags some emerging market territories, requiring fund managers to be more proactive and innovative to attract investors, stimulate fund growth and achieve competitive returns. Despite many headwinds, the country’s private equity sector’s performance relative to the listed market remains favourable, with outperformance across all three listed benchmarks (JSE ALSI, FINDI and SWIX) over the five-year period. Over the 10-year period, private equity continues to outperform the JSE All Share Index (ALSI) on Total Return Index (TRI) basis, a positive indicator of the quality of South Africa’s private equity investments. In Q4 of 2018, the 10-year ZAR IRR has improved from 11.8% in the prior quarter to 12.7%.
The five-year and three-year ZAR IRRs declined from 12.9% and 9.7% in Q3 2018 to 10.2% and 3.6% in Q4 2018, respectively — a testament of the subdued GDP growth over the last few years.
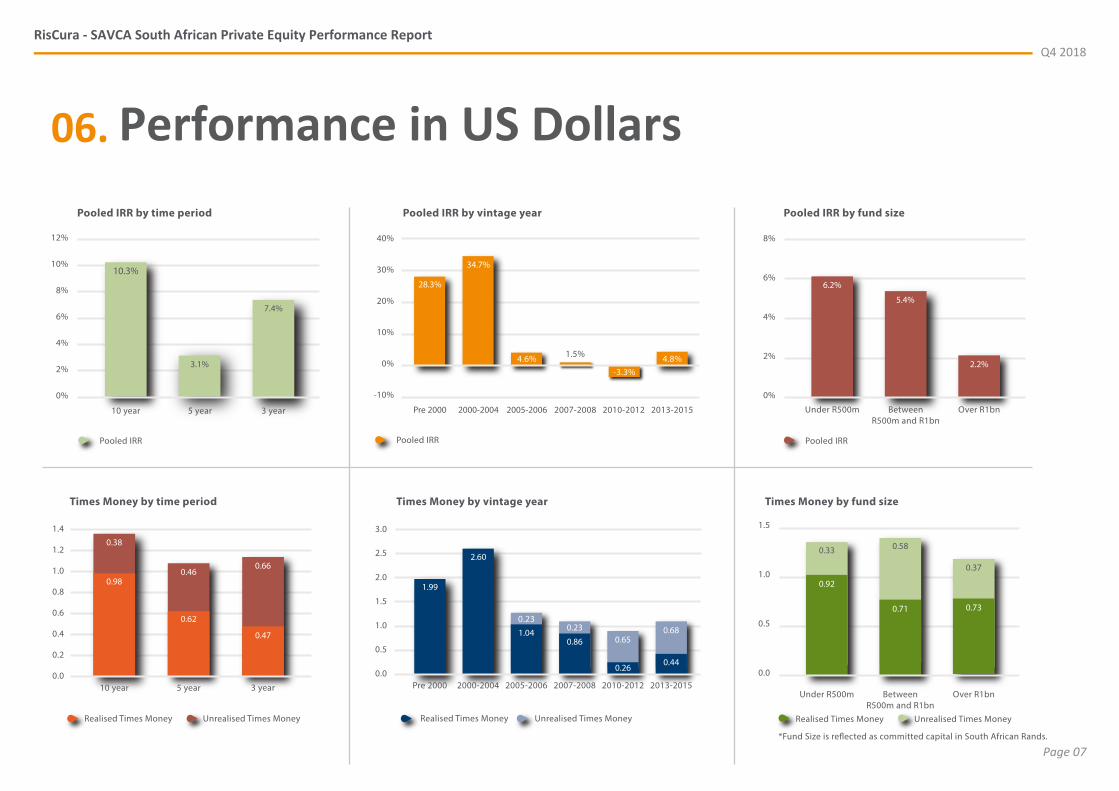
The USD IRR declined over the three-year, five-year and 10-year periods, reaching 7.4%, 3.1% and 10.3%, respectively, down from 9.8%, 4.4% and 10.7% in Q3 of 2018.
Page 03
RisCura - SAVCA South African Private Equity Performance ReportQ4 2018
Unemployment remains a significant challenge, especially in light of the low growth environment, and as a result, consumer spending remains subdued following rising food, electricity and fuel prices.
The country’s GDP growth is expected to improve later in 2019. The announcement of the additional R290bn pledged towards investment activity in South Africa at the 2018 Presidential Investment summit bodes well in support of this growth outlook.
There could be further positive change regarding policy certainty and economic growth following the 2019 national elections – something to look forward to for both South Africans and investors alike, especially following the testing 2018 year behind us.
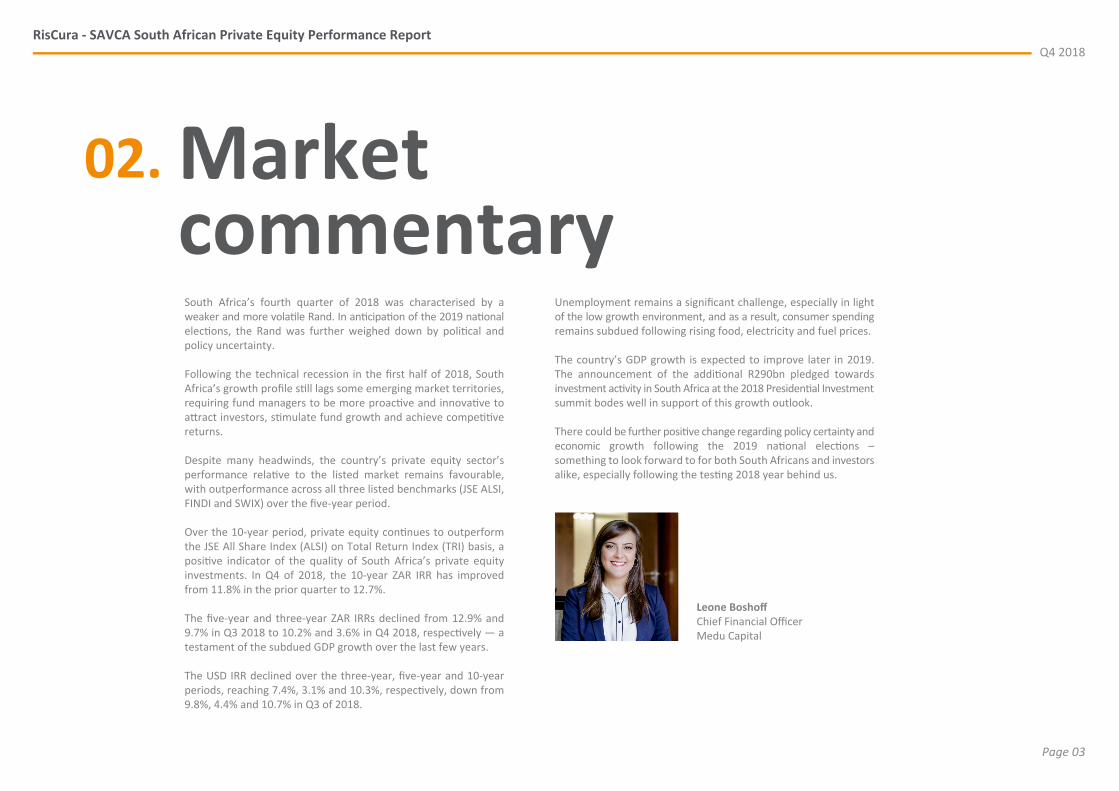
Leone BoshoffChief Financial OfficerMedu Capital
RisCura - SAVCA South African Private Equity Performance ReportQ4 2018
Page 04
Private equityin South Africa
03.
Private equity is an asset class which differs in nature from most other assets, including listed equity. Typically, private equity fund investments show low correlation to quoted equity markets and are relatively illiquid, particularly in the early years.
Private equity will normally show a drop in net asset value before showing any significant gains. This is often the effect of management fees and start-up costs on the relatively small capital base of a new fund. Private equity funds in South Africa typically follow a commitment and draw-down model, which means that investors commit a certain total of capital at the start of a fund, but are only requested to transfer cash to the private equity manager as investments are identified or costs are incurred. These funds typically return capital during the course of the fund’s life as investments are realised.
South African private equity offers institutional investors the opportunity to invest in an asset class which has historically outperformed listed equity over the long term. It does, however, have a different nature from quoted equity and it is crucial that an institutional investor considers the appropriateness of private equity to its particular objectives.
Page 05
RisCura - SAVCA South African Private Equity Performance ReportQ4 2018
Methodology04.Methods of measuring performanceThe most widely accepted method for calculating returns of private equity funds is the annualised internal rate of return (IRR) achieved over a period of time. As a sense check to the IRR measure, we also use the Times Money performance measure. This report measures performance in two ways: by ‘since inception’ and ‘end-to-end’ (over three, five and ten years). The IRR calculated in this report is net of fees over all periods.
IRR Since inceptionThis is the most widely used IRR measure of private equity performance. It measures the return of PE funds based on all cash flows in and out of the fund, as well as the remaining net asset value of the fund. This therefore most closely reflects the return an investor would achieve if they invested at the start of the fund. This is the most likely scenario in South Africa where investors in private equity funds are locked in for the life of the fund, and must catch up initial fees when joining a fund after the initial investors.
End-to-end IRREnd-to-end IRRs allow the computation of the return of groups of private equity funds which do not necessarily have the same inception date. This calculation also allows a better comparison ofprivate equity returns to those of other asset classes over similar periods. While this method has advantages, it must be noted that it allows the returns of funds at different life cycle stages to be combined. Where the period selected contains more new funds
than older funds, the return will likely include a higher balance of fees than a time period with more older funds. The longer term IRRs areconsidered to be the most indicative of private equity performance across different stages of the economic cycle, and are considered to be the headline measures. Shorter term returns should be viewed with caution as private equity is a long term investment. However, shorter period returns may be indicative of the general performance of private equity over this short period.
Times MoneyTimes Money is the ratio of total capital invested to total capital returned and remaining value. This is a useful cross-check of IRR measures, and is easily understandable. While IRR calculations are heavily dependent on the length of time that capital has been invested, Times Money does not take time into account. A Times Money in excess of 1 means that value has been created for the investor.
Public market equivalent (PME)This measure seeks to equate the heavily timing-dependent returns of private equity funds with the returns of public market indices. The measure is a ratio of the net outflows from PE funds re-invested into the public index to the end of the fund’s life, divided by the inflows into a PE fund invested in the public index until the end of the fund’s life. A ratio of above 1 reflects outperformance of private equity, while a ratio under 1 reflects under performance.
RisCura - SAVCA South African Private Equity Performance ReportQ4 2018
Page 06
05. Performance in South African Rands (ZAR)
Pooled IRR by time period
Pooled IRR
0%
2%
4%
8%
6%
10%
14%
12%
5 year
10.2%
10 year
12.7%
3.6%
3 year
Pooled IRR by vintage year
Pooled IRR
0%
10%
20%
30%
40%
2000-2004
36.3%
Pre 2000
32.5%
10.4%
2005-2006
8.7%
2007-2008 2010-2012 2013-2015
4.1%
8.5%
Pooled IRR by fund size
Pooled IRR
0%
4%
2%
8%
10%
12%
6%
14%
BetweenR500m and R1bn
11.8%
Under R500m
12.9%
8.4%
Over R1bn
Times Money by time period
Unrealised Times MoneyRealised Times Money
0.0
1.0
1.2
1.4
1.5
1.6
2.0
0.2
0.4
0.6
0.8
5 year
0.68
0.57
10 year
0.98
0.53
0.43
0.64
3 year
Times Money by vintage year
Unrealised Times MoneyRealised Times Money
0.0
0.5
1.0
1.5
2.0
2.5
3.0
2.22
Pre 2000
2.74
2000-2004
0.39
1.31
2005-2006
0.40
1.29
2007-2008
0.29
0.81
2010-2012
0.46
0.74
2013-2015
*Fund Size is re�ected as committed capital in South African Rands.
Times Money by fund size
Unrealised Times MoneyRealised Times Money
0.0
0.5
1.0
1.5
2.0
Under R500m
1.06
0.53
BetweenR500m and R1bn
0.82
0.86
Over R1bn
0.86
0.55
RisCura - SAVCA South African Private Equity Performance ReportQ4 2018
Page 07
06. Performance in US Dollars
Pooled IRR by time period
0%
2%
4%
6%
8%
12%
10%
5 year
3.1%
10 year
10.3%
7.4%
3 year
Pooled IRR Pooled IRR
Pooled IRR by fund size
0%
2%
6%
4%
8%
BetweenR500m and R1bn
5.4%
Under R500m
6.2%
2.2%
Over R1bn
*Fund Size is re�ected as committed capital in South African Rands.
Unrealised Times MoneyRealised Times Money
Times Money by fund size
0.0
0.5
1.0
1.5
Under R500m
0.92
0.33
BetweenR500m and R1bn
0.71
0.58
Over R1bn
0.73
0.37
Times Money by time period
5 year
0.62
0.46
10 year
0.98
0.38
0.47
0.66
3 year0.0
1.2
0.2
0.4
0.6
0.8
1.0
1.4
Unrealised Times MoneyRealised Times Money
Pooled IRR by vintage year
Pooled IRR
30%
-10%
0%
20%
10%
40%
2000-2004
34.7%
Pre 2000
28.3%
4.6%
2005-2006
1.5%
2007-2008 2010-2012 2013-2015
-3.3%4.8%
Times Money by vintage year
Unrealised Times MoneyRealised Times Money
0.0
0.5
1.0
1.5
2.0
2.5
3.0
1.99
Pre 2000
2.60
2000-2004
0.231.04
2005-2006
0.23
0.86
2007-2008
0.26
0.65
2010-2012
0.44
0.68
2013-2015
RisCura - SAVCA South African Private Equity Performance ReportQ4 2018
Page 08
CAGR
2008Q4 - 2018Q4
2013Q4 - 2018Q4
2015Q4 - 2018Q4
Pooled IRR ALSI TRI* FINDI TRI*Time period SWIX TRI*
12.7% 12.6% 16.5% 13.0%
10.2% 5.8% 6.8% 5.9%
3.6% 4.3% 0.4% 3.7%
Public market equivalent results by time period
0.80
0.85
0.90
0.95
1.00
1.05
1.10
1.15
SWIXFINDI ALSI
10 year
0.95 0.94
0.82
5 year
1.10
3 year
1.07
Performance compared to listed equity markets
0.70
1.20
1.00
1.10
0.90
0.80
PME
2009 - 2010 2011 - 2012 2013 - 2014 2015 - 2016 2017 - 2018
SWIXFINDIALSI
07. Listed equity comparison (ZAR)
*Listed index returns are before fees.
1.09
0.99 1.00
Direct Alpha
-6%
1%0%
2%
-4%-5%
-2%-3%
-1%
3%4%5%
SWIXFINDI ALSI
10 year
-1.2%
-4.7%
5 year
4.0% 3.5%
3 year
3.8%
-0.5%
0.0%
-1.6%
2.7% 1.07
RisCura - SAVCA South African Private Equity Performance ReportQ4 2018
Page 09
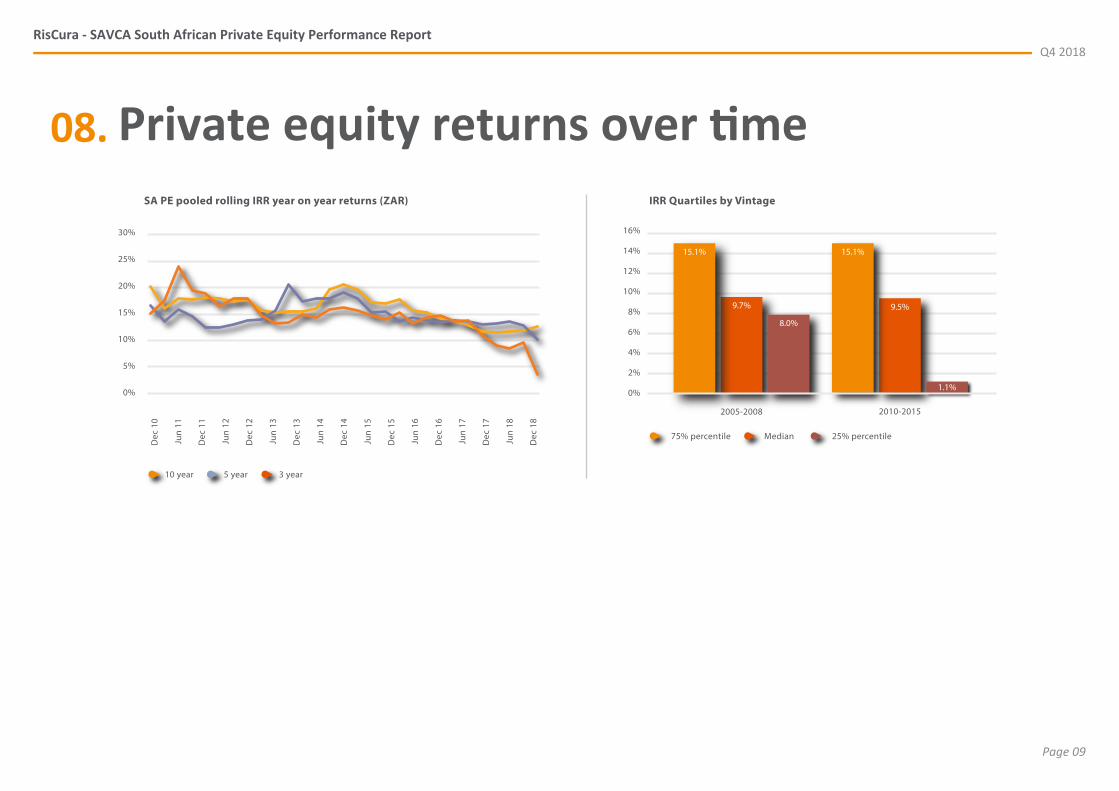
08. Private equity returns over timeIRR Quartiles by Vintage
75% percentile Median 25% percentile
0%
2%
4%
6%
8%
10%
12%
14%
16%
2005-2008
9.7%
15.1%
8.0%
2010-2015
9.5%
15.1%
1.1%
SA PE pooled rolling IRR year on year returns (ZAR)
0%
25%
15%
20%
10%
5%
Dec
10
Jun
11
Dec
11
Jun
12
Dec
12
Jun
13
Dec
13
Jun
14
Dec
14
Jun
15
Dec
15
Jun
16
Dec
16
Jun
17
Dec
17
Jun
18
Dec
18
30%
10 year 5 year 3 year
RisCura - SAVCA South African Private Equity Performance ReportQ4 2018
Page 10
How to use this reportReturns of cash flow and portfolio value data from private equity managers are the primary source for information included in this Report.
The IRR performance calculation solves for the discount rate that makes the Net Present Value of a set of cash flows equal to zero. The calculation is based on cash-on-cash returns over equal periods, modified for the residual value of the fund's equity (NAV). The residual value attributed to each respective group being measured is incorporated as its ending value.
The database accounts for cash flows on a daily basis wherever possible otherwise a monthly basis, and NAVs on a quarterly basis.
The End-to-End performance calculation is similar to the since inception IRR, however, it is measuring the return between two points in time. The calculation takes into account the opening NAV, the in-period cash flows and the closing NAV. Returns are then annualised for comparability.
The pool of funds has been split into subsets where this would enhance the user’s understanding of returns. However, this has been balanced with confidentiality considerations, and no such subsets include fewer than four funds.
Most funds included in this Report have unrealised investments, and therefore rely on the valuation of these investments to determine returns. All participating fund managers are members of SAVCA and apply the International Private Equity and Venture Capital Valuation Guidelines to determine these valuations. RisCura has not verified that these Guidelines have been adhered to.
Only South African Rand denominated funds have been included in this Report, and therefore none of the returns included are affected by exchange rate movements.
Useful information: Definitions:
CAGR is the compound annual growth rate.
Committed capital is the value of dedicated investment funds pledged by the investors of a private equity fund and available for investment. This is a proxy for the size of the fund.
Fund Size is determined by the committed capital of a fund.
IRRs are money-weighted returns that should be compared to time-weighted returns with caution. Time-weighted returns are used to measure returns in most asset classes where frequent valuations are available.
PME Public Market Equivalent is a measure that determines whether private equity returns have exceeded or underperformed a public market. A PME score of more than one indicates outperformance of private equity.
Pooled IRR aggregates or "pools" all cash flows and ending NAVs to calculate a money-weighted return.
Realised Times Money is the ratio of cash returned to investors divided by total cash invested.
Total Times Money is the sum of the Realised and Unrealised Times Money.
Unrealised Times Money is the ratio of the carrying value of portfolio investments not yet returned to investors divided by total cash invested.
Vintage Year is defined as the year in which a fund first draws down capital from its investors.
09.
About
RisCura - SAVCA South African Private Equity Performance ReportQ4 2018
Page 11
10.About RisCura
RisCura is a global, independent provider of professional investment services. RisCura services institutional investors, asset managers, hedge funds and private equity firms with over USD200 billion in assets under advice. RisCura is a leading provider of investment consulting, independent valuation, risk and performance analysis services to investors.
For more information about RisCura visit www.riscura.com
About SAVCA
The Southern African Venture Capital and Private Equity Association (SAVCA) is the industry body and public policy advocate for private equity and venture capital in Southern Africa, representing about R165 billion in assets under management, through 150 members. SAVCA promotes Southern Africa private equity by engaging with regulators and legislators on a range of matters affecting the industry, providing relevant and insightful research on aspects of the industry, offering training on private equity and creating meaningful networking opportunities for industry players.
For more information visit www.savca.co.za