Embed Size (px)
Citation preview
ROADROID CONTINUOUS ROAD CONDITION MONITORING WITH SMART PHONES
HANS JONES and LARS FORSLOF
Mats Knuts Vag 68, 784 50 Borlange, Sweden
Tel: +46 706997780; Email: [email protected] Egnahemsgatan 5, 827 35 Ljusdal, Sweden
Tel: +46 722426620; Email: [email protected]
ABSTRACT Road condition is an important variable to measure in order to decrease road and vehicle operating/maintenance costs, but also to increase ride comfort and traffic safety. By using the built-in vibration sensor in smartphones, it is possible to collect road roughness data which can be an indicator of road condition up to a level of class 2 or 3 [1] in a simple and cost efficient way. Since data collection therefore is possible to be done more frequently one can better monitor roughness changes over time. The continuous data collection can also give early warnings of changes and damage, enable new ways to work in the operational road maintenance management, and can serve as a guide for more accurate surveys for strategic asset management and pavement planning. Data collection with smartphones will not directly compete with class 1 [1] precision profiles measurements, but instead complement them in a powerful way. As class 1 data is very expensive to collect it cannot be done often, beside this advanced data collection systems also demand complex data analysis and takes long time to deliver the result. With smartphone based data collection it is possible to meet both these challenges. A smartphone based system is also an alternative to class 4 – subjective rating [1], on roads where heavy, complex and expensive equipment is impossible to use, and for bicycle roads. The technology is objective, highly portable, and is simple to use. This gives a powerful support to road inventories, inception reports, tactical planning, program analysis and support maintenance project evaluation. The Roadroid smartphone solution has two options for roughness data calculation:
1) estimated IRI (eIRI) - based on a Peak and Root Mean Square (RMS) vibration analysis – which is correlated to Swedish laser measurements on paved roads. The setup is fixed but made for three types of cars and is thought to compensate for speed between 20-100 km/h. eIRI is the base for the Roadroid Index (RI) classification of single points and stretches (road links) of the road.
2) calculated IRI (cIRI) - based on the quarter-car simulation (QCS) [1] for sampling during a narrow speed range such as 60-80 km/h. When measuring cIRI, the sensitivity of the device can be calibrated by the operator to a known reference.
Collected data are wirelessly transferred by the operator when needed via a web service to an internet mapping server with spatial filtering functions. The measured data can be aggregated in preferred sections (default 100m), as well as exported to other Geographical Information Systems (GIS) or road management system. By broadcasting road condition warnings through standards for Intelligent Transportation Systems (ITS) the information could provide new kinds of dynamic and valuable input to automotive navigation systems and digital route guides for special traffic etc.
INTRODUCTION The International Roughness Index (IRI) [1] is a road roughness index commonly obtained from measured longitudinal road profiles. Since its introduction in 1986, the IRI standard has become commonly used worldwide for evaluating and managing road systems [3]. Measuring road roughness have however been used since early 1900 for expressing road condition and ride quality [2]. Since the end of the 1960s however most road profiling is done with high speed road profiling instruments [3]. The modern traditional techniques for measuring roughness may be categorized as either specially built trucks or wagons with laser scanners, bump-wagons or even manually operated rolling straight edges. Specially built measurement equipment is expensive, due to heavy and complex hardware, low volume of production and the need of sophisticated systems and accessories. Data gathering and analysis are often time consuming. In the northern hemisphere data collection is typically done during the summer then analyzed and delivered to the maintenance management systems in late autumn. During the winter and spring the road usually faces a continual frost heave/thaw (a very dramatic period in a road´s life with extreme changes in roughness) cycle. The IRI values that were “exact” almost a year ago may now not be the same any longer. Besides, since it’s so expensive to collect and analyze the data, many roads are only covered in one lane direction every 3rd or 4th year. Smartphone based gathering of roughness data which essentially is a response-type road roughness measuring system (RTRRMS) [1] can be done at a low cost and to monitor changes on a daily basis. For frost and heave issues it can tell when and where it is happening and if the situation is worse than in previous years. It can also be used in the winter to determine the performance of snow-removal and ice-grading. It may advantageously be used in performance based contracts or research on road deterioration, various environmental effects (as heavy rains, flooding etc.) and other adjacent purposes. It should be mentioned that smartphone based systems like Roadroid might challenge old road knowledge with regard to standards, procedures and existing ways to procure:
Pavement planners and road engineers knowledge of existing solutions and inputs;
Research organizations, suppliers and buyers have standards/procedures;
Organizations have invested time, prestige and huge amounts of money to develop complex data collection and management systems which can achieve exact result.
As described in [1] it is necessary to understand the difference between the four generic classes of road roughness measuring methods in use:
Class 1 - Precision profiles
Class 2 - Other profile-metric methods
Class 3 - IRI estimates from correlation equations
Class 4 - Subjective ratings and uncalibrated measures It is natural that skepticism will appear when a class 2/3 smartphone is compared with multi-million dollar class 1 or class 2 instruments as inertial profilers etc. But a smartphone can deliver up-to-date good quality roughness data to a web page within hours, in contrast to an expensive software client with the “exact” class 1 or class 2 data from “last year”. On the other end of the scale – many road inventories and assessments are made by humans (class 4 subjective ratings) over large areas using only pen and paper.
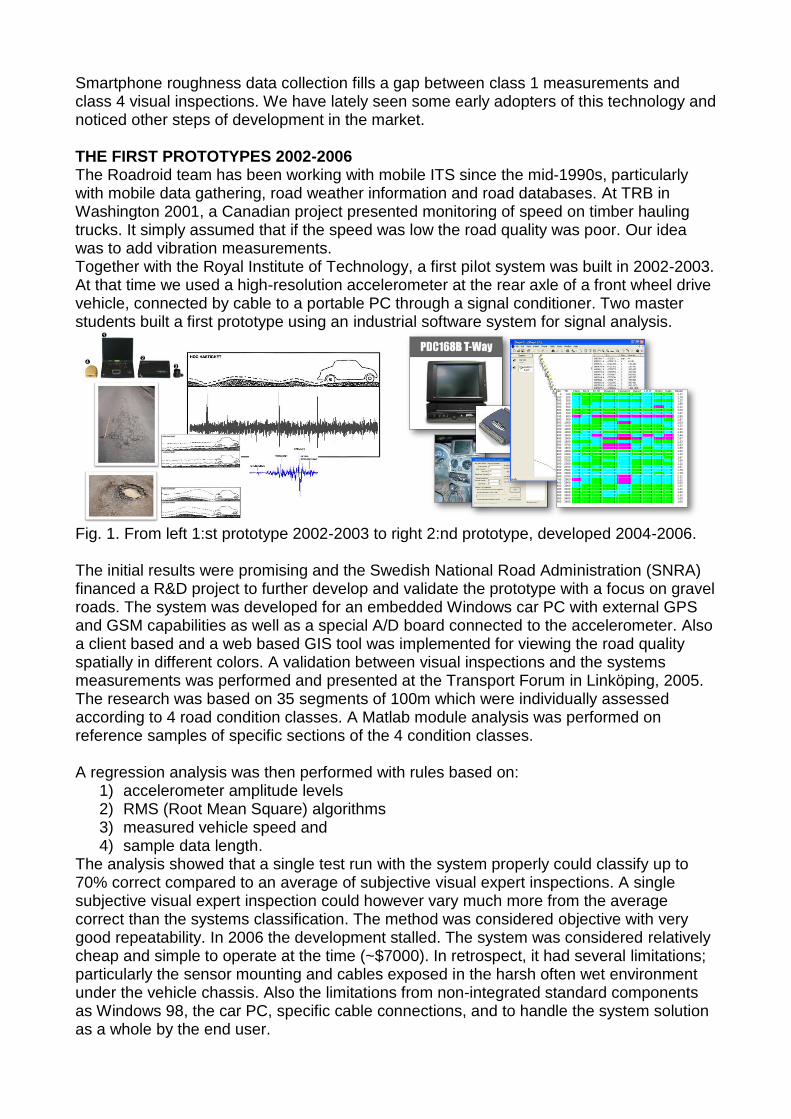
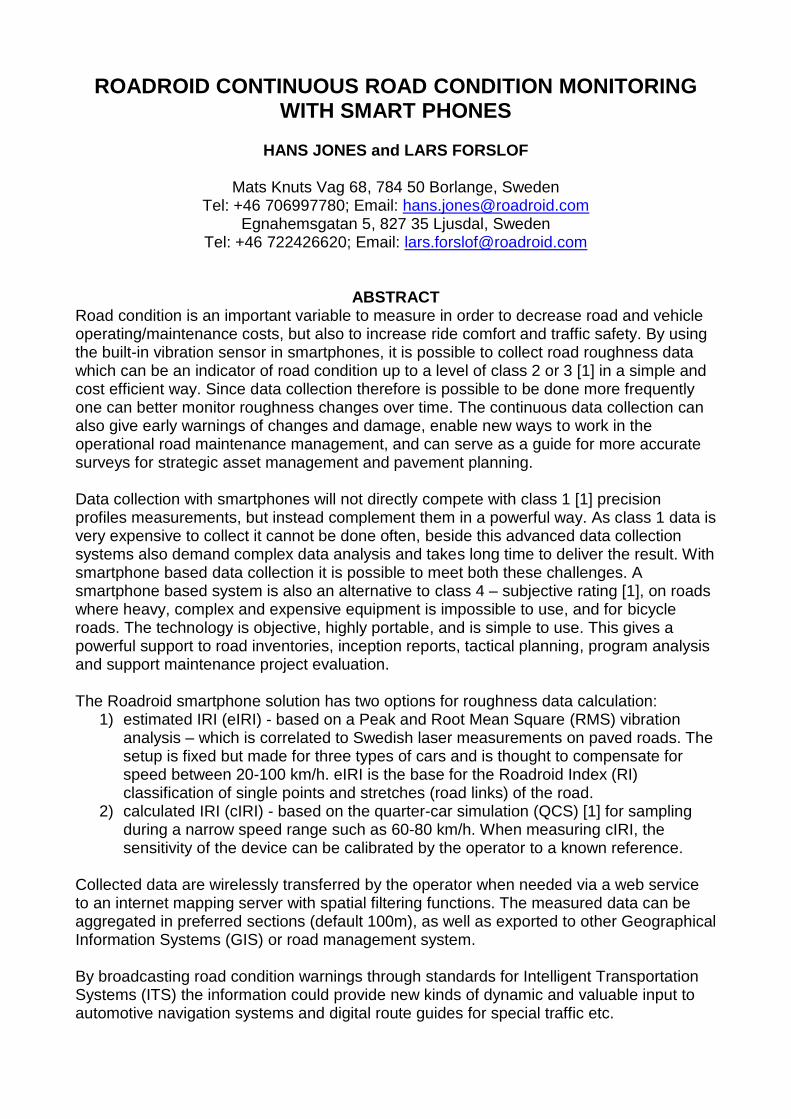
Smartphone roughness data collection fills a gap between class 1 measurements and class 4 visual inspections. We have lately seen some early adopters of this technology and noticed other steps of development in the market. THE FIRST PROTOTYPES 2002-2006 The Roadroid team has been working with mobile ITS since the mid-1990s, particularly with mobile data gathering, road weather information and road databases. At TRB in Washington 2001, a Canadian project presented monitoring of speed on timber hauling trucks. It simply assumed that if the speed was low the road quality was poor. Our idea was to add vibration measurements. Together with the Royal Institute of Technology, a first pilot system was built in 2002-2003. At that time we used a high-resolution accelerometer at the rear axle of a front wheel drive vehicle, connected by cable to a portable PC through a signal conditioner. Two master students built a first prototype using an industrial software system for signal analysis.
Fig. 1. From left 1:st prototype 2002-2003 to right 2:nd prototype, developed 2004-2006. The initial results were promising and the Swedish National Road Administration (SNRA) financed a R&D project to further develop and validate the prototype with a focus on gravel roads. The system was developed for an embedded Windows car PC with external GPS and GSM capabilities as well as a special A/D board connected to the accelerometer. Also a client based and a web based GIS tool was implemented for viewing the road quality spatially in different colors. A validation between visual inspections and the systems measurements was performed and presented at the Transport Forum in Linköping, 2005. The research was based on 35 segments of 100m which were individually assessed according to 4 road condition classes. A Matlab module analysis was performed on reference samples of specific sections of the 4 condition classes. A regression analysis was then performed with rules based on:
1) accelerometer amplitude levels 2) RMS (Root Mean Square) algorithms 3) measured vehicle speed and 4) sample data length.
The analysis showed that a single test run with the system properly could classify up to 70% correct compared to an average of subjective visual expert inspections. A single subjective visual expert inspection could however vary much more from the average correct than the systems classification. The method was considered objective with very good repeatability. In 2006 the development stalled. The system was considered relatively cheap and simple to operate at the time (~$7000). In retrospect, it had several limitations; particularly the sensor mounting and cables exposed in the harsh often wet environment under the vehicle chassis. Also the limitations from non-integrated standard components as Windows 98, the car PC, specific cable connections, and to handle the system solution as a whole by the end user.
Från Till Hans Bo S Kr. W Hossein1 Hossein2 Hans2 L-E H Robin Kalle Medel 0 100 1 1 1 1 1 1 2 1 1 1,11
100 200 2 1 1 2 2 2 2 2 2 1,78 200 300 2 1 1 1 1 1 2 1 1 1,22 300 400 2 1 2 2 2 2 2 2 2 1,89 400 500 2 2 2 2 2 2 2 3 2 2,11 500 600 1 1 1 1 1 1 1 1 1 1,00 600 700 1 1 2 1 2 2 2 2 2 1,67 700 800 3 2 3 3 3 3 3 3 3 2,89 800 900 2 2 1 1 2 2 2 2 1 1,67 900 1000 2 2 1 2 3 2 2 2 2 2,00
1000 1100 1 1 1 2 1 1 1 1 2 1,22 1100 1200 1 1 1 2 1 1 1 1 1 1,11 1200 1300 1 2 2 1 1 1 1 1 2 1,33 1300 1400 2 2 3 2 3 2 3 2 3 2,44 1400 1500 2 2 2 3 4 3 2 3 3 2,67 1500 1600 1 1 2 1 2 1 2 1 1 1,33 1600 1700 2 2 2 3 3 2 2 2 2 2,22 1700 1800 2 1 1 3 3 2 1 2 2 1,89 1800 1900 1 1 1 1 1 1 1 1 1 1,00 1900 2000 2 1 1 1 2 1 1 1 1 1,22 2000 2100 2 2 1 1 2 2 2 2 1 1,67 2100 2200 2 2 1 2 2 1 1 1 2 1,56 2200 2300 1 1 1 1 2 1 1 1 1 1,11 2300 2400 2 1 2 1 2 1 2 2 2 1,67 2400 2500 2 2 1 2 2 1 2 2 2 1,78 2500 2600 2 2 2 2 2 1 2 1 2 1,78 2600 2700 2 2 2 2 3 2 2 2 2 2,11 2700 2800 3 2 1 2 3 2 2 2 2 2,11 2800 2900 2 2 1 2 3 2 2 2 2 2,00 2900 3000 2 1 1 1 2 1 1 1 1 1,22 3000 3100 1 1 1 1 2 1 1 1 1 1,11 3100 3200 1 1 1 2 2 1 1 1 1 1,22 3200 3300 1 1 1 2 1 1 1 1 1 1,11 3300 3400 1 1 1 1 1 1 1 1 1 1,00 3400 3500 1 1 1 1 1 1 1 1 1 1,00
FURTHER DEVELOPMENT 2010-2011 In 2010, the ideas from 2002-2006 were reviewed. A major technical development was the appearance of smartphones. Literally all peripherals that previously were connected by special cables were now built into a smartphone (accelerometer, GPS, Processor, memory and data communication) and the limitations of certain components were removed by new advances in technology. We knew the answers to some of the questions from 2002-2006, e.g. the basis for signal analysis, the influence of speed and different vehicle characteristics etc. There were however new big questions to solve, such as:
Was it possible to pick up the “filtered” signals from the vehicle chassis?
We knew different car models would give different signals, how could we cope?
Would a lower sampling frequency be enough (100 Hz compared to 512-1024 Hz)?
Would the smartphone accelerometer sensitivity and range (+/-2 G) be sufficient?
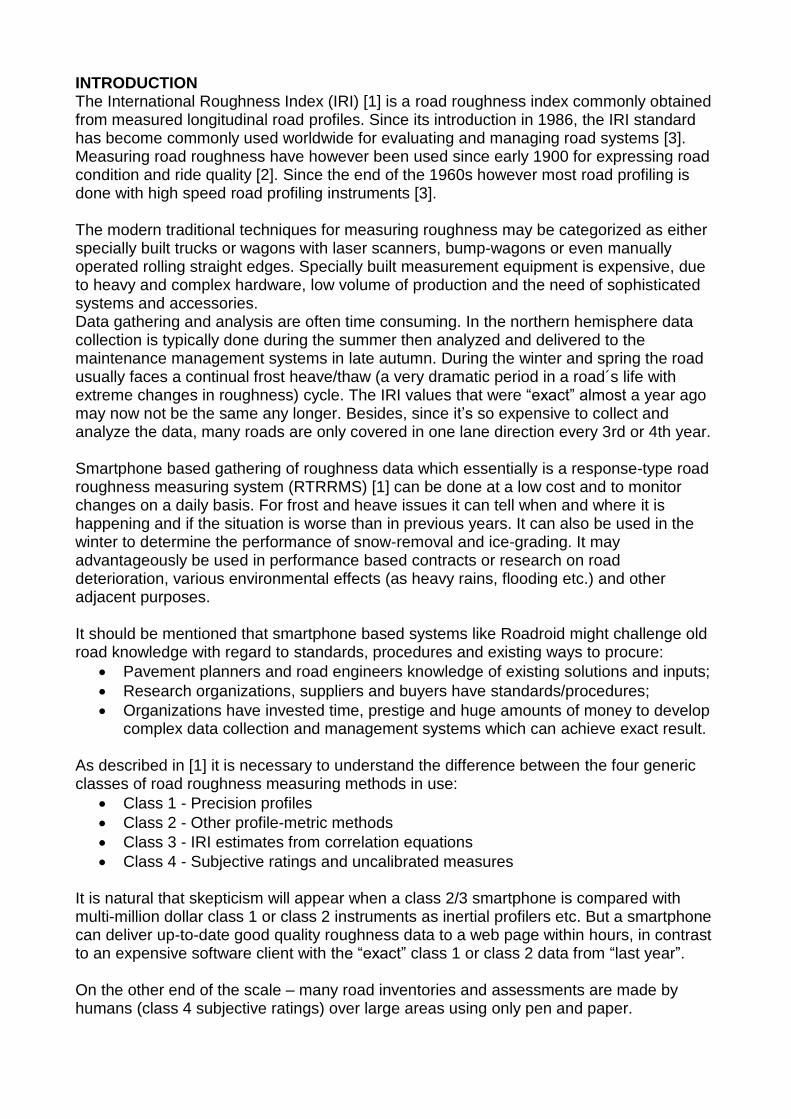
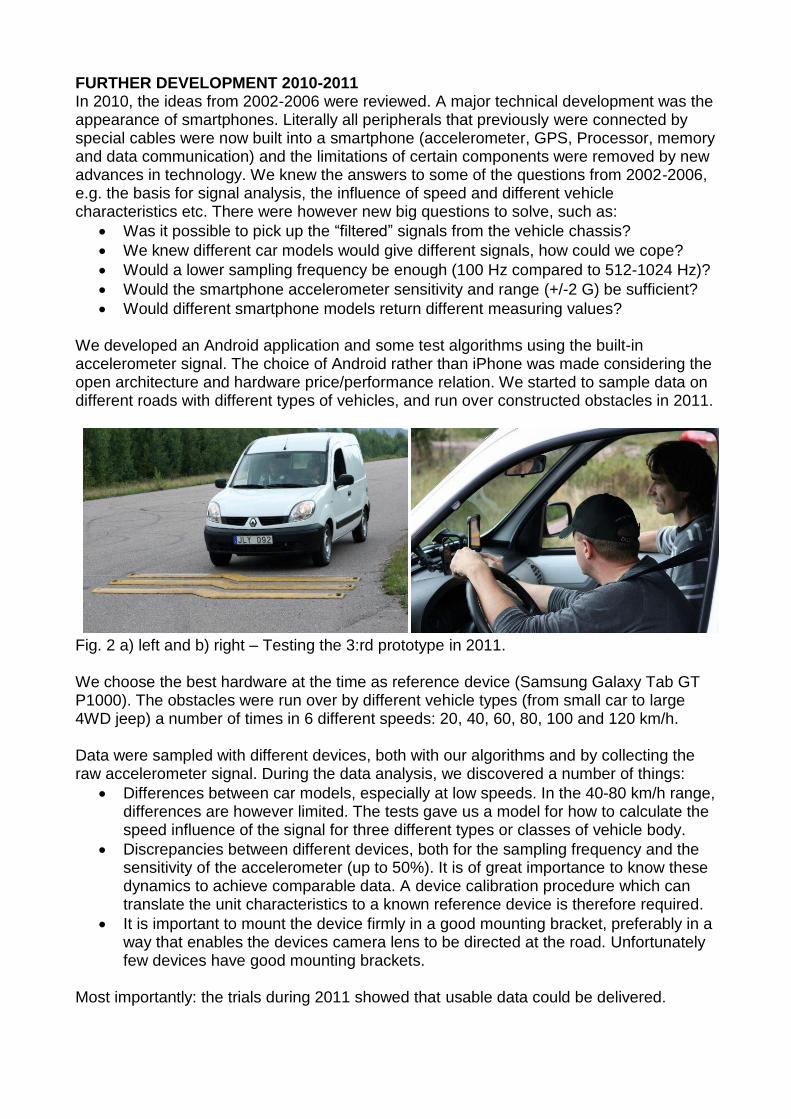
Would different smartphone models return different measuring values? We developed an Android application and some test algorithms using the built-in accelerometer signal. The choice of Android rather than iPhone was made considering the open architecture and hardware price/performance relation. We started to sample data on different roads with different types of vehicles, and run over constructed obstacles in 2011.
Fig. 2 a) left and b) right – Testing the 3:rd prototype in 2011. We choose the best hardware at the time as reference device (Samsung Galaxy Tab GT P1000). The obstacles were run over by different vehicle types (from small car to large 4WD jeep) a number of times in 6 different speeds: 20, 40, 60, 80, 100 and 120 km/h. Data were sampled with different devices, both with our algorithms and by collecting the raw accelerometer signal. During the data analysis, we discovered a number of things:
Differences between car models, especially at low speeds. In the 40-80 km/h range, differences are however limited. The tests gave us a model for how to calculate the speed influence of the signal for three different types or classes of vehicle body.
Discrepancies between different devices, both for the sampling frequency and the sensitivity of the accelerometer (up to 50%). It is of great importance to know these dynamics to achieve comparable data. A device calibration procedure which can translate the unit characteristics to a known reference device is therefore required.
It is important to mount the device firmly in a good mounting bracket, preferably in a way that enables the devices camera lens to be directed at the road. Unfortunately few devices have good mounting brackets.
Most importantly: the trials during 2011 showed that usable data could be delivered.
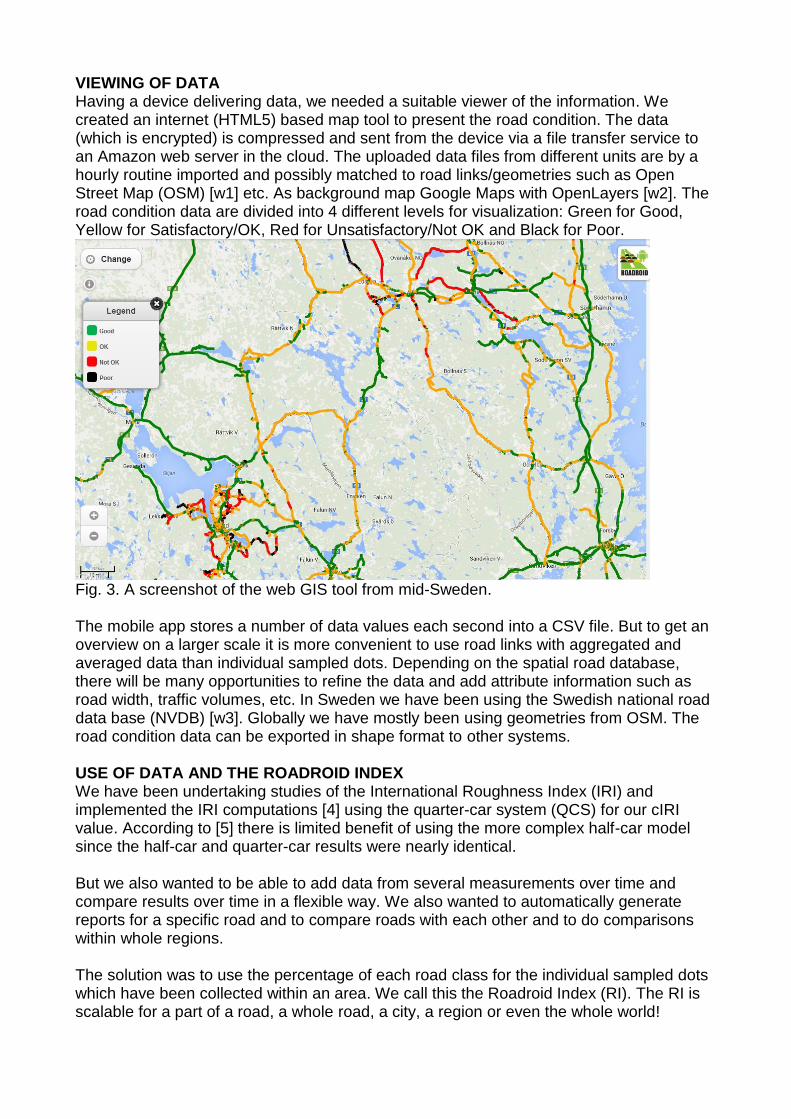
VIEWING OF DATA Having a device delivering data, we needed a suitable viewer of the information. We created an internet (HTML5) based map tool to present the road condition. The data (which is encrypted) is compressed and sent from the device via a file transfer service to an Amazon web server in the cloud. The uploaded data files from different units are by a hourly routine imported and possibly matched to road links/geometries such as Open Street Map (OSM) [w1] etc. As background map Google Maps with OpenLayers [w2]. The road condition data are divided into 4 different levels for visualization: Green for Good, Yellow for Satisfactory/OK, Red for Unsatisfactory/Not OK and Black for Poor.
Fig. 3. A screenshot of the web GIS tool from mid-Sweden. The mobile app stores a number of data values each second into a CSV file. But to get an overview on a larger scale it is more convenient to use road links with aggregated and averaged data than individual sampled dots. Depending on the spatial road database, there will be many opportunities to refine the data and add attribute information such as road width, traffic volumes, etc. In Sweden we have been using the Swedish national road data base (NVDB) [w3]. Globally we have mostly been using geometries from OSM. The road condition data can be exported in shape format to other systems. USE OF DATA AND THE ROADROID INDEX We have been undertaking studies of the International Roughness Index (IRI) and implemented the IRI computations [4] using the quarter-car system (QCS) for our cIRI value. According to [5] there is limited benefit of using the more complex half-car model since the half-car and quarter-car results were nearly identical. But we also wanted to be able to add data from several measurements over time and compare results over time in a flexible way. We also wanted to automatically generate reports for a specific road and to compare roads with each other and to do comparisons within whole regions. The solution was to use the percentage of each road class for the individual sampled dots which have been collected within an area. We call this the Roadroid Index (RI). The RI is scalable for a part of a road, a whole road, a city, a region or even the whole world!
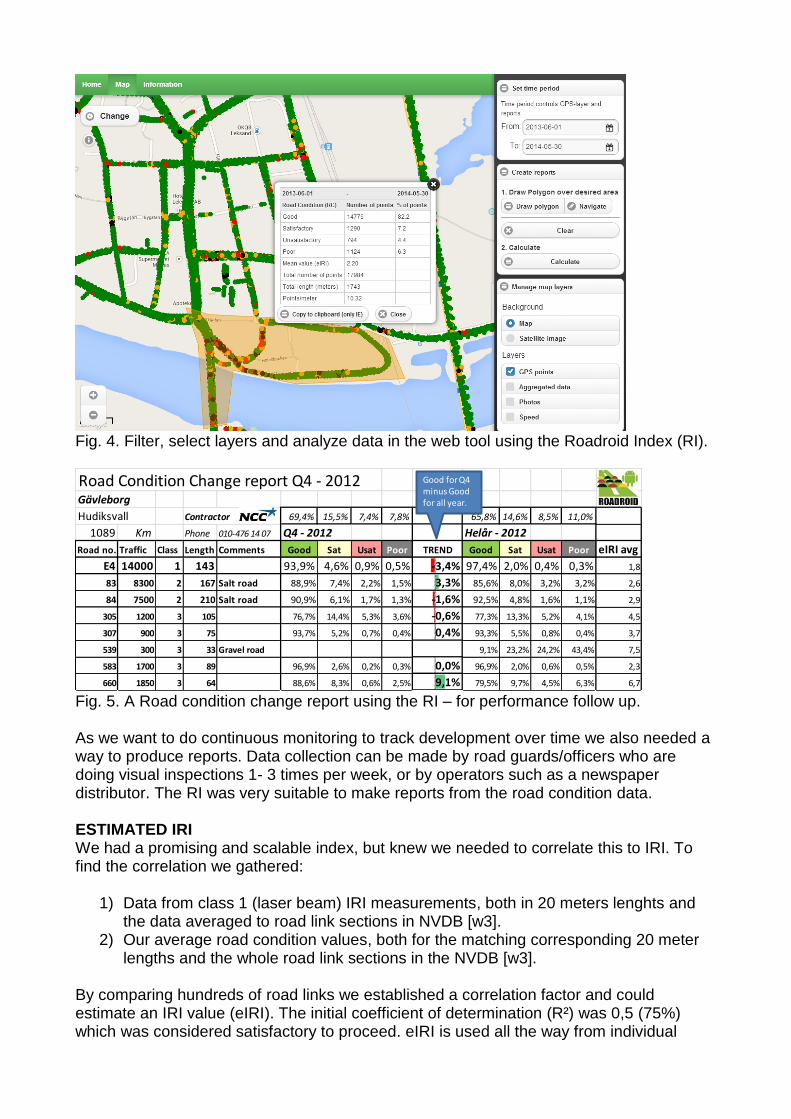
Fig. 4. Filter, select layers and analyze data in the web tool using the Roadroid Index (RI).
Fig. 5. A Road condition change report using the RI – for performance follow up. As we want to do continuous monitoring to track development over time we also needed a way to produce reports. Data collection can be made by road guards/officers who are doing visual inspections 1- 3 times per week, or by operators such as a newspaper distributor. The RI was very suitable to make reports from the road condition data. ESTIMATED IRI We had a promising and scalable index, but knew we needed to correlate this to IRI. To find the correlation we gathered:
1) Data from class 1 (laser beam) IRI measurements, both in 20 meters lenghts and the data averaged to road link sections in NVDB [w3].
2) Our average road condition values, both for the matching corresponding 20 meter lengths and the whole road link sections in the NVDB [w3].
By comparing hundreds of road links we established a correlation factor and could estimate an IRI value (eIRI). The initial coefficient of determination (R²) was 0,5 (75%) which was considered satisfactory to proceed. eIRI is used all the way from individual
Road Condition Change report Q4 - 2012Gävleborg
Hudiksvall Contractor 69,4% 15,5% 7,4% 7,8% 65,8% 14,6% 8,5% 11,0%
1089 Km Phone 010-476 14 07 Q4 - 2012 Helår - 2012
Road no. Traffic Class Length Comments Good Sat Usat Poor TREND Good Sat Usat Poor eIRI avg
E4 14000 1 143 93,9% 4,6% 0,9% 0,5% -3,4% 97,4% 2,0% 0,4% 0,3% 1,8
83 8300 2 167 Salt road 88,9% 7,4% 2,2% 1,5% 3,3% 85,6% 8,0% 3,2% 3,2% 2,6
84 7500 2 210 Salt road 90,9% 6,1% 1,7% 1,3% -1,6% 92,5% 4,8% 1,6% 1,1% 2,9
305 1200 3 105 76,7% 14,4% 5,3% 3,6% -0,6% 77,3% 13,3% 5,2% 4,1% 4,5
307 900 3 75 93,7% 5,2% 0,7% 0,4% 0,4% 93,3% 5,5% 0,8% 0,4% 3,7
539 300 3 33 Gravel road 9,1% 23,2% 24,2% 43,4% 7,5
583 1700 3 89 96,9% 2,6% 0,2% 0,3% 0,0% 96,9% 2,0% 0,6% 0,5% 2,3
660 1850 3 64 88,6% 8,3% 0,6% 2,5% 9,1% 79,5% 9,7% 4,5% 6,3% 6,7
Good for Q4 minus Good for all year.
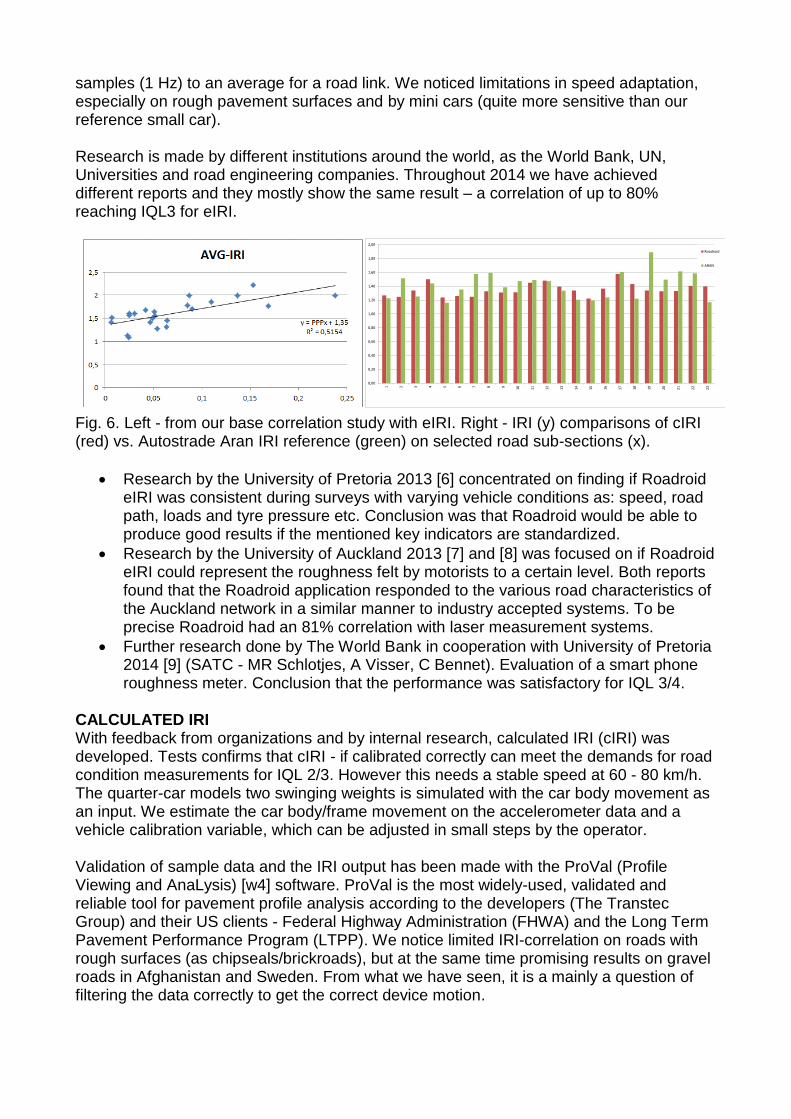
samples (1 Hz) to an average for a road link. We noticed limitations in speed adaptation, especially on rough pavement surfaces and by mini cars (quite more sensitive than our reference small car). Research is made by different institutions around the world, as the World Bank, UN, Universities and road engineering companies. Throughout 2014 we have achieved different reports and they mostly show the same result – a correlation of up to 80% reaching IQL3 for eIRI.
Fig. 6. Left - from our base correlation study with eIRI. Right - IRI (y) comparisons of cIRI (red) vs. Autostrade Aran IRI reference (green) on selected road sub-sections (x).
Research by the University of Pretoria 2013 [6] concentrated on finding if Roadroid eIRI was consistent during surveys with varying vehicle conditions as: speed, road path, loads and tyre pressure etc. Conclusion was that Roadroid would be able to produce good results if the mentioned key indicators are standardized.
Research by the University of Auckland 2013 [7] and [8] was focused on if Roadroid eIRI could represent the roughness felt by motorists to a certain level. Both reports found that the Roadroid application responded to the various road characteristics of the Auckland network in a similar manner to industry accepted systems. To be precise Roadroid had an 81% correlation with laser measurement systems.
Further research done by The World Bank in cooperation with University of Pretoria 2014 [9] (SATC - MR Schlotjes, A Visser, C Bennet). Evaluation of a smart phone roughness meter. Conclusion that the performance was satisfactory for IQL 3/4.
CALCULATED IRI With feedback from organizations and by internal research, calculated IRI (cIRI) was developed. Tests confirms that cIRI - if calibrated correctly can meet the demands for road condition measurements for IQL 2/3. However this needs a stable speed at 60 - 80 km/h. The quarter-car models two swinging weights is simulated with the car body movement as an input. We estimate the car body/frame movement on the accelerometer data and a vehicle calibration variable, which can be adjusted in small steps by the operator. Validation of sample data and the IRI output has been made with the ProVal (Profile Viewing and AnaLysis) [w4] software. ProVal is the most widely-used, validated and reliable tool for pavement profile analysis according to the developers (The Transtec Group) and their US clients - Federal Highway Administration (FHWA) and the Long Term Pavement Performance Program (LTPP). We notice limited IRI-correlation on roads with rough surfaces (as chipseals/brickroads), but at the same time promising results on gravel roads in Afghanistan and Sweden. From what we have seen, it is a mainly a question of filtering the data correctly to get the correct device motion.
0,00
0,20
0,40
0,60
0,80
1,00
1,20
1,40
1,60
1,80
2,00
1 2 3 4 5 6 7 8 9
10
11
12
13
14
15
16
17
18
19
20
21
22
23
Roadroid
ARAN
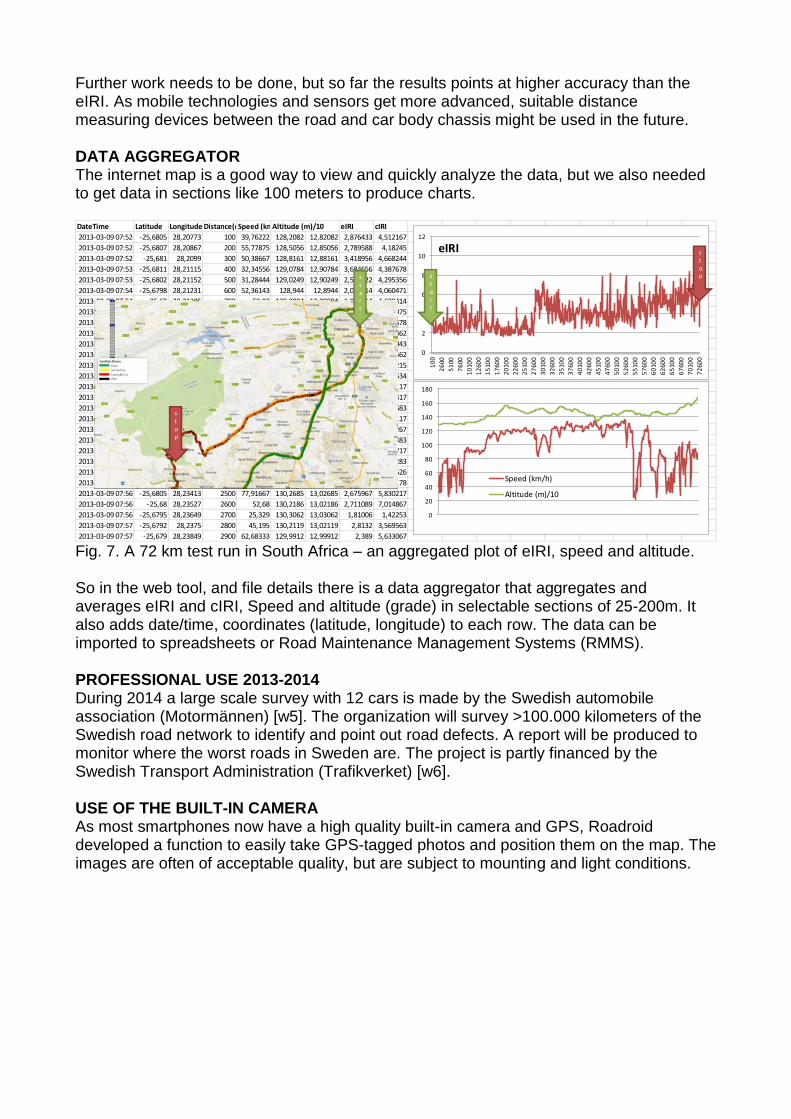
Further work needs to be done, but so far the results points at higher accuracy than the eIRI. As mobile technologies and sensors get more advanced, suitable distance measuring devices between the road and car body chassis might be used in the future. DATA AGGREGATOR The internet map is a good way to view and quickly analyze the data, but we also needed to get data in sections like 100 meters to produce charts.
Fig. 7. A 72 km test run in South Africa – an aggregated plot of eIRI, speed and altitude. So in the web tool, and file details there is a data aggregator that aggregates and averages eIRI and cIRI, Speed and altitude (grade) in selectable sections of 25-200m. It also adds date/time, coordinates (latitude, longitude) to each row. The data can be imported to spreadsheets or Road Maintenance Management Systems (RMMS). PROFESSIONAL USE 2013-2014 During 2014 a large scale survey with 12 cars is made by the Swedish automobile association (Motormännen) [w5]. The organization will survey >100.000 kilometers of the Swedish road network to identify and point out road defects. A report will be produced to monitor where the worst roads in Sweden are. The project is partly financed by the Swedish Transport Administration (Trafikverket) [w6]. USE OF THE BUILT-IN CAMERA As most smartphones now have a high quality built-in camera and GPS, Roadroid developed a function to easily take GPS-tagged photos and position them on the map. The images are often of acceptable quality, but are subject to mounting and light conditions.
DateTime Latitude Longitude Distance(m)Speed (km/h)Altitude (m)/10 eIRI cIRI
2013-03-09 07:52 -25,6805 28,20773 100 39,76222 128,2082 12,82082 2,876433 4,512167
2013-03-09 07:52 -25,6807 28,20867 200 55,77875 128,5056 12,85056 2,789588 4,18245
2013-03-09 07:52 -25,681 28,2099 300 50,38667 128,8161 12,88161 3,418956 4,668244
2013-03-09 07:53 -25,6811 28,21115 400 32,34556 129,0784 12,90784 3,684656 4,387678
2013-03-09 07:53 -25,6802 28,21152 500 31,28444 129,0249 12,90249 2,580122 4,295356
2013-03-09 07:54 -25,6798 28,21231 600 52,36143 128,944 12,8944 2,055414 4,060471
2013-03-09 07:54 -25,68 28,21335 700 59,92 128,9084 12,89084 1,987614 4,689414
2013-03-09 07:54 -25,6802 28,21451 800 53,67625 128,9856 12,89856 1,963013 3,592075
2013-03-09 07:54 -25,6803 28,21569 900 32,57444 129,3456 12,93456 2,601222 2,459678
2013-03-09 07:54 -25,6805 28,21677 1000 49,26875 129,4633 12,94633 2,181925 4,3462
2013-03-09 07:54 -25,6807 28,21787 1100 61,1 129,536 12,9536 2,068029 5,782043
2013-03-09 07:55 -25,6809 28,21905 1200 68,56167 129,7245 12,97245 3,317617 6,4562
2013-03-09 07:55 -25,681 28,22019 1300 71,29167 129,731 12,9731 2,331533 5,25215
2013-03-09 07:55 -25,6812 28,22138 1400 73,37833 129,7947 12,97947 2,205783 4,7634
2013-03-09 07:55 -25,6814 28,22258 1500 72,27 129,9207 12,99207 2,71375 7,648117
2013-03-09 07:55 -25,6816 28,22375 1600 72,43833 130,0557 13,00557 2,073817 5,782417
2013-03-09 07:55 -25,6818 28,22493 1700 74,04167 130,0723 13,00723 2,115883 6,597683
2013-03-09 07:55 -25,682 28,22616 1800 75,91333 130,1243 13,01243 2,500767 6,394117
2013-03-09 07:55 -25,6822 28,2274 1900 76,99667 130,1088 13,01088 2,797483 6,799267
2013-03-09 07:55 -25,6824 28,22867 2000 74,73167 130,2387 13,02387 2,6794 5,953483
2013-03-09 07:55 -25,6824 28,22992 2100 73,34167 130,4493 13,04493 2,929717 7,847717
2013-03-09 07:56 -25,682 28,23107 2200 76,36667 130,5108 13,05108 2,376033 6,660283
2013-03-09 07:56 -25,6814 28,23218 2300 78,602 130,3952 13,03952 3,0342 6,54626
2013-03-09 07:56 -25,681 28,23315 2400 79,534 130,3542 13,03542 1,874 5,74178
2013-03-09 07:56 -25,6805 28,23413 2500 77,91667 130,2685 13,02685 2,675967 5,830217
2013-03-09 07:56 -25,68 28,23527 2600 52,68 130,2186 13,02186 2,711089 7,014867
2013-03-09 07:56 -25,6795 28,23649 2700 25,329 130,3062 13,03062 1,81006 1,42253
2013-03-09 07:57 -25,6792 28,2375 2800 45,195 130,2119 13,02119 2,8132 3,569563
2013-03-09 07:57 -25,679 28,23849 2900 62,68333 129,9912 12,99912 2,389 5,633067
0
2
4
6
8
10
12
10
0
26
00
51
00
76
00
10
100
12
600
15
100
17
600
20
100
22
600
25
100
27
600
30
100
32
600
35
100
37
600
40
100
42
600
45
100
47
600
50
100
52
600
55
100
57
600
60
100
62
600
65
100
67
600
70
100
72
600
eIRI
0
20
40
60
80
100
120
140
160
180
Speed (km/h)
Altitude (m)/10
st
art
s
top
s
t
art
s
top
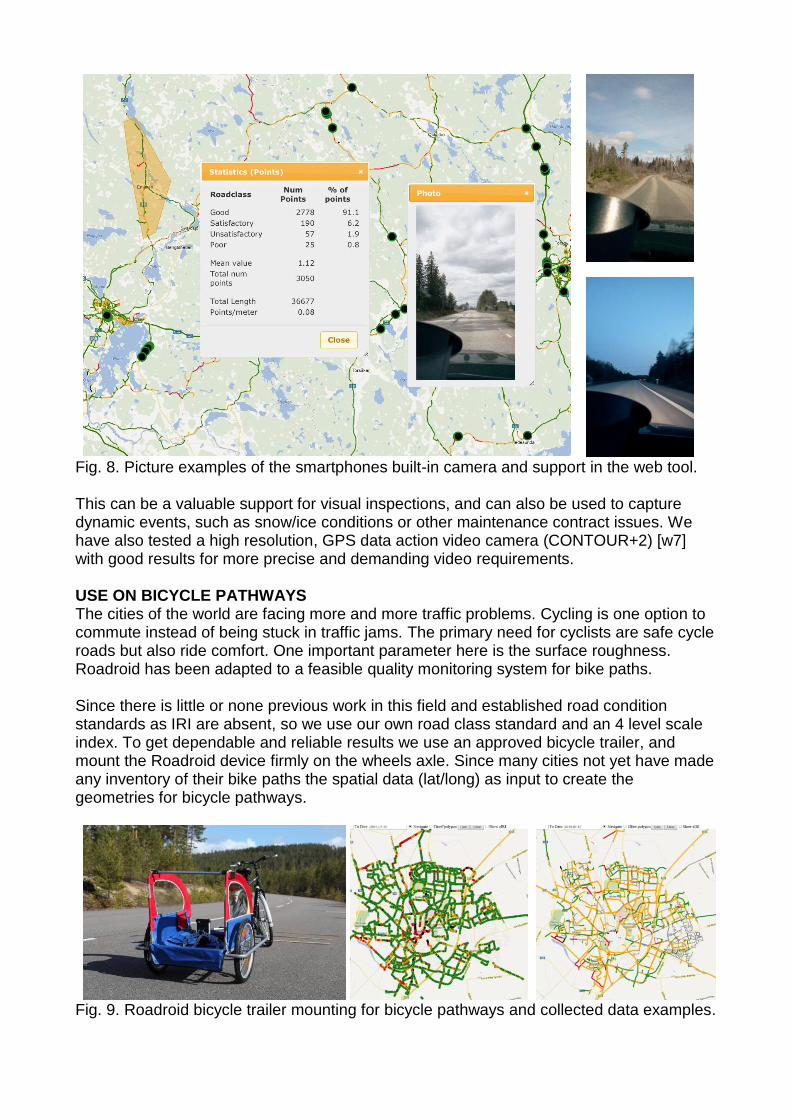
Fig. 8. Picture examples of the smartphones built-in camera and support in the web tool. This can be a valuable support for visual inspections, and can also be used to capture dynamic events, such as snow/ice conditions or other maintenance contract issues. We have also tested a high resolution, GPS data action video camera (CONTOUR+2) [w7] with good results for more precise and demanding video requirements. USE ON BICYCLE PATHWAYS The cities of the world are facing more and more traffic problems. Cycling is one option to commute instead of being stuck in traffic jams. The primary need for cyclists are safe cycle roads but also ride comfort. One important parameter here is the surface roughness. Roadroid has been adapted to a feasible quality monitoring system for bike paths. Since there is little or none previous work in this field and established road condition standards as IRI are absent, so we use our own road class standard and an 4 level scale index. To get dependable and reliable results we use an approved bicycle trailer, and mount the Roadroid device firmly on the wheels axle. Since many cities not yet have made any inventory of their bike paths the spatial data (lat/long) as input to create the geometries for bicycle pathways.
Fig. 9. Roadroid bicycle trailer mounting for bicycle pathways and collected data examples.
CONCLUSION Using smart phones for road surveys is an efficient, scalable, and cost-effective way for road organizations to gather road condition data. In this paper we have illustrated this with the Roadroid system. The system does not require a phone network connection during the data collection can easily geo-locate data on a global level with sufficient accuracy even down to object levels.
The estimated IRI reach IQL 3/4 and correlates up to 75-81% compared to IQL1 (laser) devices [7], [8] and [9].
The calculated IRI can with consistent speeds in 60-80 km/h, and tuned vehicle sensitivity reach higher accuracy (Possibly IQL 2/3)
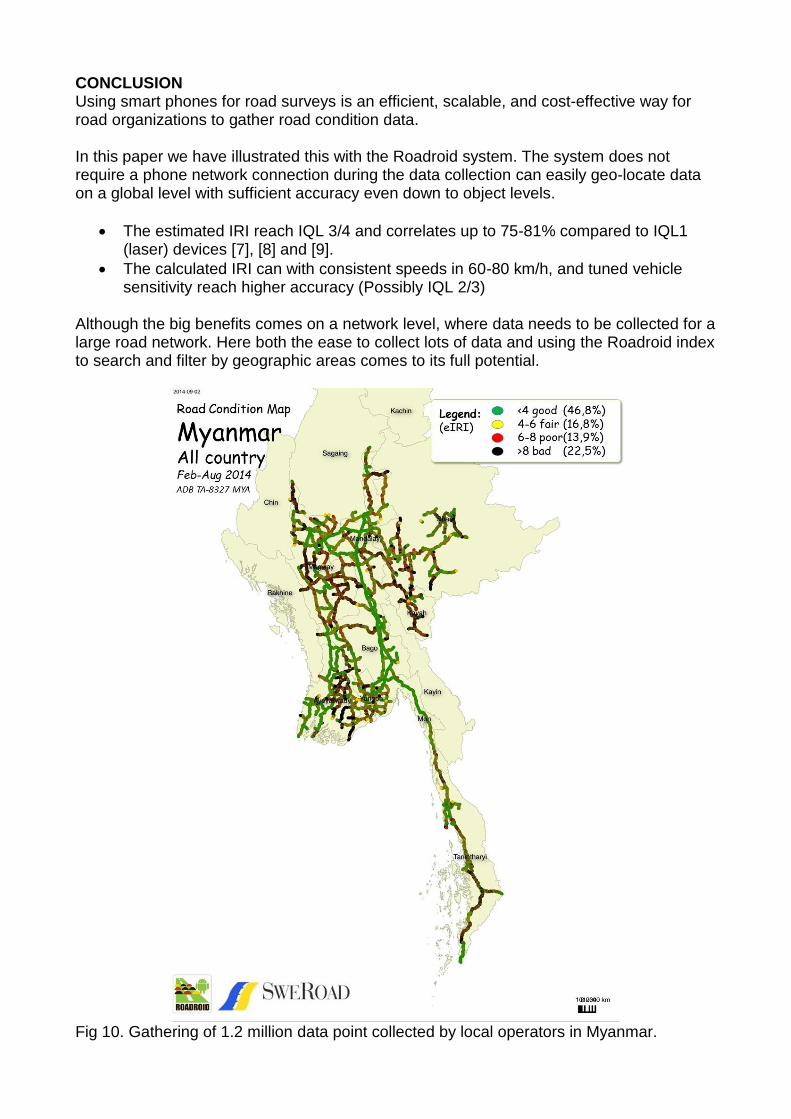
Although the big benefits comes on a network level, where data needs to be collected for a large road network. Here both the ease to collect lots of data and using the Roadroid index to search and filter by geographic areas comes to its full potential.
Fig 10. Gathering of 1.2 million data point collected by local operators in Myanmar.
REFERENCES [1] Michael W. Sayers, Thomas D. Gillespie, and Cesar A. V. Queiroz, “The International Road Roughness Experiment: Establishing Correlation and a Calibration Standard for measurements,” World Bank Technical paper number 45, Washington DC, 1986. [2] THE DANA AUTOMATIC RECORDING ROUGHOMETER FOR MEASURING HIGHWAY ROUGHNESS, 1933. [3] Sayers, M. W., and S. Karamihas. “Interpretation of Road Roughness Profile Data”. Final Report UMTRI 96-19, University of Michigan, 1996. [4] Michael W Sayers, Thomas D. Gillespie, and William D. 0. Paterson, “Guidelines for Conducting and Calibrating Road Roughness Measurements,” World Bank Technical paper number 46, Washington DC, 1986 [5] Keith J. Wakeham, D. Geoff Rideout. “Model complexity requirements in design of half car active suspension controllers,” Memorial University Canada, 2011 [6] K.E.Tarr, “Evaluation of Response Type Application for Measuring Road Roughness”, University of Pretoria, South Africa, 2013 [7] Myles Johnston. “Using cell-phones to monitor road roughness”, Department of Civil and environmental Engineering, University of Auckland, Auckland, New Zealand, 2013 [8] Tasnimul Islam. “Using cell-phones to monitor road roughness”, Department of Civil and environmental Engineering, University of Auckland, Auckland, New Zealand, 2013 [9] M R Schlotjes, A Visser, C Bennet. Evaluation of a smart phone roughness meter, University of Pretoria, 2014 WEB REFERENCES [w1] OpenLayers (2014, may 30). “OpenLayers home”, http://openlayers.org/ [w2] OpenStreetMap (2014, may 30). “OpenStreetMap”, http://www.openstreetmap.org/ [w3] Trafikverket (2014, may 30). “Start page - NVDB” [w4] ProVal (2014, may 30). “ProVal: View and analyze pavement profiles”. [w5] Motormännen. (2014, may 19). “Vägombuden kontrollerar svenska vägars säkerhet”, www.motormannen.se/nyheter/2014/vagombuden-kontrollerar-svenska-vagars-sakerhet/ [w6] Trafikverket (2014, may 30). “Startsida”, [Online]. Available: http://www.trafikverket.se/ ACKNOWLEDGEMENTS The Kartographic Society - Innovation award (Sweden, March 2013) UN World Summit Award - Global Champion in eGovernance (Abu Dhabi, February 2013) European Satellite Navigation Competition - Regional winner (Munich, October 2012).