Embed Size (px)
DESCRIPTION
Study undertaken by retail research team at the University of Southampton led by Professor Neil Wrigley
Citation preview
Romsey Town Centre Study September 2011
Neil Wrigley, Jen Li, Katherine Cudworth, Dionysia Lambiri & Michelle Lowe
2
Presentation outline
1. University of Southampton research team
2. Project background and methodology
3. Key Findings
4. Food shopping in Romsey
5. Non-food shopping in Romsey
6. Linked trips
7. Perceptions of Romsey
8. Future enhancements
9. Take home messages
3
University of Southampton research team
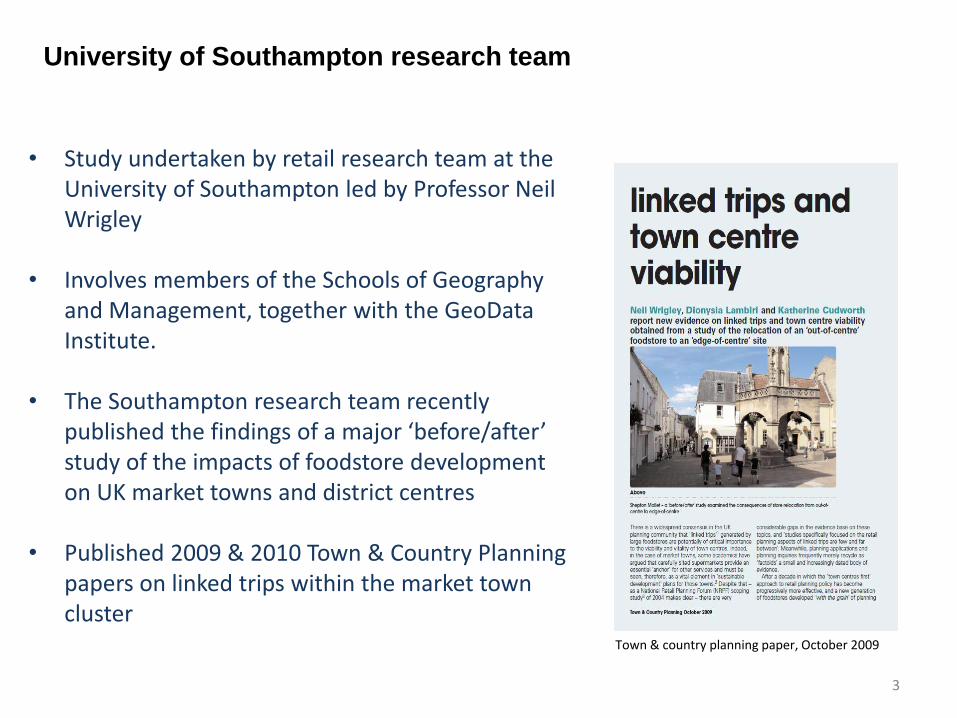
• Study undertaken by retail research team at the University of Southampton led by Professor Neil Wrigley
• Involves members of the Schools of Geography
and Management, together with the GeoData Institute.
• The Southampton research team recently
published the findings of a major ‘before/after’ study of the impacts of foodstore development on UK market towns and district centres
• Published 2009 & 2010 Town & Country Planning
papers on linked trips within the market town cluster
Town & country planning paper, October 2009
4
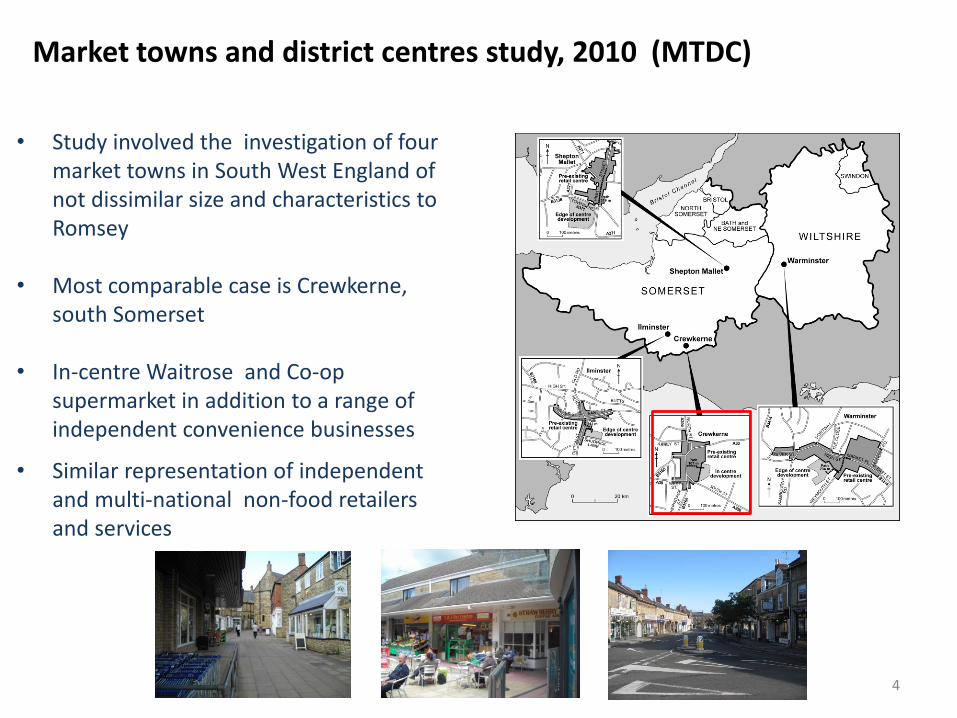
• Study involved the investigation of four market towns in South West England of not dissimilar size and characteristics to Romsey
• Most comparable case is Crewkerne, south Somerset
• In-centre Waitrose and Co-op supermarket in addition to a range of independent convenience businesses
• Similar representation of independent and multi-national non-food retailers and services
Market towns and district centres study, 2010 (MTDC)
5
Project background and methodology
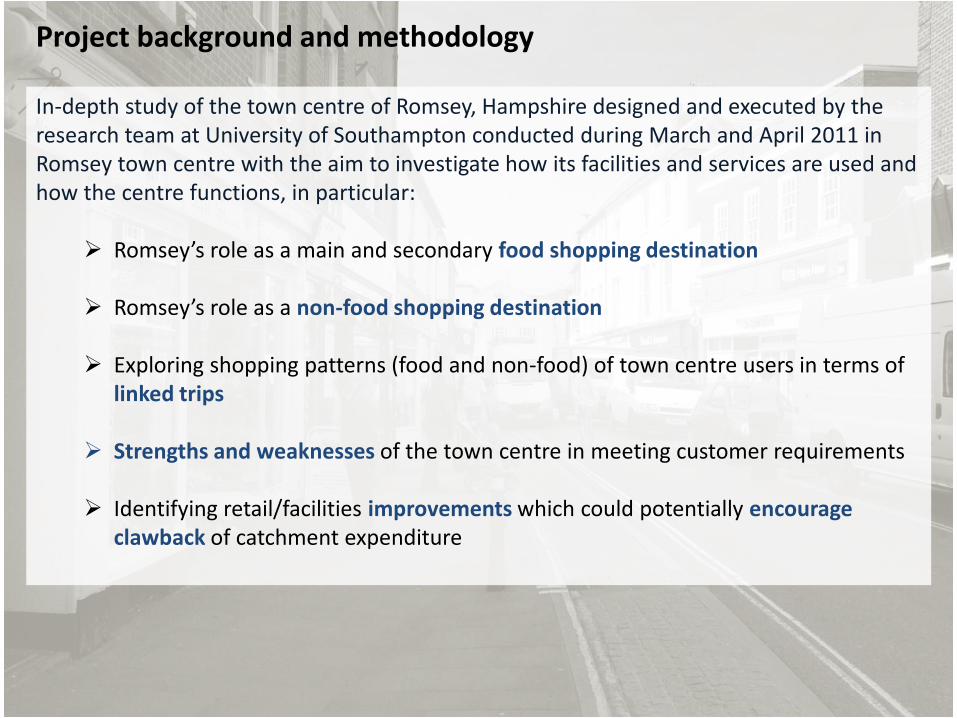
In-depth study of the town centre of Romsey, Hampshire designed and executed by the research team at University of Southampton conducted during March and April 2011 in Romsey town centre with the aim to investigate how its facilities and services are used and how the centre functions, in particular:
Romsey’s role as a main and secondary food shopping destination Romsey’s role as a non-food shopping destination
Exploring shopping patterns (food and non-food) of town centre users in terms of
linked trips
Strengths and weaknesses of the town centre in meeting customer requirements
Identifying retail/facilities improvements which could potentially encourage clawback of catchment expenditure
6
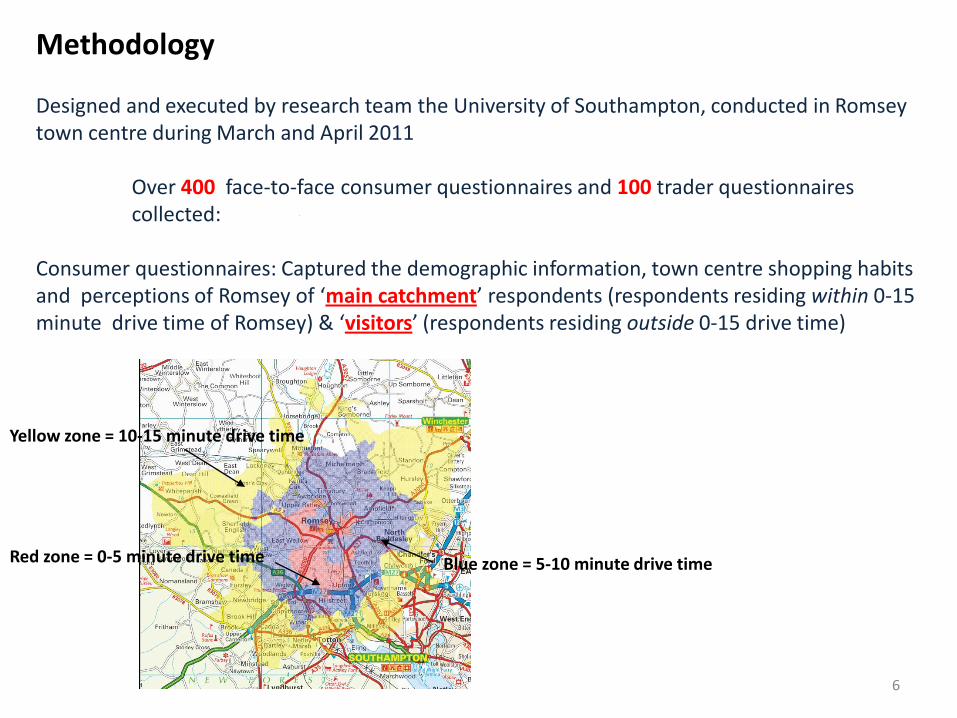
Methodology Designed and executed by research team the University of Southampton, conducted in Romsey town centre during March and April 2011 Over 400 face-to-face consumer questionnaires and 100 trader questionnaires collected: Consumer questionnaires: Captured the demographic information, town centre shopping habits and perceptions of Romsey of ‘main catchment’ respondents (respondents residing within 0-15 minute drive time of Romsey) & ‘visitors’ (respondents residing outside 0-15 drive time)
Red zone = 0-5 minute drive time Blue zone = 5-10 minute drive time
Yellow zone = 10-15 minute drive time
Methodology
Catchment zone
Age segment of respondent
Achieved Total
Total Target
Achieved % of Total Target
below 34 34 to 59 60 and over
Achieved Target Achieved Target Achieved Target
0-5 mins drive time
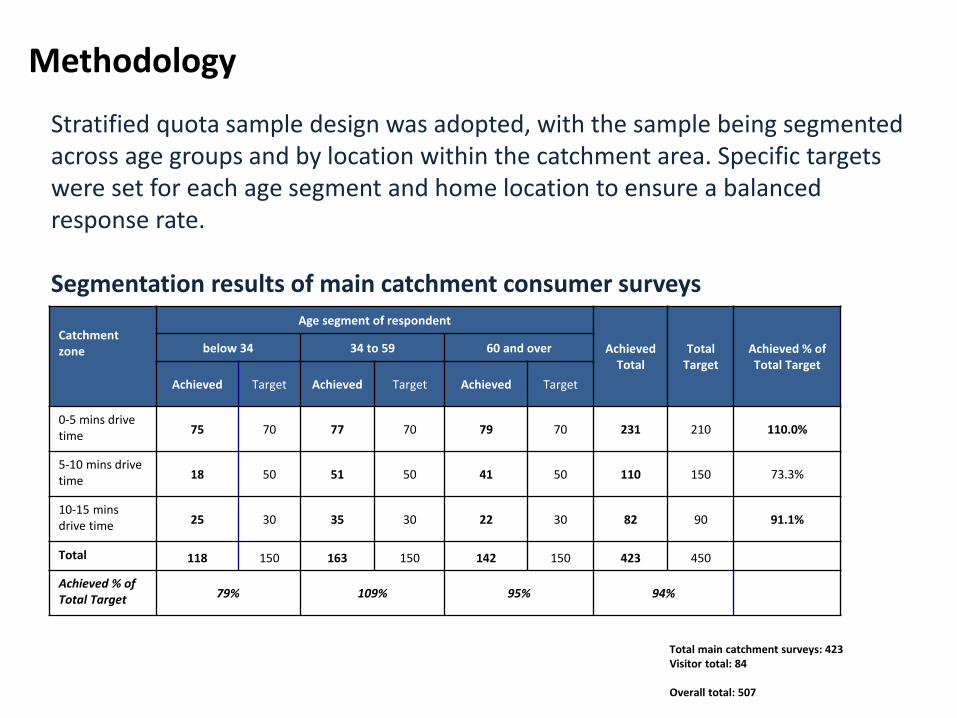
75 70 77 70 79 70 231 210 110.0%
5-10 mins drive time 18 50 51 50 41 50 110 150 73.3%
10-15 mins drive time 25 30 35 30 22 30 82 90 91.1%
Total 118 150 163 150 142 150 423 450
Achieved % of Total Target 79% 109% 95% 94%
Stratified quota sample design was adopted, with the sample being segmented across age groups and by location within the catchment area. Specific targets were set for each age segment and home location to ensure a balanced response rate. Segmentation results of main catchment consumer surveys
Total main catchment surveys: 423 Visitor total: 84 Overall total: 507
8
Key Findings
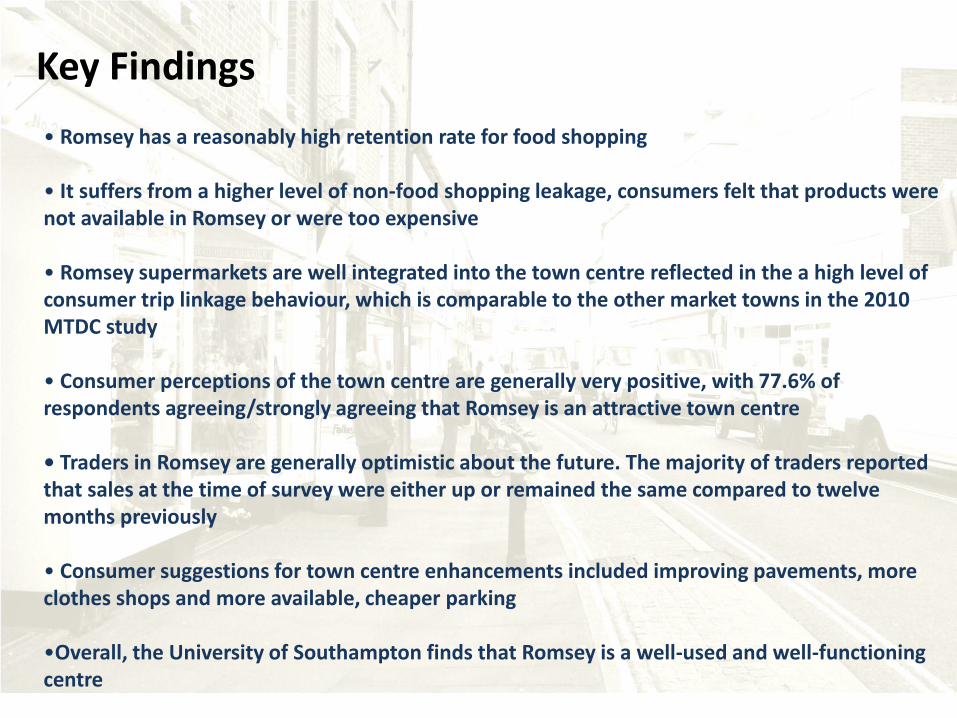
• Romsey has a reasonably high retention rate for food shopping • It suffers from a higher level of non-food shopping leakage, consumers felt that products were not available in Romsey or were too expensive • Romsey supermarkets are well integrated into the town centre reflected in the a high level of consumer trip linkage behaviour, which is comparable to the other market towns in the 2010 MTDC study • Consumer perceptions of the town centre are generally very positive, with 77.6% of respondents agreeing/strongly agreeing that Romsey is an attractive town centre • Traders in Romsey are generally optimistic about the future. The majority of traders reported that sales at the time of survey were either up or remained the same compared to twelve months previously • Consumer suggestions for town centre enhancements included improving pavements, more clothes shops and more available, cheaper parking
•Overall, the University of Southampton finds that Romsey is a well-used and well-functioning centre
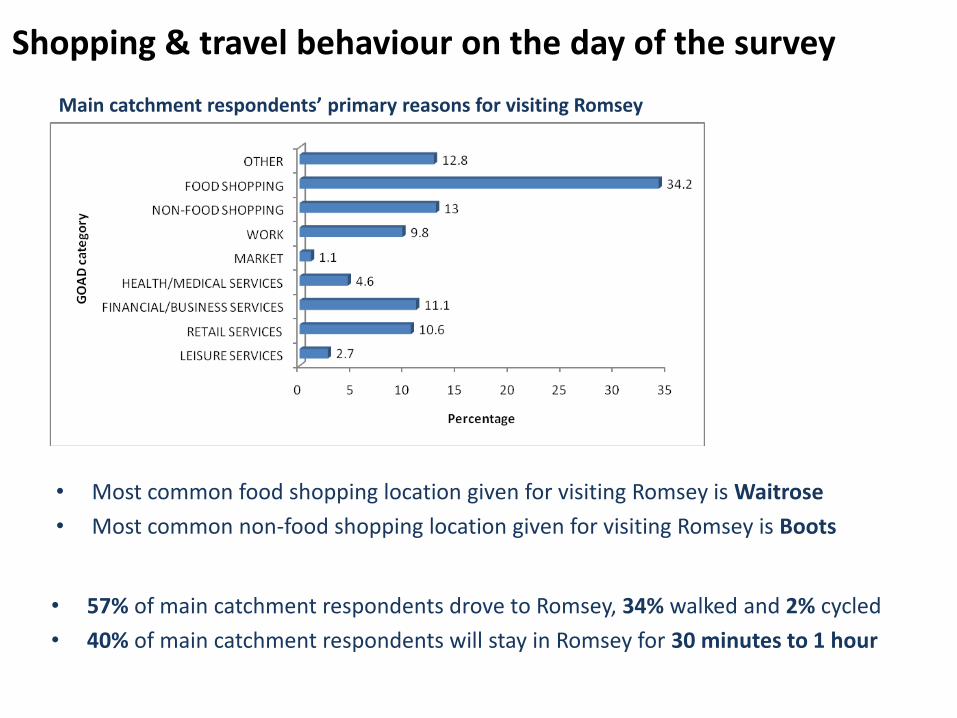
Shopping & travel behaviour on the day of the survey
• Most common food shopping location given for visiting Romsey is Waitrose
• Most common non-food shopping location given for visiting Romsey is Boots
Main catchment respondents’ primary reasons for visiting Romsey
• 57% of main catchment respondents drove to Romsey, 34% walked and 2% cycled
• 40% of main catchment respondents will stay in Romsey for 30 minutes to 1 hour
53% 9%
9% 8% Aldi own
Waitrose own
6%
8% Private Rd
3%
2% Abbey
1%
1%
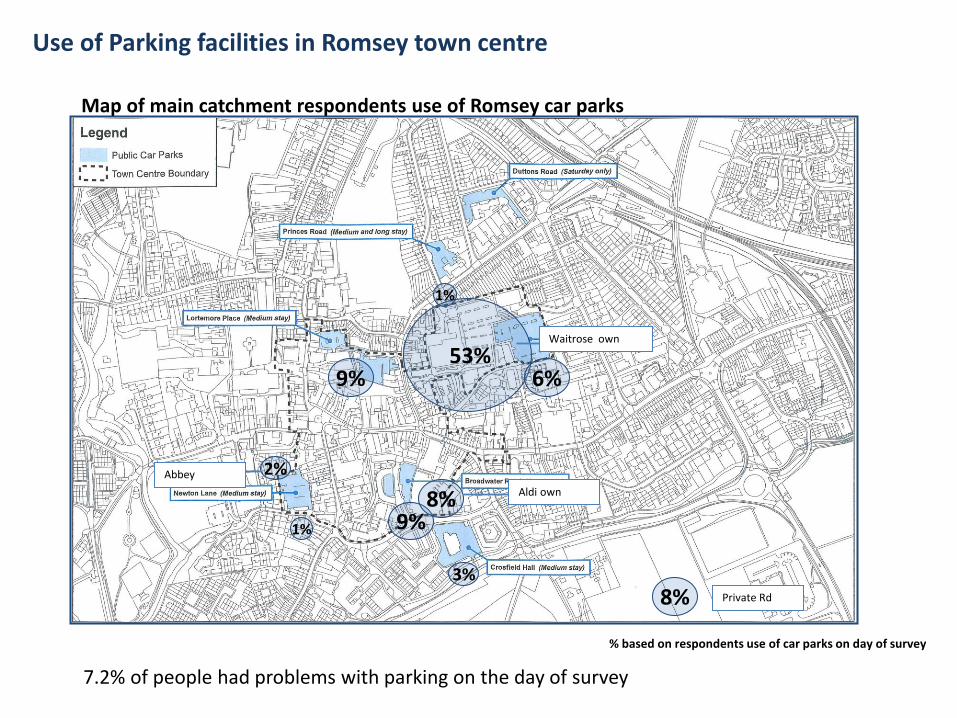
Use of Parking facilities in Romsey town centre
Map of main catchment respondents use of Romsey car parks
% based on respondents use of car parks on day of survey
7.2% of people had problems with parking on the day of survey
11
University of Southampton Romsey Study Food shopping
12
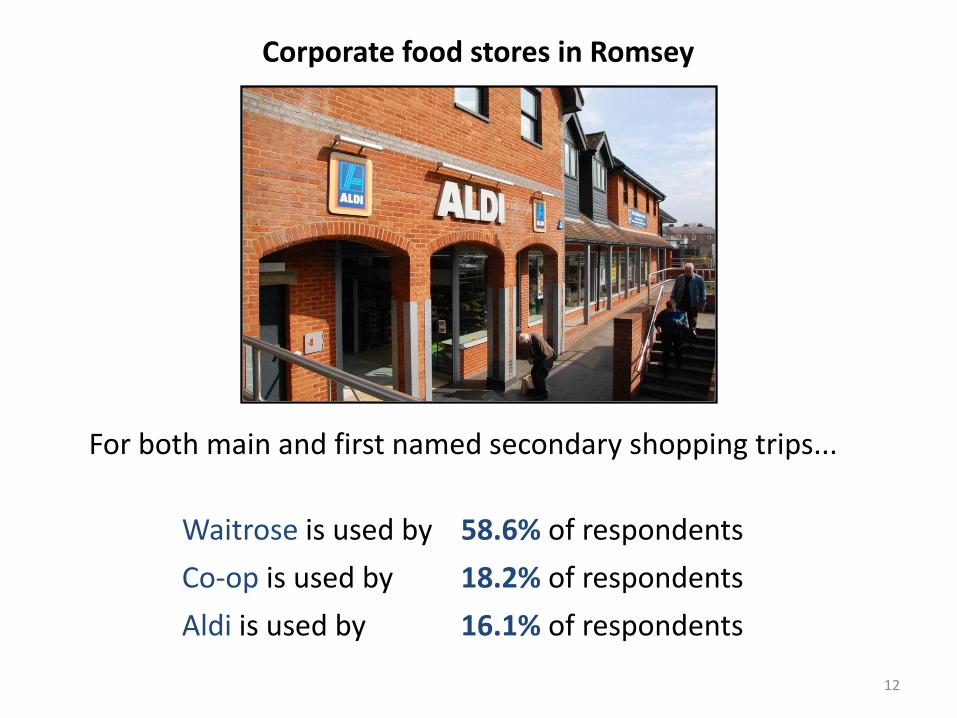
Corporate food stores in Romsey
For both main and first named secondary shopping trips...
Waitrose is used by 58.6% of respondents
Co-op is used by 18.2% of respondents
Aldi is used by 16.1% of respondents
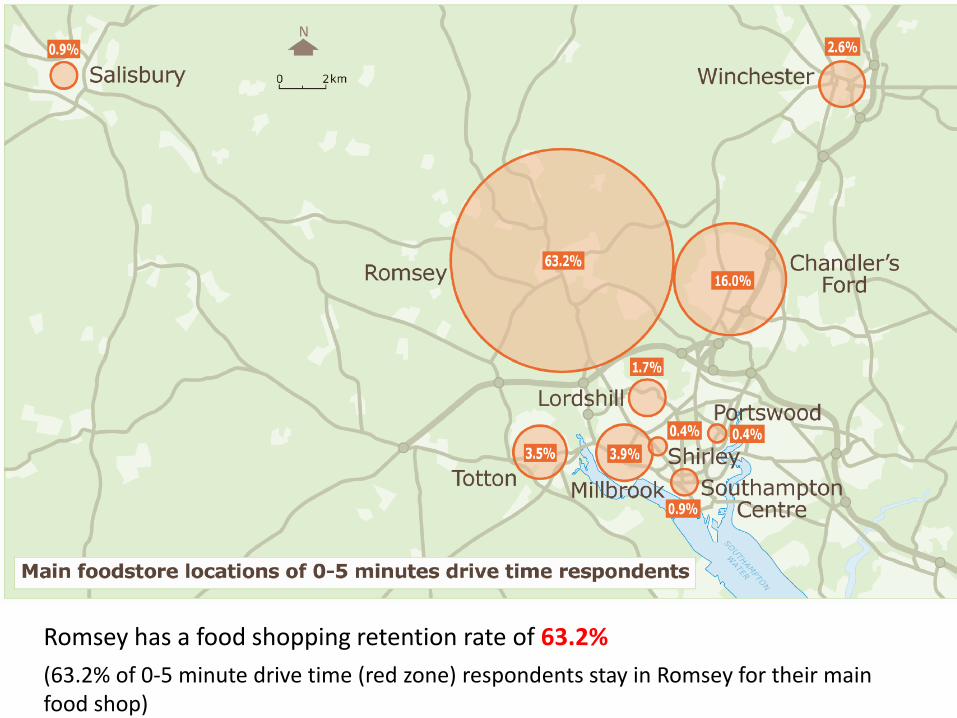
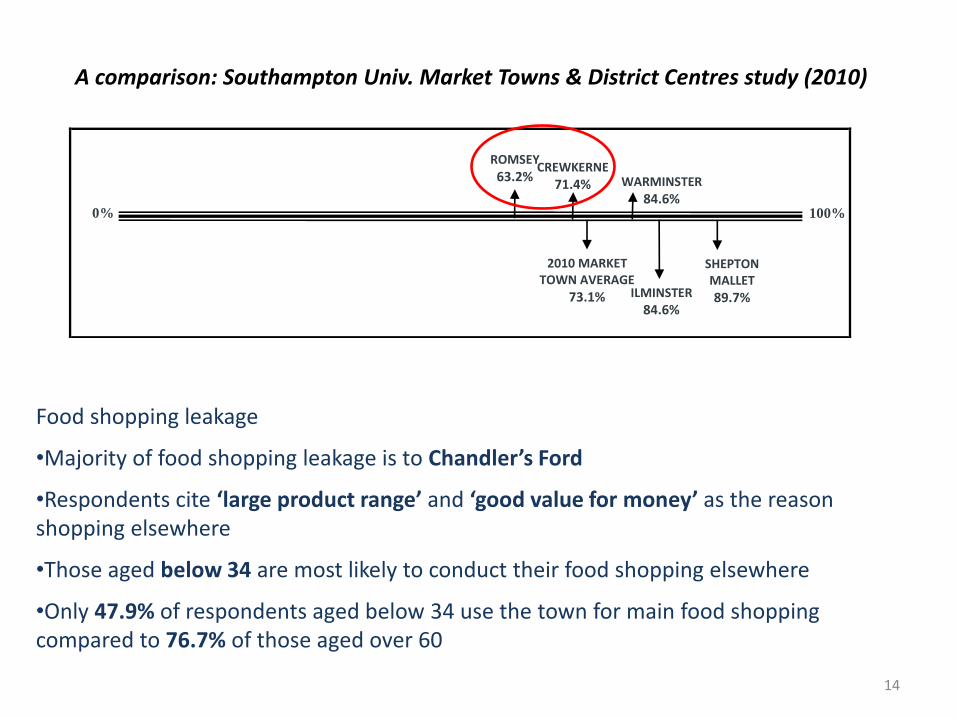
Romsey has a food shopping retention rate of 63.2%
(63.2% of 0-5 minute drive time (red zone) respondents stay in Romsey for their main food shop)
14
Food shopping leakage
•Majority of food shopping leakage is to Chandler’s Ford
•Respondents cite ‘large product range’ and ‘good value for money’ as the reason shopping elsewhere
•Those aged below 34 are most likely to conduct their food shopping elsewhere
•Only 47.9% of respondents aged below 34 use the town for main food shopping compared to 76.7% of those aged over 60
ROMSEY
63.2%
2010 MARKET TOWN AVERAGE
73.1%
0% 100%
CREWKERNE
71.4%
SHEPTON MALLET
89.7% ILMINSTER
84.6%
WARMINSTER
84.6%
A comparison: Southampton Univ. Market Towns & District Centres study (2010)
15
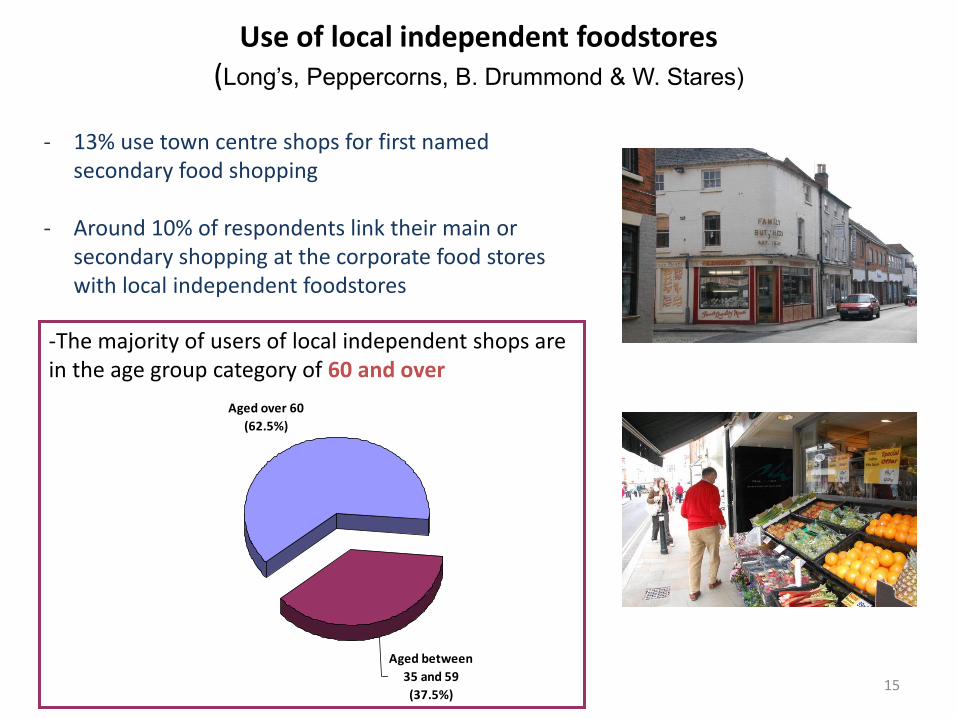
Use of local independent foodstores (Long’s, Peppercorns, B. Drummond & W. Stares)
- 13% use town centre shops for first named secondary food shopping
- Around 10% of respondents link their main or secondary shopping at the corporate food stores with local independent foodstores
Aged over 60
(62.5%)
Aged between
35 and 59
(37.5%)
-The majority of users of local independent shops are in the age group category of 60 and over
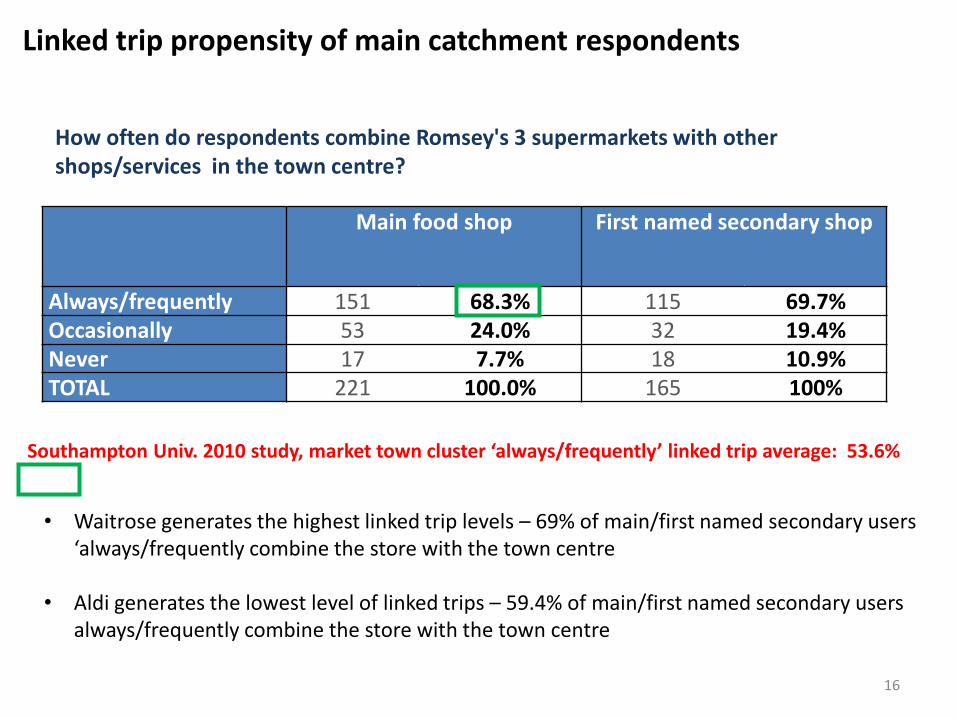
Southampton Univ. 2010 study, market town cluster ‘always/frequently’ linked trip average: 53.6%
Main food shop First named secondary shop
Always/frequently 151 68.3% 115 69.7% Occasionally 53 24.0% 32 19.4% Never 17 7.7% 18 10.9% TOTAL 221 100.0% 165 100%
16
Linked trip propensity of main catchment respondents
How often do respondents combine Romsey's 3 supermarkets with other shops/services in the town centre?
• Waitrose generates the highest linked trip levels – 69% of main/first named secondary users ‘always/frequently combine the store with the town centre
• Aldi generates the lowest level of linked trips – 59.4% of main/first named secondary users
always/frequently combine the store with the town centre
17
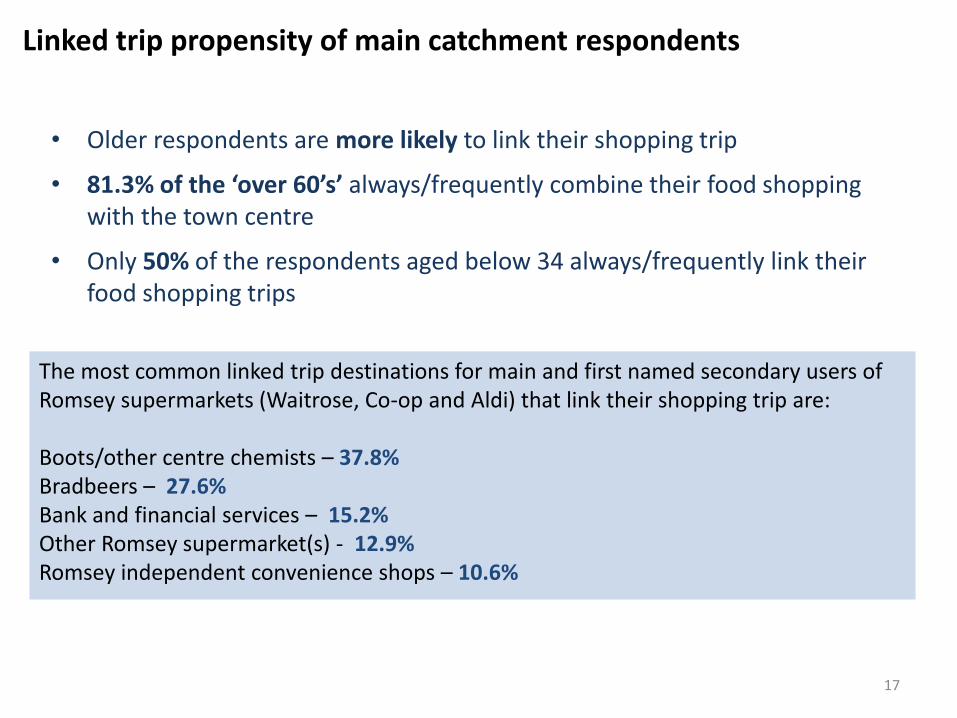
Linked trip propensity of main catchment respondents
The most common linked trip destinations for main and first named secondary users of Romsey supermarkets (Waitrose, Co-op and Aldi) that link their shopping trip are: Boots/other centre chemists – 37.8% Bradbeers – 27.6% Bank and financial services – 15.2% Other Romsey supermarket(s) - 12.9% Romsey independent convenience shops – 10.6%
• Older respondents are more likely to link their shopping trip
• 81.3% of the ‘over 60’s’ always/frequently combine their food shopping with the town centre
• Only 50% of the respondents aged below 34 always/frequently link their food shopping trips
18
University of Southampton Romsey study
Non-food shopping in Romsey
19
Non-food shopping
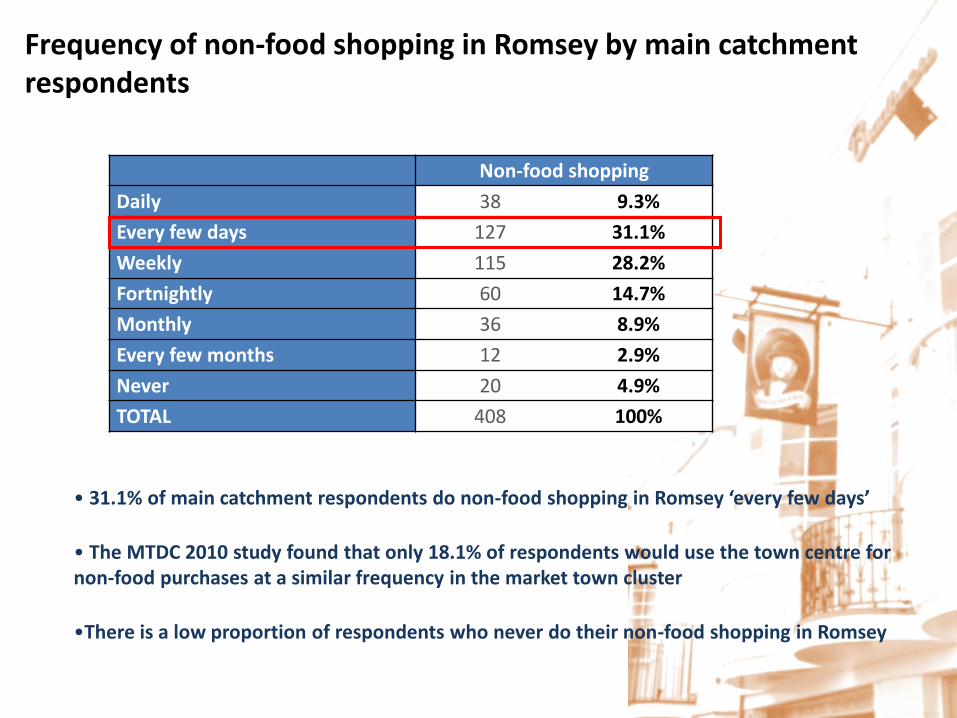
Daily 38 9.3%
Every few days 127 31.1%
Weekly 115 28.2%
Fortnightly 60 14.7%
Monthly 36 8.9%
Every few months 12 2.9%
Never 20 4.9%
TOTAL 408 100%
Frequency of non-food shopping in Romsey by main catchment respondents
• 31.1% of main catchment respondents do non-food shopping in Romsey ‘every few days’
• The MTDC 2010 study found that only 18.1% of respondents would use the town centre for non-food purchases at a similar frequency in the market town cluster
•There is a low proportion of respondents who never do their non-food shopping in Romsey
20
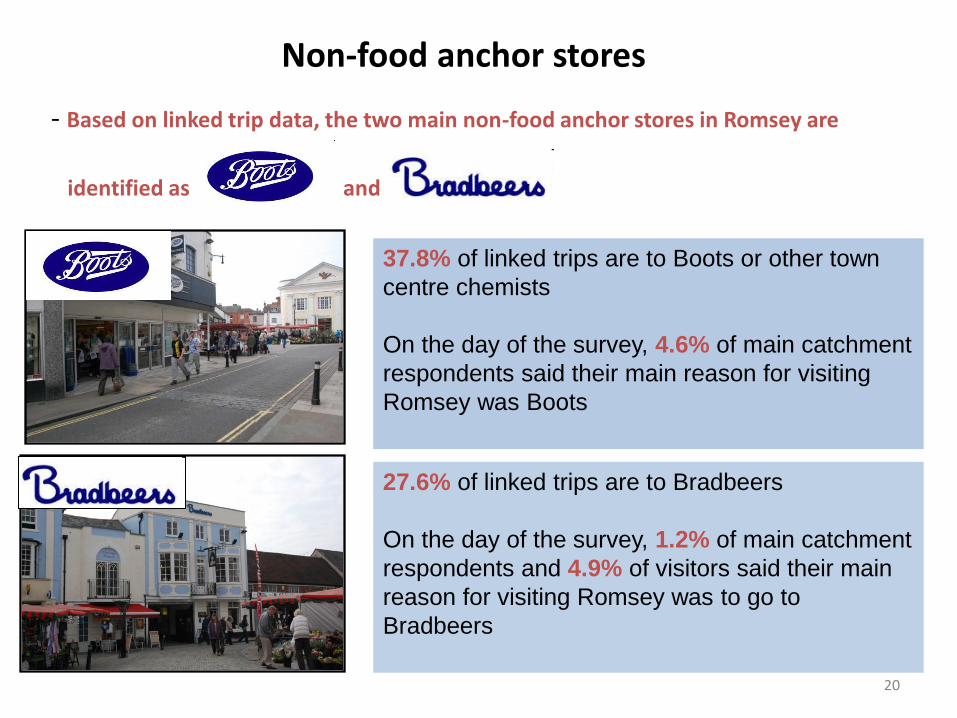
Non-food anchor stores
- Based on linked trip data, the two main non-food anchor stores in Romsey are
identified as and
27.6% of linked trips are to Bradbeers
On the day of the survey, 1.2% of main catchment
respondents and 4.9% of visitors said their main
reason for visiting Romsey was to go to
Bradbeers
37.8% of linked trips are to Boots or other town
centre chemists
On the day of the survey, 4.6% of main catchment
respondents said their main reason for visiting
Romsey was Boots
21
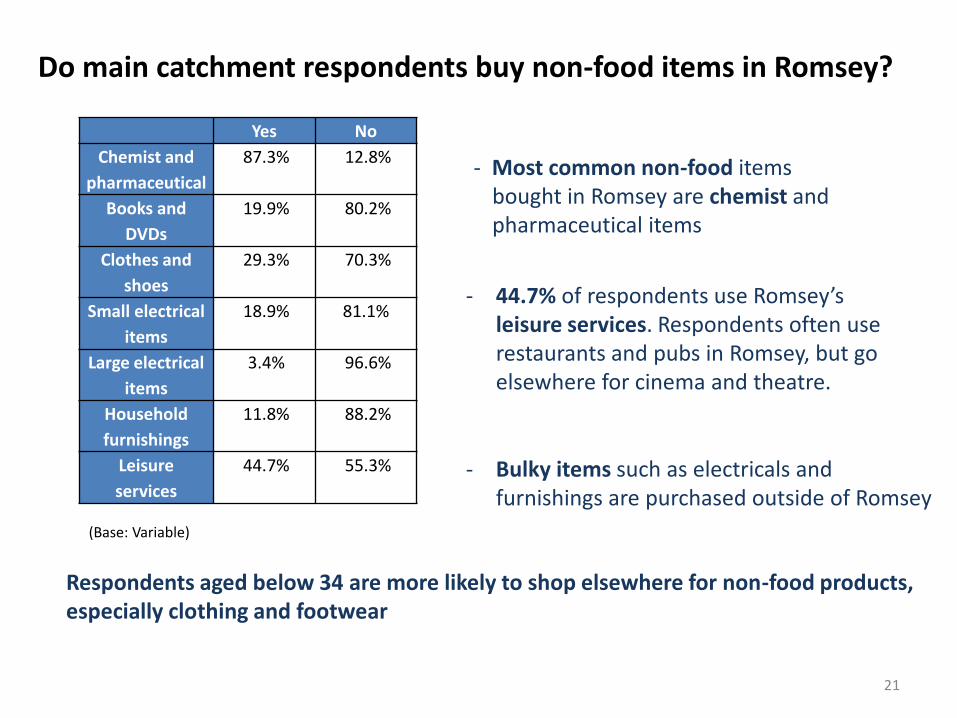
Do main catchment respondents buy non-food items in Romsey?
Yes No
Chemist and
pharmaceutical
87.3% 12.8%
Books and
DVDs
19.9% 80.2%
Clothes and
shoes
29.3% 70.3%
Small electrical
items
18.9% 81.1%
Large electrical
items
3.4% 96.6%
Household
furnishings
11.8% 88.2%
Leisure
services
44.7% 55.3%
(Base: Variable)
- Bulky items such as electricals and furnishings are purchased outside of Romsey
- Most common non-food items bought in Romsey are chemist and pharmaceutical items
- 44.7% of respondents use Romsey’s leisure services. Respondents often use restaurants and pubs in Romsey, but go elsewhere for cinema and theatre.
Respondents aged below 34 are more likely to shop elsewhere for non-food products, especially clothing and footwear
22
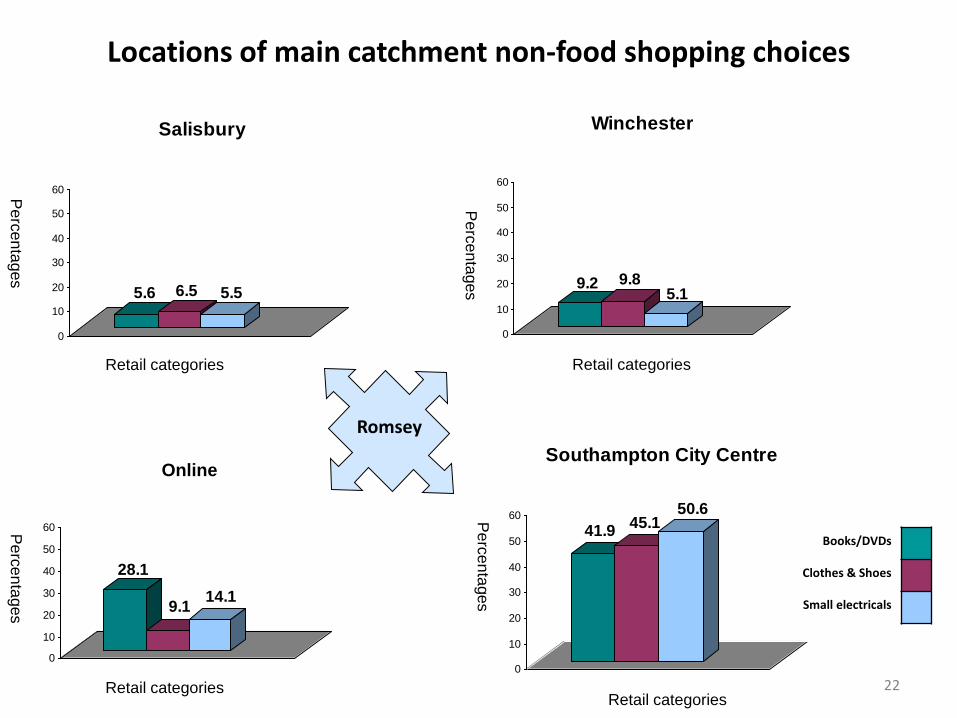
Locations of main catchment non-food shopping choices
28.1
9.114.1
0
10
20
30
40
50
60
Online
41.945.1
50.6
0
10
20
30
40
50
60
Southampton City Centre
Retail categories
Pe
rce
nta
ges
Retail categories
Pe
rcen
tages
Pe
rcen
tages
Pe
rcen
tages
Retail categories
Pe
rcen
tages
Romsey
Retail categories
9.2 9.85.1
0
10
20
30
40
50
60
Winchester
5.6 6.5 5.5
0
10
20
30
40
50
60
Salisbury
Books/DVDs
Clothes & Shoes
Small electricals
23
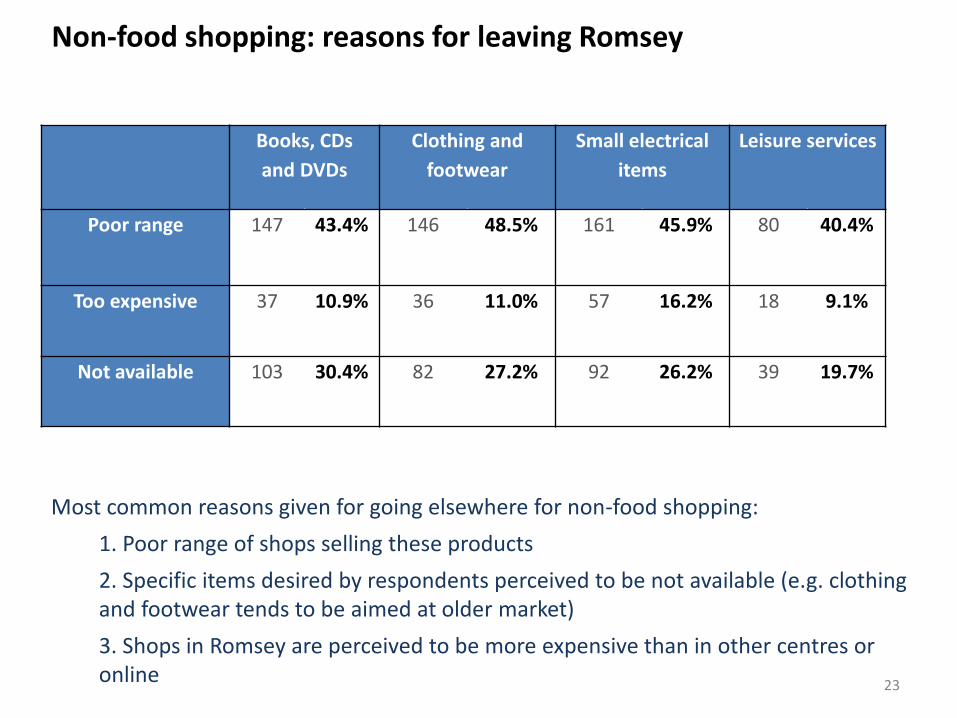
Non-food shopping: reasons for leaving Romsey
Books, CDs
and DVDs
Clothing and
footwear
Small electrical
items
Leisure services
Poor range 147 43.4% 146 48.5% 161 45.9% 80 40.4%
Too expensive 37 10.9% 36 11.0% 57 16.2% 18 9.1%
Not available 103 30.4% 82 27.2% 92 26.2% 39 19.7%
Most common reasons given for going elsewhere for non-food shopping:
1. Poor range of shops selling these products
2. Specific items desired by respondents perceived to be not available (e.g. clothing and footwear tends to be aimed at older market)
3. Shops in Romsey are perceived to be more expensive than in other centres or online
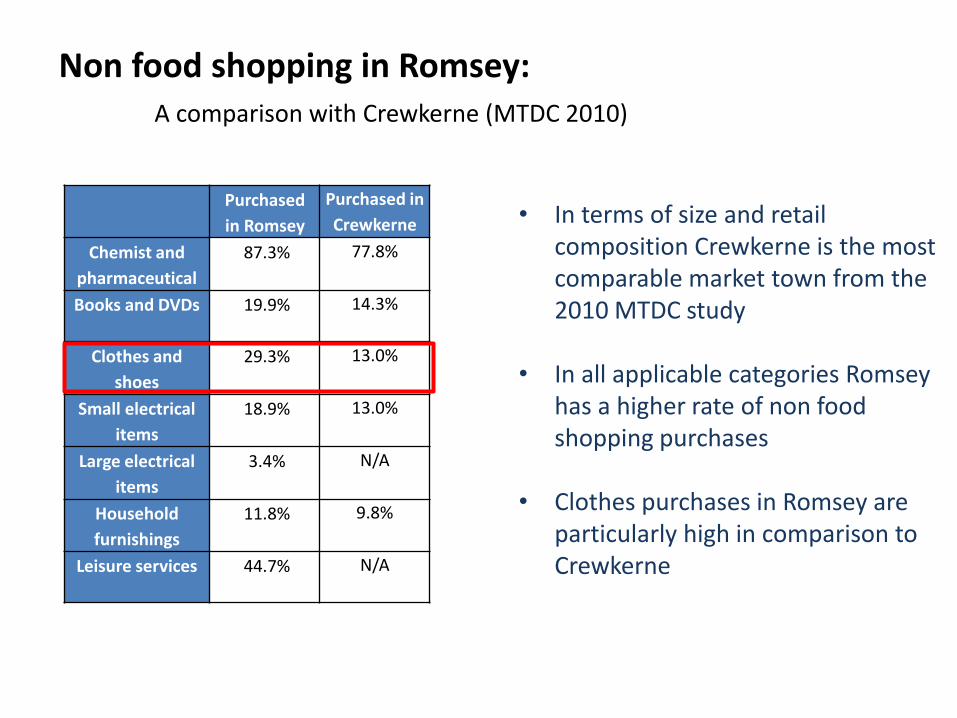
Non food shopping in Romsey: A comparison with Crewkerne (MTDC 2010)
Purchased
in Romsey
Purchased in
Crewkerne
Chemist and
pharmaceutical
87.3% 77.8%
Books and DVDs 19.9% 14.3%
Clothes and
shoes
29.3% 13.0%
Small electrical
items
18.9% 13.0%
Large electrical
items
3.4% N/A
Household
furnishings
11.8% 9.8%
Leisure services 44.7% N/A
• In terms of size and retail composition Crewkerne is the most comparable market town from the 2010 MTDC study
• In all applicable categories Romsey
has a higher rate of non food shopping purchases
• Clothes purchases in Romsey are
particularly high in comparison to Crewkerne
25
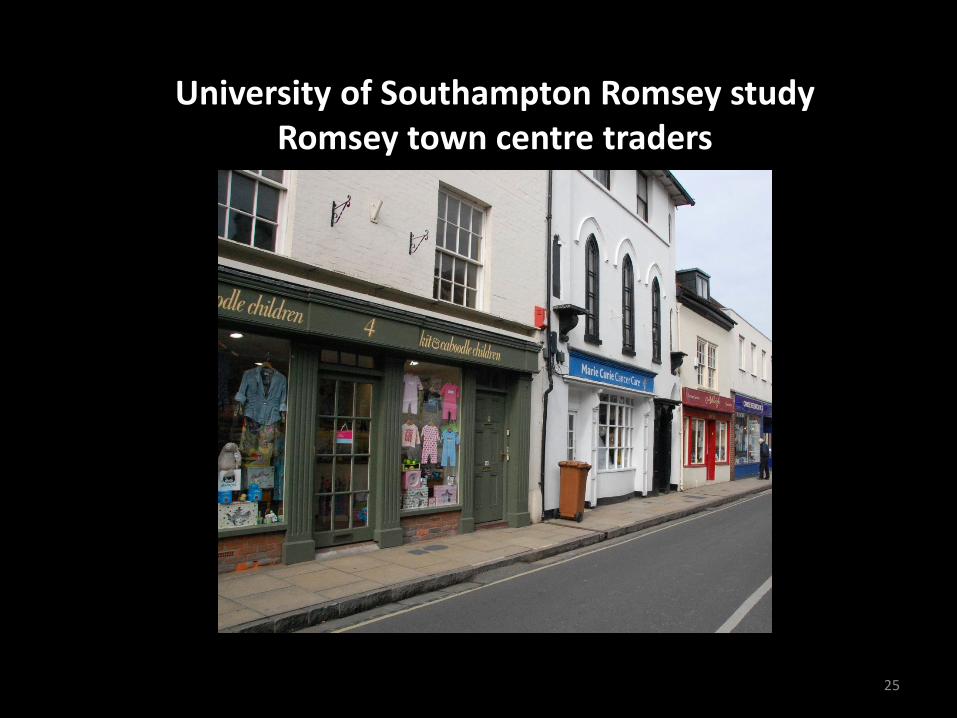
University of Southampton Romsey study Romsey town centre traders
Sales and business performance
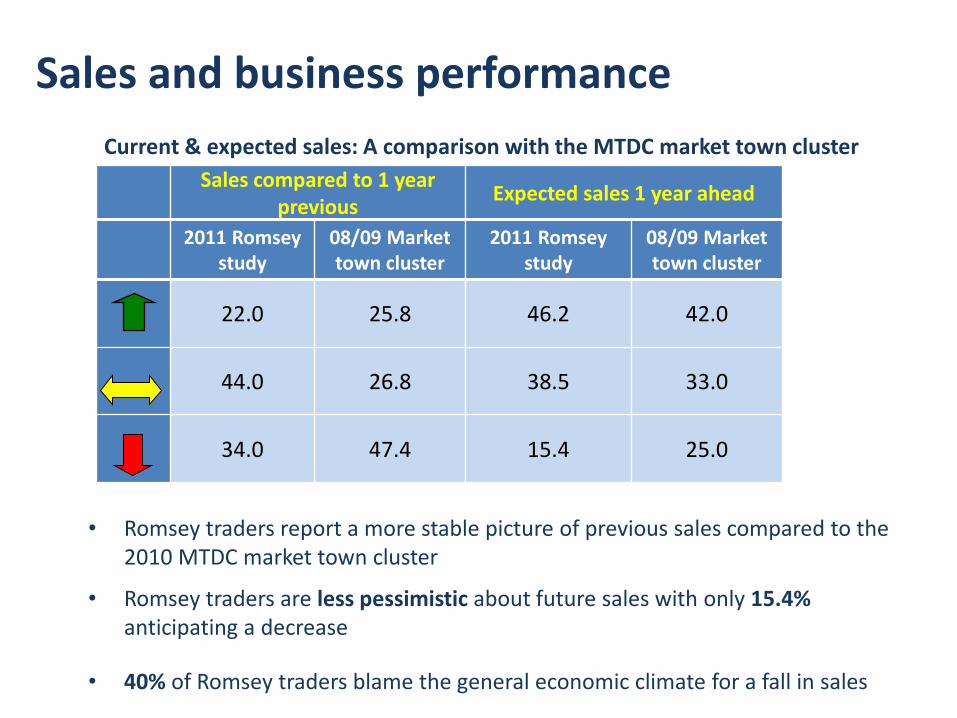
Sales compared to 1 year previous
Expected sales 1 year ahead
2011 Romsey
study 08/09 Market town cluster
2011 Romsey study
08/09 Market town cluster
22.0 25.8 46.2 42.0
44.0 26.8 38.5 33.0
34.0 47.4 15.4 25.0
Current & expected sales: A comparison with the MTDC market town cluster
• Romsey traders report a more stable picture of previous sales compared to the 2010 MTDC market town cluster
• Romsey traders are less pessimistic about future sales with only 15.4% anticipating a decrease
• 40% of Romsey traders blame the general economic climate for a fall in sales
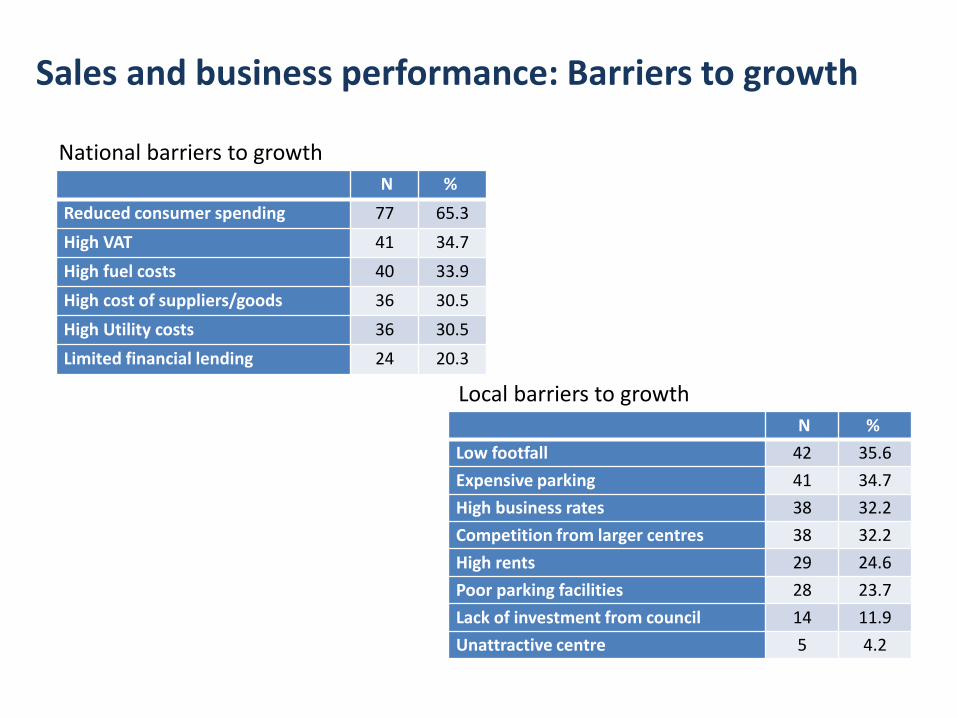
Sales and business performance: Barriers to growth
N %
Reduced consumer spending 77 65.3
High VAT 41 34.7
High fuel costs 40 33.9
High cost of suppliers/goods 36 30.5
High Utility costs 36 30.5
Limited financial lending 24 20.3
N %
Low footfall 42 35.6
Expensive parking 41 34.7
High business rates 38 32.2
Competition from larger centres 38 32.2
High rents 29 24.6
Poor parking facilities 28 23.7
Lack of investment from council 14 11.9
Unattractive centre 5 4.2
National barriers to growth
Local barriers to growth
28
0
5
10
15
20
25
30
35
40
45
50
1st biggest competitor 2nd biggest competitor 3rd biggest competitor
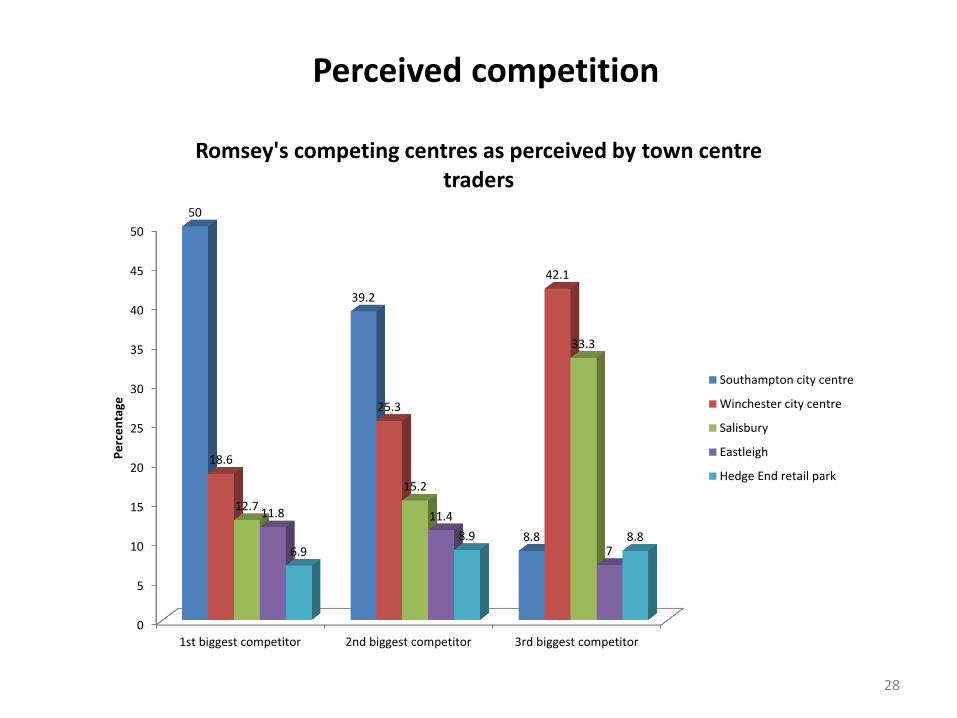
50
39.2
8.8
18.6
25.3
42.1
12.7
15.2
33.3
11.8 11.4
7 6.9 8.9 8.8
Pe
rce
nta
ge
Romsey's competing centres as perceived by town centre traders
Southampton city centre
Winchester city centre
Salisbury
Eastleigh
Hedge End retail park
Perceived competition
29
University of Southampton Romsey Study
Perceptions of Romsey
30
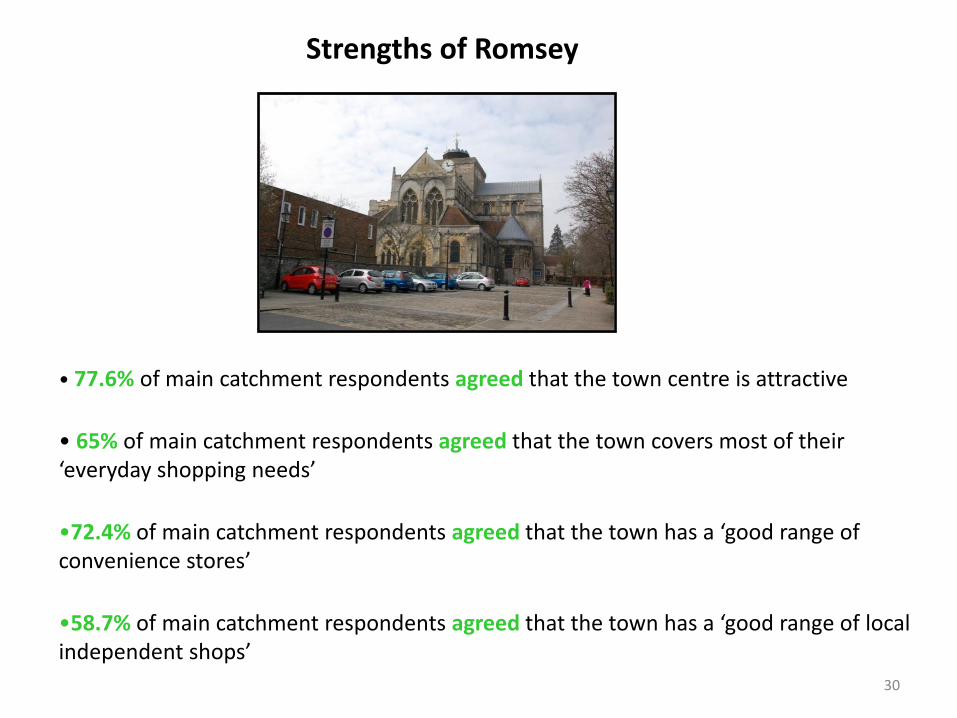
Strengths of Romsey
• 77.6% of main catchment respondents agreed that the town centre is attractive
• 65% of main catchment respondents agreed that the town covers most of their ‘everyday shopping needs’
•72.4% of main catchment respondents agreed that the town has a ‘good range of convenience stores’
•58.7% of main catchment respondents agreed that the town has a ‘good range of local independent shops’
31
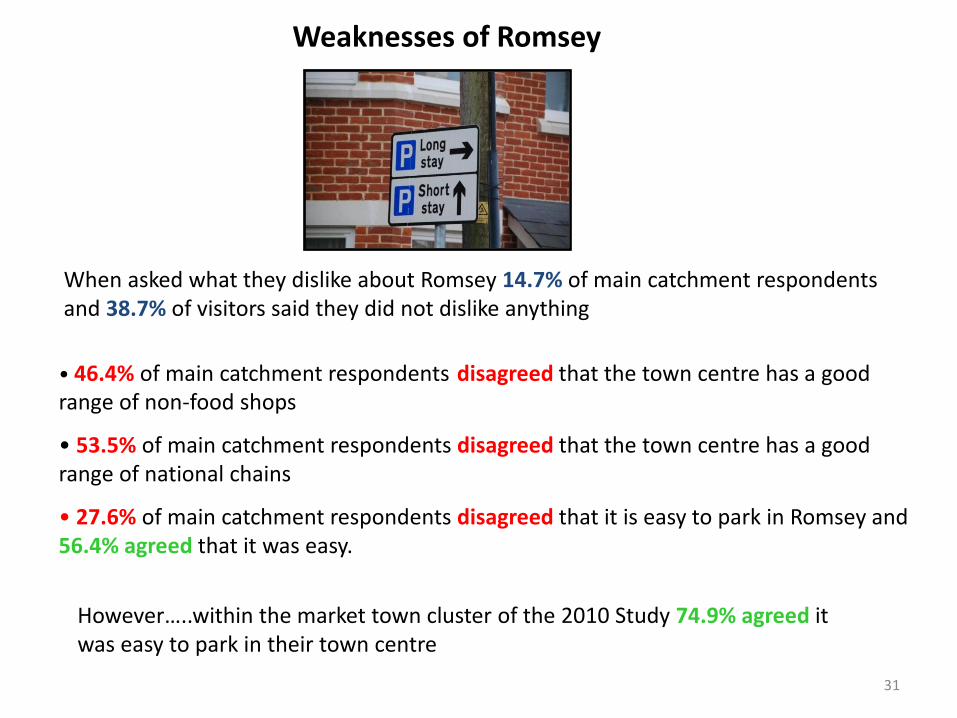
Weaknesses of Romsey
However…..within the market town cluster of the 2010 Study 74.9% agreed it was easy to park in their town centre
When asked what they dislike about Romsey 14.7% of main catchment respondents and 38.7% of visitors said they did not dislike anything
• 46.4% of main catchment respondents disagreed that the town centre has a good range of non-food shops
• 53.5% of main catchment respondents disagreed that the town centre has a good range of national chains
• 27.6% of main catchment respondents disagreed that it is easy to park in Romsey and 56.4% agreed that it was easy.
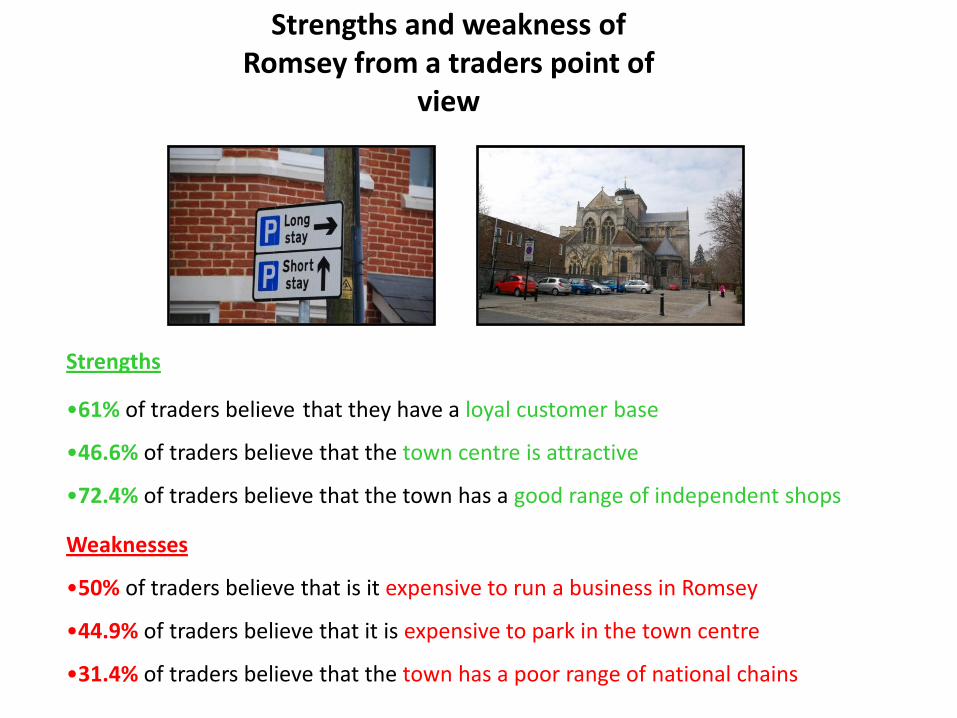
Strengths and weakness of Romsey from a traders point of
view
Strengths
•61% of traders believe that they have a loyal customer base
•46.6% of traders believe that the town centre is attractive
•72.4% of traders believe that the town has a good range of independent shops
Weaknesses
•50% of traders believe that is it expensive to run a business in Romsey
•44.9% of traders believe that it is expensive to park in the town centre
•31.4% of traders believe that the town has a poor range of national chains
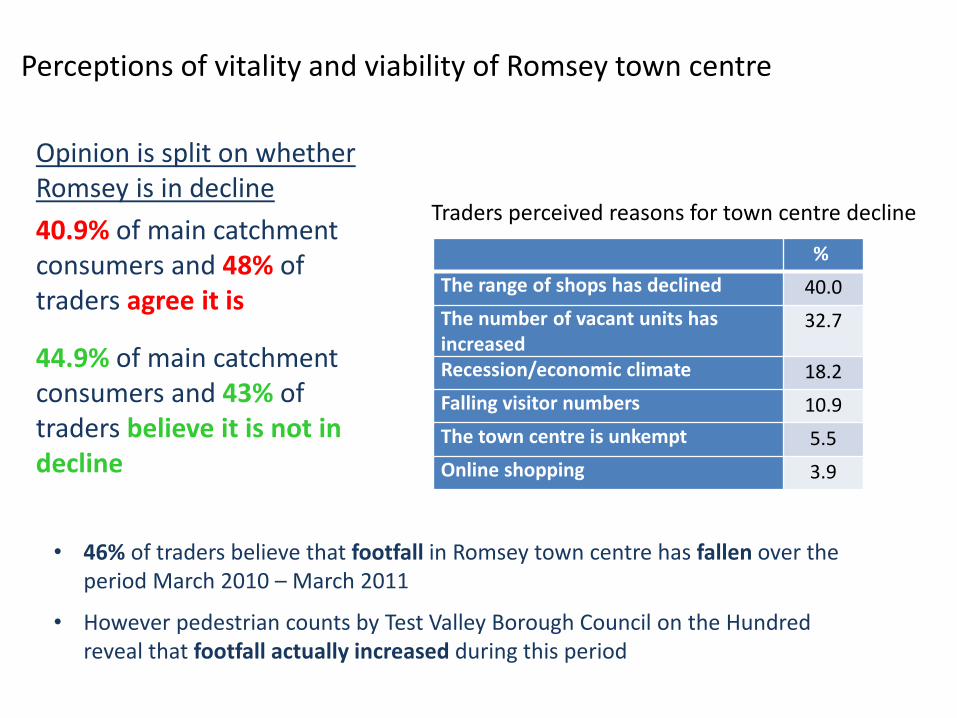
Perceptions of vitality and viability of Romsey town centre
Opinion is split on whether Romsey is in decline
40.9% of main catchment consumers and 48% of traders agree it is
44.9% of main catchment consumers and 43% of traders believe it is not in decline
%
The range of shops has declined 40.0
The number of vacant units has increased
32.7
Recession/economic climate 18.2
Falling visitor numbers 10.9
The town centre is unkempt 5.5
Online shopping 3.9
Traders perceived reasons for town centre decline
• 46% of traders believe that footfall in Romsey town centre has fallen over the period March 2010 – March 2011
• However pedestrian counts by Test Valley Borough Council on the Hundred reveal that footfall actually increased during this period
34
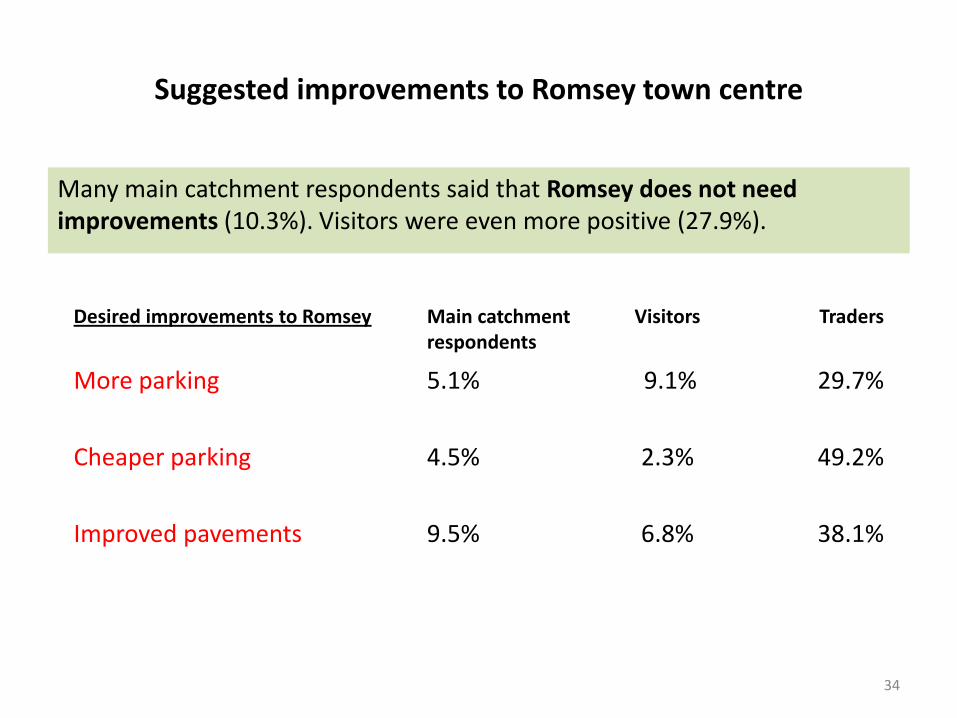
Suggested improvements to Romsey town centre
Many main catchment respondents said that Romsey does not need improvements (10.3%). Visitors were even more positive (27.9%).
Desired improvements to Romsey Main catchment respondents
Visitors Traders
More parking
Cheaper parking
Improved pavements
5.1%
4.5%
9.5%
9.1%
2.3%
6.8%
29.7%
49.2%
38.1%
35
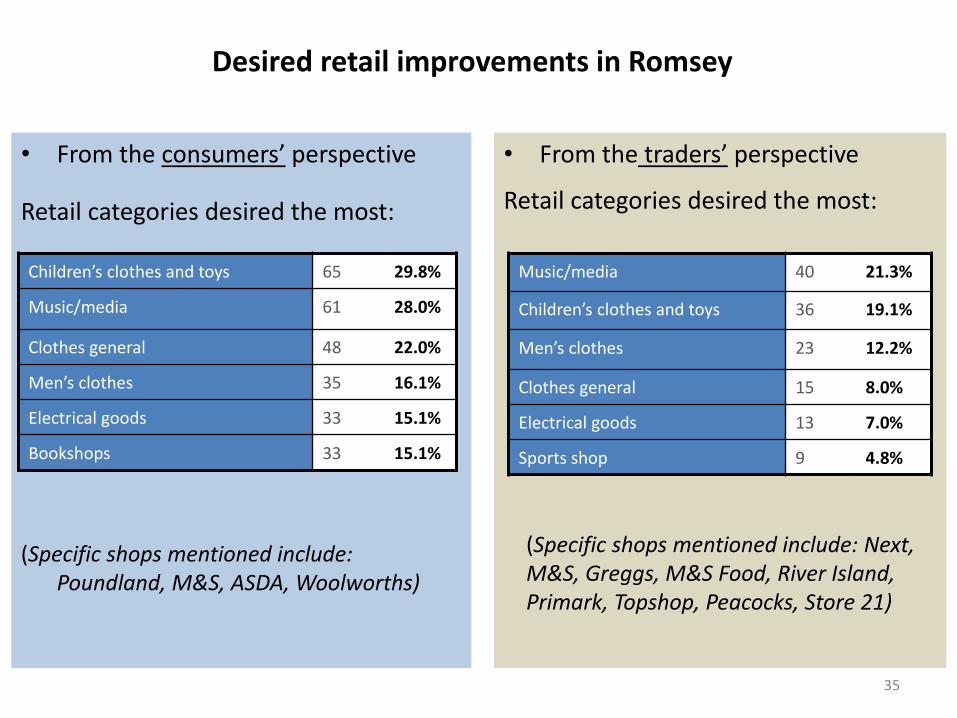
• From the consumers’ perspective
Retail categories desired the most:
(Specific shops mentioned include: Poundland, M&S, ASDA, Woolworths)
Desired retail improvements in Romsey
• From the traders’ perspective
Retail categories desired the most:
Children’s clothes and toys 65 29.8%
Music/media 61 28.0%
Clothes general 48 22.0%
Men’s clothes 35 16.1%
Electrical goods 33 15.1%
Bookshops 33 15.1%
Music/media 40 21.3%
Children’s clothes and toys 36 19.1%
Men’s clothes 23 12.2%
Clothes general 15 8.0%
Electrical goods 13 7.0%
Sports shop 9 4.8%
(Specific shops mentioned include: Next, M&S, Greggs, M&S Food, River Island, Primark, Topshop, Peacocks, Store 21)
36
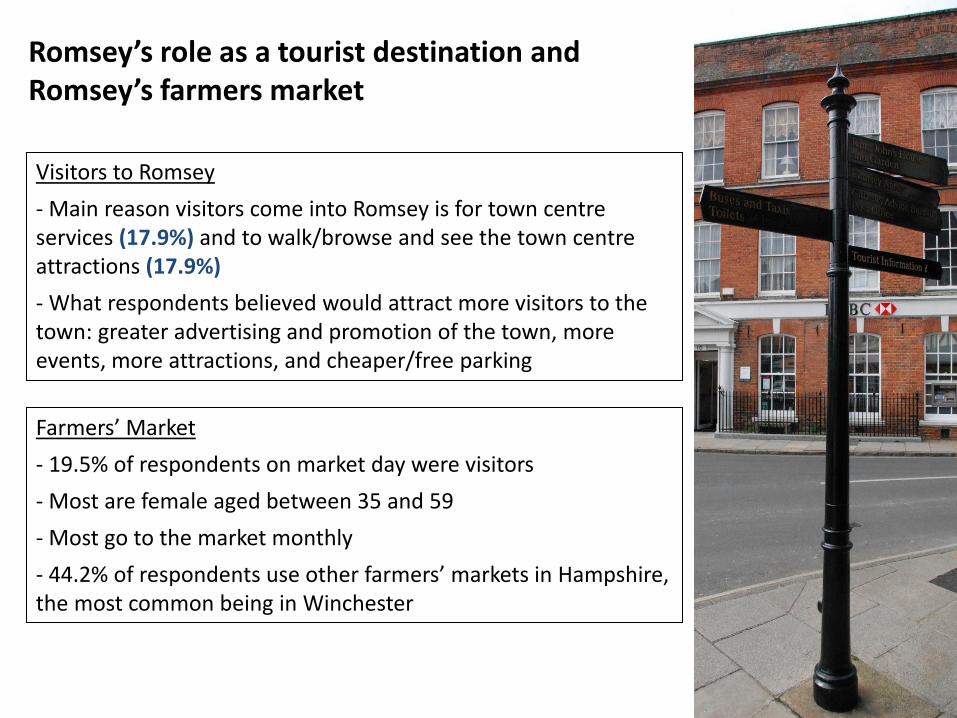
Romsey’s role as a tourist destination and Romsey’s farmers market
Farmers’ Market
- 19.5% of respondents on market day were visitors
- Most are female aged between 35 and 59
- Most go to the market monthly
- 44.2% of respondents use other farmers’ markets in Hampshire, the most common being in Winchester
Visitors to Romsey
- Main reason visitors come into Romsey is for town centre services (17.9%) and to walk/browse and see the town centre attractions (17.9%)
- What respondents believed would attract more visitors to the town: greater advertising and promotion of the town, more events, more attractions, and cheaper/free parking
37
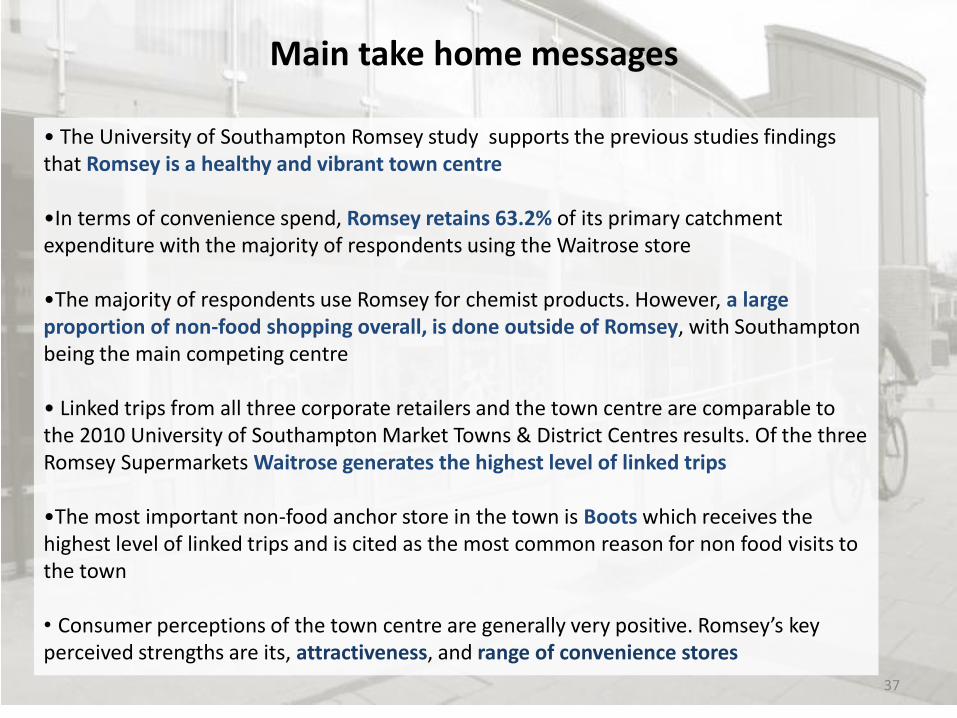
Main take home messages
• The University of Southampton Romsey study supports the previous studies findings that Romsey is a healthy and vibrant town centre •In terms of convenience spend, Romsey retains 63.2% of its primary catchment expenditure with the majority of respondents using the Waitrose store
•The majority of respondents use Romsey for chemist products. However, a large proportion of non-food shopping overall, is done outside of Romsey, with Southampton being the main competing centre • Linked trips from all three corporate retailers and the town centre are comparable to the 2010 University of Southampton Market Towns & District Centres results. Of the three Romsey Supermarkets Waitrose generates the highest level of linked trips
•The most important non-food anchor store in the town is Boots which receives the highest level of linked trips and is cited as the most common reason for non food visits to the town
• Consumer perceptions of the town centre are generally very positive. Romsey’s key perceived strengths are its, attractiveness, and range of convenience stores
38
Main take home messages
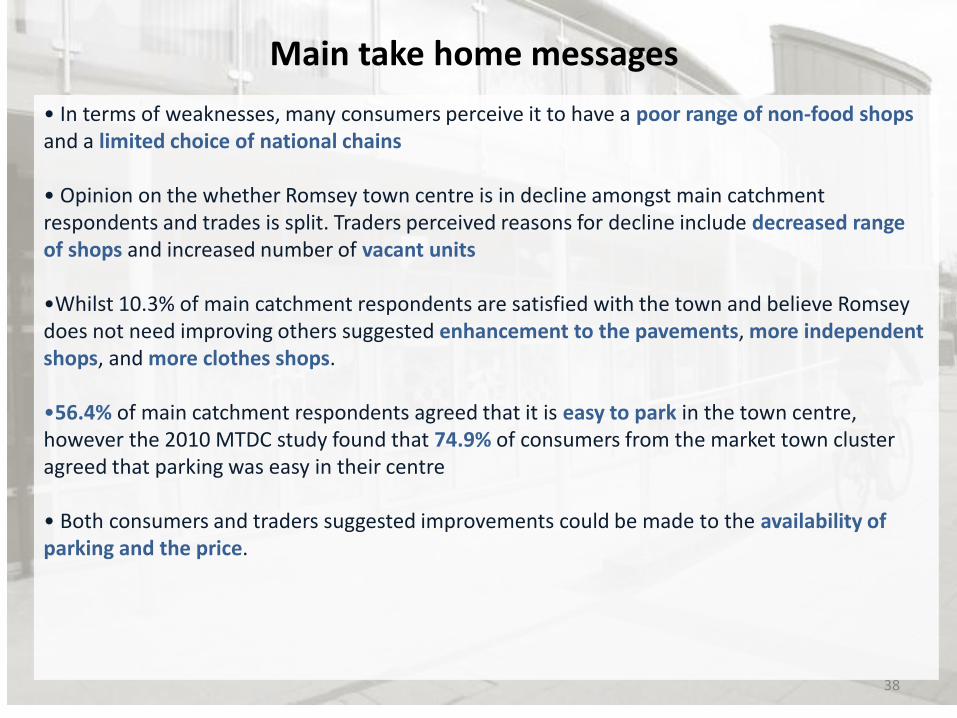
• In terms of weaknesses, many consumers perceive it to have a poor range of non-food shops and a limited choice of national chains
• Opinion on the whether Romsey town centre is in decline amongst main catchment respondents and trades is split. Traders perceived reasons for decline include decreased range of shops and increased number of vacant units •Whilst 10.3% of main catchment respondents are satisfied with the town and believe Romsey does not need improving others suggested enhancement to the pavements, more independent shops, and more clothes shops. •56.4% of main catchment respondents agreed that it is easy to park in the town centre, however the 2010 MTDC study found that 74.9% of consumers from the market town cluster agreed that parking was easy in their centre • Both consumers and traders suggested improvements could be made to the availability of parking and the price.
39
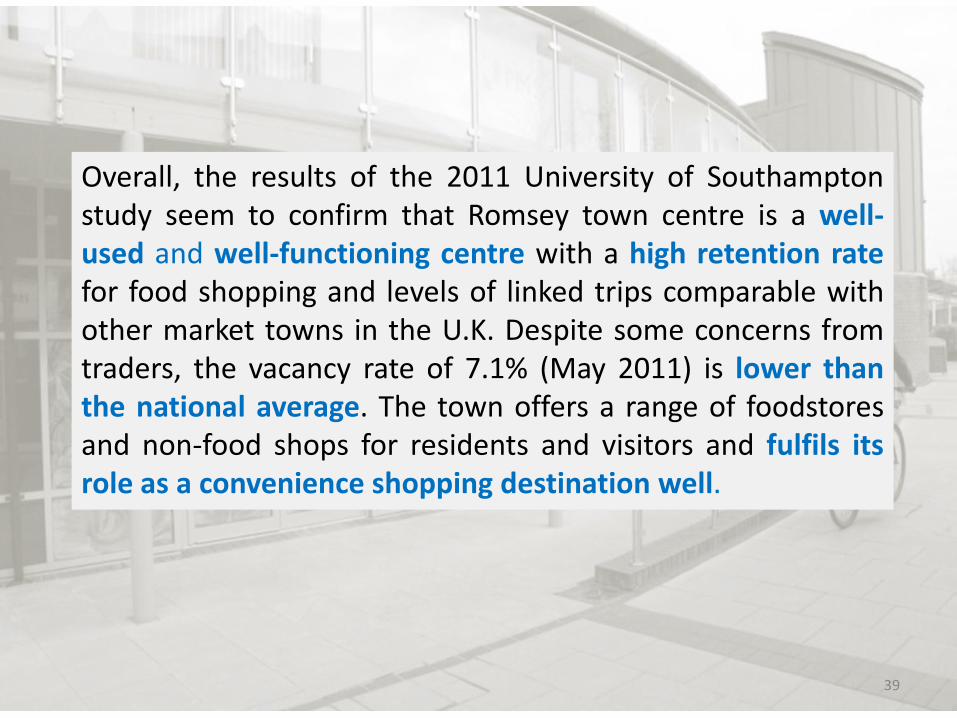
Overall, the results of the 2011 University of Southampton study seem to confirm that Romsey town centre is a well-used and well-functioning centre with a high retention rate for food shopping and levels of linked trips comparable with other market towns in the U.K. Despite some concerns from traders, the vacancy rate of 7.1% (May 2011) is lower than the national average. The town offers a range of foodstores and non-food shops for residents and visitors and fulfils its role as a convenience shopping destination well.
40
41
Previous studies’ key findings
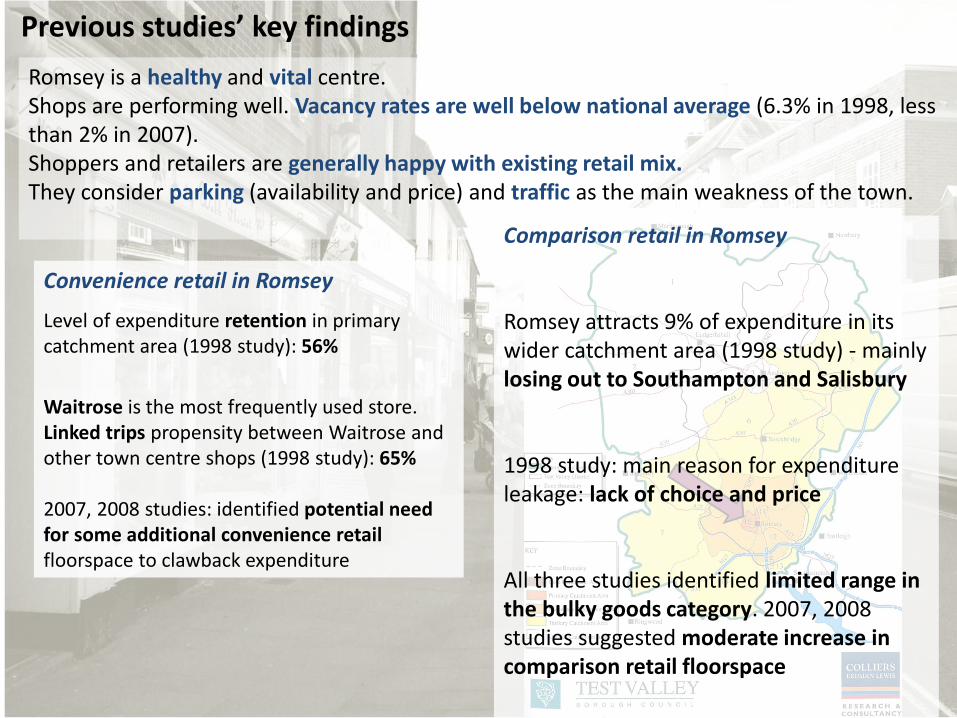
Romsey is a healthy and vital centre. Shops are performing well. Vacancy rates are well below national average (6.3% in 1998, less than 2% in 2007). Shoppers and retailers are generally happy with existing retail mix. They consider parking (availability and price) and traffic as the main weakness of the town.
Convenience retail in Romsey
Level of expenditure retention in primary catchment area (1998 study): 56%
Waitrose is the most frequently used store. Linked trips propensity between Waitrose and other town centre shops (1998 study): 65% 2007, 2008 studies: identified potential need for some additional convenience retail floorspace to clawback expenditure
Comparison retail in Romsey Romsey attracts 9% of expenditure in its wider catchment area (1998 study) - mainly losing out to Southampton and Salisbury 1998 study: main reason for expenditure leakage: lack of choice and price All three studies identified limited range in the bulky goods category. 2007, 2008 studies suggested moderate increase in comparison retail floorspace