Embed Size (px)
Citation preview

AFHRL-TR-88-63 . .
AIR FORCE COMPUTER-BASED.INSTRUCTION: EFFECT OFCOGNITIVE STYLE, INSTRUCTIONAL FORMAT, AND
H H SUBJECT-MATTER CONTENT ON LEARNING
U
M Linda J. Buehner Brent
A University of Rochestero lGraduate School of Education and Human DevelopmentN Lattimore 529NRochester, New York 14627
LOGISTICS AND HUMAN FACTORS DIVISIONR Wright-Patterson Air Force Base, Ohio 45433-6503
S April 1990
0 Final Technical Report for Period January 1986 - December 1988
UR Approved for public release; distribution is unlimited.
CES LABORATORY
AIR FORCE SYSTEMS COMMANDBROOKS AIR FORCE BASE, TEXAS 78235-5601
4 17 118
NOTICE
When Government drawings, specifications, or other data are used for any purposeother than in connection with a definitely Government-related procurement, theUnited States Government incurs no responsibility or any obligation whatsoever.The fact that the Government may have formulated or in any way supplied the saiddrawings, specifications, or other data, is not to be regarded by implication, orotherwise in any manner construed, as licensing the holder, or any other person orcorporation; or as conveying any rights or permission to manufacture, use, or sellany patented invention that may in any way be related thereto.
The Public Affairs Office has reviewed this report, and it is releasable to the NationalTechnical Information Service, where it will be available to the general public,including foreign nationals.
This report has been reviewed and is approved for publication.
ROSEMARIE J. CLARK, Contract MonitorLogistics and Human Factors Division
BERTRAM W. CREAM, Technical DirectorLogistics and Human Factors Division
HAROLD G. JENSEN, Colonel, USAFCommander

REPORT DOCUMENTATION PAGE 1o m. o704oID
Pu i( reporting burden for th$ collection of infOrmation. a estimatedl to average ! uo~r Of. reapors. including th'e time f Of revimeing iflm'U~tofi. lea-h.ln ceetang daawgathering and maintinnlg the data nleded, and€ completing and reviewng* the COllection of informion Sen commenls regalrding thus bulrden estimate or an other asec of thl.
collecton of information. including suQgestiOnS for reducing this burden. to Washinqton Heaaquiern Semices. Directorate Tor information Oppration and Report. 121S Jefar somDavis Highway. Suite 1204, Arlington. VA 22202-4302. and to the Office of Manigemert and Budget, Paoerwork Reduction Prolect (070 18). Washington. DC 20S03.1. AGENCY USE ONLY (Leave blank) 2. REPORT DATE 3. REPORT TYPE AND DATES COVEREDA. il 1990 January 1986 - December 1988
4. TITLE AND SUBTITLE S. FUNDING NUMBERS
Computer-Based Instruction: Effect of Cognitive Style, C - F49620-85-C-0013/
Instructional Format, and Subject-Matter Content SB5851-0360
on Learning PE - 62205F
6. AUTHOR(S) PR - 3017
Linda J. Buehner Brent TA - 08
WU - 04
7. PERFORMING ORGANIZATION NAME(S) AND ADORESS(ES) 8. PERFORMING ORGANIZATION
University of Rochester REPORT NUMBER
Graduate School of Education and Human Development
Lattimore 529
Rochester, New York 14627
9. SPONSORING/MONITORING AGENCY NAME(S) AND ADDRESS(ES) 10. SPONSORING /MONITORINGLogistics and Human Factors Division AGENCY REPORT NUMBER
Air Force Human Resources Laboratory AFHRL-TR-88-63
Wright-Patterson Air Force Base, Ohio 45433-6503
11. SUPPLEMENTARY NOTES
12a. DISTRIBUTION / AVAILABILITY STATEMENT 12b. DISTRIBUTION CODEApproved for public release; distribution is unlimited.
13. ABSTRACT (Maximum 200 words)
This report describes an experiment investigating the effects of cognitive style, presentation
format, and task content on learning. Cognitive style was described in terms of hemisphericity (i.e.,left- or right-brain influence on perception). Presentation format consisted of graphics, text, and a
combination of the two. The tasks consisted of knowledge, skill, attitude and decision-making.
Fifty-nine college students participated in the study. In the knowledge task, subjects learned 10
pairs of words. In the skill task, subjects built an abstract model of a windmill. In the attitude
task, subjects responded to facts and opinions on a current affairs topic. The decision-making task
involved a maze problem. Subjects were tested immediately after training, 2 weeks after training and
again at 4 weeks after training.
Results indicated the following: Presentation format, gender, and hemisphericity all appeared to
influence performance on the knowledge task. Presentation format and gender influenced performance on
the skill task. Presentation format influenced performance on the decision-making task.
(Continued)
14. SUBJECT TERMS IS. NUMBER OF PAGES Nadaptive training knowledge tasks
cognitive styles presentation formats 16. PRICE CODEdecision-making tasks skill tasks
17. SECURITY CLASSIFICATION 18. SECURITY CLASSIFICATION 19. SECURITY CLASSIFICATION 20. LIMITATION OF ABSTRACTOF REPORT OF THIS PAGE OF ABSTRACT
Unclassified Unclassified Unclassified UL
NSN 7540-01-280-5500 Standard Form 298 (Rev 2-89)PeaCr'p bV AN%1 "o 139.1296-102

Item 13. (Concluded)
This research is an initial exploration into adaptive training for computer-based systems. Theability to adapt to an individual's preferred learning style is a significant challenge for designersof training systems. The basis for the adaptability may be grounded in individual differences incognitive style. ,

This paper describes an experiment w.,hichi att.e nlt2rI to i,'>-ntir :; vc'of co7;iitive, styles, instructional forvaat, and sibjnct tmciter . lQ1inThe followinc' resea rch questions .,era addressad: (a) '.oes pres'2ltatio:1 for- i-4affect performance on trainin" tas',.s in tli2 aros of ;alda ~l1attitude, and docision-riakinn? (b) 9-oes coinitive styla1 aff(ect perfor'u1nCr_ ')rtraining tasks in th2 areas of sle~ , sill, attituAC, arr]loiecsio2-rak ing? ind (c) Coes icnder affect porforianca :Mn tl- sale nds o4: traini.aslks?
For pvirposes of this study, cognitive sty,,les tdere ,Iividj2, ii)to left-brain-doninant and right-brain-dominant infl, unes on liu-?n le:arning h2 K,.vi ors.There i~ere four tasks in th2 exparinent: a .nowled'_7e taskwic r;-qii r,-subjects to 12amn facts; iskill tas; requiring subjects to assabla3 a toy%vjindir-iill of a;)stract design; an Ltiuets I :Iic sujet '_cn'rto express their opinions on a curre2nt affairs taric; and decision- :k1task in v.i,,ich subjccts had to naviglate throujgh, a -iaze. The in-,tructioi.ailfor'iats u1sed to relay instructions f'or t,.c tasks incl-x!-i -irihics, text, itext-graphics displays. Fifty-nin2 colle~je stuPents (mlal a3n,! foeic)participated intestud y Two Comaidor2 ~i' personal co, muters 4r c.Eachi computer w.as equipped -aith a color A~iea 20;11t0 r, tiwo 1"..-inCi '.iskdrives and a "mouse." Video di spl ays wa.,r2 d ,vel oPe1 uli nr )c1 uxe ')ai ot,Electronic Arts, and Aegis -Aniriator softl~ure.
Research results indicate"! that tie format of instructi-,al 2aOterial athe2 greatest influe2nce on perfor-lance and that the :lost cffectiv-e forniat -1ydepend -on the subject-:iatter content, t It al so appeard tiat gender and cognitivestyle may hava affected perforiance on sooio tasks. A ta xon-11'' -..')ichil .nilr!combino dimensions of cog-nitive style, contenit, armd imale cf prescentvi-aonappe2ars vial id in 1 iqght of tiiese initial results. Atcxonar-iy of this 'latUrocould be2nefit traininn specialists and researchers in i~~ pf;traili '12
methodologies adtrainin- -- Iv-r yt~s
Accession For
IS GRA&I
DTIC TABUnannounced 0justification
Distribution/ ____
Availability Coldes
Atvail and/orDist Special

PREFACE
The present effort was supported by the Air Force Office of ScientificResearch under Contract No. F49620-85-C-OOI3/SB5851-0360 and Subcontract No.S-760-OMG-085 with Universal Energy Systems. The study was the result of workperformed by the author during a Summer Faculty Research Fellowship at the AirForce Human Resources Laboratory, Logistics and Human Factors Division, GroundOperations Branch, Wright-Patterson Air Force Base, Ohio, in 1985.
Appreciation is expressed to Dr Lawrence E. Reed and Rosemarie J. Clarkfor giiing the author guidance concerning the needs of the Laboratory whilestill providing the freedom to instigate research in an area of great personalinterest. Special thanks go to Kathleen Y. Moorer for administrative supportand Dr Beverley Gabie for helpful editorial comments.
The author also thanks Donald Sandor, a student at Wittenberg University,who was responsible for programning the experimental design, and Leslie:,uehlhauser for managing the experiment. This research was conducted atWittenberg University, Springfield, Ohio 45501.
ii

TABLE OF CONTFENTS
1.~~~~~~~~~~~~~~~~ INRDUTO ...........................
II. METRODUCT...ON.................................................15
Subect MTO. .................................................... 5
Screening Measures for Cognitive Style ........................ 5
The 4-Mat Test......................................... 5The Lateral Preference Test..... ......................... 5The Group Embedded Figures Test.......................... 5The Swassing-Barbe Miodality Test......................... 6
Presentation Format ......................................... 6
Content Areas.............................................. 6
Knowledge Test......................................... 6Skill Test ............................................. 6Attitude Test.......................................... 7Decision-Making Test .................................... 7
Equipment .................................................. /I
Procedures ................................................. 7
Cognitive Style Assessment .................................. 3
Trainiig ................................................... 8
Knowledge Traiiing ...................................... (1Skill Trainiig .......................................... 9Attitude Training ....................................... 9Decision-Making Training................................. 9
Performance Testing ......................................... 9
Ill. RESULTS...................................................... 1D
Presentation Format........................................ 10
Knowledge Test.........................................i1DSkill Test....................Attitude Test .......................................... 1)Decision-Making Test .................................... 1)

Gender Data ................................................. 11
Knowledge Test .......................................... IISkill Test .............................................. 11Attitude Test ........................................... 11Deci sion-Mak ing ......................................... 11
Cognitive Style (Hei.i;phericity) ............................ 11
Hefisphericity-by-Gender Data ............................... 11
IN . OISCUSSION ..................................................... 12
Pre.sentation Format ......................................... 12
Skill Test .............................................. 12Decision-Making Test .................................... 12
Gender ...................................................... 13
Cognitive Style (ilemnisphericity) ............................ 13
Knowledge Test .......................................... 13Attitude Test ........................................... 13
Concl.isions ................................................. 14
Lii tan tions ................................................. 14
Fol I :w-On Research .......................................... 15
L -",F..E ES .......................................................... 16
.......................................................... 18
Appndix A: L teral PreFerence Test ........................ 18
Appe idiK B: 'Aord Paies For Knowledge Task .................. 19
Appendix ': Attitude Test Questions ......................... 20
Kp:) 19Ii D" Ru s for Decision-Making Task ................. 22
j) p,. 1,Jix - Tables ......................................... 23
iv

LIST OF ,IGURES
Figure pag
I Style Characteristics and Thinking Skills 2
2 Style-Instruction Interaction 4
V

I. INTRODUCTION
Basic research in the areas of learning theory, memory, neuropsychology(hemisphericity), and cognitive psychology (information processing) has madesignificant contributions to the body of knowledge concerning how humanlearning occurs. This knowledge has been applied to the identification ofcognitive styles. Cognitive style, initially termed such by Allport (1937),has been described as an individual's typical mode of thinking,problem-solving, perceiving, and remembering (Schwen, Bedner, & Hodson, 1979).Ausburn and Ausburn (1973) referred to cognitive style as the psychologicaldimensions that represent consistencies in an individual's method of acquiringand processing information.
Individual differences in cognitive style may occur in any of the mentalprocesses used in information processing: (a) perception, (b) thought, (c)memory, (d) imagery, and (e) problem-solving. Such individual differencesappear to be related to hemispheric dominance (Wittrock, 1980) and the degreeto which one mode of information processing is used over another (Ausburn &Ausburn, 1978).
A number of researchers have identified various dimensions of cognitivestyle (e.g., Kogan, 1971; Kolb, 1976; Lowenfeld & Brittain, 1970; Messick,1966; and Pask & Scott, 1972). See Table E-l of Appendix E for a descriptionof 15 dimensions of cognitive style.
Each of these dimensions represents a dichotomy and may be expressed as abipolar relationship (Witkin, Moore, Goodenough, & Cox, 1977), with the twoextremes of each relationship defined. It is imperative to emphasize thatcognitive style represents a continuum within the dichotomy, and a particularindividual's style tends to fall toward one or the other end of the spectrum.It is hypothesized that this dichotomy of cognitive style may also bear arelationship to the dichotomous, hierarchical functioning of the left andright hemispheres within the brain, hemisphericity. That is, many of thecharacteristics of left- and right-hemisphere processing described in currentresearch appear to relate also to cognitive style dimensions.
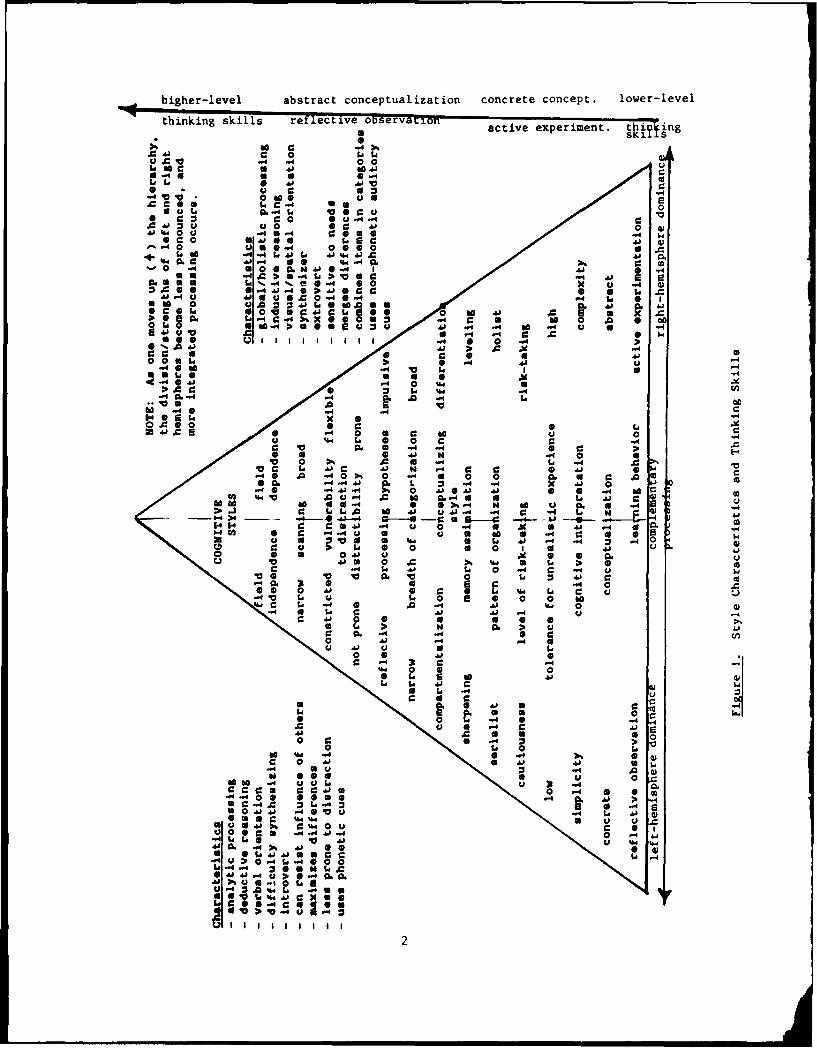
An attempt to combine the two streams of research, cognitive styles andhemisphericity, is presented in Figure 1 (Buehner, 1937). The trianglerepresents a "thinking skills" hierarchy, in which thinking processes towardthe top become more abstract, complex, and integrated. Characteristics ofleft- and right-hemispheric processing dominance are listed on the left sideand right side of the triangle, respectively. As a result of study into thecharacteristics of each cognitive style dimension, the dichotomies of stylehave been matched to the characteristics of the two hemispheric processingpatterns. The dimensions of conceptualization and learning behavior areproposed as having both hierarchical and lateral characteristics. The lateralcharacteristics become less pronounced, with hierarchical blending ashigher-order thinking occurs.
Research into ways of applying this knowledge of cognitive style to thedevelopment of methodologies appropriate to computer-based instruction has
higher-level abstract conceptualization concrete concept. lower-level
thinking skills reflective o~servanlou actv exeient. t
Uski
u -4 0 0
* -
IC C .
* 0 00"" 0 0
00 4Ci a 0 0 0 A
r A
Ld tee -4 0-4
x 0 -40.0 9
C a
-. 44
U 'ACD, CCV a
63 -4 V 4
;W LI 0 0 C
CC01 D0 0
m I64~~ AU*4 A A 0.0 N
000 a0j . A t
Id W 4 N s u La a-.
- 4.4 >4-V
to a -4 4
a~~j -4LaS0 -4 -. 1
-4.I. u 4', 0 0a 94In0 04 0 410L
.4 *L t aJ UE0IU 0i 000
0i r*~~ 60LI&4C . 41A- A) -4
I ~ A 0 I2. >1

begun to permit more effective and cost-efficient uses of computers in a widevariety of training applications. Most instructional des'gners, however, arenot currently provided with adequate tools and techniques for the developmenLof instructional programs tailored to the individual needs of the trainee(learner). Therefore, many of the current training programs are designed asif all trainees process and store information in the same manner and it is theresponsibility of trainees to matc their learning to the format of theinstruction.
Research has demonstrated tnat individuals process information differently(e g., Kogan, 1971; Messick, 1966). For example, some individuals best retaininformation presented graphically and holistically, whereas others bestprocess information serially (with verbal presentation). Results of thisresearch may be applied in the manner proposed in Figure 2 (Buehner, 1987),which depicts the interaction between cognitive style ani instruction.
Some researchers (e.g., Moore & Nawrocki, 1978) also acknowledge theimportance of taking into account the nature of the subject matter or taskwhen planning instruction. Such considerations can facilitate retention andeventual transfer of training to the job situation.
Currently, most designers of computer-based instruction do not haveadequate guidelines for the development of programs which accommodatedifferences both in individual cognitive style characteristics of trainees andin subject-matter content. The problem lies in the lack of adequate, detailedknowledge about the critical aspects of cognitive style and trainingpresentation. If the elements of subject-matter content and cognitive styleare consistently considered in planning instruction, training effectivenessand efficiency can assuredly be enhanced. With the development of guidelinesfor instructional designers, computer-based instruction shows great promise inits capacity to allow for flexibility in instruction to meet individual needs.
The objective of the present research effort was to begin to test some ofthe postilates described in the two figures, in conjunction with the proposedinstructional design modifications described in Table E-2 (Appendix E). Thatis, the effort was designed to assess trainee performance when thepresentation of instructional information is modified according to cognitivestyle and subject-matter content.
For the purposes of the present investigation, cognitive style was definedas left-hemisphere dominant and right-hemisphere dominant. Subject-mattercontent was divided into four areas: knowledge, skill, attitude, anddecision-making. The following research questions were addressed:
1. Does presentation format affect performance on training tasks inthe areas of knowledge, skill, attitude, and decision-making?
2. Does cognitive style (hemisphericity) affect performance or,training tasks in the areas of knowledge, skill, attitude, andleci si on-maki ng?
3

Cognitive complexity Progression of instruction Cognitive simplicity
V 3
.C 0
o 4M &
.C~~ tM0O
IA~ r- I
- - )O0
ILI. 0 ado- U F,
~4O O -C th 'A~0O
am *C:I. CCC C W 06"4 , VL
4A (A Cc
02 VL 0 L.L2 0 0 1O c
V~. 4,. 4
__ A

3. Does gender affect performance on training tasks in the areas ofknowledge, skill, attitude, and decision-making? Researchers haveidentified gender differences related to cognitive style (seePorac & Coren, 1981).
II. METHOD
Subjects
Fifty-nine college students (29 males and 30 females) served as subjectsfor the study. Subjects were recruited through media advertisement, and thoseselected consisted only of respondents who were: (a) currently enrolled in a2-year or 4-year college or university, and (b) between the ages of 18 and24. The mean age of the subjects was 19.7 years. Each subject was brieflyinformed of the nature of the investigation. Each was told that the purposeof the study was to investigate how people learn by using computers.Demographic information was obtained. No subject was color blind. Allsubjects were paid for their participation.
Screening Measures for Cognitive Style
Subjects were classified according to cognitive style--eitherleft-hemisphere dominant (n = 31) or right-hemisphere dominant (n = 28) basedupon the screening measures described below. The subjects were randomlyassigned to treatment conditions, with cognitive style serving as a "blocking"variable (i.e., both left- and right-hemisphere-dominant individuals wereallocated to each condition).
The 4-Mat Test. McCarthy's 4-Mat Test is a self-report measure ofcognitive style and hemispheric processing. The cognitive style subtestmeasures an individual's preference for a particular manner of perceivinginformation. Scores are computed to categorize four cognitive styles: (a)concrete experience, (b) abstract conceptualization, (c) activeexperimentation, and (d) reflective observation. These cognitive styles havebeen theoretically linked to hemispheric dominance (Buehner, 1987). Thehemispheric processing subtest measures an individual's lateral predominancein information processing (left or right).
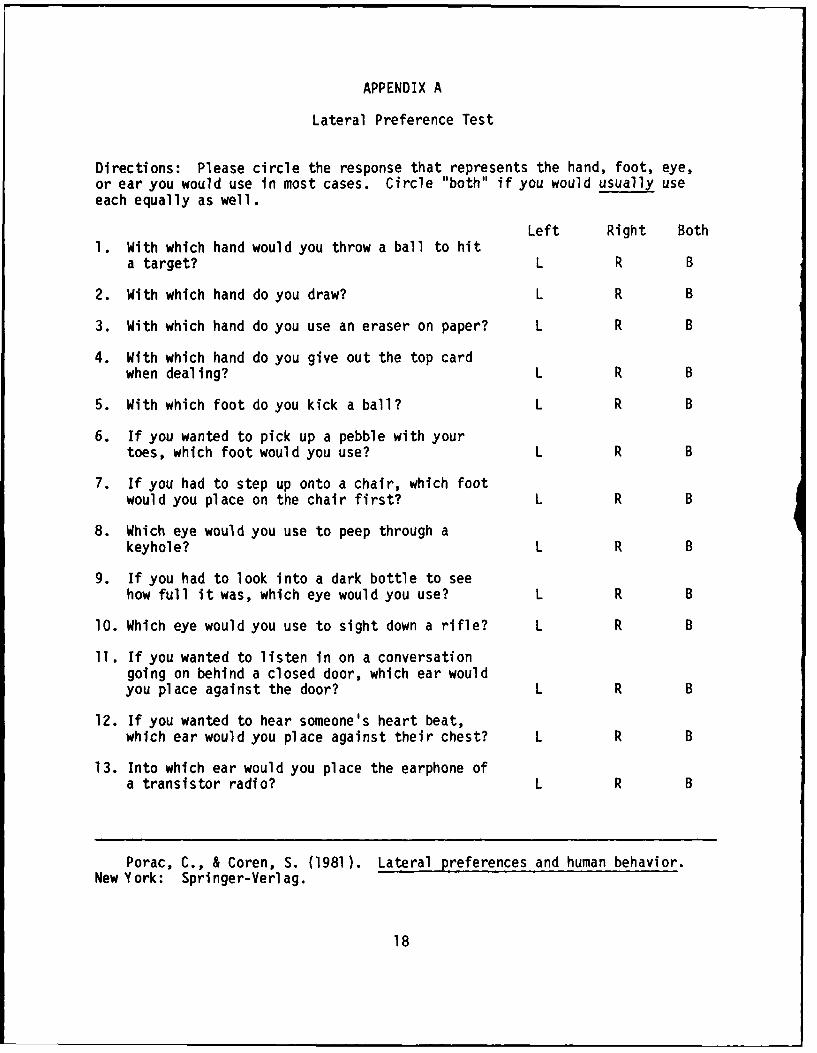
The Lateral Preference Test. The Lateral Preference Test (Porac &Coren, 1981) is a behavioral ly validated self-report inventory designed toassess lateral preferences (see Appendix A). The instrument consists of 13questions that ask respondents to specify which hand, foot, eye, or ear (left,right, or both) they would use to perform a specified task. Raw scores aretransformed to an index on a scale of lateral preference that ranges from -lto +1. Negative values indicate a predominance for left preference(right-dominance) and positive values indicate a predominance for rightpreference (left-dominance). A .91 test-retest reliability correlation hasbeen reported for this inventory. Concurrent validity has been reported to be.90.
The Group Embedded Figures Test. The Oltman, Raskin, and Witkin'sGroup Embedded Figures Test is designed to measure the cognitive style
5

dimension of field dependence/field independence (Witkin, 1965). Thisperceptual test requires the respondent to locate a single figure within alarger complex Figure. Scores on this instrumient range from 0 to 18, withhigher scores indicating a more field independent cognitive style. This groupinstrument has obtained correlations of .63 (females) and .82 (males) whencompared with Witkin's individually administered Embedded Figures Test. Thereliability of this test has been reported to be .82.
The Swassing-Barbe Modality Test. For the present effort, theSwassing-Barbe Modality Test was modified to accommodate group adinin-istration. This instrument measures preference and skill for visual andauditory perception. Participants were shown a sequence of shapes, then askedto write down what they saw. These sequences became more difficult as thenumber of shapes in a sequence increased as the test progressed. On thesecond test, the participants listened as the tester read a sequence ofshapes. They were then asked to write down what they heard. Scores on eachsubtest ranged from 0 to 45, with higher scores indicating a preference forthat particular modality. The test protocol reports high face validity and atest-retest reliability of .61 for visual and .65 for auditory.
Presentation Format
The subjects in the text condition were presented information in textualformat. In the graphics condition, subjects were presented the sam?information but in graphics form (pictures, graphs, etc.). The text-graphicscondition employed a combined presentation Format (i.e., the information waspresented to the subject using both text and graphics).
Content Areas
Knowledge Test. The Knowledge Test was developed by the investigatorto measure knowledge-Tearned in a paired-association task for this study. Thetest consists of 10 pairs of words (see Appendix B), ranked from easy to hard,selected from the Weschler Paired Associate Learning Test. Reliabilitymeasures of Weschler's test are reported in the test protocol to be .80. Theword list is a subroutine of a computer program that can be accessed oncommand by the respondent. One word at a time, fromi the paired list, israndomly presented to the respondent (until all pairs are presented).Respondents are required to key-in the correct match for the stinulis word.Learning on this test is measured by the number of correct responses (range 0to 10) and errors are automatically recorded by the computer.
Skill Test. The Skill Test was designed to assess an individual'sability to build a model by following directions presented in three formats:text, graphics, and text-graphics. This test requires the individual to reada set of detailed instructions on assetnbling a model from a building set(Tinkertoys). The exemplar For the model resembles a windmill. Therespondent is then required to identify, select, and assemble the appropriateelements from the building set as specified in the assembly instructions. Thetest is timed and scored (Dy two raters) according to the number of buildingset elements that are incorrectly placed. Test-retest reliability for theSkill Test is .90. A correlation of .98 was obtained for inter-raterrel iability.
6

Attitude Test. The researcher developed this test to measure aperson's attitude related to specific subject matter. The test consists of 18true-false questions--nine which measure knowledge of fact and nine whichmeasure attitude. The questions are presented to the respondent viacomputer. The order in which the questions are presented is randomized. Thequestions focus on the advantages of the Strategic Defense Initiative. Theknowledge questions were included in the test to serve as distractors For theattitude questions. Respondents are not informed that this test is designedto measure attitude. The score range for each set of questions is 0 to 9.The test-retest reliability for this instrument is .89. (See Appendix C foran example of the questions presented.)
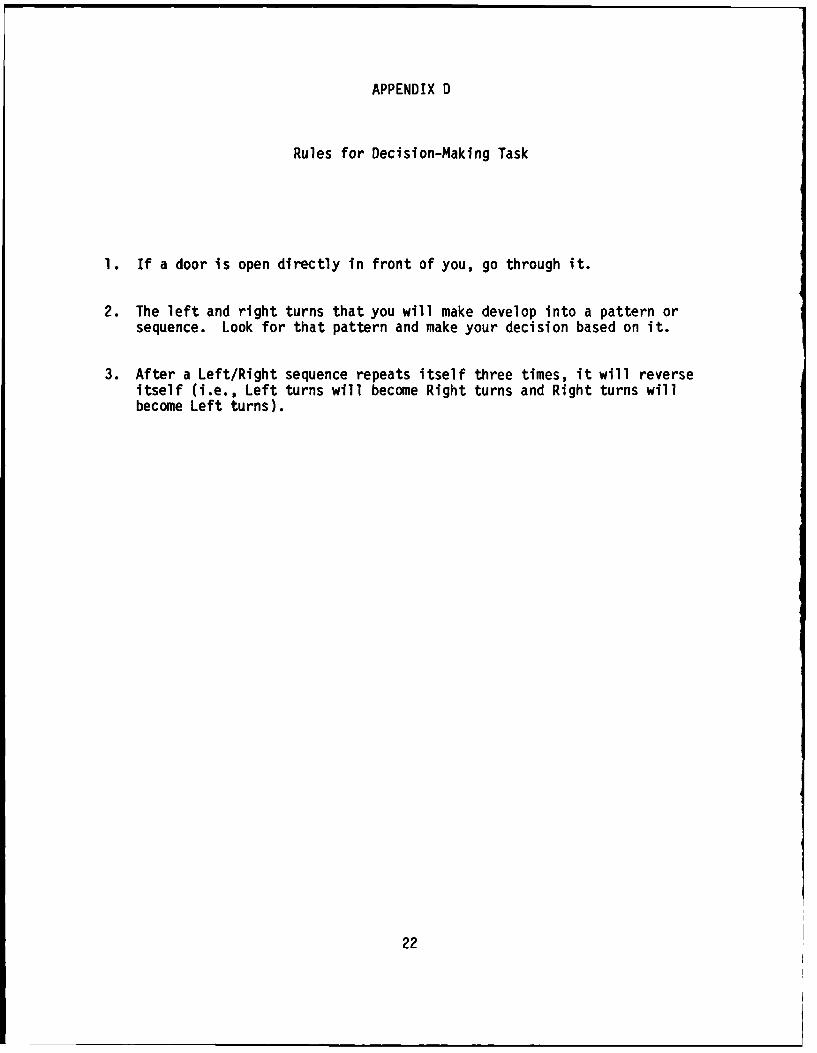
Decision-Making Test. This test, designed by the researcher, assessesan individual's ability to make decisions quickly and accurately. The test isa subroutine of a computer prograi, developed for the present study. Therespondent is required to progress successfully through a rectangular maze (25steps) by following a set of rules (see Appendix D). The respondent decideswhich direction to move and then enters his or her choice into the computer.To prevent visual scanning of the overall maze for the solution, only a smallsegment of the maze is displayed to the respondent. Incorrect responsesreceive an audible beep and the computer displays correct choices. The numberand location of errors, and the time (in seconds) to complete the maze, arerecorded by the computer. The maze was pretested to determine the appropriatelevel of difficulty for optimal visual screen presentation.
Equi pment
Two Commodore Amiga personal computers were used in this investigation.Each computer was equipped with a color Aniga monitor, two 3.5-inch diskdrives, and a "mouse." Video displays required for this study were developedwith the aid of the Deluxe Paint, Electronic Arts, and Aegis Animator softwarepackages.
Two Tinkertoy Building Sets (number 220) were used during the skilltesting. Each set contained building elements made of either wood orplastic. The elements came in several shapes and sizes, and in five colors,and were easily distinguishable from one another. A stopwatch (measuring tothousandths of a second) was used to time the skill testing.
The study was conducted at Wittenberg University in the Department ofEducation Building. Two rooms were used to conduct all the training andtesting sessions. Each room contained a desk (which held the computerequipment), two chairs, and all the equipment necessary for conducting thesession. The rooms were free of outside noise and distractions.
Procedures
This study employed a 2 X 2 X 3 X 3 (Gender X Cognitive Style XPresentation Format X Time) factorial design For the knowledge, skill, anddecision-making content areas. Performance measures were obtained immediatelyfollowing trailing, and at 2 weeks and 4 weeks after training was completed
7

(Time). For the attitude content areas, a 2 X 2 X 3 X 4 (Gender X CognitiveStyle X Presentation Format X Time) design was employed. Measures for theattitude content area were taken at pre-training (Time 1), post-training (Time2), and at 2 weeks (Time 3) and 4 weeks (Time 4) following training.
Cognitive Style Assessment
The 4-Mat Test, Group Embedded Figures Test, and the Swassing-BarbeModality Test were used to categorize subjects by cognitive style. TheLateral Preference Inventory was used to group subjects according tohemispheric dominance. Subjects with scores from -1.00 to +.23 were judgedright-hemisphere dominant (n = 28), and those with scores of +.38 to +1.00were judged left-hemisphere dominant (n = 31). Subjects were blockedaccording to cognitive style (left- and right-hemispheric dominance) andrandomly assigned to one of three presentation format treatment conditions(text, n = 20; graphics, n = 20; text-graphics, n = 19) such that there wereboth left- and right-hemispheric-dominant subjects in each treatmentcondition. Subjects were not informed during the study that there were threepresentation format conditions.
Training
Subjects received training in the content areas: knowledge, skill,attitude and decision-making. The order was counterbalanced. The order offormat presentation (text, graphics, and text-graphics) was alsocounterbalanced for all subjects to control for order-of-presentationeffects.
Knowledge Training. The knoaiedge training required subjects to learn 13pairs of words. Subjects in the text condition were presented with a wordpair and a sentence containing both words. The word-pair/sentencepresentation was employed to increase the potential for mnemonic memory. Onlyone word pair/sentence appeared on the screen at each presentation in order tominimize distraction and visual confusion. The time interval of eachpresentation was fixed, and advancement to the next word-pair/sentencepresentation was automatic, thus ensuring that presentation intervals wereconstant across subjects. Subjects practiced the word list once. Subjectskeyed-in their response to the stimulus word presented on the video screen.The correct response was acknowledged by the computer by displaying the word"correct" on the screen and presenting the next stimulus word in the list. Ifthe response was incorrect, the computer displayed the correct word, alongwith the sentence containing that particular word pair.
In the graphics condition, the training was identical to the training inthe text condition except that pictures rather than text were used tocommunicate the meaning of the sentences. Subjects in the text-graphicscondition also followed the same procedure (as in the text condition), exceptthat the sentences and the pictures were presented on the video screen withthe paired words.
Skill Training. In the skill training, subjects were required to build awindm from Tinkertoys. In the text condition, subjects were given time toread three pages of written directions for building the windmill. Thedirections were presented one page at a time, with a time limit for eachpage. After reviewing these directions, all subjects were given the firstpage of directions and the pieces necessary for building the windmill (plusfive distractor pieces), and were told to build the windmill as quickly aspossible. After completing this page, they were given the second page andreceived the third page after completing the second. In each case, they couldnot return to a previous page.
In the graphics condition, subjects were shown three consecutivecomputer-generated pictures, corresponding to each of the three pages oftext. The same procedure was followed for this condition, with the subjectsusing only the pictures to build the windmill.
In the text-graphics condition, subjects were given both the pictures andthe written directions to complete the task.
Attitude Training. In the attitude training, subjects were first asked tocomplete a pre-test. The training emphasized the advantages of thecontinuance of the Strategic Defense Initiative (SDI) project. In the textcondition, subjects read five screen "pages" of text (which were timed toadvance automatically) describing the benefits of SDI. Subjects thencompleted a post-test consisting of questions based upon the reading.
Subjects in the graphics condition were shown five pictorial graphs(describing the same information given in the text condition). In thetext-graphics condition, subjects were shown both the text and the graphics.
Decision-Making Training. In the decision-making training, subjects weregiven three rules necessary to successfully complete a maze. In the textcondition, the rules were presented individually on the screen, with timedadvancement to the next rule. In the graphics condition, the rules werepresented in pictures. In the text-graphics condition, subjects werepresented with both the written rules and the pictures. Subjects werepermitted to practice moving through a maze, with the rules on the screen atall times. Feedback was given to each subject, and errors were identified.
Performance Testing
Subjects were tested for performance in each content area immediatelyfollowing the training interval. Subjects also were tested at 2-week and4-week intervals following training, to measure retention. Subjects weretested two at a time in separate rooms.
For each testing session, the order of presentation of the four contentareas (knowledge, skill, attitude, and decision-making) was randomized foreach subject, and the order of presentation for questions on the attitude andknowledge measures was also randomized.
9

III. RESULTS
Presentation Format
A one-way analysis of variance was performed for each of the four contentareas. Results indicated statistically significant differences among groupsreceiving text, graphics, or text-graphics on the skill test and thedecision-making test.
Analyses were performed to indicate significant differences among groupsreceiving text, graphics, or text-graphics at each testing time for eachcontent area. The results are discussed below.
Knowledge Test. The results of the knowledge test indicated nosignificant differences among the presentation format groups. The knowledgetest at Time 1 indicated a higher number of errors for the text condition thanfor the graphics or text-graphics condition (see Table E-3, Appendix E), butthese differences were not significant at the .05 level.
Skill Test. At Time 1, a significant difference between groups wasobtained on the number of seconds to complete the skill test, F (2,58) = 9.30,p < .001. A Newman-Keuls analysis on these differences indicaTed thatsubjects in the graphics condition and the text-graphics condition took lesstime to complete the task than did subjects in the text condition (see TableE-4, Appendix E).
At Time 2, the difference between groups was again significant, F (2,58) =4.33, Z < .02. Again, analyses indicated that subjects in the graphTcscondition and the text-graphics condition took less time to complete the taskthan did subjects in the text condition.
At Time 3, the difference between groups was significant, F (2,58) = 3.56,< .03, and the subjects in the graphics condition took less Time to completee task than did subjects in the text condition and the text-graphics
condition.
Additionally, on the skill test at Time 2, a significant differencebetween groups was obtained on the number of errors, F (2,58) = 3.95,< .05, with the subjects in the graphics condition-having more errors thanid those in the other two groups. This difference was also significant at
Time 3, F (2,58) = 9.19, p < .001, and the graphics condition again had moreerrors tTan did the text or the text-graphics condition.
Attitude Test. The results of the attitude test indicated no significantdifferences among groups.
Decision-Making Test. On the decision-making test, the groups did notsignificantly differ as to the number of seconds required to complete thetask. At Time 1, however, a significant difference between groups wasobtained on the number of errors, F (2,55) = 5.83, P < .01. The subjects inthe graphics condition had more erFrors than did those in the other two groups
10

(see Table E-5, Appendix E). Table E-4 indicates that those in thetext-graphics condition maintained fewer errors from Time 1 through Time 3than did those in the other two conditions.
Gender Data
Analyses for gender differences in each presentation format condition forthe four content areas were performed.
Knowledge Test. At Times 1 and 2 of the knowledge test, significantdifferences were obtained (see Table E-6, Appendix E), with F (1,19) = 4.11, p<.04 at Time 1, and F (1,19) = 4.39, p < .05 at Time 2. At-both Time 1 andTime 2, in the text clndition, males made fewer errors than females did on theknowledge test.
Skill Test. No significant gender differences were found for this test.
Attitude Test. In the text condition, significant differences were notedat Times 2 through 4 on the attitude test (see Table E-7, Appendix E), withmales making fewer errors than females on this test at Time 2, F (1,19) =5.79: p < .03; at Time 3, F (1,19) = 4.97, p2< .04; and at Time-4, F (1,19) =6.00, p2 < .02.
Decision-Making. The number of errors on the decision-making test at Time2 resulted in a significant difference between groups, F (1,18) = 5.60, p <.03. Males (M = 4.8) had fewer errors on this task thaW did females (M = 9.3).
Cognitive Style (Hemisphericity)
Effects of hemisphericity on performance were studied for each of the threepresentation format conditions. No significant differences were obtainedamong groups in the text format condition.
In the graphics format condition on the knowledge test, at Time 2, thedifference between groups was significant, F (1,19) = 4.55, P < .05 (see TableE-8, Appendix E). Left-dominant subjects had fewer errors on this test thandid right-dominant individuals. The difference between groups at Time 3 wasalso significant, F (1,19) = 6.22, p< .02. Left-dominant subjects again hadfewer errors than did right-dominant subjects. No other differenceson the knowledge test were significant.
In the text-graphics format condition, the difference between groups atTime 1 on the attitude test was significant, F (1,17) = 9.33, P < .01.Right-dominant subjects (M = 4.2, n = 9) had 'rewer errors (M = 4.2) than didleft-dominant subjects (M-= 7.5, n = ll,). No other result? regardinghemisphericity were statTstically-significant.
Hemisphericity-by-Gender Data
On the skill test, at Time 3, an interaction effect of hemisphericity bygender was obtained, F (1,50) = 5.62, p_ < .02. Further analysis indicated
11
that, for right-hemisphere-dominant subjects, a significant difference betweenthe performances of males and females was obtained, F (1,27) = 6.52, p < .01.Females (M = 279, n = 15) had shorter completion timns than males (M = 347,n = 13) oW this task.
IV. DISCUSSION
Presentation Format
Does presentation format affect performance on training tasks in the areasof knowledge, skill, attitudes, and decision-making? The results support thenotion that presentation format affects performance on tasks in varyingcontent areas. The two content areas showing significant differences were theskill task and the decision-making task. The remaining two content areas,knowledge and attitude, did not produce significant results. However, thedata demonstrate trends toward format preference, and may warrant furtherresearch.
Skill Test. For the skill task specifically, results indicate thatsubjects in the graphics format condition had shorter completion times thanthose in the other two conditions. Those in the text format conditiondemonstrated the slowest times in completing the task. Therefore, on tasks ofthis nature, where the goal is fast completion of a skill, the graphics formatmay be the most appropriate format for presenting information. It may also bethat the text-graphics format may actually confuse some individuals by givingtoo much information and dividing attention between the textual and pictorialinformation presented.
With regard to accuracy in the skill task, however, subjects in thegraphics condition made significantly more errors than did subjects in theother two groups. Those in the text-graphics condition had the fewest numberof errors.
In computer-based training of a skill, when both speed and accuracy areimportant, it appears that the text-graphics format may be the mostappropriate. A speed-accuracy tradeoff was indicated by the results.Trainers may wish to sacrifice some speed to gain accuracy. Future trainingresearch should focus on the appropriate amount of textual and graphicsinformation available on the screen simultaneously for optimal performance.In much of the training of skills for military personnel, both speed andaccuracy are equally important. Therefore, attention to the appropriateconfiguration of text and graphics for simultaneous presentation is importantto training of skills for military personnel.
Decision-Making Test. In the decision-making content area, subjects inthe graphics format had more errors after initial training than did those ineither the text or the text-graphics condition. This difference decreasedover time. Although this was a simple decision-making task, it was designedto exemplify sequential decision-making at a three-step level. A graphicsformat may not be the most effective when teaching procedural decision-makingtasks.
12

Gender
Does gender affect performance in the four content areas? Malesoutperformed females on the knowledge task. This result supports the researchon gender differences for analytical and knowledge-based tasks (Porac & Coren,1981 ). This difference may suggest a change in training approaches for malesand females when teaching analytical, knowledge-based information. For males,presentation format made little difference in their performance in relation tofemales. The performance of males was highest in the graphics presentationformat.
Females, although consistently scoring below males, performed the highestin the text condition. Further research in this area could focus on genderdifferences in performance of knowledge-based tasks, with the possibility thatappropriate presentation formats for training may vary with males andfemales. For males, a graphics format may be the most effective, whereas atext format may be more effective for females.
Cognitive Style (Hemisphericity)
Does hemisphericity affect performance in the four content areas?Differences attributable to hemisphericity occurred on both the knowledge taskand the attitude task.
Knowledge Test. On the knowledge task, the differences were most evidentin t graphics condition. Left-dominant subjects made fewer errors thanright-dominant subjects when given information in the graphics format. Inaddition, left-dominant subjects in the graphics condition outperformed left-dominant subjects in the text and text-graphics conditions. Right-dominantsubjects in the text-graphics condition had the lowest number of errors of allright-dominant subjects.
The results may lend initial support for the training of knowledge-basedinformation in a graphics format for those who are left-dominant. Right-dominant individuals may benefit from information presented in a text-graphicsformat. Overall, left-dominant individuals performed slightly better on theknowledge task than did right-dominant individuals. This finding supportsprior evidence as to the location of hemispheric processing of knowledge-basedinformation (Porac & Coren, 1981 ). Left-hemisphere processing has beendemonstrated to play a primary role in language, and a major role in readingand in the learning of knowledge-related tasks (e.g., Hart, 1983; Hermann,1981; Kinsbourne, 1978). These results suggest that left-dominant individualsmay perform better on tasks of this nature, regardless of presentation format.
Attitude Test. Before training in attitudes, right-dominant individualsmade fewer errors on the attitude test than did the left-dominantindividuals. In addition, over time, right-dominant individuals changedattitudes more than did left-dominant subjects, and maintained the attitudechange over a longer period of time when given information in thetext-graphics format. This result supports research findings in the area of
13

information processing of attitudinal information (Hart, 1983; Hermann, 1981;Porac & Coren, 1981). For left-dominant subjects, the lowest number of errorsoccurred in the graphics format.
The implication from the results on hemisphericity is that somemodification of training programs on attitude and knowledge-based informationis in order. Future research could focus on the degree to which modificationis necessary in these two content areas. Additional research could focus onthe appropriate learning environment for right-dominant individuals in orderto enhance their performance in relation to left-dominant persons.
Conclusions
Of those factors studied in the present investigation, it appears that theformat of instructional material has the greatest influence on performance,and that the most effective format may depend on the content (knowledge,skill, attitude, or decision-making). It appears that gender and cognitivestyle may also affect performance on some tasks. Thus, the aspect of thetaxonomy dealing with content variations appears to have initial support inthe results of this research.
Future research can focus on continued testing of this taxonomy, setting agoal toward developing, for instructional designers, guidelines appropriate tothe relevant aspects of content and trainee cognitive styles.
Limitations
Several limitations to this study appear relevant:
1. Although subjects were randomly assigned to presentation formatconditions, they were not randomly drawn from the population. The subjectsfor this study were all college students. In military training, especiallyfor entry-level personnel, this may not be the case. Therefore, these resultscan be generalized only to other populations of similar age and educationallevels. The results, however, do merit further consideration as promisingpossibilities in the design of effective computer adaptive training.
2. The assessment device used to categorize subjects into left- andright-hemisphere dominance may have not been the most appropriate. Correla-tional data may lend support to additional aspects and measures of cognitivestyle more relevant to training in the fcur content areas. Although themeasure of cognitive style used for blocking subjects has validity andreliability data available, research in this area is still in its earlystages. It remains to be determined whether hand, foot, and eye preferencesalso relate to the preferences for the cognitive processing of information asmeasured in the knowledge, skill, attitude, and decision-making tasks.Preliminary data from this research, however, appear to support thetheoretical and empirical perspectives on cognitive style effects ininformation processing.
14

In addition, depending on the types of subjects available, the personsclassified as right-dominant may or may not score between -1 and 0 on theLateral Preference JTest (Porac & Coren, 1981). Since right-dominant personsappear to be in the minority (Wittrock, 1980), a larger sample would have beenneeded in order to have a right-dominant group who scored within this range.Therefore, subjects classified as right-dominant for the purposes of thisstudy scored between -1 and +.23 on this instrument, and may have tendedtoward more integrative processing. For this reason, some cognitive styleeffects might have been more evident, as in the skill task, had scores of -1to 0 (right-dominant) and 0 to +1 (left-dominant) been used for the blockingof subjects for this study. There was, however, a substantial differencebetween the highest score for the right-dominant subjects (+.23) and thebeginning score for the left-dominant subjects (+.38). In addition, the meanfor left-hemisphere-dominant individuals was +.82, while the mean forright-hemisphere-dominant individuals was -.20. This classification should,therefore, be considered appropriate for these circumstances.
3. A practice effect may have altered performance data on thedecision-making task, as subjects completed the same maze at all three testingsessions.
4. The training was designed to simulate tasks representative of actualtraining tasks in the content areas of knowledge, skill, attitude, anddecision-making. These training tasks were succinct and measured only oneexample of tasks in these areas. Therefore, this research is only thebeginning of investigations into computer adaptive training.
Fol 1 ow-On Research
Follow-on research can take several directions. First, research shouldcontinue efforts related to identified dimensions of cognitive style.Research into the nature of these characteristics and their relevance toadaptive training models should be conducted.
Second, research should focus on the development of a computer-basedassessment instrument useful at the onset of a training task. This instrumentcould assess the most salient factors for effective performance in trainingtasks in the content areas of knowledge, skill, attitude, anddecision-making. The present research has identified several possible factorsimportant to consider in the development of training programs (presentationformat, cognitive style, and gender). Observational data indicate that manyof the computer-based military training programs can be categorized into oneof the four content areas identified for this research project. Withadditional research, it may be possible to develop either a cross-content orcontent-dependent instrument to assess trainee characteristics beforetraining. Since computer-based training offers opportunities for thedevelopment of adaptive training programs, these programs could then beadapted to meet individual training needs.
Finally, research should continue testing the proposed taxonomy, whichlater may be employed in the development of guidelines for designers ofcomputer-based training programs.
15
REFERENCES
Allport, G.W. (1937). Personality, a psychological interpretation. New York:Holt and Company.
Ausburn, L.J., & Auburn, F.B. (1978). Cognitive styles: Implications forinstructional design. Educational Communications and Technology Journal(formerly AV Communication Review), 26(4), 337-354.
Buehner, L.J. (1987). Instructional design: Impact of subject matter andcognitive styles (AFHRL-TP-86-11, AD-A177 066). Wright-Patterson AFB,OH: Logistics and Human Factors Division, Air Force Human ResourcesLaboratory.
Gardner, R., Holzman, P.S., Kelin, G.S., Linton, H., & Spence, D.P. (1959).Cognitive control: A study of individual consistencies in cognitivebehavior. Psychological Issues, 1(4), 1-185.
Hart, L. A. (1983). Human brain and human learning. New York: Longman.
Hermann, N. (1981). The creative brain. Training and Development Journal,35(10), 10-16.
Holzman, P.S. (1952). Cognitive attitudes of leveling and sharpening intime-error assimilation tendencies. Doctoral dissertation, University ofKansas.
Kagan, J. (1965). Individual differences in the resolution of responseuncertainty. Journal of Personality and Social Psychology, 2, 154-160.
Kelly, G.A. (1955). The psychology of personal constructs (Vol. 1). NewYork: Norton.
Kinsbourne, M. (1978). The asymmetrical function of the brain. New York:Cambridge University Press.
Klein, G.S., & Schlesinger, H.J. (1951). Perceptual attitude towardinstability: Prediction of apparent movement experiences from Rorschachresponse. Journal of Personality, 19, 36-37.
Kogan, N. (1971). Educational implications of cognitive styles. In G.S.Lesser (Ed.), Psychology and Educational Practice (pp. 242-292). Glenview,IL: Scott Foresman and Co.
Kolb, D. (1976). The learning style inventory. Boston, MA: McBer andCompany.
Lowenfeld, V., & Brittain, W.L. (1970). Creative and mental growth (5th ed.).(pp. 1, 38). New York: MacMillan.
16

Messick, S. (1966). The criterion problem in the evaluation of instruc ion:Assessing possible, not just intended outcomes. Princeton, NJ:Educational Testing Service.
Messick, S. (1970). The criterion problem in the evaluation of instruction:Assessing possible, not just intended outcomes. Princeton, NJ: Educa-tional Testing Service.
Messick, S., & Kogan, N. (1963). Differentiation and compartmentalization inobject-sorting measures of categorizing style. Perceptual and MotorSkills, 16, 847-850.
Moore, M.V., & Nawrocki, L.H. (1978). The educational effectiveness of2raphic displays for computer-assisted instruction (Technical Report No.332). Alexandria, VA: U.S. Army Research Institute for the Behavioraland Social Sciences.
Pask,G.S., & Scott, B.C.E. (1972). Learning strategies and individualcompetence. International Journal of Man-Machine Studies, 4, 217-253.
Pettigrew, T.F. (1958). The measurement and correlates of category width as acognitive variable. Journal of Personality, 26, 532-544.
Porac, C., & Coren, S. (1981). Lateral preferences and human behavior. NewYork: Springer-Verl ag.
Santostefano, S.G. (1969). Cognitive controls versus cognitive styles:Diagnosing and treating cognitive disabilities in children. Seminars inPsychiatry, 1, 291-317.
Schwen, T.M., Bedner, A.K., & Hodson, K. (1979). Cognitive styles: Boon orbane? Viewpoints in Teaching and Learning, 55, 49-63.
Witkin, H.A. (1965). Psychological differentiation and forms of pathology.Journal of Abnormal Psychology, 70, 317-336.
Witkin, H.A., Moore, C.A., Goodenough, D.R., & Cox, P.W. (1977). Fielddependent and field independent cognitive styles and their educationalimplications. Review of Educational Research, 47, 1-64
Wittcock, H.D. (1930). The brain and psychology. New York: Academic Press.
17
APPENDIX A
Lateral Preference Test
Directions: Please circle the response that represents the hand, foot, eye,or ear you would use in most cases. Circle "both" if you would usually useeach equally as well.
Left Right Both
1. With which hand would you throw a ball to hit
a target? L R B
2. With which hand do you draw? L R B
3. With which hand do you use an eraser on paper? L R B
4. With which hand do you give out the top cardwhen dealing? L R B
5. With which foot do you kick a ball? L R B
6. If you wanted to pick up a pebble with yourtoes, which foot would you use? L R B
7. If you had to step up onto a chair, which footwould you place on the chair first? L R B
8. Which eye would you use to peep through akeyhole? L R B
9. If you had to look into a dark bottle to seehow full it was, which eye would you use? L R B
10. Which eye would you use to sight down a rifle? L R B
11. If you wanted to listen in on a conversationgoing on behind a closed door, which ear wouldyou place against the door? L R B
12. If you wanted to hear someone's heart beat,which ear would you place against their chest? L R B
13. Into which ear would you place the earphone ofa transistor radio? L R B
Porac, C., & Coren, S. (1981). Lateral preferences and human behavior.
New York: Springer-Verlag.
18

APPENDIX B
Word Pairs for Knowledge Task
1. Come - Go
2. Lead - Pencil
3. In - Although
4. Country - France
5. Dig - Guilty
6. Lock - Door
7. Jury - Eagle
8. Murder - Crime
9. Knife - Sharp
10. Necktie - Cracker
19

APPENDIX C
ATTITUDE TEST QUESTIONS
Directions: Read each of the following true/false questions. If thestatement is false, write "F." If the statememt is true, write "T." Here arethe questions.
1. Because of the SALT I Treaty, the Soviet Union hasdiscontinued the building of military resources.
2. Since the Strategic Defense Initiative (SDI) can interceptmissiles launched from submarines, it is important for theUnited States to protect its major coastal ports and cities bycontinuing this program.
3. The United States is not as strong in military force fordefense as is the Soviet Union.
4. The United States is at an advantage in the number ofintermediate and intercontinental missiles.
5. The greatest threat to the United States from the Soviet Unionis in the balance of aircraft between the two countries.
6. The Soviet Union has produced significantly less submarines,aircraft and armor in the years 1974-1982 than the UnitedStates.
7. The SDI program President Reagan proposes is designed to bethe most effective defense against submarine attacks.
8. The United States has not remained within the limits of theSALT I Treaty.
9. The United States needs to spend money to build militaryforces to become more equal to the Soviets.
10. Since the major concern of the United States is to protect thelives of innocent people in times of war, the SDI (with itsaccuracy in hitting only targets) would provide necessaryprotection for United States citizens.
11. If the Soviets are not remaining within the limits of SALT I,it is important for the United States to increase money spenton defense.
12. Due to the imbalance of aircraft between the two countries, itis advantageous for the United States to continue itsdevelopment of the SDI program.
20

APPENDIX C (Concluded)
13. The Soviet Union has broken a promise made in the SALT ITreaty by continuing to build military strength.
14. If an enemy were to conduct a nuclear attack on the city ofChicago without an effective United States defense such asSDI, a relatively few number of people would die instantly.
15. If we were to go to war with a nation such as the SovietUnion, the United States may lose because of an imbalance ofweapons support.
16. The development of SDI can act to equalize the balance of armsbuildup between the two world powers.
17. The United States should have an equal number of weapons asthe Soviet Union to insure peace, not war.
18. In the years 1974-1982, the Government Union produced less ofboth aircraft and armor than the United States.
21
APPENDIX D
Rules for Decision-Making Task
1. If a door is open directly in front of you, go through it.
2. The left and right turns that you will make develop into a pattern orsequence. Look for that pattern and make your decision based on it.
3. After a Left/Right sequence repeats itself three times, it will reverseitself (i.e., Left turns will become Right turns and Right turns willbecome Left turns).
22

APPENDIX E
TABLES
TABLE E-1. Fifteen Dimensions of Cognitive Style
1. Field-independence Versus Field-dependence (Witkin, 1965)
Individual differences as to the manner in which individuals perceivethemselves in spatial terms. Field-independent individuals perceiveanalytically and can easily separate "figure" from "ground." Field-dependentindividuals perceive globally and have difficulty organizing/separating simplefrom more complex figures.
2. Reflective Versus Impulsive (Kagan, 1965)
Individual differences regarding the speed and manner in which hypothesesare selected and processed. Reflective individuals delay a long period oftime before acknowledging a solution. Impulsive individuals select the firstsolution and are, as a result, many times, incorrect.
3. Sharpening Versus Leveling (Holzman, 1952; Klein & Schlesinger, 1951)
Consistent individual variations in memory assimilation (in theidentification and integration of impressions). Sharpening reflects atendency to maximize perceived differences and is less prone to confusion ofsimilar stimuli. Leveling individuals minimize perceived differences andmerge past memories.
4. Breadth of Categorizing (Kogan, 1971; Pettigrew, 1958)
Individual differences as to the degree to which an individual willinclude items within categories. Individuals with narrow categorizationstyles are resistant to the inclusion of many items in a single category.Individuals with a broad style demonstrate a willingness to include many itemswithin one category.
5. Scanning (Messick, 1970)
Individual differences in attention deployment which produce variations invividness of experience and range of awareness. Differences may be describedin terms of narrow or broad deployment of attention.
6. Tolerance for Unrealistic Experiences (Klein & Schlesinger, 1951)
Individual differences (demonstrated in research studies on apparentmovement) as to willingness to accept perceptions which vary from experience.A less tolerant individual style is more bound to reality and has a morerestricted range of illusionary movement. A more tolerant style allows for abroader range.
23

TABLE E-l (Continued)
7. Cognitive Complexity-Simplicity (Kelly, 1955)
Individual differences in the tendency to interpret the world in acomplex, multidimensional way. This includes the number of dimensions andindividual forms in judgments or the number of discriminations withinconstructs. Current research reviews the continuum of abstractness/concreteness.
8. Conceptualizing Styles (Messick & Kogan, 1963)
Individual differences in the way individuals approach the categorizationof similarities/differences among stimuli. This includes two aspects:equivalence range (very similar to breadth of categorization) and conceptualdifferentiation (differentiation-compartmentalization). Differentiation isthe number of groups to which more than a single item is assigned.Differentiation correlates with verbal knowledge and vocabulary level(synthesis of information). Compartmentalization indicates the number ofsingle items not placed in any categorical group. Compartmentalizationcorrelates negatively with creativity and demonstrates difficulty ingenerating alternate conceptual schemes.
9. Constricted Versus Flexible Control (Gardner, Holzman, Klein, Linton &Spence, 1959)
Individual differences in individuals' vulnerability to cognitive andenvironmental distraction. A constricted style represents retention ofincidental stimulation and a flexible style indicates failure of retention.Kogan (1971) questions this interpretation of terminology. For thesepurposes, the terms will be reversed.
10. Distractibility (Santostefano, 1969)
The degree to which individuals react to contradictory cues. This is anoutgrowth of constricted versus flexible control which has been relatedto (but is different from) field-dependence/field-independence. This styleimplies a range of individual proneness to distraction. This aspect ofcognitive style has not been researched as thoroughly as others.
11. Visual Versus Haptic (Lowenfeld & Brittain, 1970)
The degree to which individuals rely on visual or kinesthetic cues forinformation processing. The visual individual uses visual imagery, holisticprocessing, and the integration/synthesis of component parts. The hapticindividual uses "bodily" perceptions, and is kinesthetically oriented. An"indefinite" individual combines the use of both.
12. Cautiousness Versus Risk-Taking (Kogan, 1971)
Individual differences in willingness to take risks in decision-makingsituations. Although this dimension is usually task-specific, there are some
24
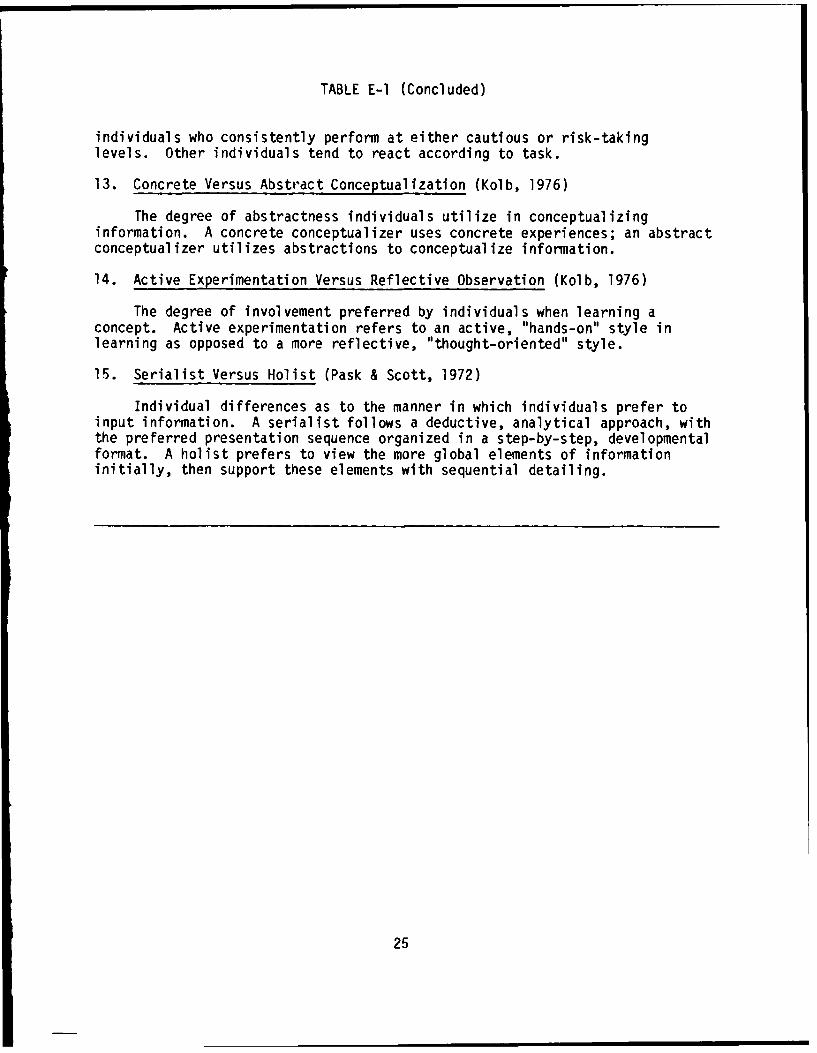
TABLE E-1 (Concluded)
individuals who consistently perform at either cautious or risk-takinglevels. Other individuals tend to react according to task.
13. Concrete Versus Abstract Conceptualization (Kolb, 1976)
The degree of abstractness individuals utilize in conceptualizinginformation. A concrete conceptualizer uses concrete experiences; an abstractconceptualizer utilizes abstractions to conceptualize information.
14. Active Experimentation Versus Reflective Observation (Kolb, 1976)
The degree of involvement preferred by individuals when learning aconcept. Active experimentation refers to an active, "hands-on" style inlearning as opposed to a more reflective, "thought-oriented" style.
15. Serialist Versus Holist (Pask & Scott, 1972)
Individual differences as to the manner in which individuals prefer toinput information. A serialist follows a deductive, analytical approach, withthe preferred presentation sequence organized in a step-by-step, developmentalformat. A holist prefers to view the more global elements of informationinitially, then support these elements with sequential detailing.
25

Table E-2. Cognitive Styles and Possible Instructional Modifications
1. Field-Independence Field-Dependence
- use advanced organizer to define - use advanced organizer
advanced relationships - use highlighting
- use highlighting - review to direct synthesis of
- review to synthesize information information
2. Reflective Impulsive
- adjust the pacing on instruction - adjust the pacing of instruction
- highlight points of emphasis during to "slow down" for effective
instruction performance
- highlight points of emphasis
during instruction
3. Sharpening Leveling
- demonstrate relationships through - highlight differences
use of a "web" - use mnemonics to direct
- use mnemonics to combine combinations
characteristics - use variety of questioning
- utilize all levels of questioning techniques to focus and direct
to force combination of training attention
components
4. Narrow Categorization Broad Categorization
- use "webs" to structure - use webbing to structure
information information
- use advanced organizers to - use advanced organizers to
provide overview of training focus attention on important
- use frequent review and aspects of training program
reinforcement to combine - use highlighting to direct
training components attention
26

Table E-2. (Continued)
5. Narrow Scanning Broad Scanning
- spread spacing on page and - focus attention with use of
use highlighting highlighting
- use graphic symbols as keys to - use graphic symbols as keys to
direct attention focus attention
- display information at different - display information at different
times to clearly direct attention times to clearly direct attention
6. Low Tolerance for Unrealistic High Tolerance for Unrealistic
Experiences Experiences
- use realistic examples (visual - use realistic examples (visual
and verbal) and verbal)
- use a variety of examples for - use a variety of examples for
application of concepts application of concepts
- use actual materials whenever - utilize color and graphics
possible to enhance interest
7. Cognitive Simplicity Cognitive Complexity
- use highlighting to narrow - provide graphic organizer
field of vision (cognitive map) to organize
- use outline/mapping to - utilize realistic examples to
organize information apply training to variety of
- arrange information well-spaced situations
on screen (minimize "clutter") - use mnemonics to combine and
classify information
27

Table E-2. (Continued)
8. Compartmental ization Differentiation- use webbing/mapping - use webbing/mapping
- choose experiences forcing the - use highlighting to classify
combination of categorization appropriate information- use variety of questioning - provide realistic examples
techniques and feedback to demonstrating application of
encourage the identification of training information
interrelationships among training
components
9. Constricted Flexible
- use highlighting to emphasize - use highlighting to narrow
- use different sizes of lettering, focus of attention to
etc. to stress organization of important training components
information - utilize graphics and color to- add additional provide interest and examples of
information progressively information presented
- provide frequent opportunities
to review/rei nforce
information presented
10. Not Prone to Distraction Prone to Distraction
- arrange information on screen - limit amount of information
for best retention of greatest displayed at a given time
possible amount of information - use highlighting to direct
- allow trainee flexibility to attention
determine amount of feedback - provide frequent feedback and
and review reinforcement
- use graphics and color to vary - provide frequent review usingpresentation mode colors and graphics
28

Table F;-2. (Continued)
11. Visual Haptic
- use color and graphics to - use color and graphics to
reinforce ideas reinforce concepts
- provide realistic experiences - provide experiences in working
to provide opportunities with equipment, etc.
to apply training (i.e., "hands-on" training)
- provide outline for organization - provide realistic examples to
of training assist trainee in applying
information presented
12. Cautiousness Risk-Taking
- use directed learning experiences - use directed learning experiences
- provide experiences for aided to control amount of information
generalizations and direct attention- provide experiences which - use highlighting to focus
become sequentially more complex attention on appropriate
information- provide experiences which
become sequentially more complex
13. Concrete Conceptualization Abstract Conceptualization
- begin with concrete experience and - begin with concrete experiences,
move toward abstract allowing flexibility for holistic
- use mnemonics to combine and processing
categorize training content - provide realistic experiences to
- use webbing to show relationships apply knowledge gained
among training components - provide opportunities for
frequent review and
reinforcement
29
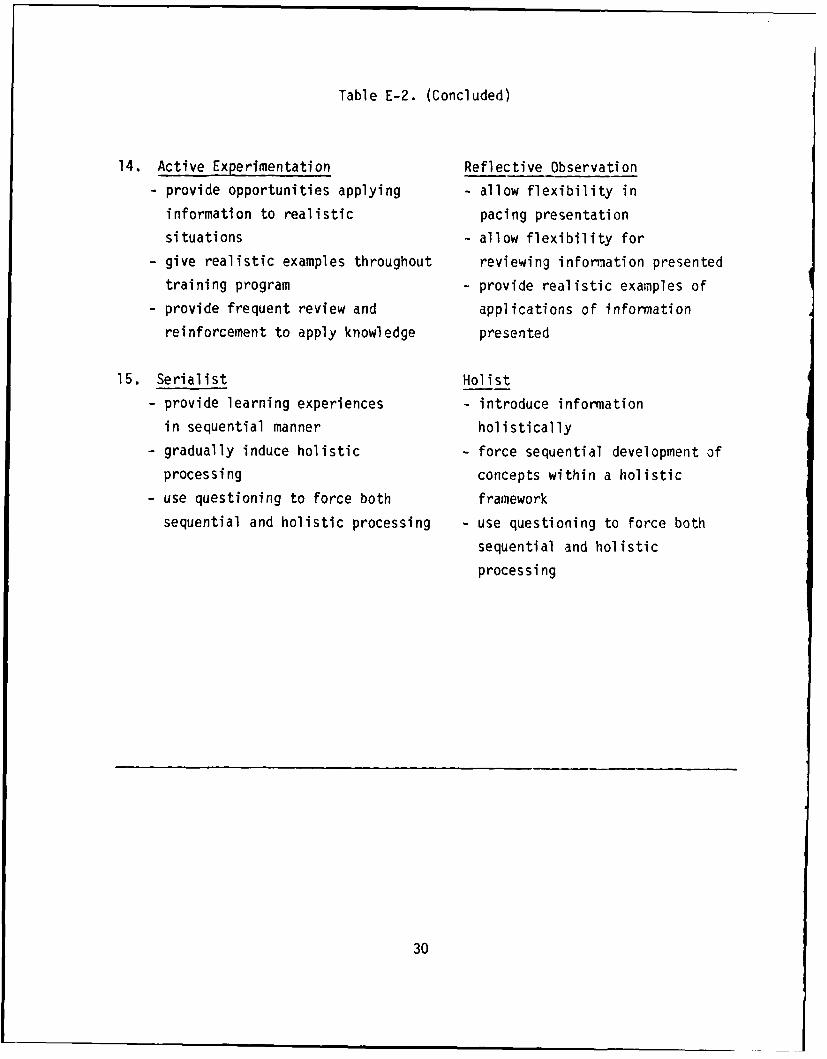
Table E-2. (Concluded)
14. Active Experimentation Reflective Observation
- provide opportunities applying - allow flexibility in
information to realistic pacing presentation
situations - allow flexibility for
- give realistic examples throughout reviewing information presented
training program - provide realistic examples of
- provide frequent review and applications of information
reinforcement to apply knowledge presented
15. Serialist Hol ist
- provide learning experiences - introduce information
in sequential manner holistically
- gradually induce holistic - force sequential development of
processing concepts within a holistic
- use questioning to force both framework
sequential and holistic processing - use questioning to force both
sequential and holistic
processing
30

Table E-3. Mean Number of Errors on the Knowledge Test in Three Presentation
Format Conditions
Format n Time 1 Time 2 Time 3
Text 20
M 1.00 5.00 5.20
SD 1.21 1.73 1.96
Graphics 20
M .25 5.05 5.30
SD .72 1 .50 1 .69
Text/Graphics 19
M .58 4.47 4.74
SD 1.07 2.29 2.31
31

Table E-4. Mean Number of Seconds to Complete Skills Test in Three
Presentation Formats Across Time
Format n Time 1 Time 2 Time 3
Text 20
M *740.80 *433.50 *335.30
SD 263.48 83.28 60.23
Graphics 20
M 441.30 329.80 272.20
SD 162.62 89.71 76.40
Text/Graphics 19
M 573.05 381.00 *323.47
SD 222.66 150.90 97.88
* statistically significant.
M = mean.
SD = standard deviation.
32

Table E-5. Mean Number of Errors on the Decision-Making Test in Three
Presentation Format Conditions
Format n Time 1 Time 2 Time 3
Text 20
M 3.2 1.6 1.2
SD 4.0 1.8 1.4
Graphics 20
M *3.6 2.9 3.3
SD 1.9 1.8 2.2
Text/Graphics 19
M 1.8 1.5 1.1
SD 2.0 1.6 1.6
* statistically significant.
33

Table E-6. Mean Number of Errors for Knowledge Test in the Text Presentation
Format Condition by Sex
n Time 1 Time 2 Time 3
Males 8
M * .4 *4.0 4.5
SD .5 1.3 2.0
Females 12
M 1.4 5.5 5.6
SD 1.4 1.7 1.9
* statistically significant.
34
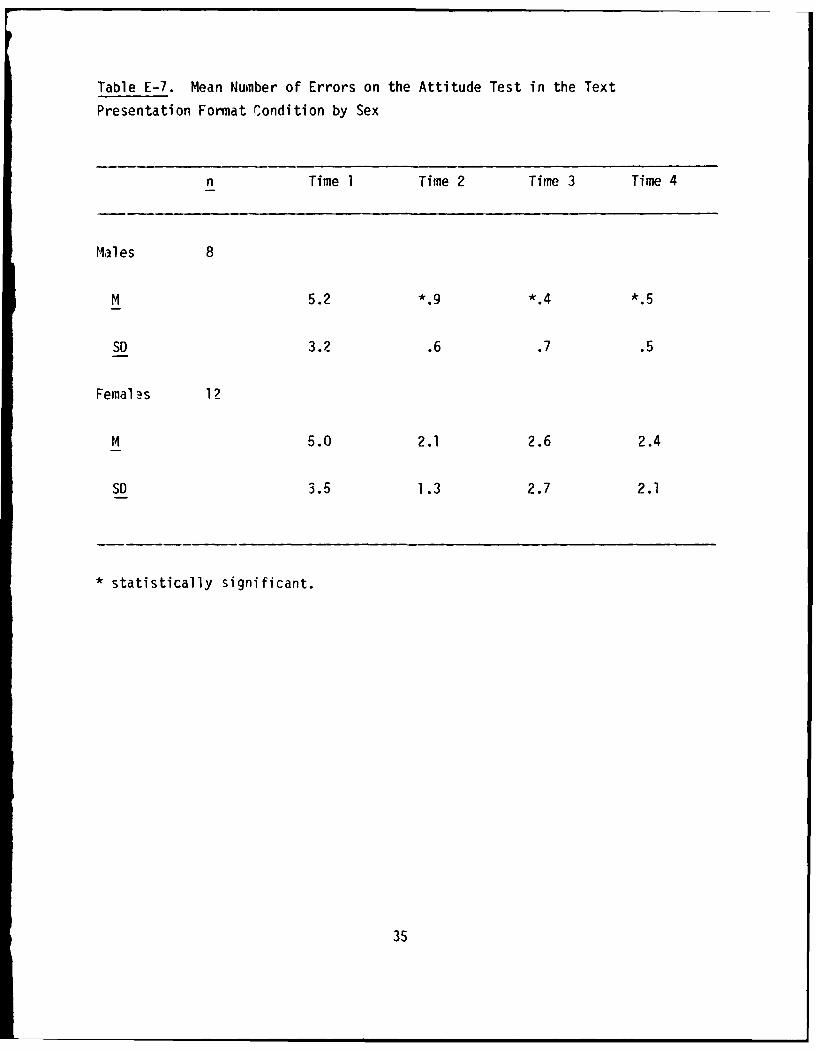
Table E-7. Mean Number of Errors on the Attitude Test in the Text
Presentation Format Condition by Sex
n Time 1 Time 2 Time 3 Time 4
Males 8
M 5.2 *.9 *.4 *.5
So 3.2 .6 .7 .5
Femal-s 1?
M 5.0 2.1 2.6 2.4
SD 3.5 1.3 2.7 2.1
* statistically significant.
35

Table E-8. Mean Number of Errors for Knowledge Test in the Graphics
Presentation Format Condition by Hemisphericity
n Time l Time 2 Time 3
Left-Dominant 11
M .4 *4.4 *4.5
SD .9 1.7 1.7
Right-Dominant 9
M .1 5.8 6.2
SD .3 .8 1.1
* statistically significant.
U. S. GOVERNMENT PRINTING OFFICE: 1990--761-O51/20023
36