Embed Size (px)
Citation preview

TID-4500, UC-48 Biology and Medicine
La-nrrenoe Radiation Laboratory
UNIVERSITY OF CALIFORNIA
LIVERMORE
UCRL-50163 Part I
PREDICTION OF THE MAXIMUM DOSAGE TO MAN
FROM THE FALLOUT OF NUCLEAR DEVICES
I. ESTIMATION OF THE MAXIMUM CONTAMINATION
OF AGRICULTURAL LAND
Arthur R. Tamplin
Bio-Medical Research Division
January 3, 1967
DISTRIBUTION STATEMENT A Approved for Public Release
Distribution Unlimited
Reproduced From Best Available Copy 20000914 121
Printed in USA. Available from the Clearinghouse for Federal Scientific and Technical Information, National Bureau of Standards,
U S Department of Commerce, Springfield, Virginia 22151 Price: Printed Copy $3.00; Microfiche $0.65
-li-
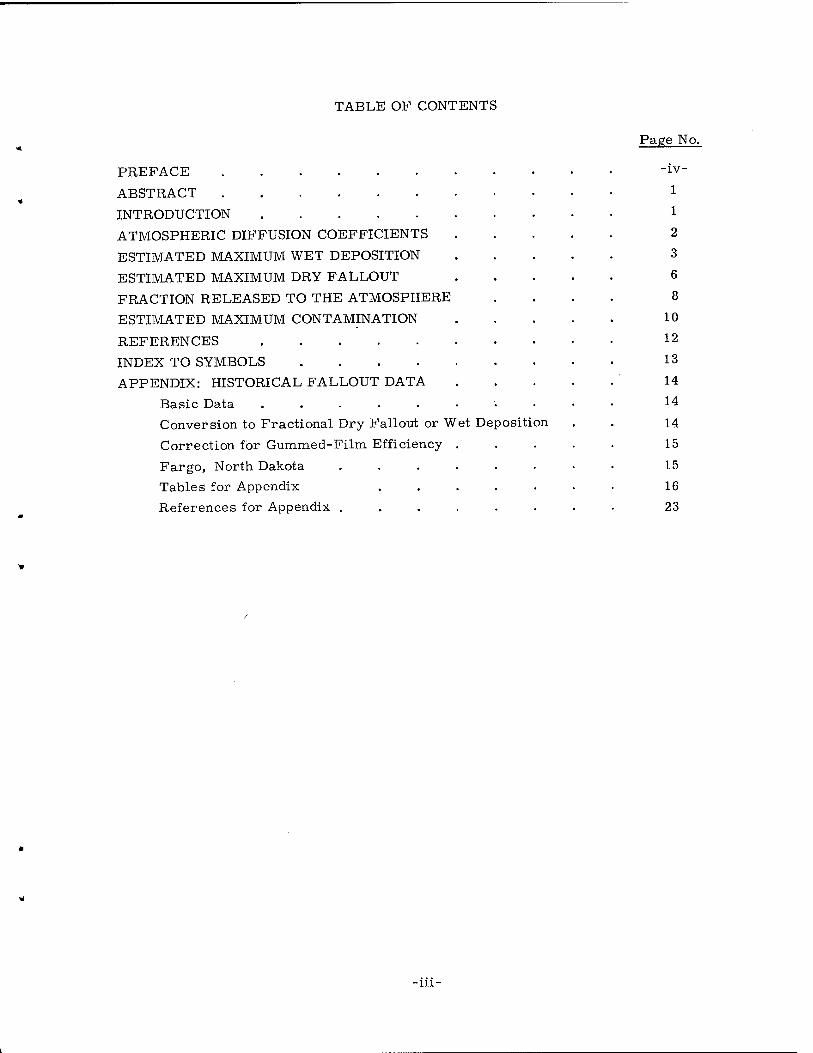
TABLE OF CONTENTS
Page No.
PREFACE
ABSTRACT
INTRODUCTION
ATMOSPHERIC DIFFUSION COEFFICIENTS
ESTIMATED MAXIMUM WET DEPOSITION
ESTIMATED MAXIMUM DRY FALLOUT
FRACTION RELEASED TO THE ATMOSPHERE
ESTIMATED MAXIMUM CONTAMINATION
REFERENCES
INDEX TO SYMBOLS
APPENDIX: HISTORICAL FALLOUT DATA
Basic Data ........
Conversion to Fractional Dry Fallout or Wet Deposition
Correction for Gummed-Film Efficiency .
Fargo, North Dakota ......
Tables for Appendix .....
References for Appendix ......
-IV-
1
1
2
3
6
8
10
12
13
14
14
14
15
15
16
23
-in-
PREFACE
1 01 The extensive coverage given to I and infant thyroid dosages subsequent to
nuclear device testing at the Nevada Test Site is sufficient evidence to indicate that
both preshot prediction and postshot documentation of the dosage to humans from
internal emitters was inadequate. So far as I131 is concerned, the postshot documenta-
tion was partially corrected in 1957. However, this documentation capability was not
integrated with preshot prediction and as a result "surprises" occurred following the
July 1962 tests.
Whether or not such "surprises" could have been anticipated in July 1962 is at
this time academic. It is* important to point out, however, that there is every reason
to believe that these "surprises" need not occur in future events if an adequate program
of preshot prediction is integrated with an adequate program of postshot documentation.
Off-site radiological safety programs should and can be conducted with the same degree
of planning and precision as laboratory experiments. Thus, preshot prediction should
not serve the sole purpose of preshot rad-safe analysis. Rather, it should also have
the function of guiding the postshot documentation by suggesting what to measure, where to measure it, and the precision required in the measurement. Furthermore,
the preshot prediction program should feed on the postshot documentation results in
order to improve subsequent predictions.
There are two other points that appear to be obvious conclusions from previous
test results: 1) No radionuclide that is produced should be ignored until a critical
analysis demonstrates that it is insignificant, and 2) preshot prediction and preshot
documentation must encompass distances extending 2000 to 3000 miles from the site
of detonation.
The Information Integration Group of the Bio-Medical Research Division has
accepted the responsibility for developing this preshot predictive capability. UCRL-50163
(Parts I and II) presents our approach to predicting the dosage from each and every
radionuclide that is released to the atmosphere and deposited on agricultural lands remote from the site of detonation. Our group is also investigating the aquatic transport
of nuclear debris by surface and ground water into fresh water and marine ecosystems;
this will be presented in a separate report.
In Part I of this report the approach that we shall use to estimate the fallout and
rainout levels as a function of cloud travel time for periods up to 50 hr post detonation
is presented. Part II, "Estimation of the Maximum Dose from Internal Emitters, " by Yook C. Ng and Stanley E. Thompson, will show how these fallout estimates can be
combined with radionuclide production estimates and biological uptake relationships to
arrive at burden and dosage estimates for man.

There were three questions which we could have asked concerning the outcome of the detonation of a nuclear device. Therefore, it is essential that the reader
recognize which of the three is the question that we are trying to answer and why we
feel that it is the most appropriate question to answer. The three questions which we could have asked are:
(1) What is the worst situation that could develop?,
(2) What is the most likely situation that will develop?
(3) What would be the situation if everything went off perfectly?
We choose to answer the first question and to direct our efforts toward predicting
the worst case. (However, in the process of answering the first question we can
generally answer the second. Quite obviously, the answer to the third question has
no meaning with respect to public health and safety.) We feel that only the worst case
should be compared with prescribed tolerances in a preshot rad-safe analysis. Moreover,
it is only when we know the worst case that we can establish an adequate system of
postshot monitoring to document the actual case and to insure that appropriate counter-
measures are instituted when and if needed. In other words, it is only by this approach
that uncertainties concerning dosimetry, such as presently exist in the case of I131, can be eliminated.
Furthermore, we are attempting to be quite thorough in our analyses and are
considering each and every radionuclide recorded on the chart of the nuclides. In this
respect, our estimates may indicate that a particular radionuclide is a hazard for one
of two reasons: 1) Either it will be a hazard because of what we know about it or
2) it will be a hazard because of what we don't know about it. If a pertinent relationship is not known concerning a particular radionuclide, we make worst case estimates of
the relationship and, hence, maximize our estimates of hazard. Nevertheless, even
though it is conservative, this approach still allows us to eliminate most of the radio-
nuclides from consideration and to indicate those that are potentially the most hazardous.
Obviously, it also allows us to estimate the upper limit of the potential burden and
dosage; however, due to the perversity of nature, the precise dosage can only be
determined by postshot documentation in the affected areas.
131 It is obvious that had I been measured in milk during the early period of
testing, its dosimetry would not be a problem. Thus, through our predictive approach
we want to be able to indicate what should be measured, where it should be measured,
and with what precision it should be measured. There would appear to be no other way
to assure that the dosimetry of future events is unambiguous and that the need for
countermeasures is recognized in time so that they can be planned for and instituted when
and if needed. In this respect, the most appropriate countermeasures lie in device
design. In Part II of this report, by Ng and Thompson, it is shown how this predictive
approach can supply guide lines for the design of nuclear devices that might be used in the construction of a sea level canal.
Thus, this predictive approach is meant to serve three purposes:
1) First, in preshot rad-safe analysis, by determining whether or not
a particular event can be conducted without exceeding existing
tolerances.
2) Second, in guidance for postshot documentation, by indicating what
should be measured, where it should be measured, and with what
precision it should be measured.
3) Third, in guidance for device design, by indicating the maximum
amount of a radionuclide that can be produced and subsequently released
to the environment without exceeding prescribed tolerances.
-vi-
-1-
PREDICTION OF THE MAXIMUM DOSAGE TO MAN
FROM THE FALLOUT OF NUCLEAR DEVICES
I. ESTIMATION OF THE MAXIMUM CONTAMINATION
OF AGRICULTURAL LAND
Arthur R. Tamplin
Bio-Medical Research Division
Lawrence Radiation Laboratory, University of California
Liver more, California
January 3, 1967
ABSTRACT
Part I of this report presents a semi-empirical approach toward estimating the
maximum contamination of agricultural land by radionuclides produced by nuclear
devices. It is based upon the maximum fallout levels observed subsequent to all
previous tests of nuclear devices and applies to cloud travel times or fallout arrival
times ranging from 1 to 50 hr and beyond.
INTRODUCTION
While considerable effort has been directed toward fallout prediction models
and while considerable is known about the transport of fallout particles in, and the
deposition of these particles from, the atmosphere, fallout models are reasonably
successful only in predicting the relatively close-in fallout of large particles (>20 ß in
diam). The major reason for this is that predicting long-range fallout is tantamount
to predicting the weather. It requires prediction of the velocity and direction of wind
and the amount of rainfall 50 or more hours in advance over distances of 2000 or more
miles. At the same time, the iodine problem arising from previous tests of nuclear
explosive devices indicates that just such an ability is required in order to make an
adequate preshot rad-safe analysis of any future tests that might release radioactivity
to the atmosphere, such as the Plowshare Program for the peaceful uses of nuclear
explosive devices.
The purpose of Part I of this document is to present a semi-empirical approach
to the prediction of long-range fallout of tropospheric debris from Plowshare cratering
experiments. It is based upon observed fallout levels that have occurred subsequent
to previous nuclear device tests. The approach is directed toward predicting the
maximum credible fallout level that could contaminate agricultural lands remote from
the detonation site. The maximum credible level is the most significant level from the
standpoint of public health and safety. Thus, this report is not intended to be a
sophisticated treatise on meteorology. It is not directed toward the prediction of likely
fallout levels given a certain set of input parameters; rather, it presents the approach
that is used by the Bio-Medical Research Division to estimate what might be the worst
case for some suggested nuclear event.
Previous experiments concerning cratering with nuclear explosive devices have
shown that there are two types of clouds produced in a cratering event: a main cloud,
similar to the one produced by a tower shot, that separates from the ground and rises
to some height, and a base-surge cloud that hugs the ground and extends upward
depending upon the yield of the device. Except for very-low-yield shots (<1 kt), the
height of the base-surge cloud is such that the treatment used in this report can be
applied to both clouds.
In predicting the maximum dry fallout or wet deposition, we have applied the
experience gained from tower detonations. Because of the lack of sufficient data,
worst-case assumptions have been made concerning activity versus particle-size
distribution and concerning the fraction of the activity released to the atmosphere.
ATMOSPHERIC DIFFUSION COEFFICIENTS
As a nuclear cloud moves downwind from the site of detonation, its concentration
is reduced by horizontal and vertical eddy diffusion as well as by velocity and directional
wind shear. The effects of shear are discussed in the subsequent section of this report.
It suffices here to state that maximum dry fallout or wet deposition occurs in the absence
of shear.
In estimating dispersion of material in the atmosphere over large distances or
over long travel times, a Fickian-type diffusion is assumed. As a result, the standard
deviation of the spread of the material is given by
^h= ysKht
and
■3-
where K, is the horizontal eddy-diffusion coefficient and Kv is the vertical eddy-diffusion
coefficient. In the following treatment, a numerical value for Kv is not required.
Heffter has reviewed all the previous data relative to K, and has determined 4 2 that for long travel times (>24 hr) an average value of K, = 4 X 10 m /sec will fit most
1 of the data. At the same time, the data he presents support the concept of accelerated 2
relative diffusion as put forth by Pasquill. This concept suggests that the value of
K, increases with cloud travel time. The explanation for this is that as the cloud grows
in size, it is influenced by larger and larger eddies and hence the apparent value of K, 3 2
increases. In the following treatment, we shall use a value of K= 4 X 10 m /sec at 4 2 a travel time of 1 hr and increase this to 4 X 10 m /sec at a travel time of 24 hr. Both
values of K, are consistent with the data presented by Heffter, and the lower value 3 2 compares with the value 6X10 m /sec used by Knox in the prediction of close-in
fallout.
ESTIMATED MAXIMUM WET DEPOSITION
There are two processes of wet deposition: washout and rainout. Washout refers
to the process where the raindrops fall through the debris cloud and remove the
particles from the cloud by impaction. In rainout, the radioactive particles actually
enter the cloud during the rain-formation process and act as condensation nuclei for
the raindrops.
The magnitude of a washout depends upon the fraction of the activity below the
rain-producing layer, the horizontal dimensions of the radioactive cloud when the rain
begins, and the rainfall rate. Maximum washout occurs when all of the activity is
below a rain-producing layer with a high rainfall rate. If the above values of K^ are
used and the nominal radius of the cloud is assumed to be two standard deviations, the
horizontal area of the cloud (A, ) is given by
A, = 3.6 X 10⁸ at 1 hr h
and by
Ah = 3.6 X 10⁹t at>24 hr,
where A, is expressed in meters squared and t is expressed in hours. In the absence
of velocity or directional wind shear, A, is the area of the cloud projected onto the
earth's surface. Hence, the maximum fractional washout is given by l/A, providing
that all of the cloud is below the rain-producing layer during a period of high rainfall
rate.

The situation is somewhat different with respect to rainout, especially for
thunderstorms. In a thunderstorm, a developing cumulus cell is characterized by
updrafts that draw the air in from below. It is by this process that the radioactive
particles are carried into the rain-producing region. The entire life of such a cell is
of the order of an hour; its mature stage, during which precipitation occurs, may last for 15 or 20 min. A large, persistent storm may develop successive cells in turn. Thus,
a storm can contain a number of cells in different stages of development.
These individual cells have horizontal dimensions ranging from 1 to 5 miles.
However, as they are in the process of developing, they may engulf air and, hence,
radioactive debris from a larger area. In other words, a thunderstorm can reconcen-
trate the debris before it is rained out and thus lead to higher localized fallout levels
than the washout process. At the same time, the wet deposition by both processes
should be related to the horizontal area of the cloud.
Thus, in the case of rainout the average deposition is still given by l/Ah; however,
within the overall rainout area, localized areas may receive depositions that are higher
than this. This will be discussed again, subsequently.
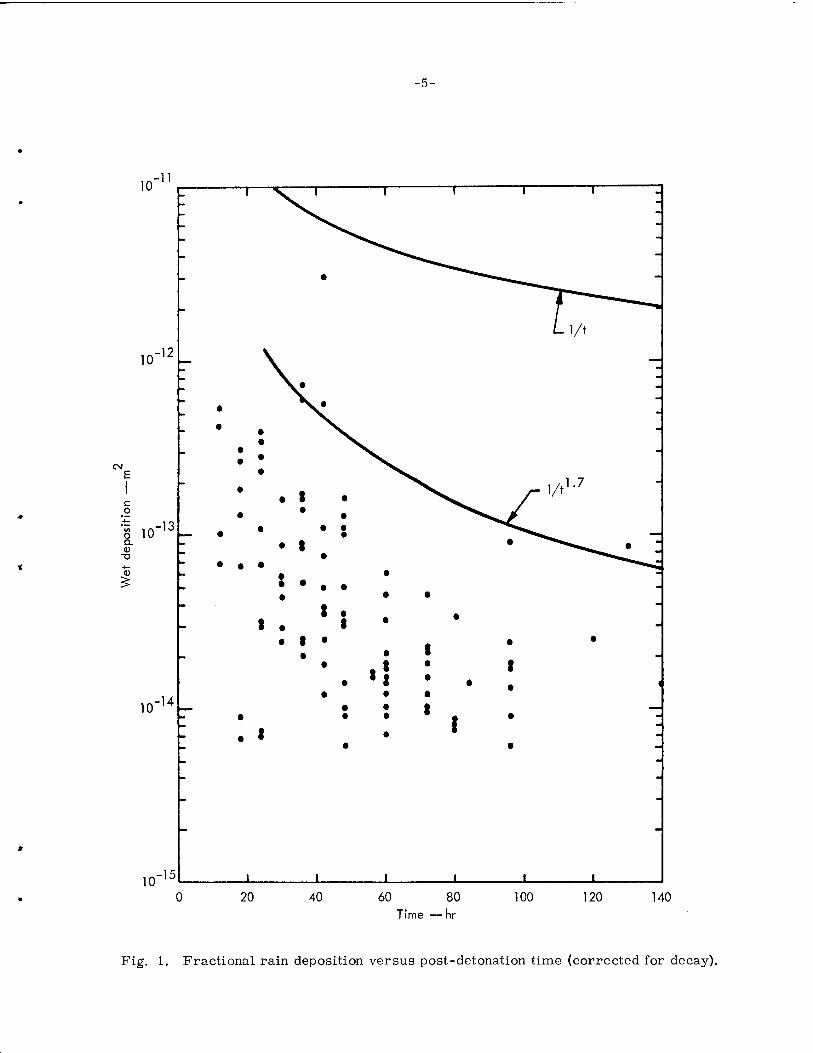
Figure 1 presents the rain-deposition data collected by the gummed-film network
following previous tower shots at the Nevada Test Site. These data are plotted as
fractional rain deposition versus post-detonation time and are corrected for decay.''
(To apply the data to a particular radionuclide, they must be corrected for its decay.)
The curve of l/A, versus t is shown (labeled l/t); it can be seen that essentially all of
the measured values are a factor of 10 or more lower than the predicted value except for
the single point at 42 hr. This point represents a rainout that occurred in Fargo, North
Dakota, following the Diablo Event of the Plumbbob series. The calculated postshot
wind trajectories suggest that there was probably little wind shear in the main body of
the Diablo cloud and that the rainfall was intense. At the same time, the wind-trajectory
data indicate that there was considerable wind shear associated with the next highest
points recorded at 36 and 42 hr. The remainder of the points are associated with shear
and/or lower rainfall rates.
In keeping with the above approach, the effect of wind shear is to increase the
projected area of the cloud on the earth's surface. In the simplest case, it changes
the shape of the area from a circle to a rectangle with rounded ends. The width of the
rectangle is determined by horizontal eddy diffusion and the length by the wind-velocity 9 n
shear. This suggests that, to account for shear, Ah should be given by Ah = 3.6 X 10 t ,
where n is some value greater than unity. Also shown in Fig. 1 is the curve of the
above relationship with n = 1.7. As can be seen, this curve intersects the next highest
group of points.
*The basic data and the details of the calculations leading to the points in Fig. 1 are given in the Appendix.
-5-
10 -11
10
c o
8 10 a.
<D
10
-
1 i 1 i i i -
• -
Li/t -12
• • •
• • • •
•
-
•
• • t
• • •
■ i/t1-7
-13 •
»
•
• •
• •
t •
• •
•
• • 2
• • • m • • < i
t • 0 " t •
• 1 • t •
• • ■■
• •
•
•
• ! : ' • t • i
-14 •
• • • • • 1 I • -
H>
• t • :
- • •
-
-15
-
1 1 i i • '
-
10 '" —
20 40 60 80 Time —hr
100 120 140
Fig. 1. Fractional rain deposition versus post-detonation time (corrected for decay).

-6-
Since we are concerned here with predicting the maximum credible rainout
rather than the most probable rainout, inspection of Fig. 1 indicates that we must make
a choice between the l/t curve, the l/t1-7 curve, or some combination of the two. It
appears reasonable to assume that the longer the travel time, the greater the probability
that the cloud is influenced by significant wind shear. In fact, these data would suggest
that even for travel times of 24 to 48 hr, significant shear effect is the rule with the
exception of the Fargo rainout. Yet, the Fargo case must be considered as representative
of a credible situation, and from the standpoint of public health and safety, the l/t
relationship should be used to predict the maximum credible wet deposition, at least
over the first 50 hr of travel time. Since a cloud can travel 1000 or more miles away
from the site of detonation in 50 hr, pastures which supply milk to large off-site
populations could be affected by heavy rainout within this time period. In other words,
the maximum credible wet deposition must be shown to be acceptable at earlier travel
times «50 hr), and as the Fargo case indicates, this requires use of the l/t relationship.
One other consideration which suggests that the l/t relationship should be used is the
localized hot spots that may develop within a rainout area. Indeed, it is unlikely that
the gummed-film samplers at Fargo recorded the highest-intensity rainout in that
occurrence. The same consideration would apply to any of the other samplers.
If the fractional wet-deposition levels read from the l/t curve are called R, then
the estimated maximum wet deposition (R.) of any radionuclide (i) is given by the
equation
-X.t R. = P.T.Re x ,
l li
where P. is the curies of radionuclide produced, T. is the total fraction of radionuclide
released'to the atmosphere, and X. is the radiological decay rate of the isotope.
ESTIMATED MAXIMUM DRY FALLOUT
A considerable amount of effort has been applied to the construction and testing of
fallout models capable of predicting the close-in dry fallout from nuclear explosive
devices. The models have been quite successful in predicting this close-in dry fallout.
However, they are only applicable to the fallout of larger particles (>20 ß in diam).
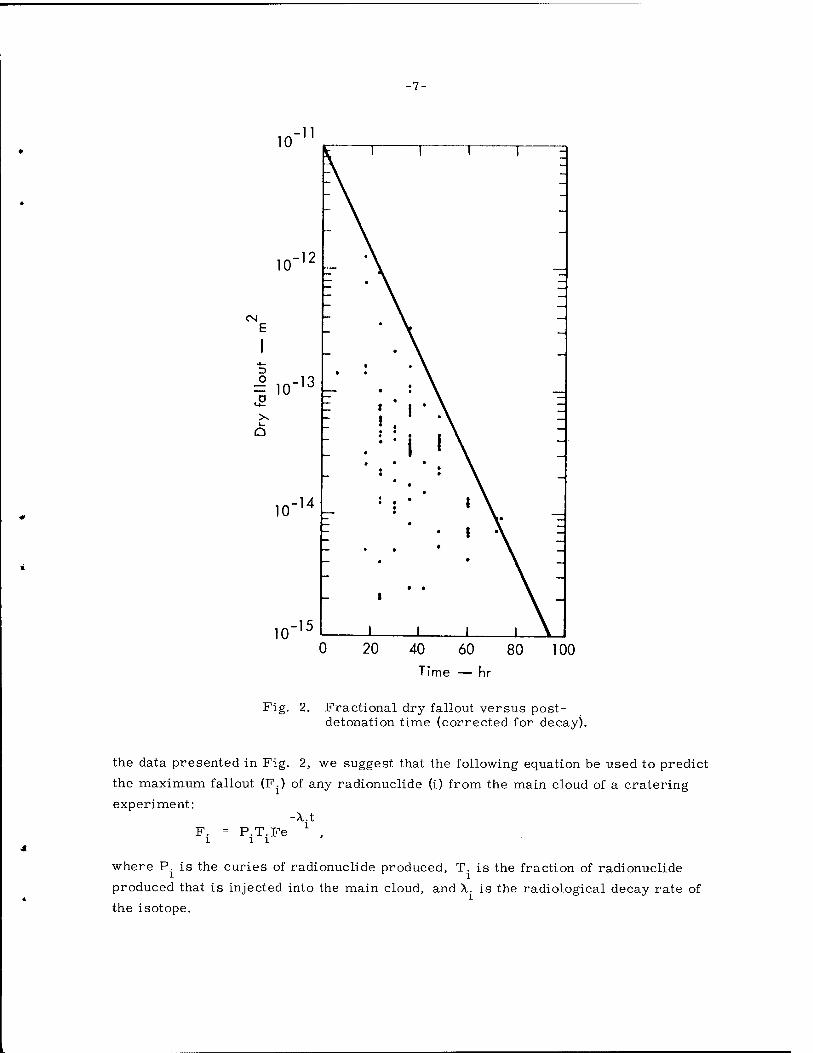
In Fig. 2, the observed fractional dry fallout levels (F) from previous tower
detonations at the Nevada Test Site are plotted as a function of time. Also, a line is
drawn in the figure that includes all of the highest observed fractional dry fallout.
This line is given by the equation F = 10"U e"°-01t. Thus in accord with
-7-
10 ■11
io-12u
CN
O _1T = 10 IJ
X O
io-,4t-
•15
-
1
• \
• \
1 i I
-
•
•
• • • t !
• •
! * *
—
-
• •
• •
• i • •
1 •
—
— • • - « •
• • I \
- •
•
• • • -
- i
1
• •
i i I
\ -
0 20 40 60 Time — hr
80 100
Fig. 2. Fractional dry fallout versus post- detonation time (corrected for decay).
the data presented in Fig. 2, we suggest that the following equation be used to predict
the maximum fallout (F.) of any radionuclide (i) from the main cloud of a cratering experiment:
P.T.Fe l l
-X.t l
where P. is the curies of radionuclide produced, T. is the fraction of radionuclide i r l
produced that is injected into the main cloud, and X. is the radiological decay rate of the isotope.
FRACTION RELEASED TO THE ATMOSPHERE
The predictive relationships presented in the previous section apply to the activity
that is released to the atmosphere at the site of detonation. All of the activity produced
is released to the atmosphere when a device is detonated on a tower, but only a fraction
of the activity is released when the device is detonated underground. In the extreme
case, when the device is buried at an appropriate depth, all of the activity remains
underground. In cratering experiments where the expanding cavity ruptures the surface
to form the crater, the material above the device acts like a filter bed and removes a
large portion of the radioactive material that would otherwise be released to the atmos-
phere. The efficiency with which a radionuclide is removed depends upon its chemical
and physical properties or those of its precursors during the venting process. There-
fore, fission products such as Cs137 and Sr89, which are present as their rare-gas precursor during the venting process, are found in much higher relative concentrations
in the cloud than a refractory radionuclide such as Zr95 or Nd 4 . Therefore, to the
extent possible, the fraction released to the atmosphere should be determined for each
specific radionuclide of interest.
As with tower shots, the fallout models that have been applied to cratering shots
are concerned only with the close-in fallout of the larger particles. The activity versus
particle-size distributions that are used have been adjusted to fit the fallout fields
observed subsequent to the test. In the case of tower shots, this distribution accounts
for only one-third of the total airborne activity. The other two-thirds is associated
with the neglected fraction contained in smaller particles. Following the Sedan experi-
ment, the close-in fallout pattern corresponded to the predicted pattern when the frac-
tion of the activity released to the atmosphere was assumed to be 10%; following Danny
Boy, this correspondence occurred at an assumed release of 5%. If we assume a
correspondence to tower shots, this would suggest that 20% and 10% were released on
smaller particles, leading to a total release of 30% and 15%. However, the assumption
of correspondence between tower and cratering shots does not appear to be justified,
particularly for Danny Boy. A smaller fraction would appear to be released on the
small particles when one examines the data for individual isotopes. 89
Table I presents the relative fraction (relative to Sr ) of a number of radionu-
clides present in close-in fallout samples and in a late-time (138 min) cloud sample
following the Danny Boy test.

-9-
Table I. Relative fraction of nuclides present following the Danny Boy test.
89 Fraction relative to Sr
Fallout Cloud Radionuclide
Sr
Sr
89
90
If this debris were unfractionated,
all of the relative fractions would be
equal to unity. This is substantially the
case for the larger particles that com-
prise the close-in fallout, except for the
refractory radionuclides of zirconium
and europium. However, the cloud
sample is highly fractionated. Since
this is a late-time cloud sample, it
should reflect the activity on the smaller
particles. If we assume that all of the on
Sr produced is present on the smaller
particles, the cloud data suggest that, A . „ 90 „ 137 , „ 140
except for Sr , Cs , and Ba ,
which have rare-gas precursors, only
1% or less of the other radionuclides
appeared on the smaller particles. 137 89
Actually, Miskel estimates that only some 13% of the Cs or Sr was present in the
cloud, and this suggests that the others were present at only 0.1%.
At this time we have no comparable data on the Sedan cloud. However, ground-
level air and fallout samples were collected in the Midwest one and two days subsequent
to the Sedan test. The results of these analyses are shown in Table II.
Zr
Ag
Cd
Cs
Cs
Ba
Ce
Eu
95
111
115
136
137
140
141
156
1.0
1.2
0.2
0.6
1.1
0.8
0.6
0.2
1.0
0.6
0.003
0.008
0.01
0.008
1.0
0.2
0.005
0.002
Table II. Relative fractions of nuclides present following the Sedan test.
' The data show that the air samples
were quite comparable to the fallout
samples, in sharp contrast to the Danny
Boy data. In this case, if we assume that
all of the Sr were released, these data
would suggest that some 20% of the activ-
ity was released on smaller particles.
There are reasons to believe that
the released fractions from the Sedan test
were different from the Danny Boy test.
One reason is the difference in yield:
100 kt for Sedan and 0.42 kt for Danny Boy.
The other is that Sedan was conducted in
a water-saturated medium, whereas
Danny Boy was conducted in a dry medium.
Both of these reasons probably contributed
to the factor-of-2 difference found in the fraction of the activity observed on larger
particles: 10% for Sedan and 5% for Danny Boy. Furthermore, the presence of water
„ 89 Fraction relative to Sr
Radionuclide Fallout Cloud
Sr89 1.0 1.0
Sr90 0.7 0.4 Y91 0.12 0.07 „ 103 Ru 0.08 0.05
Ru106 0.25 0.12
Cs137 1.9 1.45
Ba140 0.2 0.15
Ce141 0.12 -
Ce144 0.16 -

-10-
in the expanding cavity could change the nature of the chemical species present at the
time of cavity rupture and venting. Relatively non-volatile oxides could be replaced
by volatile hydroxides during the venting process.
Until more data become available with respect to the fraction of the activity
released to the atmosphere on small particles as a function of yield and medium, it is
necessary to use worst-case assumptions. Therefore, until these additional data are
available, we shall assume that an amount of radioactivity equal to that observed on
larger particles is released to the atmosphere on smaller particles. We shall also
assume that as the yield increases in the dry medium, the vented fraction will also
increase. The values shown in Table III are thus assumed.
Table III. Assumed values of the fraction of the activity released to the atmosphere.
Isotope T.c
l
Sr 89
Sr90, Y
Cs 91
137
Ba 140
All others
1.0
0.5
0.2
1.0
0.5
0.1
Total activity released.
Activity on small particles.
The available data suggest that
these values may overestimate the
fraction on smaller particles by a
factor of 10. We offer no other justi-
fication for these values at this time,
except that they represent conservative
estimates. The reader should antici-
pate that as more data become avail-
able, these estimates may be revised.
ESTIMATED MAXIMUM CONTAMINATION
If the estimates of the vented fractions are combined with the fractional dry-fallout
and wet-deposition relationships, the following relationships are obtained:
-Xt R. = P. R. e
l li
and
i -v F. = P. F. e
l li
where R! = T.R l l
and
F. = T F. l i
These primed values are shown in Table IV for the group with Sj = 0.1 and T - 0. 2;
that is, the group with no rare-gas precursors.
cursors. Time _t __i
(hr) R. l
F. l
1 6 X 10"10 2 X 10"12
6 4X 10"11 1 X 10"12
12 9 X 10"12 -13 6 X 10 l
24 2 X 10"12 2 X 10"13
48 1 X 10"12 2 X 10"14
-11-
Table IV. Values of R[ and F? for the For most radionuclides of interest, group with no rare-gas pre- ,, ,
the decay correction can be ignored and
these primed values can be multiplied
by the curies produced (P.) to obtain the
estimated maximum dry fallout or wet deposition.
In 12 hr a debris cloud could
travel 100 to 200 miles and, hence, be
beyond what might be considered a close-
in controlled area. At 12 hr the cloud diameter (assuming it is 4CT) would be 100 miles. Thus, these values suggest that if
wet deposition occurred at 12 hr, a large area (about 8000 miles2) could receive the
following estimated maximum fractional contamination (EMC):
EMC (12 hr) = 5 X 10"11 (Sr89, Cs137),
EMC (12 hr) = 2.5 X 10"11 (Sr90, Y91, Ba )j and
EMC (12 hr) = 10"11 (all others).
These EMC values are used for illustrative purposes in Part II of this report.
As the R. values indicate, maximum contamination levels higher than these can occur
by wet deposition at times earlier than 12 hr. Obviously, in any actual case the more
appropriate higher values should be applied for cloud travel times of less than 12 hr.
The data plotted in Fig. 1 indicate that a wet deposition comparable to the levels
representative of the EMC values above occurred only once subsequent to some 100
tests conducted at the Nevada Test Site, and that the next most likely situation resulted
in contamination levels that were a factor of 10 lower. It therefore appears reasonable
that these EMC values should be reduced by a factor of 10 when considering the com-
posite of a series of events, such as those proposed for the construction of a sea-level
canal. The basis for this is that it is unlikely that several events would each lead to
the maximum contamination of the same area. Thus, we propose to use the above values
for any single event and to use values of a factor of 10 lower for the composite of a series of events.
In Part II of this report, "Estimation of the Maximum Dose from Internal Emit-
ters," the above EMC values are used together with isotope-production estimates and
biological-uptake factors to arrive at burden and dosage estimates for man. The dis-
cussion section of Part II also gives suggested guidelines for applying this overall predictive approach to specific events.
■12-
REFERENCES
1. Heffter, J. L. The variation of horizontal diffusion parameters with time for travel
periods of one hour or longer. J. Appl. Meteorol. 4: 153-156, 1965.
2. Pasquill, F. Atmospheric Diffusion, London, D. Van Nostrand Company Ltd. ,
1962, et passim. 3. Knox, J. B. The prediction of wind and fallout. University of California
Lawrence Radiation Laboratory (Livermore), UCID-4662, 1962 (presented at the
DASA-NRDL Fallout Symposium, Nov. 1962).
4. Rapp, R. R. A re-examination of fallout models. The RAND Corporation,
RM-4910-TAB, 1966. 5. Knox, J. B. Prediction of fallout from subsurface nuclear detonations. University
of California Lawrence Radiation Laboratory (Livermore), UCRL-12125, 1964 or
Radioactive Fallout from Nuclear Weapons Tests, Proceedings of the Second
Conference, Germantown, Maryland, held November 3-6, 1964, A. W. Klement, ed.
U. S. Atomic Energy Commission, CONF-765, 1965, pp. 331-353.
6. Miskel, J. A. and N. A. Bonner. Project Danny Boy. Distribution of the radio-
activity from a nuclear cratering experiment. Final report. University of California
Lawrence Radiation Laboratory (Livermore), Department of Defense, and U. S.
Atomic Energy Commission, WT-1817, 1964 or Science 150: 489-493, 1965.
7. Krey, P. W. and R. E. Fried. Long-range fallout from Sedan and Small Boy shots.
In Radioactive Fallout from Nuclear Weapons Tests, Proceedings of the Second
Conference, op. cit. , pp. 82-97.
•13-
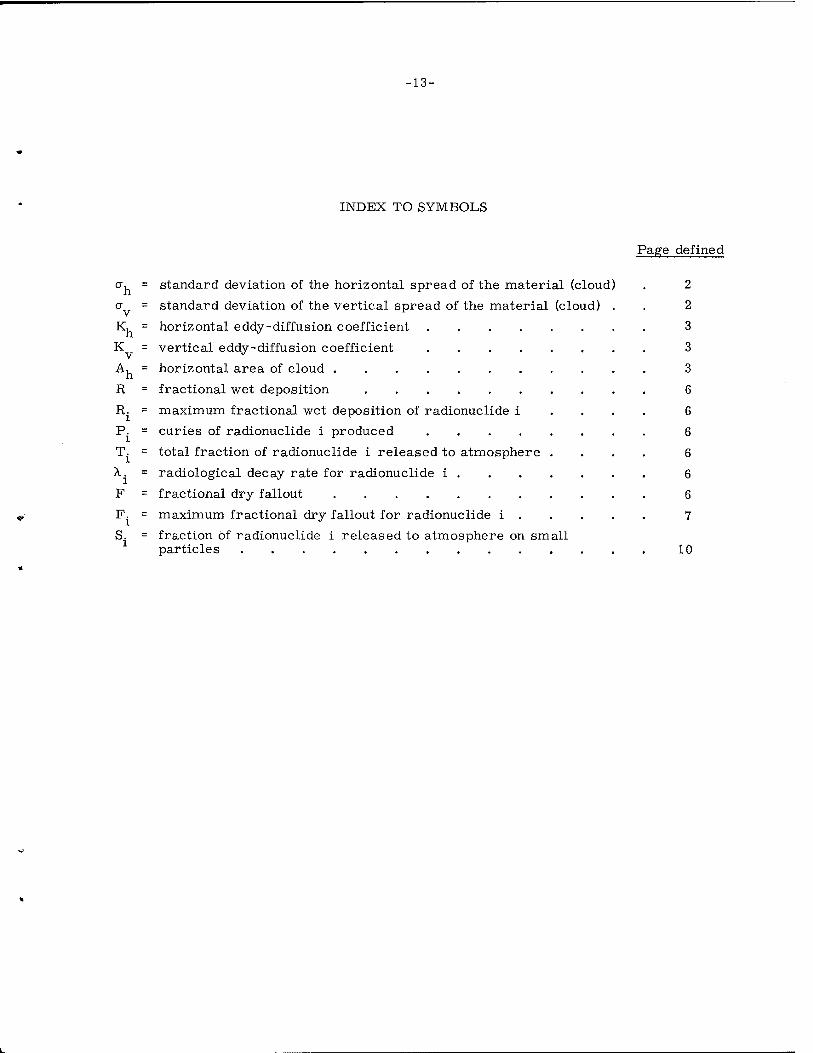
INDEX TO SYMBOLS
Page defined
ov = standard deviation of the horizontal spread of the material (cloud) . 2
CJ = standard deviation of the vertical spread of the material (cloud) . . 2
K, = horizontal eddy-diffusion coefficient 3
K = vertical eddy-diffusion coefficient 3
A, = horizontal area of cloud 3
R = fractional wet deposition 6
R. = maximum fractional wet deposition of radionuclide i 6
P. = curies of radionuclide i produced 6
T. = total fraction of radionuclide i released to atmosphere .... 6
X. = radiological decay rate for radionuclide i 6
F = fractional dry fallout 6
F. = maximum fractional dry fallout for radionuclide i 7
S. = fraction of radionuclide i released to atmosphere on small 1 particles 10
■14-
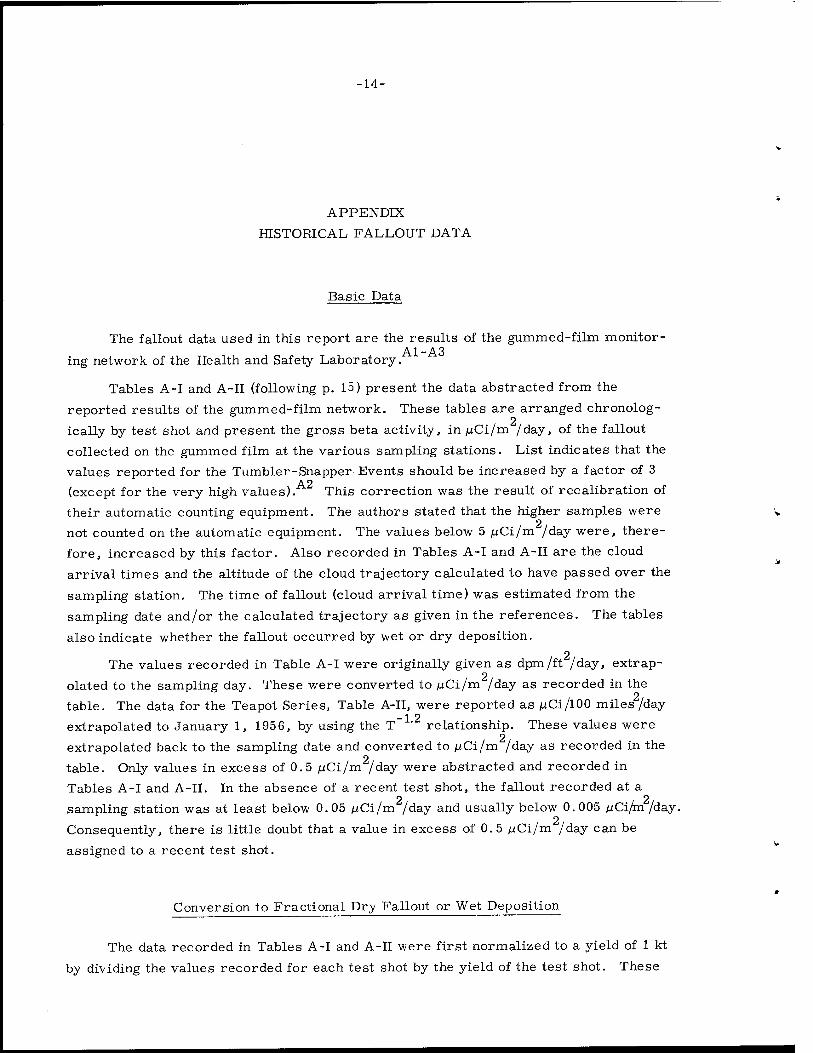
APPENDIX
HISTORICAL FALLOUT DATA
Basic Data
The fallout data used in this report are the results of the gummed-film monitor- Al -A3 ing network of the Health and Safety Laboratory.
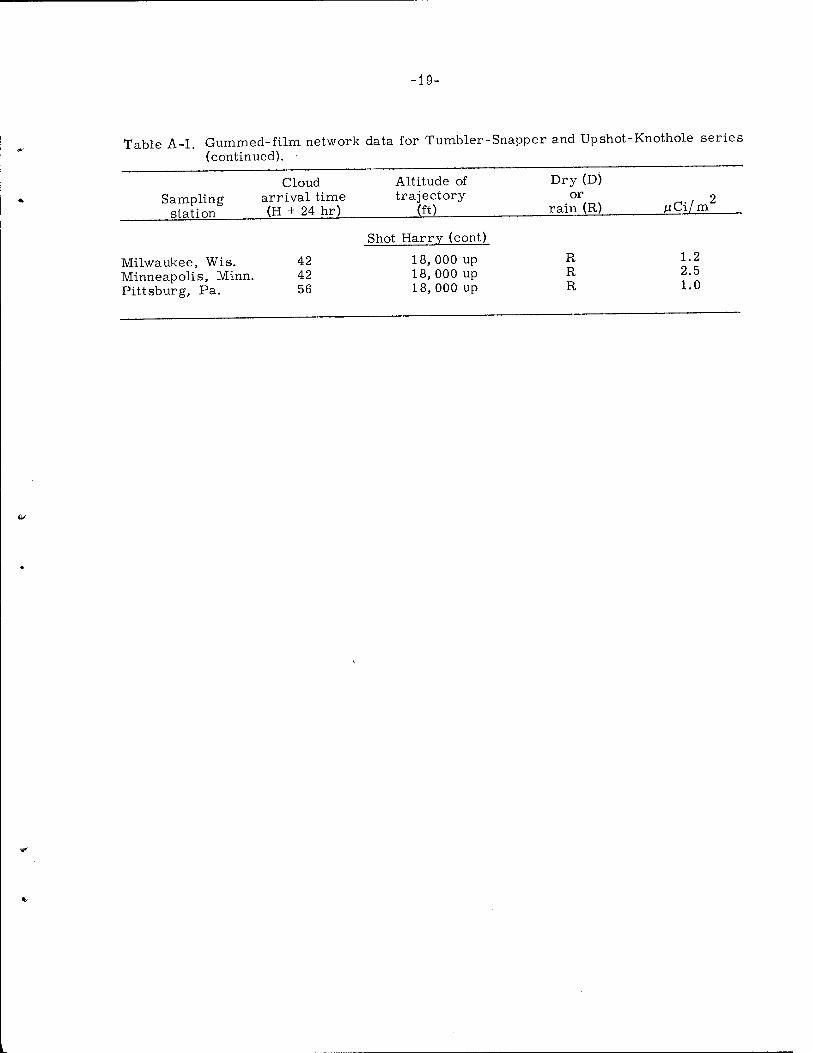
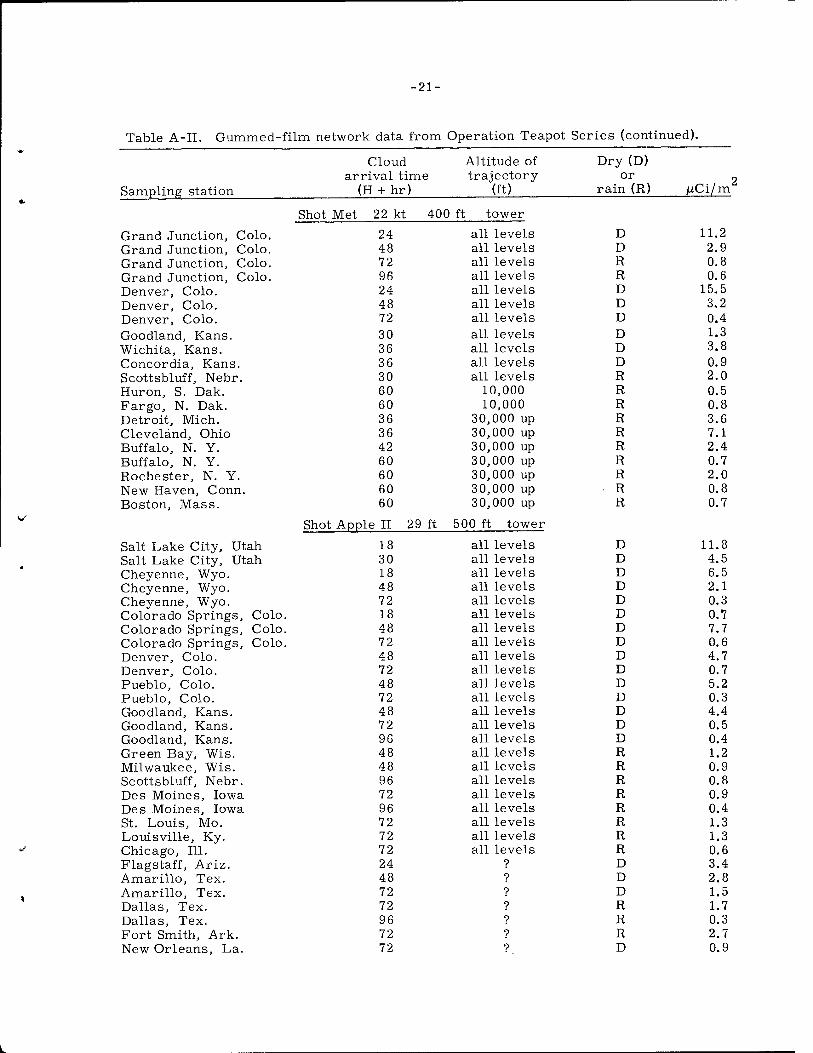
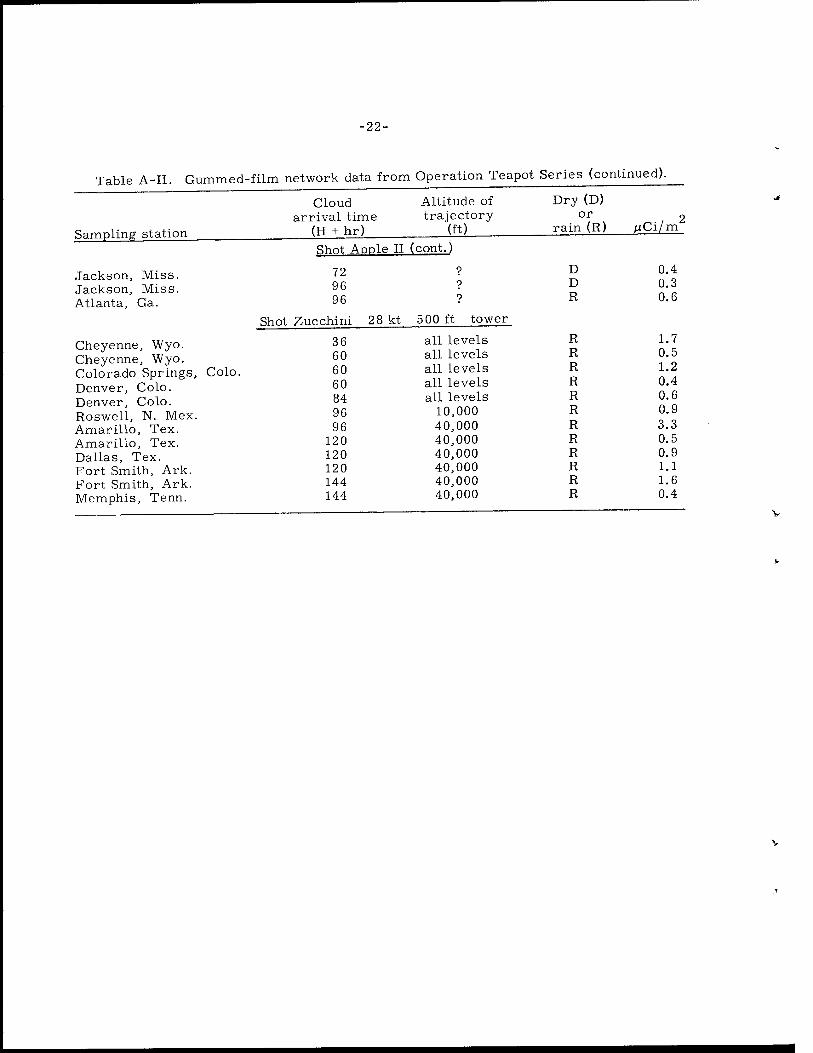
Tables A-I and A-II (following p. 15) present the data abstracted from the
reported results of the gummed-film network. These tables are arranged chronolog-
ically by test shot and present the gross beta activity, in AtCi/m /day, of the fallout
collected on the gummed film at the various sampling stations. List indicates that the
values reported for the Tumbler-Snapper Events should be increased by a factor of 3 A2 (except for the very high values). This correction was the result of recalibration of
their automatic counting equipment. The authors stated that the higher samples were o
not counted on the automatic equipment. The values below 5 /uCi/m /day were, there-
fore, increased by this factor. Also recorded in Tables A-I and A-II are the cloud
arrival times and the altitude of the cloud trajectory calculated to have passed over the
sampling station. The time of fallout (cloud arrival time) was estimated from the
sampling date and/or the calculated trajectory as given in the references. The tables
also indicate whether the fallout occurred by wet or dry deposition. 2
The values recorded in Table A-I were originally given as dpm/ft /day, extrap- 2
olated to the sampling day. These were converted to luCi/m /day as recorded in the o
table. The data for the Teapot Series, Table A-II, were reported as /uCi/100 miles/day -12 extrapolated to January 1, 1956, by using the T ' relationship. These values were
2 extrapolated back to the sampling date and converted to /uCi/m /day as recorded in the
2 table. Only values in excess of 0.5 /uCi/m /day were abstracted and recorded in Tables A-I and A-II. In the absence of a recent test shot, the fallout recorded at a
2 2 sampling station was at least below 0.05 juCi/m /day and usually below 0.005 /^Ci/m /day.
o Consequently, there is little doubt that a value in excess of 0.5 ,uCi/m /day can be
assigned to a recent test shot.
C onver si on to Fractional Dry Fallout or Wet Deposition
The data recorded in Tables A-I and A-II were first normalized to a yield of 1 kt
by dividing the values recorded for each test shot by the yield of the test shot. These

■15-
normalized values were then divided by the total beta activity per kiloton of fission
corrected for decay to the sampling date. In this analysis it was assumed, for ease
of calculation, that at H + 24 hr the total beta activity per kiloton was 1013 /jCi. (This is some 20% less than the theoretical value.)
Correction for Gummed-Film Efficiency
Comparison of gummed-film results with those of pot collectors has shown that
the pot values are, on the average, a factor of 1.6 higher; this correction is applied
to the gummed-film data when making Sr estimates.A4 Since the dry deposition
velocity has been determined to be identical between the two types of samplers ,A5"A7
this factor is due to their different efficiencies in the collection of fallout occurring in
rain and should be applied only to fallout in rain. This factor undoubtedly results from
the activity being washed off the gummed-film during rain, whereas the pots are
absolute collectors. This correction factor has been applied to the data in Tables A-I and A-II only for the fallout that occurred in rain.
Fargo, North Dakota
The highest fractional rainout value recorded in Fig. 1 at 42 hr was derived from
an estimate of the Sr deposition.A8 A deposition of 22 mCi/mi2 of Sr90 was estimated
from gummed-film data to have occurred at Fargo following the Diablo Event of the
Plumbbob series. The shot yield was 17 kt and there were approximately 1.8 X 10⁸ ;uCi
of Sr produced per kiloton of U 5 fission. (The Sr90 estimate was originally made
by assuming U fission.) These figures lead to the fractional wet deposition value of -12 -2
3 X 10 m as recorded in Fig. 1.
■16-
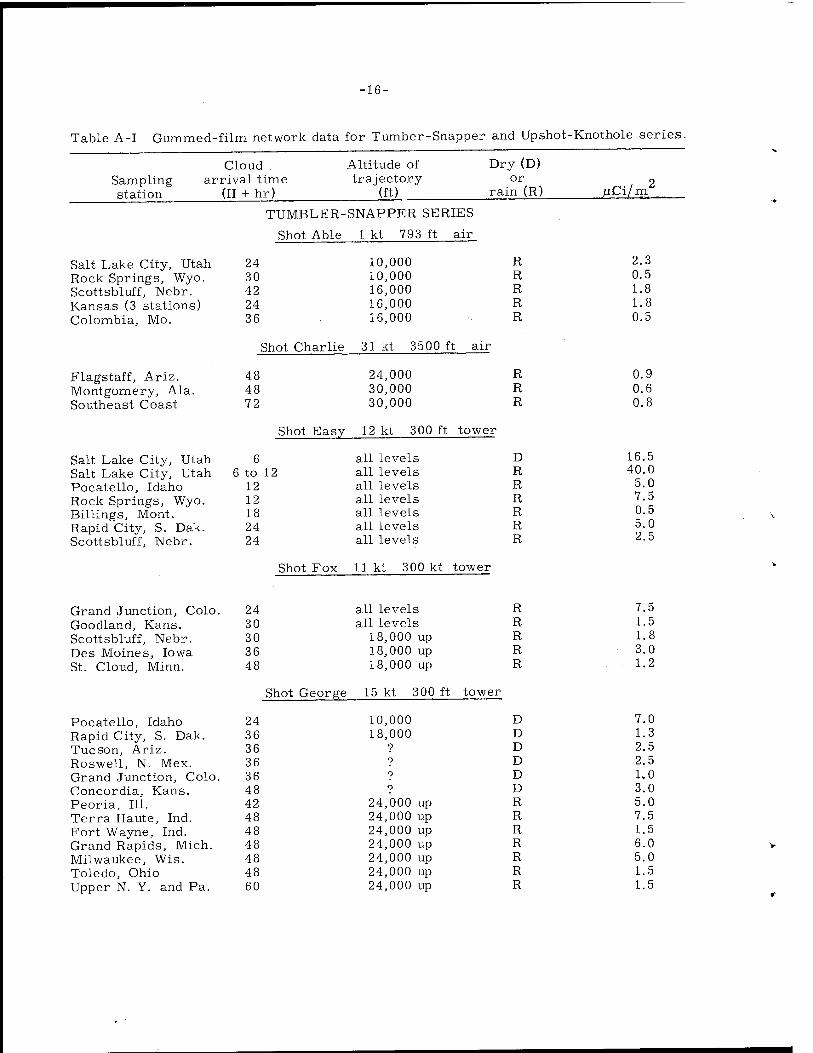
Table A-I Gummed-film network data for Tumber-Snapper and Upshot-Knothole series.
Sampling station
Cloud arrival time
(H + hr)
Altitude of trajectory
(ft)
Dry (D) or
rain (R)
Salt Lake City, Utah Rock Springs, Wyo. Scottsbluff, Nebr. Kansas (3 stations) Colombia, Mo.
Flagstaff, Ariz. Montgomery, Ala. Southeast Coast
Salt Lake City, Utah Salt Lake City, Utah Pocatello, Idaho Rock Springs, Wyo. Billings, Mont. Rapid City, S. Dak. Scottsbluff, Nebr.
Grand Junction, Colo. Goodland, Kans. Scottsbluff, Nebr. Des Moines, Iowa St. Cloud, Minn.
Pocatello, Idaho Rapid City, S. Dak. Tucson, Ariz. Roswell, N. Mex. Grand Junction, Colo. Concordia, Kans. Peoria, 111. Terra Haute, Ind. Fort Wayne, Ind. Grand Rapids, Mich. Milwaukee, Wis. Toledo, Ohio Upper N. Y. and Pa.
TUMBLER-SNAPPER SERIES
Shot Able 1 kt 793 ft air
24 10,000 R 30 10,000 R 42 16,000 R 24 16,000 R 36 16,000 R
Shot Charlie 31 kt 3500 ft air
48 24,000 R 48 30,000 R 72 30,000 R
Shot Easy 12 kt 300 ft tower
6 all levels D to 12 all levels R 12 all levels R 12 all levels R 18 all levels R 24 all levels R 24 all levels R
Shot Fox 11 kt 300 kt tower
24 all levels R 30 all levels R 30 18,000 up R 36 18,000 up R 48 18,000 up R
Shot George 15 kt 300 ft tower
24 36 36 36 36 48 42 48 48 48 48 48 60
10,000 18,000
? ? ? ?
24,000 up 24,000 up 24,000 up 24,000 up 24,000 up 24,000 up 24,000 up
D D D D D D R R R R R R R
ßCil m
2.3 0.5 1.8 1.8 0.5
0.9 0.6 0.8
16.5 40.0
5.0 7.5 0.5 5.0 2.5
7.5 1.5 1.8 3.0 1.2
7.0 1.3 2.5 2.5 1,0 3.0 5.0 7.5 1.5 6.0 5.0 1.5 1.5
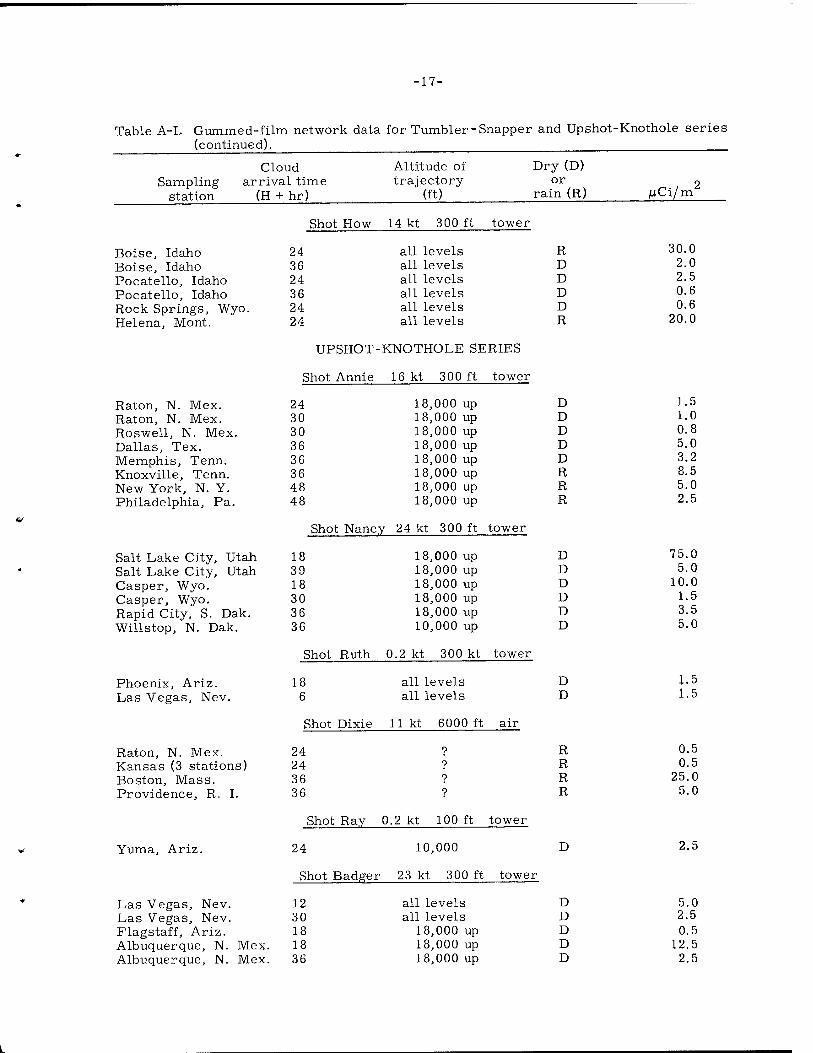
■17-
Table A-L Gummed-fil (continued).
.m network data . for Tumbler-£ snapper and Upshot- Knothole series
Sampling a: station
Cl rrh (H
.oud /al time + hr)
Altitude of trajectory
(ft)
Dry (D) or
rain (R) (uCi/m
Boise, Idaho Boise, Idaho Pocatello, Idaho Pocatello, Idaho Rock Springs, Wyo. Helena, Mont.
Shot How
24 36 24 36 24 24
14 kt 300 ft
all levels all levels all levels all levels all levels all levels
tower
R D D D D R
30.0 2.0 2.5 0.6 0.6
20.0
Raton, N. Mex. Raton, N. Mex. Roswell, N. Mex. Dallas, Tex. Memphis, Tenn. Knoxville, Tenn. New York, N. Y. Philadelphia, Pa.
Salt Lake City, Utah Salt Lake City, Utah Casper, Wyo. Casper, Wyo. Rapid City, S. Dak. Willstop, N. Dak.
Phoenix, Ariz. Las Vegas, Nev.
UPSHOT-KNOTHOLE SERIES
Shot Annie 16 kt 300 ft tower
24 18,000 up 30 18,000 up 30 18,000 up 36 18,000 up 36 18,000 up 36 18,000 up 48 18,000 up 48 18,000 up
Shot Nancy 24 kt 300 ft tower
18 18,000 up 39 18,000 up 18 18,000 up 30 18,000 up 36 18,000 up 36 10,000 up
Shot Ruth 0.2 kt 300 kt tower
18 all levels 6 all levels
Shot Dixie 11 kt 6000 ft air
D D D D D R R R
D D D D D D
D D
1.5 1.0 0.8 5.0 3.2 8.5 5.0 2.5
75.0 5.0
10.0 1.5 3.5 5.0
1.5 1.5
Raton, N. Mex. Kansas (3 stations) Boston, Mass. Providence, R. I.
24 24 36 36
R R R R
0.5 0.5
25.0 5.0
Yuma, Ariz.
Shot Ray 0.2 kt 100 ft tower
24 10,000 D
Shot Badger 23 kt 300 ft tower
2.5
Las Vegas, Nev. Las Vegas, Nev. Flagstaff, Ariz. Albuquerque, N. Mex. Albuquerque, N. Mex.
12 30 18 18 36
all levels D all levels D
18,000 up D 18,000 up D 18,000 up D
5.0 2.5 0.5
12.5 2.5
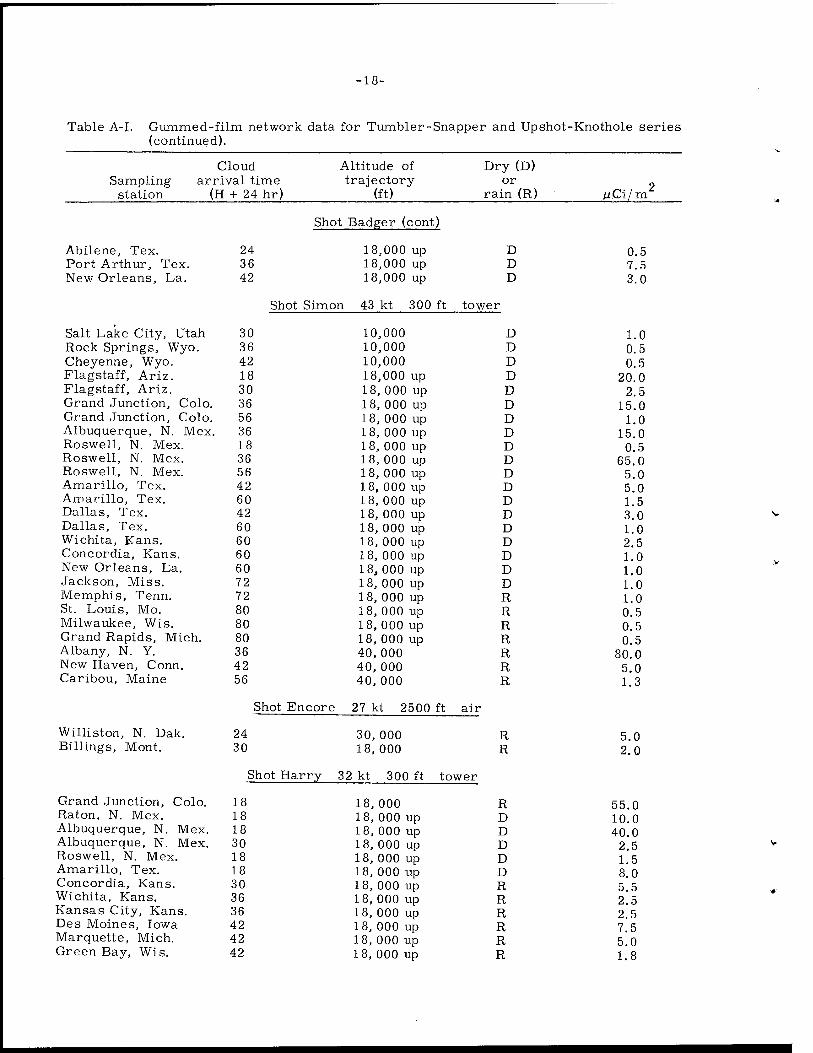
Table A-I. Gummed-film network data for Tumbler-Snapper and Up shot-Knothole series (continued).
Sampling station
Cloud arrival time
(H + 24 hr)
Altitude of trajectory
(ft)
Dry (D) or
rain (R) M.Ci/m^
Abilene, Tex. Port Arthur, Tex. New Orleans, La.
Salt Lake City, Utah Rock Springs, Wyo. Cheyenne, Wyo. Flagstaff, Ariz. Flagstaff, Ariz. Grand Junction, Colo. Grand Junction, Colo. Albuquerque, N. Mex. Roswell, N. Mex. Roswell, N. Mex. Roswell, N. Mex. Amarillo, Tex. Amarillo, Tex. Dallas, Tex. Dallas, Tex. Wichita, Kans. Concordia, Kans. New Orleans, La. Jackson, Miss. Memphis, Tenn. St. Louis, Mo. Milwaukee, Wis. Grand Rapids, Mich. Albany, N. Y. New Haven, Conn. Caribou, Maine
Williston, N. Dak. Billings, Mont.
Grand Junction, Colo. Raton, N. Mex. Albuquerque, N. Mex. Albuquerque, N. Mex. Roswell, N. Mex. Amarillo, Tex. Concordia, Kans. Wichita, Kans. Kansas City, Kans. Des Moines, Iowa Marquette, Mich. Green Bay, Wis.
Shot Badger (cont)
24 18,000 up D 36 18,000 up D 42 18,000 up D
Shot Simon 43 kt 300 ft tower
30 10,000 D 36 10,000 D 42 10,000 D 18 18,000 up D 30 18,000 up D 36 18,000 up D 56 18, 000 up D 36 18, 000 up D 18 18, 000 up D 36 18, 000 up D 56 18, 000 up D 42 18, 000 up D 60 18, 000 up D 42 1 8, 000 up D 60 18, 000 up D 60 18, 000 up D 60 18, 000 up D 60 18,000 up D 72 18, 000 up D 72 18, 000 up R 80 18, 000 up R 80 18,000 up R 80 18, 000 up R 36 40, 000 R 42 40, 000 R 56 40, 000 R
Shot Encore 27 kt 2500 ft air
24 30, 000 R 30 18, 000 R
Shot Harry 32 kt 300 ft tower
18 18 18 30 18 18 30 36 36 42 42 42
18,000 18, 000 up 18, 000 up 18, 000 up 18, 000 up 18, 000 up 18, 000 up 18, 000 up 18, 000 up 18, 000 up 18, 000 up 18, 000 up
R D D D D D R R R R R R
0.5 7.5 3.0
1.0 0.5 0.5
20.0 2.5
15.0 1.0
15.0 0.5
65.0 5.0 5.0 1.5 3.0 1.0 2.5 1.0 1.0 1.0 1.0 0.5 0.5 0.5
80.0 5.0 1.3
55.0 10.0 40.0 2.5 1.5 8.0 5.5 2.5 2.5 7.5 5.0 1.8
•19-
Table A-I. Gummed-film network data for Tumbler-Snapper and Up shot-Knothole series (continued).
Cloud Altitude of Dry (D) Sampling arrival time trajectory or 2
station (H + 24 hr) (ft) rainjR) £*Ci^m_
Shot Harry (cont)
Milwaukee, Wis. 42 18,000 up R 1.2 Minneapolis, Minn. 42 18,000 up R 2.5 Pittsburg, Pa. 56 18,000 up R 1.0

-20-
Table A-II. Gummed-film network data from Operation Teapot Series.
Sampling station
Yuma, Ariz.
Denver, Colo.
Grand Junction, Colo. Denver, Colo. Goodland, Kans. Concordia, Kans. Scottsbluff, Nebr. Chicago, 111. Cleveland, Ohio Cleveland, Ohio New York, N. Y.
Flagstaff, Ariz. Roswell, N. Mex. Jackson, Miss. Ind. , 111. , Wis. , Mich.
Dallas, Tex.
Cloud arrival time
(H + hr)
Altitude of trajectory
(ft)
Shot Wasp 1 kt 762 ft air
24 ?
Shot Telsa 7 kt 300 ft tower
30 all levels
Shot Turk 43 kt 500 ft tower
Shot Bee 8 kt 300 ft tower
42 18,000
Shot Apple I 14 kt 500 ft tower and
Shot Wasp Prime 3 kt 700 ft air
Dry (D) or
rain (R)
Albuquerque, N. Mex. Albuquerque, N. Mex. Roswell, N. Mex. Roswell, N. Mex. Amarillo, Tex. Las Vegas, Nev. Grand Junction, Colo. Pocatello, Idaho
Salt Lake City, Utah Casper, Wyo. Grand Junction, Colo.
D
D
D
juCi/m*
9.4
2.9
30 18,000 up D 10.2 36 18,000 up D 23.6 48 18,000 up D 5.0 48 18,000 up D 1.5 48 18,000 up D 1.1 60 18,000 up D 0.6 60 18,000 up D 1.7 80 18,000 up R 0.4 60 18,000 up R 1.1
Shot. Hornet 4 kt 300 ft tower D 18 18,000 6.4
30 18,000 D 0.8 36 18,000 R 1.1 60 30,000 R 0.5
0.6
18 18,000 up D 1.2
30 18,000 up D 0.3
18 18,000 up D 1.4
30 18,000 up D 0.8
36 18,000 up D 2.3
30 9 D 3.2
30 18,000 up R 0.8
18 10,000 R 5.8
Shot Post 2 1 ■ct 300 ft tower
R 12 10,000 5.3 18 10,000 R 1.6 18 14,000 R 2.3
-21-
Table A-II. Gummed-film network data from Operation Teapot Series (continued).
Cloud Altitude of Dry (D) arrival time trajectory or
Sampling station (H + hr) (ft) rain (R) juCi/m
Shot Met 22 kt 400 ft tower
Grand Junction, Colo. 24 all levels D 11.2 Grand Junction, Colo. 48 all levels D 2.9 Grand Junction, Colo. 72 all levels R 0.8 Grand Junction, Colo. 96 all levels R 0.6 Denver, Colo. 24 all levels D 15.5 Denver, Colo. 48 all levels D 3.2 Denver, Colo. 72 all levels D 0.4 Goodland, Kans. 30 all levels D 1.3 Wichita, Kans. 36 all levels D 3.8 Concordia, Kans. 36 all levels D 0.9 Scottsbluff, Nebr. 30 all levels R 2.0 Huron, S. Dak. 60 10,000 R 0.5 Fargo, N. Dak. 60 10,000 R 0.8 Detroit, Mich. 36 30,000 up R 3.6 Cleveland, Ohio 36 30,000 up R 7.1 Buffalo, N. Y. 42 30,000 up R 2.4 Buffalo, N. Y. 60 30,000 up R 0.7 Rochester, N. Y. 60 30,000 up R 2.0 New Haven, Conn. 60 30,000 up R 0.8 Boston, Mass. 60
Shot Apple II 29 ft
30,000 up
500 ft tower
R 0.7
Salt Lake City, Utah 18 all levels D 11.8 Salt Lake City, Utah 30 all levels D 4.5 Cheyenne, Wyo. 18 all levels D 6.5 Cheyenne, Wyo. 48 all levels D 2.1 Cheyenne, Wyo. 72 all levels D 0.3 Colorado Springs, Colo. 18 all levels D 0.7 Colorado Springs, Colo. 48 all levels D 7.7 Colorado Springs, Colo. 72 all levels D 0.6 Denver, Colo. 48 all levels D 4.7 Denver, Colo. 72 all levels D 0.7 Pueblo, Colo. 48 all levels D 5.2 Pueblo, Colo. 72 all levels D 0.3 Goodland, Kans. 48 all levels D 4.4 Goodland, Kans. 72 all levels D 0.5 Goodland, Kans. 96 all levels D 0.4 Green Bay, Wis. 48 all levels R 1.2 Milwaukee, Wis. 48 all levels R 0.9 Scottsbluff, Nebr. 96 all levels R 0.8 Des Moines, Iowa 72 all levels R 0.9 Des Moines, Iowa 96 all levels R 0.4 St. Louis, Mo. 72 all levels R 1.3 Louisville, Ky. 72 all levels R 1.3 Chicago, 111. 72 all levels R 0.6 Flagstaff, Ariz. 24 ? D 3.4 Amarillo, Tex. 48 ? D 2.8 Amarillo, Tex. 72 ? D 1.5 Dallas, Tex. 72 ? R 1.7 Dallas, Tex. 96 ? R 0.3 Fort Smith, Ark. 72 ? R 2.7 New Orleans, La. 72 ? D 0.9
■22-
Table A-II. Gummed-film network data from Operation Teapot Series (continued).
Cloud Altitude of Dry (D) arrival time trajectory or 2
Sampling station (H + hr) (ft) rain (R) juCi/m
Shot Aoole II (cont.)
Jackson, Miss. 72 ? D 0.4
Jackson, Miss. 96 ? D 0.3
Atlanta, Ga. 96 ? R 0.6
Shot Zucchini 2 8 kt 500 ft tower R R
Cheyenne, Wyo. Cheyenne, Wyo.
36 60
all levels all levels
1.7 0.5 1.2 Colorado Springs, Colo. 60 all levels R
Denver, Colo. 60 all levels R 0.4
Denver, Colo. 84 all levels R 0.6
Roswell, N. Mex. 96 10,000 R 0.9
Amarillo, Tex. 96 40,000 R 3.3
Amarillo, Tex. 120 40,000 R 0.5
Dallas, Tex. 120 40,000 R 0.9 Fort Smith, Ark. 120 40,000 R 1.1 Fort Smith, Ark. 144 40,000 R 1.6 Memphis, Tenn. 144 40,000 R 0.4
V
-23-
References for Appendix
Al. List, R. J. The transport of atomic debris from Operation Upshot-Knothole.
U. S. Atomic Energy Commission, New York Operations Office, and U. S.
Weather Bureau, NYO-4602(DEL), 1954.
A2. List, R. J. Radioactive debris from Operations Tumbler and Snapper. Observa-
tions beyond 200 miles from test site. Part II. U. S. Atomic Energy Commission,
New York Operations Office, and U. S. Weather Bureau, NYO-4512(DEL), 1953.
A3. List, R. J. Radioactive fallout in North America from Operation Teapot. U. S.
Atomic Energy Commission, New York Operations Office, and U. S. Weather
Bureau, NYO-4696(DEL), 1956.
A4. Harley, J. H. , E. P. Hardy, Jr., I. B. Whitney, and M. Eisenbud. Summary of
analytical results from the HASL strontium program, July through December 1956.
U. S. Atomic Energy Commission, New York Operations Office, NYO-4862, 1957.
A5. Health and Safety Laboratory of the New York Operations Office, ed. Environ-
mental contamination from weapons tests. U. S. Atomic Energy Commission,
New York Operations Office, HASL-42, 1958.
A6. Ward, G. M. and J. E. Johnson. A study of cesium-137 passage from precipita-
tion to milk. Third annual report to the U. S. Atomic Energy Commission on the
project, Colorado State University, Fort Collins, 1965.
A7. Fisher, H. L. Deposition velocities of aerosols and vapors on pasture grass.
University of California Lawrence Radiation Laboratory (Livermore), UCRL-14702,
1966.
A8. Pfeiffer, E. W. Some aspects of radioactive fallout in North Dakota. In Fallout
from Nuclear Tests. Hearings before the Special Subcommittee on Radiation of
the Joint Committee on Atomic Energy, 86th Cong. , 1st Sess. , 1959. Washington,
D. C, U. S. Govt. Print. Off., 1959, v. 3, pp. 2153-2161.
■24-
DISTRIBUTION
LRL Internal Distribution
Michael M. May
Bio-Med Library
Dr. G. H. Higgins
Dr. H. A. Tewes
D. Warner
A. Tamplin
R. Batzel
W. Patterson, Berkeley
R. K. Wakerling, Berkeley
TID File
40
40
2
60
V
External Distribution
Dr. D. S. Barth Chief Bioenvironmental Research Program Southwestern Radiological Health Laboratory Las Vegas, Nev.
Dr. L. K. Bustad University of California School of Veterinary Medicine Davis, Calif.
Dr. K. E. Cowser Health Physics Division Oak Ridge National Laboratory P. O. Box X Oak Ridge, Tenn.
Dr. G. M. Dunning Deputy Director Division of Operation Safety U. S. Atomic Energy Commission Washington, D. C.
Dr. P. F. Gustafson Fallout Studies Branch Division of Biology and Medicine U S. Atomic Energy Commission Washington, D. C.

-25-
External Distribution (Continued)
Dr. H. L. Hollister, Chief Technical Analysis Branch Division of Biology and Medicine U. S. Atomic Energy Commission Washington, D. C.
Dr. S. A. Lough Assistant Director for Radiological Physics Division of Biology and Medicine U S. Atomic Energy Commission Washington, D. C.
J. S. Kelly Director Division of Peaceful Nuclear Explosives U. S Atomic Energy Commission Washington, D. C.
Dr. R. S. Russell Agricultural Research Council Radiobiological Laboratory Letcombe Regis, Wantage, Berkshire England
Prof. G. M. Ward Animal Science Department (Dairy) Colorado State University Fort Collins, Colo.
Dr. D. E. Bales Research Branch Division of Radiological Health Radiological Health Laboratory U. S. Public Health Service 1901 Chapman Avenue Rockville, Md.
Dr. R. G. Illing Sandia Corporation Albuquerque, N. Mex.
Mr. J. McBride U. S. Public Health Service Southwestern Radiological Health Laboratory Las Vegas, Nev.
Dr. G. M. Van Dyne Radiation Ecology Section Health Physics Division Building 2001 Oak Ridge National Laboratory Post Office Box X Oak Ridge, Tenn.
-26-
External Distribution (Continued)
Dr. E. D Harward, Chief Nuclear Facilities Environmental Analysis Section Technical Operations Branch Division of Radiological Health Radiological Health Laboratory U. S. Public Health Service 1901 Chapman Avenue Rockville, Md.
Mr. T. F. Lomenick Bldg. 3504 Oak Ridge National Laboratory Oak Ridge, Tenn.
TID-4500, UC-48 Biology and Medicine 270
Tins report /*as prepared as an account of Government sponsored work
Neither tlie United Stales, nor trie Coi'Missioii. nor any person acting on behalf
of Hie Con.n.issioii:
A Makes any warranty or representation, expressed or implied, with
respect to trie accuracy completeness, or usefulness of Hie information con-
tained in ll=is report or that (lie use of any niformalion. apparatus, method, or
process disclosed in this leport may not infringe privately owned rights; or
8 Assumes any liabilities with respecl to Hie rise of. or for damages
resulting from the use of any information, apparatus, method or process dis-
closed in this report
As used in lire above "person acting on behalf of the Commission"
includes any employee or contractor of the Commission, or employee of such
contractor to the extent that such employee or contractor of the Commission,
or employee of such contractor prepares, disseminates, or provides access to,
any information pursuant to his employment or contract with the Commission,
or his employment with such contractor.
sn:la