Embed Size (px)
Citation preview
S519: Evaluation of Information Systems
Social Statistics
Ch3: Difference
This week
Range Standard deviation Variance Using Excel to calculate them
The whole story
Descriptive statistics Centrality tendency (average) Measurement of variability (variability)
Average+Variability = describe the characteristics of a set of data
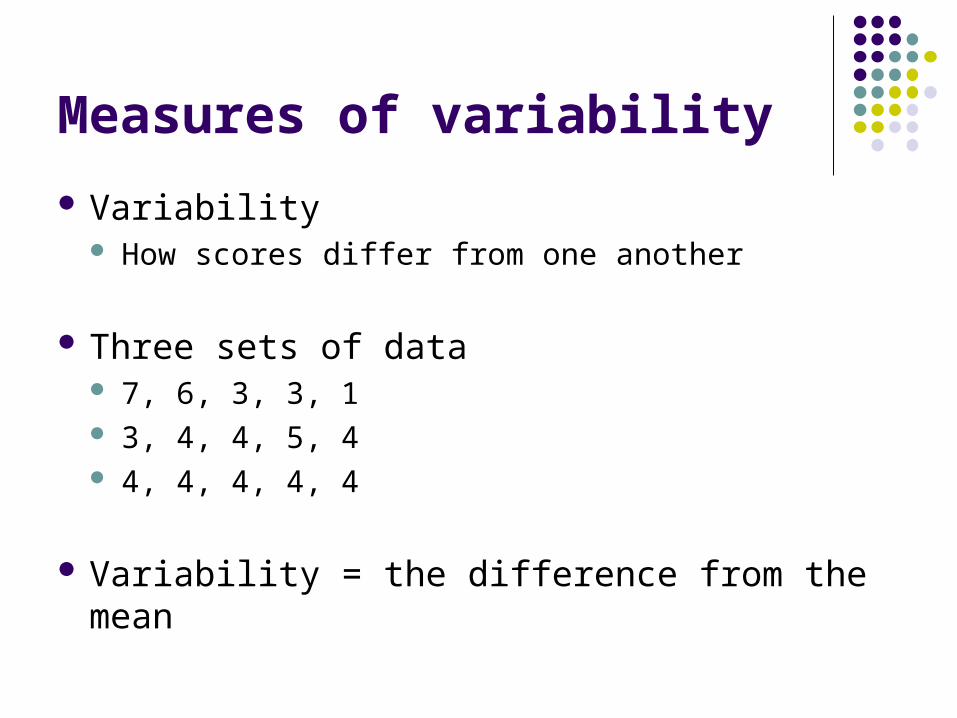
Measures of variability
Variability How scores differ from one another
Three sets of data 7, 6, 3, 3, 1 3, 4, 4, 5, 4 4, 4, 4, 4, 4
Variability = the difference from the mean
Measures of variability
Three ways Range Standard deviation Variance
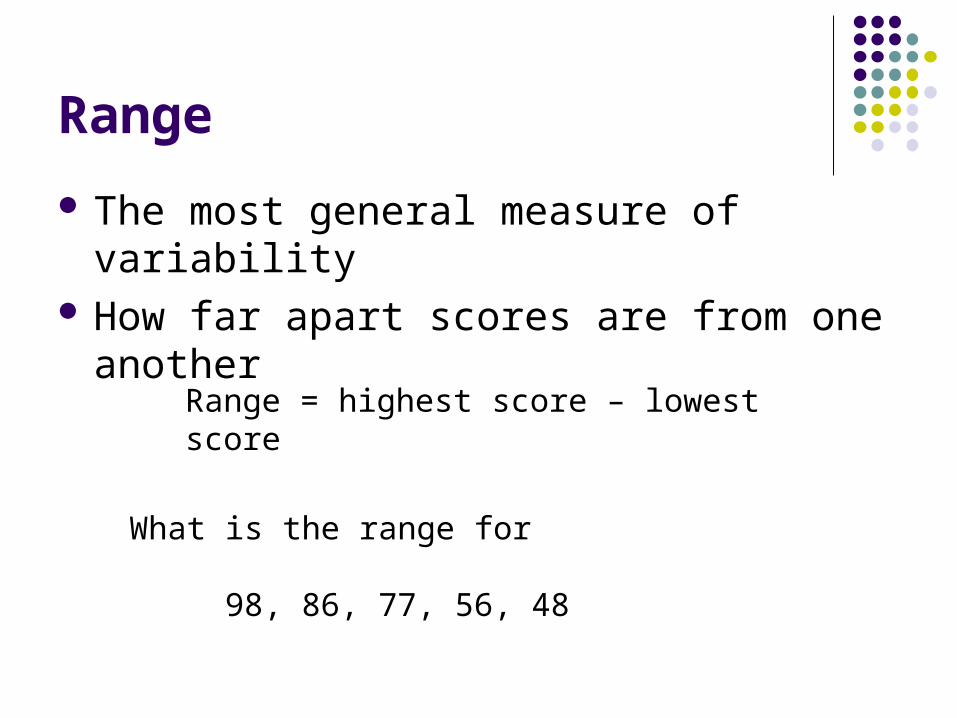
Range
The most general measure of variability How far apart scores are from one another
Range = highest score – lowest score
What is the range for
98, 86, 77, 56, 48
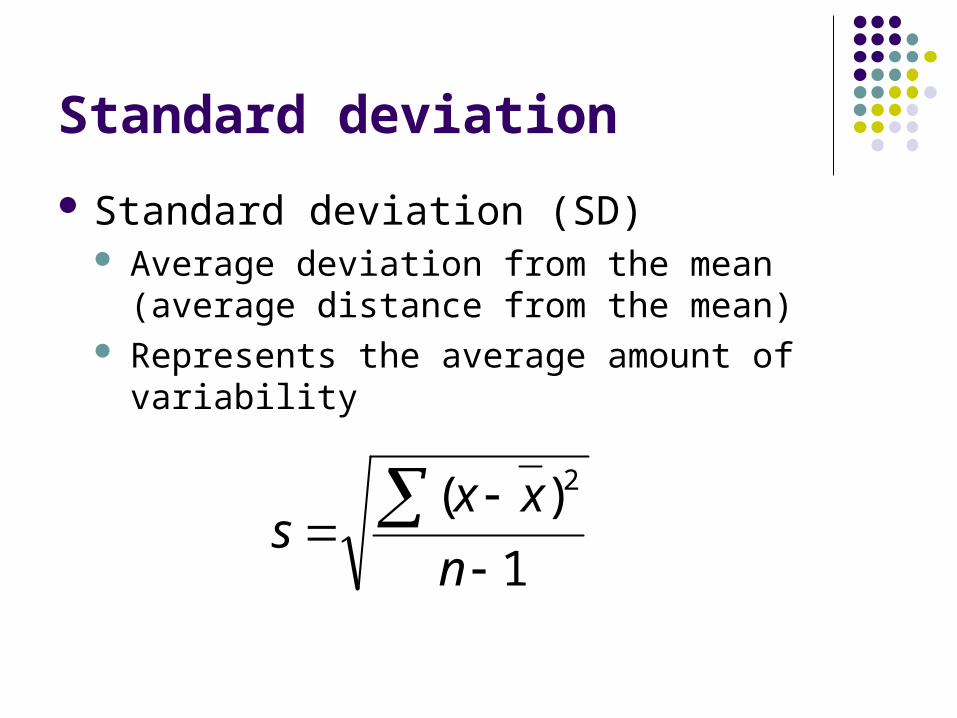
Standard deviation
Standard deviation (SD) Average deviation from the mean (average
distance from the mean) Represents the average amount of variability
1
)( 2
n
xxs
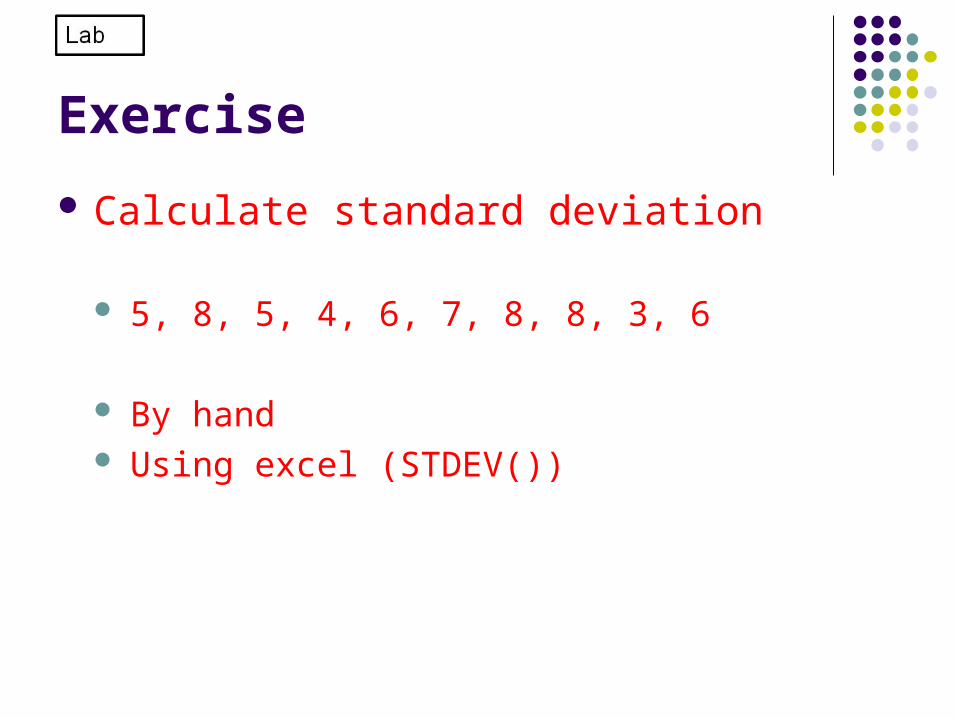
Exercise
Calculate standard deviation
5, 8, 5, 4, 6, 7, 8, 8, 3, 6
By hand Using excel (STDEV())
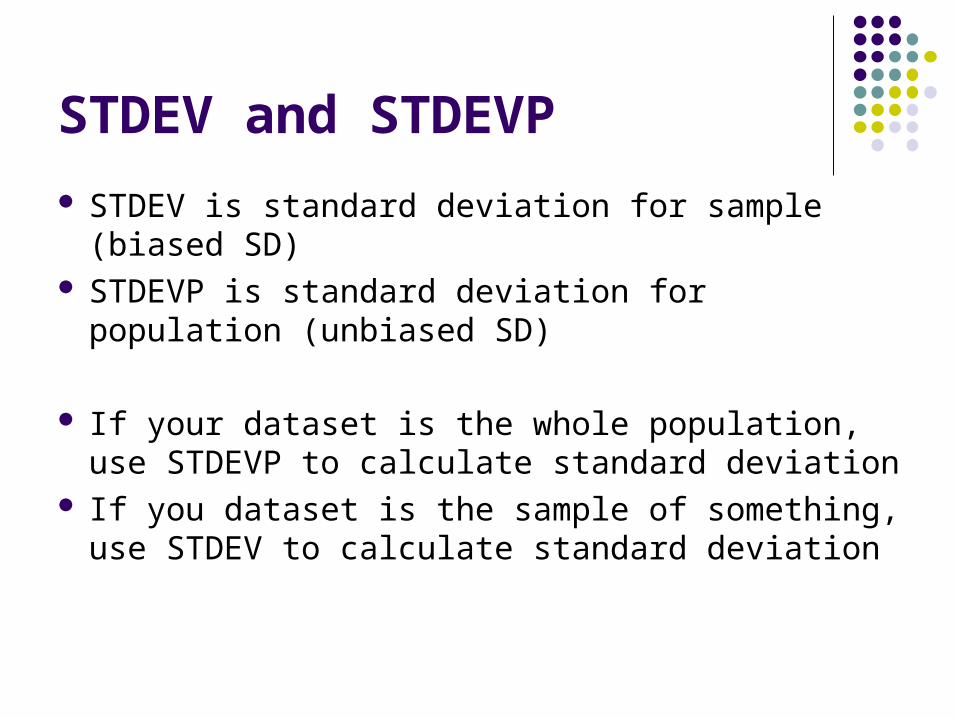
STDEV and STDEVP
STDEV is standard deviation for sample (biased SD)
STDEVP is standard deviation for population (unbiased SD)
If your dataset is the whole population, use STDEVP to calculate standard deviation
If you dataset is the sample of something, use STDEV to calculate standard deviation
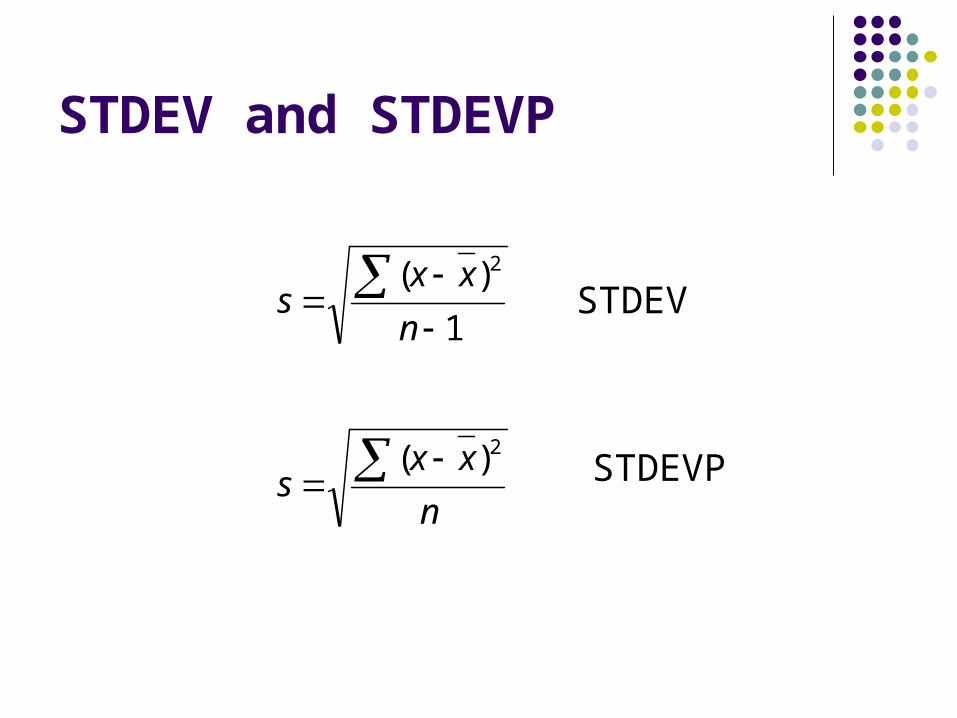
STDEV and STDEVP
1
)( 2
n
xxs
n
xxs
2)(
STDEV
STDEVP
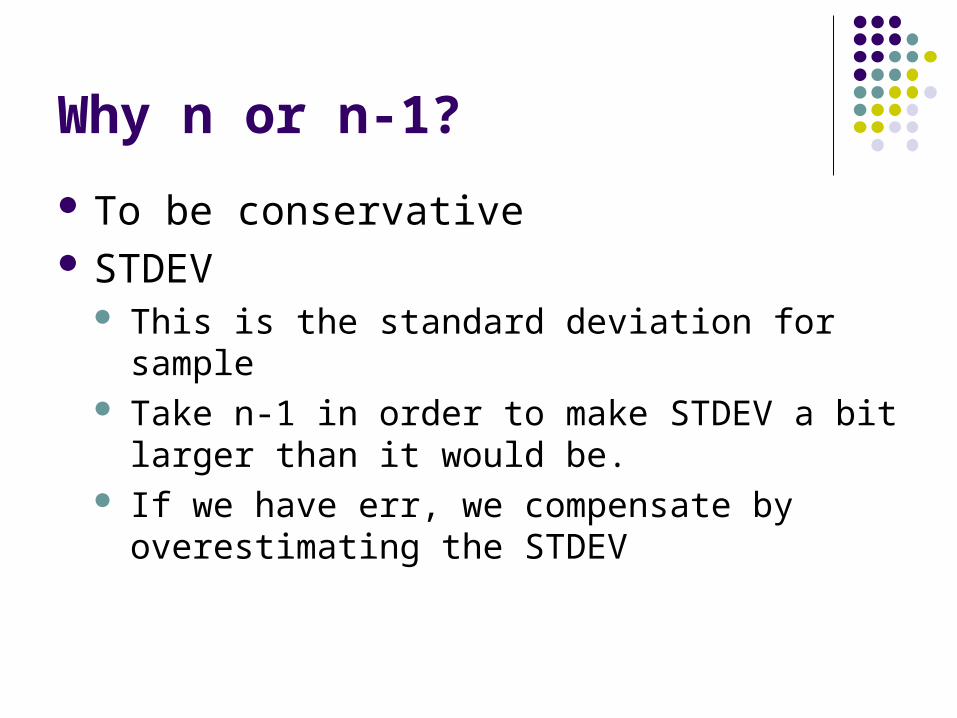
Why n or n-1?
To be conservative STDEV
This is the standard deviation for sample Take n-1 in order to make STDEV a bit larger
than it would be. If we have err, we compensate by overestimating
the STDEV
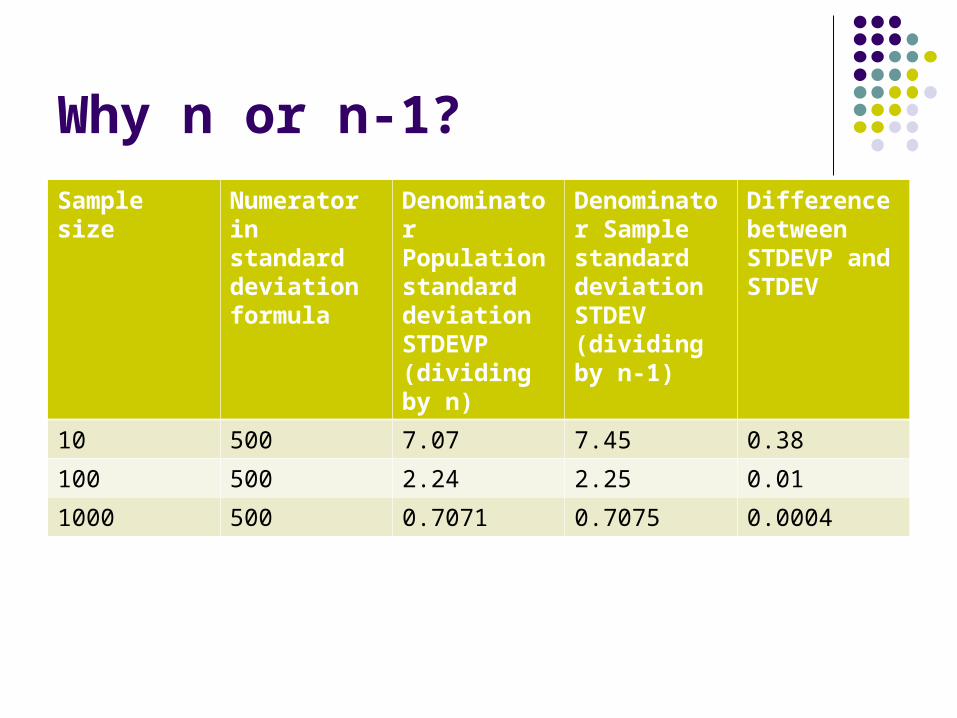
Why n or n-1?
Sample size Numerator in standard deviation formula
Denominator Population standard deviationSTDEVP(dividing by n)
Denominator Sample standard deviationSTDEV(dividing by n-1)
Difference between STDEVP and STDEV
10 500 7.07 7.45 0.38
100 500 2.24 2.25 0.01
1000 500 0.7071 0.7075 0.0004
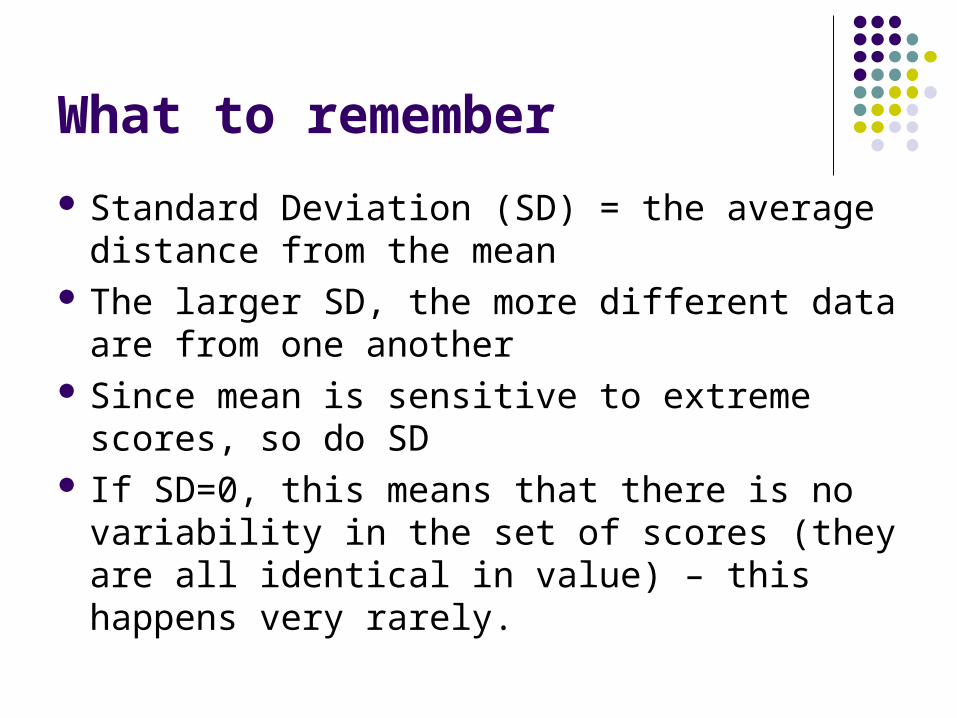
What to remember
Standard Deviation (SD) = the average distance from the mean
The larger SD, the more different data are from one another
Since mean is sensitive to extreme scores, so do SD
If SD=0, this means that there is no variability in the set of scores (they are all identical in value) – this happens very rarely.
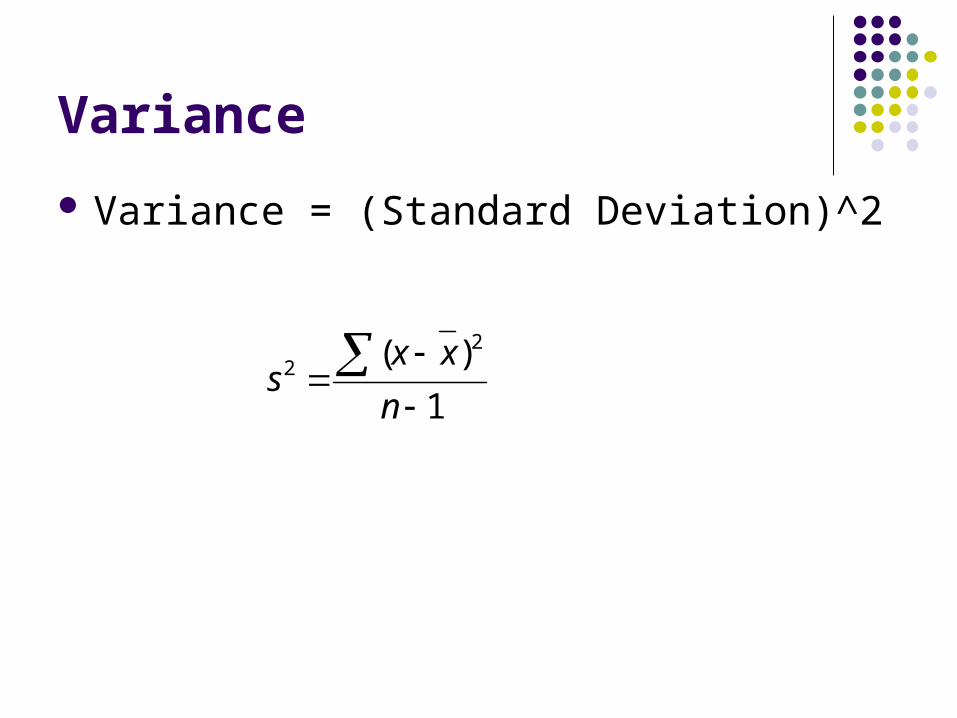
Variance
Variance = (Standard Deviation)^2
1
)( 22
n
xxs
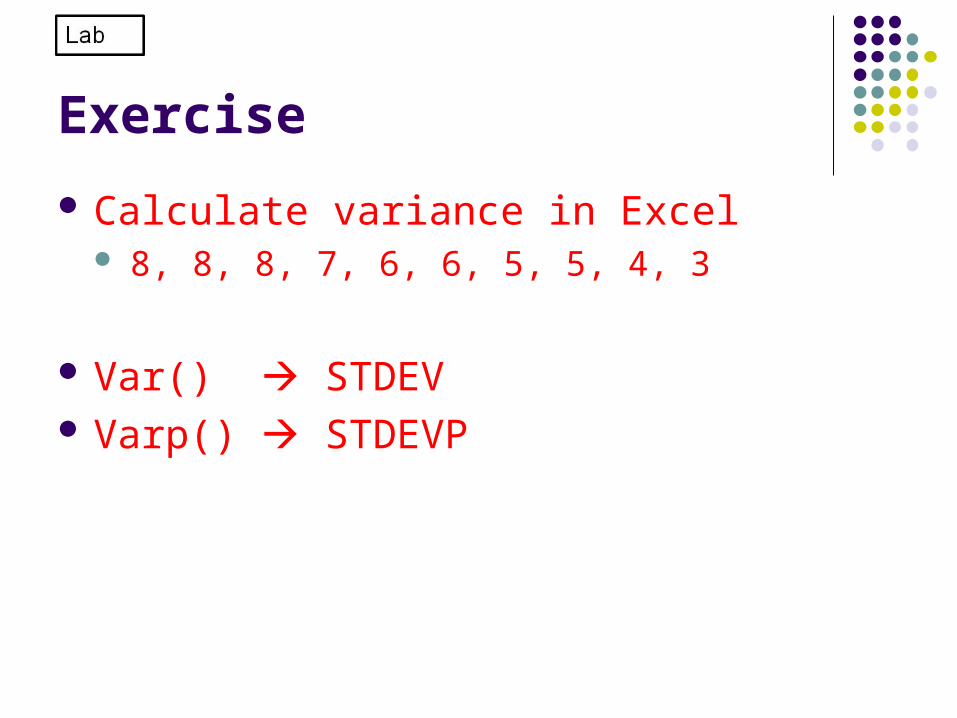
Exercise
Calculate variance in Excel 8, 8, 8, 7, 6, 6, 5, 5, 4, 3
Var() STDEV Varp() STDEVP
SD vs. variance
Often appears in the “Results” sections of journals
They are quite different Variance is squared SD
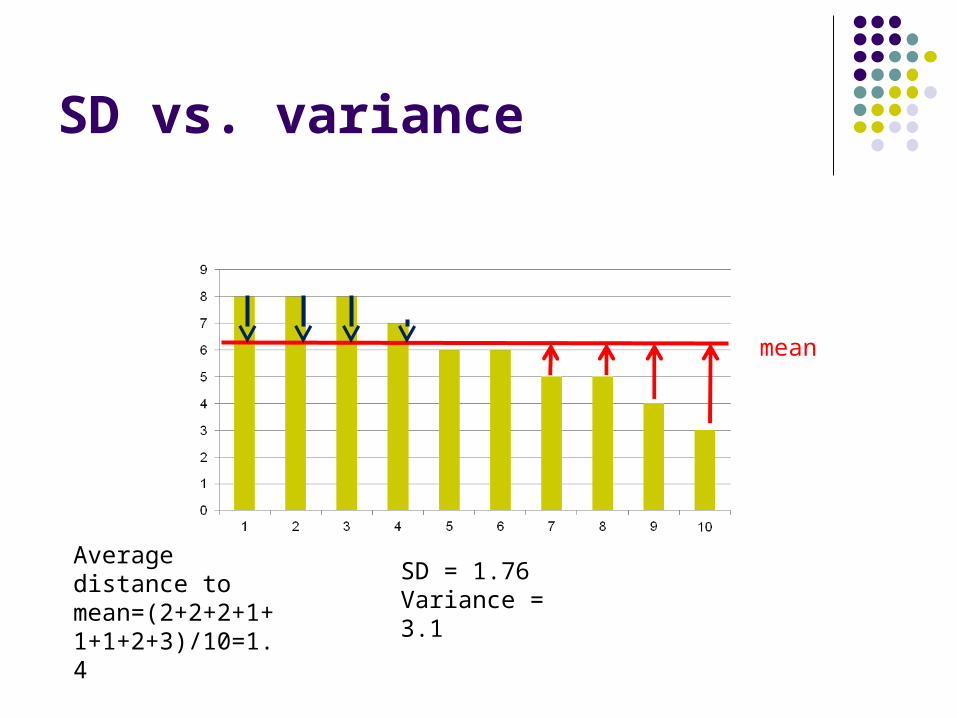
SD vs. variance
mean
SD = 1.76Variance = 3.1
Average distance to mean=(2+2+2+1+1+1+2+3)/10=1.4
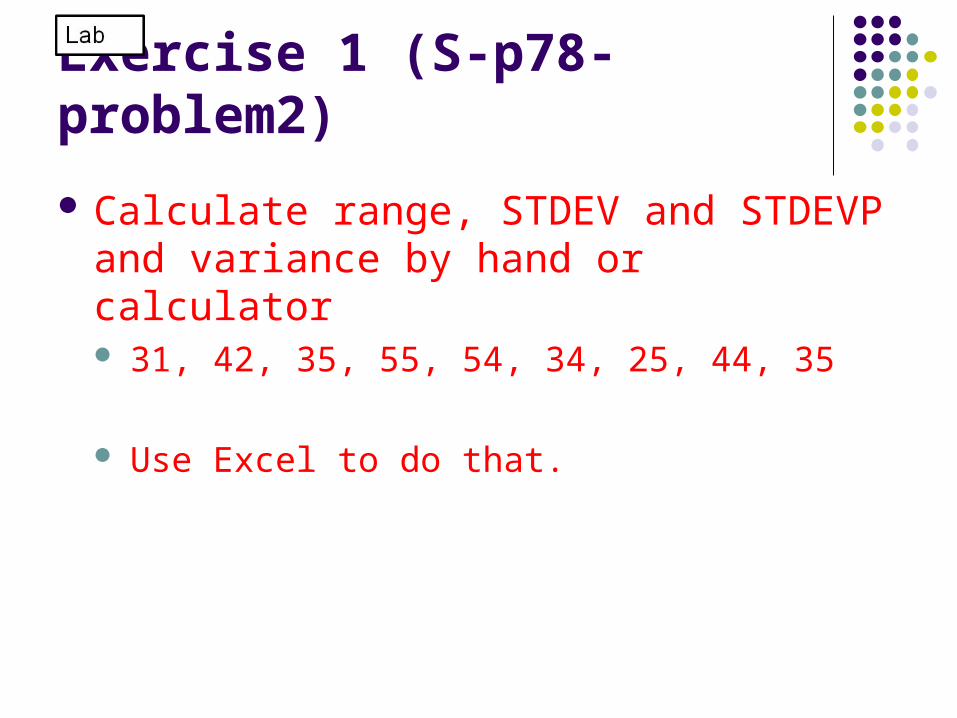
Exercise 1 (S-p78-problem2)
Calculate range, STDEV and STDEVP and variance by hand or calculator 31, 42, 35, 55, 54, 34, 25, 44, 35
Use Excel to do that.
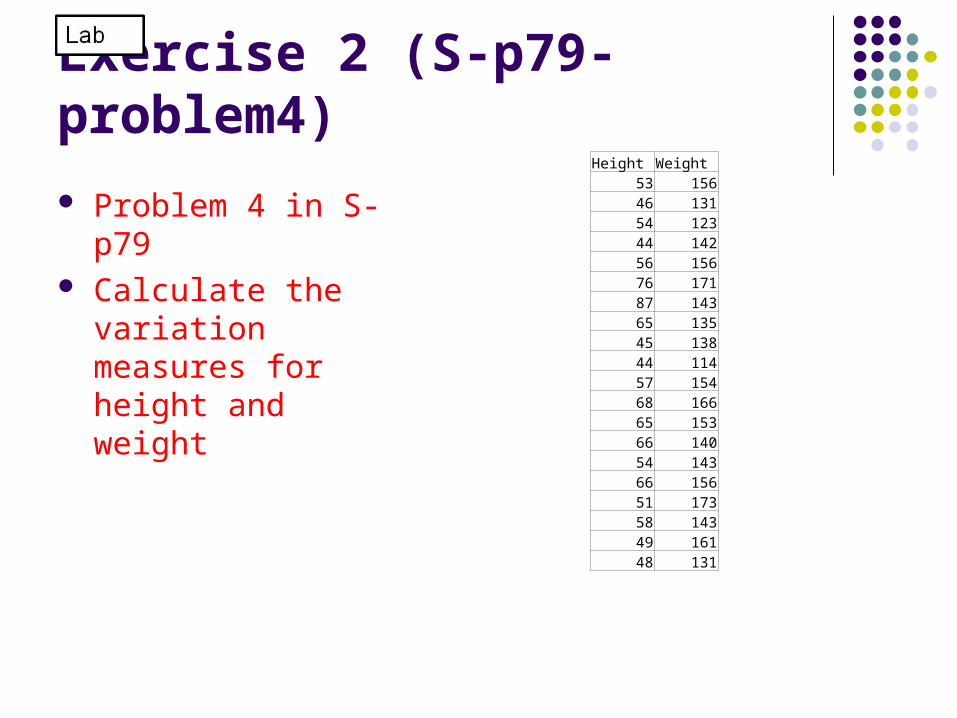
Exercise 2 (S-p79-problem4)
Problem 4 in S-p79 Calculate the
variation measures for height and weight
Height Weight53 15646 13154 12344 14256 15676 17187 14365 13545 13844 11457 15468 16665 15366 14054 14366 15651 17358 14349 16148 131
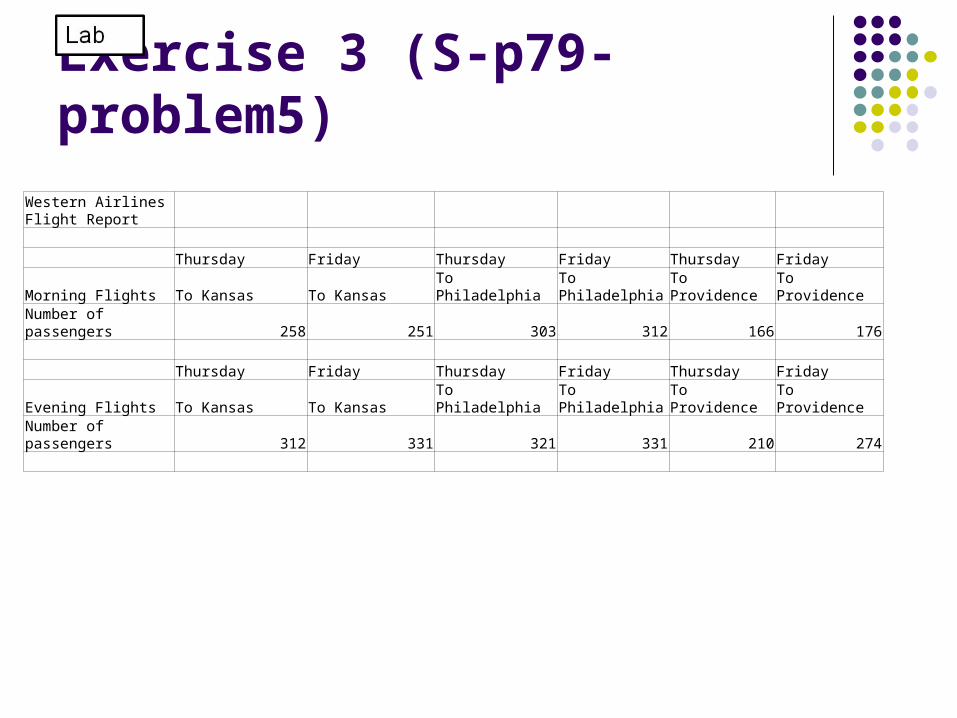
Exercise 3 (S-p79-problem5)
Western Airlines Flight Report Thursday Friday Thursday Friday Thursday FridayMorning Flights To Kansas To Kansas To Philadelphia To Philadelphia To Providence To ProvidenceNumber of passengers 258 251 303 312 166 176 Thursday Friday Thursday Friday Thursday FridayEvening Flights To Kansas To Kansas To Philadelphia To Philadelphia To Providence To ProvidenceNumber of passengers 312 331 321 331 210 274
Exercise 3 (S-p79-problem5)
Look at problem 5 Write a half page summary report to your
boss Form a group to discuss it