Embed Size (px)
Citation preview

S519: Evaluation of Information Systems
Social Statistics
Ch5: Correlation

Last week
Chart

This week
What is correlation? How to compute? How to interpret?
Correlation Coefficients
The relations between two variables How the value of one variable changes when the
value of another variable changes A correlation coefficient is a numerical index to
reflect the relationship between two variables. Range: -1 ~ +1 Bivariate correlation (for two variables)
Pearson product-moment correlation (named for inventor Karl Pearson)
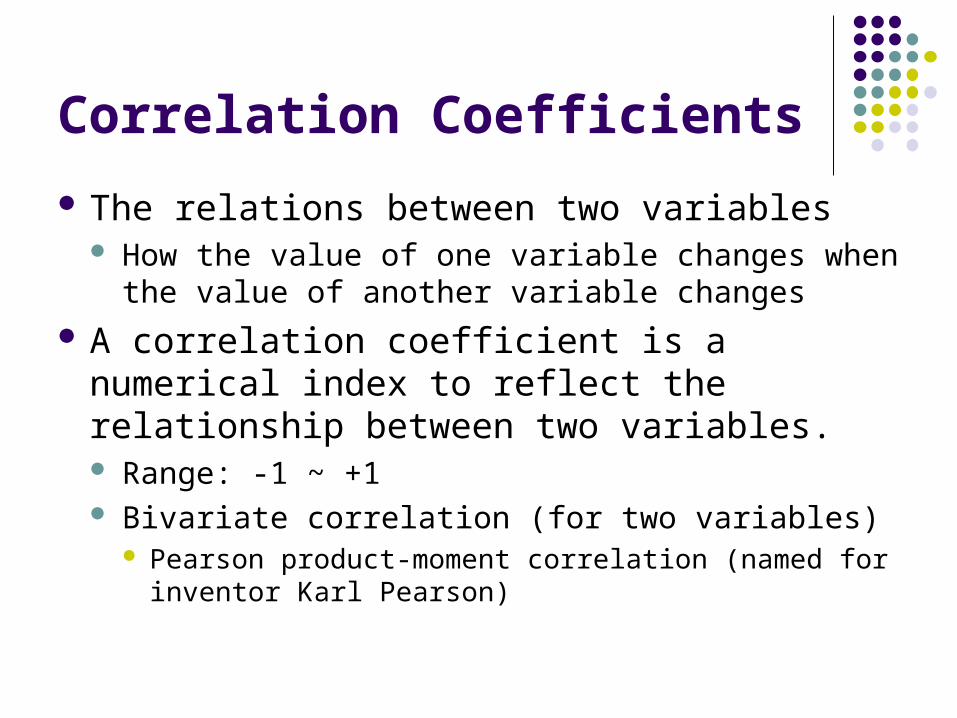
Pearson correlation coefficient
For two variables which are continuous in nature Height, age, test score, income
But not for discrete or categorical variables Race, political affiliation, social class, rank
Rxy is the correlation between variable X and variable Y
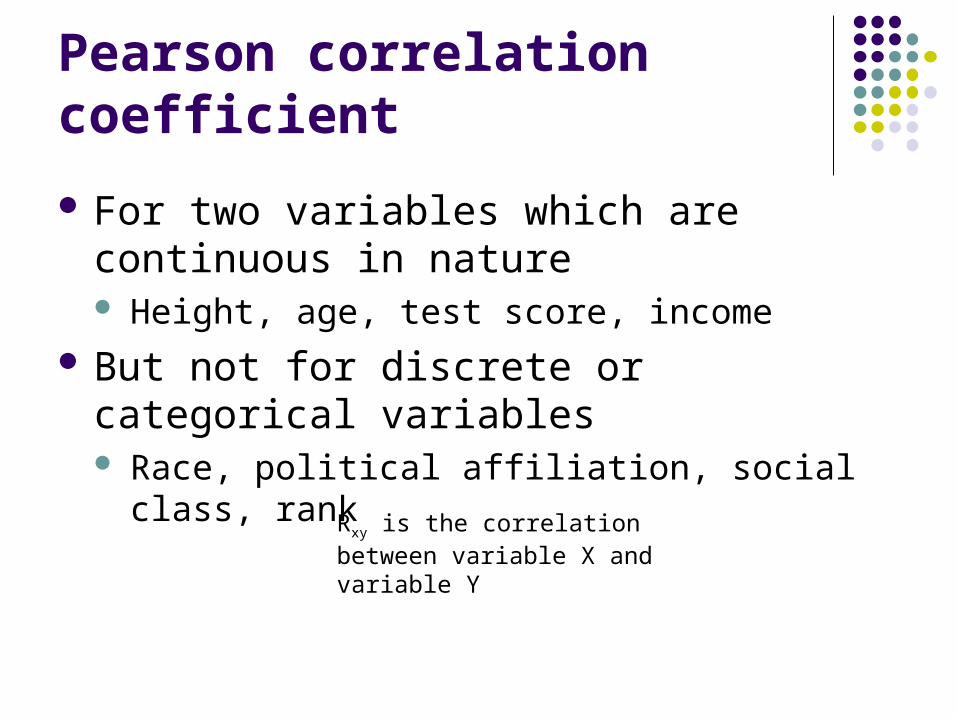
Types of correlation coefficients
Direct correlation (positive correlation): If both variables change in the same direction
Indirect correlation (negative correlation): If both variables change in opposite directions
See table 5.1 (S-p112)
-0.70 and +0.5, which is stronger?
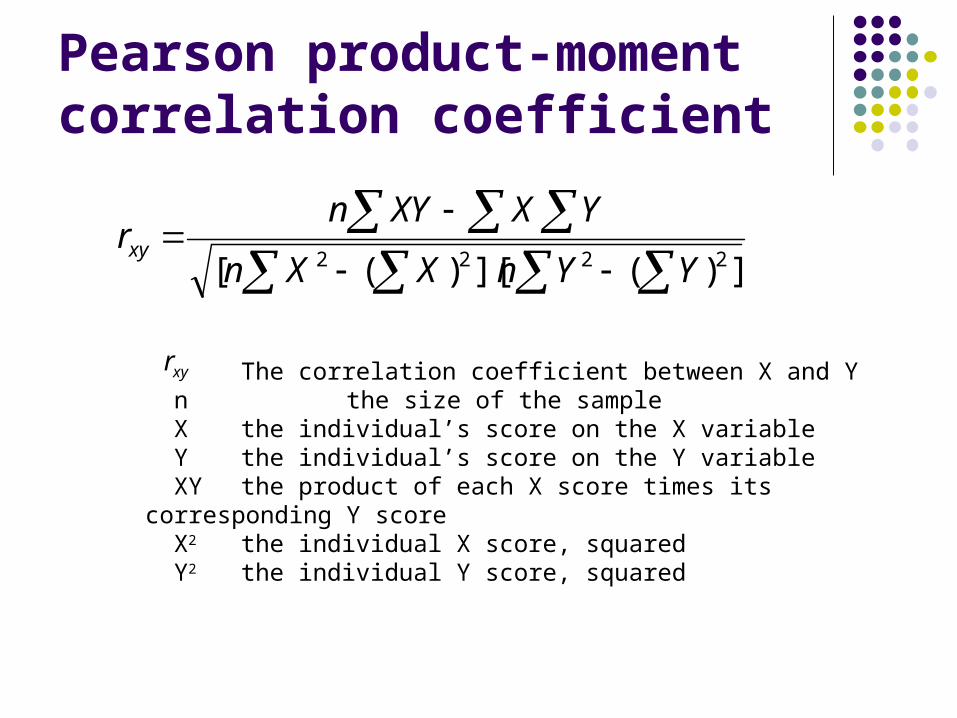
Pearson product-moment correlation coefficient
])(][)([ 2222 YYnXXn
YXXYnrxy
xyr The correlation coefficient between X and Y n the size of the sample X the individual’s score on the X variable Y the individual’s score on the Y variable XY the product of each X score times its corresponding Y score X2 the individual X score, squared Y2 the individual Y score, squared
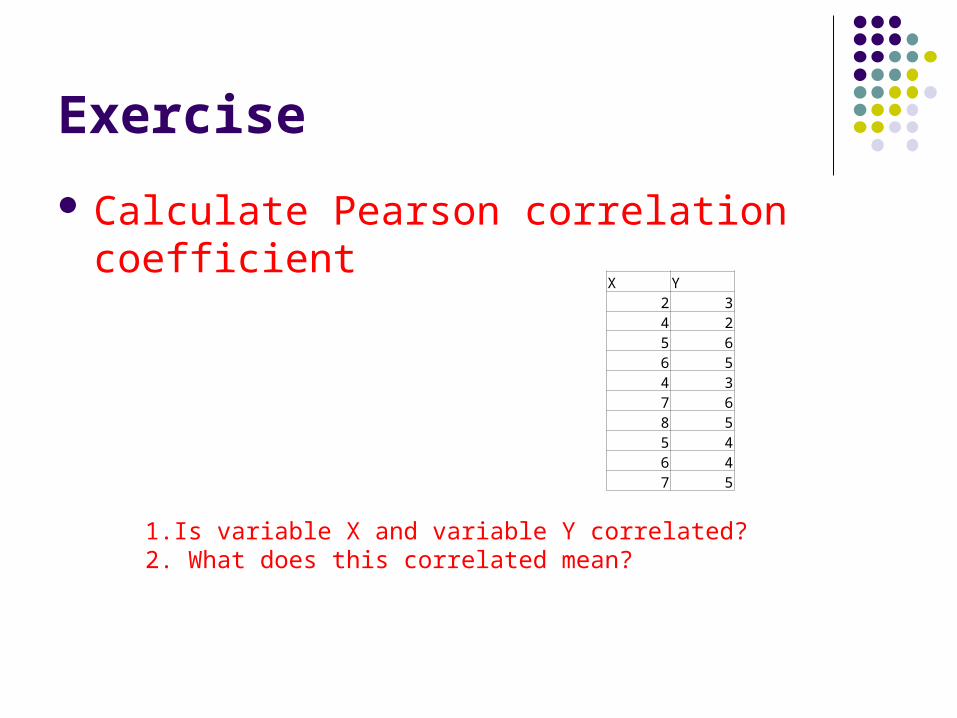
Exercise
Calculate Pearson correlation coefficient
X Y2 34 25 66 54 37 68 55 46 47 5
1.Is variable X and variable Y correlated? 2. What does this correlated mean?
Using Excel to calculate
CORREL function Or Pearson function
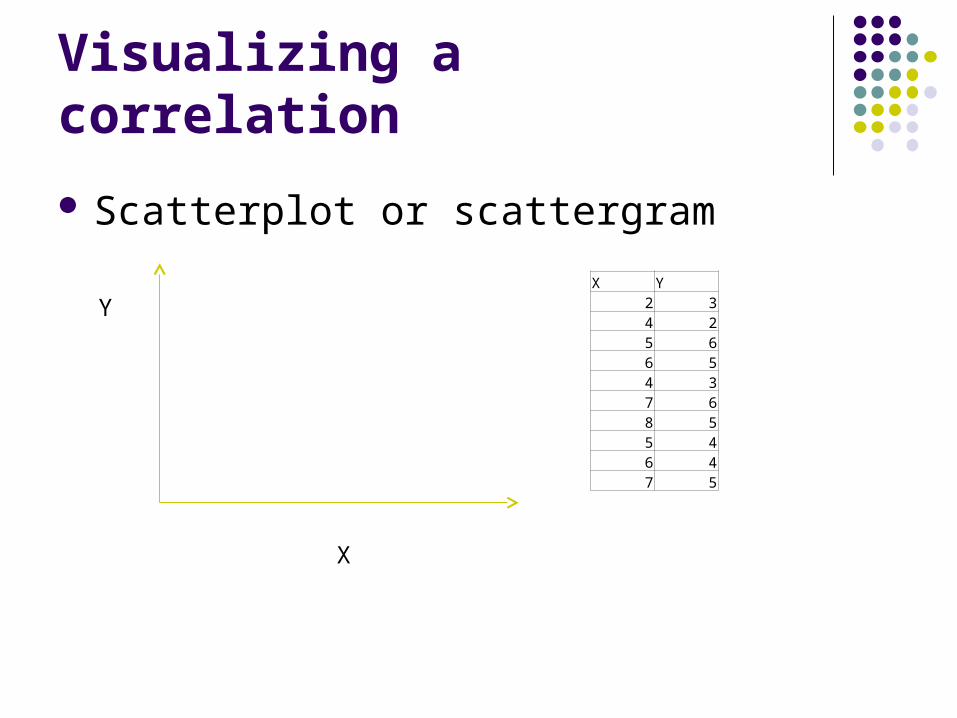
Visualizing a correlation
Scatterplot or scattergram
X Y2 34 25 66 54 37 68 55 46 47 5
X
Y

Visualizing a correlation

Direct (positive) correlation
r =1, a perfect direct (or positive) correlation In real life case, 0.7 and 0.8 could be the highest you will see
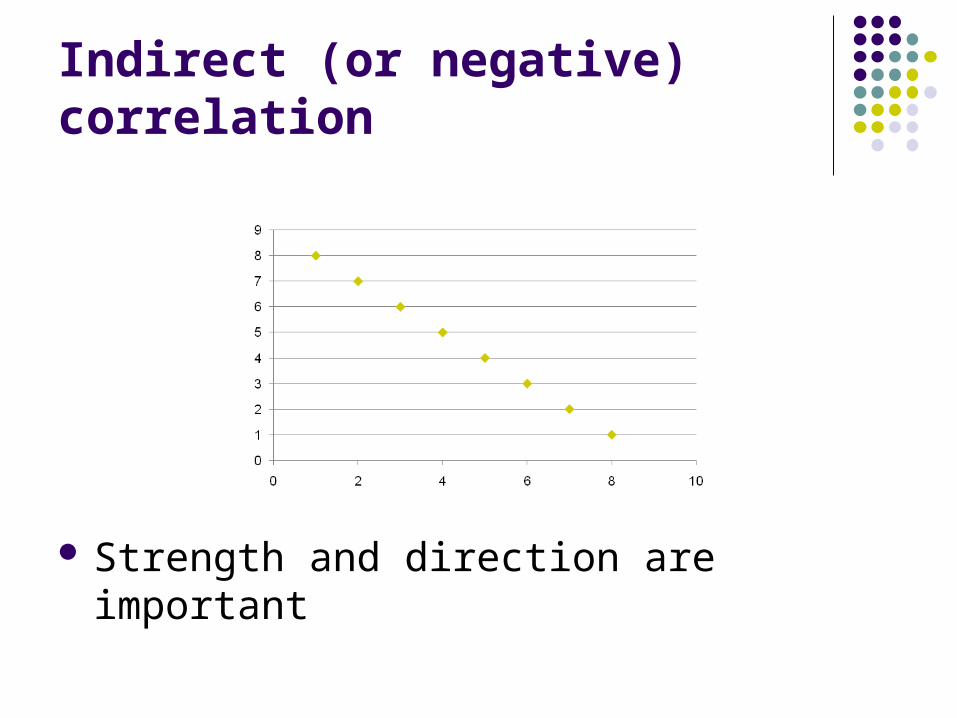
Indirect (or negative) correlation
Strength and direction are important

Excel Scatterplot
Insert- chart (select scatterplot)
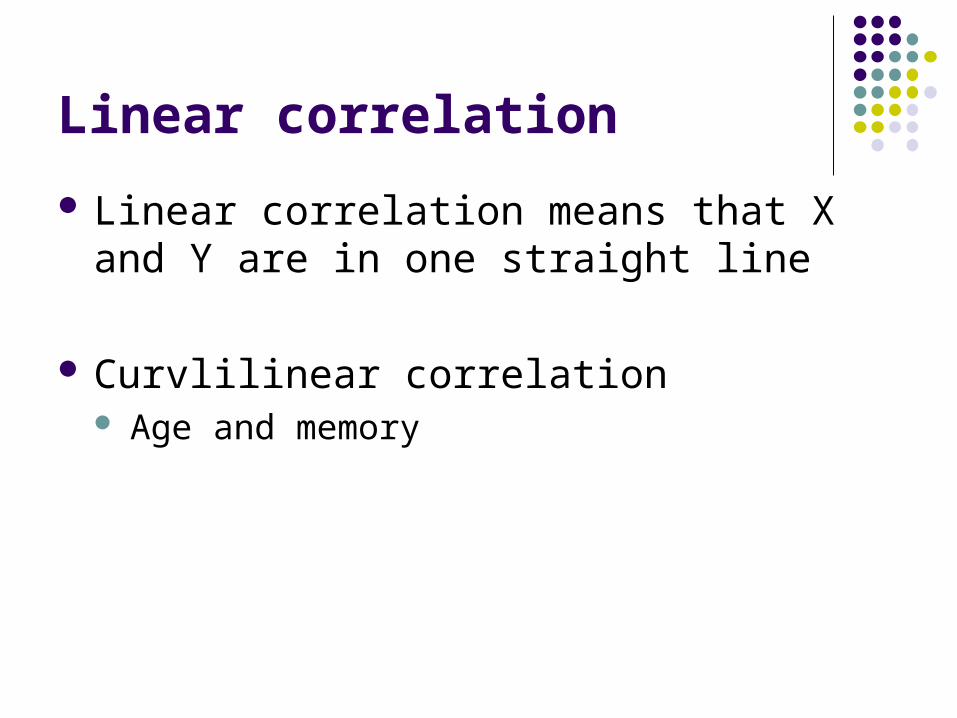
Linear correlation
Linear correlation means that X and Y are in one straight line
Curvlilinear correlation Age and memory

More than 2 variables?
income education attitude vote74190 13 1 180931 12 3 281314 11 4 273089 11 5 262023 11 3 261217 10 4 284526 11 5 187251 11 4 162659 12 5 276450 10 6 270512 12 7 278858 9 6 178628 13 7 186212 14 8 274962 9 8 258828 11 9 461471 10 8 578621 12 7 560071 9 8 4
How to calculate the correlation coefficient?
1. CORREL()2. Correlation
in data analysis toolset
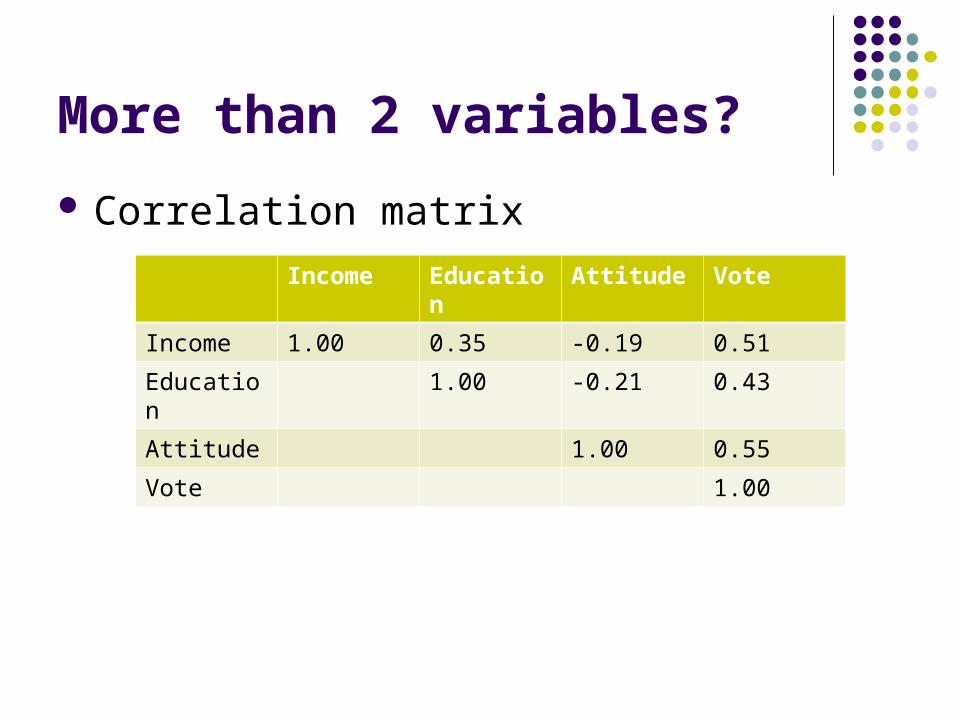
More than 2 variables?
Correlation matrix
Income Education Attitude Vote
Income 1.00 0.35 -0.19 0.51
Education 1.00 -0.21 0.43
Attitude 1.00 0.55
Vote 1.00
Excel
Data Analysis tool - correlation

Meaning of Correlation coefficient
Correlation value: - finite number ~ + finite number
Correlation coefficient value: -1.00 ~ +1.00
rxy value Interpretation
0.8 ~ 1.0 Very strong relationship (share most of the things in common)
0.6 ~0.8 Strong relationship (share many things in common)
0.4 ~ 0.6 Moderate relationship (share something in common)
0.2 ~ 0.4 Weak relationship (share a little in common)
0.0 ~ 0.2 Weak or no relationship (share very little or nothing in common)
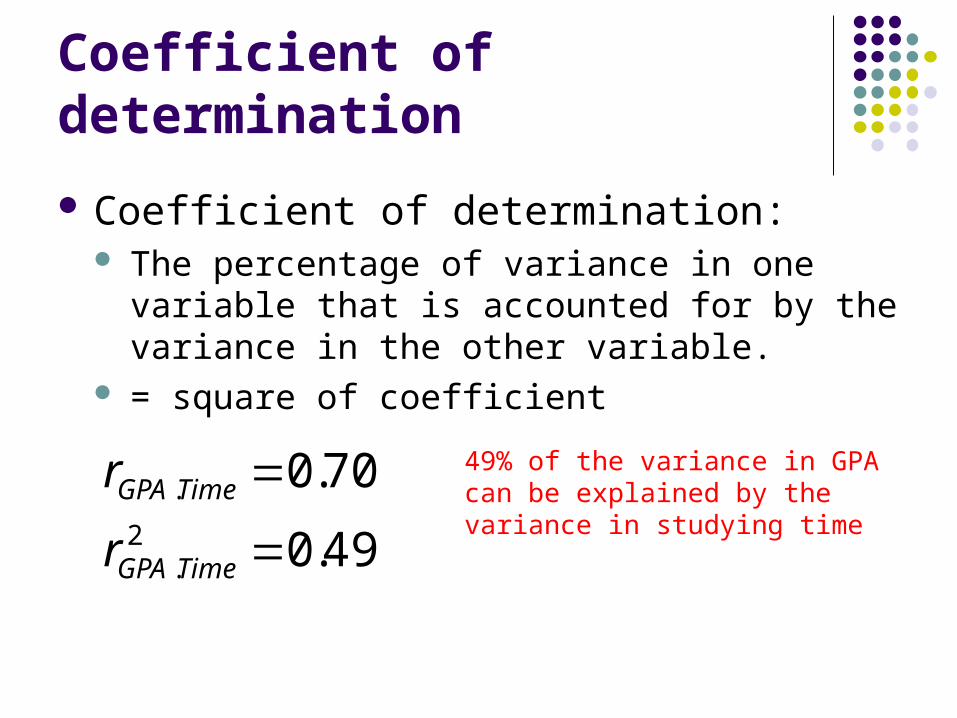
Coefficient of determination
Coefficient of determination: The percentage of variance in one variable that is
accounted for by the variance in the other variable.
= square of coefficient
49.0
70.02
.
.
TimeGPA
TimeGPA
r
r 49% of the variance in GPA can be explained by the variance in studying time

Coefficient of nondetermination
The amount of unexplained variance is called the coefficient of undetermination (coefficient of alienation)
correlation determination interpretation
0 0
0.5 0.25
0.9 0.81
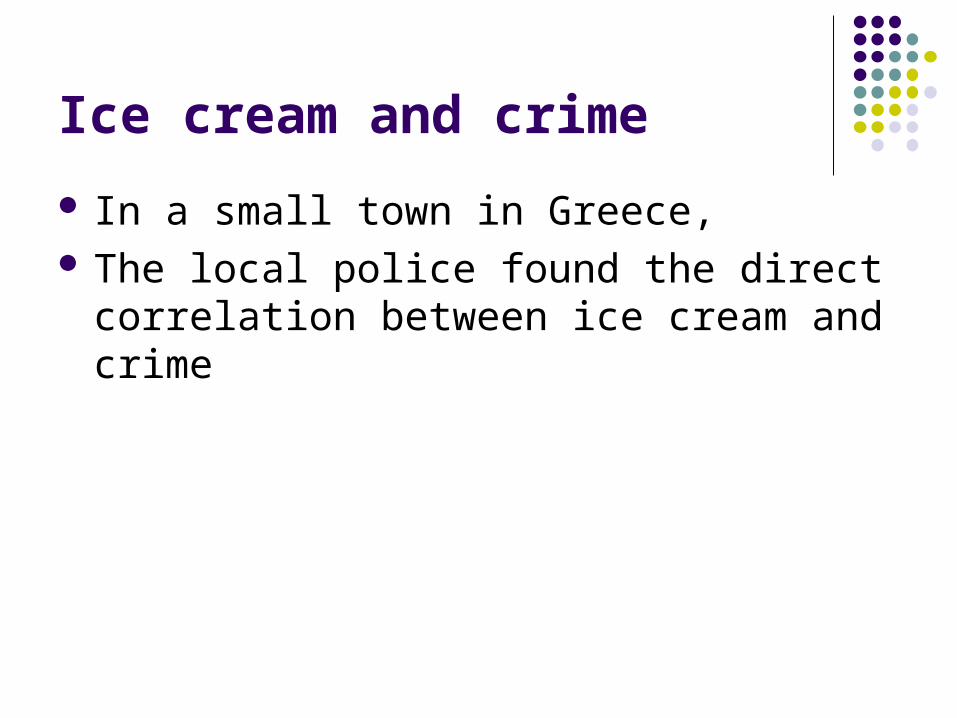
Ice cream and crime
In a small town in Greece, The local police found the direct correlation
between ice cream and crime

Correlation vs. causality
The correlation represents the association between two or more variables
It has nothing to do with causality (there is no cause relation between two correlated variables) Ices cream and crime are correlated, but Ices cream does not cause crime
Stat Homework3
Doing exercises in S-p132-133: Exe 1 Exe 2 Exe 4 Exe 5