Embed Size (px)
Citation preview
Expert Journal of Marketing, Volume 4, Issue 2, pp.46-59, 2016
© 2016 The Authors. Published by Sprint Investify. ISSN 2344-6773 Marketing.ExpertJournals.com
46
Sales Territory Management and
Distributor Performance in the
Telecommunications Industry in Ghana
Isaac TWENEBOAH-KODUAH1, Charles ADUSEI1* and
Charles TENKORANG2
1Garden City University College, Ghana 2Vodafone Ghana, Brong-Ahafo Region, Ghana
The mobile telecommunications in Ghana is a highly competitive market which faces
a problem of retaining their customers due to low switching cost. The purpose of this
study was to investigate sales territory management and distributor performance of
Vodafone in Sunyani. The population for the study was staff and retailers of Vodafone
product and services. Multi-Stage sampling approach was employed for the study. A
well-structured questionnaire and interview guide were used in collecting data from
the respondents. Descriptive statistics, One Sample t-test, Kendall’s Coefficient of
Concordance and Pearson Correlation Matrix were used to analyse the data. Results
revealed that there was effective supervision of the sales territory representatives by
the sales managers. The retailer’s confirmed the receipt of their requested orders
from the distributor when the need arose. The sales territory representatives
confirmed that sales managers involved them in developing new or adjusted territory
plans for effective distribution. This study suggests that the key distributor should
restructure their distribution strategy for better market penetration. Vodafone should
do more to support the distributor in terms of logistics and intensify sales training for
the sales territory representatives. Furthermore, the study prescribed five generic
factors to serve as best practices for distributor management of any organisation.
Keywords: distribution, sales management, sales territory, Vodafone, Ghana
JEL Classification: C42, L32, M31
1. Introduction
Well-designed sales territories make it easier to match the workload and opportunities in every
territory to the capacity of the sales person or the team assigned to cover that sales territory as indicated by
Zoltners et al., (2009). Jobber and Lancaster (2009) argue that sale territory design is an important issue and a
major determinant of salesperson’s opportunity to perform well. Establishment of sales territories might be
*Corresponding Author:
Charles Adusei, Department of Accounting, Finance and Banking, Faculty of Business Studies, Garden City University College, Kumasi, Ghana
Article History:
Received 24 September 2016 | Accepted 21 October 2016 | Available Online 29 October 2016
Cite Reference:
Tweneboah-Koduah, I., Adusei, C. and Tenkorang, C., 2016. Sales Territory Management and Distributor Performance in the Telecommunications
Industry in Ghana. Expert Journal of Marketing, 4(2), pp. 46-59.
Tweneboah-Koduah, I., Adusei, C. and Tenkorang, C., 2016. Sales Territory Management and Distributor Performance in the Telecommunications
Industry in Ghana. Expert Journal of Marketing, 4(2), pp. 46-59.
47
seen to facilitate sales force operations effectively. According to Zoltners et al., (2009), most sales leaders
often overlook the power of sales territory design as a sales effectiveness tool. Wayne (2008) indicated that
customer coverage, increased sales and fair performance evaluation can be achieved by having a good sales
territory design. He went on to suggest that effective sales territory design will help with a better identification
of customer needs and serving them in a cost effective manner.
National Communication Authority (NCA) (2015) indicated that, the mobile phone lines in Ghana
have reached a little above 32.8 million in 2014 - which exceeds the estimated 27.4 million people population
of the country. It went on to state that there is a high rate of mobile phone number portability, indicating that
86.5% of the total number of subscribers which have had their numbers ported only once, 12% ported twice
and the remaining 0.6% ported more than twice. The population for all locations for Sunyani Municipal was
123,224 with 102,389 people accounted for the in Urban territories, while Rural territories had 20,835 people,
in 2010, according to the population census as reported by Ghana Statistical Services (2013) for which the age
group between 15-64 years accounted for 80,011 in all locations, with 68,116 accounted for the Urban
territories, while Rural territories had 11,845 which implies that there is a big market for Vodafone if effective
distribution and sales territory management is deployed respective of the competition. It is obvious from the
statistics that the mobile telecommunications in Ghana is a highly competitive market which is faced with a
problem of retaining their customers. Out of stocks situations and its effects on lost sales and possible
subscriber switch to competitor prompted this study.
Distributor performance is crucial to the survival of any organisation and so it is important for specific
measurable sales goals for distributors as the expectations from the manufacturer or supplier. Kotler and Keller
(2012) argue that the distributors know that their performance will be evaluated throughout the year, and make
sure they understand the yardstick against which they will be measured. Dent (2008) indicated that distributor
performance is crucial in achieving sales targets in volume and value. Donaldson (2007) added that distributor
effort in market and outlet coverage can develop new markets and new accounts.
The role of the distributors and the sales territory representatives serve as the link between customers
and the products and services of Vodafone. This study investigates redistribution and the management of sales
territories of the key distributor of Vodafone within the Sunyani Municipality and assesses how the
performance of the distributors is affected by the type of sale territory management practices being used.
2. Literature Review
2.1. Sales Territory Management Practices
It is important for organisations to consider issues on territory management as an essential aspect of
sales management as the organisations’ success to a lager extent depends on sales and revenue for the
organisation as indicated by Zoltners et al. (2009). The sales territories are established by making sure that
they capture the existing customers as well as potential customers to a distribution representative (i.e.
salesperson), branch, or an intermediary (retailer or wholesaler) as suggested by Jobber and Lancaster (2009).
When defining sales territory, the emphasis is not on the geographical area but rather on the characteristics of
the customers Zoltners et al. (2009). One of the responsibilities of an effective sales manager is to be able to
adapt and deploy the territory concept that meets the needs of the company’s specific go-to-market strategies
which addresses the present market dynamics.
Kotler and Keller (2012) indicated that one of the objectives of sales territory design is to have a
maximum coverage of the entire market. This implies that effective design of sales territory can allow the
channel players to spend more time with existing and also make room for prospecting. Simpkins (2004)
suggested that a well design sales territory can set a company apart from competition as it can optimise the
role of the key distributors and that of the territory sales representatives to achieve proper market coverage.
Wayne (2008) explained that it is imperative that organisations allocate and define clearly the
responsibilities of each salesperson accurately and resourced them to perform well. The sales territory
management must aid a cost-effective journey plan by making available information on customer details to
help the sales representative to serve them better. Customer relationships are best developed over a long period
of interactions between the distributor and the customers. Sales territory management ensures regular visits
and interactions as indicated by Piercy and Lane (2009). Without sales territory management system,
distributors would travel to their customers from the sales office without any planned scheduling, eventually
spending more time and money in traveling as affirmed by (Dent, 2008). Under the sales management system,
the sales manager gets to evaluate the performance of distributors effectively when the distributors have been
assigned to a specific sales territory. Evaluation can be done not only with respect to sales volume but also in
terms of selling expenses, customer satisfaction levels, customer service, and other responsibilities of the
Tweneboah-Koduah, I., Adusei, C. and Tenkorang, C., 2016. Sales Territory Management and Distributor Performance in the Telecommunications
Industry in Ghana. Expert Journal of Marketing, 4(2), pp. 46-59.
48
distributor (Jobber and Lancaster, 2009). Some of the critical areas that a sales manager needs to exhibit high
level of managerial skills and competence include the area of supervision, salesforce control, exploiting new
product and market opportunities and salesforce motivation according to Zoltners et al., (2004).
2.2. Distribution Performance
The concept of salesforce or distribution performance has received a considerable empirical support
(Piercy et al., 2004; Kuster and Canales, 2008). This research support rests on the finding that the overall sales
organization effectiveness of a company is directly related to the salesperson factors, although that is not the
only factor that affects it but other factors such as organizational factors (e.g. management control systems,
advertising spending and brand image) and environmental factors (e.g. competition). Based on these studies,
the effectiveness of sales organization and the performance of salespersons or distributors are closely
correlated, but conceptually distinct. Thus, effectiveness is an overall evaluation of organizational outcomes
that can be in part attributed to the performance of salesperson (Kotler and Keller, 2012).
Performance standards are designed to measure the performance activities that the company consider
most important. Setting standards of performance for the sales executive in the evaluation process requires
consideration of the nature of the selling job (Bradley, 2003). Setting performance standard for sales personnel
relies upon company products and dealership network and the marketing channels through which company
effort to push the product into market. Performance standards of performance make it easy to measure the
progress made for the accomplishment of the sales organization objectives which may vary according to
company’s marketing situation but the general objective is to increase the sales volume, profit and growth,
according to Zoltners et al., (2004).
Performance standard can be done in two forms: quantitative and qualitative. The quantitative type
measures success in achieving profit objectives such as sales generated in terms of volume number of customer
generated which includes high user segment, low user and moderate user segments to gauge the progress sales
quota is expressed in absolute terms for the specific territory. In quantitative methods, the number of factors
to be consider while using the evaluation process such as call frequency ratio, calls per day, order call ratio,
average cost per call, average order size and non-selling activities (Farris et al., 2006).
The second aspect of performance of standards is its qualitative form, comprising of measuring sales
personnel which includes the behavioural aspect of the sales executive, such as personal effectiveness in
handling the customer relation problem, customer satisfaction and customer service. In the qualitative method,
the degree of excellence can be evaluated by each sales person using a detailed checklist of subjective factors
such as product knowledge, awareness of customer needs, relationship with customer, service follow up and
personal factors, such as punctuality, general attitude, dress and appearance, diligence, cooperation, accuracy,
adaptability and reliability (Farris et al., 2006).
3. Study Area and Methodology
3.1. Study Area
Sunyani Municipality is one the twenty-seven districts in the Brong Ahafo Region. The municipality
was established on 10th March, 1989 by a legislative instrument (LI) 1473. This was the period in which Ghana
adopted the District Assembly concept. The overall goal is to accelerate growth and development in the
Municipality. The Sunyani West district was carved from this Municipality on November 2007. The Sunyani
Municipal Assembly covers a total land area of 506.7 km2. It is located at the heart of Brong Ahafo Region
lying between Latitudes 70 20’N and 70 05’N and Longitudes 20 30’W and 20 10’W. It is bordered on the
north by Sunyani West District; west by Dormaa East District south by Asutifi District to the South and east
by Tano North District. The population of the Municipality, according to the 2010 Population Housing Census,
stands at 123,224 with 61,610 males and 61,614 females.
3.2. Methodology
3.2.1. Research Design
The research approach consists of a survey which is appropriate for the investigation into sales territory
management and distributor performance in Sunyani, using Vodafone as case study. Abramson and Abramson
(2008) indicated two basic designs for surveys that are cross-sectional and longitudinal. They indicated that a
cross-sectional study provides information about the situation that exists at a single time, whereas a
longitudinal (time-span) study provides data about events or changes during a period. The study adopted
descriptive cross-sectional study as it investigated a snap shot of the current situation of Sunyani Municipality
Tweneboah-Koduah, I., Adusei, C. and Tenkorang, C., 2016. Sales Territory Management and Distributor Performance in the Telecommunications
Industry in Ghana. Expert Journal of Marketing, 4(2), pp. 46-59.
49
of the distributor distribution performance. As indicated by De Vaus, (2002), a survey research uses structured
and in-depth interview, observation and content analyses apart from questionnaires that are widely used.
This study adopted a mixed method approach, utilizing both qualitative and quantitative methods. The
quantitative aspect was done through questionnaire administration via the Retailers and Sales Territory
Representatives while the qualitative approach was used to supplement and strengthen the quantitative aspect
to provide an opportunity for the study to seek first-hand information from the Regional Sales Manager of
Vodafone in Sunyani. The popularity of the mixed approach was confirmed by Tashakkori and Creswell,
(2007) indicating that the mixed method approach embraces more than just a combination of qualitative and
quantitative methods, rather it highlights a new “third way” of epistemological paradigm that is based in the
conceptual space between positivism and interpretivism.
The justification of the mixed method approach is that the strength of one method can be used to
overcome the weakness of another one. Also, narrative and non-textual information can increase the meaning
of numeric data, while numeric data can increase the precision to narrative and non-textual information.
3.2.2. Population
Bethlehem (2009) indicated that a target population of a study is the population that should be
investigated. It is also the population to which the outcomes of the survey refer. He went on to say that the
elements of a target population are often people, households or companies.
The population of the study covers the staffs of the Vodafone Regional Office which comprises of
eighteen (18) staff. The composition of Vodafone staff are two (2) management staff each respectively from
the commercial department and technology department, seven (7) territory representatives from commercial
and seven (7) from technology department and two (2) administrative staff. Three hundred (300) approved
retailers on the distributor journey plan. This makes the population of the study to be three hundred and
eighteen (318).
3.2.3. Sampling Procedure
Multi-Stage sampling approach was employed for the study. The first of which was the purposive
selection of the regional office of Vodafone in Sunyani from the ten (10) regional offices of Vodafone in
Ghana. Vodafone is a market challenger with a market share of 22.11% as at June 2016 behind the market
leader which is MTN with a market share of 48.01% as reported by NCA (2016). This was chosen based on
the proximity to the researchers, their knowledge of the town and staff preparedness and willingness to
cooperate with the study. The second stage was cluster sampling to group the Vodafone Staff, retailers who
sell Vodafone products and services and the approved distributors of Vodafone. The retailers were selected
randomly from the sales territory journey plan, while the staff and the distributors were purposively selected.
The third stage was using quota target for the respondents.
3.2.4. Sample Size
The sample size of the two hundred and fifty-three (253) representing 79.5% of the population as
indicated in the table 1. The determination of sample size was non-statistical; it was based on the availability
of the right respondents who have a fair knowledge of the issues under discussion. Most importantly the
respondents voluntarily took part in the study. The sample is representative to the study population.
Table 1. Composition of Respondents
Theme Total number(s) Number of respondents
Vodafone staff 18 8
Retailers 300 245
Total 318 253
Source: Researchers construct 2016
The eight (8) staff from Vodafone represent the regional manager and seven territory representative.
Two hundred and fifty-three (253) retailers comprise of shops, kiosk and table tops within Sunyani.
3.3. Data Collection Instruments
3.3.1. Questionnaires
Questionnaires were used to solicit information from staff and retailers. The questionnaire was in the
form of five Likert scales. The questionnaire is divided into five (5) main sections, with each section examining
different issues in the study. Section I looked at Socio-demographic characteristics of employees. Section II
Tweneboah-Koduah, I., Adusei, C. and Tenkorang, C., 2016. Sales Territory Management and Distributor Performance in the Telecommunications
Industry in Ghana. Expert Journal of Marketing, 4(2), pp. 46-59.
50
explores the sales territory management practices. Section III examines the competence of staff in applying
territory management practices. Section IV investigates the distribution performance of Vodafone Brong
Ahafo. Section V assesses the influence of sales territory management on distribution performance.
A self-administered questionnaire was used to gather information from sales territory representatives
through drop-and-collect technique. This involves leaving a questionnaire with a respondent and going back
to pick it up. This was used due to educational level of the sales territory representatives as they have the
knowledge and ability to fill the questionnaire. The self-administered questionnaire helps to avoid the
interviewer bias and moreover gives the study the opportunity to ask a bit more complex questions. Another
advantage is that it gives the respondents plenty time to consider their answers compare this with the
interviewing technique where the interviewee requires an immediate response. The limitation is the study has
no control over how respondents interpret the questions. With the retailers the questionnaire was personal,
face-to-face interviews. This help if any of the respondents do not understand a question, as the face-to-face
can help complete the questionnaire. A downside is the intrusive and reactive nature of this approach.
3.3.2. Interview Guide
Interviews hold a prominent place among research methods in the social and behavioural sciences.
The purpose of the interview is to collect detailed information and provide inputs into the design and content
of the questionnaire. According to Tracy (2013), interview represents a connection between two people
examining a topic important to them. Holloway (2005) showed that the interview gives the interviewee the
chance to portray experiences in great detail and to give their viewpoints and interpretations of these
encounters. The reason for utilizing the interview, and not other research methods, is that it acquires interesting
data or elucidation held by the individual who participates in the interview. Getting some answers concerning
“a thing” that the researchers are not able watch themselves (Stake, 2010).
Seidman (2006) demonstrated that for the questioner, there is always a component of being there with
the interviewee who can manage the opportunity for an overall observation of what the interview itself is
intended to do. He went ahead to state that since the interview is an experience and interaction amongst the
questioner and interviewee, the questioner can draw on observational information from the communications
to better comprehend the reactions and responses. Subsequently, information were gathered by means of a
semi organized interview with the Regional Sales Manager on the sales territory management and distribution
activities.
3.4. Data Analysis
3.4.1. Quantitative Analysis
Descriptive statistics such as mean, standard deviation, minimum and maximum were used. The Mean
was use as a measure of central tendency while the Standard Deviation as a measure of dispersion. The high
mean value corresponds to “agree” in their responses, while a low standard deviation explains the degree of
consensus to the factors outlined. Data reliability which is a measure of internal consistency and average
correlation was measured using Cronbach’s Alpha Coefficient, which ranges from 0 to 1 (Kimberlin and
Winterstein, 2008). A higher alpha coefficient value means there is consistency among the items in measuring
the concept of interest. Correlation analysis was used to find the strength of the association between the
variables involved. Inter-correlations coefficients (r) were calculated by using the Pearson Correlations.
According to Warokka et al., (2012), the correlation coefficient (r) ranging from (0.10-0.29, 0.30-0.49 and
0.50-1.00) may be regarded as indicating low degree, moderate degree and high degree of correlation
respectively. Field (2005) affirmed that values +1, -1 and 0 respectively show, a perfect positive relationship,
perfect negative relationship and no linear relation that explains the relation between the variables in
correlation analysis.
Inferential statistics for comparing means in the type of One Sample t-Test was used. The test statistic
for a One Sample (t) analysis was used on the respondents view on sales territory practices whiles Kendall’s
coefficient of concordance (W) analysis was used to rank the items identified as staff competence.
3.4.2. Qualitative Analysis
The interview examination adopted by Wolcott (1994) proposes three dimensions of qualitative
research approach, which are description, analysis and interpretation, as referred to by Brinkmann (2013). The
portrayal addresses what the researchers want readers to fully comprehend what the analyst saw, while the
investigation looked at what the researchers want readers to know what the researchers know. The
interpretation, which is the last stage, considers what the researchers want readers to understand what the
researchers have understood.
Tweneboah-Koduah, I., Adusei, C. and Tenkorang, C., 2016. Sales Territory Management and Distributor Performance in the Telecommunications
Industry in Ghana. Expert Journal of Marketing, 4(2), pp. 46-59.
51
4. Results and Discussion
4.1. Sales Territory Management Practices of Vodafone in Sunyani
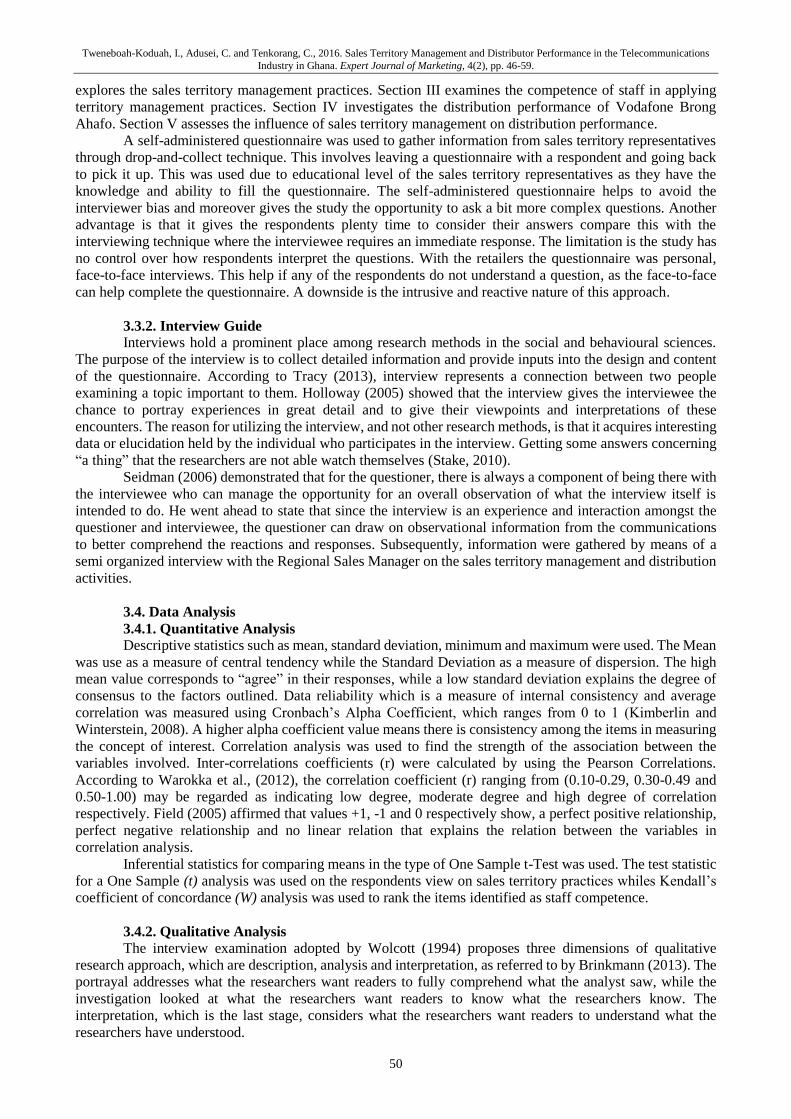
From Table 2, it can be observed that, the high mean value of 4.86 indicates that the respondents agree
that sales managers give regular feedback on their performance and by extension agree that it really improves
the management of their sales territories. More so, they also agreed that, management demarcates the sales
territory in line with the sales potentials and affirmed the Sunyani Municipal has been divided in line with the
number of calls and frequency of calls by each distributor with a mean value of (4.43). This implies that, the
establishment of the demarcation will make it easier to assess the performance of the sales territory
representatives, the key distributor and the brand performance of the SKU’s. This will improve the smooth
operational activities of the sales territory and its work area. This result aligns with Zoltners et al., (2009),
indicating that a well-design sales territory must be able to serve both the existing and the potential customers.
Table 2. Coefficient of Concordance (W), mean and standard deviation on sales territory management practices
Sales territory management practices Mean Standard
deviation Ranking
Sunyani Metropolitan is divided into approximately equal segments based on
sales potentials for sales territory demarcation
4.43 .535 3rd
Sunyani Metropolitan was divided based on the number of calls and the
frequency of calls each distributor makes
4.43 .535 3rd
The management has set a fixed route for field retailers to use in marketing
products to customers at sales zones
4.29 .488 4th
The management has not set any fixed route for field retailers to use in
marketing products to customers at sales zones
2.43 1.813 7th
The sales management give you feedback regularly on your performance 4.86 .378 1st
The sales management motivate well-performing distributor every month 4.14 1.069 5th
Distributors are assigned to a territory based on the product they market and the
potential customers within the territory
4.29 1.113 2nd
During territory assignment, distributors are assigned to specific class or group
of customers (accounts) having their numbers and addresses
3.00 1.633 6th
Source: Field Survey, 2016
Notes: Coefficient of concordance (W) = 0.655 (65.5%), Cronbach’s Alpha = 0.904, number of items=8.
On the other hand, the low mean value of 2.43 is an indication that, the respondents disagree that
management has not set any fixed route for sales agents to use in marketing products to customers at sales
zones. This shows that there is an agreement that there is some form of demarcation for the sales agents. The
mean value of (3.00) was the second least of the eight items, though above the total mean of (2.50) also
indicates that the respondents agree that during territory assignment, distributors are assigned to specific class
or group of customers (accounts) having their numbers and addresses to be served with the company products
and services. The finding is in agreement with Jobber and Lancaster (2009) suggesting than distributors must
receive a geographical area to work in and make sure it is resourced to do the right thing. Viardot (2004)
advised that feedback from sales managers to salesmen help to shape their behavioural attitude on the job. The
result confirmed the study of Viardot (2004).
The study identified eight main issues on sales territory management practices as shown in Table 2.
The respondents were asked to rank these issues on their territory organisation and performance and the result
of the ranking is presented in Table 2. The F tests for degree of agreement or concordance (W) between the
rankings of the effects with regards to sales territory management practices by the respondents is (65.5%)
which is above the average. The results show that the existence of managers giving regular feedback on sales
territory representatives performance has enhance best practice of the organization of the sales operations as it
was ranked first. Moreover, assigning a distributor to a territory based on the product they market and the
potential customers within the territory was ranked second by the respondents as it makes route to the market
shorter which has the potential to ensure visibility and availability of products and services. Those that were
important, but did not exhibit aid to effective sales management practices, were territory assignment, where
distributors are assigned to specific class or group of customers (accounts) having their numbers and addresses
during territory assignments and management has not set any fixed route for field retailers to use in marketing
products to customers at sales zones, were ranked sixth and seventh, respectively.
Tweneboah-Koduah, I., Adusei, C. and Tenkorang, C., 2016. Sales Territory Management and Distributor Performance in the Telecommunications
Industry in Ghana. Expert Journal of Marketing, 4(2), pp. 46-59.
52
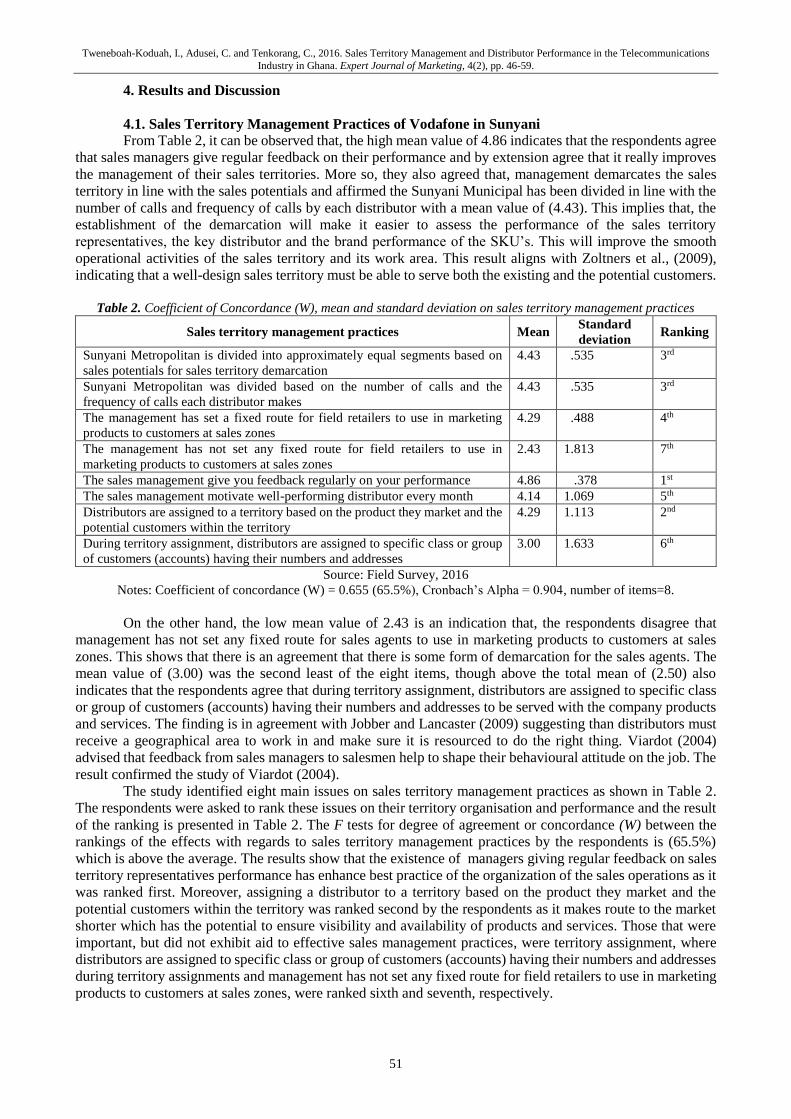
4.2 The Competencies of Staff in Applying Vodafone Territory Management Practices in
Sunyani Table 3. One Sample Statistics
Aspects on Staff competence N Mean SD Std. Error
Mean
Competent in demarcating sales territories and assigning distributors 7 4.43 .535 .202
Supervision of sales force is effective 7 4.71 .488 .184
Supervisors and/or sales managers are quick at identifying new product and
market opportunities
7 4.71 .488 .184
Sales managers react promptly to threats or opportunities from competitors 7 4.00 1.414 .535
The pricing of products are affordable 7 4.43 .787 .297
Sales expectations and monitoring of your performance with feedback are given
by managers
7 4.43 .535 .202
Formal educational qualification makes you more competent to deal with territory
issues
7 4.43 .535 .202
Professional qualification enhances competency and improves territory
performance
7 4.00 1.414 .535
Source: Fieldwork data, 2016, Cronbanch’s Alpha = .908
As indicated in Table 3, two of the factors had mean agreement scores that were significantly different
from the point of indifference, the agreement of the two factors were critical in the staff competence in
managing the sales territory. These included the effectiveness of supervision of sales force (mean = 4.71) (SD
= .488) and managers ability to spot market opportunities (mean = 4.71) (SD = .488). By implication, this
finding as shown in the results suggests that supervision of the sales force within the territories are more
important than the knowledge alone, supervision indeed put the sales territory representatives on their toes to
deliver and also helps to identifying issues early within the specific sales territory. This seems to agree with
postulations of Jobber and Lancaster (2009) that there should be some level of control mechanism to monitor
field work activities of salesmen.
The least significant were acquiring professional qualification and sales managers reacting promptly
to threat or opportunities from competitors, respectively, with mean = 4.00 and SD = 1.414. On the basis of
the field data, having a professional qualification is an added advantage but not a requirement to be competent
in managing a sales territory. The professionalism brings to bear especially on ethical issues where the
knowledge level and appreciation of ethical selling will be paramount. Though the sales manager’s ability to
react promptly to competitors is encouraging, it will also be important for the company to be more proactive
as it makes good use of resources wisely and timely, rather than reactively. This is in line with Piercy and Lane
(2009) who emphasize on the need of effective customer service skills and customer relationships with both
distributors and retailers. This means the competencies of the sales territory representatives must be brought
up in the field. Table 4. One Sample Test
Test Value = 0
Aspects on Staff competence t df Sig (2-
tailed)
Mean
Difference
95% confidence
interval of the
difference
Lower Upper
Competent in demarcating sales territories and
assigning distributors
21.920 6 0.000 4.429 3.93 4.92
Supervision of sales force is effective 25.562 6 0.000 4.714 4.26 5.17
Supervisors and/or sales managers are quick at
identifying new product and market opportunities.
25.562 6 0.000 4.714 4.26 5.17
Sales managers react promptly to threats or
opportunities from competitors
7.483 6 0.000 4.000 2.69 5.31
The pricing of products are affordable 14.892 6 0.000 4.429 3.70 5.16
Sales expectations and monitoring of your
performance with feedback are given by managers
21.920 6 0.000 4.429 3.93 4.92
Formal educational qualification makes you more
competent to deal with territory issues
21.920 6 0.000 4.429 3.93 4.92
Professional qualification enhances competency and
improves territory performance
7.483 6 0.000 4.000 2.69 5.31
Source: Fieldwork, 2016
Tweneboah-Koduah, I., Adusei, C. and Tenkorang, C., 2016. Sales Territory Management and Distributor Performance in the Telecommunications
Industry in Ghana. Expert Journal of Marketing, 4(2), pp. 46-59.
53
The study identified seven factors under the aspects attached to staff competence as presented in Table
4, using One Sample t-Test to analyse them. The positive t value of all the factors (21.920, 25.562, 25.562,
7.483, 14.892, 21.920 and 7.483) respectively for demarcating sales territory, supervision of sales men,
managers reaction to competition, pricing of products, monitoring of performance, formal education and
professional qualification. The p-value from this statistic is 0.000 and that is less than 0.05 (the level of
significance for the test). Since p < 0.05, the result rejects the null hypothesis that the sample mean is equal to
the hypothesis population mean and conclude that all the seven factors are statistically significantly different
than the average. Based on the result it can be said that aspects of staff competence in managing sales territories
of Vodafone is crucial in improving and effectively help the territory performance in the area.
4.3. The Distribution Performance of Vodafone in Sunyani
In this section, we explore excerpts from the interview with the Regional Sales Manager (RSM).
When asked about the main responsibilities of the distributor, the RSM said that: “The Key Distributor
is responsible for the: achievement of the regional airtime and revenue target, Sim Cards target for the region,
Distributors Key Performance Indicators (KPI’s) are coverage, availability of airtime and Sim cards; and
achievement of distribution logistics target like required number of motor bikes, DSA, Distribution
management system, phones, required number of shops in the region. Appointing a distributor means that a
company is delegating its business and commitment to customers in the delivery of good services in the hands
of the distributor, hence good service to the customers is a plus, but the consequences are also possible if the
distributor fall short of the requirements. It is imperative that Vodafone make the responsibilities of the
distributors clearer in both quantitative and qualitative to them for its achievement. This is in support of the
Regional Sales Manager response to the question. According to Farris et al. (2006), performance standards can
be done in two forms as quantitative and qualitative. They went on to say that this will serve as an indicator
for the distributors as it is aligned to the responsibilities of the distributors as part of best practices, to make
sure the right thing is done.
In response to the question “Does Vodafone give specific areas to key distributors within which to
operate?”, the RSM indicated with an emphatic ‘yes’ that “each distributor is assigned to a region or part of
a region”. Assigning a distributor to a specific sales area makes it easier for a company to monitor performance
related issues, via the distributor targets in alignment with the potential of the sales territory. Moreover, it
improves communication and coordination whenever there is an issue in the territory. It is not enough to select
a distributor and assign him/her a sales territory area, more importantly it is the duty of the Regional Sales
Manager on behalf of the company in question to check if the distributor(s) have the logistics and the
knowledge necessary to manage the territory. Zoltners et al. (2004) indicated the need to demarcate a territory
for the distributor, but also advised that the company in question must make sure that it does not lose control
of the field activities.
In response to setting sales targets in relation to the potential of the sales area this is what RSM has to
say: “Yes. Key distributor target are based on the potential of the area”. The sales target of the distributor is
very critical and must be set right, if it is more than the potential of the area due to certain challenges and this
becomes a disincentive to the distributor as achieving the target might be unrealistic, and on the other hand if
it is below the territory potential it means the company might be losing out in terms of sales volumes and
values which directly will affects the revenue generation and the sad thing is that competitors can take
advantages of this. If the company has one regional distributor then his/her target is the same as the RSM’s
target, on the other hand if it has several distributors, then the combinations of the distributors are same as the
RSM’s target. The RSM response supports what the literature states about sales targets, several authors such
as Rogers (2007), Simpkins (2004), Kotler and Keller (2012), Donaldson (2007) and Blythe (2005) have
mentioned the importance of setting sales targets and their achievements.
On the assessment of the distributor performance the RSM said that “Vodafone uses actual purchases
of the distributor against revenue of the area, trade audit and the utilization of the Distribution Management
System”. One of the ways to assess distributor performance in relation to target(s) is in the form of sales volume
or value, and in some cases profit contribution to the business. Sales volume or value and maybe both are
normally used to set sales targets for individual salesperson or distributor(s) according to Farris et al. (2006).
This is in alignment with RSM’s response to the question on assessing the performance of distributors where
it was recorded that they use trade audits and distributor offtake(s) against achievement. Jobber and Lancaster
(2009) emphasize that a high level of understanding of the process of sales forecasting and the techniques used
to assesses distributors must be acquired and used effectively to function as a modern sales manager.
The RSM indicated when asked about Vodafone support for Key distributors to improve performance,
“Vodafone supports the distributor by providing some of the logistics needed such as motor bicycles for their
Tweneboah-Koduah, I., Adusei, C. and Tenkorang, C., 2016. Sales Territory Management and Distributor Performance in the Telecommunications
Industry in Ghana. Expert Journal of Marketing, 4(2), pp. 46-59.
54
sales representatives”. Appointing a distributor may relieve an organization from certain responsibilities but
not all of them. It is the responsibility of Vodafone to see their key distributor(s) as partners and support them
with tangible and non-tangible assets. Logistics is critical in the effective distribution to reach the final
consumer with goods/services. It is refreshing from the response of the Regional Sales Manager the support to
distributors such as motor bicycles; Vodafone must do more than to train the distributor’s sales representatives
on selling skills and any new developments in the trade.
On the impact of sales territory management on distribution performance, this is what the RSM
responded: “A good territory management ensures availability of stocks everywhere thereby avoiding out of
stock situations”. Territory design is one of the important organisational issues in sales management. It is a
major determinant of sales people’s opportunity to perform well. One of the essences of good territory
management is about availability and visibility of products and its closeness to the market. This result aligned
with Zoltners et al. (2004) on the relevancy of the sales territory as a marketing platform, rather than a
geographical area.
When asked about how to assess what is happening in the sales territories, this is what the RSM has
to say: “What happens in the territory is assessed by trade visit and the use of the Distribution Management
Systems (DMS) to know the Direct Sales Agents (DSAs) retail coverage and sales calls”. In practice, assessing
sales territory management is difficult but most organisations have their own way of assessing the territory
issues. The trade visit by the Regional Sales Manager is a major indicator in knowing more insight in the sales
territory. The trade visit can be in a form of interviewing the retailers on issues in trade and their responses can
give insight on the performance of the company and if possible some insight from competitor(s) activities. The
trade visit can also be accompanied by the Regional Sales Manager with the Sales Territory Representatives
to find out what they do on the field. Moreover, the Sales Territory Representatives also write weekly and
monthly reports on the activities of the territory to the Regional Sales Manager. If the report is good it can be
a market intelligence used to inform major operational decisions in specific sales territories.
4.4. Retailers Views on the Distribution Performance of Vodafone in Sunyani
This section considers the input from the trade on the perspectives of the retailers on how they see and
assess the distribution performance of Vodafone in the Sunyani Metropolitan.
4.4.1. Sales of Vodafone Products
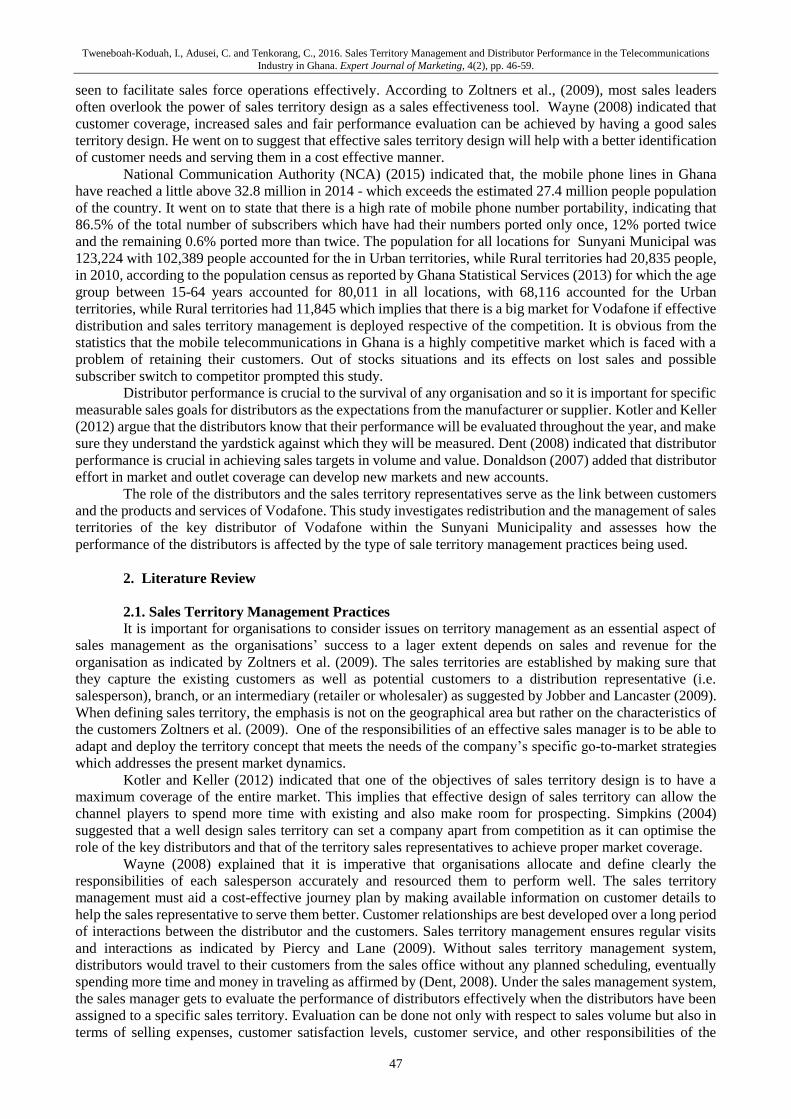
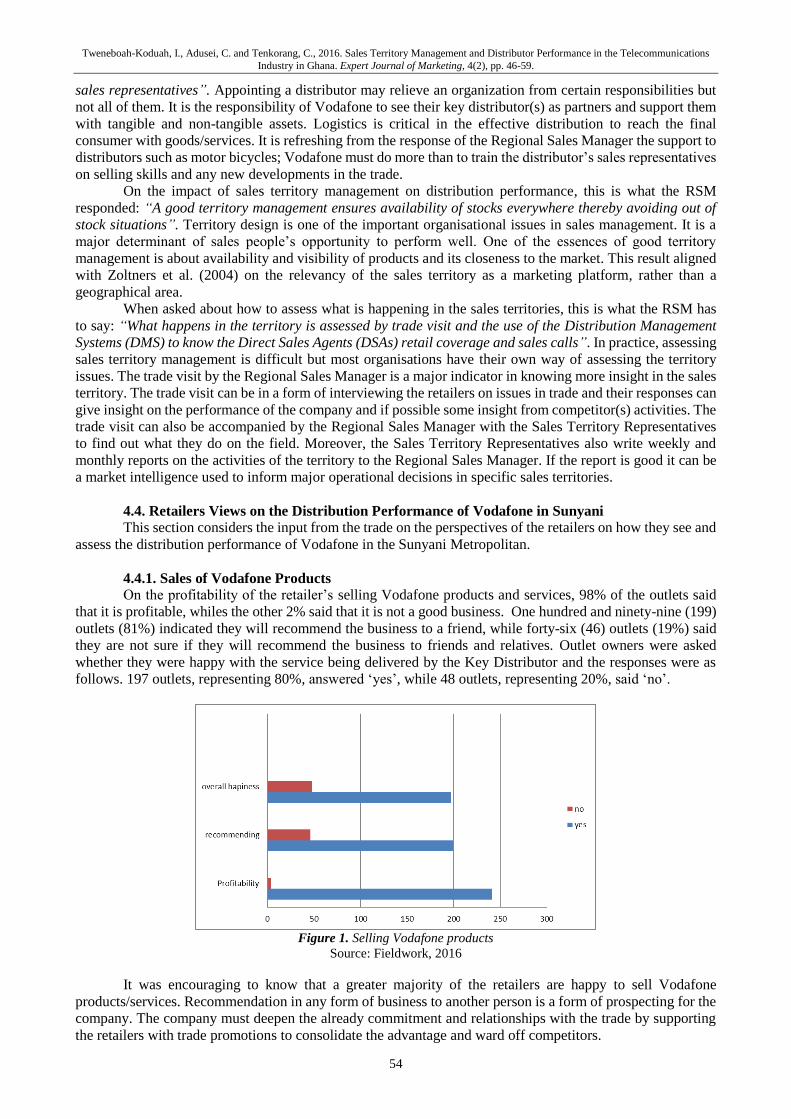
On the profitability of the retailer’s selling Vodafone products and services, 98% of the outlets said
that it is profitable, whiles the other 2% said that it is not a good business. One hundred and ninety-nine (199)
outlets (81%) indicated they will recommend the business to a friend, while forty-six (46) outlets (19%) said
they are not sure if they will recommend the business to friends and relatives. Outlet owners were asked
whether they were happy with the service being delivered by the Key Distributor and the responses were as
follows. 197 outlets, representing 80%, answered ‘yes’, while 48 outlets, representing 20%, said ‘no’.
Figure 1. Selling Vodafone products
Source: Fieldwork, 2016
It was encouraging to know that a greater majority of the retailers are happy to sell Vodafone
products/services. Recommendation in any form of business to another person is a form of prospecting for the
company. The company must deepen the already commitment and relationships with the trade by supporting
the retailers with trade promotions to consolidate the advantage and ward off competitors.
Tweneboah-Koduah, I., Adusei, C. and Tenkorang, C., 2016. Sales Territory Management and Distributor Performance in the Telecommunications
Industry in Ghana. Expert Journal of Marketing, 4(2), pp. 46-59.
55
4.4.2. Distribution of Vodafone Products
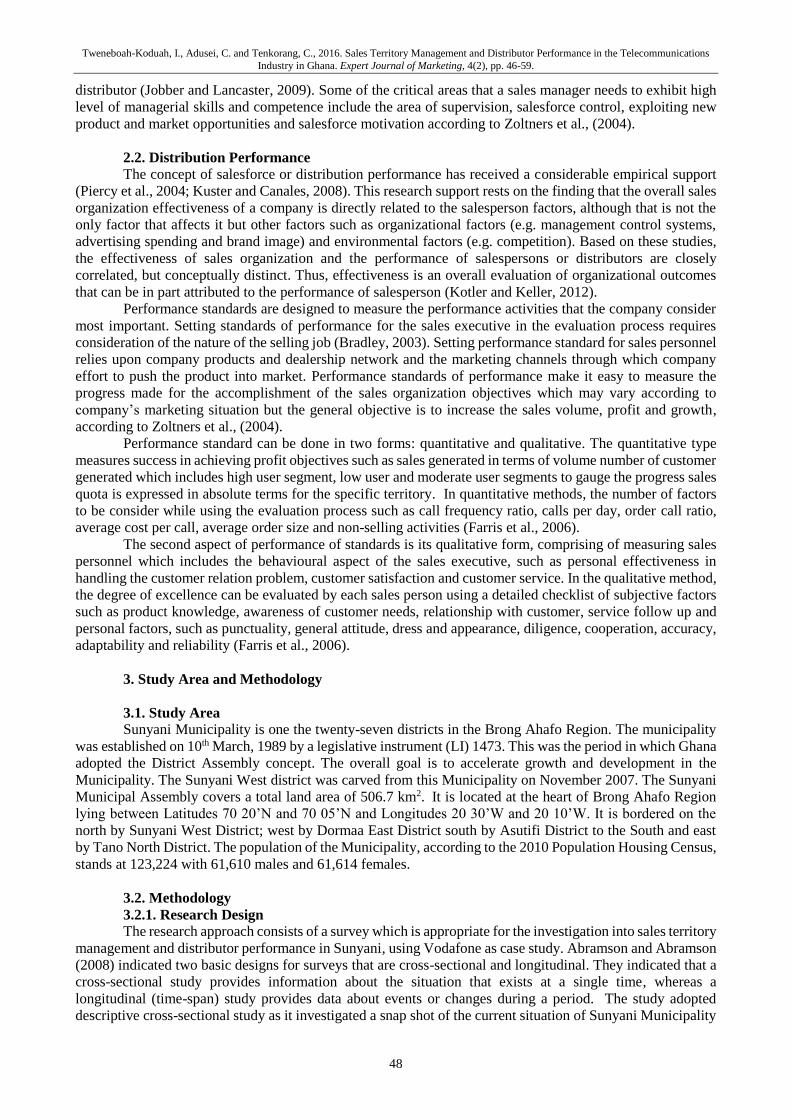
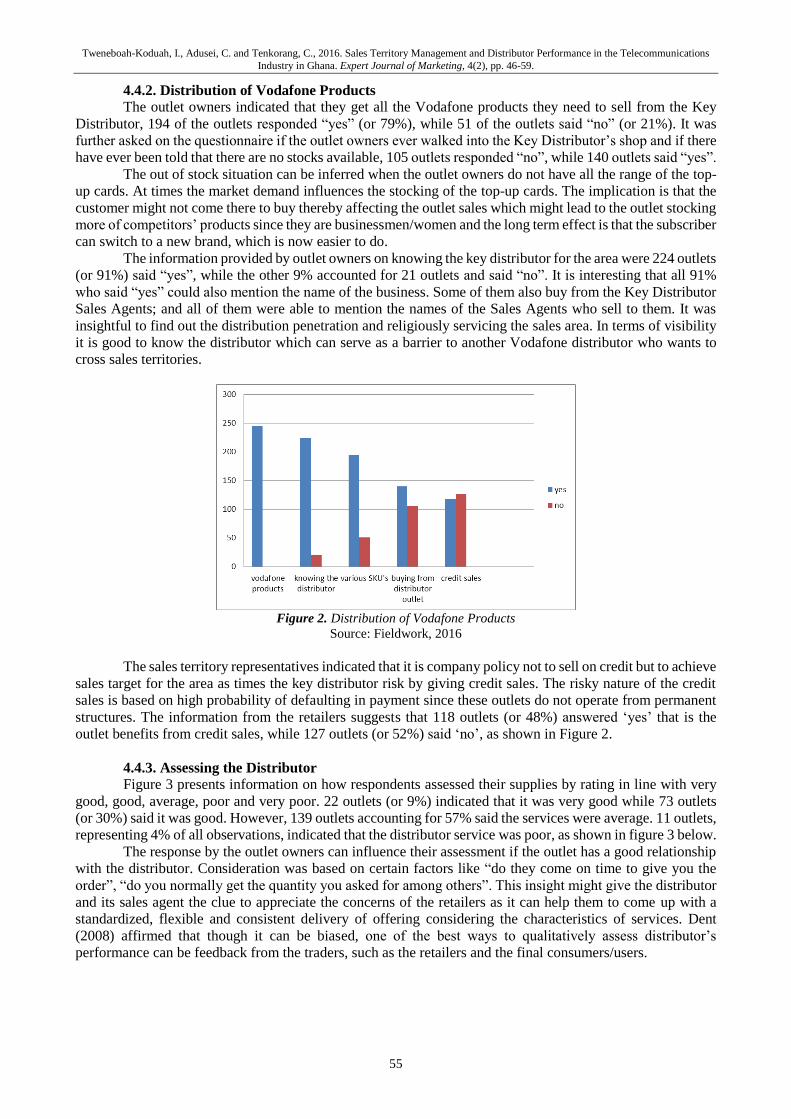
The outlet owners indicated that they get all the Vodafone products they need to sell from the Key
Distributor, 194 of the outlets responded “yes” (or 79%), while 51 of the outlets said “no” (or 21%). It was
further asked on the questionnaire if the outlet owners ever walked into the Key Distributor’s shop and if there
have ever been told that there are no stocks available, 105 outlets responded “no”, while 140 outlets said “yes”.
The out of stock situation can be inferred when the outlet owners do not have all the range of the top-
up cards. At times the market demand influences the stocking of the top-up cards. The implication is that the
customer might not come there to buy thereby affecting the outlet sales which might lead to the outlet stocking
more of competitors’ products since they are businessmen/women and the long term effect is that the subscriber
can switch to a new brand, which is now easier to do.
The information provided by outlet owners on knowing the key distributor for the area were 224 outlets
(or 91%) said “yes”, while the other 9% accounted for 21 outlets and said “no”. It is interesting that all 91%
who said “yes” could also mention the name of the business. Some of them also buy from the Key Distributor
Sales Agents; and all of them were able to mention the names of the Sales Agents who sell to them. It was
insightful to find out the distribution penetration and religiously servicing the sales area. In terms of visibility
it is good to know the distributor which can serve as a barrier to another Vodafone distributor who wants to
cross sales territories.
Figure 2. Distribution of Vodafone Products
Source: Fieldwork, 2016
The sales territory representatives indicated that it is company policy not to sell on credit but to achieve
sales target for the area as times the key distributor risk by giving credit sales. The risky nature of the credit
sales is based on high probability of defaulting in payment since these outlets do not operate from permanent
structures. The information from the retailers suggests that 118 outlets (or 48%) answered ‘yes’ that is the
outlet benefits from credit sales, while 127 outlets (or 52%) said ‘no’, as shown in Figure 2.
4.4.3. Assessing the Distributor
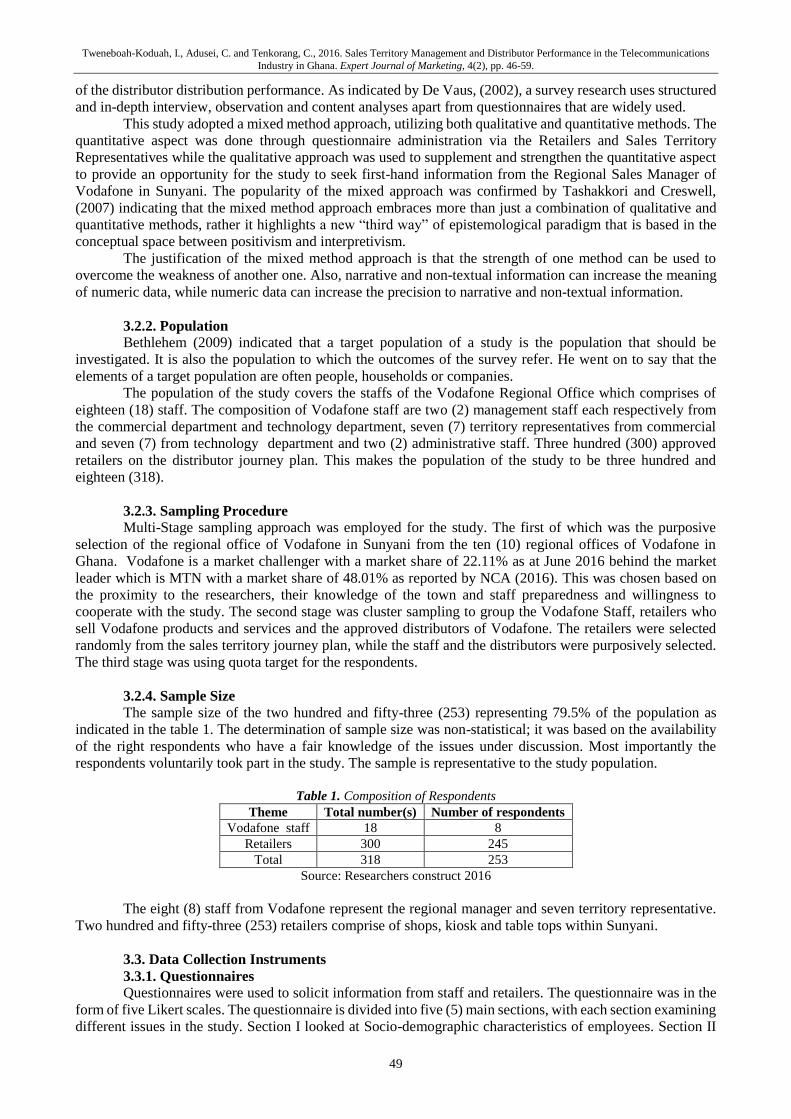
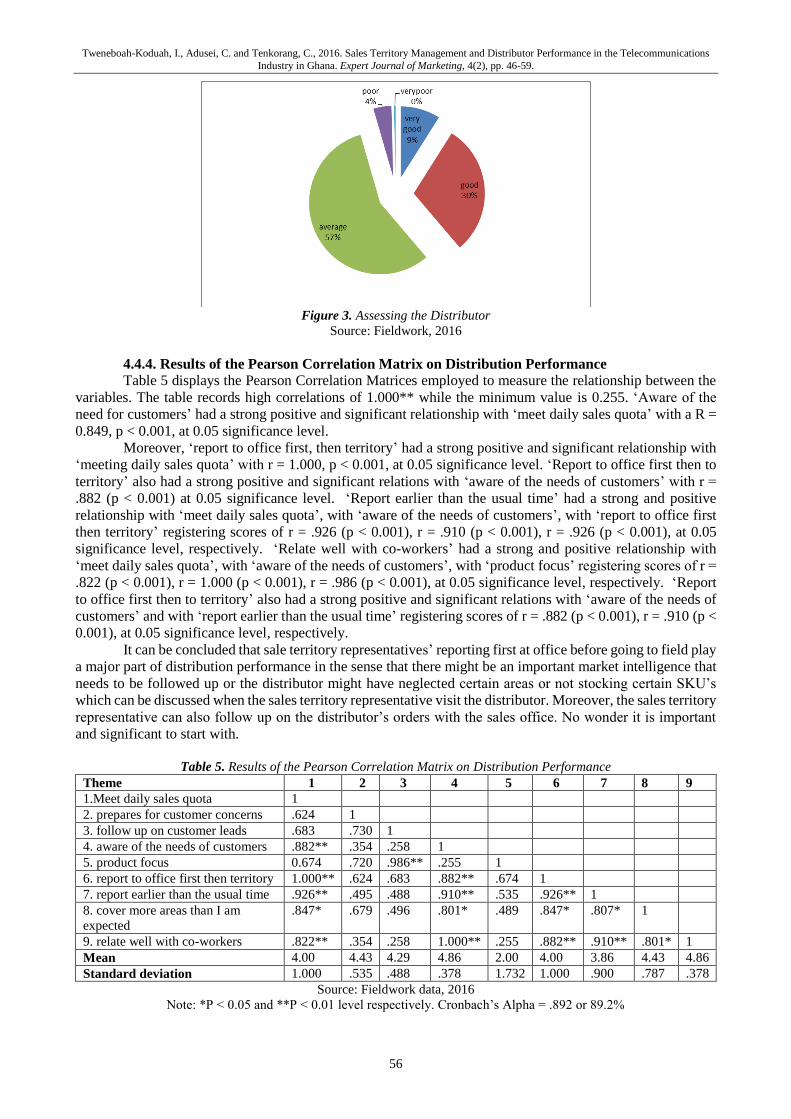
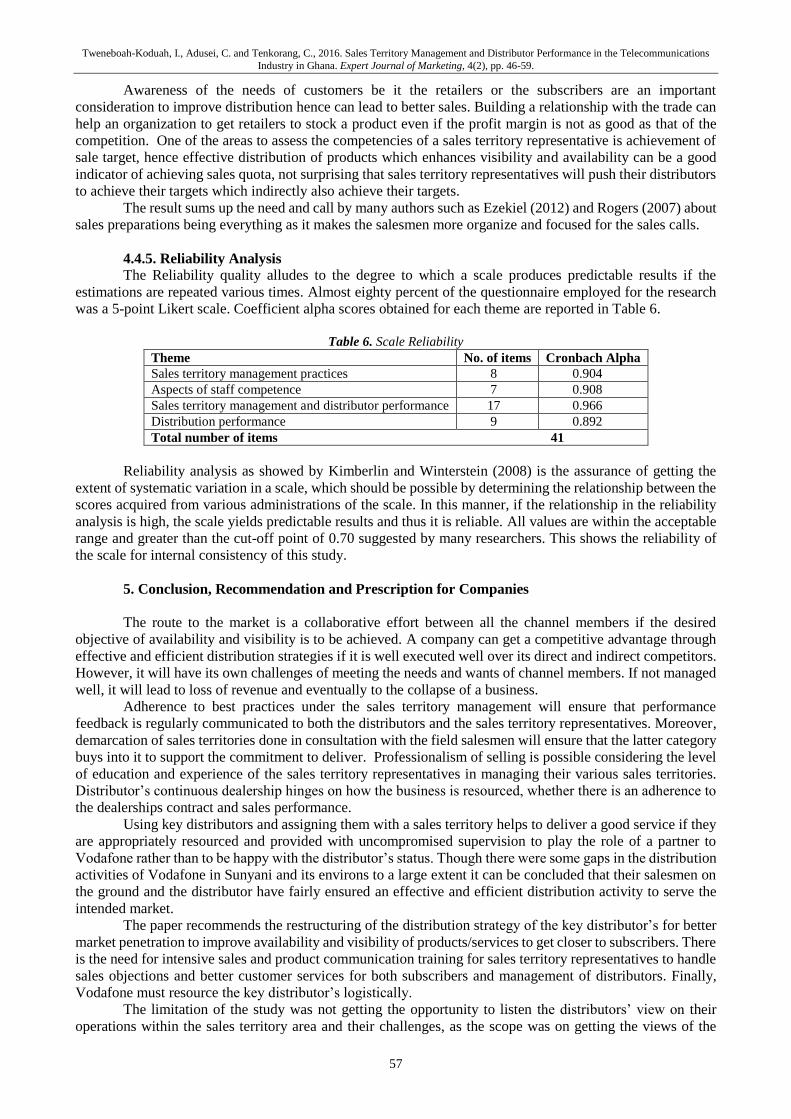
Figure 3 presents information on how respondents assessed their supplies by rating in line with very
good, good, average, poor and very poor. 22 outlets (or 9%) indicated that it was very good while 73 outlets
(or 30%) said it was good. However, 139 outlets accounting for 57% said the services were average. 11 outlets,
representing 4% of all observations, indicated that the distributor service was poor, as shown in figure 3 below.
The response by the outlet owners can influence their assessment if the outlet has a good relationship
with the distributor. Consideration was based on certain factors like “do they come on time to give you the
order”, “do you normally get the quantity you asked for among others”. This insight might give the distributor
and its sales agent the clue to appreciate the concerns of the retailers as it can help them to come up with a
standardized, flexible and consistent delivery of offering considering the characteristics of services. Dent
(2008) affirmed that though it can be biased, one of the best ways to qualitatively assess distributor’s
performance can be feedback from the traders, such as the retailers and the final consumers/users.
Tweneboah-Koduah, I., Adusei, C. and Tenkorang, C., 2016. Sales Territory Management and Distributor Performance in the Telecommunications
Industry in Ghana. Expert Journal of Marketing, 4(2), pp. 46-59.
56
Figure 3. Assessing the Distributor
Source: Fieldwork, 2016
4.4.4. Results of the Pearson Correlation Matrix on Distribution Performance
Table 5 displays the Pearson Correlation Matrices employed to measure the relationship between the
variables. The table records high correlations of 1.000** while the minimum value is 0.255. ‘Aware of the
need for customers’ had a strong positive and significant relationship with ‘meet daily sales quota’ with a R =
0.849, p < 0.001, at 0.05 significance level.
Moreover, ‘report to office first, then territory’ had a strong positive and significant relationship with
‘meeting daily sales quota’ with r = 1.000, p < 0.001, at 0.05 significance level. ‘Report to office first then to
territory’ also had a strong positive and significant relations with ‘aware of the needs of customers’ with r =
.882 (p < 0.001) at 0.05 significance level. ‘Report earlier than the usual time’ had a strong and positive
relationship with ‘meet daily sales quota’, with ‘aware of the needs of customers’, with ‘report to office first
then territory’ registering scores of r = .926 (p < 0.001), r = .910 (p < 0.001), r = .926 (p < 0.001), at 0.05
significance level, respectively. ‘Relate well with co-workers’ had a strong and positive relationship with
‘meet daily sales quota’, with ‘aware of the needs of customers’, with ‘product focus’ registering scores of r =
.822 (p < 0.001), r = 1.000 (p < 0.001), r = .986 (p < 0.001), at 0.05 significance level, respectively. ‘Report
to office first then to territory’ also had a strong positive and significant relations with ‘aware of the needs of
customers’ and with ‘report earlier than the usual time’ registering scores of r = .882 (p < 0.001), r = .910 (p <
0.001), at 0.05 significance level, respectively.
It can be concluded that sale territory representatives’ reporting first at office before going to field play
a major part of distribution performance in the sense that there might be an important market intelligence that
needs to be followed up or the distributor might have neglected certain areas or not stocking certain SKU’s
which can be discussed when the sales territory representative visit the distributor. Moreover, the sales territory
representative can also follow up on the distributor’s orders with the sales office. No wonder it is important
and significant to start with.
Table 5. Results of the Pearson Correlation Matrix on Distribution Performance
Theme 1 2 3 4 5 6 7 8 9
1.Meet daily sales quota 1
2. prepares for customer concerns .624 1
3. follow up on customer leads .683 .730 1
4. aware of the needs of customers .882** .354 .258 1
5. product focus 0.674 .720 .986** .255 1
6. report to office first then territory 1.000** .624 .683 .882** .674 1
7. report earlier than the usual time .926** .495 .488 .910** .535 .926** 1
8. cover more areas than I am
expected
.847* .679 .496 .801* .489 .847* .807* 1
9. relate well with co-workers .822** .354 .258 1.000** .255 .882** .910** .801* 1
Mean 4.00 4.43 4.29 4.86 2.00 4.00 3.86 4.43 4.86
Standard deviation 1.000 .535 .488 .378 1.732 1.000 .900 .787 .378
Source: Fieldwork data, 2016
Note: *P < 0.05 and **P < 0.01 level respectively. Cronbach’s Alpha = .892 or 89.2%
Tweneboah-Koduah, I., Adusei, C. and Tenkorang, C., 2016. Sales Territory Management and Distributor Performance in the Telecommunications
Industry in Ghana. Expert Journal of Marketing, 4(2), pp. 46-59.
57
Awareness of the needs of customers be it the retailers or the subscribers are an important
consideration to improve distribution hence can lead to better sales. Building a relationship with the trade can
help an organization to get retailers to stock a product even if the profit margin is not as good as that of the
competition. One of the areas to assess the competencies of a sales territory representative is achievement of
sale target, hence effective distribution of products which enhances visibility and availability can be a good
indicator of achieving sales quota, not surprising that sales territory representatives will push their distributors
to achieve their targets which indirectly also achieve their targets.
The result sums up the need and call by many authors such as Ezekiel (2012) and Rogers (2007) about
sales preparations being everything as it makes the salesmen more organize and focused for the sales calls.
4.4.5. Reliability Analysis
The Reliability quality alludes to the degree to which a scale produces predictable results if the
estimations are repeated various times. Almost eighty percent of the questionnaire employed for the research
was a 5-point Likert scale. Coefficient alpha scores obtained for each theme are reported in Table 6.
Table 6. Scale Reliability
Theme No. of items Cronbach Alpha
Sales territory management practices 8 0.904
Aspects of staff competence 7 0.908
Sales territory management and distributor performance 17 0.966
Distribution performance 9 0.892
Total number of items 41
Reliability analysis as showed by Kimberlin and Winterstein (2008) is the assurance of getting the
extent of systematic variation in a scale, which should be possible by determining the relationship between the
scores acquired from various administrations of the scale. In this manner, if the relationship in the reliability
analysis is high, the scale yields predictable results and thus it is reliable. All values are within the acceptable
range and greater than the cut-off point of 0.70 suggested by many researchers. This shows the reliability of
the scale for internal consistency of this study.
5. Conclusion, Recommendation and Prescription for Companies
The route to the market is a collaborative effort between all the channel members if the desired
objective of availability and visibility is to be achieved. A company can get a competitive advantage through
effective and efficient distribution strategies if it is well executed well over its direct and indirect competitors.
However, it will have its own challenges of meeting the needs and wants of channel members. If not managed
well, it will lead to loss of revenue and eventually to the collapse of a business.
Adherence to best practices under the sales territory management will ensure that performance
feedback is regularly communicated to both the distributors and the sales territory representatives. Moreover,
demarcation of sales territories done in consultation with the field salesmen will ensure that the latter category
buys into it to support the commitment to deliver. Professionalism of selling is possible considering the level
of education and experience of the sales territory representatives in managing their various sales territories.
Distributor’s continuous dealership hinges on how the business is resourced, whether there is an adherence to
the dealerships contract and sales performance.
Using key distributors and assigning them with a sales territory helps to deliver a good service if they
are appropriately resourced and provided with uncompromised supervision to play the role of a partner to
Vodafone rather than to be happy with the distributor’s status. Though there were some gaps in the distribution
activities of Vodafone in Sunyani and its environs to a large extent it can be concluded that their salesmen on
the ground and the distributor have fairly ensured an effective and efficient distribution activity to serve the
intended market.
The paper recommends the restructuring of the distribution strategy of the key distributor’s for better
market penetration to improve availability and visibility of products/services to get closer to subscribers. There
is the need for intensive sales and product communication training for sales territory representatives to handle
sales objections and better customer services for both subscribers and management of distributors. Finally,
Vodafone must resource the key distributor’s logistically.
The limitation of the study was not getting the opportunity to listen the distributors’ view on their
operations within the sales territory area and their challenges, as the scope was on getting the views of the
Tweneboah-Koduah, I., Adusei, C. and Tenkorang, C., 2016. Sales Territory Management and Distributor Performance in the Telecommunications
Industry in Ghana. Expert Journal of Marketing, 4(2), pp. 46-59.
58
subscribers. This study offers future research suggestions namely subsequent studies could look at individual
sales territory performance on the sales territory representatives and the distributors based on key performance
indicators.
For products or services to be successful in the marketplace, they must be available where customers
want to buy them and how customers want to use them. Channel management has become one of the most
important components of a firm’s competitive strategy, with mistakes often costing companies millions and
channel managers their careers. Using distributors as a route to the market has been in the surge for many
companies that producers good and services. Care must be taken to get the best out of distributors that will not
dilute the distribution strategy. Understanding the existing channels structures and performance is the first step
in improving its effectiveness. The study prescribes generic practices that will aid better relationships and
integration of mutual benefits between companies and their distributors:
- There is the need for a very clear understanding of the roles, responsibilities and clearer key
performance indicators on how and when they will be measured for the distributor and the company.
- A more productive partnership between the distributor and the company requires an effective
communication on regular basis. Moreover, companies must see their distributors as partners in the
achievement of their business goals such as market coverage and sales.
- Distributor’s incentives must be planned and structured and tied-in to how much of the different ranges
of specific SKUs (Stock Keeping Units) are sold within a determined time frame.
- The staff who are involved in the distribution activities must be trained on the requirement of good
distribution practices to acquire the appropriate competence and experience prior to commencing their
task.
- Monitoring and review of the performance of the key distributors and the identification and
implementation of any required improvements on a regular basis.
References
Abramson, J.H. and Abramson, Z.H., 2008. Research Methods in Community Medicine: Surveys, Epidemiological
Research, Programme Evaluation, Clinical Trials. 6th Edition. West Sussex: John Wiley and Sons Limited.
Bethlehem, J., 2009. Applied Survey Methods: A Statistical Perspective. New York: John Wiley and Sons, Inc.
Blythe, J., 2005. Essentials of Marketing. 3rd Edition. Harlow, England: FT Prentice Hall.
Bradley, F., 2003. Strategic Marketing in the Customer driven organization. John Wiley and Sons Inc. West
Sussex.
Brinkmann, S., 2013. Qualitative Interviewing: Understanding Qualitative Research. Oxford, UK: Oxford
University Press.
Dent, J., 2008. Distribution Channels: Understanding and Managing Channels to Market. London: Kogan
Page.
De Vaus, D.A., 2002. Surveys in Social Research. 5th Edition. Crows Nest: Allen and Unwin.
Donaldson, B., 2007. Sales Management: Principles, Process and Practice. 3rd Edition. New York: Palgrave
Macmillan.
Ezekiel, H., 2012. Salesperson competitive intelligence and performance: the role of product knowledge and
salesforce automation usage. Industrial Marketing Management.43, pp.136-145. doi:
10.1016/j.indmarman.2013.08.005
Farris, P.W., Bendle, N.T., Pfeifer, P. and Reibstein, D.J., 2006. Marketing Metrics: 50+ Metrics Every
Executive Should Master. New Jersey: Wharton School Publishing.
Field, A., 2005. Discovering Statistics using SPSS, 2nd Edition. London: SAGE Publication.
Ghana Statistical Services, 2013. 2010 Population and Housing Census. National Analytical Report. Accra:
Ghana Statistical Service.
Holloway, T., 2005. Qualitative Research in Health Care. Berkshire: Open University Press.
Jobber, D. and Lancaster, G., 2009. Selling and Sales Management. 8th Edition. Harlow, UK: FT Prentice
Hall.
Kimberlin, C.I. and Winsterstein, A.G., 2008. Validity and Reliability of Measurement Instruments used in
research. American Journal of Health-System Pharmacy, 65(23), pp. 2276-2284. doi:
10.2146/ajhp070364
Kotler, P. and Keller, K.L., 2012. Marketing Management, 14th Edition. New Jersey: Pearson, Prentice Hall.
Kuster, I. and Canales, P., 2008. Some determinants of salesforce effectiveness. Team Performance
Management, International Journal. 14, pp.296-326. doi: 10.1108/13527590810912304
Tweneboah-Koduah, I., Adusei, C. and Tenkorang, C., 2016. Sales Territory Management and Distributor Performance in the Telecommunications
Industry in Ghana. Expert Journal of Marketing, 4(2), pp. 46-59.
59
National Communications Authority, 2016. Industry Information – Telecom Subscriptions for June 2016.
Accra, Ghana: National Communications Authority.
National Communications Authority, 2015. Mobile Number Portability in Ghana Passes 2million. Accra,
Ghana: National Communications Authority.
Piercy, N.F. and Lane, N., 2009. Strategic Customer Management: Strategizing the sales organization. New
York: Oxford University Press.
Piercy, N.F., Cravens, D.W. and Low, G.S., 2004. Examining the effectiveness of sales management control
practices in developing countries. Journal of World Business, 39, pp.255-267. doi:
10.1016/j.jwb.2004.04.005
Rogers, B., 2007. Rethinking Sales Management: Strategic guide for practitioners. Hoboken, NJ: John Wiley
and Sons Limited.
Seidman, I., 2006. Interviewing as Qualitative Research: A Guide for Researchers in Education and the Social
Sciences. 3rd Edition. New York: Teachers College Press.
Simpkins, R.A., 2004. The Secrets of Great Sales Management: Advanced strategies for maximizing
performance. New York: AMACOM.
Stake, R.E., 2010. Qualitative Research Studying How Things Work. New York: The Guilford Press.
Tashakkori, A. and Creswell, J. W., 2007. The new era of mixed methods, Journal of Mixed Methods, 1(1),
pp.3-7. doi: 10.1177/2345678906293042
Tracy, S. J., 2013. Qualitative Research Methods: Collecting Evidence, Crafting Analysis, Communicating Impact.
West Sussex: Wiley-Blackwell.
Viardot, E., 2004. Successful Marketing Strategy for High-Tech Firms. 3rd Edition. Boston: Artech House.
Warokka, A., Gallato, C.G. and Moorthy, T., 2012. Organizational Justice in Performance Appraisal System and
Work Performance: Evidence from an Emerging Market. Journal of Human Resources Management
Research. Vol. 2012, pp. 1-18. doi: 10.5171/2012.159467
Wayne, M.T. 2008. The Sales Manager’s Success Manual. New York: AMACOM.
Zoltners, A.A., Sinha, P. and Lorimer, S.E., 2009. Building a winning sales force: powerful strategies for driving
high performance. New York: AMACOM.
Zoltners, A.A., Sinha, P. and Lorimer, S.E., 2004. Sales force design for strategic advantage. New York:
AMACOM.