Embed Size (px)
Citation preview
Satellite earth observation supports assessment of global climate change impacts on Asia-Pacific environmentEko SISWANTO 1*, Shin NAGAI 1, Kazuhito ICHII 2, Latifur R. SARKER 3, Anukul BURANAPRATHEPRAT 4, and Jonson L. GAOL 5, 1 Japan Agency for Marine-Earth Science and Technology (JAMSTEC), Japan; 2 Chiba University, Japan; 3 Rajshahi University, Bangladesh; 4 Burapha
University, Thailand; 5 IPB University, Indonesia; * Corresponding author. Email: [email protected]; Tel.: +81 45 778 5268; Address: 3173-25,
Showa-machi, Kanazawa-ku, Yokohama, Kanagawa, 236-0001 Japan
Earth observation for science, policy and practice:Cases from the Asia-Pacific regionA poster presented at the Earth Information Day, UNFCCC COP 25, December 2019
@APNGCR
www.facebook.com/APNGCR
www.apn-gcr.org
ContaCt: APN Secretariat, East Building, 4F, 1-5-2 Wakinohama Kaigan Dori, Chuo-ku, Kobe 651-0073 Japan. Tel : +81-78-230-8017, Fax: +81-78-230-8018, Email: [email protected]
about this projeCt
©2019 Asia-Pacific Network for Global Change Research (APN). APN is an intergovernmental network of 22 countries working towards pursuing an Asia-Pacific region that is successfully address-ing the challenges of global change and sustainability. Since its establishment in 1996, APN has provided funding support of over USD 30 million to more than 500 projects, a majority of which were led by researchers and practitioners from developing countries in the Asia-Pacific region. APN contributes to UNFCCC activities through its active participation in Subsidiary Body for Scientific and Technological Advice (SBSTA), including the Nairobi Work Programme (NWP) and the International Warsaw Mechanism; and support for capacity building in its member countries related to Nationally Determined Contributions (NDCs) under the Paris Agreement. This poster is prepared for the Earth Information Day at UNFCCC COP 25 under the theme “Earth observation for science, policy and practice: retooling global cooperation to respond to future climate risk”.
The main aims of the project are to generate satel-lite-based oceanic and terrestrial low-trophic level organisms and utilize them to assess the Earth's sur-face biological responses to global climate changes. The land and ocean environments within the region expanding from the eastern Indian Ocean to the west-ern North Pacific Ocean were selected as the project target areas because their geographic locations make them vulnerable to climatic perturbations.
The project has been generating terrestrial and oceanic low-trophic level organism databases (such as phyto-plankton, vegetation, etc.) which can be accessed from the LowTroMAP database website: https://ebcrpa.jamstec.go.jp/rcgc/e/APN/index.htm.The project has also produced many scientific papers mainly describ-ing the impacts of climate change on the low-trophic level organism spatiotemporal variability.
The Paris Agreement (PA) was signed to combat climate change or global warming by accelerating the actions needed for a sustainable low carbon future. Long-term Earth’s surface temperature monitoring, climate change impact assessment and impact mitigation, atmospheric carbon sink/sequestration estimations are among sev-eral crucial issues addressed by the PA necessary to combat climate change. Dealing with those crucial issues requires long-term, routine, and large-scale observations. Earth observations with rapid, synoptic, routine, and global observing systems are thus playing an important role in supporting the implementation of the PA.
Earth observation big data will be useful/valuable if they can be accessed universally. For that, it is necessary to strengthen the management of data resources and improve the Earth observation big data-sharing platform for an effective sharing of big data and access to the data repository.
Earth system models develop complex ecological pro-cesses dealing with many types of input/output infor-mation that may have large uncertainty and thus need to be validated and improved utilizing more consistent datasets. The Earth observation big data that store vari-ous types of Earth surface environmental variables over a long-term period and at global scales with consistent acquisition, provide a valuable reference based on which the Earth system models can be validated and improved. The long-term period of big data availability and real-time acquisition also allows for the Earth system models to predict the climate status several months in advance, thus supporting local/regional decision making for cli-mate change mitigation.
Figure 1. Target area of the project (CAF2017-RR02-CMY-Siswanto), showing annual means of marine phytoplankton chlorophyll-a concentration (Chl-a, mg m-3) and normalized difference vegetation index (NDVI).
Figure 2. Map of correlation between Niño3.4 and low-trophic level organism variable. Niño3.4 is an index for El Niño/Southern Oscillation climate variation. The low-trophic level organism in the ocean and land domains are represented by phytoplankton chlorophyll-a concentration (Chl-a, mg m-3) and normalized difference vegetation index (NDVI), respectively. Red (blue) color indicates that the low-trophic level organism will tend to increase (decrease) during El Niño years.
Figure 3. Map of correlation between Dipole Mode Index (DMI) and low-trophic level organism variable. DMI is an index for Indian Ocean Dipole climate variation. The low-trophic level organism in the ocean and land domains are represented by phytoplankton chlorophyll-a concentration (Chl-a, mg m-3) and normalized difference vegetation index (NDVI), respectively. Red (blue) color indicates that the low-trophic level organism will tend to increase (decrease) during positive Indian Ocean Dipole years.
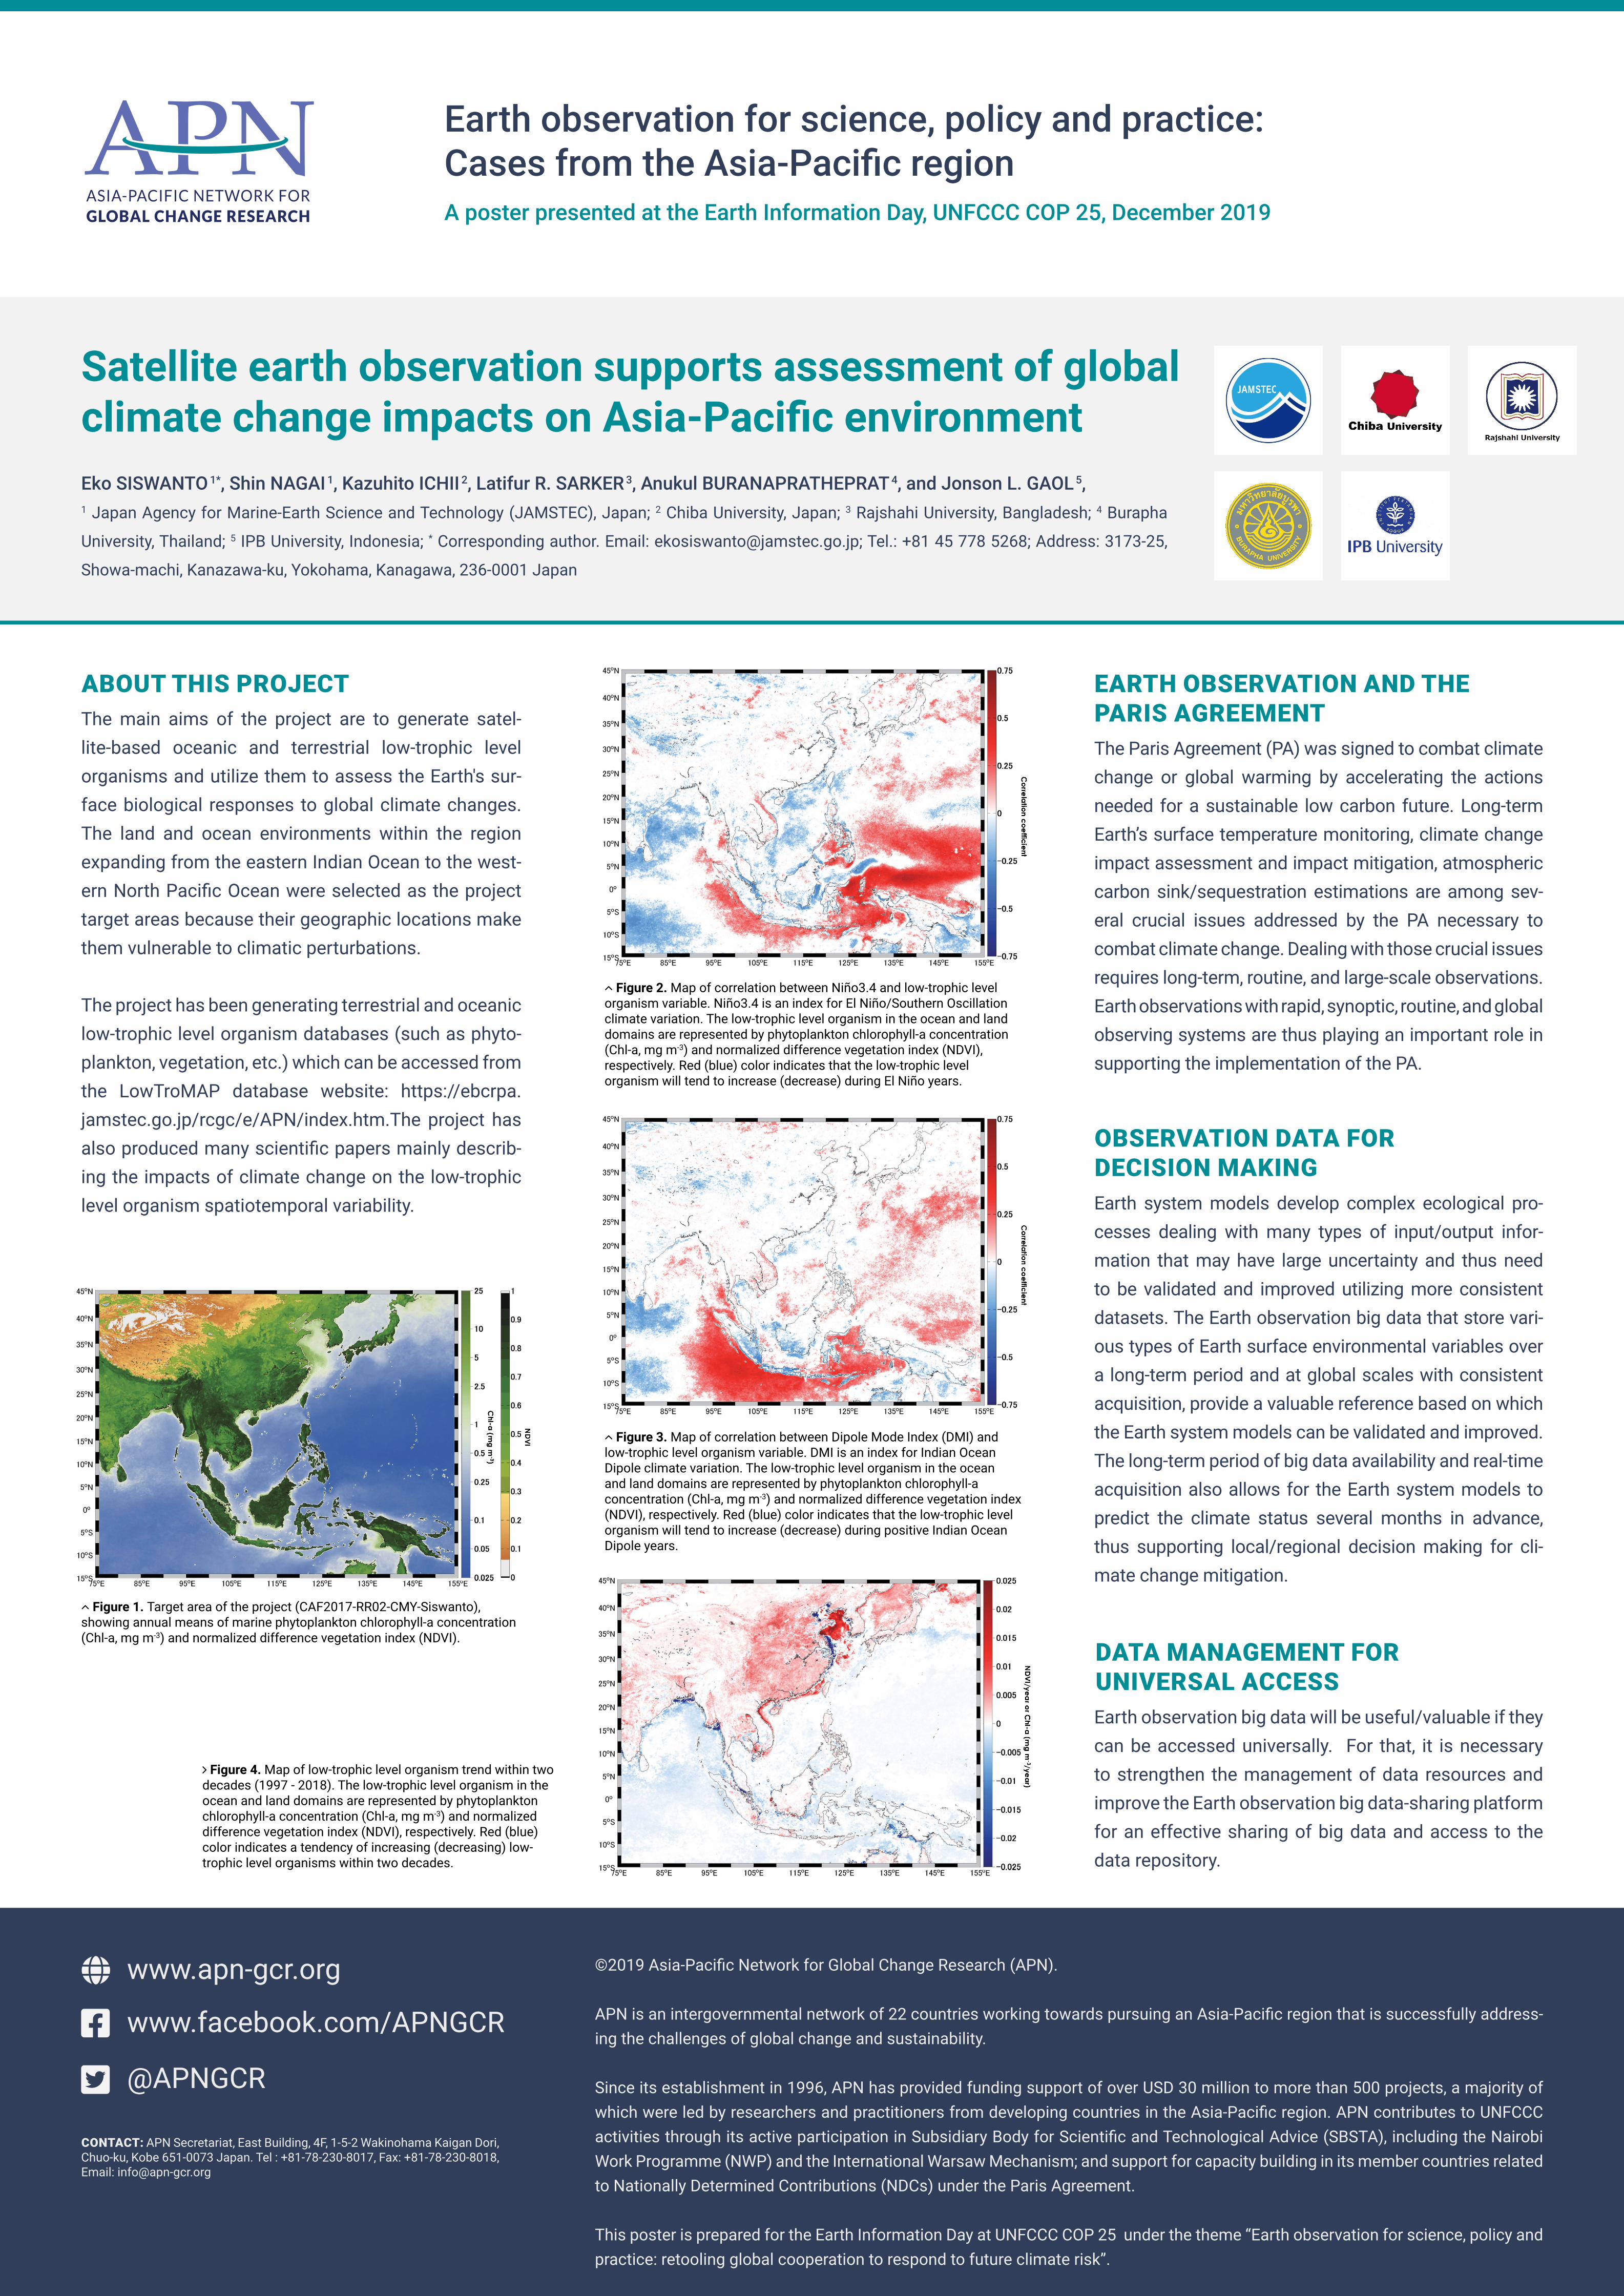
Figure 4. Map of low-trophic level organism trend within two decades (1997 - 2018). The low-trophic level organism in the ocean and land domains are represented by phytoplankton chlorophyll-a concentration (Chl-a, mg m-3) and normalized difference vegetation index (NDVI), respectively. Red (blue) color indicates a tendency of increasing (decreasing) low-trophic level organisms within two decades.
earth observation and the paris agreement
observation data for deCision making
data management for universal aCCess