Embed Size (px)
Citation preview
The use of satellite observation in the provision of climate monitoring over Ethiopia
Solomon YohannesNational Meteorological Agency, Addis Ababa, Ethiopia
Email: [email protected]/ Fax: +251-11-5517066/ Phone: +251-11-6615779
AbstractThis study investigates how to monitor various climatic entities based on various model-based forecasts and satellite imageries. Although different weather predicting models such as ECMWF has shown modest skill in estimating the rainfall distribution across the country, one underlying limitation is that it has weak skill in indicating some climatic anomalies. In contrast, the satellite imageries take in to account the effects of topography on portraying the extent at which long-term observations can ultimately indicate the extent of climate variations.
Previous observational studies have shown that the cumulative effects of severe weather conditions have been accounted for environmental and natural problems such as heavy falls exceeding 100mm/day at some places during different seasons.
The retrogression of westerly systems coupled with moisture source from northern Indian Ocean provided favorable large-scale conditions for the fall of localized heavy rainshowers. In addition to the large-scale forcing, the local circulations and local topography modulated the rainfall distribution over the country as a whole. Indeed, orographic lifting enhanced rising motion over the windward slopes of the mountainous regions of central, northeastern and eastern Ethiopia that led to significant rainfall. The existence of continuous satellite observation schemes is therefore very critical in capturing the extremity of climatic phenomena.
The current study is therefore, to investigate the potential of satellite observations in monitoring climatic variations over Ethiopia at local and regional spatial scales.
I. Introduction
Ethiopia lies approximately between latitudes 30N and 150N and longitudes 330E and 480E. The topography varies from about 100m below mean sea level in the Dalol Depression to peaks towering above 4000m in Simen Mountains (Griffiths, 1972). There are mainly three seasons. Dry season (October-January), short rainy season (mid February-mid May) and long rainy season (June-September).
The period from mid February to mid May is a short rainy period for central, northeastern, Rift valley and highlands of eastern Ethiopia. Within this period particularly, from April to May the southeastern lowlands of Ethiopia get their long rainy season. In contrast, over southwestern and western Ethiopia the rainy season extend up to October without a significant break. At this point, it is worth nothing the above three categories of rainfall pattern. Previous studies

revealed that the rainfall of the period is generally characterized by alternating of three to seven dry & wet days of three to seven days.
The long rainy period, which spans from June to September, is modulated by ITCZ and the moist southwesterly monsoon flow from the southern hemisphere. The onset and spatial distribution of rainfall is also found to follow the oscillation of the ITCZ and the intensity of the southern hemisphere anticyclones. The highlands of Ethiopia also play an important role on the flow and rainfall pattern of the period.
The Ethiopian weather and climate are influenced by different global and regional synoptic systems, which are prevailed in different seasons of the year. The highland regions of eastern, northeastern and central parts of the country are the most influential local components for fluctuations in weather and climate of the country.
The country’s economy mainly depends on rain-fed agriculture. The failure of the rains over the country varied from year to year and from one part to another. The untimely, deficient and unevenly distributed rainfall had ushered unprecedented drought and famine conditions which led to the death of thousands of people and cattle besides heavy losses in agricultural production. Many times the drought was not only severe but was also prolonged for consecutive years.
In view of this, satellite images have been playing a major role in tracking the condition and intensity of cyclonic storms as well as their movement. Also, timely satellite images are used to demonstrate the occurrences of severe weather that sometimes accompanied by heavy rain. According to the previous studies, the main cause for the unusual rain in this part of the country was found to be the approach of disturbance and moisture influxes from the Indian Ocean. Besides, the tropical disturbances that emerge near the Somalia Coast (Greater Horn of African Coast) often propagate westwards and produce considerable amount of rainfall after traversing for 3-4 days during the first decade of the month.
II. Rain producing weather systems and mean rainfall pattern during different seasons
Ethiopia is potentially rich in climate resources. Proper understanding and tapping of these climate resources is not yet fully achieved.

Day to day variations of atmospheric systems are responsible for day to day fluctuations in weather elements and variations in climate are due to integrated effects of variations in weather systems over a period of time.
Weather and climate of a region can be studied by examining the spatial and temporal distribution of weather element such as rainfall and weather systems in various seasons.However, despite scarcity of meteorological data/satellite information or imageries are the most prominent tools in order to monitor rainfall and other meteorological elements from the areas where meteorological stations are not available.
The consecutive satellite imageries taken at every 15 minutes are very much useful for issuing short range weather forecast in particular seasons that deficiency or excessive rainfall were crucial events for monitoring the cycles of events.
2.1 DataTo study and understand weather and climate of a place, documented meteorological data and information over a particular area should be necessary. Hence, a long year rainfall data has been taken to see the climate variability with the current year and the selected year of 2006. Besides, comparison has been done on the spatial as well as temporal rainfall patterns with the responsible rain producing systems for different seasons. Therefore, satellite imageries were the most important tools that could be depicting the seasonal variation that has been occurred due to different oceanic atmospheric change.
The main meteorological data and information centre is NMA. One can find the available meteorological data collected from various parts of the country. Using the available data in NMA archive rainfall regimes and climate variations were studied.
2.2 main seasons of EthiopiaIn high and mid latitudes, seasons are classified into four, mainly Winter, Spring, Summer and Autumn while in low latitudes they are categorized as wet and dry only.
In the case of Ethiopia, seasons are classified mainly based on rainfall and its distribution (Workineh Degefu, 1987, Tesfaye Haile, 1986 and Abebe Yeshanew, 1987)
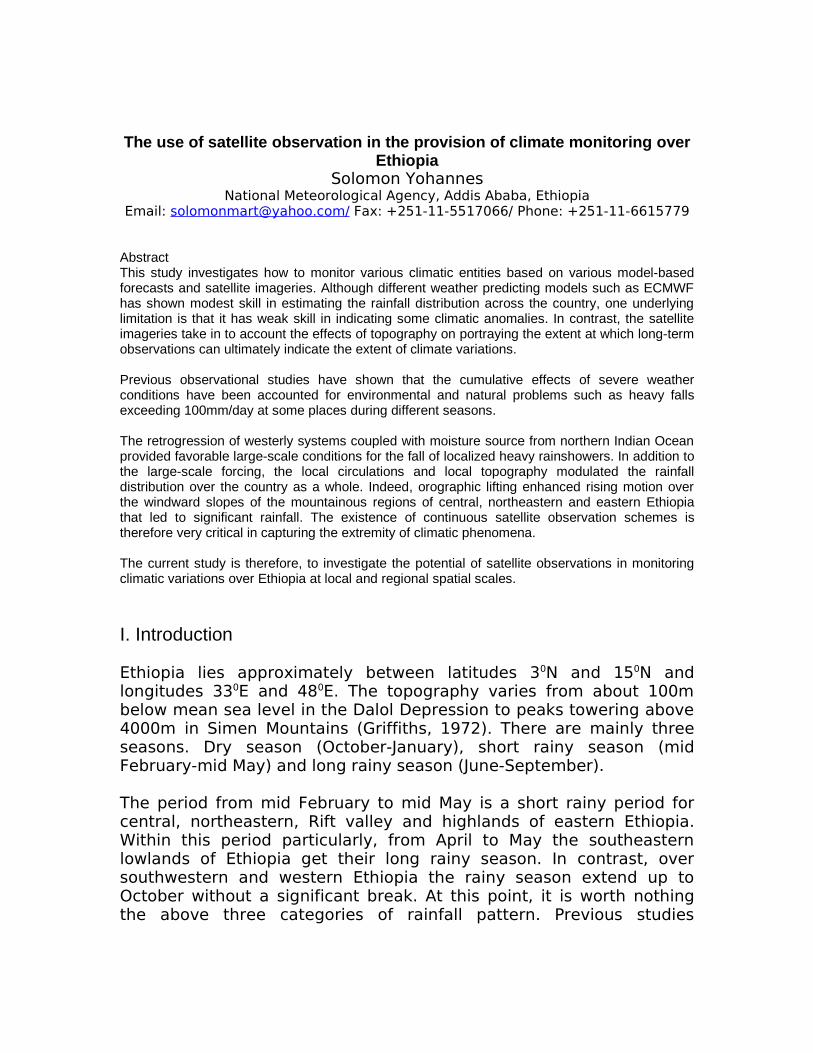
2.2.1 Bega is the dry season. It covers the period from October to January. The mean rain spatial distribution in Bega (Fig.1a) has its
maximum over southern and south western parts of the country and decreases northwards gradually.
2.2.2 Belg is the small rainy period. It covers the period from February to May. Rainfall during the season is highly variable in time and space and high maximum temperature values are common. The amount of seasonal rainfall (Fig.1b) is more than that of Bega and maximum values occur over Bale and Gamo Gofa regions (Workneh Degefu, 1987).
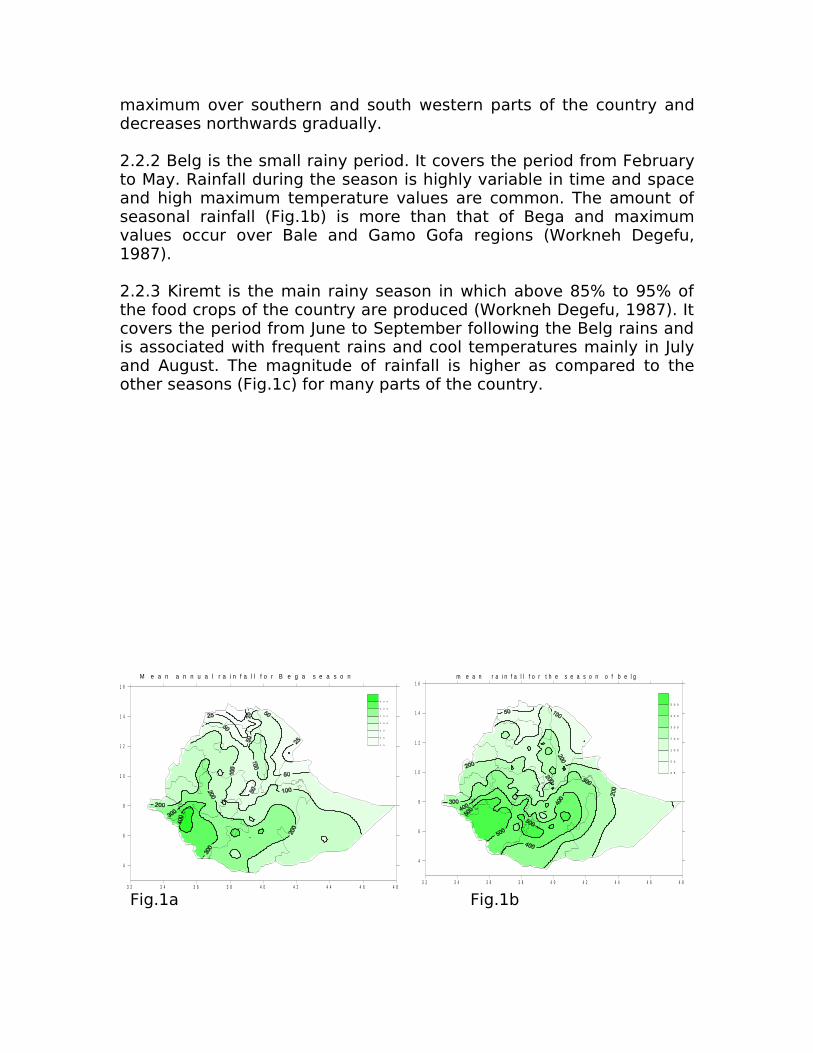
2.2.3 Kiremt is the main rainy season in which above 85% to 95% of the food crops of the country are produced (Workneh Degefu, 1987). It covers the period from June to September following the Belg rains and is associated with frequent rains and cool temperatures mainly in July and August. The magnitude of rainfall is higher as compared to the other seasons (Fig.1c) for many parts of the country.
3 2 3 4 3 6 3 8 4 0 4 2 4 4 4 6 4 8
4
6
8
1 0
1 2
1 4
1 6
1 5
2 5
5 0
1 0 0
2 0 0
3 0 0
4 0 0
M e a n a n n u a l r a i n f a l l f o r B e g a s e a s o n
3 2 3 4 3 6 3 8 4 0 4 2 4 4 4 6 4 8
4
6
8
1 0
1 2
1 4
1 6
2 5
5 0
1 0 0
2 0 0
3 0 0
4 0 0
5 0 0
m e a n r a i n f a l l f o r t h e s e a s o n o f b e l g
Fig.1a Fig.1b
3 2 3 4 3 6 3 8 4 0 4 2 4 4 4 6 4 8
4
6
8
1 0
1 2
1 4
1 6
1 0 0
2 0 0
3 0 0
4 0 0
5 0 0
6 0 0
7 0 0
8 0 0
9 0 0
1 0 0 0
1 2 0 0
1 4 0 0
M e a n A m o u n t o f R a i n f a l l f o r t h e K i r e m t S e a s o n
Fig.1c
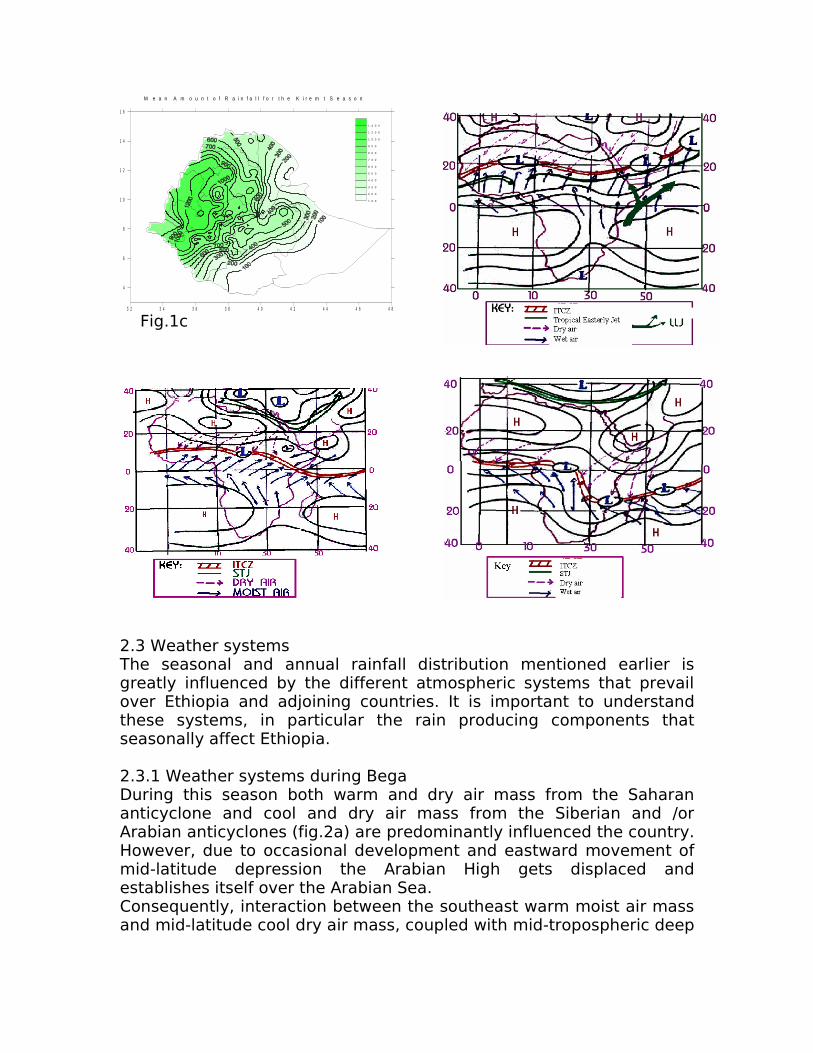
2.3 Weather systemsThe seasonal and annual rainfall distribution mentioned earlier is greatly influenced by the different atmospheric systems that prevail over Ethiopia and adjoining countries. It is important to understand these systems, in particular the rain producing components that seasonally affect Ethiopia.
2.3.1 Weather systems during BegaDuring this season both warm and dry air mass from the Saharan anticyclone and cool and dry air mass from the Siberian and /or Arabian anticyclones (fig.2a) are predominantly influenced the country. However, due to occasional development and eastward movement of mid-latitude depression the Arabian High gets displaced and establishes itself over the Arabian Sea.Consequently, interaction between the southeast warm moist air mass and mid-latitude cool dry air mass, coupled with mid-tropospheric deep
troughs and the sub-tropical jet (STJ) produces substantial rain mostly over the regions under consideration.
2.3.2 Weather systems during BelgDuring this season, a thermal low develops over sudan, an anticyclone forms over the Arabian sea, from there the south easterlies bring considerable amount of moisture to the region under consideration. Sometimes the northern part of the region is under the influence of the warm and dry Saharan and Arabian air masses (Fig.2b).The weather systems that are responsible for rainfall activity are:
- the development of high pressure over the Arabian sea;- the generation and propagation of disturbances, sometimes
coupled with easterly waves;- the interaction with the mid-latitude depressions accompanied
by troughs and STJ, the tropical disturbances and the ITCZ; and- the occasional development of the Red sea convergence zone
(RSCZ) which produces substantial rainfall in the north eastern parts.
2.3.3 Weather systems during kiremtThe major rain producing components during this season are (Fig.2c)
- the northward migration of the ITCZ following the sun’s movement;
- the development and persistence of the Arabian and Sudan thermal lows along 20oN latitude;
- the development of the quasi-high pressure systems over the southern Atlantic and Indian oceans;
- the deepning and persistence of the Indian subcontinent’s depressions and the associated monsoon trough; and
- the development of tropical easterly jet (TEJ) and its persistence, for amount distribution and intensity of rain (Tesfaye Haile, 1986 and 1987).
Under normal conditions the synoptic features the synoptic features mentioned above are the triggering mechanisms for the moisture laden cross equatorial flow to change to south westerly around the region. Also, the low level flow is enhanced by the development of the Somali jet off the coast of the Horn of Africa.
III. PRESENTATION OF THE REASEARCH FINDINGS
In this study, attempts are made to compare the short range srface charts of the 2006-year with that of station-based rainfall data. However, the result shows that the synoptic situation during the short rainy period may not clearly identified due to variation on its

characteristic over the tropical regions particularly along the mountainous regions, where the land surface is dominated by local factor in changing the weather condition over Ethiopia.
During 13th of June, the position of ITCZ was around 15N of latitude as a result of this the cloud bands were confined over the western and southwestern regions of the country. The rain producing systems were strengthened gradually towards east while the main rainfall activity was over the southwestern portion of Ethiopia.
The major causes for the weather deterioration are the persistent high over the Arabian Sea and the north Indian Ocean. At times the combination of the southern ridge that extended from the southern Indian Ocean high, with the above synoptic systems, has contributed dry more severe weather to the country during the period.
The synoptic situation, that produces such significant rainfall amount, was the development of the Red Sea convergence (RSC). The cause for more amount of rainfall was due to the intrusion of the mid-latitude disturbed weather towards our area; and the interaction that occurred between it and the tropical moist air mass. The penetration of the mid-latitude low-pressure system to lower latitude has forced the displacement of the Arabian high towards the Indian Ocean. The ideal location of the high-pressure system resulted in southeast air stream that brought quite sufficient supply of moisture laden towards our area, where later interaction was possible for the production of significant weather over most of the country.

Fig. 1a Fig. 1b
According to the comparison made, the rainfall distribution and the ECMWF actual wind analysis (Fig. 1c) taken on 25 March 2006 seemed to be reasonable. However, the actual weather activity was more pronounced over the southwestern and northeastern regions of the country while the cloud band that is supposed to give wide spread rain was seen over the southwestern, south and eastern portions of the country (fig.1a). Hence, due to the characteristic nature of cloud formation in association with the moisture availability and topography of the regions, the rainfall activity varied from place to place as it was confined over the northeastern and southeastern sections of the country (Fig. 1b).
3 4 3 6 3 8 4 0 4 2 4 4 4 6 4 8
4
6
8
1 0
1 2
1 4
0 1 2 4 6 9 1 2 1 5 2 0 2 5 3 0 4 0 5 0 6 0 7 5 1 0 0
2 5 M a r c h 2 0 0 6
Fig. 1c
However, from the IR satellite image that was taken at 1500UTC on the same date, one can predict the rain-giving clouds that are oriented along SW-to-NE. Therefore, the regions confined to west of these cloud bands are likely to get widespread rain in association with wind direction coming from the Arabian Sea.
According to satellite imageries’ investigation, the cause for the unusual rainfall in this part of the country was found to be the approach of a disturbance from the Indian Ocean. The tropical disturbance that was generated near the Somalia coast has propagated towards our area and after 3-4 days produced such a considerable amount of rainfall during the first decade of the month.
In this case the satellite picture has been found to be beneficial in locating and tracking the disturbance that could not be identified by weather charts. So one has fully to make use of the satellite picture; but not to overlook its super aid in order to assess and prepare weather prediction.
IV. RESULTS AND CONCLUSIONSWith the advent of Satellites and the flowering of field experiments, lack of data is no longer the biggest obstacle to understand the tropical disturbances: for much of the tropics, progress may depend as much on making better use of the available remote sensed data such as satellite imageries.
Particularly, in recent years progress-made to quantify and interpret satellite imageries as well as available meso-scale or synoptic scale based on the displacements of clouds with respect to satellite image sequences.
In conclusion, the satellite imageries have been found to be beneficial in locating and tracking the disturbance that could not be identified by synoptic weather charts. So one has fully make use of the satellite imageries; but not to overlook its input for the forecasters in order to prepare weather forecasting on varies time scales.
Clouds imageries, water vapor, and thermal structure as operationally achieved in real-time from geo-stationary satellites can play important role in the dynamic verification and re-initialization of numerical weather-prediction models used for short-range prediction of intense weather. By overlaying hourly interval model forecast fields over satellite imagery, the validity of the evolving forecast can be subjectively assessed.

Hence, satellite data are often the most reliable and real-time indicators of changing and significant of weather phenomena.
V. AKNOWLEDGMENTSI am grateful to Mr. Driba Korecha Team Leader at the National Meteorological Agency in Weather Forecast and Early Warning Team for his valuable idea and support.
VI. REFERENCESTesfaye Haile, 1976: Weather Over Ethiopia, March & April 1981, 3-5
David Suchman and David W.Martin, August 1977: Deep Convective Mass Transports: An Estimate from a Geostationary Satellite, Monthly Weather Review, Volume 105, Number 8, 943-944.