Embed Size (px)
Citation preview
Schertz-Cibolo-Universal City ISD
District Housing
Activity Report 4Q 2016
Solutions Through Demographics
2
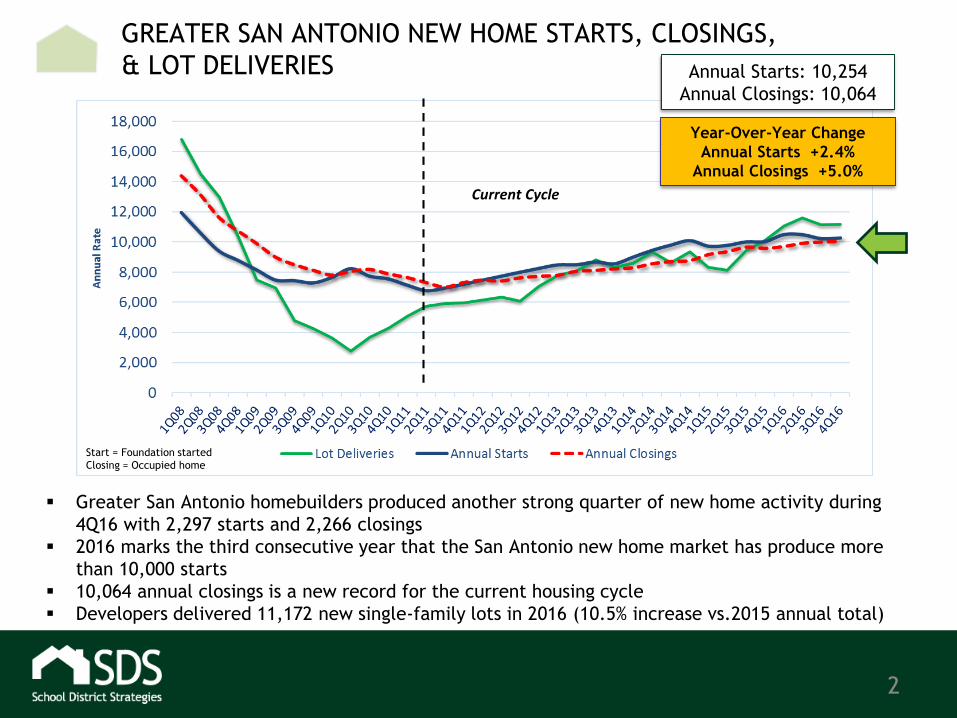
GREATER SAN ANTONIO NEW HOME STARTS, CLOSINGS,
& LOT DELIVERIES
Year-Over-Year Change
Annual Starts +2.4%
Annual Closings +5.0%
Annual Starts: 10,254
Annual Closings: 10,064
Start = Foundation started
Closing = Occupied home
Greater San Antonio homebuilders produced another strong quarter of new home activity during
4Q16 with 2,297 starts and 2,266 closings
2016 marks the third consecutive year that the San Antonio new home market has produce more
than 10,000 starts
10,064 annual closings is a new record for the current housing cycle
Developers delivered 11,172 new single-family lots in 2016 (10.5% increase vs.2015 annual total)
Current Cycle
3
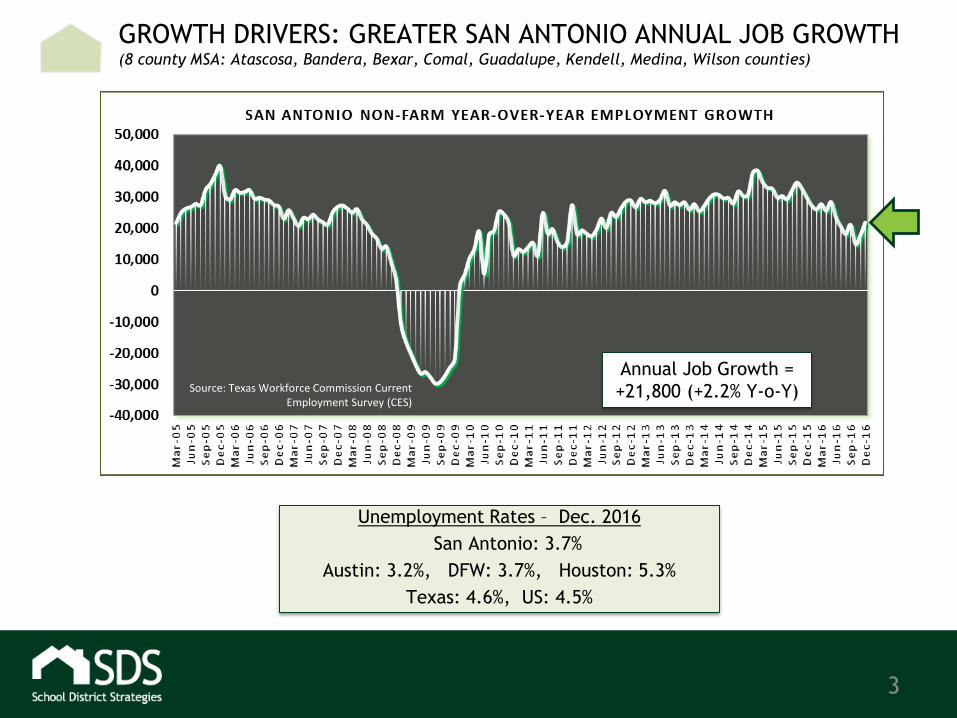
GROWTH DRIVERS: GREATER SAN ANTONIO ANNUAL JOB GROWTH(8 county MSA: Atascosa, Bandera, Bexar, Comal, Guadalupe, Kendell, Medina, Wilson counties)
Source: Texas Workforce Commission Current Employment Survey (CES)
Unemployment Rates – Dec. 2016
San Antonio: 3.7%
Austin: 3.2%, DFW: 3.7%, Houston: 5.3%
Texas: 4.6%, US: 4.5%
Annual Job Growth =
+21,800 (+2.2% Y-o-Y)
4
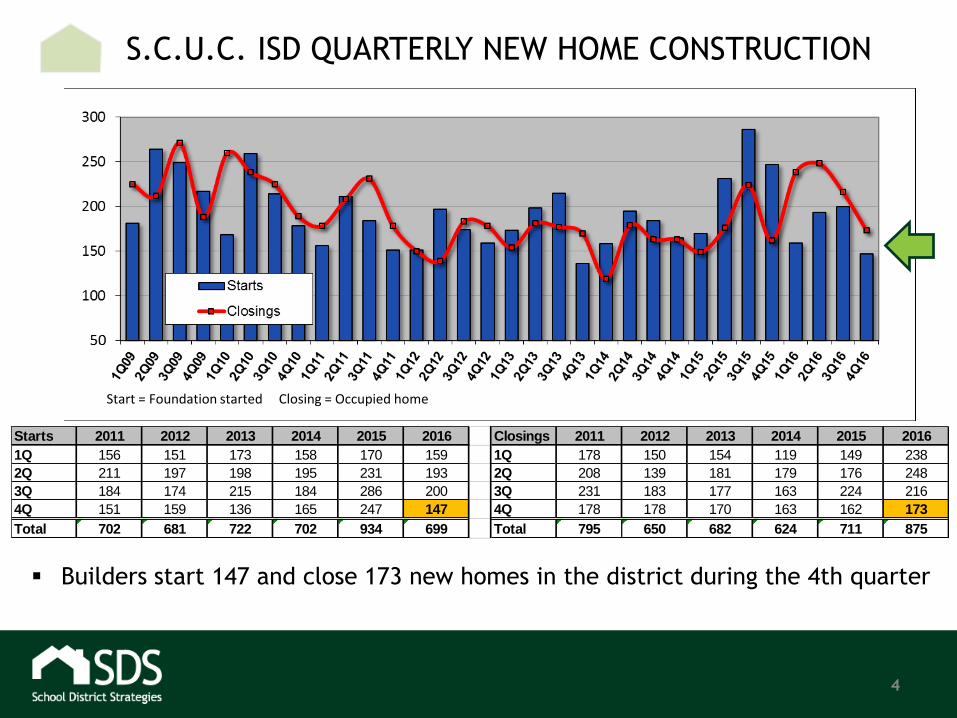
S.C.U.C. ISD QUARTERLY NEW HOME CONSTRUCTION
Start = Foundation started Closing = Occupied home
Builders start 147 and close 173 new homes in the district during the 4th quarter
Starts 2011 2012 2013 2014 2015 2016 Closings 2011 2012 2013 2014 2015 2016
1Q 156 151 173 158 170 159 1Q 178 150 154 119 149 238
2Q 211 197 198 195 231 193 2Q 208 139 181 179 176 248
3Q 184 174 215 184 286 200 3Q 231 183 177 163 224 216
4Q 151 159 136 165 247 147 4Q 178 178 170 163 162 173
Total 702 681 722 702 934 699 Total 795 650 682 624 711 875
5
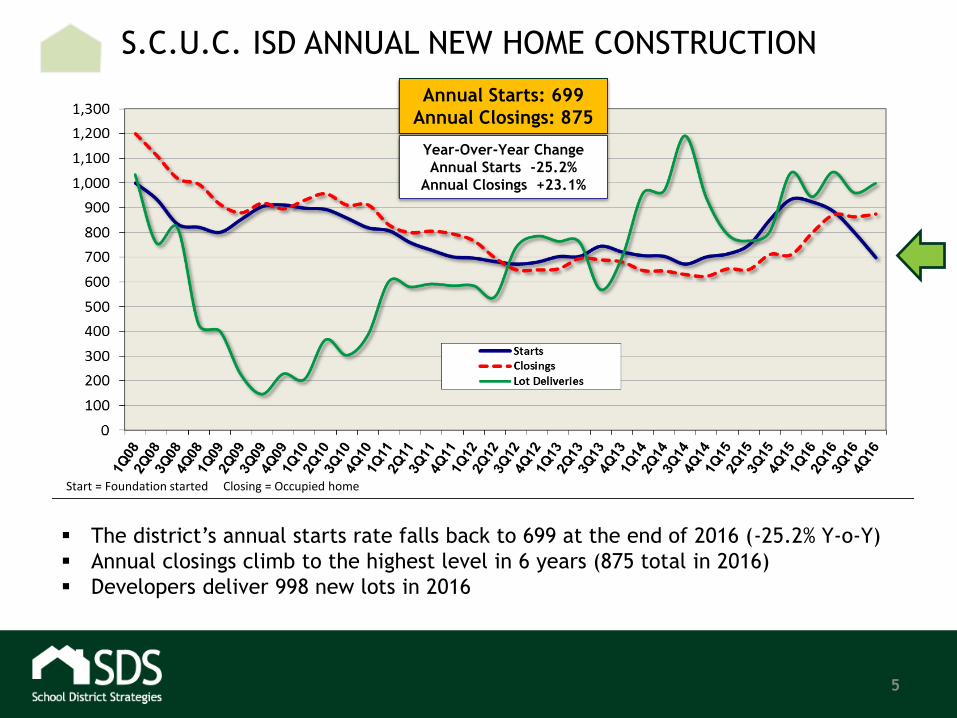
S.C.U.C. ISD ANNUAL NEW HOME CONSTRUCTION
Annual Starts: 699
Annual Closings: 875
Year-Over-Year Change
Annual Starts -25.2%
Annual Closings +23.1%
The district’s annual starts rate falls back to 699 at the end of 2016 (-25.2% Y-o-Y)
Annual closings climb to the highest level in 6 years (875 total in 2016)
Developers deliver 998 new lots in 2016
Start = Foundation started Closing = Occupied home
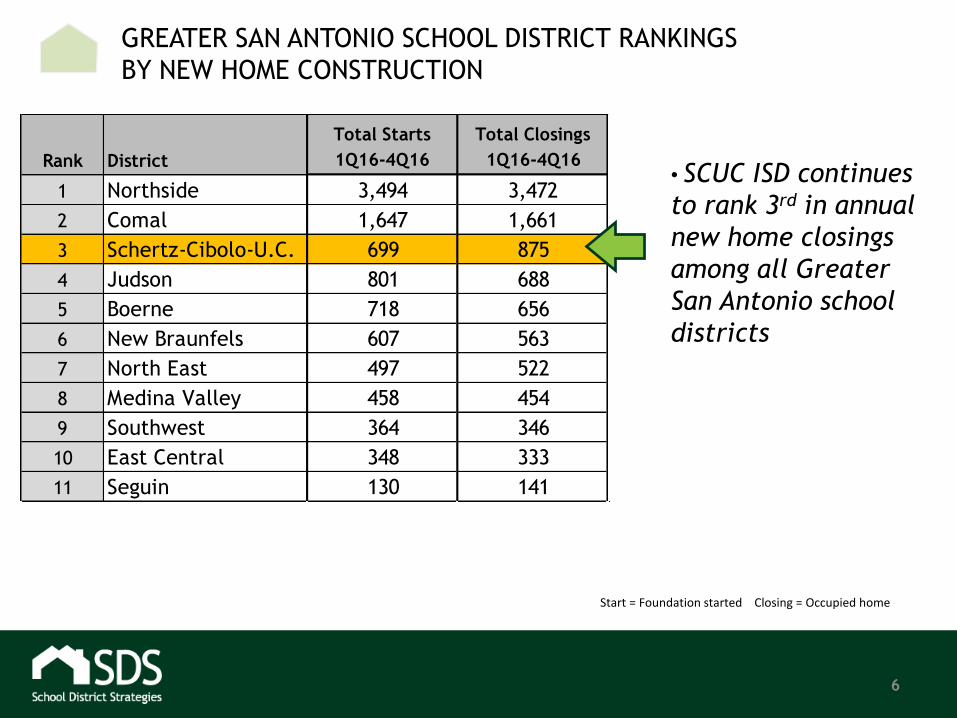
Rank District
Total Starts
1Q16-4Q16
Total Closings
1Q16-4Q16
1 Northside 3,494 3,472
2 Comal 1,647 1,661
3 Schertz-Cibolo-U.C. 699 875
4 Judson 801 688
5 Boerne 718 656
6 New Braunfels 607 563
7 North East 497 522
8 Medina Valley 458 454
9 Southwest 364 346
10 East Central 348 333
11 Seguin 130 141
6
GREATER SAN ANTONIO SCHOOL DISTRICT RANKINGS
BY NEW HOME CONSTRUCTION
• SCUC ISD continues
to rank 3rd in annual
new home closings
among all Greater
San Antonio school
districts
Start = Foundation started Closing = Occupied home
7
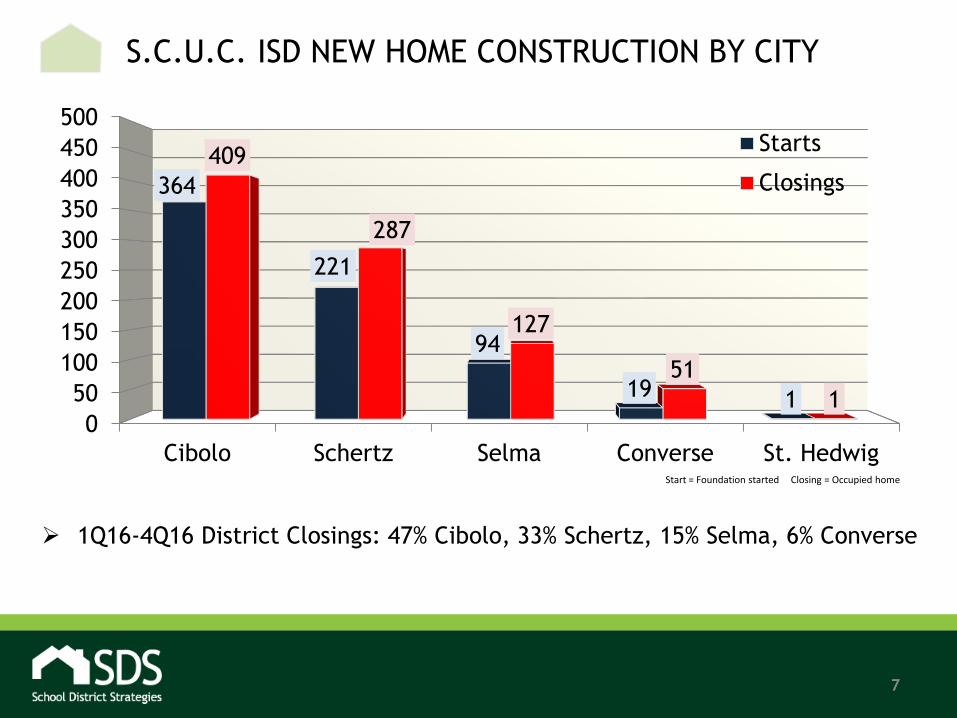
S.C.U.C. ISD NEW HOME CONSTRUCTION BY CITY
0
50
100
150
200
250
300
350
400
450
500
Cibolo Schertz Selma Converse St. Hedwig
364
221
94
19 1
409
287
127
51
1
Starts
Closings
1Q16-4Q16 District Closings: 47% Cibolo, 33% Schertz, 15% Selma, 6% Converse
Start = Foundation started Closing = Occupied home
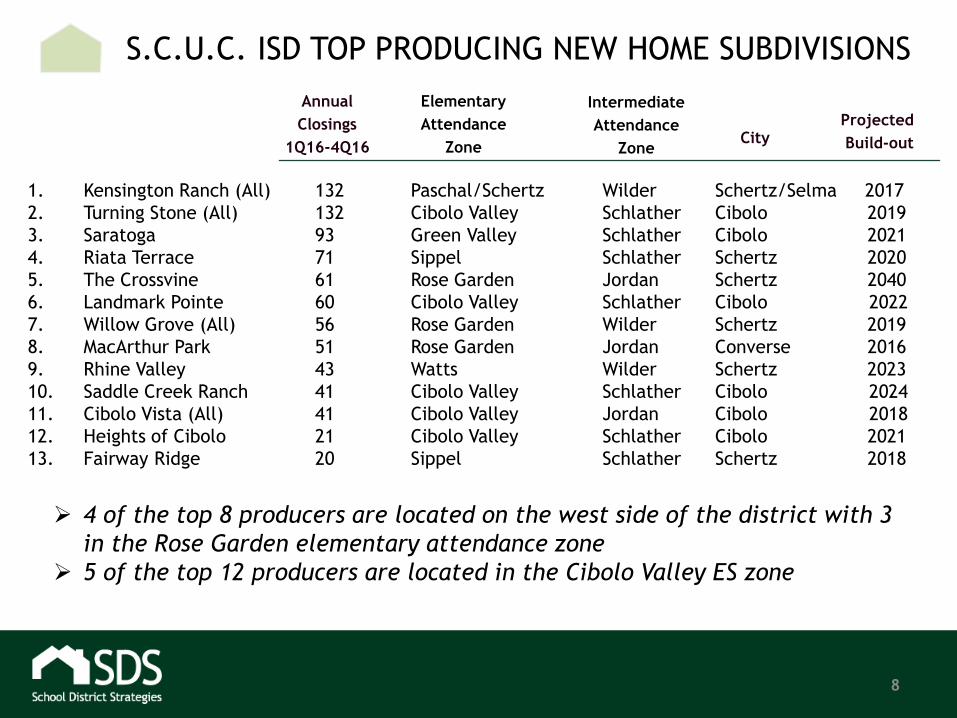
1. Kensington Ranch (All) 132 Paschal/Schertz Wilder Schertz/Selma 2017
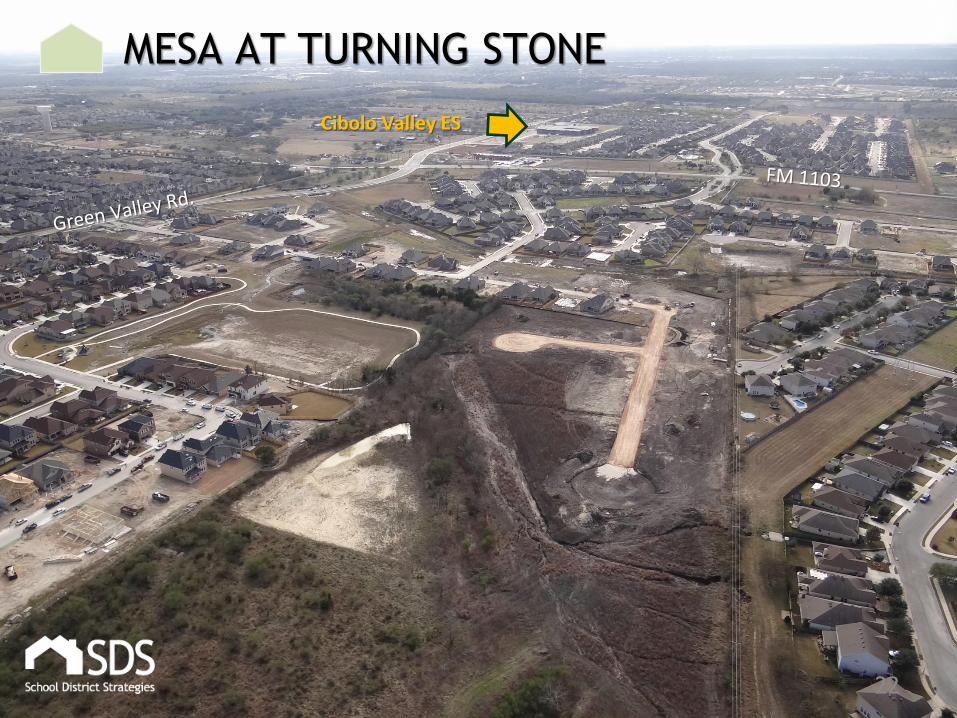
2. Turning Stone (All) 132 Cibolo Valley Schlather Cibolo 2019
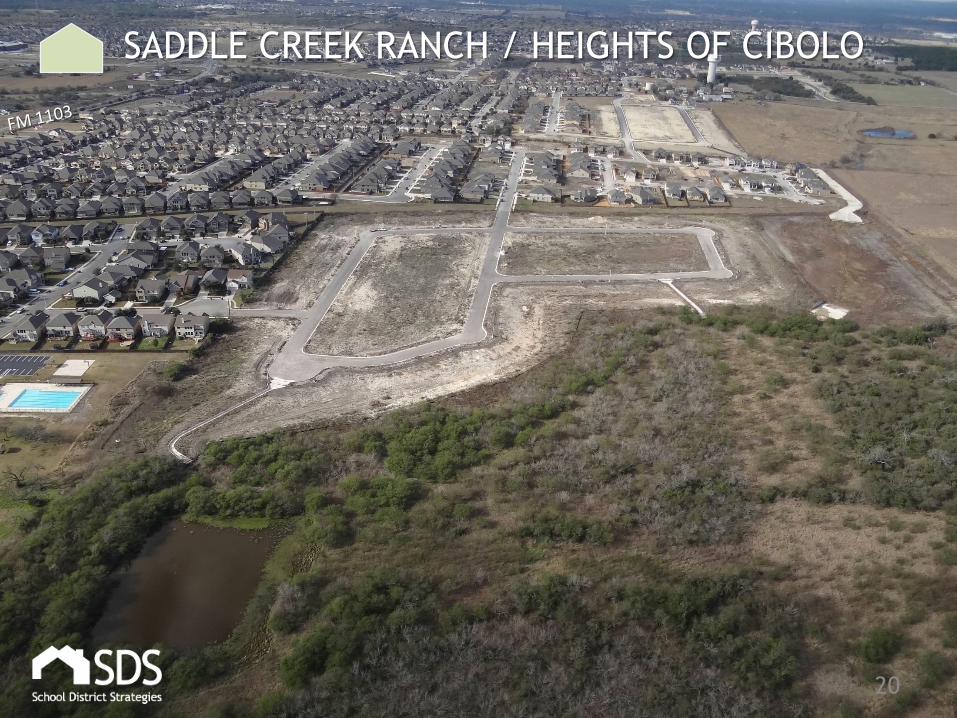
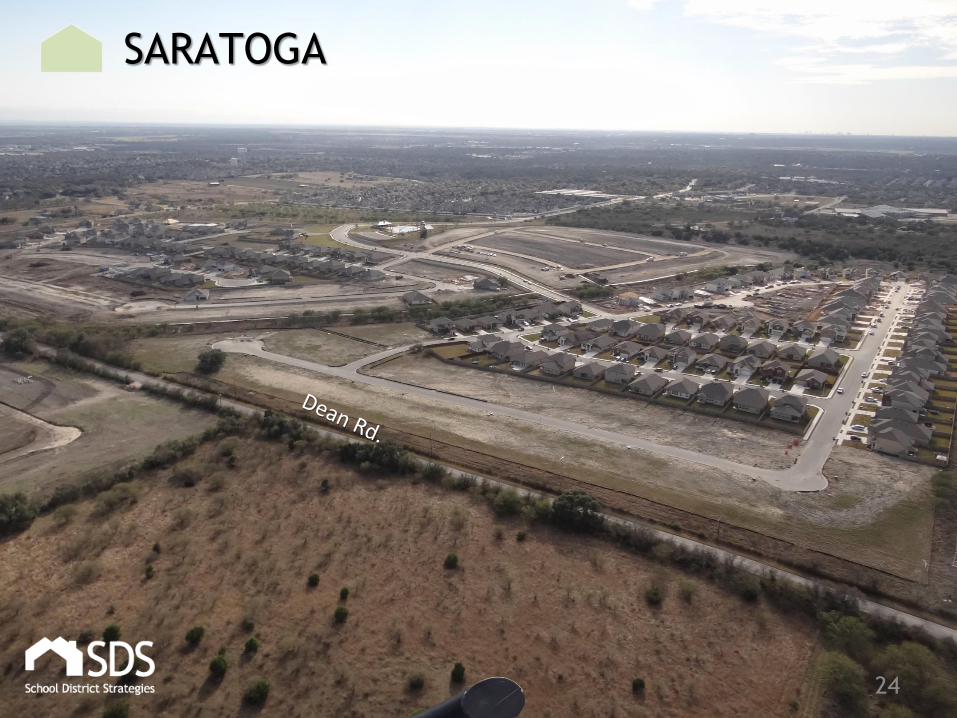
3. Saratoga 93 Green Valley Schlather Cibolo 2021
4. Riata Terrace 71 Sippel Schlather Schertz 2020
5. The Crossvine 61 Rose Garden Jordan Schertz 2040
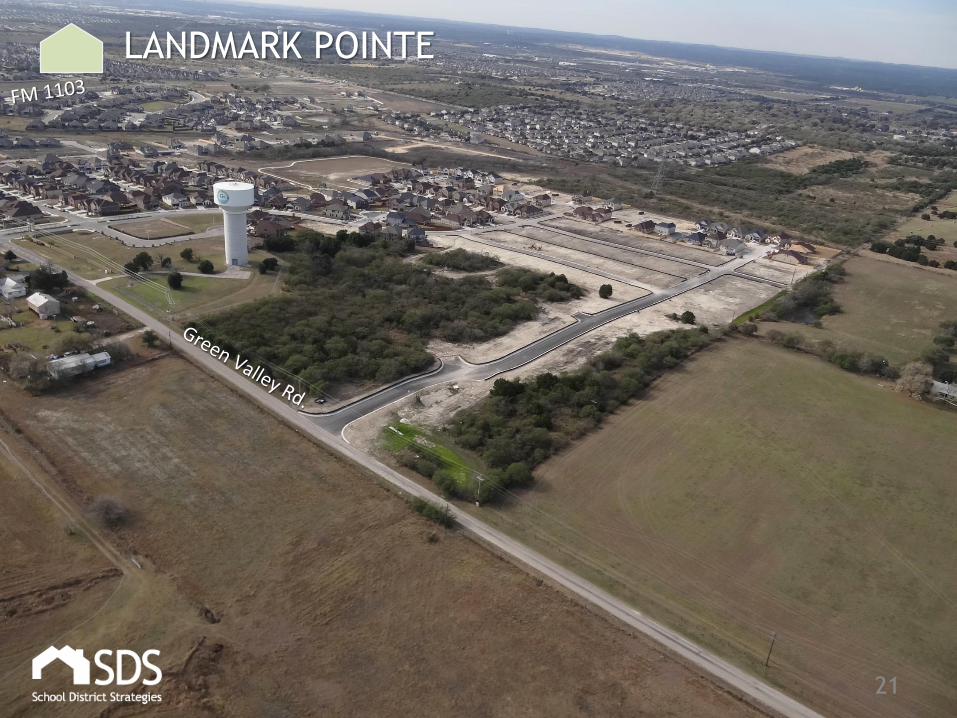
6. Landmark Pointe 60 Cibolo Valley Schlather Cibolo 2022
7. Willow Grove (All) 56 Rose Garden Wilder Schertz 2019
8. MacArthur Park 51 Rose Garden Jordan Converse 2016
9. Rhine Valley 43 Watts Wilder Schertz 2023
10. Saddle Creek Ranch 41 Cibolo Valley Schlather Cibolo 2024
11. Cibolo Vista (All) 41 Cibolo Valley Jordan Cibolo 2018
12. Heights of Cibolo 21 Cibolo Valley Schlather Cibolo 2021
13. Fairway Ridge 20 Sippel Schlather Schertz 2018
8
S.C.U.C. ISD TOP PRODUCING NEW HOME SUBDIVISIONS
Annual
Closings
1Q16-4Q16
Elementary
Attendance
Zone
4 of the top 8 producers are located on the west side of the district with 3
in the Rose Garden elementary attendance zone
5 of the top 12 producers are located in the Cibolo Valley ES zone
Intermediate
Attendance
ZoneCity
Projected
Build-out
9
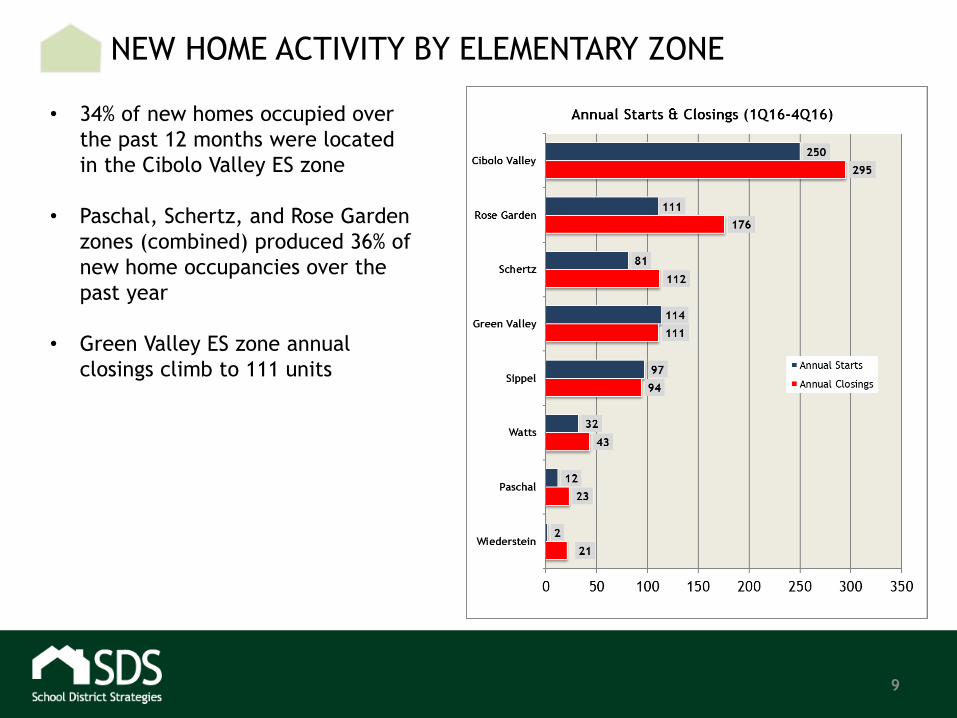
NEW HOME ACTIVITY BY ELEMENTARY ZONE
• 34% of new homes occupied over
the past 12 months were located
in the Cibolo Valley ES zone
• Paschal, Schertz, and Rose Garden
zones (combined) produced 36% of
new home occupancies over the
past year
• Green Valley ES zone annual
closings climb to 111 units
10
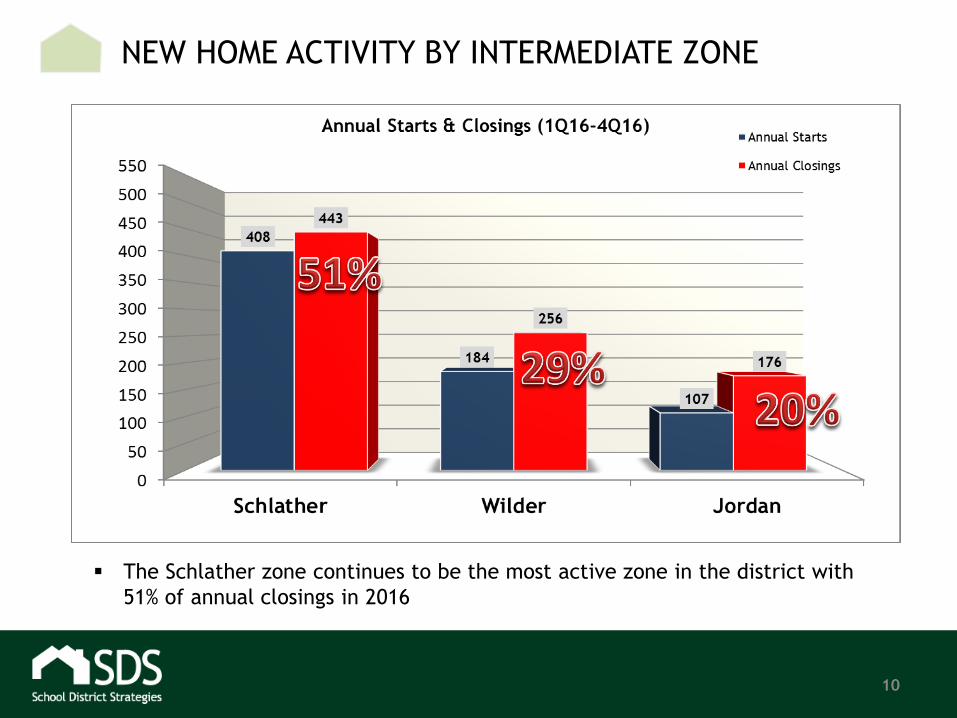
NEW HOME ACTIVITY BY INTERMEDIATE ZONE
The Schlather zone continues to be the most active zone in the district with
51% of annual closings in 2016
11
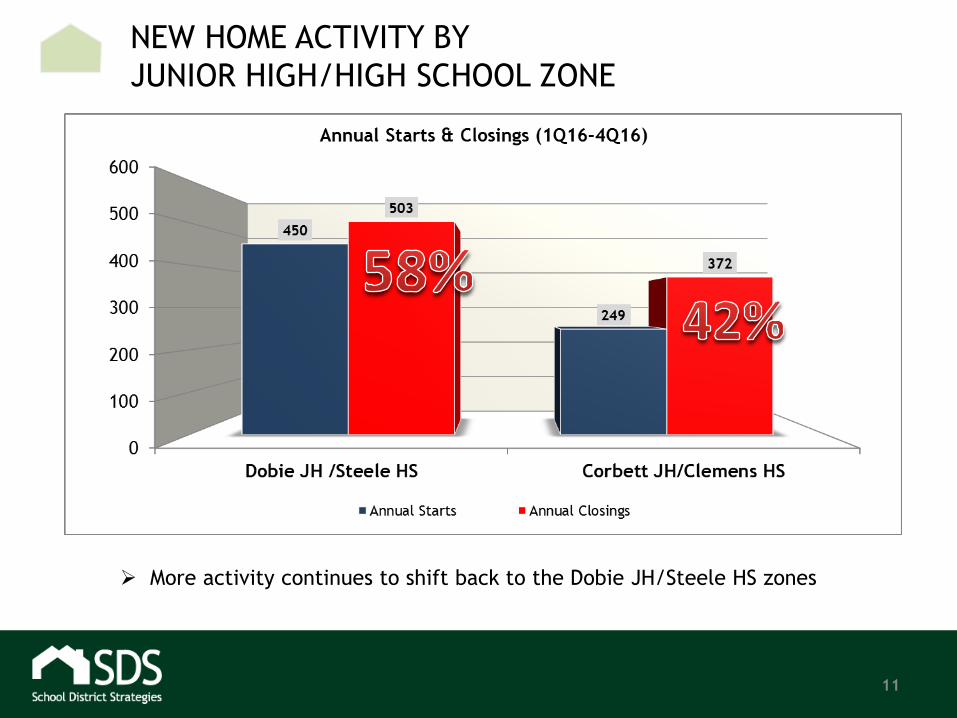
NEW HOME ACTIVITY BY
JUNIOR HIGH/HIGH SCHOOL ZONE
More activity continues to shift back to the Dobie JH/Steele HS zones
12
SCHERTZ-CIBOLO-UNIVERSAL CITY ISD
RESIDENTIAL LOT INVENTORY
351 new lots delivered in 4Q 2016 including the 232 at Homestead
1,824 vacant developed lots remaining as of Dec. 30, 2016
515 future lots under development as of year-end 2016
7,032 future lots planned

13
NEW PROPOSED
RESIDENTIAL
DEVELOPMENTS
Subdivision Total Lots Attendance Zones City
Venado Crossing
500 Wiederstein/Jordan/Corbett/Clemens
Cibolo
Hallie’s Cove 147 Wiederstein/Jordan/Corbett/Clemens
Schertz
St. Hedwig /Abbot Rd. Tracts
874 Rose Garden/Jordan/Corbet
t/Clemens
St. Hedwig

14
AERIAL PHOTOS
DECEMBER 21, 2016
15
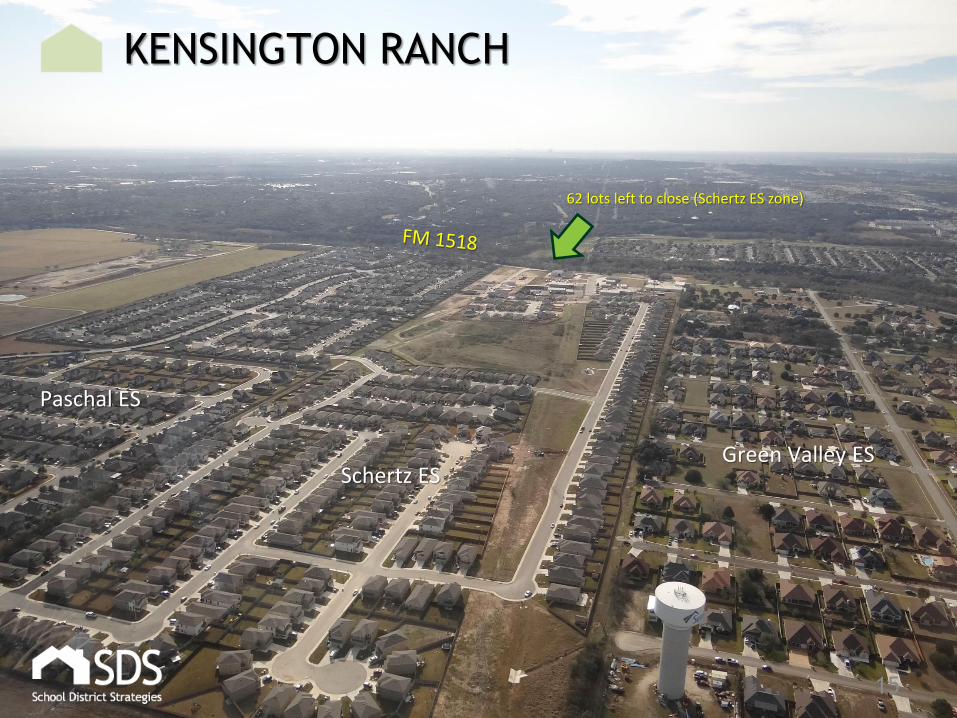
KENSINGTON RANCH
Schertz ES
Paschal ES
Green Valley ES
62 lots left to close (Schertz ES zone)
16
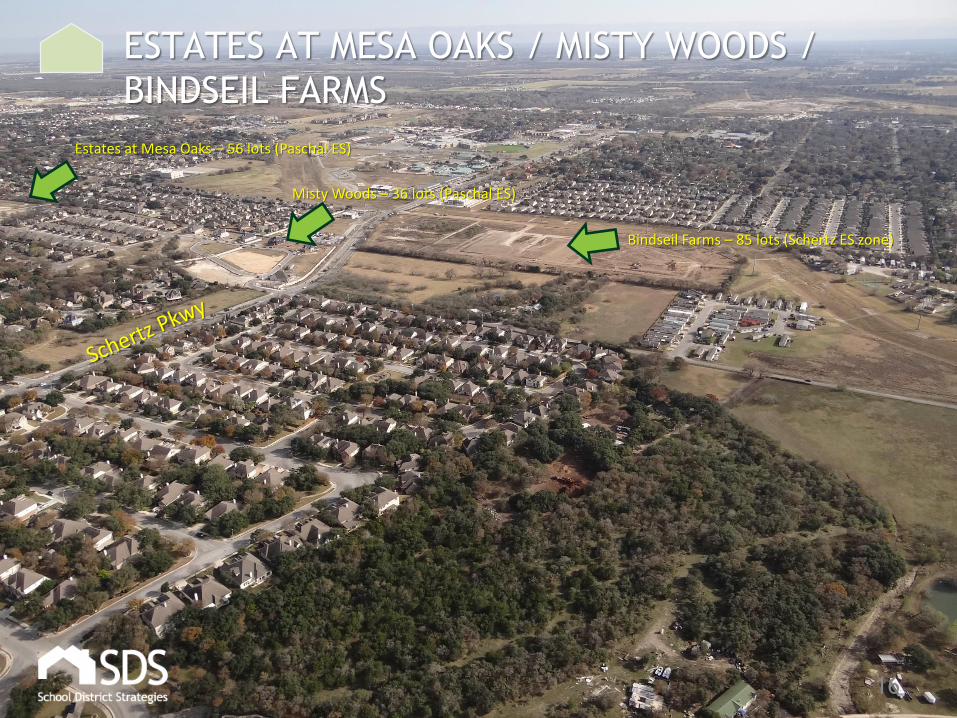
ESTATES AT MESA OAKS / MISTY WOODS /
BINDSEIL FARMS
Misty Woods – 36 lots (Paschal ES)
Bindseil Farms – 85 lots (Schertz ES zone)
Estates at Mesa Oaks – 56 lots (Paschal ES)
17
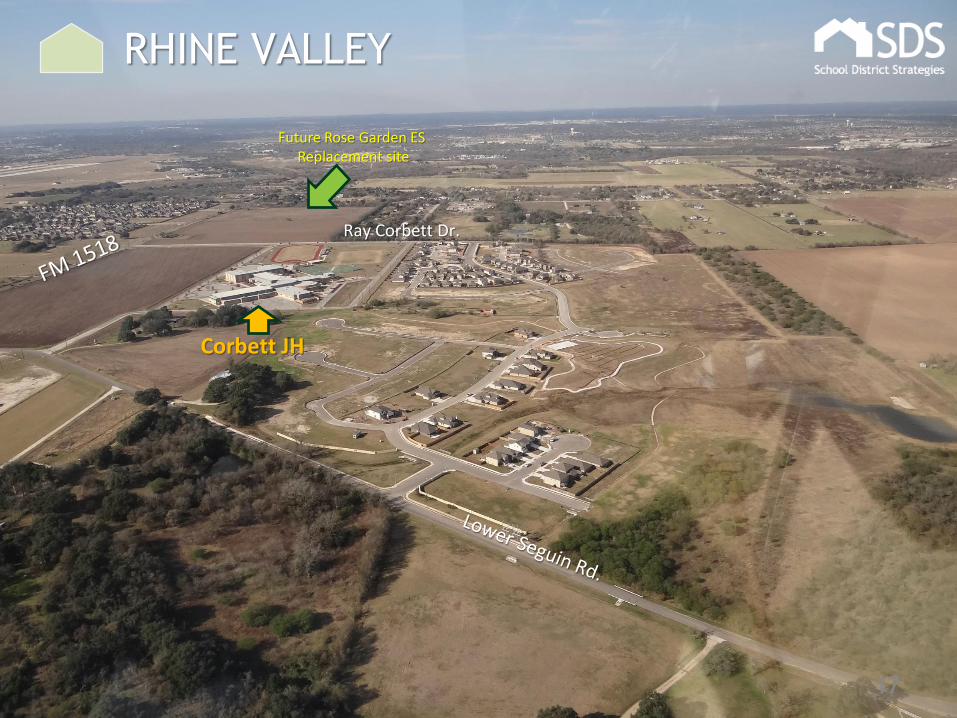
RHINE VALLEY
Corbett JH
Ray Corbett Dr.
Future Rose Garden ES Replacement site
18
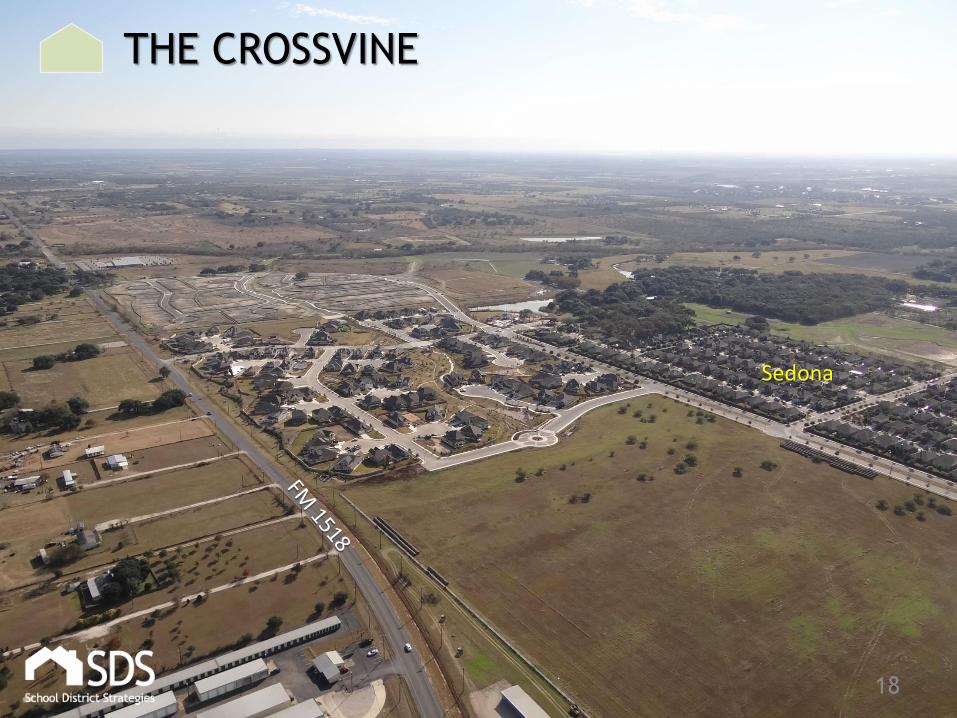
THE CROSSVINE
Sedona
19
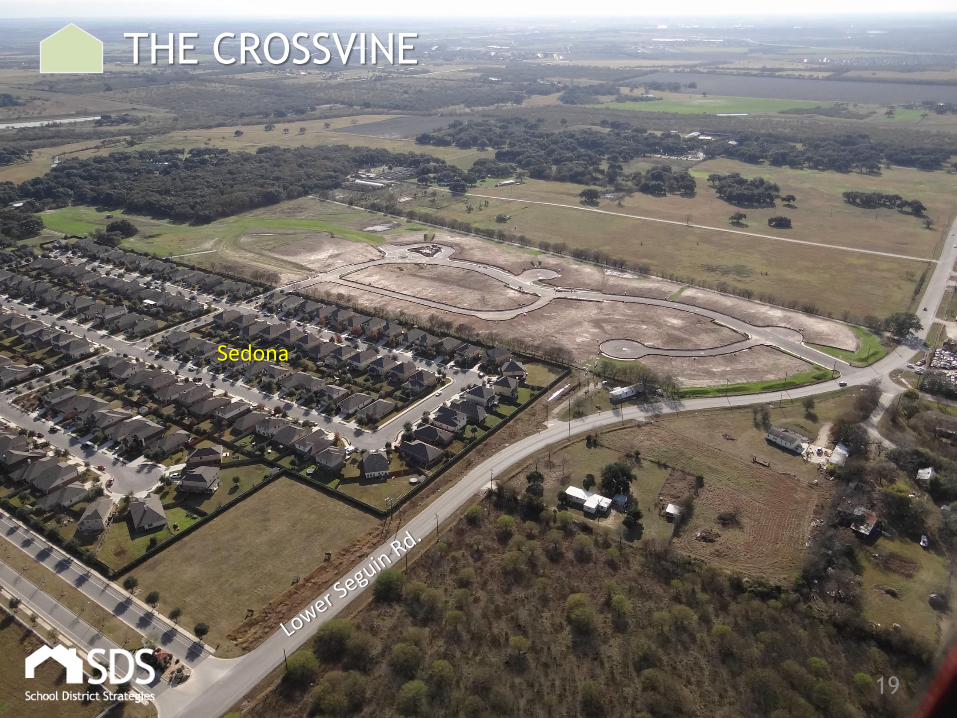
THE CROSSVINE
Sedona
20
SADDLE CREEK RANCH / HEIGHTS OF CIBOLO
21
LANDMARK POINTE
22
MESA AT TURNING STONE
Cibolo Valley ES

23
TURNING STONE
Cibolo Valley ES
___ lots under development
24
SARATOGA
25
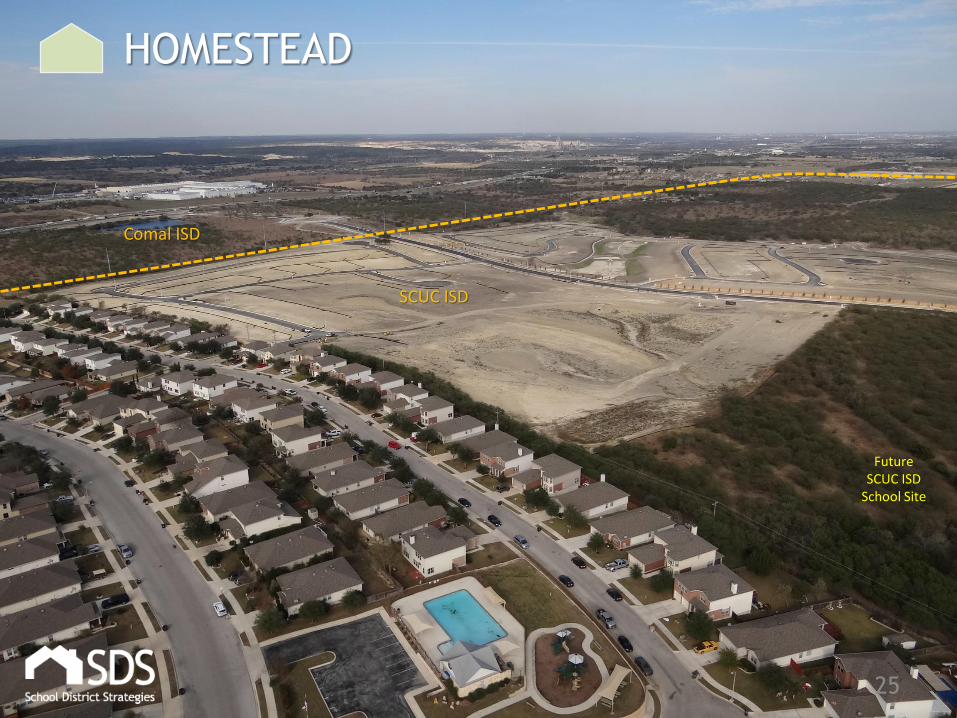
HOMESTEAD
FutureSCUC ISD
School Site
SCUC ISD
Comal ISD
26
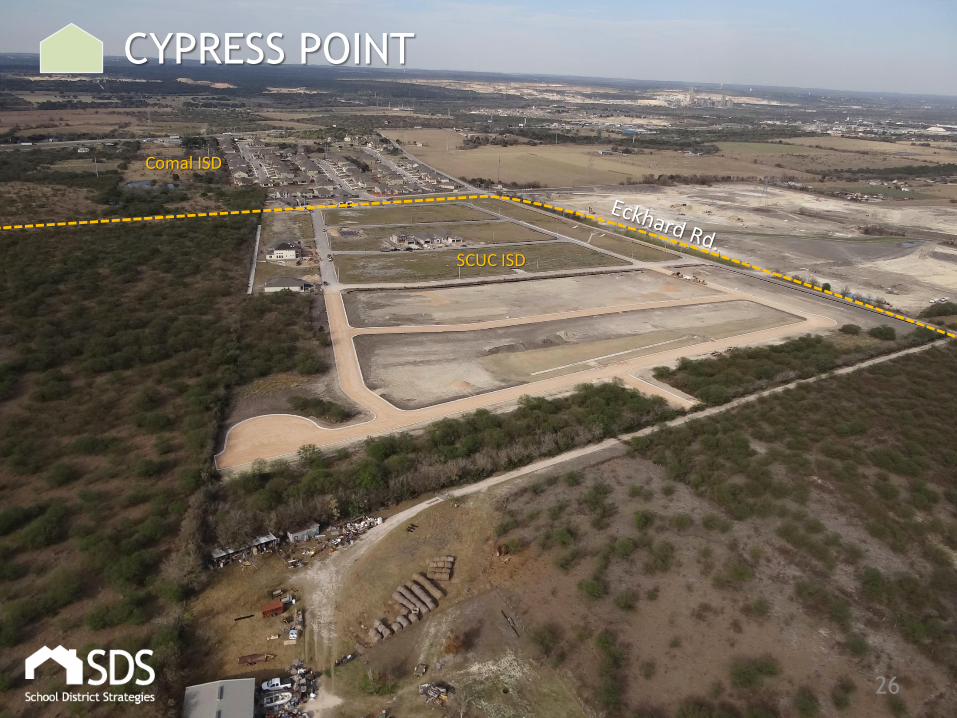
CYPRESS POINT
SCUC ISD
Comal ISD
27
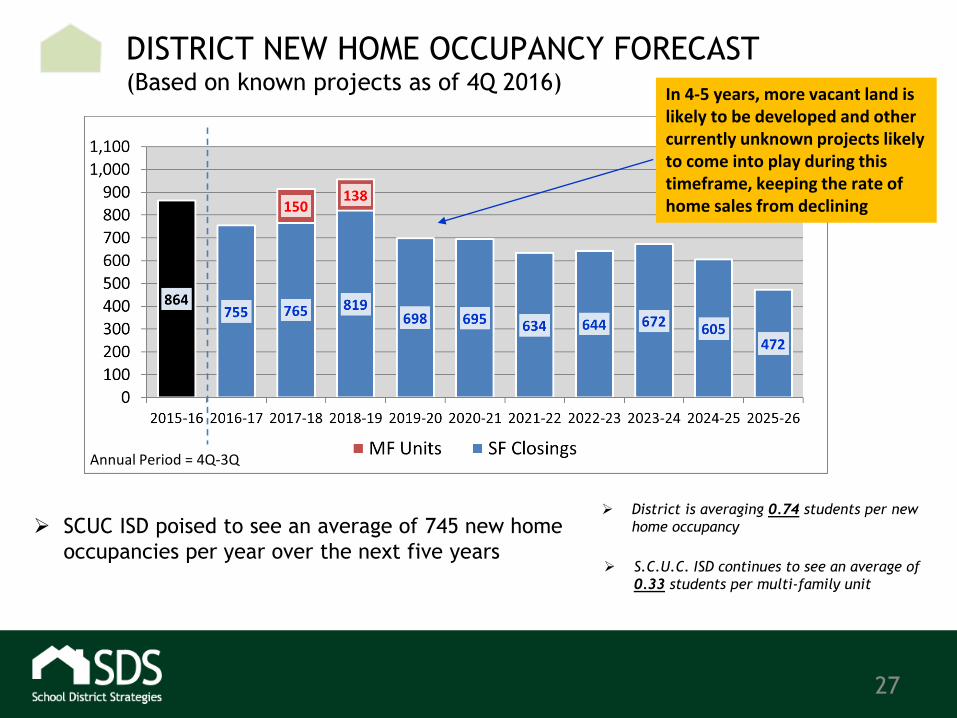
DISTRICT NEW HOME OCCUPANCY FORECAST(Based on known projects as of 4Q 2016)
SCUC ISD poised to see an average of 745 new home
occupancies per year over the next five years
Annual Period = 4Q-3Q
In 4-5 years, more vacant land is likely to be developed and other currently unknown projects likely to come into play during this timeframe, keeping the rate of home sales from declining
District is averaging 0.74 students per new
home occupancy
S.C.U.C. ISD continues to see an average of
0.33 students per multi-family unit
28
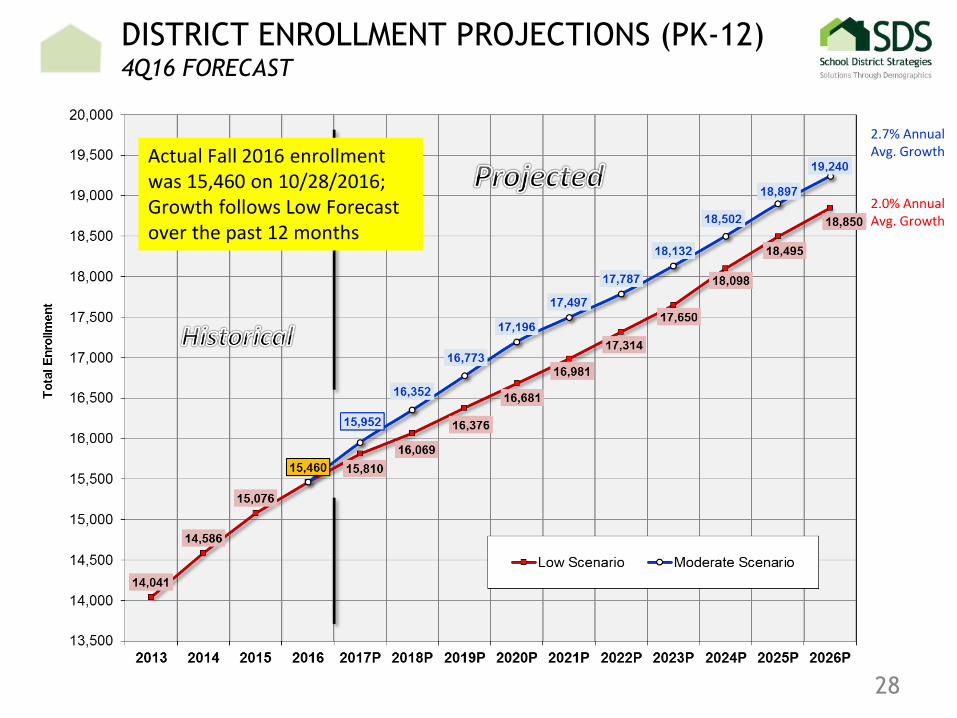
DISTRICT ENROLLMENT PROJECTIONS (PK-12)4Q16 FORECAST
Actual Fall 2016 enrollment was 15,460 on 10/28/2016; Growth follows Low Forecast over the past 12 months
2.7% Annual Avg. Growth
2.0% Annual Avg. Growth
29
Copyright 2017 School District Strategies.
Although School District Strategies (SDS) has used commercially reasonable efforts to obtain information from sources it believes to be reliable and accurate, SDS
does not guarantee the accuracy or completeness of such information. Information presented in this report represents SDS’s estimates as of the date of the report
and is subject to change without notice. This report is not intended as a recommendation or endorsement of any action taken by you or any third party in regard to
the subject matter of this report or any other real estate activity. SDS WILL HAVE NO LIABILITY FOR INDIRECT, INCIDENTAL, CONSEQUENTIAL, OR SPECIAL DAMAGES,
INCLUDING (BUT NOT LIMITED TO) LOST PROFITS, OR DIMINUTION IN VALUE OF YOUR BUSINESS OR PROPERTY, ARISING FROM OR RELATING TO SDS’S SERVICES
HEREUNDER, REGARDLESS OF ANY NOTICE OF THE POSSIBILITY OF SUCH DAMAGES AND WHETHER OR NOT SUCH DAMAGES ARE REASONABLE OR FORESEEABLE UNDER
THE APPLICABLE CIRCUMSTANCES. SDS’S LIABILITY ON ANY CLAIM OF ANY KIND, INCLUDING NEGLIGENCE, FOR ANY LOSS OR DAMAGE ARISING OUT OF, CONNECTED
WITH, OR RESULTING FROM THIS REPORT OR THE SERVICES PROVIDED BY SDS SHALL IN NO SINGLE CASE, OR IN THE AGGREGATE, EXCEED THE AMOUNTS ACTUALLY
PAID TO SDS IN CONNECTION WITH THE REPORT.
The following contingencies and limiting conditions are noted as fundamental assumptions that may affect the accuracy or validity of the analysis and conclusions set
forth in this report. Specifically, the parties assume: that the Dallas/Fort Worth metropolitan area, the State of Texas, and the nation as a whole will not suffer any
major economic shock during the time period of the forecast contained in this report; that general population levels will continue to increase at or above the rate
forecast; that the public and third party sources of statistical data and estimates used in this analysis are accurate and complete in all material respects, and that
such information is a reasonable resource for project planning purposes; the proposed real estate development projects described herein, when completed, will be
designed, promoted, and managed in a manner that will have an impact on the local market that is reasonably consistent with other similar projects in the past; and
that the recommendations set forth in this report will be acted upon within a reasonable period of time to preclude major changes in the factual conditions
evaluated.
16980 Dallas Parkway
Suite 101
Dallas, Texas 75248
www.schooldistrictstrategies.com