Embed Size (px)
Citation preview

Pioneer High
By February 1 of each year, every school in California is required by state law to publish a School Accountability Report Card (SARC).The SARC contains information aboutthe condit ion and performance of each California public school. Under the Local Control Funding Formula (LCFF) all local educat ional agencies (LEAs) are required toprepare a Local Control and Accountability Plan (LCAP), which describes how they intend to meet annual school-specific goals for all pupils, w ith specific act ivit ies toaddress state and local priorit ies. Addit ionally, data reported in an LCAP is to be consistent w ith data reported in the SARC.
For more information about SARC requirements, see the California Department of Educat ion (CDE) SARC Web page at http://www.cde.ca.gov/ta/ac/sa/.
For more information about the LCFF or LCAP, see the CDE LCFF Web page at http://www.cde.ca.gov/fg/aa/lc/.
For addit ional information about the school, parents/guardians and community members should contact the school principal or the district office.
DataQuest
Internet Access
California Department of Education
School Accountability Report CardReported Using Data from the 2016-17 School Year
DataQuest is an online data tool located on the CDE DataQuest Web page that contains addit ional information about this school and comparisons of the school tothe district and the county. Specifically, DataQuest is a dynamic system that provides reports for accountability (e.g., test data, enrollment, high school graduates,dropouts, course enrollments, staffing, and data regarding English learners).
Internet access is available at public libraries and other locat ions that are publicly accessible (e.g., the California State Library). Access to the Internet at librariesand public locat ions is generally provided on a first-come, first-served basis. Other use restrict ions may include the hours of operat ion, the length of t ime that aworkstat ion may be used (depending on availability), the types of software programs available on a workstat ion, and the ability to print documents.
Mr. Herb Espiritu, PrincipalPrincipal, Pioneer High
It is w ith great pride and humility that I share the successes of Pioneer High School in my first year as the principal, in the2016-2017 school year. Our students exceled this year – in 2017, 99% of Pioneer seniors graduated and 70% of seniorswere CSU / UC eligible. 53% of seniors enrolled in 4-year colleges, 46% enrolled in 2-year colleges, and 1% enlisted in themilitary or embarked on a mission trip. 494 students took a total of 876 AP tests in 19 subjects; 57% of all scores werethree or above, and 9% of scores were fives. Our support ive and act ive set of parent organizat ions- Athlet ic Boosters,PTSA, and Educat ion Foundat ion- initated and carried out fundraising, supervision, and event planning to ensure that allstudents have access to sports, events, classroom resources, and visual and performing arts materials and product ions.190 juniors during the 2016-2017 school year took a free-of-charge SAT Preparat ion course taught by our teachers andwe created a personalized recruitment process that resulted in at least 60% of students in all subgroups deciding to enrollin least one AP course for the 2017-2018 school year. Many of our sports programs won the Blossom Valley Athlet icLeague Championship in the 2016-2017 school year: Badminton, Golf, Boys' Soccer, Softball, Boys' Tennis, and Boys'Track and two teams won the CCS Scholast ic Achievement Award: Girls' Volleyball and Girls' Water polo. These are just afew highlights from this past school year that demonstrate the various and strong programs and opportunit ies that ourstudents have and take advantage of to become well-rounded and competent thinkers, leaders, and creators oftomorrow.
Pioneer High1290 Blossom Hill Rd.San Jose, CA 95118-3126
Phone: 408-535-6310E-mail: [email protected]
About Our SchoolAbout Our School
ContactContact
Last updated: 1/3/2018
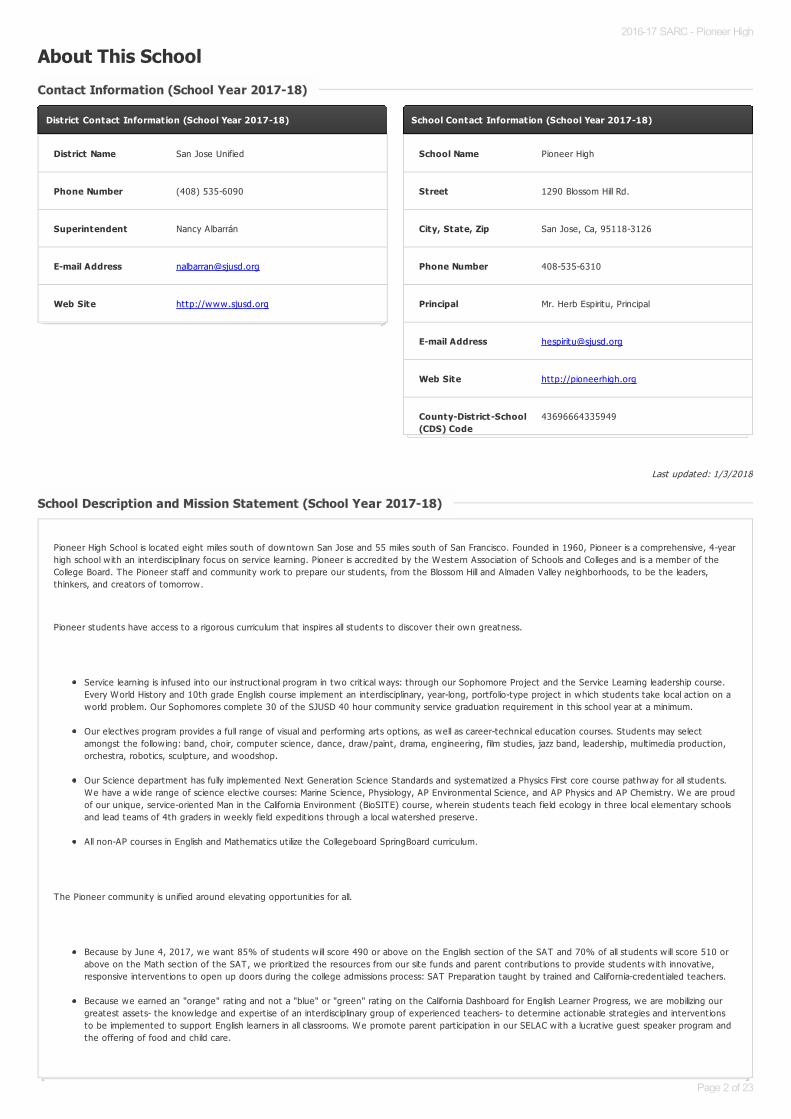
About This School
Contact Information (School Year 2017-18)Contact Information (School Year 2017-18)
District Contact Information (School Year 2017-18)
District Name San Jose Unified
Phone Number (408) 535-6090
Superintendent Nancy Albarrán
E-mail Address [email protected]
Web Site http://www.sjusd.org
School Contact Information (School Year 2017-18)
School Name Pioneer High
Street 1290 Blossom Hill Rd.
City, State, Zip San Jose, Ca, 95118-3126
Phone Number 408-535-6310
Principal Mr. Herb Espiritu, Principal
E-mail Address [email protected]
Web Site http://pioneerhigh.org
County-District-School(CDS) Code
43696664335949
School Description and Mission Statement (School Year 2017-18)School Description and Mission Statement (School Year 2017-18)
Pioneer High School is located eight miles south of downtown San Jose and 55 miles south of San Francisco. Founded in 1960, Pioneer is a comprehensive, 4-yearhigh school w ith an interdisciplinary focus on service learning. Pioneer is accredited by the Western Associat ion of Schools and Colleges and is a member of theCollege Board. The Pioneer staff and community work to prepare our students, from the Blossom Hill and Almaden Valley neighborhoods, to be the leaders,thinkers, and creators of tomorrow.
Pioneer students have access to a rigorous curriculum that inspires all students to discover their own greatness.
Service learning is infused into our instruct ional program in two crit ical ways: through our Sophomore Project and the Service Learning leadership course.Every World History and 10th grade English course implement an interdisciplinary, year-long, portfolio-type project in which students take local act ion on aworld problem. Our Sophomores complete 30 of the SJUSD 40 hour community service graduat ion requirement in this school year at a minimum.
Our elect ives program provides a full range of visual and performing arts opt ions, as well as career-technical educat ion courses. Students may selectamongst the follow ing: band, choir, computer science, dance, draw/paint, drama, engineering, film studies, jazz band, leadership, mult imedia product ion,orchestra, robot ics, sculpture, and woodshop.
Our Science department has fully implemented Next Generat ion Science Standards and systematized a Physics First core course pathway for all students.We have a w ide range of science elect ive courses: Marine Science, Physiology, AP Environmental Science, and AP Physics and AP Chemistry. We are proudof our unique, service-oriented Man in the California Environment (BioSITE) course, wherein students teach field ecology in three local elementary schoolsand lead teams of 4th graders in weekly field expedit ions through a local watershed preserve.
All non-AP courses in English and Mathematics ut ilize the Collegeboard SpringBoard curriculum.
The Pioneer community is unified around elevat ing opportunit ies for all.
Because by June 4, 2017, we want 85% of students w ill score 490 or above on the English sect ion of the SAT and 70% of all students w ill score 510 orabove on the Math sect ion of the SAT, we priorit ized the resources from our site funds and parent contribut ions to provide students w ith innovat ive,responsive intervent ions to open up doors during the college admissions process: SAT Preparat ion taught by trained and California-credent ialed teachers.
Because we earned an "orange" rat ing and not a "blue" or "green" rat ing on the California Dashboard for English Learner Progress, we are mobilizing ourgreatest assets- the knowledge and expert ise of an interdisciplinary group of experienced teachers- to determine act ionable strategies and intervent ionsto be implemented to support English learners in all classrooms. We promote parent part icipat ion in our SELAC w ith a lucrat ive guest speaker program andthe offering of food and child care.
2016-17 SARC - Pioneer High
Page 2 of 23

Last updated: 1/9/2018
2016-17 SARC - Pioneer High
Page 3 of 23

Last updated: 1/8/2018
Last updated: 1/8/2018
Student Enrollment by Grade Level (School Year 2016-17)Student Enrollment by Grade Level (School Year 2016-17)
Grade Level Number of Students
Grade 9 434
Grade 10 412
Grade 11 397
Grade 12 389
Total Enrollment 1632
Grade 9 Grade 10 Grade 11 Grade 120
50
100
150
200
250
300
350
400
450
Student Enrollment by Student Group (School Year 2016-17)Student Enrollment by Student Group (School Year 2016-17)
Student Group Percent of Total Enrollment
Black or African American 2.5 %
American Indian or Alaska Nat ive 0.2 %
Asian 14.2 %
Filipino 2.5 %
Hispanic or Lat ino 34.6 %
Native Hawaiian or Pacific Islander 0.2 %
White 43.8 %
Two or More Races 1.4 %
Other 0.6 %
Student Group (Other) Percent of Total Enrollment
Socioeconomically Disadvantaged 30.4 %
English Learners 6.0 %
Students w ith Disabilit ies 8.1 %
Foster Youth 0.1 %
2016-17 SARC - Pioneer High
Page 4 of 23
Last updated: 1/24/2018
Last updated: 1/24/2018
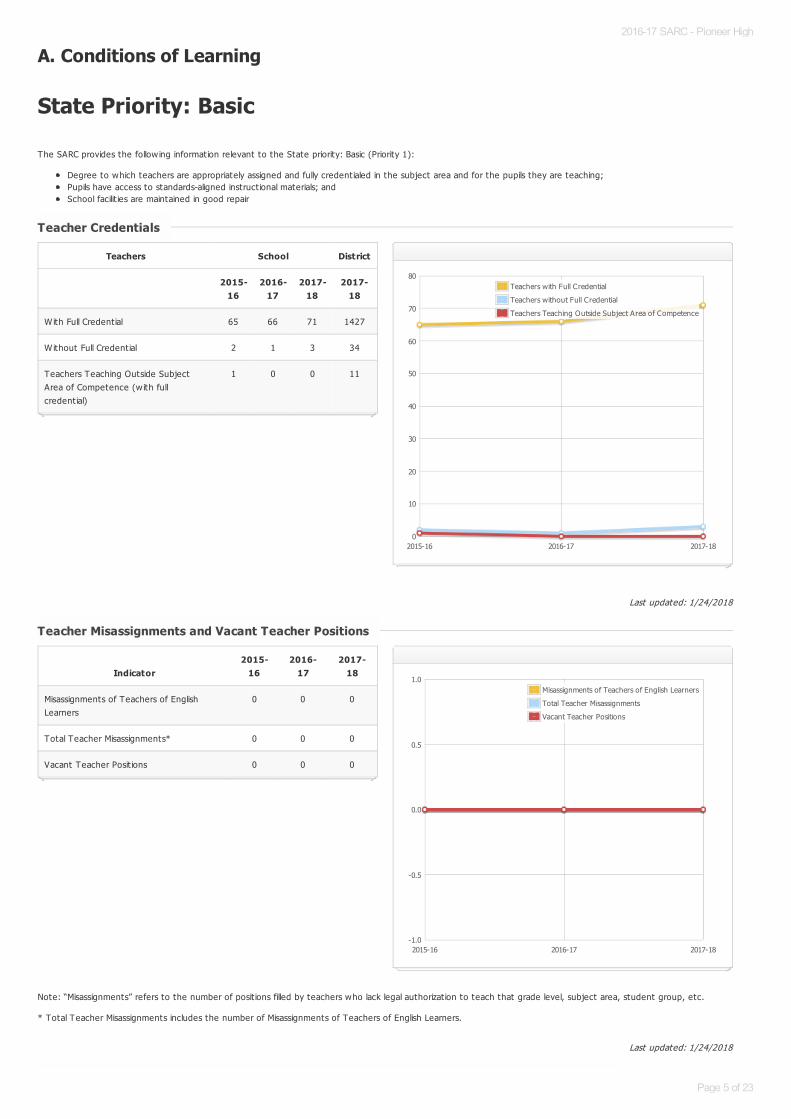
A. Conditions of Learning
State Priority: Basic
The SARC provides the follow ing information relevant to the State priority: Basic (Priority 1):
Degree to which teachers are appropriately assigned and fully credent ialed in the subject area and for the pupils they are teaching;Pupils have access to standards-aligned instruct ional materials; andSchool facilit ies are maintained in good repair
Note: “Misassignments” refers to the number of posit ions filled by teachers who lack legal authorizat ion to teach that grade level, subject area, student group, etc.
* Total Teacher Misassignments includes the number of Misassignments of Teachers of English Learners.
Teacher CredentialsTeacher Credentials
Teachers School District
2015-16
2016-17
2017-18
2017-18
With Full Credent ial 65 66 71 1427
Without Full Credent ial 2 1 3 34
Teachers Teaching Outside SubjectArea of Competence (w ith fullcredent ial)
1 0 0 11
2015-16 2016-17 2017-180
10
20
30
40
50
60
70
80Teachers with Full Credential
Teachers without Full Credential
Teachers Teaching Outside Subject Area of Competence
Teacher Misassignments and Vacant Teacher PositionsTeacher Misassignments and Vacant Teacher Positions
Indicator2015-
162016-
172017-
18
Misassignments of Teachers of EnglishLearners
0 0 0
Total Teacher Misassignments* 0 0 0
Vacant Teacher Posit ions 0 0 0
2015-16 2016-17 2017-18-1.0
-0.5
0.0
0.5
1.0Misassignments of Teachers of English Learners
Total Teacher Misassignments
Vacant Teacher Positions
2016-17 SARC - Pioneer High
Page 5 of 23

Last updated: 1/31/2018
Year and month in which the data were collected: January 2018
Quality, Currency, Availability of Textbooks and Instructional Materials (School Year 2017-18)Quality, Currency, Availability of Textbooks and Instructional Materials (School Year 2017-18)
Note: Cells w ith N/A values do not require data.
SubjectTextbooks and Instructional Materials/year of
AdoptionFrom Most Recent
Adoption?Percent Students Lacking Own
Assigned Copy
Reading/Language ArtsMaterials List:
https://sjusd.box.com/s/o0g6hno3vsgegmyorlsjhucf3c52mvy3
Yes 0.0 %
Mathematics Yes 0.0 %
Science Yes 0.0 %
History-Social Science Yes 0.0 %
Foreign Language Yes 0.0 %
Health Yes 0.0 %
Visual and Performing Arts Yes 0.0 %
Science Lab Eqpmt(Grades 9-12)
N/A N/A 0.0 %
2016-17 SARC - Pioneer High
Page 6 of 23
Last updated: 1/11/2018
Last updated: 1/5/2018
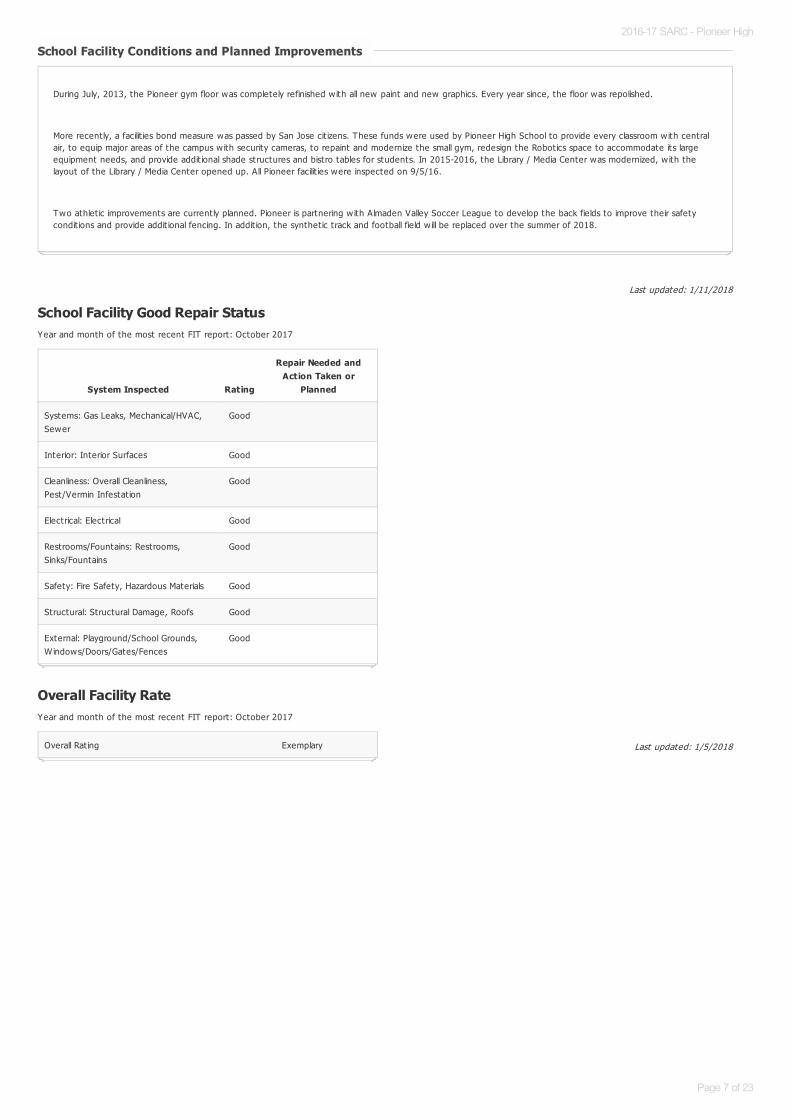
School Facility Good Repair StatusYear and month of the most recent FIT report: October 2017
Overall Facility RateYear and month of the most recent FIT report: October 2017
School Facility Conditions and Planned ImprovementsSchool Facility Conditions and Planned Improvements
During July, 2013, the Pioneer gym floor was completely refinished w ith all new paint and new graphics. Every year since, the floor was repolished.
More recent ly, a facilit ies bond measure was passed by San Jose cit izens. These funds were used by Pioneer High School to provide every classroom with centralair, to equip major areas of the campus w ith security cameras, to repaint and modernize the small gym, redesign the Robotics space to accommodate its largeequipment needs, and provide addit ional shade structures and bistro tables for students. In 2015-2016, the Library / Media Center was modernized, w ith thelayout of the Library / Media Center opened up. All Pioneer facilit ies were inspected on 9/5/16.
Two athlet ic improvements are current ly planned. Pioneer is partnering w ith Almaden Valley Soccer League to develop the back fields to improve their safetycondit ions and provide addit ional fencing. In addit ion, the synthet ic track and football field w ill be replaced over the summer of 2018.
System Inspected Rating
Repair Needed andAction Taken or
Planned
Systems: Gas Leaks, Mechanical/HVAC,Sewer
Good
Interior: Interior Surfaces Good
Cleanliness: Overall Cleanliness,Pest/Vermin Infestat ion
Good
Electrical: Electrical Good
Restrooms/Fountains: Restrooms,Sinks/Fountains
Good
Safety: Fire Safety, Hazardous Materials Good
Structural: Structural Damage, Roofs Good
External: Playground/School Grounds,W indows/Doors/Gates/Fences
Good
Overall Rat ing Exemplary
2016-17 SARC - Pioneer High
Page 7 of 23
Last updated: 1/8/2018
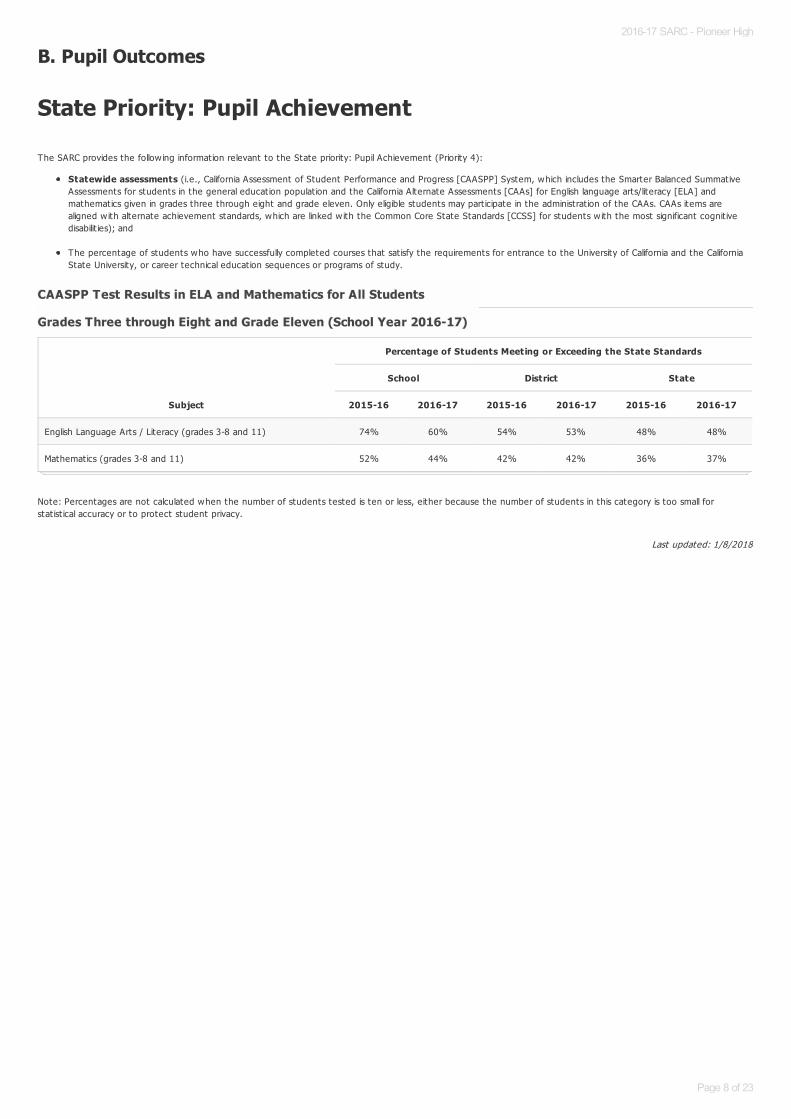
B. Pupil Outcomes
State Priority: Pupil Achievement
The SARC provides the follow ing information relevant to the State priority: Pupil Achievement (Priority 4):
Statewide assessments (i.e., California Assessment of Student Performance and Progress [CAASPP] System, which includes the Smarter Balanced SummativeAssessments for students in the general educat ion populat ion and the California Alternate Assessments [CAAs] for English language arts/literacy [ELA] andmathematics given in grades three through eight and grade eleven. Only eligible students may part icipate in the administrat ion of the CAAs. CAAs items arealigned w ith alternate achievement standards, which are linked w ith the Common Core State Standards [CCSS] for students w ith the most significant cognit ivedisabilit ies); and
The percentage of students who have successfully completed courses that sat isfy the requirements for entrance to the University of California and the CaliforniaState University, or career technical educat ion sequences or programs of study.
Note: Percentages are not calculated when the number of students tested is ten or less, either because the number of students in this category is too small forstat ist ical accuracy or to protect student privacy.
CAASPP Test Results in ELA and Mathematics for All StudentsCAASPP Test Results in ELA and Mathematics for All Students
Grades Three through Eight and Grade Eleven Grades Three through Eight and Grade Eleven (School Year 2016-17)(School Year 2016-17)
Subject
Percentage of Students Meeting or Exceeding the State Standards
School District State
2015-16 2016-17 2015-16 2016-17 2015-16 2016-17
English Language Arts / Literacy (grades 3-8 and 11) 74% 60% 54% 53% 48% 48%
Mathematics (grades 3-8 and 11) 52% 44% 42% 42% 36% 37%
2016-17 SARC - Pioneer High
Page 8 of 23

Last updated: 1/8/2018
Note: ELA test results include the Smarter Balanced Summative Assessment and the CAA. The “Percent Met or Exceeded” is calculated by taking the total number ofstudents who met or exceeded the standard on the Smarter Balanced Summative Assessment plus the total number of students who met the standard (i.e., achievedLevel 3–Alternate) on the CAAs divided by the total number of students who part icipated in both assessments.
Note: Double dashes (--) appear in the table when the number of students is ten or less, either because the number of students in this category is too small forstat ist ical accuracy or to protect student privacy.
Note: The number of students tested includes all students who part icipated in the test whether they received a score or not; however, the number of students testedis not the number that was used to calculate the achievement level percentages. The achievement level percentages are calculated using only students who receivedscores.
CAASPP Test Results in ELA by Student Group CAASPP Test Results in ELA by Student Group
Grades Three through Eight and Grade Eleven (School Year 2016-17)Grades Three through Eight and Grade Eleven (School Year 2016-17)
Student Group Total Enrollment Number Tested Percent Tested Percent Met or Exceeded
All Students 395 388 98.23% 59.79%
Male 207 205 99.03% 56.59%
Female 188 183 97.34% 63.39%
Black or African American -- -- --
American Indian or Alaska Nat ive -- -- --
Asian 70 70 100.00% 84.29%
Filipino 100.00% 54.55%
Hispanic or Lat ino 126 123 97.62% 40.65%
Native Hawaiian or Pacific Islander
White 172 168 97.67% 62.50%
Two or More Races -- -- --
Socioeconomically Disadvantaged 122 121 99.18% 38.02%
English Learners 38 38 100.00% 13.16%
Students w ith Disabilit ies 32 28 87.50% 21.43%
Students Receiving Migrant Educat ion Services
Foster Youth
2016-17 SARC - Pioneer High
Page 9 of 23
Last updated: 1/8/2018
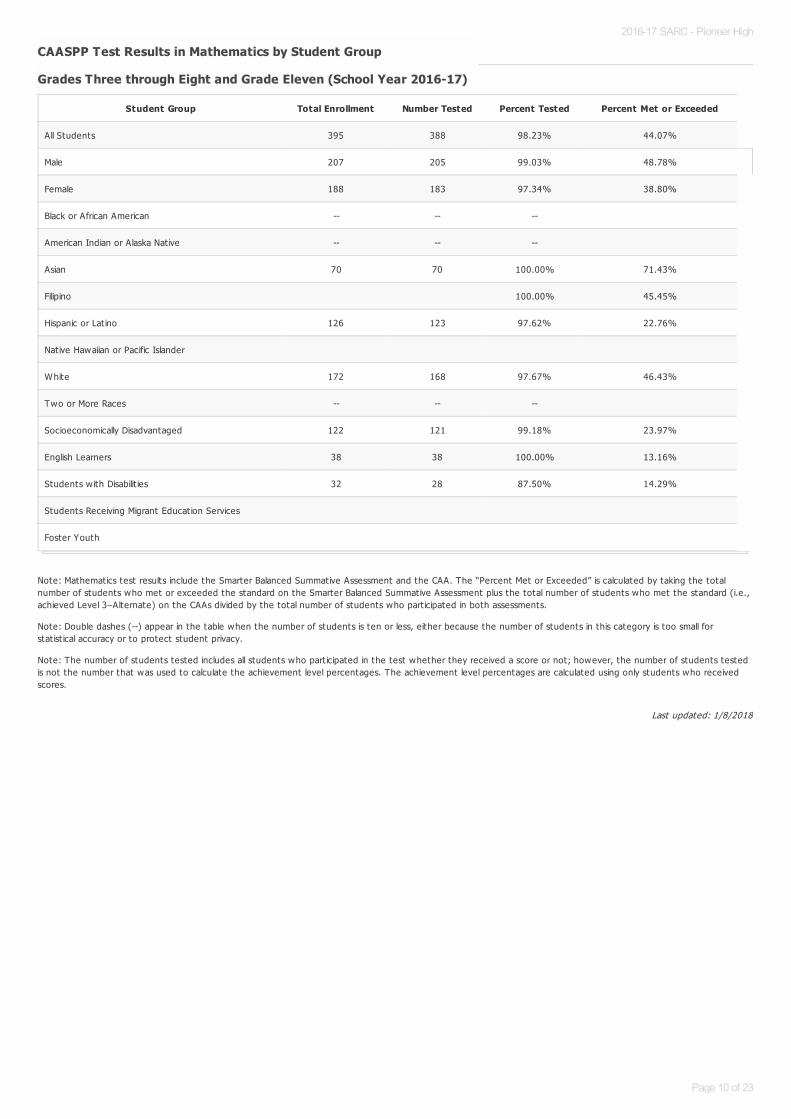
Note: Mathematics test results include the Smarter Balanced Summative Assessment and the CAA. The “Percent Met or Exceeded” is calculated by taking the totalnumber of students who met or exceeded the standard on the Smarter Balanced Summative Assessment plus the total number of students who met the standard (i.e.,achieved Level 3–Alternate) on the CAAs divided by the total number of students who part icipated in both assessments.
Note: Double dashes (--) appear in the table when the number of students is ten or less, either because the number of students in this category is too small forstat ist ical accuracy or to protect student privacy.
Note: The number of students tested includes all students who part icipated in the test whether they received a score or not; however, the number of students testedis not the number that was used to calculate the achievement level percentages. The achievement level percentages are calculated using only students who receivedscores.
CAASPP Test Results in Mathematics by Student GroupCAASPP Test Results in Mathematics by Student Group
Grades Three through Eight and Grade Eleven (School Year 2016-17)Grades Three through Eight and Grade Eleven (School Year 2016-17)
Student Group Total Enrollment Number Tested Percent Tested Percent Met or Exceeded
All Students 395 388 98.23% 44.07%
Male 207 205 99.03% 48.78%
Female 188 183 97.34% 38.80%
Black or African American -- -- --
American Indian or Alaska Nat ive -- -- --
Asian 70 70 100.00% 71.43%
Filipino 100.00% 45.45%
Hispanic or Lat ino 126 123 97.62% 22.76%
Native Hawaiian or Pacific Islander
White 172 168 97.67% 46.43%
Two or More Races -- -- --
Socioeconomically Disadvantaged 122 121 99.18% 23.97%
English Learners 38 38 100.00% 13.16%
Students w ith Disabilit ies 32 28 87.50% 14.29%
Students Receiving Migrant Educat ion Services
Foster Youth
2016-17 SARC - Pioneer High
Page 10 of 23
Last updated: 1/8/2018
Last updated: 12/18/2017
Last updated: 12/18/2017
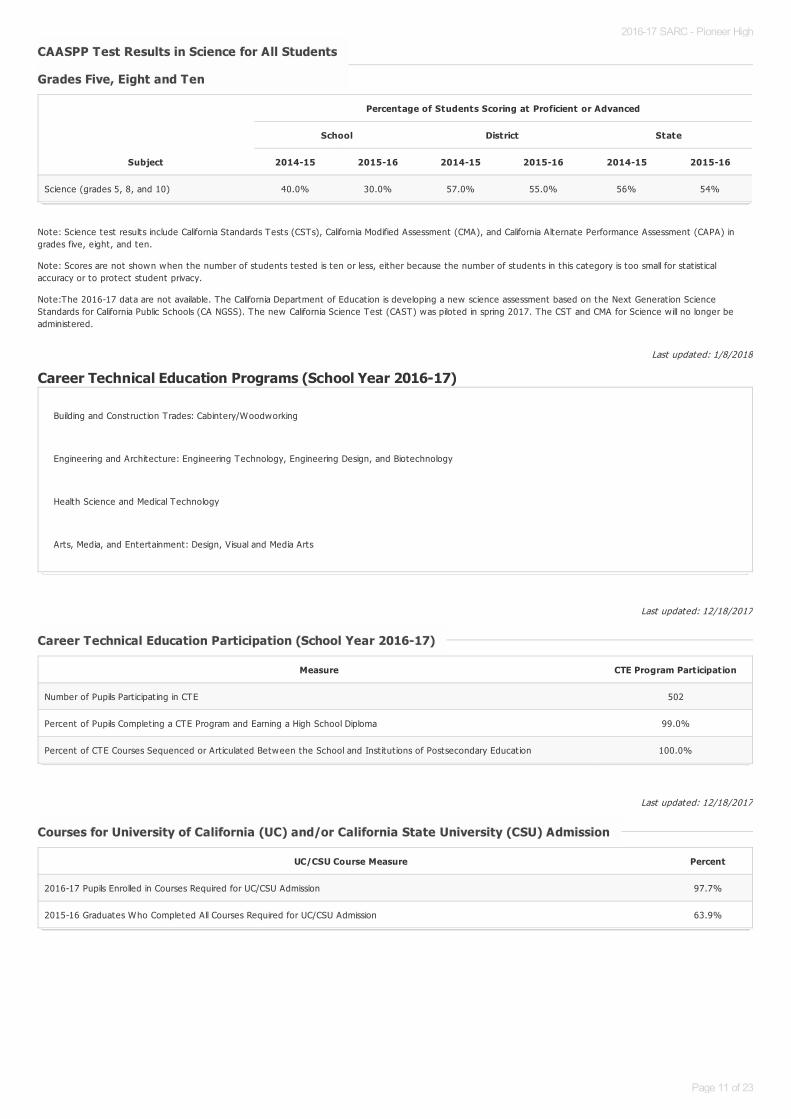
Note: Science test results include California Standards Tests (CSTs), California Modified Assessment (CMA), and California Alternate Performance Assessment (CAPA) ingrades five, eight, and ten.
Note: Scores are not shown when the number of students tested is ten or less, either because the number of students in this category is too small for stat ist icalaccuracy or to protect student privacy.
Note:The 2016-17 data are not available. The California Department of Educat ion is developing a new science assessment based on the Next Generat ion ScienceStandards for California Public Schools (CA NGSS). The new California Science Test (CAST) was piloted in spring 2017. The CST and CMA for Science w ill no longer beadministered.
Career Technical Education Programs (School Year 2016-17)
CAASPP Test Results in Science for All StudentsCAASPP Test Results in Science for All Students
Grades Five, Eight and TenGrades Five, Eight and Ten
Subject
Percentage of Students Scoring at Proficient or Advanced
School District State
2014-15 2015-16 2014-15 2015-16 2014-15 2015-16
Science (grades 5, 8, and 10) 40.0% 30.0% 57.0% 55.0% 56% 54%
Building and Construct ion Trades: Cabintery/Woodworking
Engineering and Architecture: Engineering Technology, Engineering Design, and Biotechnology
Health Science and Medical Technology
Arts, Media, and Entertainment: Design, Visual and Media Arts
Career Technical Education Participation (School Year 2016-17)Career Technical Education Participation (School Year 2016-17)
Measure CTE Program Participation
Number of Pupils Part icipat ing in CTE 502
Percent of Pupils Complet ing a CTE Program and Earning a High School Diploma 99.0%
Percent of CTE Courses Sequenced or Art iculated Between the School and Inst itut ions of Postsecondary Educat ion 100.0%
Courses for University of California (UC) and/or California State University (CSU) AdmissionCourses for University of California (UC) and/or California State University (CSU) Admission
UC/CSU Course Measure Percent
2016-17 Pupils Enrolled in Courses Required for UC/CSU Admission 97.7%
2015-16 Graduates Who Completed All Courses Required for UC/CSU Admission 63.9%
2016-17 SARC - Pioneer High
Page 11 of 23

Last updated: 1/8/2018
Last updated: 1/8/2018
State Priority: Other Pupil Outcomes
The SARC provides the follow ing information relevant to the State priority: Other Pupil Outcomes (Priority 8):
Pupil outcomes in the subject area of physical educat ion
Note: Percentages are not calculated when the number of students tested is ten or less, either because the number of students in this category is too small forstat ist ical accuracy or to protect student privacy.
California Physical Fitness Test Results (School Year 2016-17)California Physical Fitness Test Results (School Year 2016-17)
Grade Level
Percentage of Students Meeting Fitness Standards
Four of Six Fitness Standards Five of Six Fitness Standards Six of Six Fitness Standards
9 16.0% 21.6% 44.5%
2016-17 SARC - Pioneer High
Page 12 of 23
C. Engagement
State Priority: Parental Involvement
The SARC provides the follow ing information relevant to the State priority: Parental Involvement (Priority 3):
Efforts the school district makes to seek parent input in making decisions for the school district and each schoolsite
Opportunities for Parental Involvement (School Year 2017-18)Opportunities for Parental Involvement (School Year 2017-18)
Pioneer firmly believes that our parent community is vital to our well-being as a school and to the well-being of our students. We invite parents to part icipate inthe funct ions of the school by part icipat ing in any of the follow ing ways (the locat ion to contact in parentheses):
Help raise funds for the Mustang student general funds by part icipat ing in our Student Store as a Parent Volunteer (see the Associated Student Body(ASB) Clerk, [email protected]) during brunch or lunch t ime on a school day: pick your best shift , one or two days a month.
The parents at our Principal's Coffee have the opportunity to hear a principal's report and provide input on schoolw ide init iat ives. This group reviews theSingle Plan for Student Achievement on an annual basis. Attend a monthly Principal's Coffee in the front office during a weekday (see the front office,[email protected]).
Our Educat ion Foundat ion allows our students to part icipate in extracurricular act ivit ies like the Nat ional Honor Society, Science Olympiad, and the Turn-Around Awards. Foundat ion funds support the service learning program, subsidizes the cost of producing the student run newspaper, Pony Express, andprovides student scholarships and senior awards. Students went on field trips w ith their art class, attended a Journalism nat ional conference and hadequipment for labs and classrooms because of them. Join one of their meetings, after the PTSA meetings on the second Tuesday of the month in theLibrary / Media Center.(educat ionfoundat [email protected]).
The Pioneer Mustangs had a "Best Week Ever" w ith free snacks and act ivit ies because of the support and organizat ion of the PTSA. Every on-site danceprovides an opportunity to support the PTSA by volunteering for the coat check. No supervision necessary! Become a member and attend a meeting ofthe PTSA, held on the second Tuesday of the month in the library / Media Center (see the front office for a PTSA contact email, [email protected]).
We want to hear from the parents of our students who are English learners! Please attend one of our Site English Learner Advisory Committee meetings:at least six meetings are held per year in the Conference Room of the front office on the third Tuesday of the month. The SELA Committee reviews andmakes recommendations on the Site Single Plan for Student Achievement. (See the front office for a SELAC contact email, [email protected]).
Meet ings of our School Site Council are open to the public and occur on the second Thursday of the month after-school in the Conference Room in thefront office. The School Site Council reviews and makes recommendations on the Site Single Plan for Student Achievement and submits it for approval tothe SJUSD governing board. (See the front office for a School Site Council contact email, [email protected]).
We are proud that all students have free transportat ion and uniforms for the sports they play where they bear the Mustang logo. This happens due tothe non-stop organizat ion of our Athlet ic Boosters organizat ion. Every football game has an opt ion of a tri-t ip sandwich because of the enduring parentalsupport of our Athlet ic Boosters. Funds that are raised are shared across all Pioneer sports. (See the front office for an Athlet ic Boosters contact email,[email protected]).
Make copies for classrooms. Yes, it 's as simple as that, and yet for a teacher, it 's a dream come true. Sign up for a shift on a school day and processthrough copy requests for teachers: support is right by your side as well! (See Satu Sharman, Library / Media Center Technician [email protected]).
Six t imes a year, the Academic Counseling staff hold parent information nights that are organized by student grade level and topic. (See the AcademicCounseling tab on the pioneerhigh.org website for more information.)
For more information, please contact Pioneer High School at 408-535-6310
2016-17 SARC - Pioneer High
Page 13 of 23

Last updated: 1/10/2018
Last updated: 1/8/2018
State Priority: Pupil Engagement
The SARC provides the follow ing information relevant to the State priority: Pupil Engagement (Priority 5):
High school dropout rates; andHigh school graduat ion rates
Dropout Rate and Graduation Rate (Four-Year Cohort Rate)Dropout Rate and Graduation Rate (Four-Year Cohort Rate)
Indicator
School District State
2013-14 2014-15 2015-16 2013-14 2014-15 2015-16 2013-14 2014-15 2015-16
Dropout Rate 0.8% 4.0% 2.3% 7.1% 7.7% 6.4% 11.5% 10.7% 9.7%
Graduat ion Rate 98.6% 93.9% 96.5% 85.9% 85.4% 87.7% 81.0% 82.3% 83.8%
Dropout/Graduation Rate (Four-Year Cohort Rate) Chart
2013-14 2014-15 2015-160
20
40
60
80
100
120Dropout Rate
Graduation Rate
2016-17 SARC - Pioneer High
Page 14 of 23

Completion of High School Graduation Requirements - Graduating Class of 2016 Completion of High School Graduation Requirements - Graduating Class of 2016
(One-Year Rate)(One-Year Rate)
Student Group School District State
All Students 95.2% 88.4% 87.1%
Black or African American 100.0% 85.0% 79.2%
American Indian or Alaska Nat ive 100.0% 100.0% 80.2%
Asian 98.0% 97.9% 94.4%
Filipino 92.9% 90.6% 93.8%
Hispanic or Lat ino 92.9% 83.4% 84.6%
Native Hawaiian or Pacific Islander 100.0% 92.3% 86.6%
White 96.3% 93.8% 91.0%
Two or More Races 76.9% 91.3% 90.6%
Socioeconomically Disadvantaged 96.7% 90.5% 85.5%
English Learners 70.0% 52.6% 55.4%
Students w ith Disabilit ies 71.4% 57.1% 63.9%
Foster Youth 0.0% 37.5% 68.2%
2016-17 SARC - Pioneer High
Page 15 of 23
Last updated: 1/8/2018
Last updated: 1/8/2018
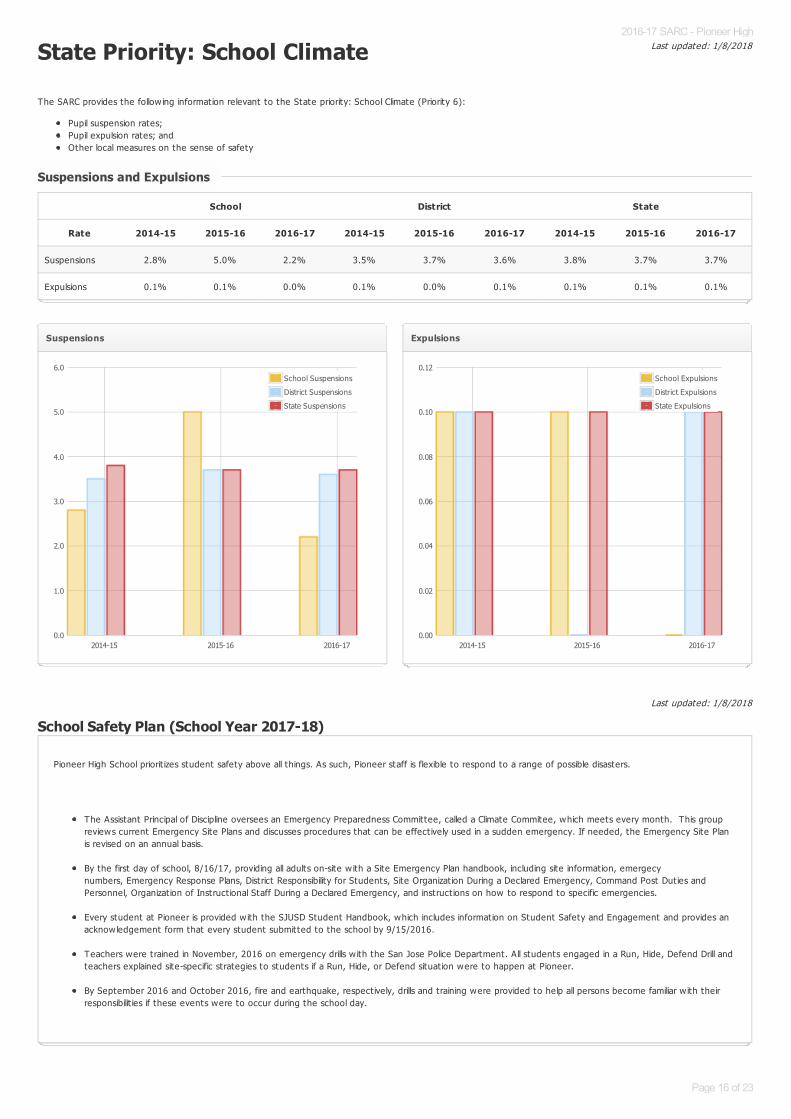
State Priority: School Climate
The SARC provides the follow ing information relevant to the State priority: School Climate (Priority 6):
Pupil suspension rates;Pupil expulsion rates; andOther local measures on the sense of safety
School Safety Plan (School Year 2017-18)
Suspensions and ExpulsionsSuspensions and Expulsions
School District State
Rate 2014-15 2015-16 2016-17 2014-15 2015-16 2016-17 2014-15 2015-16 2016-17
Suspensions 2.8% 5.0% 2.2% 3.5% 3.7% 3.6% 3.8% 3.7% 3.7%
Expulsions 0.1% 0.1% 0.0% 0.1% 0.0% 0.1% 0.1% 0.1% 0.1%
Suspensions
2014-15 2015-16 2016-170.0
1.0
2.0
3.0
4.0
5.0
6.0School Suspensions
District Suspensions
State Suspensions
Expulsions
2014-15 2015-16 2016-170.00
0.02
0.04
0.06
0.08
0.10
0.12School Expulsions
District Expulsions
State Expulsions
Pioneer High School priorit izes student safety above all things. As such, Pioneer staff is flexible to respond to a range of possible disasters.
The Assistant Principal of Discipline oversees an Emergency Preparedness Committee, called a Climate Commitee, which meets every month. This groupreviews current Emergency Site Plans and discusses procedures that can be effect ively used in a sudden emergency. If needed, the Emergency Site Planis revised on an annual basis.
By the first day of school, 8/16/17, providing all adults on-site w ith a Site Emergency Plan handbook, including site information, emergecynumbers, Emergency Response Plans, District Responsibility for Students, Site Organizat ion During a Declared Emergency, Command Post Dut ies andPersonnel, Organizat ion of Instruct ional Staff During a Declared Emergency, and instruct ions on how to respond to specific emergencies.
Every student at Pioneer is provided w ith the SJUSD Student Handbook, which includes information on Student Safety and Engagement and provides anacknowledgement form that every student submitted to the school by 9/15/2016.
Teachers were trained in November, 2016 on emergency drills w ith the San Jose Police Department. All students engaged in a Run, Hide, Defend Drill andteachers explained site-specific strategies to students if a Run, Hide, or Defend situat ion were to happen at Pioneer.
By September 2016 and October 2016, fire and earthquake, respect ively, drills and training were provided to help all persons become familiar w ith theirresponsibilit ies if these events were to occur during the school day.
2016-17 SARC - Pioneer High
Page 16 of 23

Last updated: 1/10/20182016-17 SARC - Pioneer High
Page 17 of 23

Last updated: 1/25/2018
Last updated: 1/25/2018
D. Other SARC InformationThe information in this sect ion is required to be in the SARC but is not included in the state priorit ies for LCFF.
Average Class Size and Class Size Distribution (Elementary)
* Number of classes indicates how many classes fall into each size category (a range of total students per class).
Federal Intervention Program (School Year 2017-18)Federal Intervention Program (School Year 2017-18)
Indicator School District
Program Improvement Status In PI
First Year of Program Improvement 2009-2010
Year in Program Improvement Year 3
Number of Schools Current ly in Program Improvement N/A 16
Percent of Schools Current ly in Program Improvement N/A 61.5%
2014-15 2015-16 2016-17
Grade Level Average Class Size
Number of Classes *
Average Class Size
Number of Classes *
Average Class Size
Number of Classes *
1-20 21-32 33+ 1-20 21-32 33+ 1-20 21-32 33+
K
1
2
3
4
5
6
Other
2016-17 SARC - Pioneer High
Page 18 of 23

Last updated: 1/25/2018
Last updated: 1/25/2018
Last updated: 1/25/2018
* Number of classes indicates how many classrooms fall into each size category (a range of total students per classroom). At the secondary school level, this information isreported by subject area rather than grade level.
Academic Counselors and Other Support Staff (School Year 2016-17)
Note: Cells w ith N/A values do not require data.
*One Full T ime Equivalent (FTE) equals one staff member working full t ime; one FTE could also represent two staff members who each work 50 percent of full t ime.
Note: Cells w ith N/A values do not require data.
Average Class Size and Class Size Distribution (Secondary)Average Class Size and Class Size Distribution (Secondary)
2014-15 2015-16 2016-17
Subject Average Class Size
Number of Classes *
Average Class Size
Number of Classes *
Average Class Size
Number of Classes *
1-22 23-32 33+ 1-22 23-32 33+ 1-22 23-32 33+
English 27.0 16 35 18 27.0 12 26 23 26.0 13 36 16
Mathematics 28.0 7 37 9 28.0 8 27 18 26.0 15 29 18
Science 27.0 14 24 20 28.0 7 26 19 22.0 25 30 19
Social Science 28.0 8 16 22 29.0 8 13 24 25.0 14 24 17
Title Number of FTE* Assigned to School Average Number of Students per Academic Counselor
Academic Counselor 3.3 502.0
Counselor (Social/Behavioral or Career Development) 0.6 N/A
Library Media Teacher (Librarian) 0.0 N/A
Library Media Services Staff (Paraprofessional) 0.8 N/A
Psychologist 0.8 N/A
Social Worker 0.0 N/A
Nurse 0.5 N/A
Speech/Language/Hearing Specialist 0.5 N/A
Resource Specialist (non-teaching) 4.7 N/A
Other 0.2 N/A
Expenditures Per Pupil and School Site Teacher Salaries (Fiscal Year 2015-16)Expenditures Per Pupil and School Site Teacher Salaries (Fiscal Year 2015-16)
Level Total Expenditures Per PupilExpenditures Per Pupil
(Restricted)Expenditures Per Pupil
(Unrestricted) Average Teacher Salary
School Site $10450.5 $2713.0 $7737.5 $70385.6
District N/A N/A $8016.2 $72711.6
Percent Difference – School Site and District N/A N/A -3.5% -3.3%
State N/A N/A $6574.0 $79228.0
Percent Difference – School Site and State N/A N/A 16.3% -11.8%
2016-17 SARC - Pioneer High
Page 19 of 23

Last updated: 1/10/2018
For detailed information on salaries, see the CDE Cert ificated Salaries & Benefits Web page at http://www.cde.ca.gov/ds/fd/cs/ .
Types of Services Funded (Fiscal Year 2016-17)Types of Services Funded (Fiscal Year 2016-17)
During the 2016-2017 school year, the follow ing programs and services were available at Pioneer High School:
As is the case w ith all students in SJUSD, 10th grade students at Pioneer all took the PSAT on a school day in October, free of cost to them. 11th gradestudents all took the SAT during a school day in March. Students whose families submitted a Free- and Reduced Pay-Meal Form, regardless of theireligibility, also were able to purchase AP exams for a charge of $5.
The Pioneer High School faculty consists of Resource Specialists, an Aut ism Resource Personnel and Counselor, a Speech and Language Pathologist, aSchool Psychologist, a Severely Handicapped and Special Day Class teachers. These individuals together provide services to students who have anIndividualized Educat ion Plan.
Pioneer High School administrat ion consists of one Assistant Principal of Guidance, who oversees services for students w ith IEPs and ensuresaccommodations are being met for students w ith Sect ion 504 Plans.
One to two socioemotional counselors are provided on-site during the school day. One day a week, a behavior specialist counsels a caseload of students.
A Coordinat ion of Services Team meeting is held every month to discuss students in need of addit ional intervent ions or services and includes the AssistantPrincipal of Discipline, an academic counselor, a socioemotional counselor, a Child, Welfare, and Attendance counselor, and the school nurse, amongstother support providers.
After-school support in the Library/Media Center and various classrooms was provided by teachers and peer tutors in math, English, and Science. One day aweek, a cert ificated and classified staff member hosted a homework support center for students designated as English learners.
Two cert ificated staff members served the roles of mentor and case manager for 40 students who were juniors or seniors and taking an AP course for thefirst t ime and two staff members served these same roles for students who receive a free- or reduced pay-lunch. One staff member was a case managerand provided pull out support to students who had previously been in an intervent ion course.
During the summer, a LEAP summer academy was held for students taking their first AP course wherein they worked w ith their soon-to-be AP teacherand received relevant school supplies.
11th graders could request to enroll in a 10 session SAT Preparat ion course taught by a Pioneer High English or Math teacher. In addit ion, all juniors hadthe opt ion to attend a mock administrat ion of the SATs on a Saturday wherein they received score reports on their performance. 190 students receivedthis service in 2016-17.
Teacher and Administrative Salaries (Fiscal Year 2015-16)Teacher and Administrative Salaries (Fiscal Year 2015-16)
Category District Amount State Average For Districts In Same Category
Beginning Teacher Salary $53,358 $47,808
Mid-Range Teacher Salary $77,532 $73,555
Highest Teacher Salary $93,642 $95,850
Average Principal Salary (Elementary) $103,741 $120,448
Average Principal Salary (Middle) $108,855 $125,592
Average Principal Salary (High) $117,012 $138,175
Superintendent Salary $263,799 $264,457
Percent of Budget for Teacher Salaries 33.0% 35.0%
Percent of Budget for Administrat ive Salaries 5.0% 5.0%
Teacher Salary Chart
100000
Principal Salary Chart
120000
2016-17 SARC - Pioneer High
Page 20 of 23

Last updated: 1/8/2018
Beginning Teacher Salary Mid-Range Teacher Salary Highest Teacher Salary0
20000
40000
60000
80000
100000
Average Principal Salary
(Elementary)
Average Principal Salary
(Middle)
Average Principal Salary
(High)
0
20000
40000
60000
80000
100000
1200002016-17 SARC - Pioneer High
Page 21 of 23

Last updated: 1/8/2018
Note: Cells w ith N/A values do not require data.
*Where there are student course enrollments of at least one student.
Professional Development
Advanced Placement (AP) Courses (School Year 2016-17)Advanced Placement (AP) Courses (School Year 2016-17)
Subject Number of AP Courses Offered* Percent of Students In AP Courses
Computer Science 1 N/A
English 2 N/A
Fine and Performing Arts 1 N/A
Foreign Language 1 N/A
Mathematics 3 N/A
Science 3 N/A
Social Science 4 N/A
All Courses 16 33.7%
Pioneer High School and the SJUSD know that one of our biggest investments in student outcomes lies in the knowledge and abilit ies of our staff. As a result , agreat deal of professional development opportunit ies have been offered to teachers since 2015.
All teachers and classified staff had two days of professional development training at the start of the 2015-16, 2016-17, and 2017-18 school years andagain on the first day of the second semester of each of those years. For 2016-17, professional development sessions focused on the district standards forthe teaching profession. For 2017-18, professional development sessions focused on building student resiliency and draft ing SMART goals.
English and Math teachers were provided one day of release t ime and two hours of paid after-school collaborat ion t ime each semester in the 2016-17 and2017-18 school years to develop unit and lesson plans while adapt ing to the SpringBoard curriculum.
Pioneer English and Math teachers were trained during and after school on best pract ices for support ing success on the SAT exam by Future Path Prep inthe 2016-17 and 2017-18 school years.
Teachers meet every Thursday morning for an hour in one of the follow ing professional development formats: as a whole faculty, meeting in a departmentsett ing, and/or planning w ith a course-alike team.
Coaching Cycles are available to all teachers, wherein they may work w ith an instruct ional coach on an instruct ional theme of their choosing.
A group of volunteer teachers collaborated in the Fall of 2016 to draft and then finalize an explicit behavior matrix to address concerns that werepresented by a WASC Visit ing Committee that staff needed cultural responsiveness training. This group ident ified the areas of the behavior matrix thatneeded training and attent ion during faculty meetings. Teachers then trained each other on the elements of the behavior matrix and all teachers receivedprofessional development around Growth Mindset act ions and act ivity.
In the 2017-18 school year, a Needs Assessment was conducted in which over 25 classrooms were observed and student outcomes were measured. Theanalysis of the impact of instruct ional design on student learning result ing in the draft ing of a Professional Development Plan for the school year in which 6faculty meeting t imes would be devoted to the topics of closing lessons and different iat ing for students. Teachers are supported in their progression onthese topics through small-group collaborat ion opportunit ies w ith an instruct ional coach and in their receipt of feedback and cont inual monitoring of theschool as a whole.
In response to a Spring 2016 California School Dashboard rat ing of "red" for English Learner progress, the Assistant Principal of Instruct ion formulated aninterdisciplinary group of teachers called the EL Execut ive Team to set forth an act ion plan to better meet the needs of English Learners. This groupmeets once a month in afterschool workshops.
The SJUSD provides professional development opportunit ies that teachers may opt to take in afterschool workshops or w ith a release day in the follow ingtopics: Construct ing Meaning, Classroom Managgement, Trauma-Informed Teaching, Collaborat ive Structures, and the Explicit Direct Instruct ionalFramework.
All teachers who join Pioneer High School since 2016, regardless of if they are a brand new teacher, have monthly Teacher Support Workshops that helpto integrate them into the school community.
History / Social-Sciences teachers part icipated in a three-year professional development program in collaborat ion w ith the UC Berkeley History Social ScienceProject. The focus of this professional development was on literacy strategies using technological resources and adapt ing to the newly-adopted CAframework for History / Social Sciences.
The NGSS was implemented through a process that involved a district-level teacher advisory team, of which a Pioneer teacher was a part. Teachers wereable to part icipate in whole-day collaborat ion opportunit ies to adapt their instruct ion and course materials to meet student needs under the NGSS.
2016-17 SARC - Pioneer High
Page 22 of 23

Last updated: 1/11/2018
2016-17 SARC - Pioneer High
Page 23 of 23