Embed Size (px)
Citation preview

C o n t e n t s
Activity 1: Optional Pre-Test . . . . . . . . . . . . . . . . p. 1-2 to 1-8
Activity 2: The Human Watershed . . . . . . . p. 1-9 to 1-11
Activity 3: Watershed In a Box . . . . . . . . . . p. 1-12 to 1-14
Activity 4: Stream Savers . . . . . . . . . . . . . . . . . p. 1-15 to 1-26
Activity 5: Transparency . . . . . . . . . . . . . . . . . . p. 1-27 to 1-31
Activity 6: Temperature . . . . . . . . . . . . . . . . . . . p. 1-32 to 1-35
Activity 7: Dissolved Oxygen . . . . . . . . . . . . p. 1-36 to 1-40
Activity 8: Stream Flow . . . . . . . . . . . . . . . . . . . . p. 1-41 to 1-43
Activity 9: Habitat . . . . . . . . . . . . . . . . . . . . . . . . . . p. 1-44 to 1-50
Activity 10: Biotic Index . . . . . . . . . . . . . . . . . . . . p. 1-51 to 1-54
Pre-Field-Trip Optional Activity Descriptions . . . . . . . . p. 1-55 to 1-95
Optional Activities From Other Sources. . . . . . . . . . . . . . . . p. 1-96 to 1-100
Exploring Streams: Stream Monitoring Curriculum Guide
. SECTION 1: PRE-FIELD TRIP ACTIVITIES
HANDS-ON LEARNING ABOUT STREAMS WITHIN & OUTSIDE THE CLASSROOM – FOR MIDDLE & HIGH SCHOOL TEACHERS & STUDENTS
(LEARNING THE MONITORING PROCEDURES)
Section 1 of six curriculum sections
Developed by Kris Stepenuck, University of Wisconsin-Extension and Wisconsin Dept. of Natural Resources; and Katie Murphy, Middle School Science Teacher
For more information about volunteer stream monitoring opportunities in Wisconsin, and for printable pdfs of this curriculum visit:watermonitoring.uwex.edu/wav
A publication of the University of Wisconsin-Extension, in cooperation with the Wisconsin Department of Natural Resources ©2013 by the Board of Regents of the University of Wisconsin System. University of Wisconsin-Extension is an EEO/Affirmative Action employer and provides equal opportunities.
Learning for life
1-1 Exploring Streams – Stream Monitoring Curriculum Guide

ACTIVITY 1: OPTIONAL PRE-TEST
. PRE-FIELD-TRIP ACTIVITIES
Learning Objectives:
• Studentswillshowwhatbackgroundknowledgeonstreamhealththeyalready possess.
Materials:
• Pre-test
• Writinginstrument
• Pre-testanswerkey
Time: 30 minutes
PROCEDURE:
1. Students answer the questions on the test to the best of their ability.
2. Teachers will score these, but not share the results with the students until after the students have taken the test again at the end of this mini-unit on stream health.
1-2 Exploring Streams – Stream Monitoring Curriculum Guide

. PRE-FIELD-TRIP ACTIVITIES – PRE-TEST
Name: _____________________________________________
Date: ______________________________________________
Period: _____________________________________________
Stream Water Monitoring Pre-Test
Matching: Write the letter for the correct vocabulary word on the line next to the definition.
A. Turbidity F. Riparian zone
B. Respiration G. Photosynthesis
C. Macroinvertebrates H. Riffle
D. Substrate I. Impervious surface
E. Watershed J. Transparency
_____1. An area of land that drains to a main body of water.
_____2. The land between the water’s edge and the upper edge of the flood plain.
_____3. The stream bottom surface on which plants and animals attach or live.
_____4. Small animals without backbones that are visible to the human eye.
_____5. Cloudiness in the water caused by suspended particles.
_____6. The process in which green plants convert carbon dioxide and water, using the sun’s energy, into simple sugars and oxygen.
_____7. The cellular process in which plants and animals use oxygen and release carbon dioxide.
_____8. A measure of water clarity.
_____9. Shallow area in stream where water flows swiftly over rocks.
_____10. A surface that does not allow water to pass through it.
1-3 Exploring Streams – Stream Monitoring Curriculum Guide

. PRE-FIELD-TRIP ACTIVITIES – PRE-TEST
Multiple Choice: Choose the best answer for each question and write the corresponding letter on the line.
_____11. Warm water holds _____________ dissolved oxygen than/as cold water. A. More B. Less C. The same amount of
_____12. Streams with greater turbidity will likely A. Be colder B. Have more dissolved oxygen C. Have less light penetration
_____13. Water clarity can be a useful indicator of A. Industrial discharges B. Runoff from construction sites or fields C. Both A and B
_____14. The biotic index is A. A reference book often used when studying Biology B. A scale used to evaluate stream health based on its macroinvertebrate population C. A list of macroinvertebrates found in the back of a book
_____15. Food sources, spawning areas and migration paths of fish and other wildlife are all affected and defined by A. Stream flow and velocity B. Substrate C. Riffle zones D. Both B and C
_____16. Signs of fish stress include A. Increased respiration B. Faster scale growth C. Reduced feeding rates D. Both A and C
_____17. Streams that are healthy will have A. A large population of pollution tolerant macroinvertebrates B. A large population of pollution sensitive macroinvertebrates C. A wide variety of both pollution tolerant and pollution sensitive macroinvertebrates
_____18. What type(s) of habitat(s) would support a more diverse fish and insect population? A. Riffles B. Pools C. Runs D. A combination of A, B and C
_____19. What can the shape and condition of the streambank provide clues to? A. Land uses in the adjacent watershed B. The number of animals living nearby C. How much water to expect during snowmelt season
1-4 Exploring Streams – Stream Monitoring Curriculum Guide

. PRE-FIELD-TRIP ACTIVITIES – PRE-TEST
Short Answer: Answer the following to the best of your ability. Use complete sentences.
20. If you collected caddisflies, mayflies, riffle beetles, amphipods, and both non-red midges and bloodworms, what would your biotic index score be?
Biotic Index (size of illustrations not proportional)
Non-Red Midge Larva
Riffle Beetle Adult*
Crane Fly Larva
Freshwater Mussel or Fingernail clam
Caddisfly Larva*
Dragonfly Larva Crawfish
Water Snipe Fly
LarvaAlderfly Larva Dobsonfly Larva
StoneflyLarva
Water Penny
Amphipod or ScudBlack Fly Larva
Pouch Snail (left side opening)
Isopod or Aquatic Sowbug
Bloodworm Midge Larva
(red)
LeechTubifexWorm
*All Caddisfly Larvae = 1
Damselfly Larva
Riffle Beetle Larva*
*All Riffle Beetles = 1
Damselfly tail (side view)
Group 1: These are sensitive to pollutants. Circle each animal found.
Group 2: These are semi-sensitive to pollutants. Circle each animal found.
Group 3: These are semi-tolerant of pollutants. Circle each animal found.
Group 4: These are tolerant of pollutants. Circle each animal found.
*All Snails = 1
Mayfly Larva
Snails: Orb or Gilled (right side opening)
Group Number Number of Animals Scoring (add the 4 groups for total)
Group 1 _________________ x4 = ____________________________
Group 2 _________________ x3 = ____________________________
Group 3 _________________ x2 = ____________________________
Group 4 _________________ x1 = ____________________________
Total Number = Total Score =
Total Score Total Number =/Index Score(3.6+=Excellent, 2.6-3.5=Good, 2.1-2.5=Fair, 1.0-2.0=Poor)
1-5 Exploring Streams – Stream Monitoring Curriculum Guide

21. Name at least three factors that can influence stream flow and velocity.
22. Explain why dissolved oxygen levels may be higher in the day than they are at night.
23. What are some advantages to using macroinvertebrates to identify water quality as compared to studying other physical or chemical aspects of water quality?
24. What impact(s), if any, might a cheese factory have on a nearby stream?
25. What would you expect to find in a healthy riparian zone? What purpose does the riparian zone serve for the health of the stream?
. PRE-FIELD-TRIP ACTIVITIES – PRE-TEST
1-6 Exploring Streams – Stream Monitoring Curriculum Guide

. PRE-FIELD-TRIP ACTIVITIES – PRE-TEST
Stream Water Monitoring Pre-Test (TEACHER KEY)Matching: Write the letter for the correct vocabulary word on the line next to the definition.
A. Turbidity F. Riparian zone B. Respiration G. Photosynthesis C. Macroinvertebrates H. Riffle D. Substrate I. Impervious surface E. Watershed J. Transparency
__ E __ 1. An area of land that drains to a main body of water.__ F __ 2. The land between the water’s edge and the upper edge of the flood plain.__ D __ 3. The stream bottom surface on which plants and animals attach or live.__ C __ 4. Small animals without backbones that are visible to the human eye.__ A __ 5. Cloudiness in the water caused by suspended particles. __ G __ 6. The process in which green plants convert carbon dioxide and water, using the sun’s energy, into
simple sugars and oxygen.__ B __ 7. The cellular process in which plants and animals use oxygen and release
carbon dioxide. __ J __ 8. A measure of water clarity.__ H __ 9. Shallow area in stream where water flows swiftly over rocks.__ I __ 10. A surface that does not allow water to pass through it.
Multiple Choice: Choose the best answer for each question and write the corresponding letter on the line.
__ B __ 11. Warm water holds _____________ dissolved oxygen than/as cold water. A. More B. Less C. The same amount of
__ C __ 12. Streams with greater turbidity will likely A. Be colder B. Have more dissolved oxygen C. Have less light penetration
__ C __ 13. Water clarity can be a useful indicator of A. Industrial discharges B. Runoff from construction sites or fields C. Both A and B
__ B __ 14. The biotic index is A. A reference book often used when studying Biology B. A scale used to evaluate stream health based on its macroinvertebrate population C. A list of macroinvertebrates found in the back of a book
__ A __ 15. Food sources, spawning areas and migration paths of fish and other wildlife are all affected and defined by A. Atream flow and velocity B. Substrate C. Riffle zones D. Both B and C
__ D __ 16. Signs of fish stress include A. Increased respiration B. Faster scale growth C. Reduced feeding rates D. Both A and C
1-7 Exploring Streams – Stream Monitoring Curriculum Guide
For a version (for teachers only) that includes answers, please contact
the WAV Coordinator. For contact information, see:
http://watermonitoring.uwex.edu/wav

. PRE-FIELD-TRIP ACTIVITIES – PRE-TEST
Short Answer: Answer the following to the best of your ability.
Use complete sentences.
20. If you collected caddisflies, mayflies, riffle beetles, amphipods, and both non-red midges and bloodworms, what would your biotic index score be?
__ C __ 17. Streams that are healthy will have A. A large population of pollution tolerant macroinvertebrates B. A large population of pollution sensitive macroinvertebrates C. A wide variety of both pollution tolerant and pollution sensitive macroinvertebrates
__ D __ 18. What type(s) of habitat(s) would support a more diverse fish and insect population? A. Riffles B. Pools C. Runs D. A combination of A, B and C
__ A __ 19. What can the shape and condition of the streambank provide clues to A. Land uses in the adjacent watershed B. The number of animals living nearby C. How much water to expect during snowmelt season
Biotic Index (size of illustrations not proportional)
Non-Red Midge Larva
Riffle Beetle Adult*
Crane Fly Larva
Freshwater Mussel or Fingernail clam
Caddisfly Larva*
Dragonfly Larva Crawfish
Water Snipe Fly
LarvaAlderfly Larva Dobsonfly Larva
StoneflyLarva
Water Penny
Amphipod or ScudBlack Fly Larva
Pouch Snail (left side opening)
Isopod or Aquatic Sowbug
Bloodworm Midge Larva
(red)
LeechTubifexWorm
*All Caddisfly Larvae = 1
Damselfly Larva
Riffle Beetle Larva*
*All Riffle Beetles = 1
Damselfly tail (side view)
Group 1: These are sensitive to pollutants. Circle each animal found.
Group 2: These are semi-sensitive to pollutants. Circle each animal found.
Group 3: These are semi-tolerant of pollutants. Circle each animal found.
Group 4: These are tolerant of pollutants. Circle each animal found.
*All Snails = 1
Mayfly Larva
Snails: Orb or Gilled (right side opening)
21. List at least three factors that can influence stream flow and velocity. (Complete sentences are not necessary on this question).
Teachers use your judgment. Student answers may include but are not limited to the following:-- Rainfall, snowmelt, drought-- Soil type, vegetation and slope in the watershed-- Withdrawals for irrigation or domestic or industrial purposes-- Dams-- Development (increased impervious surface near stream)
22. Explain why dissolved oxygen levels may be higher in the day than they are at night.
During the day plants photosynthesize and produce oxygen as a byproduct. At night plants and animals respire and take in oxygen while they produce carbon dioxide.
23. What are some advantages to using macroinvertebrates to identify water quality as compared to studying other physical or chemical aspects of water quality?
Macroinvertebrates tell us what the stream conditions might be like over a longer period of time. Other measurements (e.g., temperature and dissolved oxygen) only tell us what the stream was like at the exact moment that we collected the sample.
24. What impact(s), if any, might a cheese factory have on a nearby stream?
A cheese factory might release heated water that was used in the manufacturing process into the stream thereby causing an increase in temperature to the stream water.
25. What would you expect to find in a healthy riparian zone? What purpose does the riparian zone serve for the health of the stream?
A healthy riparian zone should contain a combination of trees, shrubs and/or long grasses. Having a variety of types of plants present will help ensure that a wide diversity of animals will be able to utilize the area for habitat. Plus, this vegetation will help to buffer any runoff before it enters the stream.
Group Number Number of Animals Scoring (add the 4 groups for total)
Group 1 ________0_______ x4 = _____________0______________
Group 2 ________3_______ x3 = _____________9______________
Group 3 ________2_______ x2 = _____________4______________
Group 4 ________1_______ x1 = _____________1______________
Total Number = Total Score =
Total Score Total Number =/Index Score(3.6+=Excellent, 2.6-3.5=Good, 2.1-2.5=Fair, 1.0-2.0=Poor)
6
6 2.3
14
14
1-8 Exploring Streams – Stream Monitoring Curriculum Guide
Biotic Index (size of illustrations not proportional)
Non-Red Midge Larva
Riffle Beetle Adult*
Crane Fly Larva
Freshwater Mussel or Fingernail clam
Caddisfly Larva*
Dragonfly Larva Crawfish
Water Snipe Fly
LarvaAlderfly Larva Dobsonfly Larva
StoneflyLarva
Water Penny
Amphipod or ScudBlack Fly Larva
Pouch Snail (left side opening)
Isopod or Aquatic Sowbug
Bloodworm Midge Larva
(red)
LeechTubifexWorm
*All Caddisfly Larvae = 1
Damselfly Larva
Riffle Beetle Larva*
*All Riffle Beetles = 1
Damselfly tail (side view)
Group 1: These are sensitive to pollutants. Circle each animal found.
Group 2: These are semi-sensitive to pollutants. Circle each animal found.
Group 3: These are semi-tolerant of pollutants. Circle each animal found.
Group 4: These are tolerant of pollutants. Circle each animal found.
*All Snails = 1
Mayfly Larva
Snails: Orb or Gilled (right side opening)
For a version (for teachers only) that includes answers, please contact
the WAV Coordinator. For contact information, see:
http://watermonitoring.uwex.edu/wav

ACTIVITY 2: THE HUMAN WATERSHED
. PRE-FIELD-TRIP ACTIVITIES
Activity developed by Andy Yencha, UW-Extension.
Students will compare the human circulation system to the streams and rivers that
crisscross Wisconsin.
JUGULAR VEINSUPERIORVENA CAVA
INFERIORVENA CAVA
DIGITAL VEINS
DIGITAL VEINS
FEMORAL VEIN
A TYPICAL WATERSHED MAP
Small rivulets, intermittent waterways, creeks and rivers are joined together in a network that drains water through a large area.
You can obtain U.S. Geological
Survey topographical maps online
(at: http://topomaps.usgs.gov).
Your UW-Extension office or county
Land Conservation Department
may also be able to help you find
a map of your watershed.
Learning Objectives:
By participating in this activity, students will:
• Comparethesimilaritiesbetweenahuman circulatory system and a typical waterway system.
• Identifyandlocatevariousbloodvesselsinthehumanbody.
• IdentifyandlocatemajorstreamsandriversinWisconsin.
Standards:
Environmental Education A.8.4, A.8.5; Science Connections A.8.6; Science Inquiry C.8.4, C.8.6
Materials:
• Twoposter-sizedsheetsofpaperfortheinstructor
• Twoletter-sizedsheetsofpaperforeachparticipant, or rolled paper to draw actual body outlines
• Red,blue,andblackcoloredmarkers,pencils,pens, crayons
• AWisconsinroadmaportopographicmap (or localize this activity by using a map of your local watershed instead)
1-9 Exploring Streams – Stream Monitoring Curriculum Guide

. PRE-FIELD-TRIP ACTIVITY 2 – THE HUMAN WATERSHED
Time:
15 minutes preparation time, plus 45 minutes to do the activity (Note: This activity can be
abbreviated by having students work in teams to do the sketches, or limit the activity to a
comparison and discussion of the wall posters.)
Background:
The blood vessels that return blood to the heart are much like the streams, creeks and rivers that
carry surface water through a watershed. Very tiny capillaries in the tips of our toes return blood
through increasingly larger vessels on the way to the heart. In similar fashion, rain water and
snowmelt flow off the land, first via small rivulets, then intermittent streams and then via larger
creeks and rivers. The blood vessels which carry blood to our hearts are classified by increasing
size: capillaries (smallest), venules (mid-sized) and veins (largest).
Streams have a classification system as well. The smallest streams on the edge of a watershed
are called first-order streams. When two first-order streams join, they form a second-order stream.
When two second-order streams meet, they form a third-order stream. The largest rivers in the
world like the Amazon and the Mississippi are considered 9th- and 10th-order streams. The largest
veins in the body – the inferior and superior vena cava – average 3⁄4 to 11⁄4 inches in diameter.
PROCEDURE:
1. Before your group arrives, outline the boundaries of Wisconsin on poster-sized paper. Accuracy is not that important. Include a few local towns and roads so your group knows where they live on the map. Don’t sketch-in the streams yet!
2. Sketch a human outline on poster-sized paper the best you can. Don’t sketch-in any blood vessels yet!
3. Tape human outline on wall.
4. Keep the Wisconsin map out-of-sight for now.
5. When students arrive, pass out paper/markers. Give everyone in the group paper, and a blue, red and black marker.
6. Have the group sketch a human outline. Let them use the outline taped to the wall for inspiration, but encourage creativity.
7. Ask the group how the blood in the tips of their toes and fingers gets to their heart. Ask them to name the different blood vessel types (i.e., veins, venules, capillaries) and explain why they are different. Continue this discussion as far as your knowledge of the cardiovascular system will carry you.
1-10 Exploring Streams – Stream Monitoring Curriculum Guide

. PRE-FIELD-TRIP ACTIVITY 2 – THE HUMAN WATERSHED
8. Have each student draw blood vessels. Starting at the tips of the toes, use a red marker to sketch (use the example on page 1-9 for guidance) a pathway of capillaries, venules, and veins leading to the heart. When completed, have them set these drawings aside.
9. Next, discuss watersheds with the group. Ask the group where the water in a well known creek or river comes from and goes to. Discuss how rain and melted snow start the journey to small rivulets and intermittent waterways, before forming creeks and rivers. If they mention groundwater springs, ask them where groundwater comes from. (Answer: surface water that soaks into the ground.)
10. Tape Wisconsin map on wall. Ask the group to identify their current location on the map.
11. Have the group copy the outline of Wisconsin on their paper.
12. Ask for volunteers to name major streams and rivers in Wisconsin. Find these waterways on the wall map. Ask the group to copy them to their personal maps.
13. Ask the group to compare their drawings. Keep these things in mind: Blood vessels and streams share many similarities. They both:
i. Carry life-giving water and nutrients
1. Streams enrich the landscape
2. Blood nourishes the body
ii. Remove waste
1. Streams remove sediment and nutrients
2. Blood removes metabolic waste
iii. Work in cycles
1. The hydraulic cycle for streams
2. The circulation system for blood
iv. Are affected by human decisions
1. Wise land management promotes clean streams
2. A healthy lifestyle promotes a healthy body
Optional Activity:
• StreamWalkSurvey(seepage1-88)
1-11 Exploring Streams – Stream Monitoring Curriculum Guide

ACTIVITY 3: WATERSHED IN A BOX
. PRE-FIELD-TRIP ACTIVITIES
Learning Objectives:
• Studentswillunderstandwhywecareaboutmonitoringwaterqualityinstreams.
• Studentswillbegintomakeaconnectionbetweenouractionsonthelandand the effects on water quality.
• Studentswilllearnwhatawatershedis.
• Studentswilldistinguishbetweenpointsourceandnonpointsourcepollution.
• Studentswillcreateamodeltorepresentnonpointsourcepollutionanddemonstrate how this pollution affects surface water.
• Studentswilldesignacommunitythatwilltrytominimizetheeffectsofpollution on surface water.
Standards:
Agricultural Education B.8.3, E.8.2; Environmental Education B.8.5, B.8.15, B.8.19, B.12.3,
B.12.17, D.8.1; Science Connections A.8.6 ; Science Inquiry C.8.1, C.8.3, C.8.5, C.8.6, C.8.11; Life
and Environmental Science F.8.8, F.8.10
Materials for each model:
• Aboxcoverorothershallowboxthatis12”x12”orlarger
• Foampieces,Styrofoam®orpaper
• Heavy-dutyaluminumfoilorwhiteplasticbag
• Permanentmarkers
• Spraybottle
• Cupofwater
• Powdered,unsweeteneddrinkmix–twoorthreedifferentcolors
• Bucket
Time:
25 minutes
1-12 Exploring Streams – Stream Monitoring Curriculum Guide

Background:
No matter where you live, the water quality in rivers and streams is determined by what happens
on the land around them. The area of land that drains to a stream or river is called a watershed.
One watershed is separated from another watershed by a low rise, the crest of a hill or a mountain
chain. Rain or snow that falls on opposite sides of the higher land results in water flowing into
different watersheds. Not all watersheds are the same. Some watersheds are hilly, while other
watersheds are flat plains. Regardless, precipitation that falls within the watershed that does not
infiltrate into the ground, flows over land to reach a lower point – a lake, river or stream.
As water flows over land, it picks up soil, chemicals and other pollutants and carries them to
lakes, rivers or streams. This water transportation system is called runoff.
In rural or agricultural areas, runoff water carries a wide variety of materials, including
pesticides, soil and animal wastes, directly into waterways.
In urban areas, hard surfaces such as driveways, sidewalks, rooftops and roadways prevent
water from soaking into the ground. As a result, the runoff water, which can be contaminated
with road salt, heavy metals or automobile fluids, flushes quickly into storm drains that dump
directly into streams and rivers.
Pollutants that do not have a single source are called nonpoint source pollution. This pollution
originates from many different places.
Everyone lives in a watershed. We may not realize that what happens somewhere in the watershed
will eventually have an impact on a lower point in the watershed – a lake, a river, or a stream.
. PRE-FIELD-TRIP ACTIVITY 3 – WATERSHED IN A BOX
PROCEDURE:
1. Use a box cover or a shallow box to contain the runoff model.
2. Arrange pieces of foam or crumpled paper to represent hills and land forms in the bottom of the box. Encourage your group to be creative. Remember, the highest points should be near the box walls. Leave a gully or valley in the middle of the box to represent a stream or river.
3. Cover the land forms with a large piece of aluminum foil, shiny side up. Start in the middle of the box and gently press the foil into all of the hills and valleys, working your way towards the box walls. Push the edges of the foil up along the walls of the box and fold the foil over the edge of the box. Be careful not to tear the foil.
1-13 Exploring Streams – Stream Monitoring Curriculum Guide

4. With a permanent marker, draw on the foil to outline the streams or rivers in your model. Next, draw houses, roads, farm fields, feed lots, stores or anything else that you want in your community.
5. Sprinkle different colors of powdered drink mix onto the model. The colors represent different kinds of pollution. For example:
• Useredpowdertorepresentyardcarechemicalsandsprinkleitaroundthehouses.
• Usegreenpowdertorepresentsaltontheroadsorautomobilewasteandsprinkleitalong roadways or in a parking lot.
• Usebrownpowdertorepresentexposedsoilatafarmfieldoraconstructionsite.
• Usebluepowdertorepresenthumanoranimalwaste and leave little piles of powder near homes and farms.
6. Ask the group what they think would happen if it rained.
7. Using the spray bottle to represent a rain storm, spray water on the hillsides. Watch the water flow toward the rivers and streams.
8. Ask the group to tell you what happened. Then ask the group how they would redesign the community to prevent water pollution.
9. Dump the water from the model into a bucket. Remove the foil from the model and set it aside. Place a new piece of foil on the watershed. Ask the group to redesign the community to prevent water pollution. Sprinkle powdered drink mix in the appropriate areas. Let it rain. Was there an improvement?
10. Ask the group what parameters they might monitor in a stream to help assess effects of our uses of the land on water quality. Discuss with students the types of water pollution issues that local communities are facing as a result of land use.
STEP 4
STEP 7
STEP 5
. PRE-FIELD-TRIP ACTIVITY 3 – WATERSHED IN A BOX
1-14 Exploring Streams – Stream Monitoring Curriculum Guide

ACTIVITY 4: STREAM SAVERS
. PRE-FIELD-TRIP ACTIVITIES
This activity was developed by and is used here with permission from Georgia Adopt-A-Stream
(http://www.georgiaadoptastream.org). It has been slightly modified from its original version.
Learning Objectives:
Students will be able to identify practices that contribute to nonpoint source pollution.
Standards:
Agricultural Education B.8.3, E.8.2; Environmental Education B.8.5, B.8.8, B.8.10, B.8.15, B.8.17,
B.8.18, B.8.19, B.8.21, B.12.11; Science Connections A.8.1, A.12.2; Nature of Science B.8.6; Life
and Environmental Science F.8.9, F.12.8
Materials:
Each group will need:
• Onediefromanothergameboard
• Playingboard(includedinthebackofthis curriculum)
• Cards(includedonpages1-23to1-26–copyasetforeachgroup)
• Squaresfromdifferentcolorconstructionpaperorvariouscoinstouseasgame pieces (Optional: Vials with aquatic insects or cut-outs of invertebrates from the Key to Life in the River, included in the back of this curriculum)
Time:
30-45 minutes
Background:
Pollution is divided into two groups, depending on how the pollution enters a body of water.
Point source pollution is waste that comes from a specific point. Factories and wastewater
treatment plants may have discharge pipes that lead directly to a waterway. These are
considered point sources because they are easily identified as coming from one site.
Nonpoint source pollution comes from more than one specific location. It results from the runoff
1-15 Exploring Streams – Stream Monitoring Curriculum Guide
of water (e.g., rainfall, snowmelt, etc.) over land. As water passes over the ground, it picks up
pollutants and carries them into local streams and rivers. Nonpoint source pollution can also
result from airborne pollutants that are deposited in waterways.
Nonpoint sources can be either rural or urban. Nonpoint source pollution in rural areas usually
results from such things as poor agricultural or forestry practices but can also include runoff such
as trash, oil, gas and fertilizers from lawns, the common culprit in urban and suburban areas.
. PRE-FIELD-TRIP ACTIVITY 4 – STREAM SAVERS
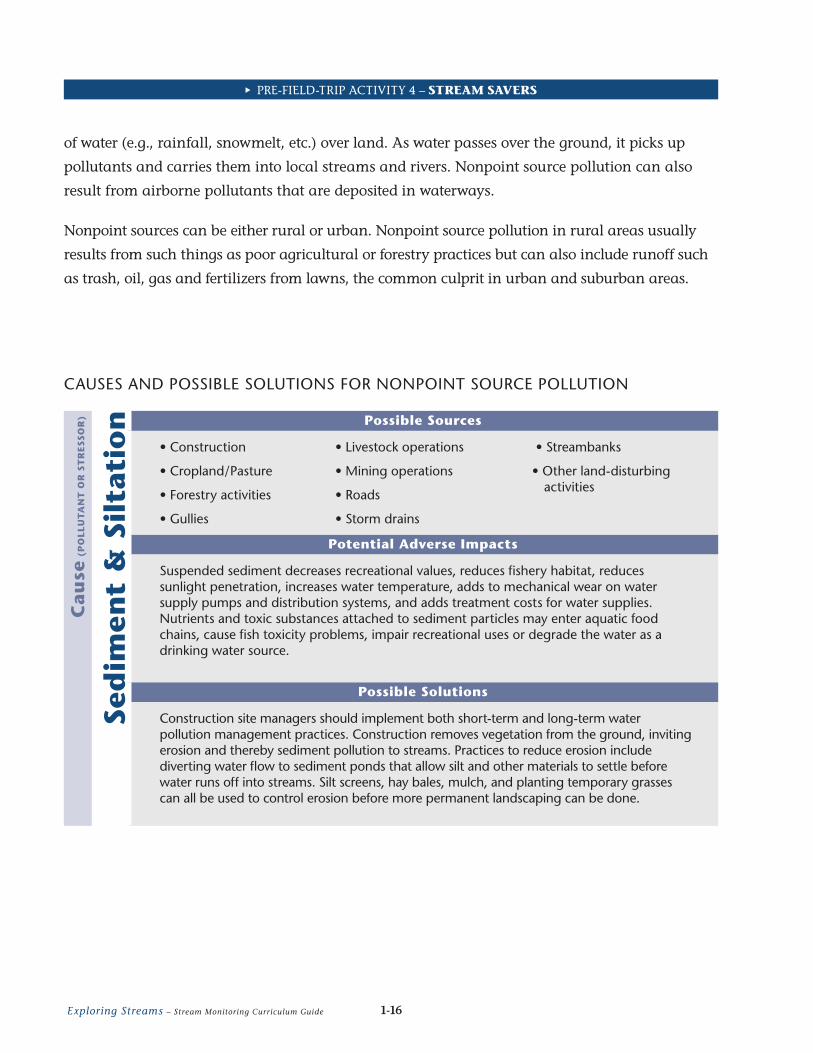
Possible Sources
•Construction
•Cropland/Pasture
•Forestryactivities
•Gullies
•Livestockoperations
•Miningoperations
•Roads
•Stormdrains
•Streambanks
•Otherland-disturbingactivities
Potential Adverse Impacts
Suspended sediment decreases recreational values, reduces fishery habitat, reduces sunlight penetration, increases water temperature, adds to mechanical wear on water supply pumps and distribution systems, and adds treatment costs for water supplies. Nutrients and toxic substances attached to sediment particles may enter aquatic food chains, cause fish toxicity problems, impair recreational uses or degrade the water as a drinking water source.
Possible Solutions
Construction site managers should implement both short-term and long-term water pollution management practices. Construction removes vegetation from the ground, inviting erosion and thereby sediment pollution to streams. Practices to reduce erosion include diverting water flow to sediment ponds that allow silt and other materials to settle before water runs off into streams. Silt screens, hay bales, mulch, and planting temporary grasses can all be used to control erosion before more permanent landscaping can be done.
CAUSES AND POSSIBLE SOLUTIONS FOR NONPOINT SOURCE POLLUTION
Ca
use
(P
OLLU
TA
NT
OR
ST
RESS
OR
)
Sed
imen
t &
Sil
tati
on
1-16 Exploring Streams – Stream Monitoring Curriculum Guide

. PRE-FIELD-TRIP ACTIVITY 4 – STREAM SAVERS
Possible Sources
•Erosionandrunoff from fertilized fields
•Urbanrunoff
•Wastewaterplants
•Industrialdischarges
•Septicsystems
•Animalproduction operations
•Croplandorpasturewheremanure is spread
Potential Adverse Impacts
Nutrients are essential for the growth and survival of aquatic plants and animals. Excess nutrients may cause excessive algae and aquatic plant growth, which may choke open waters and consume oxygen (primarily from decomposition of dead plants and algae). These conditions will adversely affect fish and aquatic organisms, fishing and boating, and the taste and odor of drinking water. High levels of nitrogen contaminants in drinking water may cause methoglobinemia (blood disease) in infants, and have forced the closure of many water supplies.
Possible Solutions
Conservation tillage can be used to reduce erosion and sediment pollution (and therefore nutrient pollution). Instead of plowing under the residue from a previous crop and exposing bare soil, conservation tillage uses a disc to cut through the residue to plant seeds. This allows a protective layer of vegetation to remain on top of the soil to retard erosion and to retain more water in the soil. Agricultural Extension provides soil testing to determine the need for fertilizers. The tests will indicate which nutrients are needed so over-fertilization does not occur. Buffers of vegetation next to a stream also help prevent overland runoff.
Possible Sources
•Humanandanimalexcreta
•Animaloperations
•Croplandorpasture
•Wastewatertreatment
•Septicsystems
•Urbanrunoff
•Wildlife
Potential Adverse Impacts
Waterborne diseases may be transmitted to humans through drinking or contact with pathogen-laden water. Eating shellfish taken from or uncooked crops irrigated with pathogen- laden waters may also transmit waterborne diseases. The principal concern in both surface and ground waters is the potential degradation of public water supply sources. Pathogens reaching a lake or other surface water may limit primary contact recreation, such as swimming.
Possible Solutions
A farm waste management system must have three basic components: collection, transportation, and storage or disposal of animal wastes. Many facilities have storage ponds that treat wastes before discharging into waters. Sometimes animal manure or composted manure is sold to be used as fertilizer on fields.
Ca
use
(P
OLLU
TA
NT
OR
ST
RESS
OR
)C
au
se (
PO
LLU
TA
NT
OR
ST
RESS
OR
)
Nu
trie
nts
(P
ho
sph
oru
s, N
itro
gen
)P
ath
og
ens
(Bact
eria
& v
iru
ses)
1-17 Exploring Streams – Stream Monitoring Curriculum Guide

. PRE-FIELD-TRIP ACTIVITY 4 – STREAM SAVERS
Possible Sources
•Urbanrunoff •Wastewatertreatment •Industrialdischarges
Potential Adverse Impacts
Toxic substances may enter surface waters either dissolved in runoff or attached to sediment or organic materials and may enter groundwater through soil infiltration. Principal concerns in surface water include entry into the food chain, bioaccumulation, toxic effects on fish, wildlife and microorganisms, habitat degradation and potential degradation of public water supplies. Groundwater impacts are primarily related to degradation of water supply sources.
Possible Solutions
Urban runoff is still controlled primarily by voluntary means, but cities have adopted new practices like leaf collection and street cleaning at critical times, that can reduce the flow of sediment and other contaminants into waterways. Detention-retention ponds have been incorporated into some water control systems to allow contaminants to settle, and to feed rainwater into runoff channels at a controlled rate.
Cau
se (
PO
LLU
TA
NT
OR
ST
RESS
OR
)
Toxic
Su
bst
an
ces
(Heavy
Meta
ls,
Oil
& P
etr
ole
um
Pro
du
cts)
Possible Sources
•Alllandwherepesticides are used
•Urbanrunoff
•Allsitesofhistoricalusage(e.g., chlorinated pesticides)
•Irrigationreturnflows
Potential Adverse Impacts
Pesticides may enter surface waters either dissolved in runoff or attached to sediment or organic materials and may enter groundwater through soil infiltration. Principal concerns in surface water include entry into the food chain, bioaccumulation, toxic effects on fish, wildlife and microorganisms, habitat degradation and potential degradation of public water supply sources. Groundwater impacts are primarily related to water supply sources.
Possible Solutions
Integrated pest management (IPM) can be used to identify the pest control methods that will be the most environmentally-friendly and least hazardous to human health. In IPM, pests are monitored and threshold levels at which action will be necessary to prevent troublesome populations are identified. Steps are taken to prevent pest populations from reaching threshold levels, but if they do, the least risky control methods are implemented before pesticides are sprayed. These include trapping pests or using pheromones to disrupt their reproduction.
Ca
use
(P
OLLU
TA
NT
OR
ST
RESS
OR
)
Pes
tici
des
1-18 Exploring Streams – Stream Monitoring Curriculum Guide

. PRE-FIELD-TRIP ACTIVITY 4 – STREAM SAVERS
Possible Sources
•Ripariancorridordestruction
•Bankdestruction
•Urbanrunoff
•Hydromodifications
•Industrialdischarges
Potential Adverse Impacts
Direct exposure of sunlight to streams (e.g., by cutting trees along banks) may elevate stream temperatures, which can exceed fish tolerance limits, reduce dissolved oxygen and promote the growth of nuisance algae. Thermal stress may also be the result of stormwater runoff, which is heated as it flows over urban streets. Hydomodifications that create wider, shallower channels create more surface area and allow for quicker temperature changes. Modifications that create pools and increase the storage time of water may also contribute to thermal stress by increasing surface area and not allowing the warmed water to wash out of the watershed. Coldwater fish may be eliminated or only marginally supported in streams affected by thermal stress.
Possible Solutions
Many logging companies use selective cutting practices that allow for better timber choices and minimal impact on the land. Logging roads may wind around hills to reduce erosion and allow natural growth to quickly “retake” the land after cutting is finished. A “buffer zone,” an area of timber lining the streambanks, can be left. The remaining trees reduce the amount of erosion reaching the stream and the trees shade the stream leaving the water temperature normal.
Ca
use
(P
OLLU
TA
NT
OR
ST
RESS
OR
)
Th
erm
al S
tres
s &
Su
nli
gh
tPossible Sources
•Humanandanimalexcreta
•Decayingplantandanimalmatter
•Discardedlitterandfoodwaste
Potential Adverse Impacts
Organic materials may enter surface waters dissolved or suspended in runoff. Natural decomposition of these materials may deplete oxygen supplies in surface waters below the threshold necessary to maintain aquatic life.
Possible Solutions
On farms, careful manure management can help minimize organic inputs to streams. Farmers can work with trusted sources such as Extension to identify high risk areas (e.g., highly erodible soils, steep slopes, karst topography), and high risk times (e.g., when soil moisture is already high, frozen ground) where manure spreading should be minimized. Homeowners can remove leaves from storm drains and refrain from dumping grass clippings into waterways. Backyard composting of these materials can produce a nutrient-rich compost to enrich gardens later on.
Ca
use
(P
OLLU
TA
NT
OR
ST
RESS
OR
)
Org
an
ic E
nri
chm
ent
(Dep
leti
on
of
Dis
solv
ed
Ox
ygen
)
1-19 Exploring Streams – Stream Monitoring Curriculum Guide

. PRE-FIELD-TRIP ACTIVITY 4 – STREAM SAVERS
Possible Sources
•Channeling
•Dams
•Dredging •Streambankmodifications
Potential Adverse Impacts
Hydrologic modifications alter the flow of streamwater. Structures or activities in the water body that alter stream flow may in turn be the source of stressors, such as habitat modifications, or exacerbate others, such as thermal stress. Dams may also act as a barrier to the upstream migration of aquatic organisms. Stream flow alterations may result from a stressor such as sedimentation, which may change a streambed from narrow with deep pools to broad and shallow.
Possible Solutions
Streams can be restored and allowed to meander along their path as well as be provided an adequate floodplain area alongside the stream (i.e., riparian area). This will allow increased infiltration of water into the ground following a storm, and thus decreased storm runoff peak flows. This will in turn allow water velocities following storms to be less dramatically different from baseflow periods, and thus streambank erosion will be minimized. Dams can be removed to allow natural flow conditions to resume.
Ca
use
(P
OLLU
TA
NT
OR
ST
RESS
OR
)
Flo
w A
lter
atio
ns
Possible Sources
•Minedrainage
•Minetailingsrunoff
•Atmosphericdeposition •Industrialpointsourcedischarges
Potential Adverse Impacts
Acidic or alkaline waters will adversely affect many biological processes. Low pH or acidic conditions adversely affect the reproduction and development of fish and amphibians, and can decrease microbial activity important to nutrient cycling. An extremely low pH will kill all aquatic life. Acidic conditions can also cause the release of toxic metals that were attached to sediments into the water column. High pH, or alkaline conditions, can cause ammonia toxicity in aquatic organisms.
Possible Solutions
Factories with smokestacks can install scrubbers which operate like filters to remove sulfur particles and gases that result during coal and petroleum processing that would soon become airborne.
Ca
use
(P
OLLU
TA
NT
OR
ST
RESS
OR
)
pH
Lev
el
1-20 Exploring Streams – Stream Monitoring Curriculum Guide

Possible Sources
•Litter •Illegaldumpingofsolidwastes
Potential Adverse Impacts
Refuse and litter in a stream can clog fish spawning areas; stress aquatic organisms, injure wildlife; reduce water clarity; impede water treatment plant operations; and impair recreational uses of the water body, such as swimming, fishing and boating.
Possible Solutions
Citizens can carry out local stream and river clean ups to remove trash and other debris from waterways. Educational programs can be implemented to help citizens understand the impacts of such wastes on water quality and overall stream health. Local communities can host tire and/or appliance collection events to help minimize illegal dumping of large items into streams. Companies can offer financial incentives for people to recycle items such as TVs and computers.
Cau
se (
PO
LLU
TA
NT
OR
ST
RESS
OR
)
Ref
use
, Lit
ter
& D
ebri
sPossible Sources
•Channeling
•Construction
•Changinglandusesinthe watershed
•Streamburial
•Dredging
•Removalofriparianvegetation
•Streambankmodifications
Potential Adverse Impacts
Habitat modifications include activities on the landscape or in the water body that alter the physical structure of the aquatic and riparian ecosystem. Some examples include: removal of streamside vegetation that stabilizes the streambank and provides shade; excavation in the stream and removal of cobbles from the stream bed that provide nesting habitat for fish; stream burial; and development that alters the natural drainage pattern by increasing the intensity, magnitude and energy of runoff waters.
Possible Solutions
Increased education of citizens about the value of streamside and in-stream habitat for health of aquatic organisms might result in fewer people implementing activities that damage habitat. Shoreland zoning regulations and required minimum set-backs (e.g., minimum distance to a stream in which a structure can be built) can be implemented by local community officials or state agencies to provide overarching protection to streams and lakes to ensure healthy waters are maintained.
Ca
use
(P
OLLU
TA
NT
OR
ST
RESS
OR
)
Hab
itat
Mo
difi
cati
on
s
. PRE-FIELD-TRIP ACTIVITY 4 – STREAM SAVERS
1-21 Exploring Streams – Stream Monitoring Curriculum Guide

. PRE-FIELD-TRIP ACTIVITY 4 – STREAM SAVERS
Preparation:
Copythe“cardpage”and“cardpageanswers”backtobackoncardstockorthickpaper.Have
each group cut out a set for their game. Also make copies of the playing board – one per group.
PROCEDURE:
1. Review the definitions of nonpoint source and point source pollution with students and discuss the various causes, sources and solutions covered in the background information for this activity. Divide the class into groups of five. Have each student cut a small shape out of construction paper to represent them as a player. Make sure each team member has a different colored square. Alternatively, students can use different coins, small vials of different types of aquatic insects, or cut-outs of drawings of aquatic insects from the Key to Life in the River to represent each player.
2. Have the students look over the playing board and, as a team, identify some of the spaces with proper and improper water quality practices. Point out that improper practices are in red and proper are in green.
3. Let’s play the game – GAME RULES:
i. Each player is to line up on the “starting line.”
ii. Roll the die to see who will move first. (The highest number rolls first.)
iii. Moving clockwise around the group, each student should take a turn rolling the die and moving their playing piece the number of spaces rolled on the die.
iv. When a student lands on the space marked “read card,” they are to take the card from the top of the pile, read it and answer the question. If they get the answer right, they follow instructions and return the card to the bottom of the pile. If they answer incorrectly, they stay on the square and their turn is over.
v. The game continues until a student reaches the “finish.”
Discussion:
1. What is nonpoint source pollution? What is point source pollution?
2. Give two examples of point and nonpoint source pollution.
3. List two things that indicate a healthy stream.
4. List two things that can harm a stream.
Optional Activities:
1. Have the students make up additional cards for the game.
2. Have the students participate in a Stream Walk Survey (page 1-88).
1-22 Exploring Streams – Stream Monitoring Curriculum Guide

Give two examples of nonpoint source pollution.
Move 2 spaces.
Name two rivers in Wisconsin.
Move 2 spaces.
Name two animals that live in a stream.
Move 1 space.
Cutting trees along the streambank can be harmful
to aquatic organisms.
(True/False)
Move 1 space.
What does nonpoint source pollution mean?
Move 2 spaces.
List two things that could harm a stream.
Move 1 space.
How can cows damage a stream if they walk
through it?
Move 1 space.
List two things you can do to help a stream.
Move 1 space.
. PRE-FIELD-TRIP ACTIVITY 4 – STREAM SAVERS
1-23 Exploring Streams – Stream Monitoring Curriculum Guide

Answer
Erosion of streambanks (possibly due to construction or improper forestry techniques), cows walking in stream, parking lot runoff, agricultural runoff, etc.
Answer
Wisconsin, St. Croix, Chippewa, Wolf, Fox, Rock, etc. Any local river can be used.
Answer
Aquatic insects (e.g., caddisfly larvae, mayfly larvae), fish (e.g., largemouth bass, bluegill) salamanders, frogs, turtles, beavers, etc.
Answer
True: It causes erosion and increases temperature in the stream by removing sources of shade.
Answer
Nonpoint source pollution is water contamination that comes from a broad area from a variety of causes (e.g., erosion, agricultural runoff, parking lot runoff). It is the opposite of point source pollution that comes from a single identifiable source.
Answer
Agricultural runoff; cows in the stream, sediment in the stream; increase in temperature; elevated pH level; low dissolved oxygen; etc.
Answer
Cows might defecate in a stream and therefore cause an increase of nutrients in the stream. This can, in turn, lower oxygen due to microbes using oxygen to breakdown the waste. Cows also increase erosion by walking in a stream.
Answer
Remove litter or trash from a stream; carry out a streambank restoration project; help prevent erosion; check for aquatic insects in the stream and other animals living in the water when monitoring a stream; teach someone else about the importance of keeping streams clean.
. PRE-FIELD-TRIP ACTIVITY 4 – STREAM SAVERS
1-24 Exploring Streams – Stream Monitoring Curriculum Guide
For a version (for teachers only) that includes answers, please contact
the WAV Coordinator. For contact information, see:
http://watermonitoring.uwex.edu/wav

Name two activities for which a stream can be used.
Move 1 space.
When oils and chemicals get in a stream, they end up
downstream
(True/False)
Move 1 space.
Name two things you can find in a healthy (clean) stream.
Move 1 space.
Nonpoint source pollution can easily be seen in a stream
(True/False)
Move 1 space.
If you find water that smells bad and looks very dirty,
who should you tell?
Move 1 space.
How do you know when water is polluted?
Move 1 space.
. PRE-FIELD-TRIP ACTIVITY 4 – STREAM SAVERS
1-25 Exploring Streams – Stream Monitoring Curriculum Guide

Answer
Canoeing, fishing, kayaking, swimming, tubing, drinking water (after treatment.)
Answer
True: Any chemicals added to a stream would travel downstream.
Answer
Aquatic insects (e.g., caddisfly larvae, hellgrammite, mayfly larvae), fish (e.g., trout, bluegill), turtles, frogs, etc. (Any living animal could be used as the answer to this question.)
Answer
True or False- Depending on the source of the pollution it may be visible. For instance, an increase in algae will leave a green color in the water or grow on the rocks (indicating nutrient levels are high.) However, a chemical such as chloride from road salting would not be visible.
Answer
Call the local authorities such as the County Land Conservation Department, State Department of Natural Resources, EPA, or someone who can contact the proper authorities.
Answer
Rocks buried in sediment; trash in the water; high level of nutrients in the water; cows using the stream as a toilet; water smells bad, and it may look dark green with algae growing on the rocks.
. PRE-FIELD-TRIP ACTIVITY 4 – STREAM SAVERS
1-26 Exploring Streams – Stream Monitoring Curriculum Guide
For a version (for teachers only) that includes answers, please contact
the WAV Coordinator. For contact information, see:
http://watermonitoring.uwex.edu/wav

ACTIVITY 5: TRANSPARENCY
. PRE-FIELD-TRIP ACTIVITIES
Learning Objectives:
• Studentswillknowwhyitisimportanttoknowthebaselinetransparencyofa stream.
• Studentswillknowwhatchangesinaquaticlifeandphysicalattributesofthewater (i.e., temperature, dissolved oxygen) to expect with changes in transparency.
• Studentswillunderstandandpracticehowtouseatransparencytubetoassess water clarity.
Standards:
English A.8.1, A.8.4; Environmental Education B.8.5; Mathematics:
Statistics and Probability E.12.1; Science Inquiry C.8.1, C.8.3,
C.8.4, C.12.1, C.12.2, C.12.5
Materials:
• WaterActionVolunteersVolunteerStreamMonitoring DVD Set Disc #1
• StudentWorkbook(seeSection4)
• Writinginstrument
• ComputerwithInternetaccess(optional)
• Transparencytubes(approximatelyoneperthree or four students)
• Watersamplefromlocalstreamorlake(optional)
Time:
35 minutes
1-27 Exploring Streams – Stream Monitoring Curriculum Guide

Background:
• Waterclarityisoneofthemostobviousmeasuresofwaterquality.
• Waterclaritycanbeausefulindicatorofrunofffromconstructionsites,fields,logging activity, industrial discharges and other sources.
• Monitoringtransparencybefore,duringandimmediatelyafterraincanprovide a useful picture of potential runoff problems.
Murky water is easily seen as unhealthy. However, natural substances which are not harmful to
the water can sometimes make water appear brown and murky. How do we know if the murky
water is a cause for concern? Scientists have found a way to quantify the cloudiness of water by
measuring its turbidity, which relates to the amount of suspended particles in the water. These
small particles of soil, algae or other materials generally range in size from the microscopic level
to about one millimeter (about as thick as a pencil lead). More free-floating particles cause
greater turbidity, resulting in less light penetration through the water. This hinders
photosynthesis, necessary for healthy aquatic plant growth and production of dissolved oxygen.
The water also becomes warmer because the suspended particles absorb heat.
Sources of turbidity include: erosion from fields, construction sites, urban runoff from rainstorms
and melting snow, eroding streambanks, large number of bottom feeders (such as carp) which
stir up bottom sediments, and excessive algal growth. The faster a stream flows, the more energy
it has and the more sediment it can carry.
Since we assess water clarity visually, we don’t directly measure how many suspended particles
are in the water. Instead we measure the transparency of the water, which takes into account
both color and suspended particles. You will measure water clarity in centimeters (cm) using a
transparency tube that is approximately 120 cm long. There is a black and white disc in the
bottom of the tube that you will look down to - through the water sample - to attempt to see. If
you cannot see the disc in the bottom of the tube, your monitoring partner will open a release
valve to allow water to flow out of the tube. Your job is to alert your partner to close the valve
when you can just see the contrast between black and white on the disc. However, if you can see
the disc in the bottom of the tube when the tube is full, you will report a transparency value of
120 cm. It’s important to note that you cannot determine the exact transparency if you can see
the disc with the tube full, you only know that transparency is greater than 120 cm. This high
transparency indicates good water quality.
. PRE-FIELD-TRIP ACTIVITY 5 – TRANSPARENCY
1-28 Exploring Streams – Stream Monitoring Curriculum Guide

All streams have background
turbidity/transparency, or a
baseline standard for a natural
amount of turbidity/transparency.
Fish and aquatic life that are native
to streams have evolved over time to
adapt to varying levels of back-
ground water clarity. For example,
some native fish and aquatic life in
the Mississippi River are very happy
with their murky environment.
What causes problems in any stream or river are unusual concentrations of suspended particles
and how long the water clarity stays at a deviated level.
When you collect transparency samples, it is important to note
any fluctuations in values, which can help detect trends in water
quality. Time is probably the most influential factor in determining
how turbidity affects the aquatic environment. The longer the
water remains at unusually high values, the greater effect it has
on fish and other aquatic life. Fish in particular become very
stressed in waters that remain highly turbid for a long time. Signs
of stress include increased respiration rate, reduced growth and
feeding rates, delayed hatching and in severe cases, death. Fish
eggs are ten times more sensitive to turbidity than adult fish.
Turbidity is measured in Nephelometric Turbidity Units (NTU)
when scientists use a special meter, called a nephelometer, to assess
this parameter. This type of meter shines light through a water
sample and measures how much light is scattered by suspended
material in the sample. We have a conversion chart for transparency
measurements (which assess both particles in the water and water
color) to NTU which can allow scientists to roughly compare
transparency results obtained with a tube to those obtained with
a nephelometer (See conversion chart at left). This conversion also
allows you to assess potential impacts of water clarity on
organisms in the stream you sampled.
LOW WATER TRANSPARENCY INFLUENCES FISH HEALTH
LowTransparency
HighTransparency
PO
OR
HEA
LTH
GO
OD
HEA
LTH
Source: Minnesota Pollution Control Agency
FAIR HEALTH
TRANSPARENCY VALUE CONVERSION CHART
Centimeters Turbidity (NTUs)
6.4 to 7.0 240
7.1 to 8.2 185
8.3 to 9.5 150
9.6 to 10.8 120
10.9 to 12.0 100
12.1 to 14.0 90
14.1 to 16.5 65
16.6 to 19.1 50
19.2 to 21.6 40
21.7 to 24.1 35
24.2 to 26.7 30
26.8 to 29.2 27
29.3 to 31.8 24
31.9 to 34.3 21
34.4 to 36.8 19
36.9 to 39.4 17
39.5 to 41.9 15
42.0 to 44.5 14
44.6 to 47.0 13
47.1 to 49.5 12
49.6 to 52.1 11
52.2 to 54.6 10
>54.7 <10
. PRE-FIELD-TRIP ACTIVITY 5 – TRANSPARENCY
1-29 Exploring Streams – Stream Monitoring Curriculum Guide

To further understand
how time and turbidity
impact fish, look at the
graph to the right. The
graph shows that the
longer time turbidity
levels are elevated, the
greater the impact on
aquatic life. High
turbidity levels affect
humans too. An
acceptable turbidity level
for recreation is 5 NTU
and an acceptable level
for human consumption
ranges from 1-5 NTU.
.zPRE-FIELD-TRIP ACTIVITY 5 – TRANSPARENCY
For additional information about monitoring transparency visit this website:
http://watermonitoring.uwex.edu/wav/monitoring/transparency.html
RELATIONAL TRENDS OF FRESHWATER FISH ACTIVITY TO TURBIDITY VALUES AND TIME
Tu
rbid
ity
High
Time Hours Days Weeks Months
10 NTUs
100 NTUs
1,000 NTUs
10,000 NTUs
100,000 NTUs
Death
– Reducedgrowth ratesdetected
– Delayedhatching rates
– Fishabandoncover
– Fish startto showsigns ofstress
– Increasedcoughingrates
– Reducedfeedingrates
– Increasedrespiration
– Avoidancebehaviordetected
– Long-termreduction infeeding success
Low
PROCEDURE:
1. Show students the video about turbidity/transparency monitoring that is on the Water Action Volunteers DVD Set (from the main menu on Disc 1, choose “Monitoring Protocols” and then “Turbidity”; Run time 5:20). The video is also available online at: http://watermonitoring.uwex.edu/wav/monitoring/video.html
2. Have students read the section in the student workbook entitled “Transparency” (See Section 4).
3. (Optional) Have students conduct additional reading about transparency monitoring on the website listed in the background section for this parameter.
4. Have students answer discussion questions in their workbook.
5. Have students make a hypothesis about the turbidity/transparency levels they will measure at their stream site. Students should record their hypothesis in their workbook.
6. Have students practice using transparency tubes in the classroom using tap water or a water sample you have collected from a nearby stream, following the procedure outlined in the video and available in sections 2 and 6.
1-30 Exploring Streams – Stream Monitoring Curriculum Guide

. PRE-FIELD-TRIP ACTIVITY 5 – TRANSPARENCY
Optional Activities:
Student Discussion Questions and Sample Answers:
1. High turbidity hinders plant growth and the production of which gas? oxygen
2. List four factors that can make water more turbid: Soil erosion from construction sites, streambanks and farm fields; Urban runoff; Excessive algal growth; Bottom sediments stirred up by bottom feeders such as carp.
3. Turbid waters often have higher temperature because the suspended particles absorb heat .
4. Turbidity is measured in what units? NTU
5. Would you more likely find more smallmouth bass or trout in waters that are very turbid? Give at least two reasons to support your hunch. I would more likely find more smallmouth bass in turbid waters because such waters will be warmer and have less dissolved oxygen.
6. How might a large change in the turbidity of stream water over a long period of time affect aquatic organisms? It may stress organisms living there if they are not accustomed to the different turbidity. They may experience such things as increased breathing rates, reduced feeding rates or abandon their cover.
7. What might increased turbidity or lower transparency tell us about human activities within the watershed? There could be much impervious surface area, so runoff is not properly filtered before entering the stream, or it could signify construction or deforest ation which would increase sediment washing away through erosion. It may also indicate erosion from agricultural fields or an input of materials from industrial discharges.
8. When assessing transparency you will take two measurements with the transparency tube and then calculate the average transparency (cm). Then you will convert the average transparency (cm) to turbidity (NTU). If your transparency tube readings were 106 cm and 98 cm, what is the average transparency? What turbidity does that convert to? 102 is the average transparency. That converts to a turbidity of <10 NTU.
9. You will soon be assessing the transparency of a stream near your school. Do you think that your stream will be very transparent or not? Why? Note your hypothesis for your stream site and your plan for how to research that hypothesis here:
• JustPassingThrough(Seepage1-97) • RainyDayHike(Seepage1-97) • ColorMeAWatershed(Seepage1-97) • TothePoint(Seepage1-99) • FiltrationActivity,IllinoisNCRS(Seepage1-100) • SoilGlue,IllinoisNRCS(Seepage1-100) • ErosionintheZone(Seepage1-100) • FilterPlants(Seepage1-100) • PercolationTest(Seepage1-100)
• ErosioninaBottle(Seepage1-63) • UrbanRunoffModel(Seepage1-68) • TransparencyTubeCaseConstruction
(See page 1-72) • StreamEcosystem–WhatMakesa
Stream Healthy? (See page 1-73) • BranchingOut(Seepage1-97) • A-maze-ingWater(Seepage1-97) • SumoftheParts(Seepage1-97)
1-31 Exploring Streams – Stream Monitoring Curriculum Guide
For a version (for teachers only) that includes answers, please contact
the WAV Coordinator. For contact information, see:
http://watermonitoring.uwex.edu/wav

ACTIVITY 6: TEMPERATURE
. PRE-FIELD-TRIP ACTIVITIES
Learning Objectives:
• Studentswillunderstandtheimpactthatchanges in temperature can have on stream life.
• Studentswillunderstandtherelationshipsbetween temperature and dissolved oxygen and between temperature and turbidity.
• Studentswillunderstandandpracticehowtomonitor water temperature.
Standards:
English A.8.1, A.8.4; Environmental Education B.8.5;
Mathematics: Statistics and Probability E.12.1; Science
Inquiry C.8.1, C.8.3, C.8.4, C.12.1, C.12.2, C.12.5
Materials:
• WaterActionVolunteersVolunteerStreamMonitoring DVD Set Disc #1
• StudentWorkbook(seeSection4)
• Writinginstrument
• ComputerwithInternetaccess(optional)
• Thermometers(approximatelyoneperthreeorfourstudents)
Time:
25 minutes
Background:
• Althoughmostaquaticlifehasadaptedtosurvivewithinarangeofwatertemperatures, some fish species (e.g., trout) require cooler waters. The metabolic rate of organisms, or the rate at which they convert food into energy, also increases with higher water temperatures, resulting in even greater demands on oxygen.
• Researchalsoshowsthatextremetemperaturefluctuationscanmakefish and insects more susceptible to disease, parasites and the harmful effects of toxic waste.
1-32 Exploring Streams – Stream Monitoring Curriculum Guide

Stable water temperature is a critical factor in maintaining the health of a stream and its
inhabitants. Temperatures over 75° F (24° C) for example, are usually fatal to brook trout, which
need waters in the range of 55°-65° F (12.8°-18.3° C) in order to thrive. Other fish such as the
smallmouth bass
can survive to 90° F
(35° C) and carp
can live in even
warmer waters.
So as temperature
increases, cold
water species will
gradually be
replaced by warm
water ones.
One of the most
drastic ways that
stream temperature
is increased is by
thermal pollution.
Thermal pollution
occurs when warm
water is added
to the stream.
Industries such as power plants, paper mills and cheese factories may discharge heated water
used in the manu facturing process into streams. Runoff, in a more indirect way, can also add
warm water to streams. Rainwater
running off warmed surfaces,
especially parking lots, roof tops
and roads, increases stream
temperatures.
The table to the left shows
temperature ranges for cold,
cool and warm streams.
. PRE-FIELD-TRIP ACTIVITY 6 – TEMPERATURE
Most Aquatic FreshwaterInvertebrates Die 40˚C
21-30˚C Optimal temperature range for bass, sunfish, catfish, minnows, darters,northern pike, dragonfly larva
10-20˚C Optimal temperature range for trout, sculpin,and larva of mayfly, stonefly, caddisfly
4.5-10˚C Optimal temperature range for brook and brown trout spawning
40˚C(104˚F)
35˚C(90˚F)
30˚C(86˚F)
25˚C(77˚F)
20˚C(68˚F)
15˚C(59˚F)
10˚C(50˚F)
5˚C(41˚F)
0˚C(32˚F)
Largemouth & SmallmouthBass Die 35˚C
Brown Trout Die 27˚C
Rainbow Trout Die 25˚CBrook Trout Die 24˚C
Some Mayfly and StoneflyLarva Die 20˚C
Illustration by Jeffrey J. StrobelUW-Extension Environmental Resources Center
Mo
re
Pla
nt
Gr
ow
th
SPECIES TOLERANCE TO VARIOUS TEMPERATURES
Thermal regimeMaximum instantaneous temperature
Maximum daily mean temperature
Cold water stream <25°C (77°F) <22°C (72°F)
Cool water stream 25-28°C 22-24°C
Warm water stream >28°C (82°F) >24°C (75°F)
THERMAL CRITERIA FOR COLD, COOL AND WARM WATER STREAMS IN WISCONSIN
1-33 Exploring Streams – Stream Monitoring Curriculum Guide

. PRE-FIELD-TRIP ACTIVITY 6 – TEMPERATURE
PROCEDURE:
1. Show students the video about water temperature monitoring that is on the Water Action Volunteers DVD Set (from the main menu on Disc 1, choose “Monitoring Protocols” and then “Temperature”; Run time 2:27). The video is also available online at: http://watermonitoring.uwex.edu/wav/monitoring/video.html
2. Have students read the section in the student workbook entitled “Temperature” (See Section 4).
3. (Optional) Have students conduct additional reading about temperature on the website listed at the end of the background section for this parameter.
4. Have students answer discussion questions in their workbook.
5. Have students make a hypothesis about the water temperature they will measure at their stream site. Students should record this hypothesis in their workbook.
6. Have students practice taking water temperature with the thermometers following the procedure outlined on the video and available in sections 2 and 6.
Mill ponds and impoundments also increase water temperature because they contain a large surface
area of slow-moving water which is warmed by the sun, affecting water temperature downstream.
Removing all overhanging trees that shade and cool the stream can also negatively impact
stream temperatures. Another factor contributing to higher stream temperatures is eroding soil.
Turbid water that results from eroded soil heats up quickly because the suspended sediments
absorb the sun’s radiant heat. Sediment also makes stream channels shallow. A shallow stream
warms up faster than deep waters.
Temperature changes can affect all aquatic life. For example, warm water holds less dissolved
oxygen than cold water and triggers higher plant growth and respiration rates. The lowered
oxygen levels of warmer waters are further reduced when plants and animals die and decay.
For additional information about water temperature, visit this website:
http://watermonitoring.uwex.edu/wav/monitoring/temp.html
1-34 Exploring Streams – Stream Monitoring Curriculum Guide

. PRE-FIELD-TRIP ACTIVITY 6 – TEMPERATURE
Student Discussion Questions and Sample Answers:
1. Warm water holds less oxygen than cold water.
2. Increased temperatures trigger increased plant growth and respiration rates.
3. Management decisions and stream classifications are often closely tied to water temperatures.
4. The water temperature of Stream X measured 27° C. What type of fish might you expect to find living here? What factors may be impacting the temperature of this stream? Explain. I would expect to find such fish as smallmouth bass and carp. Factors that could be impacting the stream include thermal pollution from industry or factories such as paper mills or power plants, runoff traveling over warmed impervious surfaces, mill ponds and impound ments, lack of shade trees, or high levels of erosion.
5. If you were a developer in a local community, what are some things you might do to minimize changes in stream water temperature? I could provide a healthy riparian zone, leave wetlands intact whenever possible, etc. (Answers may vary widely).
6. What impacts would drastic fluctuations in water temperature have on life in the stream? It would cause stress to life in the stream. Specifically it might cause changes in feeding, respiration rates, growth rates, or hatching, and possibly death.
7. You will soon be measuring water temperature at a stream near your school. What water temperature do you expect to find? Why? Note your hypothesis for your stream site and your plan for how to research that hypothesis here:
Optional Activities:
• StreamEcosystem–WhatMakesaStreamHealthy?(Seepage1-73)
• BranchingOut(Seepage1-97)
• A-maze-ingWater(Seepage1-97)
• SumoftheParts(Seepage1-97)
• JustPassingThrough(Seepage1-97)
• RainyDayHike(Seepage1-97)
• ColorMeAWatershed(Seepage1-97)
• WaterofLife(Seepage1-99)
1-35 Exploring Streams – Stream Monitoring Curriculum Guide
For a version (for teachers only) that includes answers, please contact
the WAV Coordinator. For contact information, see:
http://watermonitoring.uwex.edu/wav

ACTIVITY 7: DISSOLVED OXYGEN
. PRE-FIELD-TRIP ACTIVITIES
Learning Objectives:
• Studentswillunderstandwhatvariablesmayinfluencechanges in the dissolved oxygen level of a stream.
• Studentswillunderstandwhatlevelsofdissolvedoxygen are needed for aquatic life and why drastic changes may be harmful.
• Studentswillunderstandandpracticehowtoassessdissolved oxygen.
Standards:
English A.8.1, A.8.4; Environmental Education B.8.5; Mathematics: Statistics and
Probability E.12.1; Science Inquiry C.8.1, C.8.3, C.8.4, C.12.1, C.12.2, C.12.5
Materials:
• WaterActionVolunteersVolunteerStreamMonitoringDVDSetDisc#1
• StudentWorkbook(seeSection4)
• Writinginstrument
• ComputerwithInternetaccess(optional)
• HachModelOX-2Pdissolvedoxygenkits(approximatelyonekitperthreeorfour students)
• Safetyglasses(onepairperstudent)
Time:
50 minutesBackground:
• Allplantsandanimalsrequireoxygenforsurvival.
• Dissolvedoxygenlevelsinstreamsfluctuateoverthecourseof24hours.
• Coldwatercanholdmoredissolvedoxygenthanwarmerwater.
Oxygen is a clear, colorless, odorless and tasteless gas that dissolves in water. Small but
important amounts of it are dissolved in water. It is supplied by diffusion of atmospheric oxygen
(air) into the water and by production of oxygen from photosynthesis by aquatic plants. Wind,
waves and tumbling water in fast-moving streams increase the rate of diffusion.
1-36 Exploring Streams – Stream Monitoring Curriculum Guide

. PRE-FIELD-TRIP ACTIVITY 7 – DISSOLVED OXYGEN
Both plants and animals depend on dissolved oxygen for survival. Lack of dissolved oxygen can
cause aquatic animals (e.g., fish, macroinvertebrates) to quickly leave the area or face death. Under
low oxygen conditions, the aquatic animal community changes quickly. Under extreme conditions,
lack of oxygen can kill aquatic plants and animals. Measuring dissolved oxygen is probably the
most significant water quality test to determine the suitability of a stream for fish and many other
aquatic organisms. However, these measures only provide a snapshot of the oxygen levels at that
particular time. Levels can fluctuate widely throughout the day and year. Fish and other organisms
have to live and breathe in that water all year long. A short time without oxygen can be fatal.
Dissolved oxygen (D.O.) is reported as milligrams of oxygen per liter of water (mg/L) which can be
called parts per million (ppm) by weight. Different aquatic organisms have different oxygen needs.
Trout and stoneflies, for example, require high dissolved oxygen levels. Trout need water with at
least 6 mg/L D.O. Warm water fish such as bass and bluegills survive nicely at 5 mg/L D.O. and
some organisms such as
carp and blood worms
can survive with less
than 1 mg/L of D.O.
Based on this, there are
stream class ifications in
Wisconsin that define
the minimum amount
of oxygen that must be
maintained in a stream
with a given classification
(See charts at right).
The oxygen demand of aquatic plants and
cold-blooded animals also varies with water
temp erature. A trout uses five times more
oxygen while resting at 80° F (26.7° C) than
at 40° F (4.4° C).
There are many factors that affect the
amount of dissolved oxygen in the water
(see chart on the following page). A major
one is photosynthesis.
DISSOLVED OXYGEN REQUIREMENTS OF AQUATIC PLANTS AND ANIMALS
Very High D.O. Moderately High D.O. Low D.O.
A N I M A L SBrook or rainbow trout Brown trout Carp
Mottled sculpin Redbelly dace Green sunfish
Bass Fathead minnow
P L A N T S
Much plant variety Moderate plant variety Little plant variety
Source: Dane County Water Watchers
Stream Classification
Minimum Dissolved Oxygen Allowed
Trout waters 6 mg/L (out of spawning season) and 7 mg/L (during spring/fall spawning season)
Fish or aquatic life- designated waters
5 mg/L
Limited forage fish waters
3 mg/L
Limited aquatic life waters
1 mg/L
MINIMUM DISSOLVED OXYGEN LEVELS ALLOWED FOR WATERS WITH
VARIED CLASSIFICATIONS IN WISCONSIN
1-37 Exploring Streams – Stream Monitoring Curriculum Guide

. PRE-FIELD-TRIP ACTIVITY 7 – DISSOLVED OXYGEN
Aquatic plants produce oxygen by photosynthesis during daylight hours, but they also use
oxygen for respiration. High day-time levels of D.O. are often countered with low night-time
levels (see a sample diel cycle for dissolved oxygen below). This is due to respiration of living
organisms, including fish, bacteria,
fungi and protozoans, as well as the
cessation of photo synthesis. Wide
daily fluctuations of D.O. stress fish
and other aquatic animals. Oxygen
depletion can occur because of
heavy plant growth. Complete
depletion of D.O. can sometimes be
detected with your nose. Anaerobic
decay results in a rotten egg smell
(hydrogen sulfide gas). However,
oxygen levels can be improved with good management practices such as planting or
maintaining vegetation that filters rainwater runoff and shades the water, and protecting the
stream channel in other ways to maintain or increase turbulence.
Recording dissolved oxygen differs from other tests in
that it requires two distinct calculations. We are
interested in both the absolute amount of D.O. and how
close the value is to the equilibrium value for that
temperature and air pressure (known as the percentage
of saturation.) Values between 91% and 110% of
saturation are excellent. Supersaturated (over 100%)
Factors That Could Increase The Amount of Dissolved Oxygen in Water
Factors That Could Decrease The Amount of Dissolved Oxygen in Water
• Highatmosphericpressure
• Clearwater
• Photosynthesis
• Muchturbulence/waveaction
• Coldwater
• Presenceofexcessiveamounts of plants (during daytime)
• Respirationofanimalsandplantslivinginthewater
• Chemicalreactionsofthedecayingprocess
• Lowatmosphericpressure
• Highlevelsofturbidity(suchasfromerosion)
• Warmwater
• Presenceofexcessiveamountsofplants(duringnighttime)
• Excessiveorganicmaterials(suchassewage,manureorfertilizers)
SAMPLE DIEL FLUCTUATION OF DISSOLVED OXYGEN IN A STREAM
Dissolved Oxygen Levels (% Saturation)
Excellent: 91-110
Good: 71-90
Fair: 51-70
SOURCE: Field Manual for Water Quality Monitoring (13th Edition)
1-38 Exploring Streams – Stream Monitoring Curriculum Guide

. PRE-FIELD-TRIP ACTIVITY 7 – DISSOLVED OXYGEN
values may sound good but they can also indicate problems, such as excessive plant growth.
You can assess the range of dissolved oxygen levels that aquatic plants and animals at your
stream site must withstand by monitoring twice in one day – early in the morning, just before
sunrise, and later in the afternoon when plants have been exposed to the most direct sunlight
for an extended period.
For additional information about monitoring dissolved oxygen visit this website:
http://watermonitoring.uwex.edu/wav/monitoring/oxygen.html
PROCEDURE:
1. Show students the video about dissolved oxygen monitoring that is on the Water Action Volunteers DVD Set (from the main menu on Disc 1, choose “Monitoring Protocols” and then “Dissolved Oxygen”; Run time 13:10). The video is also available online at: http://watermonitoring.uwex.edu/wav/monitoring/video.html
2. Have students read the section in the student workbook entitled “Dissolved Oxygen” (See Section 4).
3. (Optional) Have students conduct additional reading about dissolved oxygen on the website listed in the background section for this parameter.
4. Have students answer discussion questions in their workbook.
5. Have students make a hypothesis about the dissolved oxygen levels they will measure at their stream site. Students should record this hypothesis in their workbook.
6. Using tap water or a stream sample you have collected, have students practice assessing dissolved oxygen following the methods outlined in the video and available in sections 2 and 6.
Student Discussion Questions and Sample Answers:
1. How does oxygen get into the water? Oxygen enters the water through plant photosynthesis and through water turbulence (exchange between the water and the air).
2. What factors affect the levels of dissolved oxygen in the water? Factors that affect dissolved oxygen in the water include the time of day, water temperature and turbidity of the water.
3. When is oxygen consumed in streams? Oxygen is always being consumed in streams by all organisms, including plants and animals.
4. What is the problem with wide fluctuations in dissolved oxygen? Very low or very high dissolved oxygen levels can be problematic for stream organisms, all of which rely on oxygen for survival.
1-39 Exploring Streams – Stream Monitoring Curriculum Guide
For a version (for teachers only) that includes answers, please contact
the WAV Coordinator. For contact information, see:
http://watermonitoring.uwex.edu/wav

. PRE-FIELD-TRIP ACTIVITY 7 – DISSOLVED OXYGEN
5. The dissolved oxygen level of the water in Stream Z was recently tested. It was found to have a dissolved oxygen level of 4 ppm. Is this considered low or high? Low
6. Which organisms might you expect to find thriving in Stream Z? I might expect to find bass, bluegill, carp, bloodworms and sowbugs.
7. Based on this dissolved oxygen level (of 4 ppm), what might you expect to be true about the transparency and temperature of the stream? I would expect decreased transparency and increased temperature as the suspended particles will trap heat and block sunlight, therefore reducing the photosynthesis that would produce oxygen.
8. Explain why dissolved oxygen levels may be higher in the day and lower at night. What other variables can cause changes in the dissolved oxygen levels? Plants produce oxygen during the process of photosynthesis which takes place in the presence of sunlight (during the day). At night plants as well as animals continue to respire and use up oxygen in the water and produce carbon dioxide. Other variables that may affect dissolved oxygen levels include turbidity, stream flow/wave action/turbulence, weather (e.g., cloudy days have decreased photosynthesis, wind, atmospheric pressure), temperature, decomposition, water depth and color, excessive organic waste, excessive plant growth, industrial outlets, flowages or storm sewers.
9. You will soon be testing the dissolved oxygen content of a stream near your school. Make a hypothesis. Do you think that your stream will have high or low levels of dissolved oxygen? Why? Note your hypothesis for your stream site and your plan for how to research that hypothesis here:
Optional Activities:
• Stream Ecosystem – What Makes a Stream Healthy? (See page 1-73)
• PartsPerMillionLab(Seepage1-78)
• ReachingYourLimits(Seepage1-97)
• FishFood(Seepage1-99)
• WaterofLife(Seepage1-99)
1-40 Exploring Streams – Stream Monitoring Curriculum Guide
For a version (for teachers only) that includes answers, please contact
the WAV Coordinator. For contact information, see:
http://watermonitoring.uwex.edu/wav

ACTIVITY 8: STREAM FLOW
. PRE-FIELD-TRIP ACTIVITIES
Learning Objectives:
• Studentswillunderstandwhatconditionscanleadtohighandlowflowrates.
• Studentswillunderstandhowdifferentflowratescanaffectlifeinthestream.
Standards:
English A.8.1, A.8.4; Environmental Education B.8.5; Mathematics: Statistics and Probability E.12.1
Materials:
• WaterActionVolunteersVolunteerStreamMonitoringDVDSetDisc#1
• StudentWorkbook(seeSection4)
• Writinginstrument
• ComputerwithInternetaccess(optional)
Time:
25 minutes
Background:
• Streamflowisameasureofthevolumeofwatermovingpastapointduringa span of time.
• Streamflowisaffectedbyrunoffofrainorsnowmelttothestreamfromthesurrounding watershed, and also by groundwater inputs.
Stream flow, or discharge, is the volume of water moving
past a cross-section of a stream over a set period of time. It
is usually measured in cubic feet per second (cfs).
Stream flow is affected by the amount of water within a
watershed – increasing with rainstorms or snowmelt, and
decreasing during dry periods. Flow is also important
because it defines the shape, size and course of the stream.
It is integral not only to water quality, but also to habitat. Food sources, spawning areas and
migration paths of fish and other wildlife are all affected and defined by stream flow and
velocity. Velocity and flow together determine the kinds of organisms that can live in a stream
(some need fast-flowing areas; others need quiet, low-velocity pools). Different kinds of
vegetation require different flows and velocities as well.
Note to teachers:
Although it is often preferred to teach students Systéme International (SI) Notation, we measure stream flow in cubic feet per second (cfs) following methodology of the lead stream flow monitoring agency in the United States, the US Geological Survey (Turnipseed and Sauer, 2010).
1-41 Exploring Streams – Stream Monitoring Curriculum Guide

Stream flow is affected by both forces of nature and by humans. In undeveloped watersheds, soil
type, vegetation and slope all play a role in how fast and how much water reaches a stream. In
watersheds with high human impacts, water flow might be depleted by withdrawals for irrigation,
domestic or industrial purposes. Dams used for electric power generation may affect flow,
particularly during periods of peak need
when stream flow is held back and later
released in a surge. Drastically altering
landscapes in a water shed, such as with
development, can also change flow
regimes. For instance, increasing areas of
impervious surface causes faster runoff
during storm events and higher peak
flows. These altered flows can negatively
affect an entire ecosystem by upsetting
habitats and organisms dependent on
natural flow rates.
Tracking stream flow measurements over a period of time can give us baseline information
about the stream’s natural flow rate.
For more information about stream flow, visit this website:
http://watermonitoring.uwex.edu/wav/monitoring/flow.html
. PRE-FIELD-TRIP ACTIVITY 8 – STREAM FLOW
STORM
PRE-DEVELOPMENT
POST
-DEV
ELOP
MEN
T
TIME
Higher, more rapidpeak discharge
More runoff volume
Gradual riseand recession
Lower, less rapidpeak dischargeHigher
base flow
STR
EAM
FLO
W
A hydrograph is a graph that shows stream flow over time. This hydrograph shows how stream flow changes as a watershed goes from a natural land cover (pre-development) to an urbanized land cover (post-development).
Reference: Turnipseed, D.P. and V.B. Sauer. 2010. Discharge Measurements at Gaging Stations. Chapter 8 of Book 3, Section A. U.S. Department of the Interior. U.S. Geological Survey. 87 pp.
PROCEDURE:
1. Show students the video about stream flow monitoring that is on the Water Action Volunteers DVD Set (from the main menu on Disc 1, choose “Monitoring Protocols” and then “Stream Flow”; Run time 7:21). The video is also available online at: http://watermonitoring.uwex.edu/wav/monitoring/video.html
2. Have students read the section in the student workbook entitled “Stream Flow” (see Section 4).
3. (Optional) Have students conduct additional reading about stream flow on the website listed at the end of the background section for this parameter.
4. Have students answer discussion questions in their workbook.
5. Have students make a hypothesis about the stream flow they will measure at their stream site. Students should record this hypothesis in their workbook.
1-42 Exploring Streams – Stream Monitoring Curriculum Guide

. PRE-FIELD-TRIP ACTIVITY 8 – STREAM FLOW
Student Discussion Questions and Sample Answers:
1. What is stream flow? Stream flow is the volume of water that passes a point in a certain time period.
2. What units are used to measure stream flow? Stream flow is generally measured in cubic feet per second.
3. Name at least three ways that humans can alter stream flow. Some ways humans can alter stream flow are through irrigation, domestic or industrial withdrawals, dams, development, impervious surfaces or removing vegetation near a stream.
4. Name at least four ways that changes in stream flow can affect fish. Changes in stream flow can affect fishes’ food sources, spawning areas and migration paths. Plus, drastic changes in flow could be detrimental to fish if a stream is partially or fully dewatered at times, thus eliminating their habitat or changing the temperature and thus oxygen availability.
5. Why would a stream in the forest have lower peak flows following a rain storm than a stream of the same size in a city? Plant roots and soil in the forest will allow some runoff water to infiltrate into the ground or be used by plants as it flows towards the stream, thus water will reach the stream more slowly and in smaller quantities in the forest. In the city, the water will not infiltrate into the ground but will run directly into the stream over the paved roads and parking lots, or from storm sewers.
6. You will soon be measuring stream flow at a stream near your school. What flow do you expect to find? Why? Note your hypothesis for your stream site and your plan for how to research that hypothesis here:
Optional Activities:
• Stream Ecosystem – What Makes a Stream Healthy? (See page 1-73)
• Branching Out (See page 1-98)
• Rainy Day Hike (See page 1-98)
• Back to the Future (See page 1-98)
• Just Passing Through (See page 1-98)
• Color Me a Watershed (See page 1-98)
• Putting on the Brakes (See page 1-100)
1-43 Exploring Streams – Stream Monitoring Curriculum Guide
For a version (for teachers only) that includes answers, please contact
the WAV Coordinator. For contact information, see:
http://watermonitoring.uwex.edu/wav

ACTIVITY 9: HABITAT ASSESSMENT
. PRE-FIELD-TRIP ACTIVITIES
Learning Objectives:
• Studentswillunderstandhowstreamlifeandwaterqualityareaffectedbyuses of the land nearby the stream.
• Studentswillunderstandhowdifferentsubstratesareimportantforstreamlife.
• Studentswillunderstandandpracticehowtoassesshabitat.
Standards:
English A.8.1, A.8.4; Environmental Education B.8.5; Mathematics: Statistics and Probability E.12.1
Materials:
• WaterActionVolunteersVolunteerStreamMonitoringDVDSetDisc#1
• StudentWorkbook(seeSection4)
• Writinginstrument
• ComputerwithInternetaccess(optional)
Time:
30 minutes
Background:
• Thehabitatfunctionsholistically,soanychangestoapartmayaffecttheentire habitat.
• Certainlandusesaffecthabitatqualityandstreamhealth.
• TheHabitatChecklistusesvisualmeasurementsoflandandwaterconditionsto help pinpoint land uses affecting water quality.
A healthy stream is a busy place. Wildlife find shelter and food near and in its waters. Vegetation
grows along its banks, shading the stream and filtering pollutants before they enter the stream.
Within the stream are fish, insects and other tiny creatures with specific needs: dissolved oxygen
to breathe; rocks, overhanging tree limbs, logs and roots for shelter; vegetation and other tiny
animals to eat; and special places to breed and hatch their young. For any of these activities,
organisms might also need water of specific velocity, depth and temperature. Many land-use
activities can alter these characteristics, causing problems within the entire habitat. The Habitat
Assessment is an easy-to-use approach for identifying and assessing the elements of a stream’s
habitat. This assessment is useful as: 1) a screening tool to identify habitat stressors and 2) a
method for learning about stream ecosystems and environmental stewardship.
1-44 Exploring Streams – Stream Monitoring Curriculum Guide

. PRE-FIELD-TRIP ACTIVITY 9 – HABITAT ASSESSMENT
Taking stock of the habitat’s characteristics may begin at the riparian zone where land is
making a transition into water. Within healthy stream corridors, this area generally has certain
kinds of vegetation that act as a buffer between land and water, soaking up many pollutants
carried in runoff. Moving on, the stream assessment will then focus on the condition of the
upper and lower banks and finally the stream channel and stream itself. In order to help
prepare you to fill out the Habitat Checklist, certain stream and river characteristics and
concepts are defined in the following text.
RIPARIAN ZONE
The healthy riparian zone is characterized by trees, bushes, shrubs and tall grasses that help to
buffer the stream from polluted runoff and create habitat for fish and wildlife. These plants also
provide stream shading (or overhead canopy) and serve several important functions in the
stream habitat. The canopy helps keep water temperatures cool by shading the water from the
sun, while offering protection and refuge for animals. Certain conditions in the riparian zone
can negatively affect the stream’s habitat. Lawns maintained to the water’s edge are abrupt
transitions from land to water, offering very little or no buffering protection for the stream. In
these cases, lawn care products and grass clippings could be entering the stream. Short-grassed
streambanks also provide poor habitat for animals. Bare soil and pavement provide no
buffering action from runoff. Features to note in riparian zones:
/ Evergreen trees (conifers) – cone-bearing trees that do not lose their leaves in winter.
/ Hardwood trees (deciduous) – in general, trees that shed their leaves at the end of the growing season.
/ Bushes – short conifers or deciduous shrubs less than 15 feet high.
/ Tall grass, ferns, etc. – includes tall, natural grasses, ferns, vines and mosses.
/ Lawn – cultivated and maintained short grass.
/ Boulders – rocks larger than 10 inches.
/ Gravel/cobbles/sand – rocks smaller than 10 inches in diameter; sand.
/ Bare soil
/ Pavement or structures – any structures or paved areas, including paths, roads, bridges, houses, etc.
/ Garbage or junk adjacent to the stream – note the presence of litter, tires, appliances, car bodies or other large objects.
1-45 Exploring Streams – Stream Monitoring Curriculum Guide

STREAMBANK CHARACTERISTICS
The streambank consists of the upper bank and lower bank.
The shape and condition of the streambank can give many
clues to the types of land uses in the adjacent watershed. For
example, sometimes the channel may be altered by too much
water flooding the stream in a short time. This may indicate a
nearby urban area with many impervious surfaces, so the rain or melting snow cannot naturally
soak into the ground. Large volumes of runoff then flood the nearest stream with too much
water, which erodes and distorts the stream channel. Sometimes it is obvious that the banks
have been eroded by excessive water because the normal flow does not reach the new shoreline
which has been pushed back.
A vertical or undercut bank rises vertically (at an approximate 90-degree angle) or overhangs the
stream. This type of bank generally provides good cover for aquatic invertebrates (small animals
without backbones) and fish, and is resistant to erosion. This bank usually has a good vegetative
cover that helps to stabilize the bank. If seriously undercut, however, the bank could collapse.
A steeply sloping bank slopes at more than a 45-degree angle. This type of bank is very
vulnerable to erosion.
A gradually sloping bank has a slope of about 30 degrees or less. Although this type of
streambank is highly resistant to erosion, it does not provide much streamside cover.
Artificial bank modifications include ditching and other changes such as concrete
embankments and gabions to stem further erosion due to the action of the water. Also included
are LUNKER structures which are wooden underwater habitats set into the bank and designed
for trout and other game fish. Rock rip rap placed at bends and other areas subject to erosion
serve to improve fish habitat and stabilize stream meanders. Poor streambank conditions can
include the loss of natural plant cover. Erosion can occur when streamside vegetation is trampled
or missing or has been replaced by poorly designed landscaping or pavement. More severe cases
of streambank erosion include washed away banks or banks that have collapsed. Excessive mud
or silt entering the stream from erosion can distort the stream channel, and interfere with
beneficial plant growth, dissolved oxygen levels and the ability of fish to sight prey. It can also
irritate fish gills and smother fish eggs in spawning areas. Often it is the result of eroding
streambanks, poor construction site practices, urban area runoff, silviculture (forestry practices)
or ditches that drain the surrounding landscape.
. PRE-FIELD-TRIP ACTIVITY 9 – HABITAT ASSESSMENT
Note to teachers:
See the Habitat Section of the student workbook on pages 4-31 - 4-40 for illustrations of these characteristics.
1-46 Exploring Streams – Stream Monitoring Curriculum Guide

. PRE-FIELD-TRIP ACTIVITY 7 – HABITAT. PRE-FIELD-TRIP ACTIVITY 9 – HABITAT ASSESSMENT
IN-STREAM CHARACTERISTICS
Stream bottoms (substrate) are classified according to the materials that they are made of.
Rocky-bottom streams are defined as those made up of gravel, cobbles and boulders in any
combination. They usually have definite riffle areas. Soft-bottom streams have naturally muddy,
silty or sandy bottoms that lack riffles. Usually, these are slow-moving, low-gradient streams (i.e.,
streams that flow along flat terrain). A different questionaire for each type of stream bottom has
been designed for you to use. Substrate types include:
Silt/clay/mud – This substrate has a sticky feeling. The particles are fine. The spaces between
the particles hold a lot of water, making the sediments feel like ooze.
Sand (up to 0.1 inch) – A sandy bottom is made up of tiny, gritty particles of rock that are
smaller than gravel but coarser than silt (gritty, particles are smaller than a grain of rice).
Gravel (0.1-2 inches) – A gravel bottom is made up of stones ranging from tiny quarter-inch
pebbles to rocks of about 2 inches (fine gravel is rice size to marble
size; coarse gravel is marble to ping pong ball size).
Cobbles (2-10 inches) – Most rocks on this type of stream bottom are
between 2 and 10 inches (between a ping pong ball and a basketball
in size).
Boulders (greater than 10 inches) – Most of the rocks on the bottom
are greater than 10 inches (between a basketball and a car in size).
Bedrock – This kind of stream bottom is solid rock (or rocks bigger
than a car).
Embeddedness is the extent to which rocks (i.e., gravel, cobbles and
boulders) are buried by silt, sand or mud on the stream bottom.
Generally, the more embedded the rocks, the less rock surface or
space between rocks there is available for aquatic macroinvertebrate
habitat and for fish spawning. Excessive silty runoff from erosion can
increase a stream’s embeddedness. To calculate embeddedness,
estimate the amount of silt or finer sediments overlying, inbetween,
and surrounding the rocks (see diagram at right).
A rocky-bottom stream becomes embedded with sand. As sand settles on the streambed, spaces between the rocks fill up.
BEC
OM
ING
MO
RE EM
BED
DED
1-47 Exploring Streams – Stream Monitoring Curriculum Guide

Presence of logs or woody debris in streams can provide important fish habitat. Be sure to
differentiate between logs or woody debris and naturally occurring or moderate amounts of
organic material in streams, which includes leaves and twigs.
WATER CHARACTERISTICS
Streams are made up of pools, riffles and runs. A mixture of flows and depths creates a variety
of habitats to support fish and invertebrate life.
/ Riffles are shallow with fast turbulent water running over rocks.
/ Runs are deeper with fast-moving water with little or no turbulence.
/ Pools are deep with slow water.
Stream velocity influences the health, variety and abundance of aquatic animals. If water flows
too quickly, some organisms might be unable to maintain their hold on rocks and vegetation,
and they may be flushed downstream. If water flows too slowly, oxygen diffusion might be
insufficient for species needing high levels of dissolved oxygen. Dams, channelization or
straightening out a stream’s natural bends (sinuosity), certain kinds of terrain, runoff and other
factors can also affect stream velocity.
Rooted aquatic plants provide food and cover for aquatic organisms. They can also indicate
water quality problems. Sometimes, excess nutrients may flush into the stream and stimulate
unnatural aquatic plant growth. To decide if there are too many plants, compare the amount of
plants in your stream to other streams in the area with varied land uses in their watersheds.
Algae are simple plants that do not grow true roots, stems or leaves and that mainly live in water,
providing food for animals low on the food chain. Algae may be green or brown, grow on rocks,
twigs or other submerged materials, or float in the water. Excessive algal growth may indicate
excessive nutrients (e.g., organic matter or a pollutant such as fertilizer) in the stream.
What do Habitat Assessments Mean?
Each stream will have a unique habitat assessment value ranging between 13 (worst) and 52 (best).
This value is an important baseline measure for future comparisons. By comparing specific
habitat parameter scores (between years at one site or between sites in small watersheds) the
connection between land use and aquatic habitat may be better understood.
For more information about habitat, visit this website:
http://watermonitoring.uwex.edu/wav/monitoring/habitat.html
. PRE-FIELD-TRIP ACTIVITY 9 – HABITAT ASSESSMENT
1-48 Exploring Streams – Stream Monitoring Curriculum Guide

. PRE-FIELD-TRIP ACTIVITY 9 – HABITAT ASSESSMENT
PROCEDURE:
1. Show students the video about habitat assessment monitoring on the Water Action Volunteers DVD Set (from the main menu on Disc 1, choose “Monitoring Protocols” and then “Habitat”; Run time 14:49). The video is also available online at: http://watermonitoring.uwex.edu/wav/monitoring/video.html
2. Have students read the section in the student workbook entitled “Habitat Assessment” (see Section 4).
3. (Optional) Have students conduct additional reading about habitat assessment on the website listed in the background section above and in their workbook.
4. Have students answer discussion questions in their workbook.
5. Have students make a hypothesis about the habitat score they will measure at their stream site. Students should record this hypothesis in their workbook.
6. (Optional) Download a presentation from the Water Action Volunteers’ website:
http://watermonitoring.uwex.edu/pdf/level1/Habitat_Assessment_PPT.pdf
Show this to your students so they can practice ranking habitat based on the sites shown and using the data sheets available in section 6.
Student Discussion Questions and Sample Answers:
1. Why do you think it is important to include a quantitative habitat assessment when evaluating the health of a stream? It is important because it makes it easier to compare stream health from one site visit to the next and to compare habitat between streams.
2. Why is it important for a stream to have a healthy riparian zone? It is important because the riparian zone will buffer runoff before it enters the stream. There may also be more diverse habitat for a larger diversity of wildlife to live and thrive.
3. What types of habitats would support a more diverse fish and aquatic insect population? A combination of runs, pools and riffles, as well as different substrates and bank types would support the most diverse fish and aquatic insect population.
4. You will soon be assessing habitat at a stream near your school. What habitat score do you expect to find? Why? (A total score of between 13 and 52 is possible; the higher the score, the healthier the stream.) Note your hypothesis for your stream site and your plan for how to research that hypothesis here:
1-49 Exploring Streams – Stream Monitoring Curriculum Guide
For a version (for teachers only) that includes answers, please contact
the WAV Coordinator. For contact information, see:
http://watermonitoring.uwex.edu/wav

. PRE-FIELD-TRIP ACTIVITY 9 – HABITAT ASSESSMENT
Optional Activities:
• StreamEcosystem–WhatMakesaStream Healthy? (See page 1-73)
• WetlandMetaphors(Seepage1-96)
• EdgeofHome(Seepage1-96)
• BlueRibbonNiche(Seepage1-96)
• WhereDoesWaterRunoff(formerly, Where Does Water Runoff After School) (See page 1-96)
• DragonflyPond(Seepage1-96)
• BranchingOut(Seepage1-98)
• A-maze-ingWater(Seepage1-98)
• SumoftheParts(Seepage1-98)
• JustPassingThrough(Seepage1-98)
• RainyDayHike(Seepage1-98)
• ColorMeAWatershed(Seepage1-98)
• WaterAddress(Seepage1-98)
• HomeSweetHome(Seepage1-99)
• TothePoint(Seepage1-99)
• SharedInterests(Seepage1-99)
• RestorationNation(Seepage1-99)
• ReadingtheWater(Seepage1-99)
• CommunitySiteChecklist(Seepage1-100)
• HomeSiteChecklist(Seepage1-100)
• SchoolSiteChecklist(Seepage1-100)
• FarmSiteChecklist(Seepage1-100)
• OntheEdge(Seepage1-100)
• ZoneSearch(Seepage1-100)
• PuttingontheBrakes(Seepage1-100)
• PlantPower(Seepage1-100)
1-50 Exploring Streams – Stream Monitoring Curriculum Guide

ACTIVITY 10: BIOTIC INDEX
. PRE-FIELD-TRIP ACTIVITIES
Learning Objectives:
• Studentswillbeabletodefineaquaticmacroinvertebrate.
• Studentswillunderstandhowmacroinvertebratesareusedtolearnaboutthelong-term health of a stream.
• Studentswillunderstandandpracticehowtoassesswaterquality,usingabiotic index.
• Studentswillunderstandhowtousethemacroinvertebratedatasheettoassess stream water quality.
Standards:
English A.8.1, A.8.4; Environmental Education B.8.5, B.8.8; Mathematics: Statistics and
Probability E.12.1; Life and Environmental Science F.8.8
Materials:
• WaterActionVolunteersVolunteerStreamMonitoringDVDSetDisc#1
• StudentWorkbook(seeSection4)
• Writinginstrument
• ComputerwithInternetaccess(optional)
• Macroinvertebrate“dice”:Foreachgroupofstudents,havefourone-inchblocks with a drawing of a macroinvertebrate (from data sheets) copied, cut out, and taped or glued to each block face
• KeystoMacroinvertebrateLifeintheRiver
• Macroinvertebratedatasheets
Time:
45 minutes
1-51 Exploring Streams – Stream Monitoring Curriculum Guide

. PRE-FIELD-TRIP ACTIVITY 10 – BIOTIC INDEX
Background:
• Aquaticmacroinvertebratesaresmallanimalswithoutbackbones. Their presence or absence can reflect a stream’s general condition.
• Certainmacroinvertebratesresponddifferentlytothephysical,chemicalandbiological conditions within a stream.
• Aquaticmacroinvertebratesarerelativelyimmobilesotheycan’tescapeeithershort-term or long-term pollution exposure. This is important when assessing long-term pollution events within the stream.
From the crayfish burrowing in the streambed to the tiny aquatic insects skirting the water’s
surface, streams and rivers swarm with life. The inhabitants of this living place are affected by
poor water quality just like humans are affected by an unhealthy environment. However,
scientists have found that not all aquatic organisms react the same to poor water quality. Some
species are pollutant-tolerant while some are very pollutant-sensitive.
From this knowledge, a scale was developed to determine water quality based on the types of life
found in the water. For example, streams with primarily pollutant-tolerant organisms generally
have poorer water quality than those streams with many pollutant-sensitive animals. This is
because streams that become more polluted gradually lose pollutant-sensitive animals until only
the pollutant-tolerant species are left. A healthy stream will have many different organisms,
both pollutant-tolerant and those sensitive to pollution.
Although relatively accurate in assessing stream conditions, the Citizen Monitoring Biotic Index
does have its limitations. The biotic index can indicate a problem, but it cannot specify what
that problem might be. For example, manure, sewage, fertilizers, sediment and organic materials
all negatively impact water quality. In order to pinpoint these possible pollutant sources, other
monitoring such as habitat assessment, dissolved oxygen and temperature needs to be conducted.
The biotic index is useful for identifying long-term pollution problems, since these organisms
carry out a portion or all of their life cycle in streams. Most of the other parameters you will
monitor (except habitat) only indicate the water quality conditions at the time of testing.
To determine a biotic index score, you will collect organisms, identify them, and rate them based
on their tolerance to pollution using a chart like the Macroinvertebrate Tally on the next page.
The most tolerant organisms will get a score of 1; the least tolerant will get a score of 4. Review
the example on the following page to see how a biotic index score is determined.
1-52 Exploring Streams – Stream Monitoring Curriculum Guide

. PRE-FIELD-TRIP ACTIVITY 10 – BIOTIC INDEX
For additional information about macroinvertebrates, visit these websites:
http://watermonitoring.uwex.edu/wav/monitoring/biotic.html
http://watermonitoring.uwex.edu/wav/monitoring/coordinator/ecology/macro.html
PROCEDURE:
1. Show students the video about biotic index monitoring from the Water Action Volunteers DVD Set (from the main menu on Disc 1, choose “Monitoring Protocols” and then “Biotic Index”; Run time 11:40). The video is also available online at: http://watermonitoring.uwex.edu/wav/monitoring/video.html
2. Have students read the section in the student workbook entitled “Biotic Index” (see Section 4).
3. (Optional) Have students conduct additional reading about biotic index on the website listed in the background section for this parameter.
4. Have students answer discussion questions in their workbook.
5. Have students make a hypothesis about the biotic index they will measure at their stream site. Students should record this hypothesis in their workbook.
6. Have students roll the macroinvertebrate “dice” three times (to represent collecting three biotic index samples) and determine which macroinvertebrates are present in their stream using the Key to Macroinvertebrate Life in the River.
7. Have students fill out the macroinvertebrate data sheet (available in section 6) to show which macroinvertebrates were present in their three biotic index samples. Then have them complete the calculations on the data sheet to determine the health of the stream.
1-53 Exploring Streams – Stream Monitoring Curriculum Guide

. PRE-FIELD-TRIP ACTIVITY 10 – BIOTIC INDEX
Student Discussion Questions and Sample Answers:
1. What are aquatic macroinvertebrates? They are organisms that live in the water, do not have backbones, and which can be seen without the aid of a microscope.
2. Give some examples of aquatic macroinvertebrates. Mayflies, stoneflies, and damselflies are examples of aquatic macroinvertebrates.
3. What are some advantages to using macroinvertebrates to identify water quality as compared to studying other physical or chemical aspects of water quality? Macroinvertebrates provide a more long-term picture of stream quality as opposed to something like temperature which is specific to the very moment that the sample was collected.
4. After sampling the macroinvertebrate population at Stream X in Central Wisconsin that had low gradient and a muddy bottom, you noticed that there were not very many different types of organisms present. Before filling out the biotic index sheet, what would you speculate about the water quality of Stream X? Why? Stream X probably has poor water quality. When there is low diversity in the types of macroinvertebrates present, that often (though not always!) suggests the macroinvertebrates are primarily pollutant-tolerant organisms.
5. If you were standing on the edge of a stream planning where to go within it to collect aquatic macroinvertebrates, where would you try looking for them? They could be found under logs, under rocks, in leaf packs, on the surface, in strainers, within submerged vegetation along the bank, etc.
6. If you collected caddisflies, mayflies, riffle beetles, amphipods and both non-red midges and bloodworms, what would your biotic index score be? 2.3
7. You will soon be determining a biotic index score at a stream near your school. What water quality do you expect to find? Why? Note your hypothesis for your stream site and your plan for how to research that hypothesis here:
Optional Activities:
• MakingandUsingDichotomousKeys(Seepage1-82)
• ResearchingMacroinvertebrates(Seepage1-84)
• FashionaFish(Seepage1-97)
• MacroinvertebrateMayhem(Seepage1-98)
• BuildaBug(Seepage1-100)
1-54 Exploring Streams – Stream Monitoring Curriculum Guide
For a version (for teachers only) that includes answers, please contact
the WAV Coordinator. For contact information, see:
http://watermonitoring.uwex.edu/wav

E. coli BACTERIA MONITORING
. PRE-FIELD-TRIP OPTIONAL ACTIVITIES
The background material for this parameter is used with permission from Chapter 2 of the Citizens
Monitoring Bacteria manual, by Laura Bruhn and Lois Wolfson. Citizens Monitoring Bacteria was a three-
year multi-state, multi-partner project funded by USDA to develop a training program and scientifically
select a reliable bacteria monitoring method appropriate for use by volunteers monitoring surface waters.
The full manual is available at: http://www.usawaterquality.org/volunteer/EColi/Manual.htm
Learning Objectives:
• StudentswillunderstandwhatE. coli bacteria are and some sources of these bacteria.
• StudentswillunderstandhowE. coli bacteria are used to learn about the health of a stream.
• Studentswillunderstandandpracticehowtoassesswaterqualityusing E. coli bacteria.
Standards:
English A.8.1, A.8.4; Environmental Education B.8.5; Mathematics: Statistics and Probability
E.12.1; Science Inquiry C.8.1, C.8.2, C.12.1, C.12.2, C.12.3
Materials:
• WisconsinStateLaboratoryofHygiene“Beach Water Collection for E. coli Testing”Video(accessibleusingInternetExplorer at: http://www.slh.wisc.edu/ehd/watermicro/)
• StudentWorkbook(SeeSection4)
• Writinginstrument
• Sterile30mLsamplebottles(availablefrom Microbiology Labs)
• 3M™Petrifilm™plates(thisisagoodopportunity to use expired plates)
• 3M™Petrifilm™spreaders
Time:
50 minutes
• Sterile1mLpipettes
• Bleach(dilutesolution)
• Antibacterialhandwipes
• Permanentmarkers
• Papertowels
• Latexornitrilegloves
• Photosofbacteriacolonieson 3M Petrifilm plates
• E. coli bacteria data sheets
• ComputerwithInternetaccess(optional)
1-55 Exploring Streams – Stream Monitoring Curriculum Guide

. PRE-FIELD-TRIP OPTIONAL ACTIVITY – E. Coli BACTERIA MONITORING
Background:
• Mostbacteriadonotcausehumanhealthproblems;some,includingE. coli, can be used as indicators of possible pollution in surface waters.
• RunofffromlandistheleadingcauseofsurfacewaterpollutionintheUnitedStates.
• Sourcesoffecalcoliformbacteriainsurfacewatersincludemanurespreadonland that has run off into surface waters, failed septic systems, pet wastes, and wildlife and bird feces.
Bacteria are microscopic, single-celled organisms that are the most numerous organisms on
earth. They are so small that over five million could be placed on the head of a pin. Bacteria can
live in numerous environments and perform many complex actions, some of which are
beneficial and some harmful. Most bacteria, however, are not harmful and do not cause human
health problems. Those that are disease producing are referred to as pathogenic. Viruses and
some protozoans can also be pathogenic.
Coliform bacteria are part of the Enterobacteriaceae family and individual cells cannot be seen
with the naked eye due to their small size (but colonies can be seen.) While some coliform
bacteria can be naturally found in soil, the type of coliform bacteria that live in the intestinal
tract of warm-blooded animals and originate from animal and human waste are called fecal
coliform bacteria.
Escherichia coli (E. coli) is one subgroup of fecal coliform bacteria. Even within this species, there
are numerous different strains, some of which can be harmful. However, the release of these
naturally-occurring organisms into the environment is generally not a cause for alarm.
However, other disease causing bacteria, which can include some pathogenic strains of E. coli or
viruses, may also be present in these wastes and pose a health threat.
E. coli as indicator bacteria
Trying to detect disease-causing bacteria and other pathogens in water is expensive and may
pose potential health hazards. Further, testing for pathogens requires large volumes of water,
and the pathogens can often be difficult to grow in the laboratory and isolate. E. coli bacteria are
good indicator organisms of fecal contamination because they generally live longer than
pathogens, are found in greater numbers, and are less risky to collect or culture in a laboratory
than pathogens. However, their presence does not necessarily mean that pathogens are present,
but rather indicates a potential health hazard may exist.
1-56 Exploring Streams – Stream Monitoring Curriculum Guide

. PRE-FIELD-TRIP OPTIONAL ACTIVITY – E. Coli BACTERIA MONITORING
The Environmental Protection Agency (EPA) has determined that E. coli are one of the best
indicators for the presence of potentially pathogenic bacteria (US EPA, 2002). Because E. coli
monitoring does not measure the actual pathogens, the assessment is not foolproof; however, it
is a good approach for assessing the likelihood of risks to human health. Monitoring for these
indicator organisms is an easy and economical method for citizens or professionals to assess
health risks due to bacterial contamination of surface waters.
Common sources of E. coli
Bacteria in water can originate from the intestinal tracts of both humans and other warm-blooded
animals. Human sources include failing septic tanks, leaking sewer lines, wastewater treatment
plants,seweroverflows,boatdischarges,swimming“accidents”andurbanstormwaterrunoff.
In urban watersheds, fecal indicator bacteria are significantly correlated with human density
(Frenzel and Couvillion, 2002). Animal sources of fecal coliform bacteria in surface waters
include manure that has been spread on the land, livestock defecating in streams, pet wastes
(e.g., dogs, cats), wildlife (e.g., deer, elk, raccoons), and birds (e.g., geese, pigeons, ducks, gulls). If
you are sampling in a watershed area without significant human impact and are finding E. coli,
the source may be birds or wildlife. In a study comparing E. coli concentrations in waters from
agriculturaland“pristine”sites,contaminationwasfoundinbothsettings.Theresearchers
deduced that the levels of E. coli at the pristine site likely came from wildlife, such as deer and
elk, living the area (Niemi and Niemi, 1991).
Another source of bacteria pollution to stream waters comes from Combined Sewer Overflows
(CSOs). Some sewer and storm water pipes are not separated. When a large storm event occurs,
the wastewater treatment plants cannot handle the excess volume of water being pumped to
them. As a result, untreated sewage along with storm water is dumped directly into rivers and
streams.
Remember, the presence and levels of E. coli in a stream do not give an indication of the source of
the contamination. Though monitoring them can be a good first step in investigating a
watershed for potential sources.
Common routes of bacteria to streams
Polluted water runoff from the land is the leading cause of water quality problems nationwide
(US EPA, 2002). Fecal material as well as other pollutants can be transported to waterways
through runoff. How quickly they are transported partially depends on the type of land use.
Non-developed lands including grasses and other vegetation tend to soak up rainfall, thereby
increasing infiltration into the ground and reducing runoff to waterways. Developed lands such
1-57 Exploring Streams – Stream Monitoring Curriculum Guide

. PRE-FIELD-TRIP OPTIONAL ACTIVITY – E. Coli BACTERIA MONITORING
as streets, rooftops, sidewalks, parking lots, driveways and other hard surfaces that are
impervious to infiltration cause runoff to increase. Lands that support domesticated animals,
such as cattle, hogs or horses, can also be a source of bacteria, particularly if animals enter the
water for drinking or if heavy rains wash manure from the land into receiving waters.
Risks to human health
Most people are concerned about the risk that bacteria may pose to human health. When bacterial
counts are above health standards, people exposed to water that contain bacteria may exhibit
fever, diarrhea, abdominal cramps, chest pain or hepatitis. While E. coli by itself is not generally
a cause for alarm, other pathogens of fecal origin that are health threats include Salmonella,
Shigella, and Psuedomonas aeruginosa. Non-bacterial pathogens that may be present with fecal
material include protozoans, such as Cryptosporidium and Giardia, and viruses.
There are some strains of E. coli that are pathogenic themselves. One that has received much
attention is the E. coli strain named 0157:H7 that lives in the intestinal tract of cattle. This strain
is primarily spread to people who eat contaminated, undercooked beef or drink unpasteurized
milk and is not generally found in surface waters.
Examples of at-risk concentration levels
Criteria for acceptable concentrations of indicator bacteria in recreational waters have been
developed by the US EPA (1986). Initially, total coliform bacteria were used as the benchmark.
However, because it was shown that E. coli were more closely correlated with swimming-related
illnesses, the US EPA later recommended that E. coli be used as the indicator in freshwater
recreational areas (US EPA, 2002).
Many states have since adopted this recommendation; however, some such as Wisconsin, still
use total fecal coliform bacteria when determining acceptable concentrations for recreating in
surface waters. For E. coli the EPA mandates that the acceptable risk level for total body contact
recreation, which involves activities such as swimming or water skiing, is 126 colonies of
organisms (referred to as colony forming units or cfu) per 100 milliliters (ml) of water or less,
based on a geometric mean (calculated over 30 days with at least 5 samples) or a one-time
concentration of 235 cfu/100 ml. The risk of getting sick increases as total numbers of colonies
are exceeded.
The number of colony forming units of E. coli organisms per 100 ml of water and the method of
determination may vary slightly by state, based on state public health codes and water quality
standards. The EPA recommends a set of standards for E. coli in freshwater bodies as a single
maximum allowable count. These rates correspond to an acceptable risk level of 8 people out of
1-58 Exploring Streams – Stream Monitoring Curriculum Guide

. PRE-FIELD-TRIP OPTIONAL ACTIVITY – E. Coli BACTERIA MONITORING
1,000 getting sick. In Wisconsin, these guidelines are used for
swimming beaches, but a fecal coliform standard (of which E.
coli is a subset) is used for other recreational waters. The fecal
coliform standard is 400 cfu/100 mL for a single event.
Even with good watershed management measures, there will
always be fecal material in the environment. If you find
unusually high levels of E. coli on a long-term, regular basis in
your stream samples, you should alert and work with your local
health agency.
Weather and seasonal influences
The number of bacteria colonies can be influenced by weather
and seasonal effects. This variability makes the bacterial
concentrations in natural water difficult to predict at any one
time. Bacteria counts often increase following a heavy storm, snow melt or other excessive
runoff. E. coli bacteria are often more prevalent in turbid waters because they live in soil and can
attach to sediment particles. Bacteria can also remain in streambed sediments for long periods
of time. If the streambed has been stirred up by increased flow or rainfall, your sample could
have elevated bacteria levels. This is why you should avoid disturbing the streambed as you
wade out into the stream to collect your sample. You should also collect the water sample
upstream from you. If you are collecting at several sites within the stream, collect the furthest
downstream sample first and proceed upstream.
A number of other weather influences may affect bacteria levels in the stream. Higher E. coli
counts may be found in warmer waters because E. coli survive more easily in these waters.
(E. coli typically live in the warm environment of the intestines of warm-blooded animals).
Ultraviolet rays of sunlight, however, can also kill bacteria, so a warm sunny day may produce
counts lower than expected.
For more information about E. coli bacteria monitoring, visit this website:
http://www.usawaterquality.org/volunteer/EColi/Manual.htm
References:
Frenzel, S.A. and C.S. Couvillion (2002) Fecal-indicator bacteria in streams along a gradient of residential development. Journal of the American Water Resources Association. 38:265-273.
Niemi, R.M. and J.S. Niemi (1991) Bacterial pollution of waters in pristine and agricultural lands. Journal of Environmental Quality. 20:620-627.
US EPA (1986) Ambient Water Quality Criteria for Bacteria, EPA 440/5-84-002. Office of Water.
US EPA (2002). Implementation Guidance for Ambient Water Quality Criteria for Bacteria (Draft). May 2002 (www.epa.gov/waterscience/standards/bacteria/bacteria.pdf).
Fecal coliform bacteria which include E. coli are part of a larger group of colifom bacteria. (Figure not to scale.)
Total coliform bacteria
Fecal coliform bacteria
E. coli bacteria
Pathogenic E. coli bacteria
1-59 Exploring Streams – Stream Monitoring Curriculum Guide

. PRE-FIELD-TRIP OPTIONAL ACTIVITY – E. Coli BACTERIA MONITORING
Classroom Procedure for E. coli Bacteria Monitoring:
During your class field trip, you will collect your sample from a stream near your school using
methods outlined in the Wisconsin State Lab of Hygiene video, and transport your sample on ice
toyourclassroom.Youwillthenuse3M™Petrifilm™tomonitorE. coli. It is essential that you
maintain sterile conditions while plating your sample, since this is the time with the greatest
potential for external contamination of the samples. Follow these steps to process the sample:
1. Remove3M™Petrifilm™fromrefrigeratorandallowthepackagetocometoroom temperature before opening. This will take at least 10-15 minutes.
2. Sanitize your working surface by spraying or wiping it with a dilute bleach solution.
3. Wash your hands thoroughly with soap and water.
4. Labelthebacksideofthree3M™Petrifilm™plates with the date, time, sampling site and replicate number (1 to 3).
5. Always shake your sample bottle before extracting a sample with a pipette.
6. Placea3M™Petrifilm™plateonalevelsurface.
7. Lift the top film and dispense 1 mL of sample in the upper portion of the pink portion of the plate.
8. Slowly roll the top film down onto the sample to prevent trapping air bubbles.
Note to teachers:
• Donotuseplatesthatshoworange or brown discoloration.
• Ensureplatestobeusedforfieldmonitoring have not expired. The expiration date and lot number are noted on each package. (Example expiration date: 2012-10, would expire in the 10th month (October) of the year 2012.)
1-60 Exploring Streams – Stream Monitoring Curriculum Guide
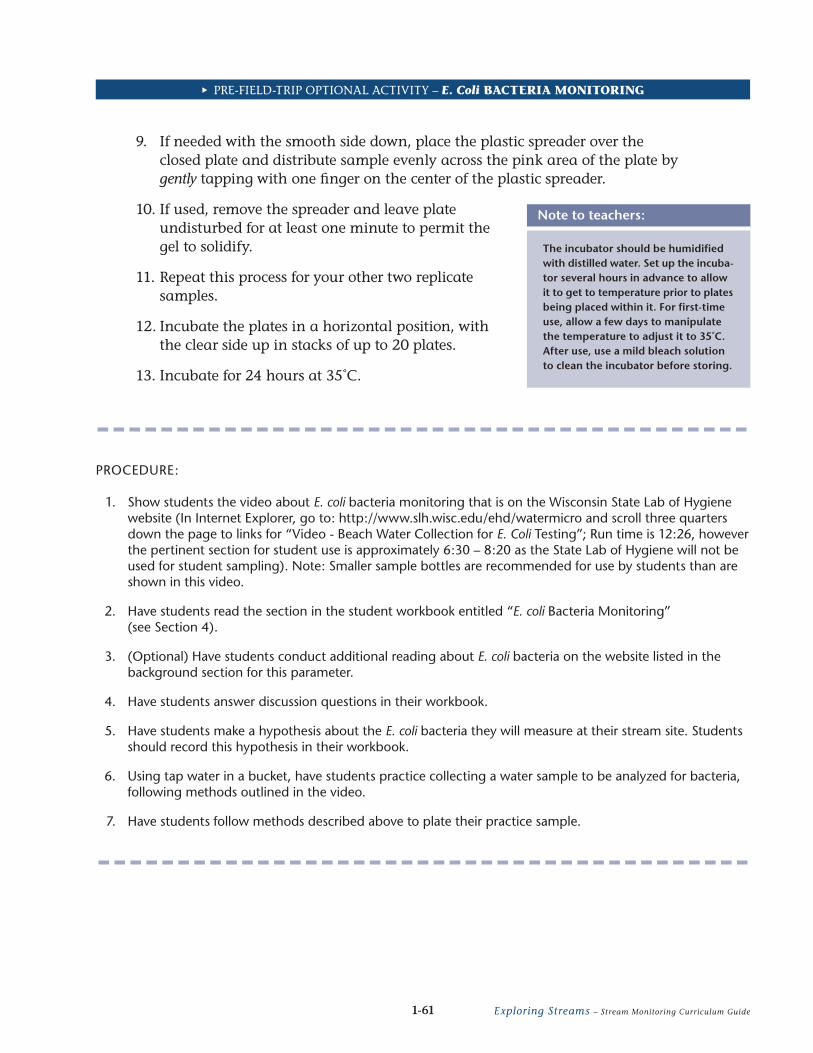
. PRE-FIELD-TRIP OPTIONAL ACTIVITY – E. Coli BACTERIA MONITORING
9. If needed with the smooth side down, place the plastic spreader over the closed plate and distribute sample evenly across the pink area of the plate by gently tapping with one finger on the center of the plastic spreader.
10. If used, remove the spreader and leave plate undisturbed for at least one minute to permit the gel to solidify.
11. Repeat this process for your other two replicate samples.
12. Incubate the plates in a horizontal position, with the clear side up in stacks of up to 20 plates.
13. Incubate for 24 hours at 35˚C.
Note to teachers:
The incubator should be humidified with distilled water. Set up the incuba-tor several hours in advance to allow it to get to temperature prior to plates being placed within it. For first-time use, allow a few days to manipulate the temperature to adjust it to 35˚C. After use, use a mild bleach solution to clean the incubator before storing.
PROCEDURE:
1. Show students the video about E. coli bacteria monitoring that is on the Wisconsin State Lab of Hygiene website (In Internet Explorer, go to: http://www.slh.wisc.edu/ehd/watermicro and scroll three quarters down the page to links for “Video - Beach Water Collection for E. Coli Testing”; Run time is 12:26, however the pertinent section for student use is approximately 6:30 – 8:20 as the State Lab of Hygiene will not be used for student sampling). Note: Smaller sample bottles are recommended for use by students than are shown in this video.
2. Have students read the section in the student workbook entitled “E. coli Bacteria Monitoring” (see Section 4).
3. (Optional) Have students conduct additional reading about E. coli bacteria on the website listed in the background section for this parameter.
4. Have students answer discussion questions in their workbook.
5. Have students make a hypothesis about the E. coli bacteria they will measure at their stream site. Students should record this hypothesis in their workbook.
6. Using tap water in a bucket, have students practice collecting a water sample to be analyzed for bacteria, following methods outlined in the video.
7. Have students follow methods described above to plate their practice sample.
1-61 Exploring Streams – Stream Monitoring Curriculum Guide

. PRE-FIELD-TRIP OPTIONAL ACTIVITY – E. Coli BACTERIA MONITORING
Student Discussion Questions and Sample Answers:
1. What are three sources of E. coli in surface waters? Fecal matter from people or geese and other warm-blooded wildlife are possible sources of E. coli to surface waters. Failing septic tanks and combined sewer overflows can also be sources.
2. Disease-causing bacteria are called pathogenic bacteria.
3. Are the majority of bacteria disease-causing? No
4. What are some advantages to using E. coli bacteria to monitor water quality? Since E. coli live in the gut of warm-blooded animals, there is a chance that pathogens that also inhabit the guts of such animals may be present in waters with high levels of E. coli bacteria. They serve as indicator organisms of fecal pollution.
5. What symptoms might humans infected with water-borne pathogens display? A person who has been infected by water borne pathogens might have a fever, diarrhea, chest pain or hepatitis.
6. In what units are E. coli measured? E. coli are measured in colony-forming units per 100 ml of sample (cfu/100 ml).
7. What is the EPA-recommended one-time concentration limit for E. coli for total body contact activities such as swimming? The limit is 235 cfu/100 ml.
8. What factors can influence the concentration of bacteria in surface waters? Rainfall, amount of sunlight, and water turbidity can affect how many bacteria colonies are present in surface waters.
9. You will soon be monitoring the E. coli bacteria level in a stream near your school. What water quality do you expect to find? Why? Note your hypothesis for your stream site and your plan for how to research that hypothesis here:
1-62 Exploring Streams – Stream Monitoring Curriculum Guide
For a version (for teachers only) that includes answers, please contact
the WAV Coordinator. For contact information, see:
http://watermonitoring.uwex.edu/wav

EROSION IN A BOTTLE
. PRE-FIELD-TRIP OPTIONAL ACTIVITIES
Activity developed for WAV by: Kevin Fermanich, Mike Pelech, Scott Arnold, Rob Zemenchik and Peter Kling,
with the Department of Soil Science at University of Wisconsin-Madison (608-262-2633).
Groups will build a model that demonstrates runoff and erosion, which can occur in both urban
and agricultural settings.
Learning Objectives:
By participating in this activity, students will:
1. Understand what factors contribute to erosion and runoff in urban and agricultural settings.
2. Build a bottle runoff model.
3. Use the bottle runoff model to demonstrate runoff and erosion.
Standards:
Environmental Education B.8.5, B.8.17
Materials:
• 4two-literplasticsodabottles
• Onebottlecap
• Apermanentmarker
• Photocopiesoftowerholepattern (page 1-67)
• Darktopsoil
• Sand
• Mulchorsod(ornewspaper or woodchips)
Time:
30 minutes
• Water
• 2two-cupmeasuringcups
• 2containerssuchasglassesorsmall bowls
• Razorknife
• Scissors
• Pushpinoricepick/drill
• Powdereddrinkmix
1-63 Exploring Streams – Stream Monitoring Curriculum Guide
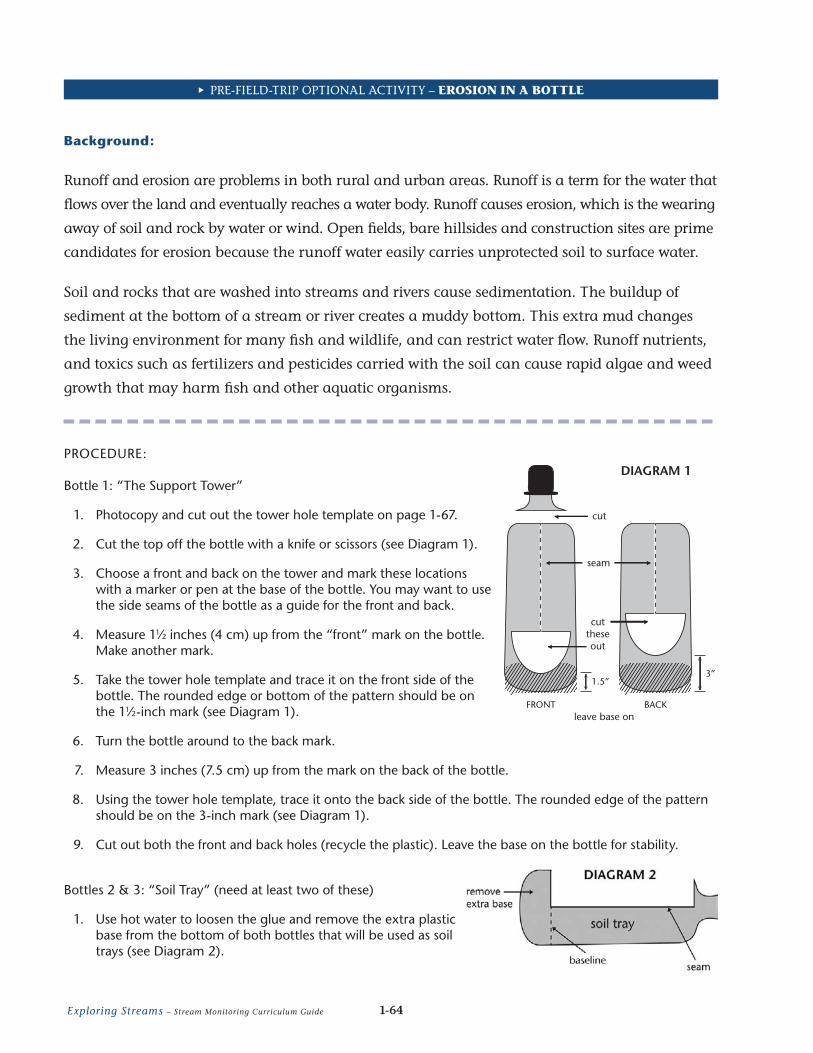
. PRE-FIELD-TRIP OPTIONAL ACTIVITY – EROSION IN A BOTTLE
Background:
Runoff and erosion are problems in both rural and urban areas. Runoff is a term for the water that
flows over the land and eventually reaches a water body. Runoff causes erosion, which is the wearing
away of soil and rock by water or wind. Open fields, bare hillsides and construction sites are prime
candidates for erosion because the runoff water easily carries unprotected soil to surface water.
Soil and rocks that are washed into streams and rivers cause sedimentation. The buildup of
sediment at the bottom of a stream or river creates a muddy bottom. This extra mud changes
the living environment for many fish and wildlife, and can restrict water flow. Runoff nutrients,
and toxics such as fertilizers and pesticides carried with the soil can cause rapid algae and weed
growth that may harm fish and other aquatic organisms.
PROCEDURE:
Bottle 1: “The Support Tower”
1. Photocopy and cut out the tower hole template on page 1-67.
2. Cut the top off the bottle with a knife or scissors (see Diagram 1).
3. Choose a front and back on the tower and mark these locations with a marker or pen at the base of the bottle. You may want to use the side seams of the bottle as a guide for the front and back.
4. Measure 11⁄2 inches (4 cm) up from the “front” mark on the bottle. Make another mark.
5. Take the tower hole template and trace it on the front side of the bottle. The rounded edge or bottom of the pattern should be on the 11⁄2-inch mark (see Diagram 1).
6. Turn the bottle around to the back mark.
7. Measure 3 inches (7.5 cm) up from the mark on the back of the bottle.
8. Using the tower hole template, trace it onto the back side of the bottle. The rounded edge of the pattern should be on the 3-inch mark (see Diagram 1).
9. Cut out both the front and back holes (recycle the plastic). Leave the base on the bottle for stability.
Bottles 2 & 3: “Soil Tray” (need at least two of these)
1. Use hot water to loosen the glue and remove the extra plastic base from the bottom of both bottles that will be used as soil trays (see Diagram 2).
FRONT BACKleave base on
DIAGRAM 1
seam
cuttheseout
1.5”3”
cut
1-64 Exploring Streams – Stream Monitoring Curriculum Guide

. PRE-FIELD-TRIP OPTIONAL ACTIVITY – EROSION IN A BOTTLE
2. Use a permanent marker to draw a line (baseline) around the base of the bottle about 2 inches from the bottom of the bottle.
3. Lay the bottle on its side.
4. Find the seams that run the length of the bottle. You can use these seams as a guide.
5. Use the marker to draw a line along each seam from the baseline to the neck of the bottle (see Diagram 2).
6. At the neck of the bottle, draw a line from one seam line to the other seam line.
7. Cut along lines and remove the side of the soil tray (recycle the plastic). The soil tray is ready to be filled with soil.
8. Repeat steps 1-7 for the second soil tray.
Filling the soil tray
1. With the bottle lying on its side, fill one bottle with about 1⁄2-inch of sand. This is the subsoil. Level the subsoil and gently press it down to make it firm.
2. Put 1⁄4 inch of moist topsoil over the sand. Remove or break up any soil clumps. The layers of soil should be easy to see through the side of the bottle (see Diagram 4).
3. The bare soil tray is done.
4. Repeat steps 1 and 2 for a second soil tray.
5. In the second soil tray, press mulch (grass clippings in the summer; finely shredded newspaper or wood chips in the winter) into the moist topsoil so most of the surface is covered. You may want to use a piece of sod instead of mulch. If you have the extra time, you can grow your own plants such as alfalfa sprouts or grass in the second soil tray.
6. Sprinkle about one-half-bottle-cap-full of powdered drink mix evenly over the surface of both trays. The mix represents some kind of fertilizer or pollution.
Bottle 4: “Rain Maker”
1. Cut the next bottle in half to form a funnel and a water container (see Diagram 3).
2. The funnel or top portion is the rain maker.
3. Poke holes in the bottle cap by using a push pin, ice pick or drill. Make nine holes. It’s best to leave the rubber seal in the cap so water doesn’t leak around the rim.
4. Screw the cap tightly on the rain maker and fill the rain maker about halfway with water to test whether
DIAGRAM 3
push pin
9-hole cap
cut in half
rain maker
DIAGRAM 4
rain maker
topsoil
subsoil
1-65 Exploring Streams – Stream Monitoring Curriculum Guide

. PRE-FIELD-TRIP OPTIONAL ACTIVITY – EROSION IN A BOTTLE
all holes are free-flowing. If the water is only dribbling out, enlarge the holes by wiggling the push pin back and forth a bit more.
5. The bottom half of the bottle can be used to hold the water added to the rain maker.
Putting the model together
1. Pour sand into the tower (Bottle 1) to make it stable.
2. Push the bare soil tray through the holes in the tower. The neck of the soil tray should be lower than the base of the soil tray (see Diagram 4).
3. Place the model on a block of wood or a platform so the mouth (bottle cap end) of the soil tray is high enough to place measuring cup beneath it.
4. Insert the empty rain maker into the top of the tower.
Collecting runoff
1. Use the two-cup measuring cup to collect runoff. It’s important to use the same size collection container when comparing runoff between different demonstrations.
How to do the demonstration
1. Pour water into two separate containers so both containers have two cups of water. This water will be added to the rain maker. Place the measuring cup below the soil tray to collect runoff (see Diagram 5).
2. Dump the water from one container into the rain maker.
3. Observe the amount of drink mix and soil being “eroded” into the measuring cup.
4. When all of the runoff water has flowed into the measuring cup, set it aside. You will need to use it to compare runoff with the next soil tray.
5. Remove the first soil tray from the tower and replace it with the second soil tray (mulch tray).
6. Repeat demonstration steps 2 through 4, but this time use the mulch tray and the second container of water.
7. Compare the results.
• Whichmeasuringcuphasthemostwater?Coloredwaterfromdrink mix?
• Wasthemulchhelpfulinreducingtheamountofrunoff?Erosion?
• Wasthetopsoilwashedawaydirectlybeneaththerainmaker?
Look at the collection containers. Think of these containers as a stream or river. How would the “drink mix” affect water quality and aquatic life?
DIAGRAM 5
rain maker
tower
soil tray
measuring cup
subsoil
topsoil
1-66 Exploring Streams – Stream Monitoring Curriculum Guide

. PRE-FIELD-TRIP OPTIONAL ACTIVITY – EROSION IN A BOTTLE
Extra ideas
Try these ideas to make your “Erosion in a Bottle” experiment even more interesting!
Create a filter strip
A filter strip is an area of grass that slows runoff and captures soil and pollutants. To create an erosion model with a filter strip, make an extra soil tray with sod.
Then, let runoff from the bare soil tray pour onto the soil tray with sod and then into the measuring cup (see diagram below). This activity will demonstrate how filter strips help to prevent runoff pollution.
Different amounts of rainfall
Experiment with the amount of “rainfall” and how this affects the amount of erosion.
rain maker
bottle #3(top)
bottle 1
bottle 2
filter strip
soil tray
grass sod
subsoil topsoil
Tower HoleTemplate
center
center
4” (10 cm)
4-4.5” (10-12 cm)
1-67 Exploring Streams – Stream Monitoring Curriculum Guide

URBAN RUNOFF MODEL
. PRE-FIELD-TRIP OPTIONAL ACTIVITIES
Developed for WAV by Ron Struss and Paul Hlina.
Students will build a simple watershed model that demonstrates how the volume of stormwater
runoff increases as urban watersheds are roofed and paved over.
Learning Objectives:
By participating in this activity, students will:
1. Demonstrate that as watersheds urbanize and increase in area under hard surfaces (e.g., roofs and pavement), the speed and volume of stormwater runoff leaving watersheds will also increase.
2. Demonstrate the need for stormwater sewers and ponds to prevent urban flooding.
Standards:
Environmental Education B.8.5, B.8.10, B.12.2, B.12.3, D.8.5
Time:
25 minutes
Materials:
• Apaintrollertray
• Aspraybottle
• A10”X10”squareofwhitefelt
• Green,blueandblackpermanentmarkers
• Clothorpapertowels
• Measuringcup
• Extrafelt(optional)
• Modelingclay(optional)
• Tape
1-68 Exploring Streams – Stream Monitoring Curriculum Guide
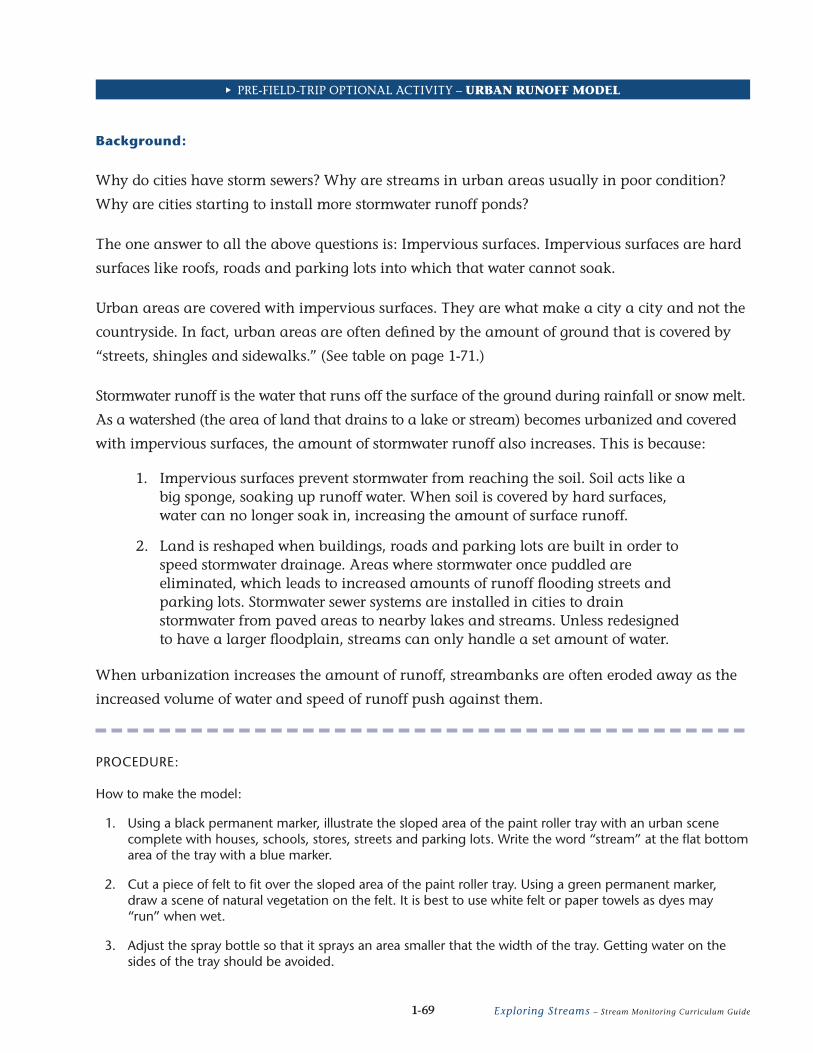
Background:
Why do cities have storm sewers? Why are streams in urban areas usually in poor condition?
Why are cities starting to install more stormwater runoff ponds?
The one answer to all the above questions is: Impervious surfaces. Impervious surfaces are hard
surfaces like roofs, roads and parking lots into which that water cannot soak.
Urban areas are covered with impervious surfaces. They are what make a city a city and not the
countryside. In fact, urban areas are often defined by the amount of ground that is covered by
“streets,shinglesandsidewalks.”(Seetableonpage1-71.)
Stormwater runoff is the water that runs off the surface of the ground during rainfall or snow melt.
As a watershed (the area of land that drains to a lake or stream) becomes urbanized and covered
with impervious surfaces, the amount of stormwater runoff also increases. This is because:
1. Impervious surfaces prevent stormwater from reaching the soil. Soil acts like a big sponge, soaking up runoff water. When soil is covered by hard surfaces, water can no longer soak in, increasing the amount of surface runoff.
2. Land is reshaped when buildings, roads and parking lots are built in order to speed stormwater drainage. Areas where stormwater once puddled are eliminated, which leads to increased amounts of runoff flooding streets and parking lots. Stormwater sewer systems are installed in cities to drain stormwater from paved areas to nearby lakes and streams. Unless redesigned to have a larger floodplain, streams can only handle a set amount of water.
When urbanization increases the amount of runoff, streambanks are often eroded away as the
increased volume of water and speed of runoff push against them.
. PRE-FIELD-TRIP OPTIONAL ACTIVITY – URBAN RUNOFF MODEL
PROCEDURE:
How to make the model:
1. Using a black permanent marker, illustrate the sloped area of the paint roller tray with an urban scene complete with houses, schools, stores, streets and parking lots. Write the word “stream” at the flat bottom area of the tray with a blue marker.
2. Cut a piece of felt to fit over the sloped area of the paint roller tray. Using a green permanent marker, draw a scene of natural vegetation on the felt. It is best to use white felt or paper towels as dyes may “run” when wet.
3. Adjust the spray bottle so that it sprays an area smaller that the width of the tray. Getting water on the sides of the tray should be avoided.
1-69 Exploring Streams – Stream Monitoring Curriculum Guide

. PRE-FIELD-TRIP OPTIONAL ACTIVITY – URBAN RUNOFF MODEL
How to use the model:
1. The paint roller tray is a watershed; the bare tray is an urban watershed with 100% impervious surfaces, the tray with felt cover is a natural vegetated watershed with 0% impervious surfaces. Just like soil, the felt acts like a sponge soaking up stormwater. The flat bottom area of the paint roller tray is a stream that receives stormwater runoff. The spray bottle is rain.
2. Create “rain” on the natural vegetation watershed. Place the felt over the sloped area of the paint roller tray. Spray the felt with even sprays while counting the number of sprays. Record the number of sprays it took to get one drop of runoff from the “natural vegetated watershed” into the “stream” (it should take 75-100 sprays).
3. Remove the felt and dry out paint roller pan. Pretend the natural vegetated watershed has been dramatically converted into an urban watershed with 100% impervious surface. Make bulldozer noises if you like as the felt is removed and the urban scene is revealed. Point out that this is a dramatic illustration; going directly from a fully naturally vegetated watershed to a fully urbanized one will take some time in real life.
4. Create “rain” on the urban watershed. Spray the sloping area of the bare metal paint roller pan with even sprays. Count the sprays it takes to get one drop of runoff from the “urban watershed” into the “stream” (it should only take 3 to 5). Continue spraying until the spray count is the same as what produced a single drop of runoff in the “naturally vegetated” watershed. How much water is in the stream?
5. Compare the two – discuss. It should be obvious that urbanization results in faster runoff and more runoff. Discuss what the impact on the receiving stream would be as the speed and volume of stormwater runoff from a watershed increases. Discuss ways that stormwater runoff speed and volume can be reduced from urban watersheds.
STORM
PRE-DEVELOPMENT
POST
-DEV
ELOP
MEN
T
TIME
Higher, more rapidpeak discharge
More runoff volume
Gradual riseand recession
Lower, less rapidpeak dischargeHigher
base flow
STR
EAM
FLO
W
A hydrograph is a graph that shows stream flow over time. This hydrograph shows how stream flow changes as a watershed goes from a natural land cover (pre-development) to an urbanized land cover (post-development).
Making rain on the “urban” watershed (number of sprays are again counted).
Making rain on the “natural vegetation watershed” (number of sprays are counted).
1-70 Exploring Streams – Stream Monitoring Curriculum Guide

. PRE-FIELD-TRIP OPTIONAL ACTIVITY – URBAN RUNOFF MODEL
Discussion Question:
1. What actions could individual people take to improve the health of the watershed? People can
maintain riparian buffers, minimize impervious surfaces, check weather forecasts before spreading manure
or fertilizing lawns, etc. (Answers will vary widely.)
Other ideas:
Add Green Spaces
Cutsmallpiecesoffelt(e.g.,2”X3”)andstickthisontothe“urbanwatershed”withrolledtape.
These represent parks, playgrounds, golf courses and yards in urban areas. Spray the watershed
a set number of times before and after the felt squares are in place and see how the addition of
“green”spacesincitiesaffectsthevolumeofstormwaterrunoff.
Add Stormwater Ponds
Usingmodelingclay,constructanumberof“U”-shapeddikesonthe“urbanwatershed”where
the“V”-shapedridgescometogetherinthecenterofthetray.Thesedikesrepresentstormwater
ponds built at the end of storm sewer lines. Do a set number of sprays, drying out the ponds with
towels afterwards to represent pond water that infiltrates into the soil or evaporates. Measure the
remainingrunoffinthe“stream”andseehowtheadditionofstormwaterpondsaffectsthe
volume of stormwater runoff.
Resources
Chapter One, The Wisconsin Stormwater Manual, UW-Extension Publication G3691
Storm Sewers – The rivers beneath our feet, UW-Extension Publication GWQ-004
Urban Land Use Percent Area in Impervious Surfaces
Downtown areas or shopping malls 95% - 100%
Apartments or closely-spaced houses 45% - 60%
Suburban houses on typical lots (1⁄4 acre) 35% - 45%
Suburban houses on large lots 20% - 40%
Open park areas 0% - 10%Source: Modified from the Wisconsin Stormwater Manual, Department of Natural Resources
1-71 Exploring Streams – Stream Monitoring Curriculum Guide
For a version (for teachers only) that includes answers, please contact
the WAV Coordinator. For contact information, see:
http://watermonitoring.uwex.edu/wav

TRANSPARENCY TUBE CASE CONSTRUCTION
. PRE-FIELD-TRIP OPTIONAL ACTIVITIES
Pattern developed by Judy Aspling and Carolyn Lipke.
Learning Objectives:
• Studentswillpracticemeasurementskills.
• Studentswillunderstandthemeaningofaseamallowance.
• Studentswillunderstandhowtouseasewingmachinetocreateaproduct.
Standards:
Mathematics: Measurement D.8.3, D.12.2
Time:
50 minutes
Materials:
• 13-inchx57½-inchpieceofmediumweightfabric
• Thread
• 30-inchcordorshoelace
• 32-inch1½-inch-widewebbingorfabricstrap
Background:
Volunteer stream monitors across Wisconsin use transparency tubes to quantify stream clarity. These cases will help protect the tubes during travel to and from field sites and while in storage.
PROCEDURE:
1. Attach strap to rectangle of fabric. Place webbing lengthwise on right side of fabric rectangle, 3½ inches from the side, 12 inches from top. Use zigzag stitch to attach top edge of webbing. Measure down 29 inches and attach bottom edge of webbing. Strap will not lay flat.
2. Fold fabric, right sides together, seam bottom side and long side, stopping 6 inches from top edge.
3. Using an overcast zigzag finish all raw edges.
4. Turn under ½-inch seam allowance at side opening, topstitch in place.
5. Turn down 1¼-inch casing at top edge, topstitch 1⁄8 inch from lower casing edge. Thread shoelace through casing and tack in place at the halfway point. This will keep the lace from getting pulled out.
6. Use completed cases for school-owned transparency tubes or send completed cases to: Kris Stepenuck, Environmental Resources Center 445 Henry Mall, Rm 202, Madison, WI 53706.
12"
cut 13"
3 1⁄2"
29"
cut 5
7 1 ⁄2
"
( cut strap 32" long and 11⁄2" wide)
Note to teachers:
Please use fabric that is machine washable and dryable. Fabrics that will dry quickly and are somewhat durable are preferred (polar fleece is an excellent option). Feel free to use scrap/repurposed fabric.
1-72 Exploring Streams – Stream Monitoring Curriculum Guide

STREAM ECOSYSTEM – WHAT MAKES A STREAM HEALTHY?
. PRE-FIELD-TRIP OPTIONAL ACTIVITIES
Developed by Ann Kroncke, Platteville Public School District
Learning Objective:
• Studentswilllearnbasicprinciplesofstreamecologyrelatedtothemonitoring they will participate in on their upcoming field trip.
Standard:
Environmental Education B.8.5
Materials:
• WaterActionVolunteersVolunteerStreamMonitoringDVDSetDisc#2
• Copiesofstudentworksheet(thiscanbefoundonthefollowingtwopages)
• Writinginstrument
Time:
50 minutes
Background:
Dr. Kristopher Wright, Assistant Professor of Biology at UW-Platteville, developed this PowerPoint
presentation that introduces basics of stream ecology. The presentation links the six aspects of
stream health that students will monitor with the water cycle, food webs and basic concepts of
stream development.
PROCEDURE:
1. Show students the video about stream ecology from the Water Action Volunteers DVD Set (from the main menu on Disc 2, choose “Stream Ecology Basics”).
2. Have students answer questions on the worksheet that correspond with the Stream Ecology presentation.
1-73 Exploring Streams – Stream Monitoring Curriculum Guide

. PRE-FIELD-TRIP OPTIONAL ACTIVITY – STREAM ECOSYSTEM – WHAT MAKES A STREAM HEALTHY?
Name: _____________________________________________
Date: _____________________________________________
Period: _____________________________________________
Stream Ecosystem – What Makes a Healthy Stream? Student Worksheet
1. List four ways in which water gets into a stream.
2. Complete the following definitions:
_________________ is the ability to do work (e.g., transport sediments)
_________________ is the speed of the water (distance/time)
_________________ is the amount of water that passes a given point over time (volume/time)
3. Habitats can be defined by changes in flow along the length of a stream. Record where riffles, pools, waterfalls, rapids and runs fall along this continuum.
4. Draw a picture of a meander in the space below. Add arrows and label where the current or flow is the strongest. Explain what this does to the streambank (For instance, where would there be erosion? Deposition?)
5. Why are meanders important?
Fast movingSlow moving
1-74 Exploring Streams – Stream Monitoring Curriculum Guide

. PRE-FIELD-TRIP OPTIONAL ACTIVITY – STREAM ECOSYSTEM – WHAT MAKES A STREAM HEALTHY?
6. Autochthonous production is photosynthesis that happens _______________________
7. How does the energy from allocthonous production get into the stream?
8. List and explain one factor that can affect photosynthesis in a stream (autochthonous production).
9. List and explain one factor that can reduce water clarity.
10. Water temperature in a headwater system does/does not change much during the day. (circle one)
11. Dissolved oxygen levels are increased by these three factors:
12. pH is a measure of acidity. Complete the pH scale below by circling the number that is considered neutral and then labeling the acid and basic/alkaline ends of the scale.
0 1 2 3 4 5 6 7 8 9 10 11 12 13 14
All fish dead
Caddisflies andmayflies die
Salmonid eggsand alevin die
Bass and trout begin to die
Snails and tadpolesbegin to die
Best level for most fish
All fish dead
Lemon Juice
Vinegar
Tomatoes
Battery Acid Carrots
Normal Rain
Milk Human Blood
Ammonia
Bleach
Lye
1-75 Exploring Streams – Stream Monitoring Curriculum Guide

. PRE-FIELD-TRIP OPTIONAL ACTIVITY – STREAM ECOSYSTEM – WHAT MAKES A STREAM HEALTHY?
Stream Ecosystem – What Makes a Healthy Stream? (Student Worksheet KEY)
1. List four ways in which water gets into a stream.
1. Direct Input (snow, rain)
2. Overland Flow (water running off the surface of land into a stream)
3. Shallow Sub-surface Flow (water percolates through the topsoil, moves downhill, re-emerges at the surface and empties into the stream)
4. Ground Water Flow (water percolates into the water table and moves through sediments before it enters the stream)
2. Complete the following definitions:
Power is the ability to do work (e.g., transport sediments)
Velocity is the speed of the water (distance/time)
Discharge is the amount of water that passes a given point over time (volume/time)
3. Habitats can be defined by changes in flow along the length of a stream. Record where riffles, pools, waterfalls, rapids and runs fall along this continuum.
4. Draw a picture of a meander in the space below. Add arrows and label where the current or flow is the strongest. Explain what this does to the streambank (For instance, where would there be erosion? Deposition?)
Slow moving
POOLS RUNS RIFFLES RAPIDS WATERFALLS
Fast moving
EROSION
EROSION
EROSION
EROSIONDEPOSITION
DEPOSITON
FAST
SLOW
FAST
SLOW
FAST
SLOW
FAST
1-76 Exploring Streams – Stream Monitoring Curriculum Guide
For a version (for teachers only) that includes answers, please contact
the WAV Coordinator. For contact information, see:
http://watermonitoring.uwex.edu/wav

5. Why are meanders important?
• Determinewhereerosionanddepositionwilloccur
• Controltheflowratesinstream
• Providehabitats
• Arenaturalanddynamic
6. Autochthonous production is photosynthesis that happens within a stream (e.g., by algae and marophytes).
7. How does the energy from allocthonous production get into the stream?
Streamside vegetation uses energy from sun to photoshynthesize; terrestrial plant matter is then transferred into stream (often through leaf/litter fall).
8. List and explain one factor that can affect photosynthesis in a stream (autochthonous production).
Streamside vegetation shading the stream; time of day and angle of sun; season/climate; water depth; surface roughness; turbidity and water clarity
9. List and explain one factor that can reduce water clarity.
Erosion (sediments can be transported into streams); flows (faster water can churn up debris and sediment); litter fall (leafs and plant matter falling from streambank); algae growth (thick growth reduces clarity); biotic community (invertebrates can eat algae and clear up water); geology (may be highly erodable)
10. Water temperature in a headwater system does / does not change a lot during the day. (circle one)
Does not
11. Dissolved oxygen levels are increased by these three factors:
•Photosynthesis(releaseO2)
•Riffles/roughwater(exchangewithair)
•Colderwaterholdsmoreoxygen
12. pH is a measure of acidity. Complete the pH scale below by circling the number that is considered neutral and then labeling the acid and basic/alkaline ends of the scale.
. PRE-FIELD-TRIP OPTIONAL ACTIVITY – STREAM ECOSYSTEM – WHAT MAKES A STREAM HEALTHY?
0 1 2 3 4 5 6 7 8 9 10 11 12 13 14
All fish dead
Caddisflies andmayflies die
Salmonid eggsand alevin die
Bass and trout begin to die
Snails and tadpolesbegin to die
Best level for most fish
All fish dead
Lemon Juice
Vinegar
Tomatoes
Battery Acid Carrots
Normal Rain
Milk Human Blood
Ammonia
Bleach
Lye
acidic basic/alkaine
Circle # 7
1-77 Exploring Streams – Stream Monitoring Curriculum Guide
For a version (for teachers only) that includes answers, please contact
the WAV Coordinator. For contact information, see:
http://watermonitoring.uwex.edu/wav
PARTS PER MILLION LAB
. PRE-FIELD-TRIP OPTIONAL ACTIVITIES
Activity developed by Susan Klaubert and Ann Gaffney, science teachers at Londonderry Middle School, NH
Learning Objectives:
• Studentswillunderstandwhatonepartpermillionmeans(andlookslike).
Standards:
Environmental Education A.8.4, A.8.5; Mathematics: Measurement D.8.3; Science Inquiry C.8.4
Materials:
• 100mLofdarkcoloredunsweeteneddrinkmix or concentrated dye
• 7beakersorplasticcups
• Graduatedcylindersorairpistons
Time:
15-25 minutes
Background:
Sometimes, when discussing water or air, a scientist will have to talk about extremely small amounts
of a chemical. Just because the amounts are small does not mean they are unimportant. For example,
fish such as trout need a dissolved oxygen level of 6 parts per million (ppm) to survive. This means
that out of every million molecules in a sample of water, at least six of them must be oxygen. Living
things can be affected by very small amounts of materials in water. It is important to know the human
tolerance level of a substance when determining if water is safe for humans to drink. As technology
continues to improve, scientists are able to detect smaller and smaller amounts of materials. The
smallest amount that can be detected is called the detection limit. The smaller the detection limit, the
more we know about what is in our water, and the more that can be done to keep our water safe. Some
materials can now be found in concentrations as small as parts per billion or parts per trillion!
PROCEDURE:
1. Set up materials for the Parts per Million Lab. This can be done as a demo in the front of the classroom or as a lab done by students. (It will take less time as a demo.)
2. Have students follow step-by-step procedure on the lab sheet and answer the questions.
3. The teacher can go over the answers with the class after all groups have finished their labs.
• Stirringrod
• Studentworksheet (page 1-79 to 1-80)
1-78 Exploring Streams – Stream Monitoring Curriculum Guide

. PRE-FIELD-TRIP OPTIONAL ACTIVITY – PARTS PER MILLION LAB
Name: _____________________________________________
Date: _____________________________________________
Period: _____________________________________________
Parts per Million Lab: Concentration of Color and Parts Per Million
Student Worksheet
1. Label your beakers or plastic cups 1 through 7.
2. Measure 100 mL of the original solution from the front of the room and put it into beaker 1. This solution has a concentration of one part per one or 1/1. Every bit of it is a concentrated solution. Describe the color of this solution in your data table. Be as descriptive as possible.
3. Measure out 90 mL of water into beakers 2 through 7.
4. Carefully measure out 10 mL of solution from beaker 1. What is the concentration of this solution? __________ Explain your reasoning.
5. Add this to beaker 2 and stir it up.
How many milliliters of concentrated solution are there? _________ How many milliliters of liquid are there? __________ What fraction of the solution in beaker 2 is the concentrated solution? __________ Reduce this ratio. ___________ This is the concentration of beaker 2. Enter the concentration and a description of the color of the solution into your data table.
6. Carefully measure out 10 mL of solution from beaker 2. Stir this into beaker 3. What fraction of the solution is now colored? ___________ How is this related to the concentration?
Enter the concentration and a description of the color of the solution into your data table on the back of this worksheet.
7. Carefully measure out 10 mL of solution from beaker 3. Stir this into beaker 4. Enter the concentration and color of this solution into your data table.
1-79 Exploring Streams – Stream Monitoring Curriculum Guide

8. Carefully measure out 10 mL of solution from beaker 4. Stir this into beaker 5. Enter the concentration and color of this solution into your data table.
9. Carefully measure out 10 mL of solution from beaker 5. Stir this into beaker 6. Enter the concentration and color of this solution into your data table.
10. Carefully measure out 10 mL of solution from beaker 6. Stir this into beaker 7. Enter the concentration and color of this solution into your data table.
. PRE-FIELD-TRIP OPTIONAL ACTIVITY – PARTS PER MILLION LAB
Beaker Concentration (as a ratio)
Concentration (written out) Description of Color
1 1/1 1 part per 1
2
3
4
5
6
7
Discussion Questions:
1. Describe what happens to the concentration of the color as you dilute each solution.
2. Is there color in all of the beakers? ___________ How do you know?
3. What happens to the concentration of the beakers as you move 10mL of the solution from one to the next? Be very specific.
4. If there was only one molecule of color in beaker 7, how many color molecules did you start with in beaker 1? ____________ How do you know?
1-80 Exploring Streams – Stream Monitoring Curriculum Guide

. PRE-FIELD-TRIP OPTIONAL ACTIVITY – PARTS PER MILLION LAB
Beaker Concentration (as a ratio)
Concentration (written out) Description of Color
1 1/1 1 part per 1
2 1/10 1 part per 10
3 1/100 1 part per 100
4 1/1,000 1 part per 1,000
5 1/10,000 1 part per 10,000
6 1/100,000 1 part per 100,000
7 1/1,000,000 1 part per 1,000,000
Parts per Million Lab (TEACHER KEY) 1. Label your beakers or plastic cups 1 through 7.
2. Measure 100 mL of the original solution from the front of the room and put it into beaker 1. This solution has a concentration of one part per one or 1/1. Every bit of it is a concentrated solution. Describe the color of this solution in your data table. Be as descriptive as possible.
3. Measure out 90 mL of water into beakers 2 through 7.
4. Carefully measure out 10 mL of solution from beaker 1. What is the concentration of this solution? 1/1 Explain your reasoning. The entire solution is concentrated or pure….it is 100% dye
5. Add this to beaker 2 and stir it up. How many milliliters of concentrated solution are there? 10 How many milliliters of liquid are there? 100 What fraction of the solution in beaker 2 is the concentrated solution? 10/100 Reduce this ratio. 1/10 This is the concentration of beaker 2. Enter the concentration and a description of the color of the solution into your data table.
6. Carefully measure out 10 mL of solution from beaker 2. Stir this into beaker 3. What fraction of the solution is now colored? 1/100 How is this related to the concentration? It is 1 part dye per 100 parts water.
Enter the concentration and a description of the color of the solution into your data table.
7. Carefully measure out 10 mL of solution from beaker 3. Stir this into beaker 4. Enter the concentration and color of this solution into your data table.
8. Carefully measure out 10 mL of solution from beaker 4. Stir this into beaker 5. Enter the concentration and color of this solution into your data table.
9. Carefully measure out 10 mL of solution from beaker 5. Stir this into beaker 6. Enter the concentration and color of this solution into your data table.
10. Carefully measure out 10 mL of solution from beaker 6. Stir this into beaker 7. Enter the concentration and color of this solution into your data table.
Discussion Questions:
1. Describe what happens to the concentration of the color as you dilute each solution. In each beaker the color concentration is less.
2. Is there color in all of the beakers? Yes. How do you know? Because we started with color in the first beaker.
3. What happens to the concentration of the beakers as you move 10mL of the solution from one to the next? Be very specific. It decreases by a factor of 10.
4. If there was only one molecule of color in beaker 7, how many color molecules did you start with in beaker 1? 1,000,000 How do you know? Because 1/1 = 1,000,000/1,000,000…The fractions are equal.
1-81 Exploring Streams – Stream Monitoring Curriculum Guide
For a version (for teachers only) that includes answers, please contact
the WAV Coordinator. For contact information, see:
http://watermonitoring.uwex.edu/wav

MAKING AND USING DICHOTOMOUS KEYS
. PRE-FIELD-TRIP OPTIONAL ACTIVITIES
Learning Objective:
• Studentswillunderstandhowtouseadichotomouskeytoidentifyanunknown critter or object.
Standard:
Life and Environmental Science F.12.5
Materials:
• Chalkboard(orwhiteboard)
• Students’shoes
• “KeytoMacroinvertebrateLifeintheRiver”
• Paper
• Writinginstruments
Time:
45 minutes
PROCEDURE:
1. Ask each student to take off one shoe and pass it to the front of the classroom. Have one volunteer at a time come to the front and decide how to divide one pile of shoes into two piles (e.g., left shoe and right shoes, sneakers and not sneakers). The teacher can follow the splits on the board, forming a branching chart.
Example:Period 1
shoes
Left shoes
Sneakers Not sneakers
Right shoes
1-82 Exploring Streams – Stream Monitoring Curriculum Guide

. PRE-FIELD-TRIP OPTIONAL ACTIVITY – MAKING AND USING DICHOTOMOUS KEYS
2. After the chart is fairly complete, introduce a new shoe (perhaps one of the teacher’s shoes).
3. Have students use the chart to identify in which group the new shoe belongs.
4. Introduce classification of living things (Kingdom-Phylum-Class-Order-Family-Genus-Species).
5. Compare the shoe sorting activity to the classification of living things where the Kingdom level is the same as the “Period 1 Shoes”, Phylum would be “Left” and “Right” etc.
6. Then show the students the “Key to Macroinvertebrate Life in the River” that they will be using to identify macroinvertebrates in the field.
7. Have students use the Key to Macroinvertebrate Life in the River to answer the following discussion questions:
a. This macroinvertebrate is orange. It does not have a shell or an obvious tail, nor does it have wings. It has six legs. (Answer: Caddisfly larva)
b. This worm-like macroinvertebrate has no shell and no legs. It is green and has a distinct head. (Answer: Midge larva)
c. This macroinvertebrate has two shells. It is dark colored and can be as large as five inches across. (Answer: Freshwater mussel)
8. Extension (possible homework assignment):
Have the students design their own branching charts. Have them choose 10 things that they would consider to be in the “same Kingdom” (e.g., 10 cds, 10 shirts, 10 books, etc.). Have them develop a branching chart to organize those things. When they are done, the teacher can suggest an eleventh object and see if it will fit into the existing organization. This is a good way to illustrate the importance of categorizing carefully. For example instead of dividing objects into black and white; divide objects into black and not black. Then if a yellow object is added it has a place in the existing organization.
1-83 Exploring Streams – Stream Monitoring Curriculum Guide
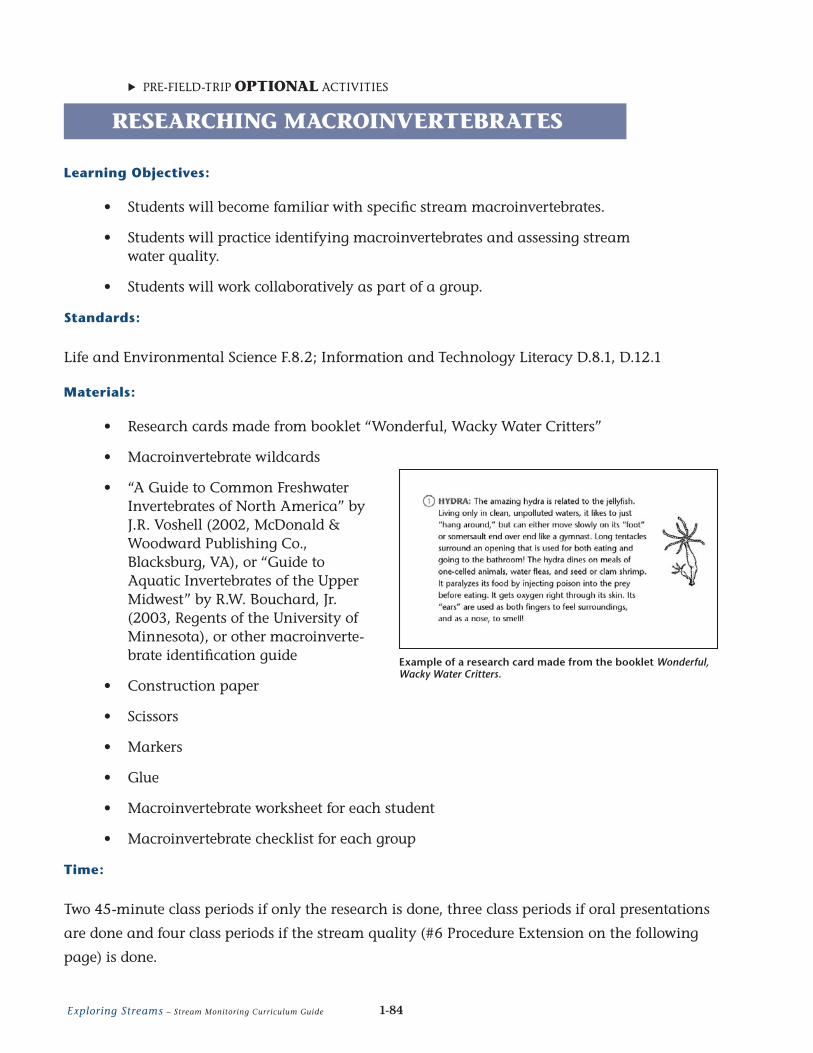
RESEARCHING MACROINVERTEBRATES
. PRE-FIELD-TRIP OPTIONAL ACTIVITIES
Learning Objectives:
• Studentswillbecomefamiliarwithspecificstreammacroinvertebrates.
• Studentswillpracticeidentifyingmacroinvertebratesandassessingstreamwater quality.
• Studentswillworkcollaborativelyaspartofagroup.
Standards:
Life and Environmental Science F.8.2; Information and Technology Literacy D.8.1, D.12.1
Materials:
• Researchcardsmadefrombooklet“Wonderful,WackyWaterCritters”
• Macroinvertebratewildcards
• “AGuidetoCommonFreshwaterInvertebratesofNorthAmerica”byJ.R. Voshell (2002, McDonald & Woodward Publishing Co., Blacksburg, VA), or “Guide to Aquatic Invertebrates of the Upper Midwest”byR.W.Bouchard,Jr.(2003, Regents of the University of Minnesota), or other macroinverte-brate identification guide
• Constructionpaper
• Scissors
• Markers
• Glue
• Macroinvertebrateworksheetforeachstudent
• Macroinvertebratechecklistforeachgroup
Time:
Two 45-minute class periods if only the research is done, three class periods if oral presentations
are done and four class periods if the stream quality (#6 Procedure Extension on the following
page) is done.
Example of a research card made from the booklet Wonderful, Wacky Water Critters.
1-84 Exploring Streams – Stream Monitoring Curriculum Guide

. PRE-FIELD-TRIP OPTIONAL ACTIVITY – RESEARCHING MACROINVERTEBRATES
PROCEDURE:
1. Photocopy the macroinvertebrate worksheet (page 1-86) double sided for each student and one checklist (page 1-87) for each group.
2. Students will work in groups. Each member of the group will complete a worksheet on each of four different macroinvertebrates. Using the macroinvertebrate checklist, group members will be sure that they all research different organisms. (Note the blank area in the lower right corner of each card is for students to draw and color a picture of their organism.)
3. Using construction paper, students can then create two of their organisms. Since many of these organisms are very tiny, the teacher might suggest a scale. For example all organisms will be made 5 or 10 times their actual size.
4. Each student will teach the class about the two macroinvertebrates they created.
5. The students can then “release” their organisms into the “stream.” Teachers can use a long length of blue paper to represent a stream. Attach this to the classroom or hallway wall.
6. Extension: After all students have presented and attached their organisms to the stream on the wall, the teacher may choose to divide the stream into segments. Assign each group to a segment and allow them to practice with the data sheet they will be using in the field on the sampling day. Students should assess the quality of the water based on the organism variety found in their section of the stream.
1-85 Exploring Streams – Stream Monitoring Curriculum Guide

. PRE-FIELD-TRIP OPTIONAL ACTIVITY – RESEARCHING MACROINVERTEBRATES
MACROINVERTEBRATE WORKSHEET
Common Name: _______________________________ Scientific Name: ___________________________________________
Order: __________________________________________ Sub-Order (if applicable): _______________________________
Tolerance to pollution? ___________________________________________________________________________________________
________________________________________________________________________________________________________________
What does it eat? ________________________________________________________________________________________________
________________________________________________________________________________________________________________
How does it get its food? _________________________________________________________________________________________
________________________________________________________________________________________________________________
How does it get oxygen? _________________________________________________________________________________________
________________________________________________________________________________________________________________
How does it get away from enemies? ______________________________________________________________________________
________________________________________________________________________________________________________________
Other unique adaptations? _______________________________________________________________________________________
____________________________________________________________________________________________
Drawing of Macroinvertebrate
Drawing of Macroinvertebrate
1-86 Exploring Streams – Stream Monitoring Curriculum Guide

. PRE-FIELD-TRIP OPTIONAL ACTIVITY – RESEARCHING MACROINVERTEBRATES
Macroinvertebrate Group Checklist
(Be sure that each person researches four different macroinvertebrates and that there are no repeats within your group.)
N Mosquito
N Nematode or horsehair worm
N Phantom midge
N Pill or fingernail clam
N Planaria or flatworm
N Predaceous diving beetle
N Rat-tailed maggot
N Riffle beetle
N Scud or amphipod
N Seed shrimp or clam shrimp
N Snail
N Soldier fly
N Spring tail
N Stonefly
N Threadworm or nematode
N Tubifex worm
N Water boatman
N Water flea or daphnia
N Water mite
N Water penny
N Water scavenger beetle
N Water scorpion
N Water snipe fly or Atherix
N Water strider
N Whirligig beetle
N Aquatic sowbug or isopod
N Alderfly
N Backswimmer
N Black fly
N Bristle worm
N Caddisfly
N Caterpillar or pyralid moth
N Crane fly
N Crawling water beetle
N Crayfish
N Cyclops or copepod
N Damselfly
N Dobsonfly
N Dragonfly
N Fairy shrimp
N Fishfly
N Fishing spider
N Freshwater mussel
N Giant water bug
N Horse fly and deer fly
N Hydra
N Leech
N Limpet
N Marsh treader
N Mayfly
N Midge or bloodworm
1-87 Exploring Streams – Stream Monitoring Curriculum Guide

STREAM WALK SURVEY
. PRE-FIELD-TRIP OPTIONAL ACTIVITIES
Learning Objectives:
• Studentswillbecomeawareoftheplantsandanimalsthatlivenearthestream or river.
• Studentswillunderstandhowthestreamorriverisbeingusedbypeople.
• Studentswillunderstandhowlandusesaffectriver/streamwaterqualityandstreambank habitat.
Standards:
Agricultural Education: B.8.3, E.8.2; Environmental Education: A.8.4, A.8.5, A.8.6, A.12.5, B.8.5,
B.8.10, B.8.17, B.8.18, C.8.2
Time:
A stream walk survey will take one afternoon (depending on the length of stream being surveyed).
Materials:
Stream Walk Worksheet (Pages 1-92 and 1-93)
Background:
Conducting a survey is the first way to collect information about your stream or river. From this
survey, you will gain information to help you to decide what actions may be needed to improve
the quality of the stream or river.
Use the Stream Walk Worksheet to evaluate the health of your waterway.
1-88 Exploring Streams – Stream Monitoring Curriculum Guide

. PRE-FIELD-TRIP OPTIONAL ACTIVITY – STREAM WALK SURVEY
PROCEDURE:
1. Ask for permission to conduct a survey if the survey site is on private property.
2. Before going on your stream walk, make copies of the Stream Walk Worksheet for all members of the group. This worksheet will be your guide to completing the survey.
3. If you have a topographic map of the waterway, draw a circle around the area to be surveyed.
4. If storm drains or drainage pipes enter the stream, do your best to follow the pipes to find their sources.
5. Take pictures or a video of the stream or river to document your trip and the stream’s quality.
6. Complete a new Stream Walk Worksheet for every survey done. Include photos and other information that you collect. Use this information to build a portfolio about your stream, or share the information with your community through media releases, newsletters, or displays at local malls, schools, banks, etc.
How to Complete the Form:
Complete the box that asks for information about the name of the stream, where it is located, and the date and time that you collected the data. In the weather section, check the box that best describes the weather conditions.
1. Water Appearance is a physical indicator of water pollution. Select the term(s) that best describe the physical appearance of the water in the stream:
Clear: Colorless, transparent.
Turbid: Cloudy brown. May be due to silt or plant material suspended in the water.
Milky: Cloudy-white or gray. May be natural or due to pollution.
Foamy: May be natural or caused by excessive nutrients or detergents from pollution. (Foam that is several inches high and does not brush apart easily is generally due to some sort of pollution.)
Dark Brown: Tea-colored. May indicate that acids are being released into the stream due to decaying plants.
Oily Sheen: A multi-colored reflection. Can occur naturally or it may indicate oil or other petrochemicals in the stream.
Orange/Reddish: May indicate acids draining into the water or iron bacteria.
Green: Caused by algae. May indicate excess nutrients are being released into the stream.
2. Water Odor is also a physical indicator of water pollution.
None: Indicates good water quality.
Sewage: May indicate the release of human waste material, livestock manure flow from an upstream feed lot. If you smell sewage/manure or rotten eggs coming from stream, please do not enter the water. Notify the nearest DNR Service Center.
Chlorine: May indicate that a sewage treatment plant is over-chlorinating its effluent or may be from swimming pool discharge. Also a component of milk house cleaning.
1-89 Exploring Streams – Stream Monitoring Curriculum Guide

. PRE-FIELD-TRIP OPTIONAL ACTIVITY – STREAM WALK SURVEY
Fishy: May indicate the presence of excessive algal growth or dead fish.
Rotten Eggs: A sulfurous smell may indicate muck soils or sewage/manure pollution, as hydrogen sulfide gas is a product of organic decomposition.
Petroleum: May indicate an oil spill from boats, land or storm drains.
3. Temperature controls the growth/activity of bacteria which can strongly influence the amount of oxygen in the water. Cold water holds more dissolved oxygen than warm water, thus temperature directly affects the amount of oxygen available to these organisms.
a. Measure air temperature by holding the thermometer in the shade for at least two minutes. If there is no tall vegetation, use your body to shade the thermometer. Repeat and record both measurements.
b. Measure water temperature by submerging a thermometer for at least two minutes in a stream run. Do not measure temperature in a slow-moving part of the stream or right next to the banks. Repeat in another section of the stream and record both measurements.
4. Submerged Aquatic Plants. Record if there are submerged plants in the stream and describe what they look like and where they are located.
5. Riparian (streamside) vegetation and other riparian surfaces. Identify the riparian vegetation or other land covers by type. Use the left column for the left-hand side of the waterway (looking upstream); use the right column for the right-hand side.
6. Canopy Cover. Estimate how shaded your site is. Do not include overhanging grasses. Check the box that is closest to your estimate.
7. Bottom Substrate is the material in and on the stream bottom that macroinvertebrates attach to, feed from or crawl on. Check the boxes that best describe the stream bottom in the study site.
8. Stream Discharge Estimate. To estimate the volume of water flowing through the stream at a particular point, measure the width, depth and average water velocity. You will need someone to help you with this measurement.
a. Stream Width: Measure the width of the stream with a tape measure. If the stream is too deep, wide or polluted to measure directly, you might be able to measure the depth indirectly by using a bridge. Indicate on the data sheet that the measurement was an estimate.
b. Stream Depth: Record the stream depth at five evenly distributed points across the channel. Total the five depth values and divide by five to determine the average depth in feet.
c. Stream Velocity:
i. Mark off a distance of 20 feet of stream at your site. Place a person in the water or on the bank at the “top” spot and the other person 20 feet downstream at the end of the measured length of stream.
ii. Have the downstream person be the time keeper with a stopwatch.
Note to teachers:
If you are conducting the field trip, students will complete the Stream Discharge Estimate at that time, so you may opt to skip this step during your stream walk survey.
1-90 Exploring Streams – Stream Monitoring Curriculum Guide

. PRE-FIELD-TRIP OPTIONAL ACTIVITY – STREAM WALK SURVEY
iii. The person at the “top” spot should gently toss an orange, apple or other float at least five feet upstream from the “top” spot. Once the object passes the “top” person, that person should yell “start” to begin timing how long it takes the object to float 20 feet.
iv. When the object passes the “downstream” person, that person should yell “time” and stop the watch. Don’t forget to retrieve the object for a few more trials.
v. Record the time in seconds in the appropriate space on the Stream Walk Worksheet.
vi. Repeat this procedure two more times. Try to place the float in different places across the channel. Do not count any trials where the float gets stuck in debris, along the bank or in an eddy.
vii. Keep track of the type of float used. Notes on floats: Oranges and apples seem to work very well. Many groups use tennis balls. Vials half full of water, corks and even sticks have been used as well. The type of float used should be consistent. Do not use something that can be affected by the wind. Many people like to use something that is biodegradable.
viii. Total the three trial times and divide by three to determine the average time.
ix. Divide this number into 20 to get the velocity (feet/second). For example if the three times it took your orange to travel 20 feet were 16, 9, and 11 seconds. The average time equals 36 divided by 3 = 12 sec. To get the final velocity divide 20 feet by 12 seconds = 1.67 feet/sec.
d. Stream Discharge: Multiply the width by the average depth by the velocity to get the discharge.
9) Watershed Features. Record all land uses observed upstream of your site for about 1⁄4 mile. Indicate which land uses are present with a check in the first column. If the land use is clearly having an impact on the stream, check the second column.
10) Channel Alteration. Indicate whether or not the stream segment has been channelized or straightened.
11) Personal Observations. Enter here any observations that you feel are important to the quality of the habitat of the stream and its environs. Include any characteristics not mentioned on the data sheet.
1-91 Exploring Streams – Stream Monitoring Curriculum Guide

Stream Name
County State
Your Name
Monitoring Location (general description and longitude/latitude)
Date Time
Weather in the past 24 hours:
❒ Storm (heavy rain)
❒ Rain (steady rain)
❒ Showers (intermittent rain)
❒ Overcast
❒ Clear/Sunny
Weather Now:❒ Storm (heavy rain)
❒ Rain (steady rain)
❒ Showers (intermittent rain)
❒ Overcast
❒ Clear/Sunny
1. Water Appearance
❒ Clear ❒ Dark Brown ❒ Turbid ❒ Oily Sheen ❒ Milky ❒ Orange/red ❒ Foamy ❒ Green ❒ Other _____________________
Notes _______________________ _____________________________ _____________________________
2. Water Odor
❒ None ❒ Fishy ❒ Sewage ❒ Rotten Eggs ❒ Chlorine ❒ Petroleum ❒ Other _____________________
Notes _______________________ _____________________________ _____________________________
3. Temperature
Air ______ ______ ˚F ˚C Water ______ ______ ˚F ˚C (circle temp. scale used)
(continued on next page)
Attach a photo or sketch your site:Note features that affect stream habitat, such as riffles, runs, pools, ditches, wetlands, dams, rip rap, outfalls, tributaries, landscape features, logging, paths and roads. Include an arrow showing which way the stream is flowing, and another arrow showing ‘north.’
Stream Walk Worksheet
. PRE-FIELD-TRIP OPTIONAL ACTIVITY – STREAM WALK SURVEY
1-92 Exploring Streams – Stream Monitoring Curriculum Guide

4. Submersed Aquatic PlantsAre there submersed aquatic plants?
Yes ______ No ______
Where? __________________________ Identify or describe them: __________ _________________________________ _________________________________
5. Riparian VegetationLooking upstream, describe the streamside cover.
a) Note vegetation on streambank only and check boxes if present (left column is for left-hand side of stream; right column is for right-hand side).
left right ❒ Evergreen trees ❒
❒ Hardwood trees ❒
❒ Bushes, shrubs ❒
❒ Tall grasses, ferns, etc. ❒
❒ Lawn ❒
❒ Boulders/rocks ❒
❒ Gravel/sand ❒
❒ Bare soil ❒
❒ Pavement/structures ❒
b) Note vegetation from the top of streambank back 66 feet.
left right ❒ Evergreen trees ❒
❒ Hardwood trees ❒
❒ Bushes, shrubs ❒
❒ Tall grasses, ferns, etc. ❒
❒ Lawn ❒
❒ Boulders/rocks ❒
❒ Gravel/sand ❒
❒ Bare soil ❒
❒ Pavement/structures ❒
❒ Agricultural fields ❒
❒ Pasture ❒
6. Canopy CoverPick the category that best describes how much vegetation shades the stream at your site.
❒0% ❒25% ❒75% ❒100%
Notes on vegetation: ________________ ___________________________________ ___________________________________
7. Bottom SubstrateRecord the materials that make up the stream bottom.
Bottom types:
❒ Bedrock
❒ Boulder (>10 inches) ❒ Cobble (2.5 inches - 10 inches) ❒ Gravel (0.1 inches - 2.5 inches) ❒ Sand (<0.1 inches) ❒ Silt ❒ Other (include organics)
Notes on substrate: ______________ ________________________________ ________________________________
8. Stream Discharge EstimateStream width: ______ feet (a)
Depth measurements:
______ ft. ______ ft. ______ ft. ______ ft. ______ ft.
______ total /5 =______ avg. depth (b)
Velocity: Time (per 20 ft)
______ sec. ______ sec. ______ sec.
______ total
divide total by number of trials
______ /3 = ______ secs. (avg.)
Velocity = foot/second
20 ft. / ______ sec. (avg. time)
= ft./sec. (c)
Discharge: (width x depth x velocity)
____ feet x ____feet x ____ ft/sec. = (a) (b) (c)
= ft3/sec.
9. Watershed Features (within about 1⁄4 mile of the site – upstream)
Adjacent land used can impact the stream. Check “1” if present, “2” if clearly having an impact on the stream:
1 2 Residential
❒ ❒ single-family housing (dense) ❒ ❒ single-family housing (>1 acre lots)
❒ ❒ multifamily housing
❒ ❒ lawns❒ ❒ commercial/institutional
1 2 Roads, etc.
❒ ❒ paved roads, parking lots, bridges ❒ ❒ unpaved roads
1 2 Construction underway on:
❒ ❒ housing development ❒ ❒ commercial development ❒ ❒ road or bridge building/repair
1 2 Agricultural
❒ ❒ grazing land (pastures) ❒ ❒ feed lots, animal holding areas ❒ ❒ cropland (type )❒ ❒ inactive agricultural land
1 2 Recreation
❒ ❒ golfing ❒ ❒ camping ❒ ❒ swimming/fishing/canoeing
❒ ❒ hunting land/natural
1 2 Other
❒ ❒ mining ❒ ❒ logging ❒ ❒ industry
❒ ❒ sanitary landfill❒ ❒ sewage treatment plant❒ ❒ dams
10. Channel Alteration
Has the stream been channelized?
Yes ______ No ______
. PRE-FIELD-TRIP OPTIONAL ACTIVITY – STREAM WALK SURVEY
1-93 Exploring Streams – Stream Monitoring Curriculum Guide

WHAT IS A WATERSHED VIDEO
. PRE-FIELD-TRIP OPTIONAL ACTIVITIES
Learning Objectives:
• Studentswillunderstandwhatawatershedis.
• Studentswillbeabletoexplainhowhumanresourceusecanimpacttheenvironment.
• Studentswillbeabletoidentifymajorair,waterorlandpollutantsandtheirsources.
• Studentswillbeabletoidentifytypesofhumanlandusesandhowthosemay affect water quality.
• Studentswillbeabletoidentifyatleastthreeaspectsofstreamsthatmaybeaffected by human impacts in a watershed.
• Studentswillbeabletoexplaintheconceptofpollutionasitrelatestowatersheds.
Standards:
Environmental Education B.8.17, B.8.18, B.12.17
Materials:
• WaterActionVolunteersVolunteerStreamMonitoringDVDSetDisc#2
• StudentWorkbook(seeSection4)
• Writinginstrument
Time:
25 minutes
Background:
Helping students understand why we care about water and monitoring water is a key aspect to
making this curriculum successful when used in Wisconsin’s middle and high schools. This
video introduces the concept of a watershed and that human uses of the land within a watershed
affect those downstream. In this video, the concepts of stream order, natural and man-made
changes and time scales for expected change are discussed by Dr. Kristopher Wright from
UW-Platteville. The importance of monitoring streams and how to design monitoring to identify
sources of pollution are also discussed.
1-94 Exploring Streams – Stream Monitoring Curriculum Guide

. PRE-FIELD-TRIP OPTIONAL ACTIVITY – WHAT IS A WATERSHED VIDEO
Student Discussion Questions and Sample Answers:
1. Name two activities humans might do in Wisconsin that could affect water quality in the Mississippi River in New Orleans. Humans might spread fertilizers or manure on the land and those nutrients could run off into the river and make their way to the mouth of the Mississippi River. Humans might introduce an aquatic invasive species that would be able to move downstream to New Orleans.
2. For a watershed to change naturally, would you expect this to happen over a short time period (e.g., a day) or a long time period (e.g., hundreds or thousands of years)? I would expect natural change at the watershed level to occur over a long time period.
3. What are two of three major concerns about human impacts on watersheds? Human impacts are relatively new impacts that streams are facing. Human impacts have happened in a relatively short period of time. Human impacts are many, so organisms have to face many stressors at one time.
4. Name three things related to streams that may be affected by human impacts in a watershed. Life, including fish, macroinvertebrates, birds and mammals may be affected. Water chemistry and geomorphology may be affected. This could include such things as dissolved oxygen, pH, turbidity, nutrients, sediments and channel structure.
PROCEDURE:
1. Show students the “What is a Watershed” video that is on the Water Action Volunteers DVD Set (from the main menu on Disc 2, choose “What is a Watershed”; Run time 16:47).
2. Have students answer the following discussion questions.
1-95 Exploring Streams – Stream Monitoring Curriculum Guide
For a version (for teachers only) that includes answers, please contact
the WAV Coordinator. For contact information, see:
http://watermonitoring.uwex.edu/wav

OPTIONAL ACTIVITIES FROM OTHER SOURCES
Please see Section 5 for contact information for any of the curricula listed below.
Suggested Optional Activities from Project Wild Aquatic
Overall Experience
. To Dam or Not to Dam – “Students will role play individuals representing differingperspectivesandconcernsrelatedtoacomplexissue.”
. What’s in the Water (formerly, Deadly Waters) – “Students will analyze the pollutants found in a hypothetical river. They graph the quantities of pollutants and make recommendations about actions that could be taken to improvethehabitat.”
. Alice in Waterland – “Students will use a simulated field trip, lecture-discussion and student-gathered data to explore water use and its effects on wildlife habitat.”
Other
. Where Have All The Salmon Gone? – “Students will graph and interpret actualfishpopulationdatainrelationtohistoricalevents.”
. Students will use topographical maps to do suggestions for Shrinking Habitat (“AquaticExtensionstoProjectWILDActivities”foundintheindicesintheback of the Project WILD Aquatic guide) – Students will use maps to compare historic and present land use.
Habitat
. Wetland Metaphors – “Students are presented with a selection of hands-on objectsforinvestigationasmetaphorsfornaturalfunctionsofwetlands.”
. Edge of Home – “Students will explore the concept of ecotones by visiting placeswherehabitatsoverlap.”
. Blue Ribbon Niche – “Students will create a variety of representations of animalsthatliveinriparianhabitats.”
. Where Does Water Runoff (formerly, Where Does Water Runoff After School) – “Students will measure and calculate the area of the school ground, calculate the volume and weight of water falling on the school ground; determine specific and annual rainfall and runoff; and trace the course of that water to aquatichabitats.”
. Dragonfly Pond – “Students will create a collage of human land-use activities aroundanimageofapond.”
1-96 Exploring Streams – Stream Monitoring Curriculum Guide

. OPTIONAL ACTIVITIES FROM OTHER SOURCES
Art
. Fashion a Fish – “Students will design a variety of fish adapted for various aquatichabitats.”
. Fashion a Fish – (Specifically the suggestion called Adaptation Artistry listed in“AquaticExtensionstoProjectWILDActivities”foundintheindicesintheback of the Project WILD Aquatic guide.) “Students will invent an insect specially adapted to be able to land on water to feed, swim underwater as well asflyintheairandtravellongdistances.”
. Fashion a Fish – (Specifically, the suggestion listed in “Aquatic Extensions to ProjectWILDActivities”foundintheindicesinthebackoftheProjectWILDAquaticguide)“Studentswillexplorestreaminvertebrates.”
Suggested Optional Activities from Project WET
Transparency and Temperature
. Branching Out – Students will construct a watershed model.
. A-maze-ing Water – Students will negotiate a maze to investigate nonpoint source pollution.
. Sum of the Parts – Students will demonstrate nonpoint source pollution.
. Just Passing Through – Students will mimic the movement of water down a slope.
. Rainy Day Hike – Students will explore schoolyard topography and its effect on the watershed.
. Color Me A Watershed – Students will interpret maps to analyze changes in a watershed.
Dissolved Oxygen
. ReachingYourLimits–Studentswill“limbo”tolearnbasicwaterqualityconcepts and standards development.
1-97 Exploring Streams – Stream Monitoring Curriculum Guide

. OPTIONAL ACTIVITIES FROM OTHER SOURCES
Stream Flow
. Branching Out – Students will construct a watershed model.
. Rainy Day Hike – Students will explore schoolyard topography and its effect on the watershed.
. Back to the Future – Students will analyze stream flow data to predict floods and water shortages.
. Just Passing Through – Students will mimic the movement of water down a slope.
. Color Me a Watershed – Students will interpret maps to analyze changes in a watershed.
Habitat
. Branching Out – Students will construct a watershed model.
. A-maze-ing Water – Students will negotiate a maze to investigate nonpoint source pollution.
. Sum of the Parts – Students will demonstrate nonpoint source pollution.
. Just Passing Through – Students will mimic the movement of water down a slope.
. Rainy Day Hike – Student will explore schoolyard topography and its effect on the watershed.
. Color Me A Watershed – Students will interpret maps to analyze changes in a watershed.
. Water Address – Students will analyze clues to match organisms with water-related adaptations.
Macroinvertebrates
. Macroinvertebrate Mayhem – Students will illustrate, through a game of tag, how macroinvertebrate populations indicate water quality.
Overall Experience
. Water Works – Students will create a web of water users.
. ChoicesandPreferences–Studentswilldevelopa“waterindex”torankwateruses.
. Hot Water – Students will debate water issues.
Other
. Where Are The Frogs? – Students will run a simulation and experiment to understand the effects of acid rain.
1-98 Exploring Streams – Stream Monitoring Curriculum Guide

. OPTIONAL ACTIVITIES FROM OTHER SOURCES
Suggested Optional Activities from Hook, Line & Thinker
Transparency
. To the Point – Students will plan an information program to alert the public to specific nonpoint source pollution problems and solutions for their watershed.
Temperature
. Water of Life – Students will watch a demonstration of summer lake stratification. Students will discuss oxygen and temperature changes in lakes during other seasons and work in partners to design an experiment.
Dissolved Oxygen
. Fish Food – Students will complete a set of math problems to show how energy is lost in a food chain and play a population dynamics game.
. Water of Life – Students will watch a demonstration of summer lake stratification. Students will discuss oxygen and temperature changes in lakes during other seasons and work in partners to design an experiment.
Habitat
. HomeSweetHome–Studentswillcreatea“travelbrochure”foraparticularfish species’ spawning habitat and present it to the class. The travel brochure will include a detailed description of the environment, a description of the amenities that the fish requires for spawning, and graphics from the internet or another source.
. To the Point – Students will plan an information program to alert the public to specific nonpoint source pollution problems and solutions for their watershed.
. Shared Interests – Students will read a scenario and take on the roles of characters in the story as they develop a land use proposal, argue the merits of their proposal and attempt to compromise on a decision.
. Restoration Nation – Students will work in small teams to develop a creek restoration plan and present their results to the class.
. Reading the Water – Students will profile a fish and share their research with others. Students will use a lake map to discuss possible fish locations.
1-99 Exploring Streams – Stream Monitoring Curriculum Guide

. OPTIONAL ACTIVITIES FROM OTHER SOURCES
Suggested Optional Activities from Give Water a Hand Action Guide
. Research Needs for Action – Students will use a site map and a checklist to help identify specific water problems, and determine which ones need action in one of four locations (community, school, home, or farm). In addition, they will find out what is already being done and what still needs to be done to protect the watershed and conserve water. Available checklists:
• CommunitySiteChecklist
• HomeSiteChecklist
• SchoolSiteChecklist
• FarmSiteChecklist
Suggested Optional Activities from Holding onto the GREEN Zone
. Erosion in the Zone – Students will compare and contrast the effects of rainfall on bare soil and land protected by vegetation.
. Filter Plants – Students will demonstrate that plants can filter some pollutants from a riparian area.
. On the Edge – Students will describe characteristics of water bodies and shorelines that they have visited or that they can view in photographs.
. Zone Search – Students will explore more about riparian areas by locating the GREEN Zone in two photos.
. Putting on the Brakes – Students will make a shoe-box model of a stream and will devise ways to slow down water (a marble) in their shoe-box stream to demonstrate the relationship between water speed and stream shape in the riparian zone.
. Plant Power – Students will observe detailed drawings of plants and examine characteristics that can help maintain a healthy riparian zone.
. Percolation Test – Students will time the flow of water through different soils; measure the amount of water held in these soils; and observe the ability of soils to filter water.
Suggested Optional Activities from Other Sources
. Filtration, Illinois NRCS – Students will learn that “soils can filter and clean water. The ability of a soil to filter water is largely dependent upon particle sizeandhowfastwaterflowsthroughsoil.”
. Soil Glue, Illinois NRCS – Students will learn that “surface soil particles are held together by organic proteins to form larger pieces called aggregates. The binding of soil particles together helps maintain pore spaces for aeration and water infiltration. The soil aggregates are harder to wash away than individualsoilparticlesduringrainstorms.”
. Build a Bug, Utah 4H – Students will learn about macroinvertebrates and their adaptations.
1-100 Exploring Streams – Stream Monitoring Curriculum Guide