Embed Size (px)
Citation preview
4-1
SECTION 4 - UNEMPLOYMENT COMPENSATION
CONTENTS
Overview Benefits
Coverage Number of Covered Workers Eligibility Amount and Duration of Weekly Benefits
Extended Benefits Benefit Exhaustion Supplemental Benefits Hypothetical Weekly Benefit Amounts for Various Workers in the Regular
State Programs The Unemployment Trust Fund
Financial Condition of the Unemployment Trust Fund The Federal Unemployment Tax State Unemployment Taxes
Administrative Financing and Allocation Legislative History References
OVERVIEW
The Social Security Act of 1935 (Public Law 74-271) created the Federal-State Unemployment Compensation (UC) Program. The program has two main objectives: (1) to provide temporary and partial wage replacement to involuntarily unemployed workers who were recently employed; and (2) to help stabilize the economy during recessions. The U.S. Department of Labor oversees the system, but each State administers its own program. Because Federal law defines the District of Columbia, Puerto Rico, and the Virgin Islands as States for the purposes of UC, there are 53 State programs. The Federal Unemployment Tax Act of 1939 (Public Law 76-379) and titles III, IX, and XII of the Social Security Act form the framework of the system. The Federal Unemployment Tax Act (FUTA) imposes a 6.2 percent gross tax rate on the first $7,000 paid annually by covered employers to each employee. Employers in States with programs approved by the Federal Government and with no delinquent Federal loans may credit 5.4 percentage points against the 6.2 percent tax rate, making the minimum net Federal unemployment tax rate 0.8 percent. Since all States have approved programs, 0.8 percent is the effective Federal tax rate. This Federal revenue finances administration of the system, half of the Federal-State Extended Benefits (EB) Program, and a Federal account for State
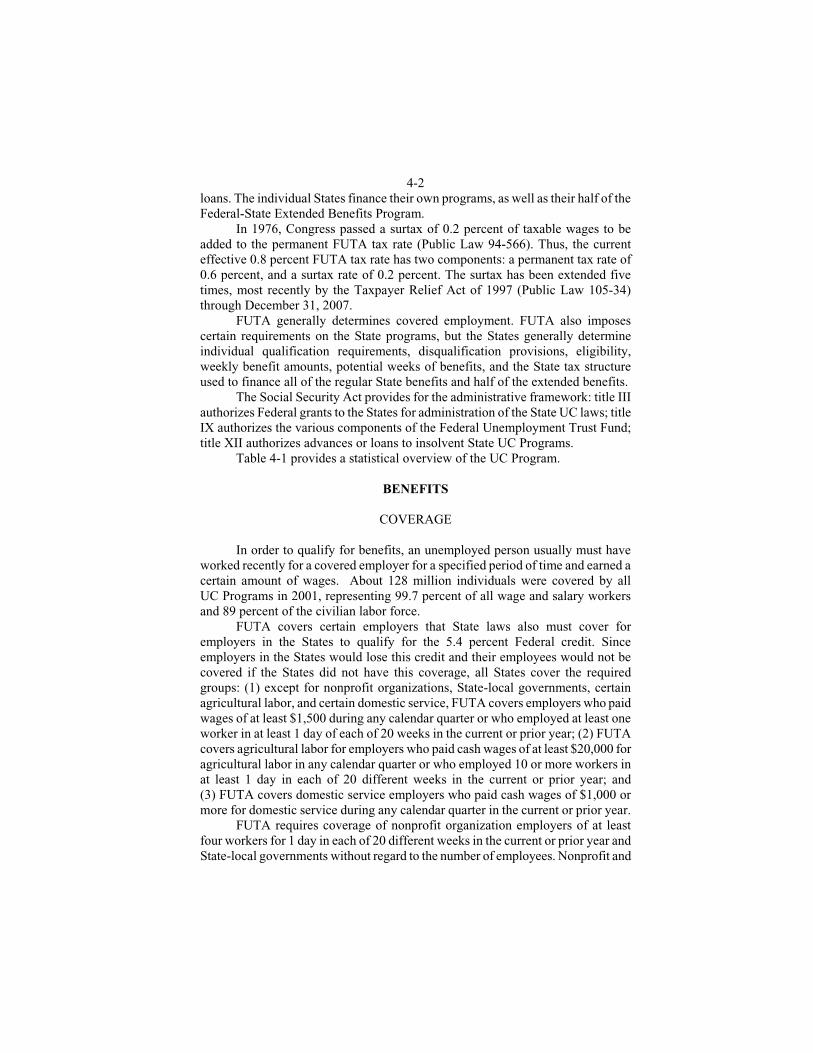
4-2 loans. The individual States finance their own programs, as well as their half of the Federal-State Extended Benefits Program. In 1976, Congress passed a surtax of 0.2 percent of taxable wages to be added to the permanent FUTA tax rate (Public Law 94-566). Thus, the current effective 0.8 percent FUTA tax rate has two components: a permanent tax rate of 0.6 percent, and a surtax rate of 0.2 percent. The surtax has been extended five times, most recently by the Taxpayer Relief Act of 1997 (Public Law 105-34) through December 31, 2007. FUTA generally determines covered employment. FUTA also imposes certain requirements on the State programs, but the States generally determine individual qualification requirements, disqualification provisions, eligibility, weekly benefit amounts, potential weeks of benefits, and the State tax structure used to finance all of the regular State benefits and half of the extended benefits. The Social Security Act provides for the administrative framework: title III authorizes Federal grants to the States for administration of the State UC laws; title IX authorizes the various components of the Federal Unemployment Trust Fund; title XII authorizes advances or loans to insolvent State UC Programs. Table 4-1 provides a statistical overview of the UC Program.
BENEFITS
COVERAGE
In order to qualify for benefits, an unemployed person usually must have worked recently for a covered employer for a specified period of time and earned a certain amount of wages. About 128 million individuals were covered by all UC Programs in 2001, representing 99.7 percent of all wage and salary workers and 89 percent of the civilian labor force. FUTA covers certain employers that State laws also must cover for employers in the States to qualify for the 5.4 percent Federal credit. Since employers in the States would lose this credit and their employees would not be covered if the States did not have this coverage, all States cover the required groups: (1) except for nonprofit organizations, State-local governments, certain agricultural labor, and certain domestic service, FUTA covers employers who paid wages of at least $1,500 during any calendar quarter or who employed at least one worker in at least 1 day of each of 20 weeks in the current or prior year; (2) FUTA covers agricultural labor for employers who paid cash wages of at least $20,000 for agricultural labor in any calendar quarter or who employed 10 or more workers in at least 1 day in each of 20 different weeks in the current or prior year; and (3) FUTA covers domestic service employers who paid cash wages of $1,000 or more for domestic service during any calendar quarter in the current or prior year. FUTA requires coverage of nonprofit organization employers of at least four workers for 1 day in each of 20 different weeks in the current or prior year and State-local governments without regard to the number of employees. Nonprofit and
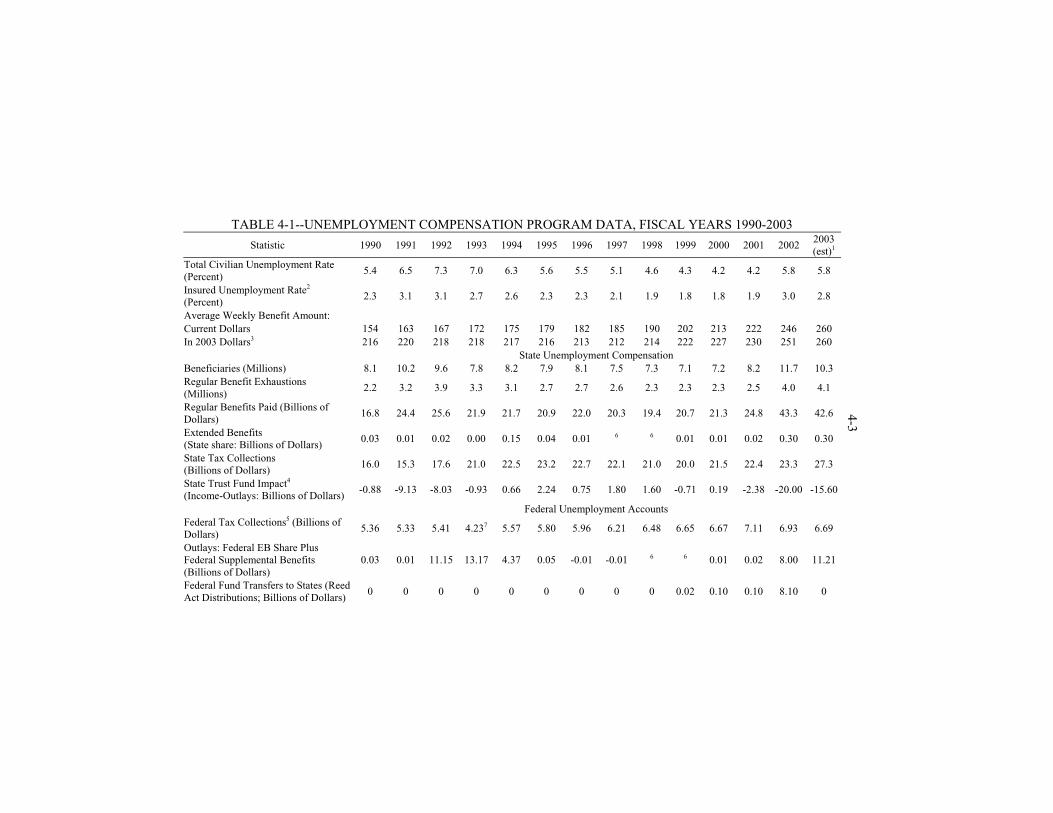
TABLE 4-1--UNEMPLOYMENT COMPENSATION PROGRAM DATA, FISCAL YEARS 1990-2003
Statistic 1990 1991 1992 1993 1994 1995 1996 1997 1998 1999 2000 2001 2002 2003 (est)1
Total Civilian Unemployment Rate (Percent)
5.4 6.5 7.3 7.0 6.3 5.6 5.5 5.1 4.6 4.3 4.2 4.2 5.8 5.8
Insured Unemployment Rate2 (Percent)
2.3 3.1 3.1 2.7 2.6 2.3 2.3 2.1 1.9 1.8 1.8 1.9 3.0 2.8
Average Weekly Benefit Amount: Current Dollars 154 163 167 172 175 179 182 185 190 202 213 222 246 260 In 2003 Dollars3 216 220 218 218 217 216 213 212 214 222 227 230 251 260
State Unemployment Compensation Beneficiaries (Millions) 8.1 10.2 9.6 7.8 8.2 7.9 8.1 7.5 7.3 7.1 7.2 8.2 11.7 10.3 Regular Benefit Exhaustions (Millions)
2.2 3.2 3.9 3.3 3.1 2.7 2.7 2.6 2.3 2.3 2.3 2.5 4.0 4.1
Regular Benefits Paid (Billions of Dollars)
16.8 24.4 25.6 21.9 21.7 20.9 22.0 20.3 19.4 20.7 21.3 24.8 43.3 42.6
Extended Benefits (State share: Billions of Dollars)
0.03 0.01 0.02 0.00 0.15 0.04 0.01 6 6 0.01 0.01 0.02 0.30 0.30
State Tax Collections (Billions of Dollars)
16.0 15.3 17.6 21.0 22.5 23.2 22.7 22.1 21.0 20.0 21.5 22.4 23.3 27.3
State Trust Fund Impact4
(Income-Outlays: Billions of Dollars) -0.88 -9.13 -8.03 -0.93 0.66 2.24 0.75 1.80 1.60 -0.71 0.19 -2.38 -20.00 -15.60
Federal Unemployment Accounts Federal Tax Collections5 (Billions of Dollars)
5.36 5.33 5.41 4.237 5.57 5.80 5.96 6.21 6.48 6.65 6.67 7.11 6.93 6.69
Outlays: Federal EB Share Plus Federal Supplemental Benefits (Billions of Dollars)
0.03 0.01 11.15 13.17 4.37 0.05 -0.01 -0.01 6 6 0.01 0.02 8.00 11.21
Federal Fund Transfers to States (Reed Act Distributions; Billions of Dollars)
0 0 0 0 0 0 0 0 0 0.02 0.10 0.10 8.10 0
4-3
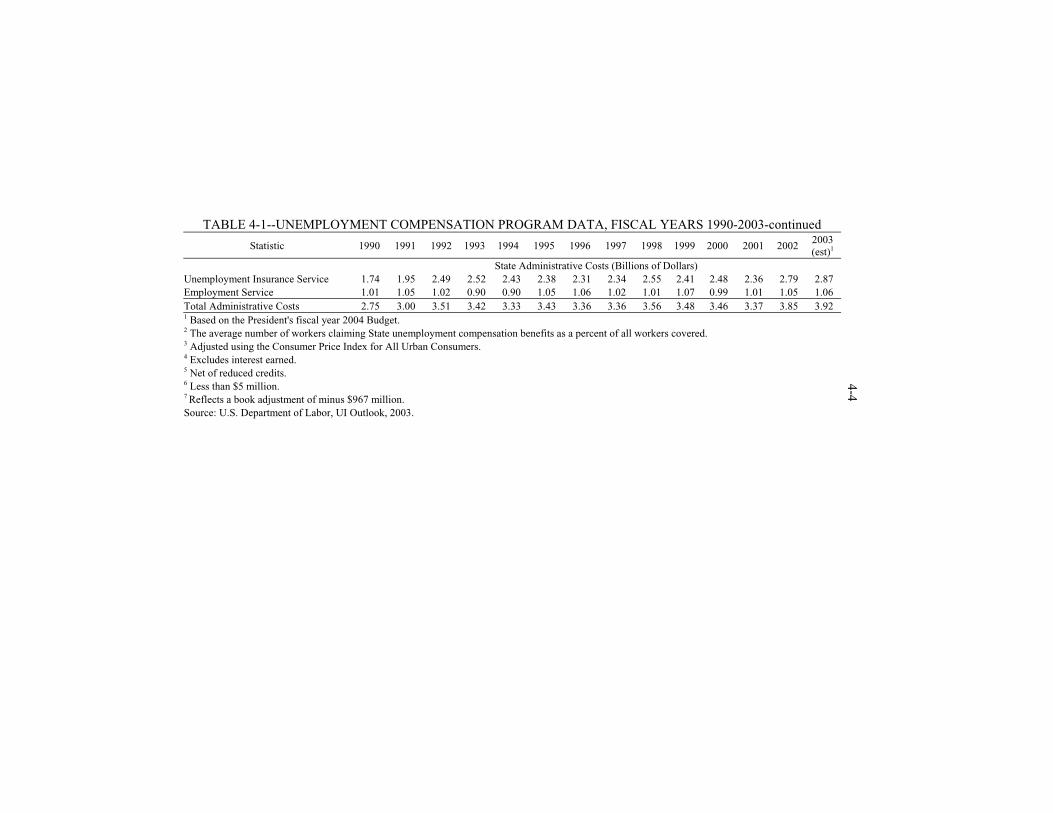
TABLE 4-1--UNEMPLOYMENT COMPENSATION PROGRAM DATA, FISCAL YEARS 1990-2003-continued
Statistic 1990 1991 1992 1993 1994 1995 1996 1997 1998 1999 2000 2001 20022003 (est)1
State Administrative Costs (Billions of Dollars) Unemployment Insurance Service 1.74 1.95 2.49 2.52 2.43 2.38 2.31 2.34 2.55 2.41 2.48 2.36 2.79 2.87 Employment Service 1.01 1.05 1.02 0.90 0.90 1.05 1.06 1.02 1.01 1.07 0.99 1.01 1.05 1.06 Total Administrative Costs 2.75 3.00 3.51 3.42 3.33 3.43 3.36 3.36 3.56 3.48 3.46 3.37 3.85 3.92 1 Based on the President's fiscal year 2004 Budget. 2 The average number of workers claiming State unemployment compensation benefits as a percent of all workers covered.
3 Adjusted using the Consumer Price Index for All Urban Consumers. 4 Excludes interest earned. 5 Net of reduced credits. 6 Less than $5 million. 7 Reflects a book adjustment of minus $967 million. Source: U.S. Department of Labor, UI Outlook, 2003.
4-4

4-5 State-local government organizations are not required to pay Federal unemployment taxes; they may choose instead to reimburse the system for benefits paid to their laid-off employees. States may cover certain employment not covered by FUTA, but most States have chosen not to expand FUTA coverage significantly. The following employment is therefore generally not covered: (1) self-employment; (2) certain agricultural labor and domestic service; (3) service for relatives; (4) service of patients in hospitals; (5) certain student interns; (6) certain alien farmworkers; (7) certain seasonal camp workers; and (8) railroad workers (who have their own unemployment program).
NUMBER OF COVERED WORKERS Although the UC system covers 99.7 percent of all wage and salary workers, Table 4-2 shows that on average only 44 percent of unemployed persons were receiving UC benefits in 2002. This compares with a peak of 81 percent of the unemployed receiving UC benefits in April 1975 and a low point of 26 percent in June 1968 and in October 1987. Despite high unemployment during the early 1980s, there was a downward trend in the proportion of unemployed persons receiving regular State benefits until the mid-1980s. The proportion receiving UC rose sharply in December 1991 due to the temporary Emergency Unemployment Compensation (EUC) Program. In May 1988, Mathematica Policy Research, Inc., under contract to the U.S. Department of Labor, released a study on the decline in the proportion of the unemployed receiving benefits during the 1980s. This analysis did not find a single predominant cause for the decline but instead found statistical evidence that several factors contributed to the decline (the figures in parentheses show the share of the decline attributed to each factor):
1. The decline in the proportion of the unemployed from manufacturing industries (4-18 percent);
2. Geographic shifts in composition of the unemployed among regions of the country (16 percent);
3. Changes in State program characteristics (22-39 percent): Increase in the base period earnings requirements (8-15 percent); Increase in income denials for UC receipt (10 percent); and Tightening up other non-monetary eligibility requirements
(3-11 percent); 4. Changes in Federal policy such as partial taxation of UC benefits
(11-16 percent); and 5. Changes in unemployment as measured by the Current Population Survey
(CPS) (1-12 percent). The group of unemployed most likely to be insured are job losers. Chart 4-1 shows the number of unemployment compensation claimants measured as a percentage of the number of job losers. This coverage ratio remained fairly
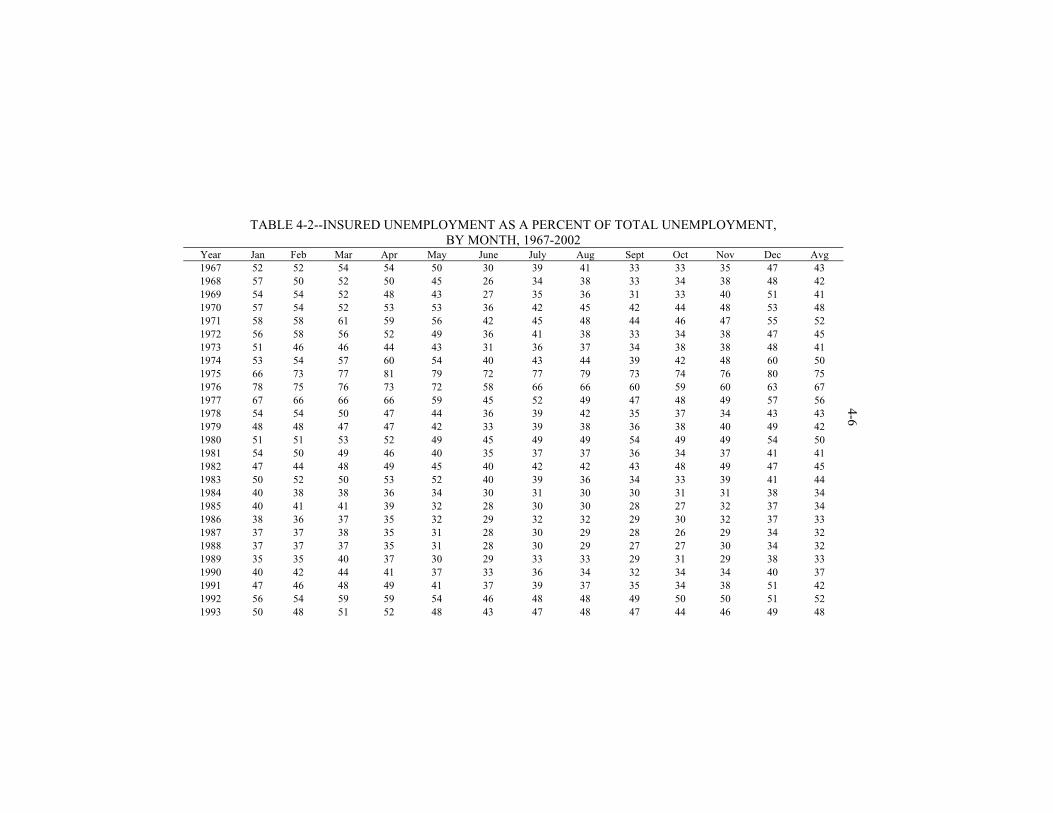
TABLE 4-2--INSURED UNEMPLOYMENT AS A PERCENT OF TOTAL UNEMPLOYMENT,
BY MONTH, 1967-2002 Year Jan Feb Mar Apr May June July Aug Sept Oct Nov Dec Avg 1967 52 52 54 54 50 30 39 41 33 33 35 47 43 1968 57 50 52 50 45 26 34 38 33 34 38 48 42 1969 54 54 52 48 43 27 35 36 31 33 40 51 41 1970 57 54 52 53 53 36 42 45 42 44 48 53 48 1971 58 58 61 59 56 42 45 48 44 46 47 55 52 1972 56 58 56 52 49 36 41 38 33 34 38 47 45 1973 51 46 46 44 43 31 36 37 34 38 38 48 41 1974 53 54 57 60 54 40 43 44 39 42 48 60 50 1975 66 73 77 81 79 72 77 79 73 74 76 80 75 1976 78 75 76 73 72 58 66 66 60 59 60 63 67 1977 67 66 66 66 59 45 52 49 47 48 49 57 56 1978 54 54 50 47 44 36 39 42 35 37 34 43 43 1979 48 48 47 47 42 33 39 38 36 38 40 49 42 1980 51 51 53 52 49 45 49 49 54 49 49 54 50 1981 54 50 49 46 40 35 37 37 36 34 37 41 41 1982 47 44 48 49 45 40 42 42 43 48 49 47 45 1983 50 52 50 53 52 40 39 36 34 33 39 41 44 1984 40 38 38 36 34 30 31 30 30 31 31 38 34 1985 40 41 41 39 32 28 30 30 28 27 32 37 34 1986 38 36 37 35 32 29 32 32 29 30 32 37 33 1987 37 37 38 35 31 28 30 29 28 26 29 34 32 1988 37 37 37 35 31 28 30 29 27 27 30 34 32 1989 35 35 40 37 30 29 33 33 29 31 29 38 33 1990 40 42 44 41 37 33 36 34 32 34 34 40 37 1991 47 46 48 49 41 37 39 37 35 34 38 51 42 1992 56 54 59 59 54 46 48 48 49 50 50 51 52 1993 50 48 51 52 48 43 47 48 47 44 46 49 48
4-6
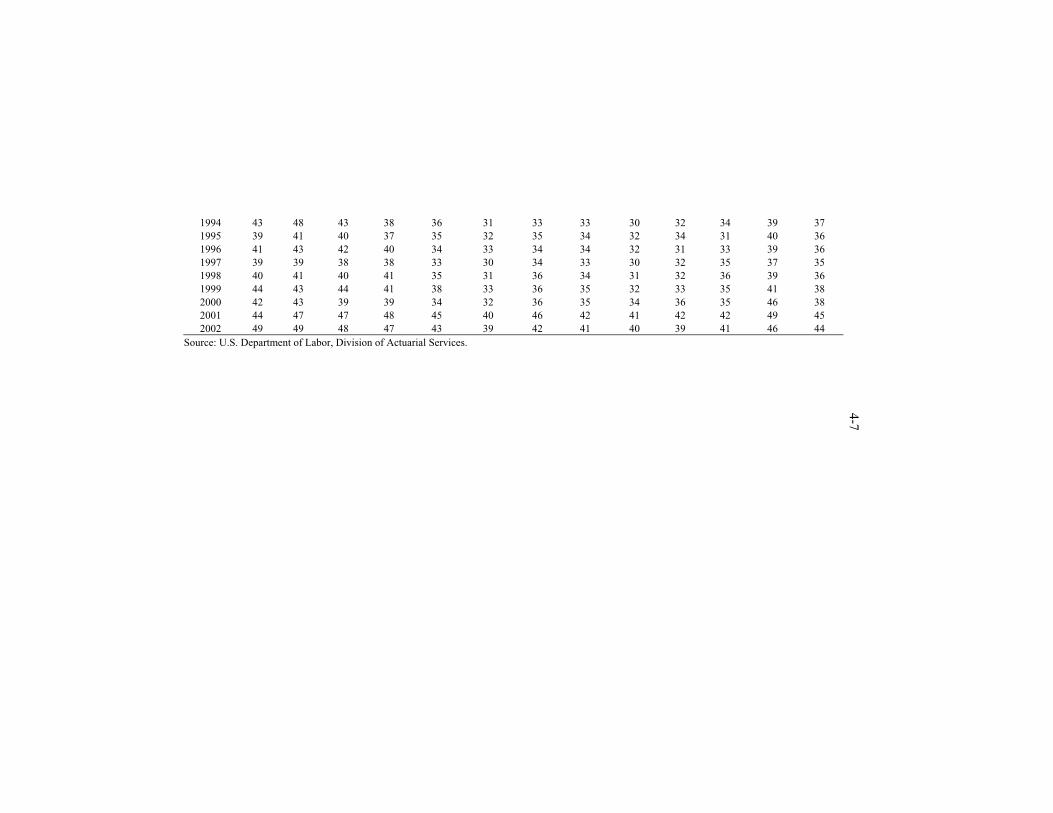
1994 43 48 43 38 36 31 33 33 30 32 34 39 37 1995 39 41 40 37 35 32 35 34 32 34 31 40 36 1996 41 43 42 40 34 33 34 34 32 31 33 39 36 1997 39 39 38 38 33 30 34 33 30 32 35 37 35 1998 40 41 40 41 35 31 36 34 31 32 36 39 36 1999 44 43 44 41 38 33 36 35 32 33 35 41 38 2000 42 43 39 39 34 32 36 35 34 36 35 46 38 2001 44 47 47 48 45 40 46 42 41 42 42 49 45 2002 49 49 48 47 43 39 42 41 40 39 41 46 44
Source: U.S. Department of Labor, Division of Actuarial Services.
4-7
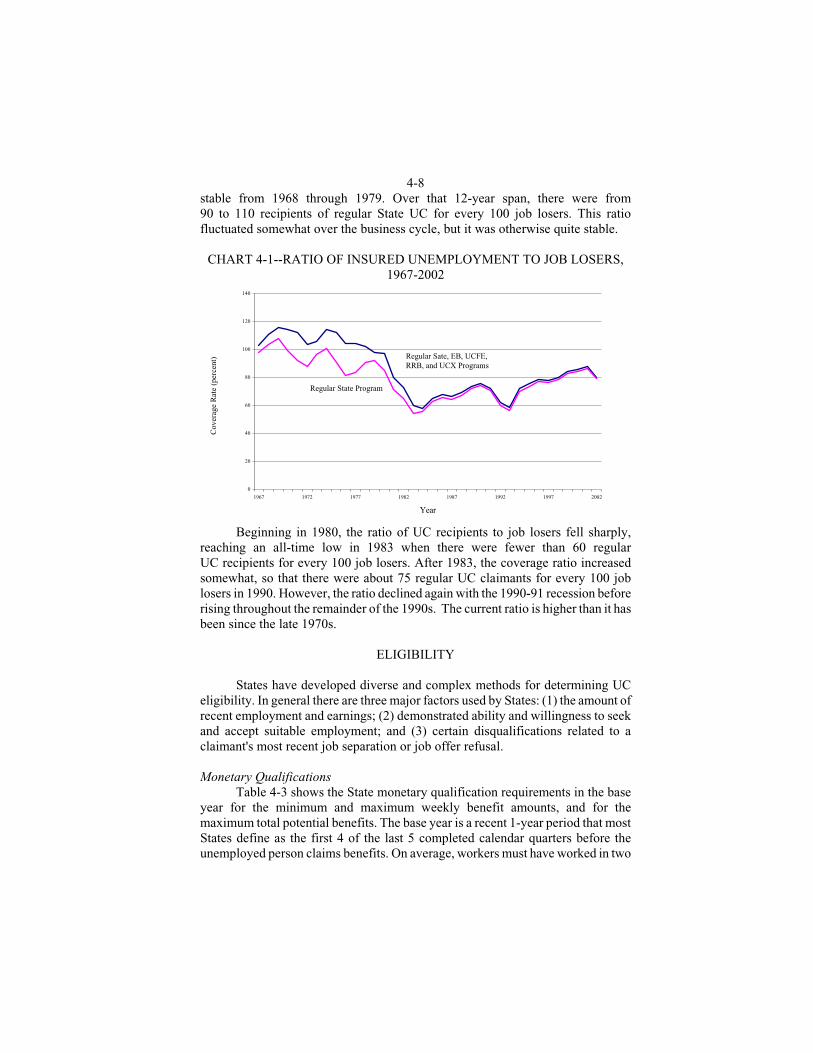
4-8 stable from 1968 through 1979. Over that 12-year span, there were from 90 to 110 recipients of regular State UC for every 100 job losers. This ratio fluctuated somewhat over the business cycle, but it was otherwise quite stable.
CHART 4-1--RATIO OF INSURED UNEMPLOYMENT TO JOB LOSERS, 1967-2002
0
20
40
60
80
100
120
140
1967 1972 1977 1982 1987 1992 1997 2002
Year
Beginning in 1980, the ratio of UC recipients to job losers fell sharply, reaching an all-time low in 1983 when there were fewer than 60 regular UC recipients for every 100 job losers. After 1983, the coverage ratio increased somewhat, so that there were about 75 regular UC claimants for every 100 job losers in 1990. However, the ratio declined again with the 1990-91 recession before rising throughout the remainder of the 1990s. The current ratio is higher than it has been since the late 1970s.
ELIGIBILITY States have developed diverse and complex methods for determining UC eligibility. In general there are three major factors used by States: (1) the amount of recent employment and earnings; (2) demonstrated ability and willingness to seek and accept suitable employment; and (3) certain disqualifications related to a claimant's most recent job separation or job offer refusal. Monetary Qualifications Table 4-3 shows the State monetary qualification requirements in the base year for the minimum and maximum weekly benefit amounts, and for the maximum total potential benefits. The base year is a recent 1-year period that most States define as the first 4 of the last 5 completed calendar quarters before the unemployed person claims benefits. On average, workers must have worked in two
Cov
erag
e R
ate
(per
cent
) Regular Sate, EB, UCFE, RRB, and UCX Programs
Regular State Program
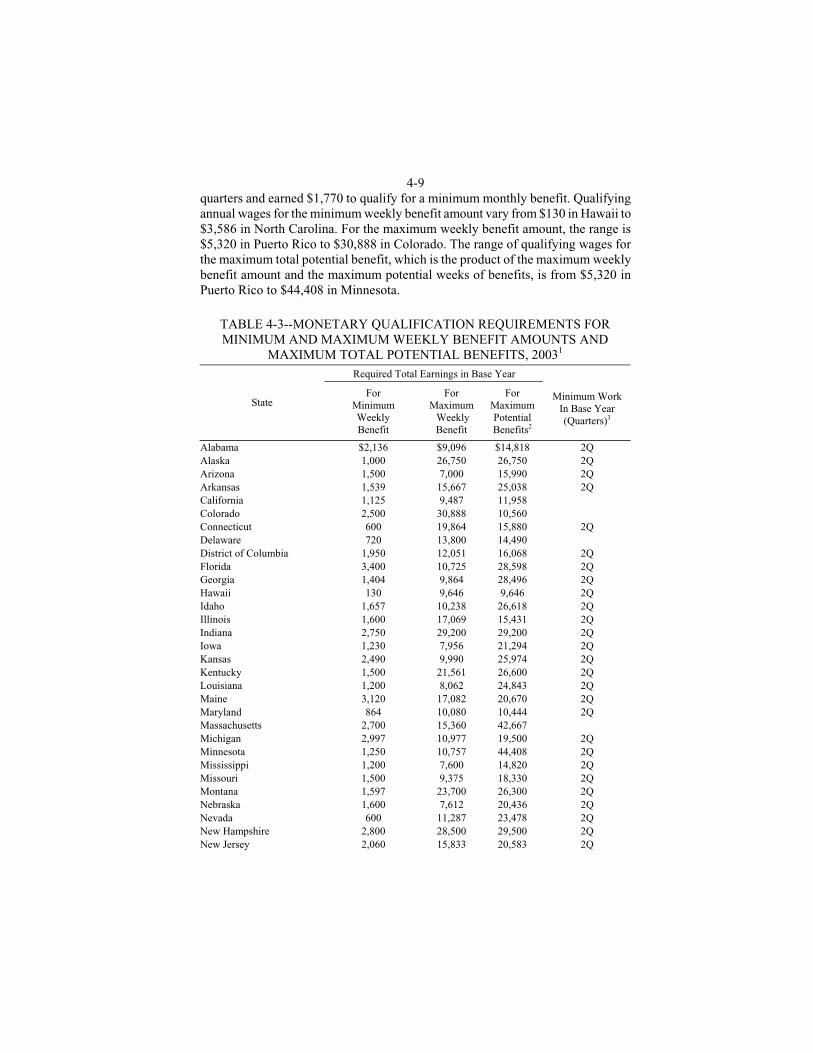
4-9 quarters and earned $1,770 to qualify for a minimum monthly benefit. Qualifying annual wages for the minimum weekly benefit amount vary from $130 in Hawaii to $3,586 in North Carolina. For the maximum weekly benefit amount, the range is $5,320 in Puerto Rico to $30,888 in Colorado. The range of qualifying wages for the maximum total potential benefit, which is the product of the maximum weekly benefit amount and the maximum potential weeks of benefits, is from $5,320 in Puerto Rico to $44,408 in Minnesota.
TABLE 4-3--MONETARY QUALIFICATION REQUIREMENTS FOR MINIMUM AND MAXIMUM WEEKLY BENEFIT AMOUNTS AND
MAXIMUM TOTAL POTENTIAL BENEFITS, 20031 Required Total Earnings in Base Year
State For
Minimum Weekly Benefit
For Maximum Weekly Benefit
For Maximum Potential Benefits2
Minimum Work
In Base Year (Quarters)3
Alabama $2,136 $9,096 $14,818 2Q Alaska 1,000 26,750 26,750 2Q Arizona 1,500 7,000 15,990 2Q Arkansas 1,539 15,667 25,038 2Q California 1,125 9,487 11,958 Colorado 2,500 30,888 10,560 Connecticut 600 19,864 15,880 2Q Delaware 720 13,800 14,490 District of Columbia 1,950 12,051 16,068 2Q Florida 3,400 10,725 28,598 2Q Georgia 1,404 9,864 28,496 2Q Hawaii 130 9,646 9,646 2Q Idaho 1,657 10,238 26,618 2Q Illinois 1,600 17,069 15,431 2Q Indiana 2,750 29,200 29,200 2Q Iowa 1,230 7,956 21,294 2Q Kansas 2,490 9,990 25,974 2Q Kentucky 1,500 21,561 26,600 2Q Louisiana 1,200 8,062 24,843 2Q Maine 3,120 17,082 20,670 2Q Maryland 864 10,080 10,444 2Q Massachusetts 2,700 15,360 42,667 Michigan 2,997 10,977 19,500 2Q Minnesota 1,250 10,757 44,408 2Q Mississippi 1,200 7,600 14,820 2Q Missouri 1,500 9,375 18,330 2Q Montana 1,597 23,700 26,300 2Q Nebraska 1,600 7,612 20,436 2Q Nevada 600 11,287 23,478 2Q New Hampshire 2,800 28,500 29,500 2Q New Jersey 2,060 15,833 20,583 2Q
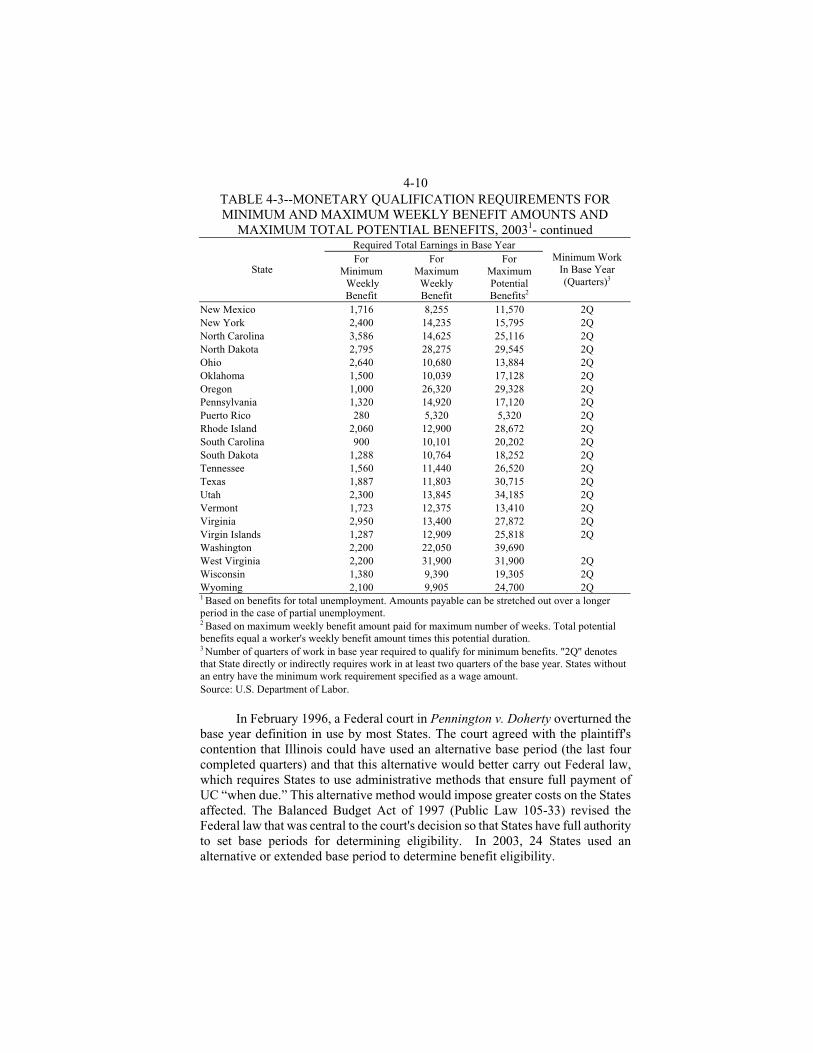
4-10 TABLE 4-3--MONETARY QUALIFICATION REQUIREMENTS FOR MINIMUM AND MAXIMUM WEEKLY BENEFIT AMOUNTS AND
MAXIMUM TOTAL POTENTIAL BENEFITS, 20031- continued Required Total Earnings in Base Year
State For
Minimum Weekly Benefit
For Maximum
Weekly Benefit
For Maximum Potential Benefits2
Minimum Work In Base Year (Quarters)3
New Mexico 1,716 8,255 11,570 2Q New York 2,400 14,235 15,795 2Q North Carolina 3,586 14,625 25,116 2Q North Dakota 2,795 28,275 29,545 2Q Ohio 2,640 10,680 13,884 2Q Oklahoma 1,500 10,039 17,128 2Q Oregon 1,000 26,320 29,328 2Q Pennsylvania 1,320 14,920 17,120 2Q Puerto Rico 280 5,320 5,320 2Q Rhode Island 2,060 12,900 28,672 2Q South Carolina 900 10,101 20,202 2Q South Dakota 1,288 10,764 18,252 2Q Tennessee 1,560 11,440 26,520 2Q Texas 1,887 11,803 30,715 2Q Utah 2,300 13,845 34,185 2Q Vermont 1,723 12,375 13,410 2Q Virginia 2,950 13,400 27,872 2Q Virgin Islands 1,287 12,909 25,818 2Q Washington 2,200 22,050 39,690 West Virginia 2,200 31,900 31,900 2Q Wisconsin 1,380 9,390 19,305 2Q Wyoming 2,100 9,905 24,700 2Q 1 Based on benefits for total unemployment. Amounts payable can be stretched out over a longer period in the case of partial unemployment. 2 Based on maximum weekly benefit amount paid for maximum number of weeks. Total potential benefits equal a worker's weekly benefit amount times this potential duration. 3 Number of quarters of work in base year required to qualify for minimum benefits. "2Q'' denotes that State directly or indirectly requires work in at least two quarters of the base year. States without an entry have the minimum work requirement specified as a wage amount. Source: U.S. Department of Labor. In February 1996, a Federal court in Pennington v. Doherty overturned the base year definition in use by most States. The court agreed with the plaintiff's contention that Illinois could have used an alternative base period (the last four completed quarters) and that this alternative would better carry out Federal law, which requires States to use administrative methods that ensure full payment of UC “when due.” This alternative method would impose greater costs on the States affected. The Balanced Budget Act of 1997 (Public Law 105-33) revised the Federal law that was central to the court's decision so that States have full authority to set base periods for determining eligibility. In 2003, 24 States used an alternative or extended base period to determine benefit eligibility.

4-11 From 1999 to 2003, 12 States increased the required earnings in the base year to qualify for the minimum weekly benefit amount, and 7 States decreased it. Thirty States increased, 16 remained the same, and 7decreased the qualification requirement for the maximum weekly benefit amount. Forty-two States increased and one decreased their qualification requirements for maximum potential benefits. Ability to Work and Availability for Work All State laws provide that a claimant must be both able to work and available for work. A claimant must meet these conditions continually to receive benefits. Only minor variations exist in State laws setting forth the requirements concerning “ability to work.” A few States specify that a claimant must be mentally and physically able to work. “Available for work” is translated to mean being ready, willing, and able to work. In addition to registration for work at a local employment office, most State laws require that a claimant seek work actively or make a reasonable effort to obtain work. Generally, a person may not refuse an offer of, or referral to, “suitable work” without good cause. Most State laws list certain criteria by which the “suitability” of a work offer is to be tested. The usual criteria include the degree of risk to a claimant's health, safety, and morals; the physical fitness and prior training, experience, and earnings of the person; the length of unemployment and prospects for securing local work in a customary occupation; and the distance of the available work from the claimant's residence. Generally, as the length of unemployment increases, the claimant is required to accept a wider range of jobs. In addition, Federal law requires States to deny benefits provided under the Extended Benefits Program (see below) to any individual who fails to accept work that is offered in writing or is listed with the State Employment Service, or who fails to apply for any work to which he is referred by the State agency, if the work: (1) is within the person's capabilities; (2) pays wages equal to the highest of the Federal or any State or local minimum wage; (3) pays a gross weekly wage that exceeds the person's average weekly unemployment compensation benefits plus any supplemental unemployment compensation (usually private) payable to the individual; and (4) is consistent with the State definition of “suitable” work in other respects. Public Law 102-318 suspended these provisions from March 7, 1993, until January 1, 1995. States must refer extended benefits claimants to any job meeting these requirements. If the State, based on information provided by the individual, determines that the individual's prospects for obtaining work in their customary occupation within a reasonably short period are good, the determination of whether any work is “suitable work” is made in accordance with State law rather than the criteria outlined above. There are certain circumstances under which Federal law provides that State and extended benefits may not be denied. A State may not deny benefits to an

4-12 otherwise eligible individual for refusing to accept new work under any of the following conditions: (1) if the position offered is vacant directly due to a strike, lockout, or other labor dispute; (2) if the wages, hours, or other conditions of the work offered are substantially less favorable to the individual than those prevailing for similar work in the locality; or (3) if, as a condition of being employed, the individual would be required to join a union or to resign from or refrain from joining any bona fide labor organization. Benefits may not be denied solely on the grounds of pregnancy. The State is prohibited from canceling wage credits or totally denying benefits except in cases of misconduct, fraud, or receipt of disqualifying income. There are also certain conditions under which Federal law requires that benefits be denied. For example, benefits must be denied to professional and administrative employees of educational institutions during summer (and other vacation periods) if they have a reasonable assurance of reemployment; to professional athletes between sport seasons; and to aliens not permitted to work in the United States. Disqualifications The major causes for disqualification from benefits are not being able to work or available for work, voluntary separation from work without good cause, discharge for misconduct connected with the work, refusal of suitable work without good cause, and unemployment resulting from a labor dispute. Disqualification for one of these reasons may result in a postponement of benefits for some prescribed period, a cancellation of benefit rights, or a reduction of benefits otherwise payable. Of the 20.5 million “monetarily eligible” initial UC claims in 2002, 24.1 percent were disqualified. This figure subdivides into 4.0 percent not being able to work or available for work, 6.4 percent voluntarily leaving a job without good cause, 4.8 percent being fired for misconduct on the job, 0.2 percent refusing suitable work, and 8.7 percent committing other disqualifying acts. The total disqualification rate ranged from a low of 12.0 percent in Tennessee to a high of 102.0 percent in Nebraska, with Colorado the next highest at 94.1 percent. (Note - that a claimant can be disqualified for any week claimed, so it is possible for a claimant to be disqualified more times than the total number of that claimant's initial claims in the benefit year.) Federal law requires that benefits provided under the Extended Benefits Program be denied to an individual for the entire spell of his unemployment if he was disqualified from receiving State benefits because of voluntarily leaving employment, discharge for misconduct, or refusal of suitable work. These benefits will be denied even if the disqualification were subsequently lifted with respect to the State benefits prior to reemployment. The person could receive extended benefits, however, if the disqualification were lifted because he became reemployed and met the work or wage requirement of State law. Public Law 102-318 suspended the restrictions on extended benefits under Federal law, however, from
4-13 March 7, 1993, until January 1, 1995. The Advisory Council on Unemployment Compensation was required to study these provisions, and it recommended that the Federal rules be eliminated. However, Congress has taken no action on this recommendation. U.S. Department of Labor Proposal to Use Unemployment Compensation Benefits for Family Leave On December 3, 1999, the U.S. Department of Labor (DOL) issued a Notice of Proposed Rulemaking to create, by regulation, a voluntary experimental program that would give States the option of extending UC eligibility to parents who take time off from employment after the birth or placement for adoption of a child under the Family Medical Leave Act of 1993 (Public Law 103-3). The program is referred to as the birth and adoption UC experiment, also known colloquially as “baby UI.” The proposal immediately drew criticism from opponents who argued that the proposal creates a benefit that the Congress did not intend when it created the Family and Medical Leave Act and such benefits would be contrary to the purpose of UC benefits as stated in the law. Some opponents argued that the proposal could not be implemented without a new law being enacted by the Congress. DOL disagreed with this assessment and cited the fact that much of the basic structure of the UC system, including the requirement that individuals be able and available for work, was established by regulatory guidance, rather than statute. DOL also suggested the change was needed to allow the UC system to keep pace with the changing nature of the work force, particularly the dramatic increase in the number of working mothers. The final rule was published in the Federal Register on June 13, 2000. On December 4, 2002, the Bush Administration reviewed the rule. As a result of the review, DOL concluded that the BAA-UC experiment was “poor policy and a misapplication of federal UC law relating to” the requirements that beneficiaries be able and available for work. Since no State had enacted a BAA-UC program, DOL determined that terminating the experiment would not result in any State withdrawing benefits it had previously granted. According to DOL, the only effect of the removal of the regulations would be that would reduce State flexibility since a State could no longer elect to use its unemployment fund to pay BAA-UC. A final decision by DOL repealing this rule was issued on October 9, 2003, and goes into effect November 10, 2003. Ex-Service Members The Emergency Unemployment Compensation Act of 1991 (Public Law 102-164) provided that ex-members of the military be treated the same as other unemployed workers with respect to the waiting period for benefits and benefit duration. Before this 1991 action, Congress had placed restrictions on benefits for ex-service members, so that the maximum number of weeks of benefits an ex-service member could receive based on employment in the military was 13 (as compared with 26 weeks under the regular UC Program for civilian workers). In
4-14 addition to a number of restrictive eligibility requirements, ex-service members had to wait 4 weeks from the date of their separation from the service before they could receive benefits. Pension Offset The Unemployment Compensation Amendments of 1976 (Public Law 94-566) required all States to reduce an individual's UC by the amount of any government or private pension or retirement pay received by the individual. Public Law 96-364, enacted in 1980, modified this offset requirement. Under the modified provision, States are required to make the offset only in those cases in which the work-related pension was maintained or contributed to by a “base period” or “chargeable” employer. Entitlement to and the amount and duration of unemployment benefits are based on work performed during this State-specified base period. A “chargeable” employer is one whose account will be charged for UC received by the individual. However, the offset must be applied for Social Security benefits without regard to whether base period employment contributed to the Social Security entitlement. States are allowed to reduce the amount of these offsets by amounts consistent with any contributions the employee made toward the pension. This policy allows States to limit the offset to one-half of the amount of a Social Security benefit received by an individual who qualifies for unemployment benefits. Taxation of Unemployment Compensation Benefits The Tax Reform Act of 1986 (Public Law 99-514) made all UC taxable after December 31, 1986. The Revenue Act of 1978 first made a portion of UC benefits taxable beginning January 1, 1979. Table 4-4 illustrates the projected effect of taxing all UC benefits for the 2003 tax law using 2000 population and incomes. This table understates the impact of taxation because this analysis uses data collected from a sample of households for the Current Population Survey (CPS), which is known to have a problem with respondents underestimating their annual income from various sources. In particular, total UC benefits reported in the CPS are equal to about two-thirds of benefits actually paid out. Because of this underreporting of UC benefits in the CPS and, consequently, underestimates of benefits paid in 2003, taxes collected on benefits probably will be about twice as high as the $2.0 billion shown in Table 4-4.
AMOUNT AND DURATION OF WEEKLY BENEFITS
In general, the States set weekly benefit amounts as a fraction of the individual's average weekly wage up to some State-determined maximum. The total maximum duration available nationwide under permanent law is 39 weeks. The regular State programs usually provide up to 26 weeks. The permanent Federal-State Extended Benefits Program provides up to 13 additional weeks in
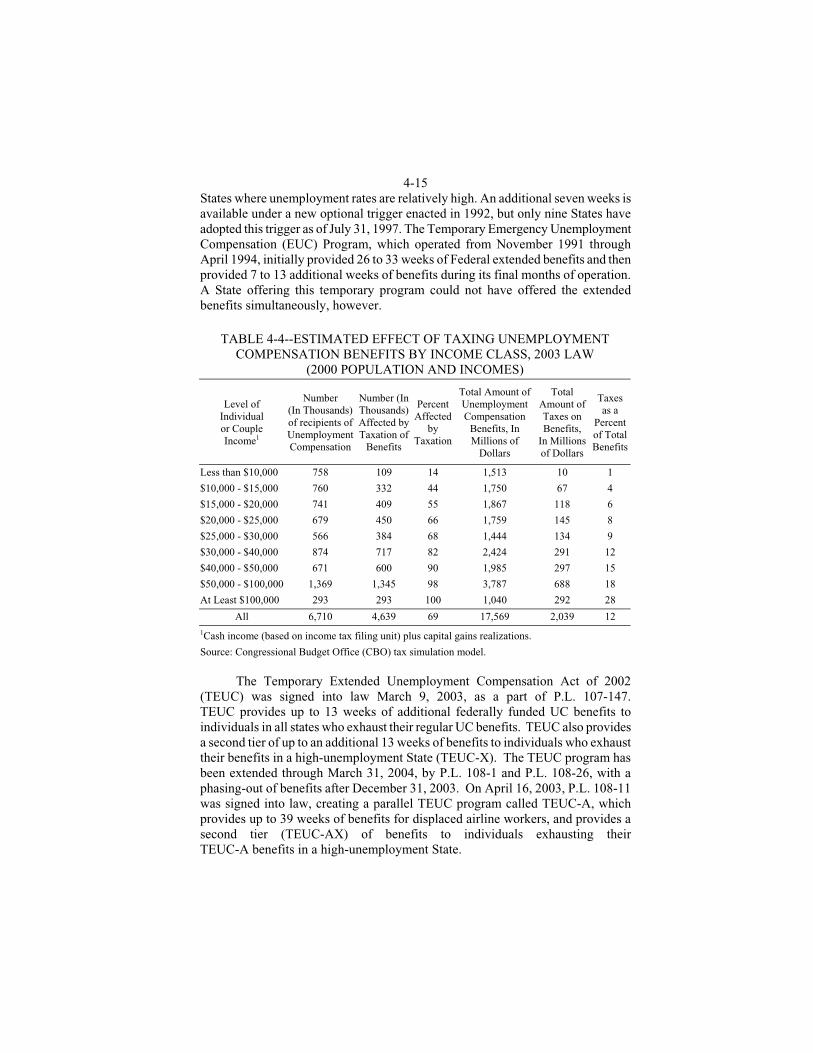
4-15 States where unemployment rates are relatively high. An additional seven weeks is available under a new optional trigger enacted in 1992, but only nine States have adopted this trigger as of July 31, 1997. The Temporary Emergency Unemployment Compensation (EUC) Program, which operated from November 1991 through April 1994, initially provided 26 to 33 weeks of Federal extended benefits and then provided 7 to 13 additional weeks of benefits during its final months of operation. A State offering this temporary program could not have offered the extended benefits simultaneously, however.
TABLE 4-4--ESTIMATED EFFECT OF TAXING UNEMPLOYMENT COMPENSATION BENEFITS BY INCOME CLASS, 2003 LAW
(2000 POPULATION AND INCOMES)
Level of Individual or Couple Income1
Number (In Thousands) of recipients of Unemployment Compensation
Number (In Thousands) Affected by Taxation of
Benefits
Percent Affected
by Taxation
Total Amount of Unemployment Compensation
Benefits, In Millions of
Dollars
Total Amount of Taxes on Benefits,
In Millions of Dollars
Taxes as a
Percent of Total Benefits
Less than $10,000 758 109 14 1,513 10 1
$10,000 - $15,000 760 332 44 1,750 67 4
$15,000 - $20,000 741 409 55 1,867 118 6
$20,000 - $25,000 679 450 66 1,759 145 8
$25,000 - $30,000 566 384 68 1,444 134 9
$30,000 - $40,000 874 717 82 2,424 291 12
$40,000 - $50,000 671 600 90 1,985 297 15
$50,000 - $100,000 1,369 1,345 98 3,787 688 18
At Least $100,000 293 293 100 1,040 292 28
All 6,710 4,639 69 17,569 2,039 12 1Cash income (based on income tax filing unit) plus capital gains realizations.
Source: Congressional Budget Office (CBO) tax simulation model.
The Temporary Extended Unemployment Compensation Act of 2002 (TEUC) was signed into law March 9, 2003, as a part of P.L. 107-147. TEUC provides up to 13 weeks of additional federally funded UC benefits to individuals in all states who exhaust their regular UC benefits. TEUC also provides a second tier of up to an additional 13 weeks of benefits to individuals who exhaust their benefits in a high-unemployment State (TEUC-X). The TEUC program has been extended through March 31, 2004, by P.L. 108-1 and P.L. 108-26, with a phasing-out of benefits after December 31, 2003. On April 16, 2003, P.L. 108-11 was signed into law, creating a parallel TEUC program called TEUC-A, which provides up to 39 weeks of benefits for displaced airline workers, and provides a second tier (TEUC-AX) of benefits to individuals exhausting their TEUC-A benefits in a high-unemployment State.
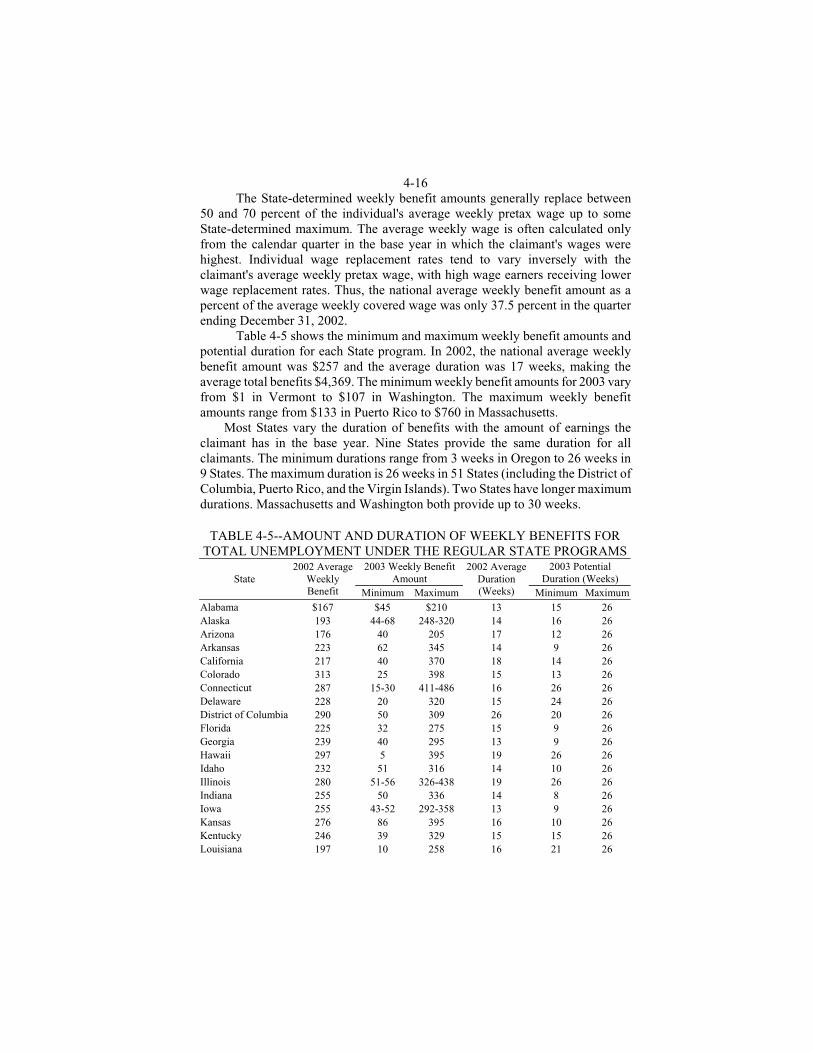
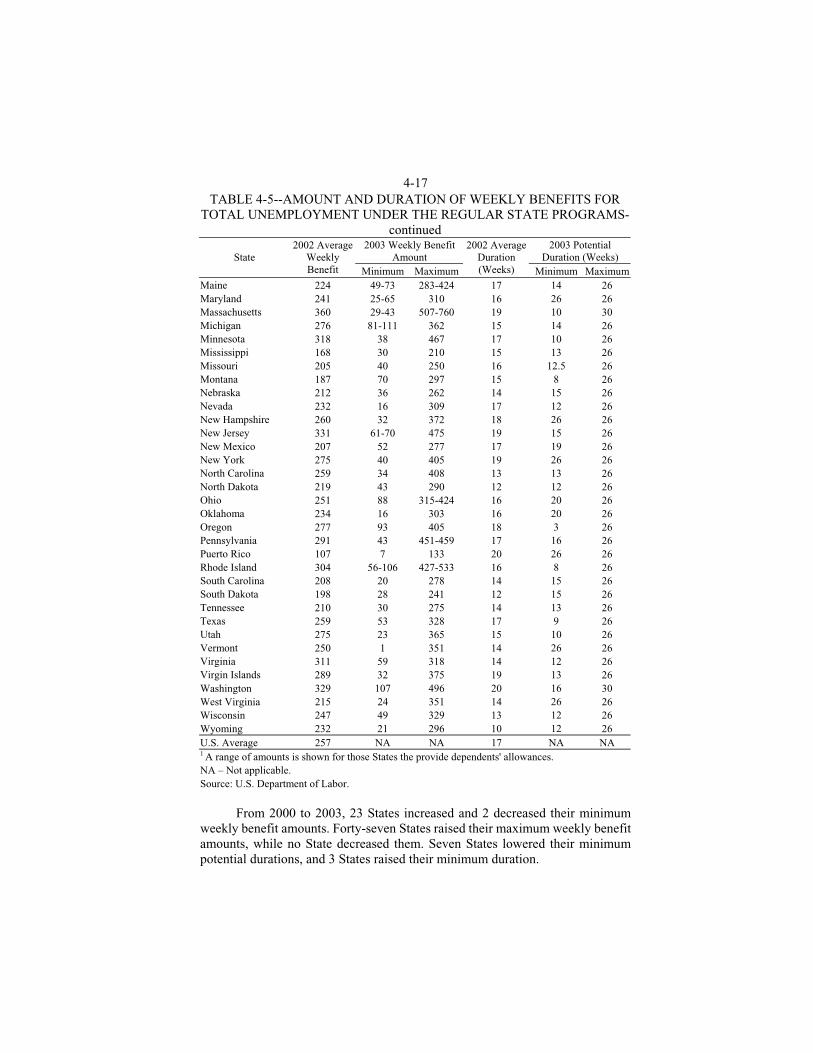
4-16 The State-determined weekly benefit amounts generally replace between 50 and 70 percent of the individual's average weekly pretax wage up to some State-determined maximum. The average weekly wage is often calculated only from the calendar quarter in the base year in which the claimant's wages were highest. Individual wage replacement rates tend to vary inversely with the claimant's average weekly pretax wage, with high wage earners receiving lower wage replacement rates. Thus, the national average weekly benefit amount as a percent of the average weekly covered wage was only 37.5 percent in the quarter ending December 31, 2002. Table 4-5 shows the minimum and maximum weekly benefit amounts and potential duration for each State program. In 2002, the national average weekly benefit amount was $257 and the average duration was 17 weeks, making the average total benefits $4,369. The minimum weekly benefit amounts for 2003 vary from $1 in Vermont to $107 in Washington. The maximum weekly benefit amounts range from $133 in Puerto Rico to $760 in Massachusetts. Most States vary the duration of benefits with the amount of earnings the claimant has in the base year. Nine States provide the same duration for all claimants. The minimum durations range from 3 weeks in Oregon to 26 weeks in 9 States. The maximum duration is 26 weeks in 51 States (including the District of Columbia, Puerto Rico, and the Virgin Islands). Two States have longer maximum durations. Massachusetts and Washington both provide up to 30 weeks.
TABLE 4-5--AMOUNT AND DURATION OF WEEKLY BENEFITS FOR TOTAL UNEMPLOYMENT UNDER THE REGULAR STATE PROGRAMS
2003 Weekly Benefit Amount
2003 Potential Duration (Weeks) State
2002 Average Weekly Benefit Minimum Maximum
2002 Average Duration (Weeks) Minimum Maximum
Alabama $167 $45 $210 13 15 26 Alaska 193 44-68 248-320 14 16 26 Arizona 176 40 205 17 12 26 Arkansas 223 62 345 14 9 26 California 217 40 370 18 14 26 Colorado 313 25 398 15 13 26 Connecticut 287 15-30 411-486 16 26 26 Delaware 228 20 320 15 24 26 District of Columbia 290 50 309 26 20 26 Florida 225 32 275 15 9 26 Georgia 239 40 295 13 9 26 Hawaii 297 5 395 19 26 26 Idaho 232 51 316 14 10 26 Illinois 280 51-56 326-438 19 26 26 Indiana 255 50 336 14 8 26 Iowa 255 43-52 292-358 13 9 26 Kansas 276 86 395 16 10 26 Kentucky 246 39 329 15 15 26 Louisiana 197 10 258 16 21 26
4-17 TABLE 4-5--AMOUNT AND DURATION OF WEEKLY BENEFITS FOR
TOTAL UNEMPLOYMENT UNDER THE REGULAR STATE PROGRAMS-continued
2003 Weekly Benefit Amount
2003 Potential Duration (Weeks) State
2002 Average Weekly Benefit Minimum Maximum
2002 Average Duration (Weeks) Minimum Maximum
Maine 224 49-73 283-424 17 14 26 Maryland 241 25-65 310 16 26 26 Massachusetts 360 29-43 507-760 19 10 30 Michigan 276 81-111 362 15 14 26 Minnesota 318 38 467 17 10 26 Mississippi 168 30 210 15 13 26 Missouri 205 40 250 16 12.5 26 Montana 187 70 297 15 8 26 Nebraska 212 36 262 14 15 26 Nevada 232 16 309 17 12 26 New Hampshire 260 32 372 18 26 26 New Jersey 331 61-70 475 19 15 26 New Mexico 207 52 277 17 19 26 New York 275 40 405 19 26 26 North Carolina 259 34 408 13 13 26 North Dakota 219 43 290 12 12 26 Ohio 251 88 315-424 16 20 26 Oklahoma 234 16 303 16 20 26 Oregon 277 93 405 18 3 26 Pennsylvania 291 43 451-459 17 16 26 Puerto Rico 107 7 133 20 26 26 Rhode Island 304 56-106 427-533 16 8 26 South Carolina 208 20 278 14 15 26 South Dakota 198 28 241 12 15 26 Tennessee 210 30 275 14 13 26 Texas 259 53 328 17 9 26 Utah 275 23 365 15 10 26 Vermont 250 1 351 14 26 26 Virginia 311 59 318 14 12 26 Virgin Islands 289 32 375 19 13 26 Washington 329 107 496 20 16 30 West Virginia 215 24 351 14 26 26 Wisconsin 247 49 329 13 12 26 Wyoming 232 21 296 10 12 26 U.S. Average 257 NA NA 17 NA NA 1 A range of amounts is shown for those States the provide dependents' allowances. NA – Not applicable. Source: U.S. Department of Labor.
From 2000 to 2003, 23 States increased and 2 decreased their minimum weekly benefit amounts. Forty-seven States raised their maximum weekly benefit amounts, while no State decreased them. Seven States lowered their minimum potential durations, and 3 States raised their minimum duration.
4-18
EXTENDED BENEFITS
The Federal-State Extended Benefits Program is available in every State and provides one-half of a claimant's total State benefits up to 13 weeks in States with an activated program, for a combined maximum of 39 weeks of regular and extended benefits. Weekly benefit amounts are identical to the regular State UC benefits for each claimant, and Federal funds pay half the cost. The program activates in a State under one of two conditions: (1) if the State's 13-week average insured unemployment rate (IUR) in the most recent 13 weeks is at least 5.0 percent and at least 120 percent of the average of its 13-week IURs in the last 2 years for the same 13-week calendar period; or (2) at State option, if its current 13-week average IUR is at least 6.0 percent. All but 12 State programs have adopted the second, optional condition. The 13-week average IUR is calculated from the ratio of the average number of insured unemployed persons under the regular State programs in the last 13 weeks to the average covered employment in the first four of the last five completed calendar quarters. In addition to the two automatic triggers, States have the option of electing an alternative trigger authorized by the Unemployment Compensation Amendments of 1992 (Public Law 102-318). This trigger is based on a 3-month average total unemployment rate (TUR) using seasonally adjusted data. If this TUR average exceeds 6.5 percent and is at least 110 percent of the same measure in either of the prior 2 years, a State can offer 13 weeks of EB. If the average TUR exceeds 8 percent and meets the same 110-percent test, 20 weeks of EB can be offered. Analysis of historical data shows that this TUR trigger would have made EB more widely available in the past than did the IUR trigger. As of July 5, 2003, the TUR trigger had been authorized by nine States (Alaska, Connecticut, Kansas, New Hampshire, North Carolina, Oregon, Rhode Island, Vermont, and Washington). As of July 2003, EB is active in three States.
BENEFIT EXHAUSTION
Due to the limited duration of UC benefits, some individuals exhaust their benefits. For the regular State programs, 4.4 million individuals exhausted their benefits during 12 months ending June 30, 2003, or 43.6 percent of claimants who began receiving UC during the 12 months ending December 2002. A study of exhaustees was completed in September 1990 by Corson and Dynarski, under contract to the U.S. Department of Labor. The purpose of this study was to examine the characteristics and behavior of exhaustees and nonexhaustees and to explore the implications of this information. The samples were chosen from individuals who began collecting benefits during the period October 1987 through September 1988. Overall, 1,920 exhaustees and 1,009 nonexhaustees were interviewed. The study's authors reached three general conclusions:
4-19 1. A large proportion of UC recipients expected to be recalled to their
previous jobs. The unemployment spells of these job-attached workers were considerably shorter than those of workers who suffered permanent job losses, and few job-attached workers exhausted their UC benefits. Workers who were not job-attached—in particular, workers who were dislocated from their previous jobs or who had low skill levels—were likely to experience long unemployment spells, and a significant proportion of these workers exhausted their UC benefits.
2. Most workers who exhausted their benefits were still unemployed more than a month after receiving their final payment, and a majority were still unemployed 2 months after receiving their final payment. Moreover, workers who found jobs after exhausting their UC benefits were generally receiving lower wages than on their prior jobs.
3. State exhaustion rate trigger mechanisms would not be clearly superior to the State IUR triggers in targeting extended benefits to areas with high cyclical unemployment. Substate trigger mechanisms for extended benefits would do a poor job of targeting extended benefits to local areas with high structural unemployment.
SUPPLEMENTAL BENEFITS
The Extended Benefits (EB) Program was enacted to provide unemployment compensation benefits to workers who had exhausted their regular benefits during periods of high unemployment. Before enactment of a permanent EB Program, Congress authorized two temporary programs, during 1958 and 1959 and again in 1961 and 1962. The Federal-State Extended Unemployment Compensation Act of 1970 authorized a permanent mechanism for providing extended benefits. Extended benefits rules were amended by the Omnibus Budget Reconciliation Act of 1981 (Public Law 97-35) and the Unemployment Compensation Amendments of 1992 (Public Law 102-318). During the 1970s and 1980s, temporary programs provided supplemental benefits to UC recipients who had exhausted both their regular and extended benefits during three periods of high unemployment: (1) the Emergency Unemployment Compensation Act of 1971, which provided benefits until March 31, 1973; (2) the Federal Supplemental Benefits Program, first authorized by the Emergency Unemployment Compensation Act of 1974, and subsequently extended in 1975 (twice) and in 1977; and (3) the Federal Supplemental Compensation Program, created by the Tax Equity and Fiscal Responsibility Act of 1982, which was subsequently extended and modified six times and finally expired on June 30, 1985. In the 1990s, Congress passed the Emergency Unemployment Compensation Act of 1991 (Public Law 102-164) authorizing a temporary Emergency Unemployment Compensation (EUC) Program. The EUC Program, which was extended four times, effectively superseded the EB Program and entitled
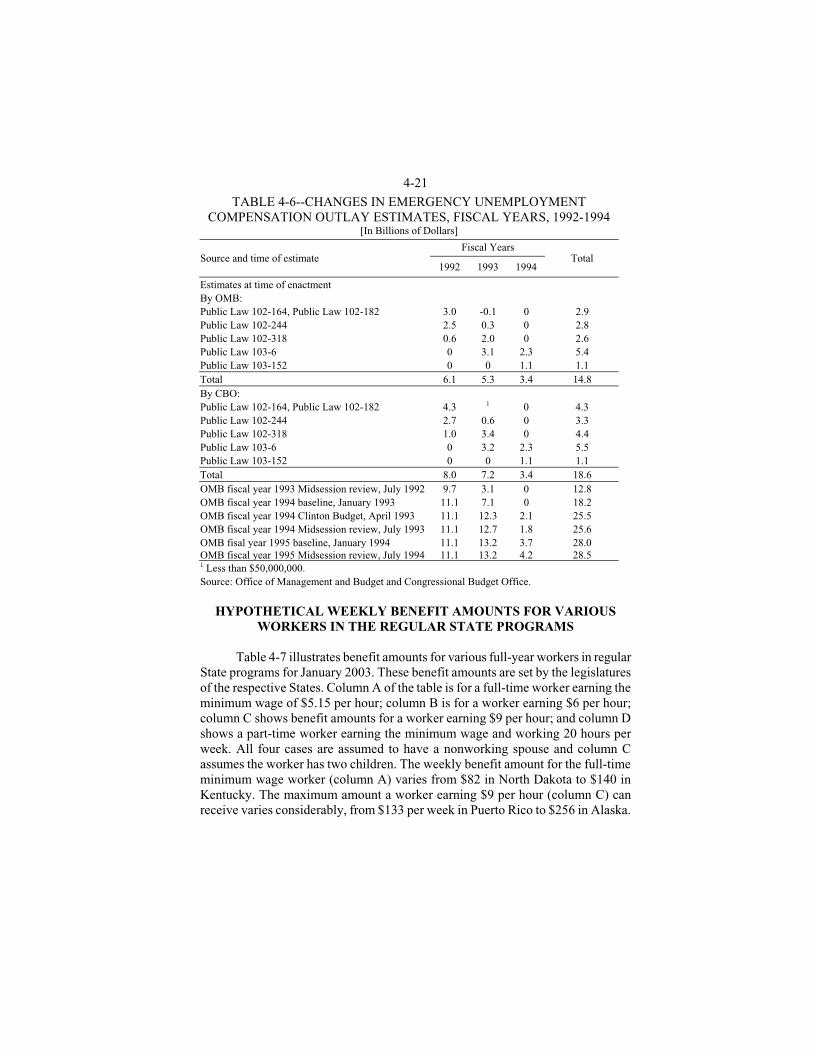
4-20 individuals whose regular unemployment compensation benefits had run out to additional weeks of assistance. At its peak in 1992, the EUC Program provided benefits for 26 or 33 weeks, depending on the level of unemployment in the respective States. The EUC Program ended on April 30, 1994. Benefits under the EUC Program were originally financed from spending authority in the Extended Unemployment Compensation Account (EUCA) of the Unemployment Trust Fund. However, depletion of EUCA led Congress to fund EUC from general revenues from July 1992 to October 1993. States that qualified for extended benefits while EUC was in effect could elect to trigger off extended benefits. This reduced the State funding burden because 50 percent of extended benefit costs are financed from State UC accounts while EUC was entirely federally funded. Table 4-6 shows several estimates of the cost of the EUC Program at different points in time. A comparison of cost estimates at the time of enactment with later reviews shows that actual costs far exceeded anticipated costs due to three factors: exhaustions from the regular State program were unexpectedly near record levels; claimants were staying on EUC longer than expected; and large numbers of claimants eligible for both regular benefits and EUC were choosing EUC. As a result, for the periods fiscal year 1992 and fiscal year 1993 alone, the Office of Management and Budget (OMB) cost estimates rose from $11.4 billion on the dates of enactment to $12.8 billion in July 1992, $18.2 billion in January 1993, $23.4 billion in April 1993, $23.8 billion in July 1993, and finally $24.3 billion in January 1994—113 percent higher than originally estimated. Including fiscal year 1994 costs, the Clinton administration's budget released in July 1994 estimated the final 3-year cost of EUC benefits to be $28.5 billion, $13.7 billion more than OMB and $9.9 billion more than CBO had estimated on the date of enactment. Most recently, Congress enacted the Temporary Extended Unemployment Compensation Act of 2002 (TEUC), signed into law March 9, 2002, as part of P.L. 107-147. TEUC provides up to 13 weeks of additional federally funded benefits to individuals in all States who exhaust their regular UC benefits. TEUC also provides a second tier of 13 weeks of benefits to individuals who exhaust their benefits in a high-unemployment state (TEUC-X). On January 8, 2003, Congress passed S. 23 (P.L. 108-1) extending the TEUC program through August 30, 2003, and phasing-out benefits after May 31, 2003. On April 16, 2003, P.L. 108-11 was signed into law, creating a parallel TEUC program called TEUC-A. TEUC-A provides up to 39 weeks of benefits for displaced airline and related workers, and provides a second tier (TEUC-AX) of benefits to individuals exhausting their TEUC-A benefits in a high-unemployment state. The Congress passed H.R. 2185, extending the TEUC program through March 31, 2004, and the President signed the bill into law on May 28, 2003 (P.L. 108-26).
4-21
TABLE 4-6--CHANGES IN EMERGENCY UNEMPLOYMENT COMPENSATION OUTLAY ESTIMATES, FISCAL YEARS, 1992-1994
[In Billions of Dollars]
Fiscal Years Source and time of estimate
1992 1993 1994 Total
Estimates at time of enactment By OMB: Public Law 102-164, Public Law 102-182 3.0 -0.1 0 2.9 Public Law 102-244 2.5 0.3 0 2.8 Public Law 102-318 0.6 2.0 0 2.6 Public Law 103-6 0 3.1 2.3 5.4 Public Law 103-152 0 0 1.1 1.1 Total 6.1 5.3 3.4 14.8 By CBO: Public Law 102-164, Public Law 102-182 4.3 1 0 4.3 Public Law 102-244 2.7 0.6 0 3.3 Public Law 102-318 1.0 3.4 0 4.4 Public Law 103-6 0 3.2 2.3 5.5 Public Law 103-152 0 0 1.1 1.1 Total 8.0 7.2 3.4 18.6 OMB fiscal year 1993 Midsession review, July 1992 9.7 3.1 0 12.8 OMB fiscal year 1994 baseline, January 1993 11.1 7.1 0 18.2 OMB fiscal year 1994 Clinton Budget, April 1993 11.1 12.3 2.1 25.5 OMB fiscal year 1994 Midsession review, July 1993 11.1 12.7 1.8 25.6 OMB fisal year 1995 baseline, January 1994 11.1 13.2 3.7 28.0 OMB fiscal year 1995 Midsession review, July 1994 11.1 13.2 4.2 28.5 1 Less than $50,000,000. Source: Office of Management and Budget and Congressional Budget Office.
HYPOTHETICAL WEEKLY BENEFIT AMOUNTS FOR VARIOUS WORKERS IN THE REGULAR STATE PROGRAMS
Table 4-7 illustrates benefit amounts for various full-year workers in regular State programs for January 2003. These benefit amounts are set by the legislatures of the respective States. Column A of the table is for a full-time worker earning the minimum wage of $5.15 per hour; column B is for a worker earning $6 per hour; column C shows benefit amounts for a worker earning $9 per hour; and column D shows a part-time worker earning the minimum wage and working 20 hours per week. All four cases are assumed to have a nonworking spouse and column C assumes the worker has two children. The weekly benefit amount for the full-time minimum wage worker (column A) varies from $82 in North Dakota to $140 in Kentucky. The maximum amount a worker earning $9 per hour (column C) can receive varies considerably, from $133 per week in Puerto Rico to $256 in Alaska.

4-22 TABLE 4-7--WEEKLY STATE BENEFIT AMOUNTS FOR VARIOUS
FULL-YEAR WORKERS, JANUARY 2003 Hypothetical Worker1
State A B C D
Alabama $112 $130 $195 $56 Alaska 144 158 256 102 Arizona 107 125 187 54 Arkansas 103 120 180 62 California 92 108 161 46 Colorado 124 144 216 62 Connecticut 113 130 210 62 Delaware 116 136 203 58 District of Columbia 103 120 180 52 Florida 103 120 180 52 Georgia 116 136 203 58 Hawaii 128 149 223 64 Idaho 103 120 180 52 Illinois 102 119 178 56 Indiana 125 142 205 71 Iowa 116 136 203 58 Kansas 114 133 199 86 Kentucky 140 163 245 70 Louisiana 107 125 187 54 Maine 132 152 243 73 Maryland 120 138 219 65 Massachusetts 128 145 255 77 Michigan NA NA NA NA Minnesota 103 120 180 52 Mississippi 103 120 180 52 Missouri 107 125 187 54 Montana 107 125 187 70 Nebraska 103 120 180 52 Nevada 107 125 187 54 New Hampshire 118 137 206 59 New Jersey 124 144 216 70 New Mexico 103 120 180 52 New York 103 120 180 52 North Carolina 103 120 180 52 North Dakota 82 96 144 43 Ohio 103 120 180 0 Oklahoma 116 136 203 58 Oregon 134 156 234 93 Pennsylvania 112 130 202 59 Puerto Rico 103 120 133 52 Rhode Island 124 144 216 62 South Carolina 103 120 180 52 South Dakota 103 120 180 52 Tennessee 103 120 180 52 Texas 107 125 187 54 Utah 103 120 180 52
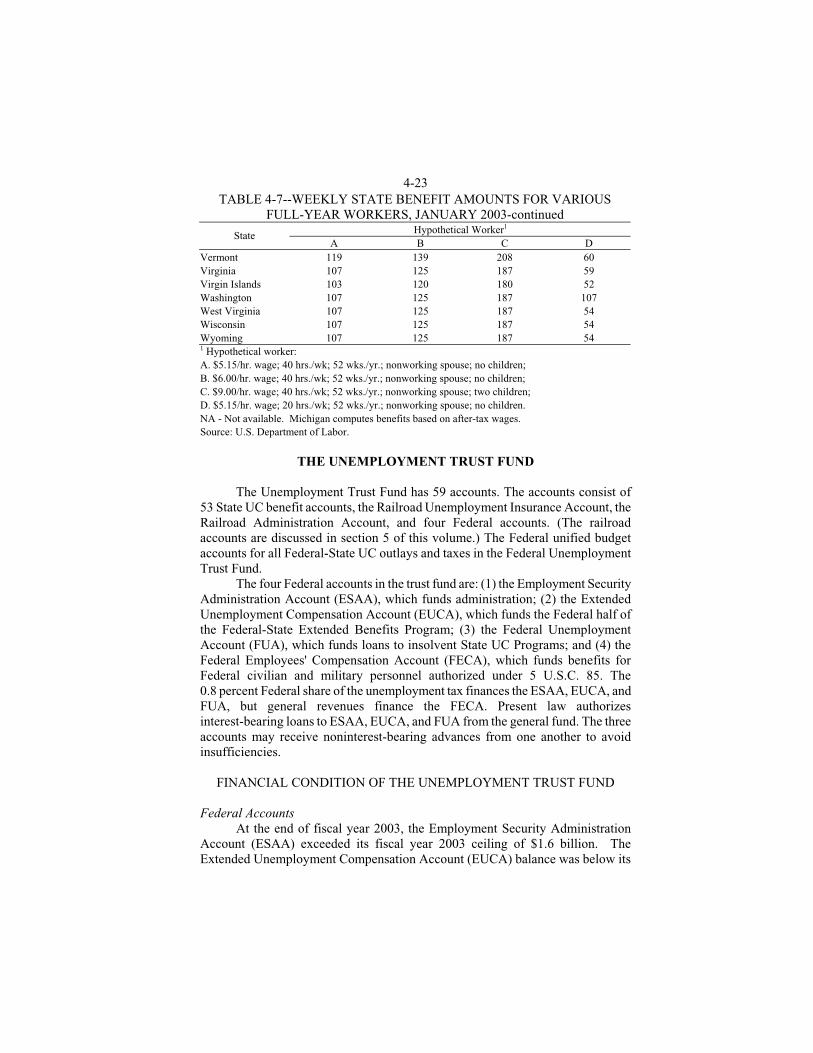
4-23 TABLE 4-7--WEEKLY STATE BENEFIT AMOUNTS FOR VARIOUS
FULL-YEAR WORKERS, JANUARY 2003-continued Hypothetical Worker1 State
A B C D Vermont 119 139 208 60 Virginia 107 125 187 59 Virgin Islands 103 120 180 52 Washington 107 125 187 107 West Virginia 107 125 187 54 Wisconsin 107 125 187 54 Wyoming 107 125 187 54 1 Hypothetical worker: A. $5.15/hr. wage; 40 hrs./wk; 52 wks./yr.; nonworking spouse; no children; B. $6.00/hr. wage; 40 hrs./wk; 52 wks./yr.; nonworking spouse; no children; C. $9.00/hr. wage; 40 hrs./wk; 52 wks./yr.; nonworking spouse; two children; D. $5.15/hr. wage; 20 hrs./wk; 52 wks./yr.; nonworking spouse; no children. NA - Not available. Michigan computes benefits based on after-tax wages. Source: U.S. Department of Labor.
THE UNEMPLOYMENT TRUST FUND
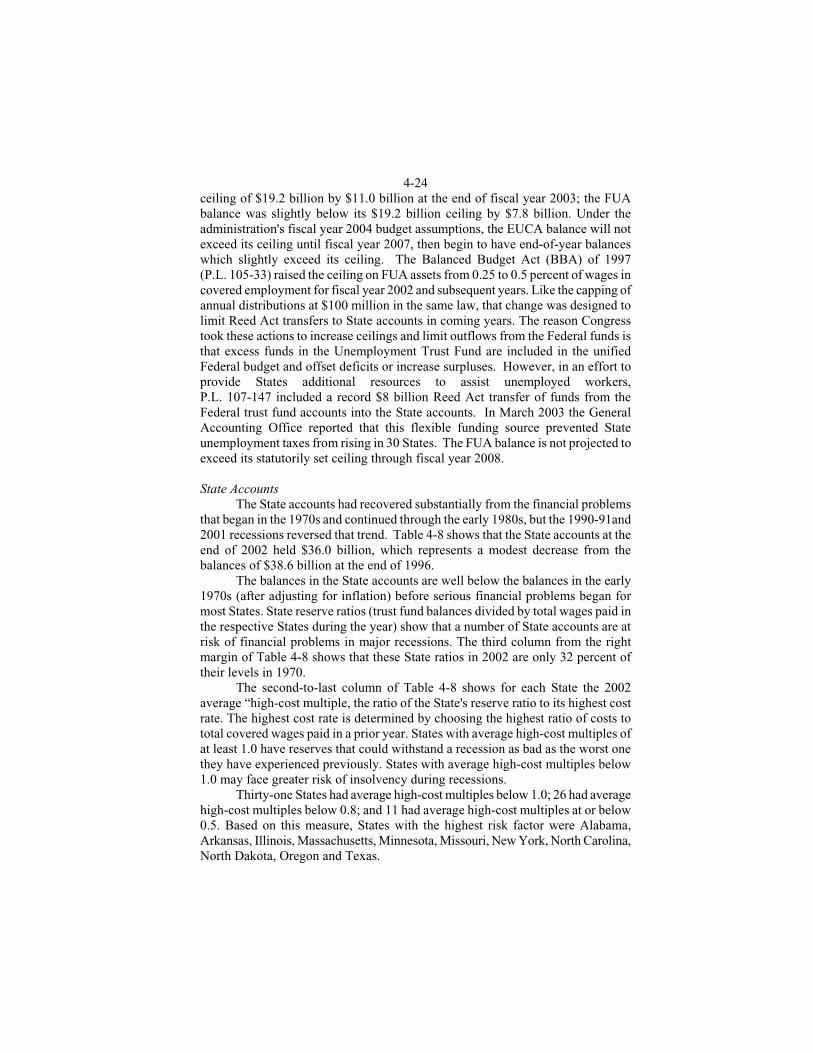
The Unemployment Trust Fund has 59 accounts. The accounts consist of 53 State UC benefit accounts, the Railroad Unemployment Insurance Account, the Railroad Administration Account, and four Federal accounts. (The railroad accounts are discussed in section 5 of this volume.) The Federal unified budget accounts for all Federal-State UC outlays and taxes in the Federal Unemployment Trust Fund. The four Federal accounts in the trust fund are: (1) the Employment Security Administration Account (ESAA), which funds administration; (2) the Extended Unemployment Compensation Account (EUCA), which funds the Federal half of the Federal-State Extended Benefits Program; (3) the Federal Unemployment Account (FUA), which funds loans to insolvent State UC Programs; and (4) the Federal Employees' Compensation Account (FECA), which funds benefits for Federal civilian and military personnel authorized under 5 U.S.C. 85. The 0.8 percent Federal share of the unemployment tax finances the ESAA, EUCA, and FUA, but general revenues finance the FECA. Present law authorizes interest-bearing loans to ESAA, EUCA, and FUA from the general fund. The three accounts may receive noninterest-bearing advances from one another to avoid insufficiencies.
FINANCIAL CONDITION OF THE UNEMPLOYMENT TRUST FUND
Federal Accounts At the end of fiscal year 2003, the Employment Security Administration Account (ESAA) exceeded its fiscal year 2003 ceiling of $1.6 billion. The Extended Unemployment Compensation Account (EUCA) balance was below its
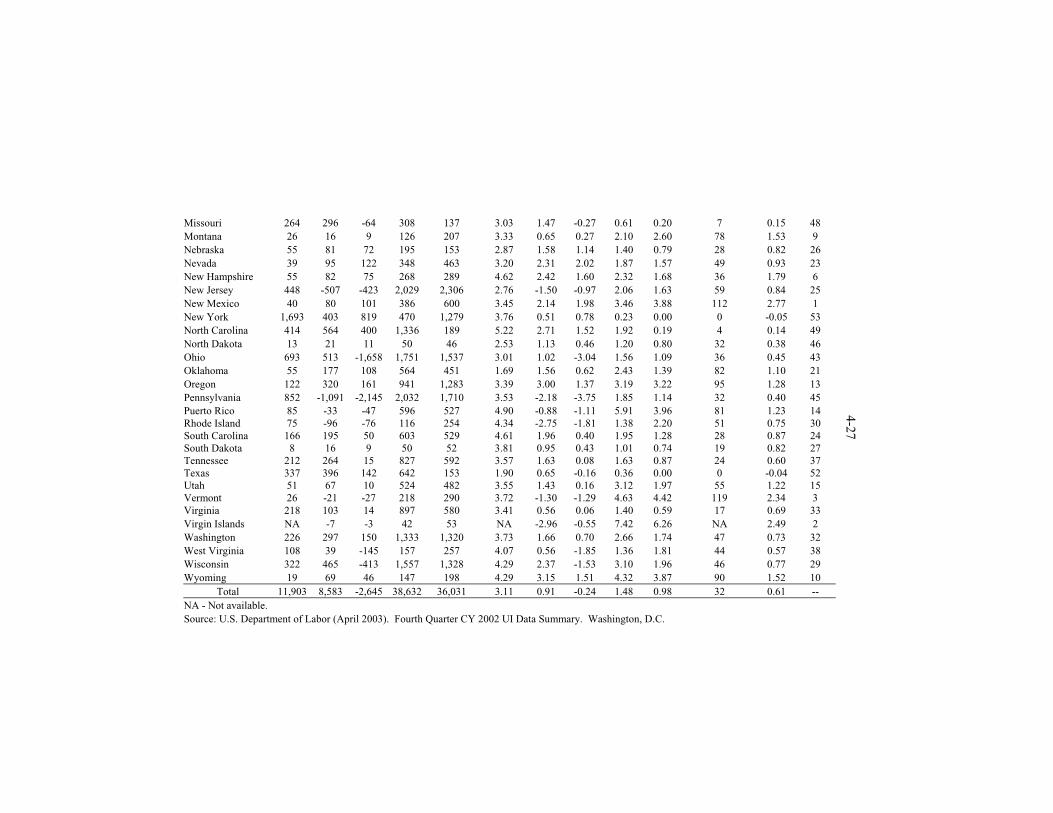
4-24 ceiling of $19.2 billion by $11.0 billion at the end of fiscal year 2003; the FUA balance was slightly below its $19.2 billion ceiling by $7.8 billion. Under the administration's fiscal year 2004 budget assumptions, the EUCA balance will not exceed its ceiling until fiscal year 2007, then begin to have end-of-year balances which slightly exceed its ceiling. The Balanced Budget Act (BBA) of 1997 (P.L. 105-33) raised the ceiling on FUA assets from 0.25 to 0.5 percent of wages in covered employment for fiscal year 2002 and subsequent years. Like the capping of annual distributions at $100 million in the same law, that change was designed to limit Reed Act transfers to State accounts in coming years. The reason Congress took these actions to increase ceilings and limit outflows from the Federal funds is that excess funds in the Unemployment Trust Fund are included in the unified Federal budget and offset deficits or increase surpluses. However, in an effort to provide States additional resources to assist unemployed workers, P.L. 107-147 included a record $8 billion Reed Act transfer of funds from the Federal trust fund accounts into the State accounts. In March 2003 the General Accounting Office reported that this flexible funding source prevented State unemployment taxes from rising in 30 States. The FUA balance is not projected to exceed its statutorily set ceiling through fiscal year 2008. State Accounts The State accounts had recovered substantially from the financial problems that began in the 1970s and continued through the early 1980s, but the 1990-91and 2001 recessions reversed that trend. Table 4-8 shows that the State accounts at the end of 2002 held $36.0 billion, which represents a modest decrease from the balances of $38.6 billion at the end of 1996. The balances in the State accounts are well below the balances in the early 1970s (after adjusting for inflation) before serious financial problems began for most States. State reserve ratios (trust fund balances divided by total wages paid in the respective States during the year) show that a number of State accounts are at risk of financial problems in major recessions. The third column from the right margin of Table 4-8 shows that these State ratios in 2002 are only 32 percent of their levels in 1970. The second-to-last column of Table 4-8 shows for each State the 2002 average “high-cost multiple, the ratio of the State's reserve ratio to its highest cost rate. The highest cost rate is determined by choosing the highest ratio of costs to total covered wages paid in a prior year. States with average high-cost multiples of at least 1.0 have reserves that could withstand a recession as bad as the worst one they have experienced previously. States with average high-cost multiples below 1.0 may face greater risk of insolvency during recessions. Thirty-one States had average high-cost multiples below 1.0; 26 had average high-cost multiples below 0.8; and 11 had average high-cost multiples at or below 0.5. Based on this measure, States with the highest risk factor were Alabama, Arkansas, Illinois, Massachusetts, Minnesota, Missouri, New York, North Carolina, North Dakota, Oregon and Texas.
4-25 Table 4-9 summarizes the beginning balances in the various Unemployment Trust Fund accounts for selected fiscal years. At the start of fiscal year 2003,the 4 Federal accounts and the 53 State benefit accounts had a total balance of $69.3 billion. In real terms this represents a level 20 percent higher than that of 1971. This increase in real dollars does not allow for the erosion implied by the large increase in the labor force over this time period. Overall, a better measure of readiness for a recession is the ratio of the 2002:1970 reserve ratios in Table 4-8, which shows that aggregate reserves in 2002 relative to wages were a significantly less than one third the 1970 level. Whether the State trust fund balances are adequate is ultimately a matter about which each State must decide. States have a great deal of autonomy in how they establish and run their unemployment system. However, the framework established by the Federal Government requires States to actually pay the level of benefits they determine to be appropriate; in budget terms, unemployment benefits are an entitlement (although the program is financed by a dedicated tax imposed on employers and employees and not by general revenues). Thus, if a recession hits a given State and results in a depletion of that State's trust account, the State is legally required to continue paying benefits. To do so, the State will be forced to borrow money from the Federal Unemployment Account. As a result, not only will the State be required to continue paying benefits, it will also be required to repay the funds plus interest it has borrowed from the Federal loan account. Such States will probably be forced to raise taxes on their employers, an action that dampens economic growth and job creation. In short, States have strong incentives to keep adequate funds in their trust fund accounts.
THE FEDERAL UNEMPLOYMENT TAX
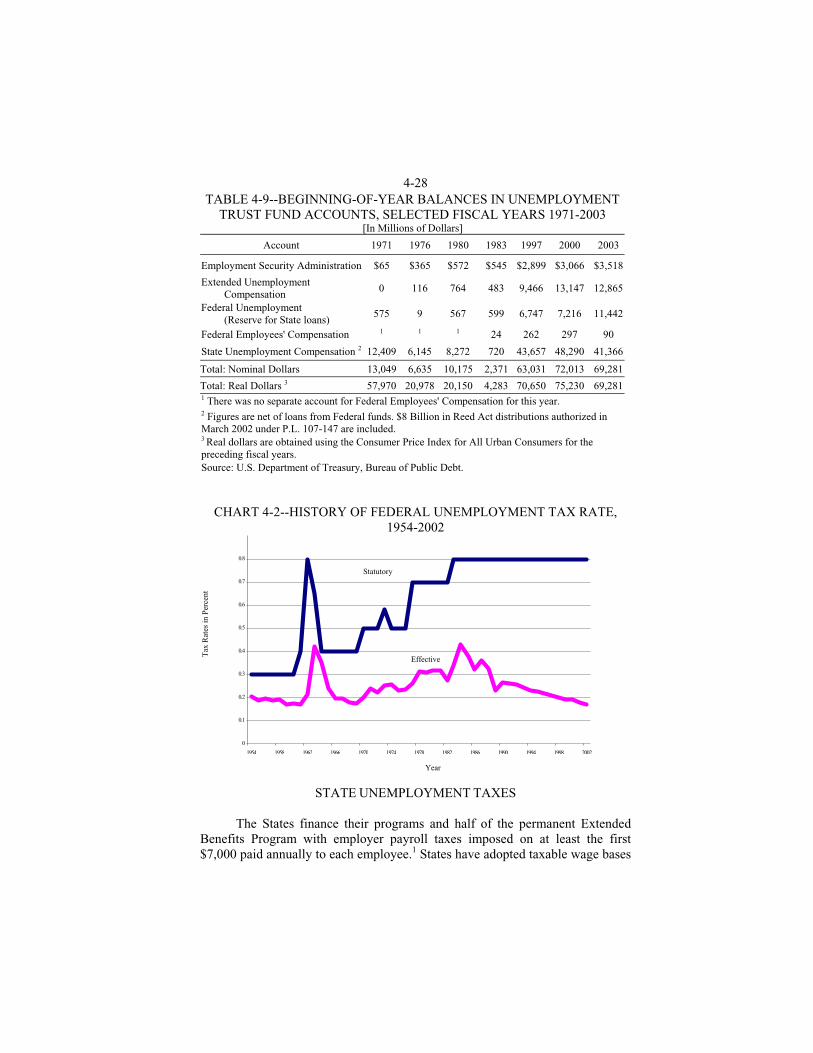
FUTA imposes a minimum, net Federal payroll tax on employers of 0.8 percent on the first $7,000 paid annually to each employee. The current gross FUTA tax rate is 6.2 percent, but employers in States meeting certain Federal requirements and having no delinquent Federal loans are eligible for a 5.4 percent credit, making the current minimum, net Federal tax rate 0.8 percent. Since most employees earn more than the $7,000 taxable wage ceiling, the FUTA tax typically is $56 per worker ($7,000 X 0.8 percent), or three cents per hour for a full-time worker. The 1997 budget bill extended the 0.2 percent surtax through 2007. The wage base for the Federal tax was held constant at $3,000 until 1971, and then was increased on three occasions, most recently in 1983. Chart 4-2 depicts the historical trends in the statutory and effective Federal unemployment tax rates. The effective tax rate equals FUTA revenue as a percent of total covered wages. Although the statutory tax rate doubled from 0.4 percent in the late 1960s to 0.8 percent in the late 1980s, the effective tax rate has fluctuated between 0.2 and 0.3 percent in most of those years.
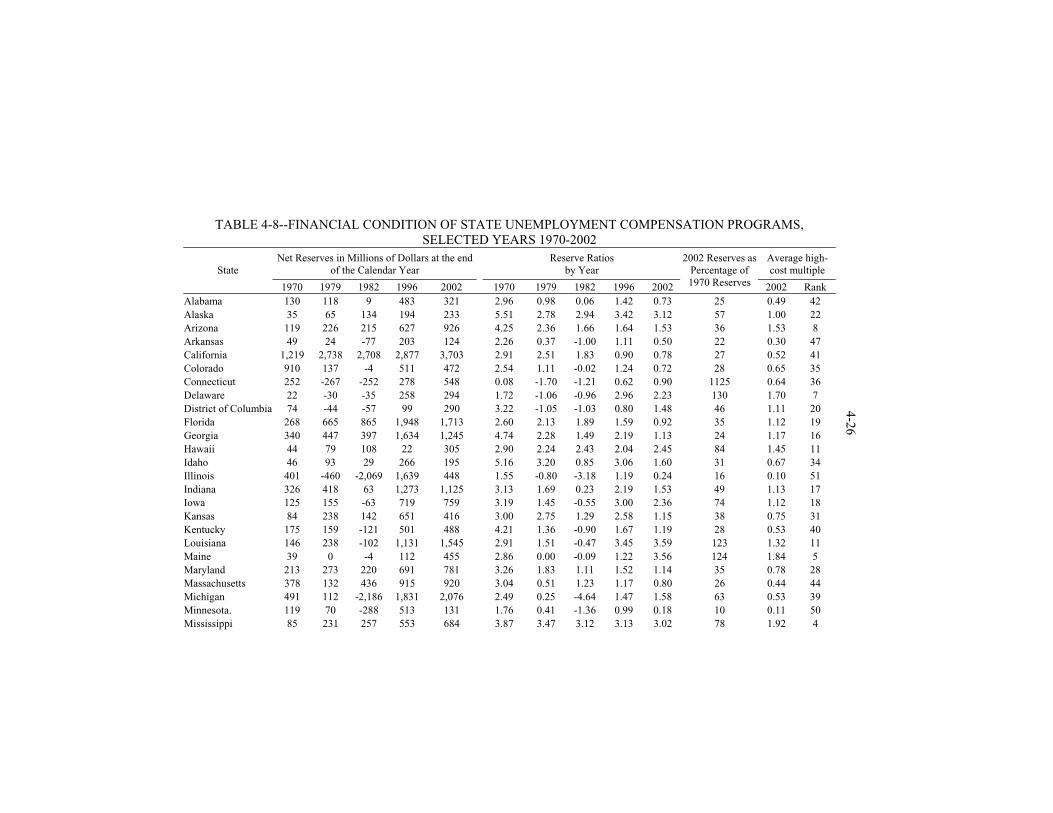
TABLE 4-8--FINANCIAL CONDITION OF STATE UNEMPLOYMENT COMPENSATION PROGRAMS,
SELECTED YEARS 1970-2002 Net Reserves in Millions of Dollars at the end
of the Calendar Year Reserve Ratios
by Year Average high-cost multiple State
1970 1979 1982 1996 2002 1970 1979 1982 1996 2002
2002 Reserves as Percentage of 1970 Reserves 2002 Rank
Alabama 130 118 9 483 321 2.96 0.98 0.06 1.42 0.73 25 0.49 42 Alaska 35 65 134 194 233 5.51 2.78 2.94 3.42 3.12 57 1.00 22 Arizona 119 226 215 627 926 4.25 2.36 1.66 1.64 1.53 36 1.53 8 Arkansas 49 24 -77 203 124 2.26 0.37 -1.00 1.11 0.50 22 0.30 47 California 1,219 2,738 2,708 2,877 3,703 2.91 2.51 1.83 0.90 0.78 27 0.52 41 Colorado 910 137 -4 511 472 2.54 1.11 -0.02 1.24 0.72 28 0.65 35 Connecticut 252 -267 -252 278 548 0.08 -1.70 -1.21 0.62 0.90 1125 0.64 36 Delaware 22 -30 -35 258 294 1.72 -1.06 -0.96 2.96 2.23 130 1.70 7 District of Columbia 74 -44 -57 99 290 3.22 -1.05 -1.03 0.80 1.48 46 1.11 20 Florida 268 665 865 1,948 1,713 2.60 2.13 1.89 1.59 0.92 35 1.12 19 Georgia 340 447 397 1,634 1,245 4.74 2.28 1.49 2.19 1.13 24 1.17 16 Hawaii 44 79 108 22 305 2.90 2.24 2.43 2.04 2.45 84 1.45 11 Idaho 46 93 29 266 195 5.16 3.20 0.85 3.06 1.60 31 0.67 34 Illinois 401 -460 -2,069 1,639 448 1.55 -0.80 -3.18 1.19 0.24 16 0.10 51 Indiana 326 418 63 1,273 1,125 3.13 1.69 0.23 2.19 1.53 49 1.13 17 Iowa 125 155 -63 719 759 3.19 1.45 -0.55 3.00 2.36 74 1.12 18 Kansas 84 238 142 651 416 3.00 2.75 1.29 2.58 1.15 38 0.75 31 Kentucky 175 159 -121 501 488 4.21 1.36 -0.90 1.67 1.19 28 0.53 40 Louisiana 146 238 -102 1,131 1,545 2.91 1.51 -0.47 3.45 3.59 123 1.32 11 Maine 39 0 -4 112 455 2.86 0.00 -0.09 1.22 3.56 124 1.84 5 Maryland 213 273 220 691 781 3.26 1.83 1.11 1.52 1.14 35 0.78 28 Massachusetts 378 132 436 915 920 3.04 0.51 1.23 1.17 0.80 26 0.44 44 Michigan 491 112 -2,186 1,831 2,076 2.49 0.25 -4.64 1.47 1.58 63 0.53 39 Minnesota. 119 70 -288 513 131 1.76 0.41 -1.36 0.99 0.18 10 0.11 50 Mississippi 85 231 257 553 684 3.87 3.47 3.12 3.13 3.02 78 1.92 4
4-26
Missouri 264 296 -64 308 137 3.03 1.47 -0.27 0.61 0.20 7 0.15 48 Montana 26 16 9 126 207 3.33 0.65 0.27 2.10 2.60 78 1.53 9 Nebraska 55 81 72 195 153 2.87 1.58 1.14 1.40 0.79 28 0.82 26 Nevada 39 95 122 348 463 3.20 2.31 2.02 1.87 1.57 49 0.93 23 New Hampshire 55 82 75 268 289 4.62 2.42 1.60 2.32 1.68 36 1.79 6 New Jersey 448 -507 -423 2,029 2,306 2.76 -1.50 -0.97 2.06 1.63 59 0.84 25 New Mexico 40 80 101 386 600 3.45 2.14 1.98 3.46 3.88 112 2.77 1 New York 1,693 403 819 470 1,279 3.76 0.51 0.78 0.23 0.00 0 -0.05 53 North Carolina 414 564 400 1,336 189 5.22 2.71 1.52 1.92 0.19 4 0.14 49 North Dakota 13 21 11 50 46 2.53 1.13 0.46 1.20 0.80 32 0.38 46 Ohio 693 513 -1,658 1,751 1,537 3.01 1.02 -3.04 1.56 1.09 36 0.45 43 Oklahoma 55 177 108 564 451 1.69 1.56 0.62 2.43 1.39 82 1.10 21 Oregon 122 320 161 941 1,283 3.39 3.00 1.37 3.19 3.22 95 1.28 13 Pennsylvania 852 -1,091 -2,145 2,032 1,710 3.53 -2.18 -3.75 1.85 1.14 32 0.40 45 Puerto Rico 85 -33 -47 596 527 4.90 -0.88 -1.11 5.91 3.96 81 1.23 14Rhode Island 75 -96 -76 116 254 4.34 -2.75 -1.81 1.38 2.20 51 0.75 30South Carolina 166 195 50 603 529 4.61 1.96 0.40 1.95 1.28 28 0.87 24South Dakota 8 16 9 50 52 3.81 0.95 0.43 1.01 0.74 19 0.82 27Tennessee 212 264 15 827 592 3.57 1.63 0.08 1.63 0.87 24 0.60 37Texas 337 396 142 642 153 1.90 0.65 -0.16 0.36 0.00 0 -0.04 52Utah 51 67 10 524 482 3.55 1.43 0.16 3.12 1.97 55 1.22 15Vermont 26 -21 -27 218 290 3.72 -1.30 -1.29 4.63 4.42 119 2.34 3Virginia 218 103 14 897 580 3.41 0.56 0.06 1.40 0.59 17 0.69 33 Virgin Islands NA -7 -3 42 53 NA -2.96 -0.55 7.42 6.26 NA 2.49 2 Washington 226 297 150 1,333 1,320 3.73 1.66 0.70 2.66 1.74 47 0.73 32 West Virginia 108 39 -145 157 257 4.07 0.56 -1.85 1.36 1.81 44 0.57 38 Wisconsin 322 465 -413 1,557 1,328 4.29 2.37 -1.53 3.10 1.96 46 0.77 29 Wyoming 19 69 46 147 198 4.29 3.15 1.51 4.32 3.87 90 1.52 10
Total 11,903 8,583 -2,645 38,632 36,031 3.11 0.91 -0.24 1.48 0.98 32 0.61 -- NA - Not available. Source: U.S. Department of Labor (April 2003). Fourth Quarter CY 2002 UI Data Summary. Washington, D.C.
4-27
4-28 TABLE 4-9--BEGINNING-OF-YEAR BALANCES IN UNEMPLOYMENT
TRUST FUND ACCOUNTS, SELECTED FISCAL YEARS 1971-2003 [In Millions of Dollars]
Account 1971 1976 1980 1983 1997 2000 2003
Employment Security Administration $65 $365 $572 $545 $2,899 $3,066 $3,518
Extended Unemployment Compensation
0 116 764 483 9,466 13,147 12,865
Federal Unemployment (Reserve for State loans)
575 9 567 599 6,747 7,216 11,442
Federal Employees' Compensation 1 1 1 24 262 297 90
State Unemployment Compensation 2 12,409 6,145 8,272 720 43,657 48,290 41,366
Total: Nominal Dollars 13,049 6,635 10,175 2,371 63,031 72,013 69,281
Total: Real Dollars 3 57,970 20,978 20,150 4,283 70,650 75,230 69,281 1 There was no separate account for Federal Employees' Compensation for this year. 2 Figures are net of loans from Federal funds. $8 Billion in Reed Act distributions authorized in March 2002 under P.L. 107-147 are included. 3 Real dollars are obtained using the Consumer Price Index for All Urban Consumers for the preceding fiscal years. Source: U.S. Department of Treasury, Bureau of Public Debt.
CHART 4-2--HISTORY OF FEDERAL UNEMPLOYMENT TAX RATE, 1954-2002
0
0.1
0.2
0.3
0.4
0.5
0.6
0.7
0.8
1954 1958 1962 1966 1970 1974 1978 1982 1986 1990 1994 1998 2002
STATE UNEMPLOYMENT TAXES The States finance their programs and half of the permanent Extended Benefits Program with employer payroll taxes imposed on at least the first $7,000 paid annually to each employee.1 States have adopted taxable wage bases
Tax
Rat
es in
Per
cent
Year
Statutory
Effective
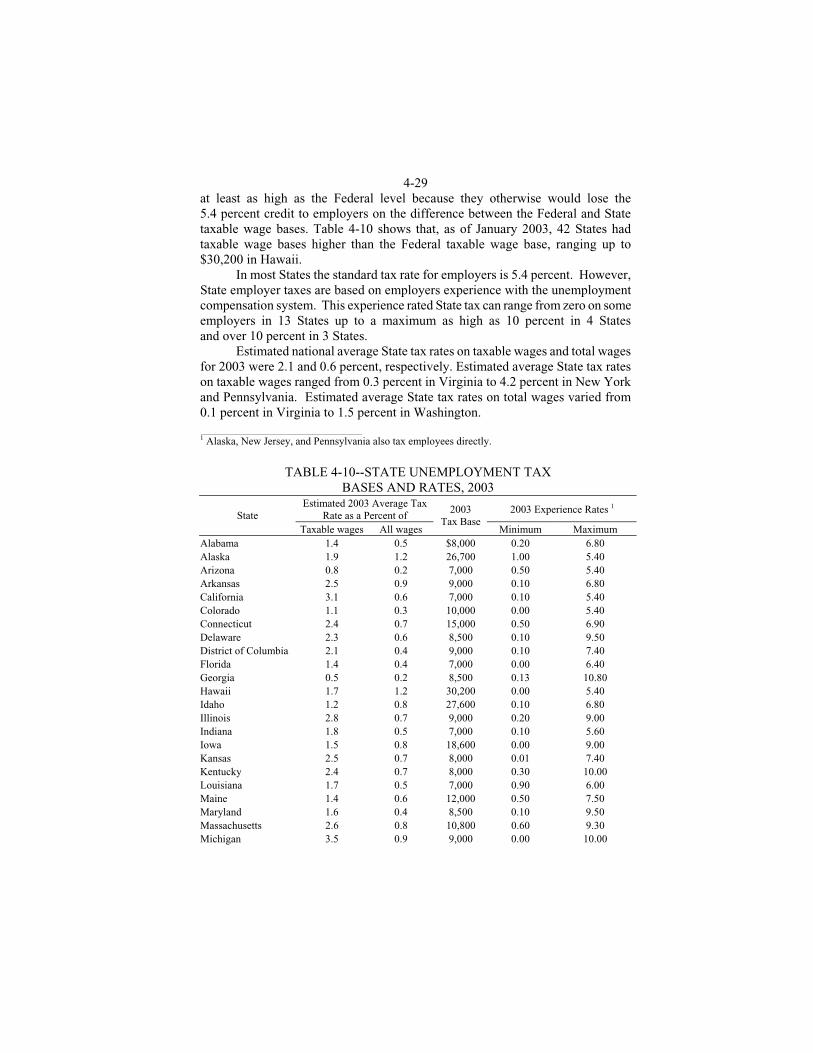
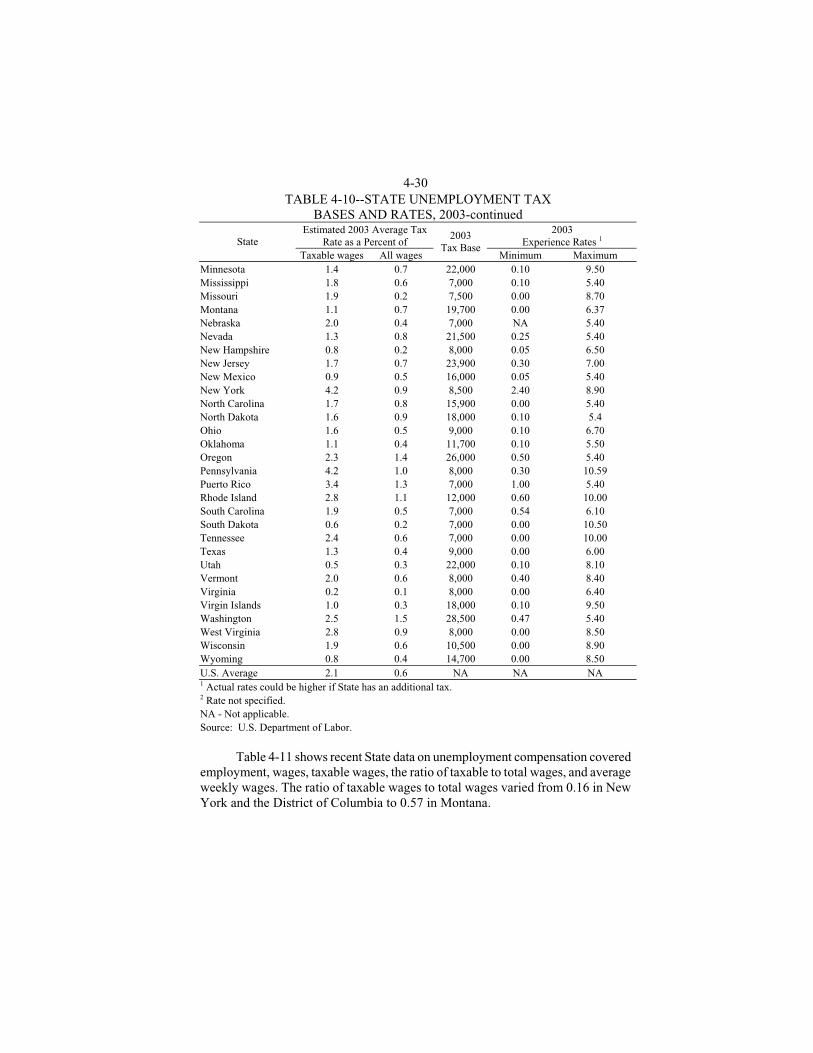
4-29 at least as high as the Federal level because they otherwise would lose the 5.4 percent credit to employers on the difference between the Federal and State taxable wage bases. Table 4-10 shows that, as of January 2003, 42 States had taxable wage bases higher than the Federal taxable wage base, ranging up to $30,200 in Hawaii. In most States the standard tax rate for employers is 5.4 percent. However, State employer taxes are based on employers experience with the unemployment compensation system. This experience rated State tax can range from zero on some employers in 13 States up to a maximum as high as 10 percent in 4 States and over 10 percent in 3 States. Estimated national average State tax rates on taxable wages and total wages for 2003 were 2.1 and 0.6 percent, respectively. Estimated average State tax rates on taxable wages ranged from 0.3 percent in Virginia to 4.2 percent in New York and Pennsylvania. Estimated average State tax rates on total wages varied from 0.1 percent in Virginia to 1.5 percent in Washington. 1 Alaska, New Jersey, and Pennsylvania also tax employees directly.
TABLE 4-10--STATE UNEMPLOYMENT TAX BASES AND RATES, 2003
Estimated 2003 Average Tax Rate as a Percent of
2003 Experience Rates 1 State
Taxable wages All wages
2003 Tax Base
Minimum Maximum Alabama 1.4 0.5 $8,000 0.20 6.80 Alaska 1.9 1.2 26,700 1.00 5.40 Arizona 0.8 0.2 7,000 0.50 5.40 Arkansas 2.5 0.9 9,000 0.10 6.80 California 3.1 0.6 7,000 0.10 5.40 Colorado 1.1 0.3 10,000 0.00 5.40 Connecticut 2.4 0.7 15,000 0.50 6.90 Delaware 2.3 0.6 8,500 0.10 9.50 District of Columbia 2.1 0.4 9,000 0.10 7.40 Florida 1.4 0.4 7,000 0.00 6.40 Georgia 0.5 0.2 8,500 0.13 10.80 Hawaii 1.7 1.2 30,200 0.00 5.40 Idaho 1.2 0.8 27,600 0.10 6.80 Illinois 2.8 0.7 9,000 0.20 9.00 Indiana 1.8 0.5 7,000 0.10 5.60 Iowa 1.5 0.8 18,600 0.00 9.00 Kansas 2.5 0.7 8,000 0.01 7.40 Kentucky 2.4 0.7 8,000 0.30 10.00 Louisiana 1.7 0.5 7,000 0.90 6.00 Maine 1.4 0.6 12,000 0.50 7.50 Maryland 1.6 0.4 8,500 0.10 9.50 Massachusetts 2.6 0.8 10,800 0.60 9.30 Michigan 3.5 0.9 9,000 0.00 10.00
4-30 TABLE 4-10--STATE UNEMPLOYMENT TAX
BASES AND RATES, 2003-continued Estimated 2003 Average Tax
Rate as a Percent of 2003
Experience Rates 1 State Taxable wages All wages
2003 Tax Base
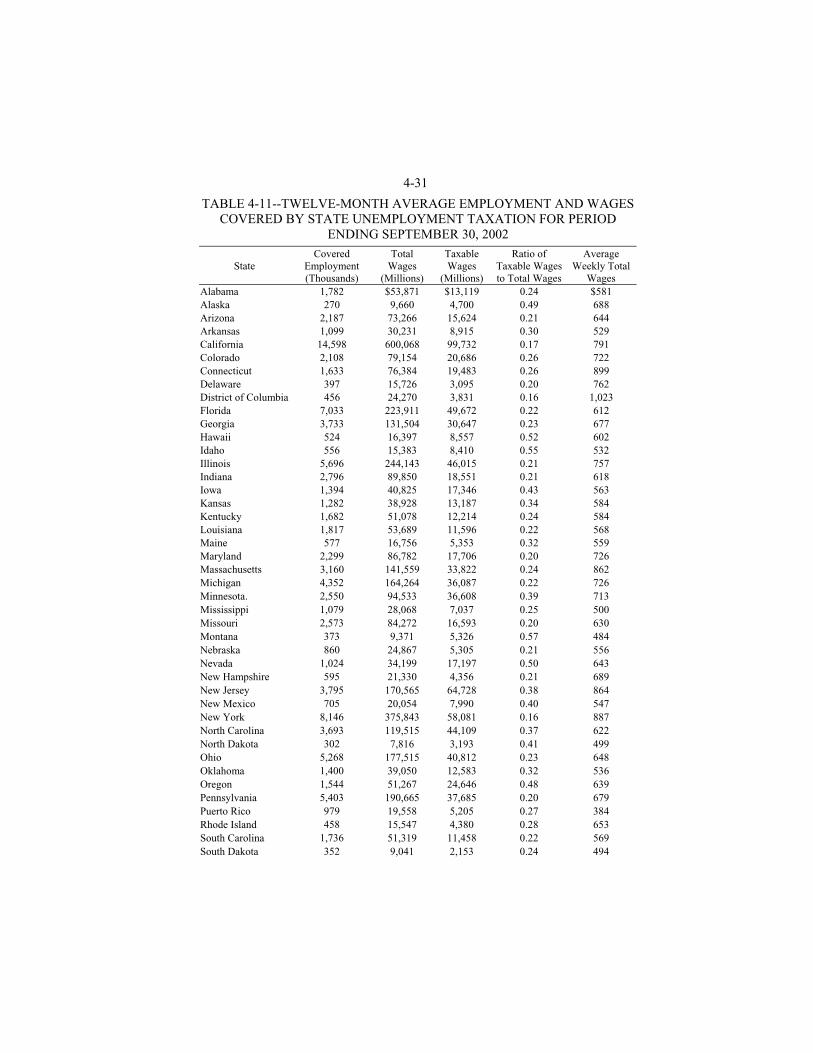
Minimum Maximum Minnesota 1.4 0.7 22,000 0.10 9.50 Mississippi 1.8 0.6 7,000 0.10 5.40 Missouri 1.9 0.2 7,500 0.00 8.70 Montana 1.1 0.7 19,700 0.00 6.37 Nebraska 2.0 0.4 7,000 NA 5.40 Nevada 1.3 0.8 21,500 0.25 5.40 New Hampshire 0.8 0.2 8,000 0.05 6.50 New Jersey 1.7 0.7 23,900 0.30 7.00 New Mexico 0.9 0.5 16,000 0.05 5.40 New York 4.2 0.9 8,500 2.40 8.90 North Carolina 1.7 0.8 15,900 0.00 5.40 North Dakota 1.6 0.9 18,000 0.10 5.4 Ohio 1.6 0.5 9,000 0.10 6.70 Oklahoma 1.1 0.4 11,700 0.10 5.50 Oregon 2.3 1.4 26,000 0.50 5.40 Pennsylvania 4.2 1.0 8,000 0.30 10.59 Puerto Rico 3.4 1.3 7,000 1.00 5.40 Rhode Island 2.8 1.1 12,000 0.60 10.00 South Carolina 1.9 0.5 7,000 0.54 6.10 South Dakota 0.6 0.2 7,000 0.00 10.50 Tennessee 2.4 0.6 7,000 0.00 10.00 Texas 1.3 0.4 9,000 0.00 6.00 Utah 0.5 0.3 22,000 0.10 8.10 Vermont 2.0 0.6 8,000 0.40 8.40 Virginia 0.2 0.1 8,000 0.00 6.40 Virgin Islands 1.0 0.3 18,000 0.10 9.50 Washington 2.5 1.5 28,500 0.47 5.40 West Virginia 2.8 0.9 8,000 0.00 8.50 Wisconsin 1.9 0.6 10,500 0.00 8.90 Wyoming 0.8 0.4 14,700 0.00 8.50 U.S. Average 2.1 0.6 NA NA NA 1 Actual rates could be higher if State has an additional tax. 2 Rate not specified. NA - Not applicable. Source: U.S. Department of Labor. Table 4-11 shows recent State data on unemployment compensation covered employment, wages, taxable wages, the ratio of taxable to total wages, and average weekly wages. The ratio of taxable wages to total wages varied from 0.16 in New York and the District of Columbia to 0.57 in Montana.
4-31
TABLE 4-11--TWELVE-MONTH AVERAGE EMPLOYMENT AND WAGES COVERED BY STATE UNEMPLOYMENT TAXATION FOR PERIOD
ENDING SEPTEMBER 30, 2002
State Covered
Employment (Thousands)
Total Wages
(Millions)
Taxable Wages
(Millions)
Ratio of Taxable Wages to Total Wages
Average Weekly Total
Wages Alabama 1,782 $53,871 $13,119 0.24 $581 Alaska 270 9,660 4,700 0.49 688 Arizona 2,187 73,266 15,624 0.21 644 Arkansas 1,099 30,231 8,915 0.30 529 California 14,598 600,068 99,732 0.17 791 Colorado 2,108 79,154 20,686 0.26 722 Connecticut 1,633 76,384 19,483 0.26 899 Delaware 397 15,726 3,095 0.20 762 District of Columbia 456 24,270 3,831 0.16 1,023 Florida 7,033 223,911 49,672 0.22 612 Georgia 3,733 131,504 30,647 0.23 677 Hawaii 524 16,397 8,557 0.52 602 Idaho 556 15,383 8,410 0.55 532 Illinois 5,696 244,143 46,015 0.21 757 Indiana 2,796 89,850 18,551 0.21 618 Iowa 1,394 40,825 17,346 0.43 563 Kansas 1,282 38,928 13,187 0.34 584 Kentucky 1,682 51,078 12,214 0.24 584 Louisiana 1,817 53,689 11,596 0.22 568 Maine 577 16,756 5,353 0.32 559 Maryland 2,299 86,782 17,706 0.20 726 Massachusetts 3,160 141,559 33,822 0.24 862 Michigan 4,352 164,264 36,087 0.22 726 Minnesota. 2,550 94,533 36,608 0.39 713 Mississippi 1,079 28,068 7,037 0.25 500 Missouri 2,573 84,272 16,593 0.20 630 Montana 373 9,371 5,326 0.57 484 Nebraska 860 24,867 5,305 0.21 556 Nevada 1,024 34,199 17,197 0.50 643 New Hampshire 595 21,330 4,356 0.21 689 New Jersey 3,795 170,565 64,728 0.38 864 New Mexico 705 20,054 7,990 0.40 547 New York 8,146 375,843 58,081 0.16 887 North Carolina 3,693 119,515 44,109 0.37 622 North Dakota 302 7,816 3,193 0.41 499 Ohio 5,268 177,515 40,812 0.23 648 Oklahoma 1,400 39,050 12,583 0.32 536 Oregon 1,544 51,267 24,646 0.48 639 Pennsylvania 5,403 190,665 37,685 0.20 679 Puerto Rico 979 19,558 5,205 0.27 384 Rhode Island 458 15,547 4,380 0.28 653 South Carolina 1,736 51,319 11,458 0.22 569 South Dakota 352 9,041 2,153 0.24 494
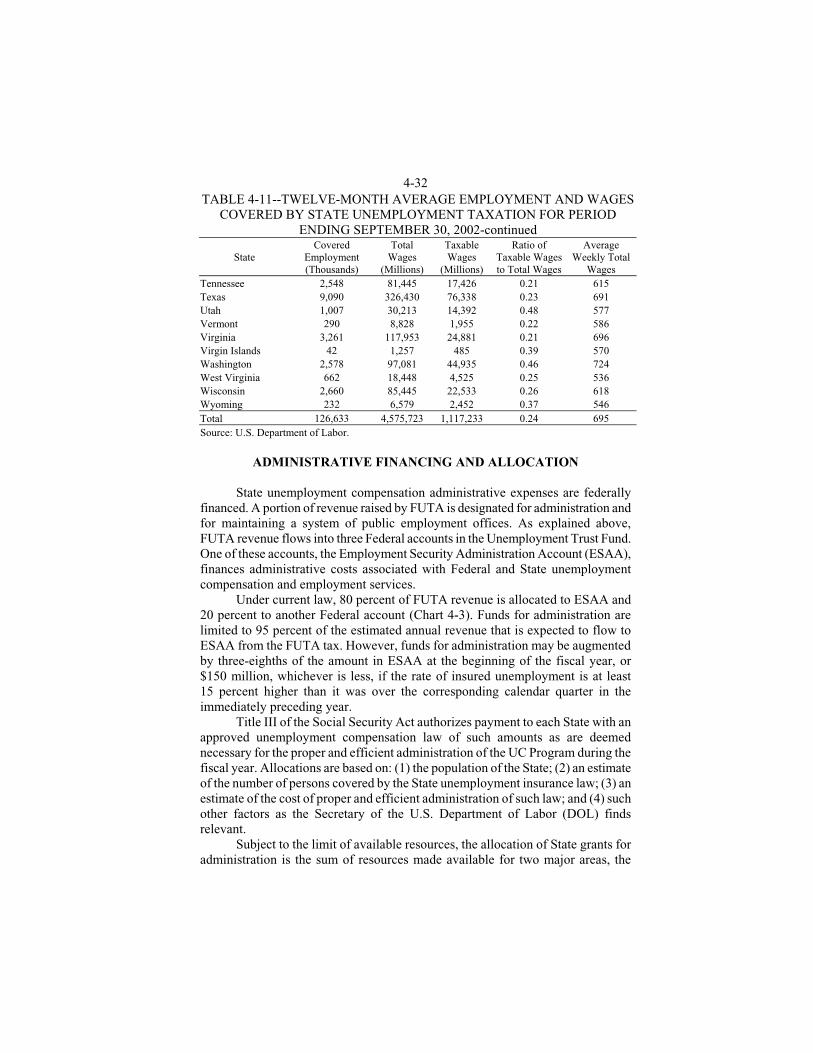
4-32 TABLE 4-11--TWELVE-MONTH AVERAGE EMPLOYMENT AND WAGES
COVERED BY STATE UNEMPLOYMENT TAXATION FOR PERIOD ENDING SEPTEMBER 30, 2002-continued
State Covered
Employment (Thousands)
Total Wages
(Millions)
Taxable Wages
(Millions)
Ratio of Taxable Wages to Total Wages
Average Weekly Total
Wages Tennessee 2,548 81,445 17,426 0.21 615 Texas 9,090 326,430 76,338 0.23 691 Utah 1,007 30,213 14,392 0.48 577 Vermont 290 8,828 1,955 0.22 586 Virginia 3,261 117,953 24,881 0.21 696 Virgin Islands 42 1,257 485 0.39 570 Washington 2,578 97,081 44,935 0.46 724 West Virginia 662 18,448 4,525 0.25 536 Wisconsin 2,660 85,445 22,533 0.26 618 Wyoming 232 6,579 2,452 0.37 546 Total 126,633 4,575,723 1,117,233 0.24 695 Source: U.S. Department of Labor.
ADMINISTRATIVE FINANCING AND ALLOCATION State unemployment compensation administrative expenses are federally financed. A portion of revenue raised by FUTA is designated for administration and for maintaining a system of public employment offices. As explained above, FUTA revenue flows into three Federal accounts in the Unemployment Trust Fund. One of these accounts, the Employment Security Administration Account (ESAA), finances administrative costs associated with Federal and State unemployment compensation and employment services. Under current law, 80 percent of FUTA revenue is allocated to ESAA and 20 percent to another Federal account (Chart 4-3). Funds for administration are limited to 95 percent of the estimated annual revenue that is expected to flow to ESAA from the FUTA tax. However, funds for administration may be augmented by three-eighths of the amount in ESAA at the beginning of the fiscal year, or $150 million, whichever is less, if the rate of insured unemployment is at least 15 percent higher than it was over the corresponding calendar quarter in the immediately preceding year. Title III of the Social Security Act authorizes payment to each State with an approved unemployment compensation law of such amounts as are deemed necessary for the proper and efficient administration of the UC Program during the fiscal year. Allocations are based on: (1) the population of the State; (2) an estimate of the number of persons covered by the State unemployment insurance law; (3) an estimate of the cost of proper and efficient administration of such law; and (4) such other factors as the Secretary of the U.S. Department of Labor (DOL) finds relevant. Subject to the limit of available resources, the allocation of State grants for administration is the sum of resources made available for two major areas, the
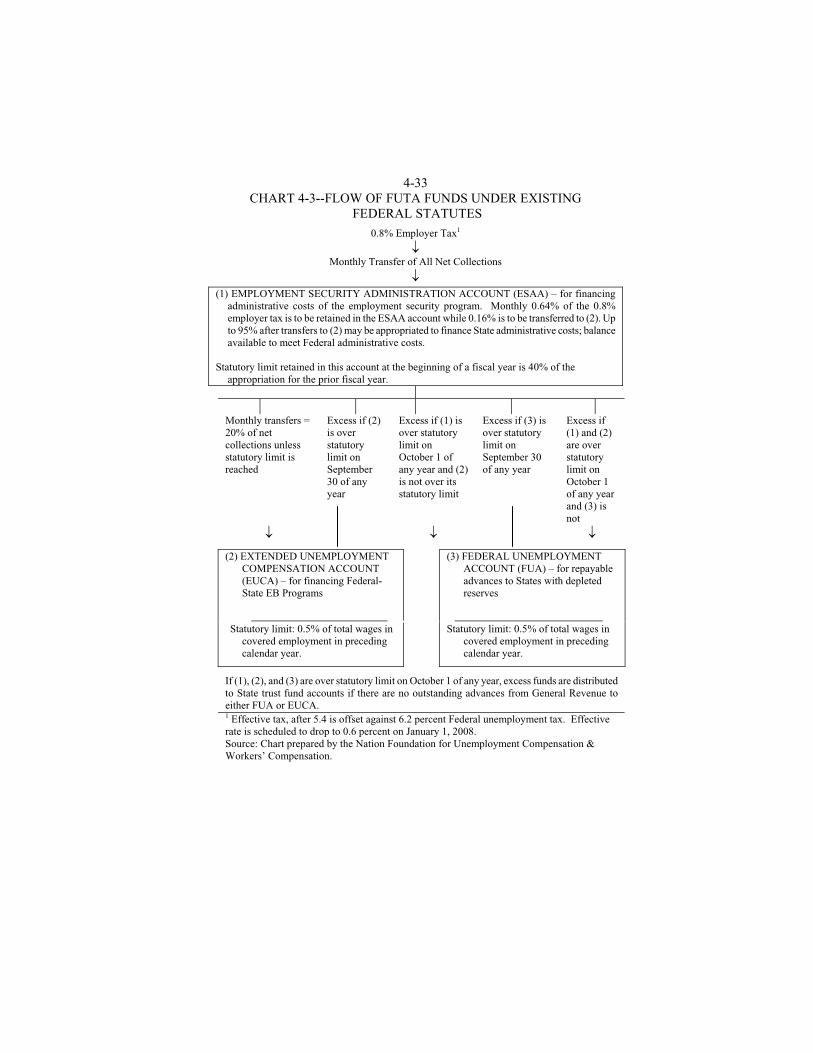
4-33 CHART 4-3--FLOW OF FUTA FUNDS UNDER EXISTING
FEDERAL STATUTES
0.8% Employer Tax1
Monthly Transfer of All Net Collections
Monthly transfers = 20% of net collections unless statutory limit is reached
Excess if (2) is over statutory limit on September 30 of any year
Excess if (1) is over statutory limit on October 1 of any year and (2) is not over its statutory limit
Excess if (3) is over statutory limit on September 30 of any year
Excess if (1) and (2) are over statutory limit on October 1 of any year and (3) is not
(2) EXTENDED UNEMPLOYMENT COMPENSATION ACCOUNT (EUCA) – for financing Federal-State EB Programs
(3) FEDERAL UNEMPLOYMENT ACCOUNT (FUA) – for repayable advances to States with depleted reserves
Statutory limit: 0.5% of total wages in covered employment in preceding calendar year.
Statutory limit: 0.5% of total wages in covered employment in preceding calendar year.
If (1), (2), and (3) are over statutory limit on October 1 of any year, excess funds are distributed to State trust fund accounts if there are no outstanding advances from General Revenue to either FUA or EUCA. 1 Effective tax, after 5.4 is offset against 6.2 percent Federal unemployment tax. Effective rate is scheduled to drop to 0.6 percent on January 1, 2008. Source: Chart prepared by the Nation Foundation for Unemployment Compensation & Workers’ Compensation.
(1) EMPLOYMENT SECURITY ADMINISTRATION ACCOUNT (ESAA) – for financing administrative costs of the employment security program. Monthly 0.64% of the 0.8% employer tax is to be retained in the ESAA account while 0.16% is to be transferred to (2). Up to 95% after transfers to (2) may be appropriated to finance State administrative costs; balance available to meet Federal administrative costs.
Statutory limit retained in this account at the beginning of a fiscal year is 40% of the
appropriation for the prior fiscal year.
4-34 Unemployment Insurance Service (UI) and the Employment Service (ES). Each area has its own allocation methodology subject to general constraints set forth in the Social Security Act and the Wagner-Peyser Act. Each year, as part of the development of the President's budget, the DOL, in conjunction with the Department of Treasury, estimates revenue expected from FUTA and the appropriate amount to be available for administration. The estimate of FUTA revenues is based on several factors: (1) a wage base of $7,000 per employee; (2) a tax rate of 0.8 percent (0.64 percentage points for administration and 0.16 percentage points for extended benefits); (3) the administration's projection of the level of unemployment and the growth in wages; and (4) the level of covered employment subject to FUTA. In addition, a determination is made based on the administration's forecast for unemployment as to whether the rate will increase by at least 15 percent. Each year the President's budget sets forth an estimate of national unemployment in terms of the volume of unemployment claims per week. This is characterized as average weekly insured unemployment (AWIU). A portion of AWIU is expressed as “base” and the remainder as “contingency.” At the present time, the base is set at the level of resources required to process an average weekly volume of 2.0 million weeks of unemployment. Resources available to each State to administer its UC Program (i.e., process claims and pay benefits) are provided from either “base” funds or “contingency” funds. At the beginning of the fiscal year, only the base funds are allocated, while contingency funds are allocated on a needs basis as workload materializes. Base funds are distributed to the State for use throughout the fiscal year and are available regardless of the level of unemployment (workload) realized. If a State processes workloads in excess of the base level, it receives contingency funds determined by the extent of the resources required to process the additional workload. The allocation of the base UC grant funds to each State is made by:
1. Projecting the workloads that each State is expected to process; 2. Determining the staff required to process each State's projected workload; 3. Multiplying the final staff-year allocations for each State by the cost per
staff year (i.e., State salary and benefit level) to determine dollar funding levels; and
4. Allocating overhead resources (administrative and management staff and nonpersonal services).
Each DOL regional office may redistribute resources among the States in its area with national office approval. The 1997 budget bill authorized funds over 5 years specifically for program integrity activities such as claims review and employer tax audits to assist the States in strengthening their efforts to reduce administrative error and fraud. In Public Law 102-164, Congress required the DOL to study the allocation process and recommend improvements. Public Law 102-318 extended the study deadline to December 31, 1994. The Department has not yet submitted the report to Congress.
4-35 Total grants to States for administrative costs represent about 53 percent of total FUTA tax collections in fiscal year 2002. In addition, the Reed Act transfer of $8 billion provided to states under P.L. 107-147 could be used by states for administrative purposes. There continues to be considerable interest among State Employment Security Agencies in recent years in having more of the FUTA revenue returned to the States for administrative expenses. In the 108th Congress, legislation has been introduced which would change the administrative financing of the UC Program.
LEGISLATIVE HISTORY
Major Federal laws passed by Congress since 1990 and their key provisions are as follows: The Omnibus Budget Reconciliation Act of 1990 (Public Law 101-508) extended the 0.2 percent FUTA surtax for 5 years through 1995. The Emergency Unemployment Compensation Act of 1991 (Public Law 102-164) established temporary emergency unemployment compensation (EUC) benefits through July 4, 1992. It returned to States the option of covering nonprofessional school employees between school terms and restored benefits for ex-military members to the same duration and waiting period applicable to other unemployed workers. It extended the 0.2 percent FUTA surtax for 1 year through 1996. The Unemployment Compensation Amendments of 1992 (Public Law 102-318) extended EUC for claims filed through March 6, 1993, and reduced the benefit periods to 20 and 26 weeks. The law also gave claimants eligible for both EUC and regular benefits the right to choose the more favorable of the two. States were authorized, effective March 7, 1993, to adopt an alternative trigger for the Federal-State EB Program. This trigger is based on a 3-month average total unemployment rate and can activate either a 13- or a 20-week benefit period depending on the rate. The Emergency Unemployment Compensation Amendments of 1993 (Public Law 103-6) extended EUC for claims filed through October 2, 1993. The law also authorized funds for automated State systems to identify permanently displaced workers for early intervention with reemployment services. The Omnibus Budget Reconciliation Act of 1993 (Public Law 103-66) extended the 0.2 percent FUTA surtax for 2 years through 1998. The Unemployment Compensation Amendments of 1993 (Public Law 103-152) extended EUC for claims filed through February 5, 1994, and set the benefit periods at 7 and 13 weeks. It repealed a provision passed in 1992 that allowed claimants to choose between EUC and regular State benefits. It required States to implement a “profiling” system to identify UI claimants most likely to need job search assistance to avoid long-term unemployment. The North American Free Trade Agreement Implementation Act (Public Law 103-182) gave States the option of continuing UC benefits for claimants who elect