Embed Size (px)
Citation preview

Find CIBC research on Bloomberg, Reuters, firstcall.com and cibcwm.com CIBC World Markets Inc., P.O. Box 500, 161 Bay Street, Brookfield Place, Toronto, Canada M5J 2S8 (416) 594-7000
Equity Research
Industry Update
May 30, 2008 Solar
Solar Industry Outlook Industry At A Crossroads
All figures in US dollars, unless otherwise stated. 08-89534 © 2008
CIBC World Markets does and seeks to do business with companies covered in its research reports. As a result, investors should be aware that the firm may have a conflict of interest that could affect the objectivity of this report. Investors should consider this report as only a single factor in making their investment decision.
See "Important Disclosures" section at the end of this report for important required disclosures, including potential conflicts of interest. See "Price Target Calculation" and "Key Risks to Price Target" sections at the end of this report, or at the end of each section hereof, where applicable.
Sector Weighting: Market Weight
Michael Willemse, CFA 1 (416) 594-7285 [email protected]

Solar Industry Outlook - May 30, 2008
2
Table of Contents Industry At A Crossroads........................................................................3
Cautious In The Short Term, Positive Longer Term .....................................4 Initiating Coverage Of ARISE Technologies,
Day4 Energy & OPEL International...................................................5 Solar – Still A Small Sector .....................................................................6 Solar Module Capacity Outlook .............................................................. 20 Which Technologies Will Prosper? .......................................................... 21
Appendix A: Solar Initiatives By Country..............................................26 Appendix B: The Drive To Reduce CO2 ..................................................30 Appendix C: Converting Sunlight To Electricity .....................................32 Appendix D: Are Solar Stocks Too Risky?..............................................35 Appendix E: Web Resources .................................................................36
Company Reports
ARISE Technologies..............................................................................37 Day4 Energy .........................................................................................57 Opel International ................................................................................71
Solar Industry Outlook - May 30, 2008
3
Industry At A Crossroads In December, 2007 Scientific America published an article proposing a “Solar Grand Plan” that could help solve most of the energy problems facing the United States. This plan suggested that 69% of the U.S.’s electricity and 35% of its total energy needs (including transportation) could be supplied with solar power by 2050. This energy would be supplied to the U.S. consumer for about $0.05/kWh, in line with the low-end of electricity prices in North America. The infrastructure would displace 300 coal-fired power plants and 300 natural gas plants, and would reduce greenhouse gas emissions by 1.7 billion tons. Carbon emissions would be 62% below 2005 levels. Given the abundance of solar energy hitting the earth every day, blue sky projections such as the above are not unrealistic. A patch of land covering 63,000 square miles (250 miles x 250 miles) in the U.S. Southwest receives more than 1,100 quadrillion British thermal units (Btu) of solar radiation a year. Converting only 10% of that radiation into electricity would match the total energy consumption in the U.S. for 2006. The obvious constraint for this “Solar Grand Plan” is the cost required to convert sunlight into useable electricity. To complete the 2050 plan, the article argues that the U.S. government would have to invest more than $400 billion over 40 years.
Current installed costs for a Photovoltaic (PV) solar generating system of $5.00/watt-$8.00/watt need to be reduced to approximately $1.50/watt to be competitive with traditional forms of electricity (or “the grid”). At the very least, we believe installed costs for solar systems need to be reduced to approximately $2.50/watt-$3.00/watt (with minimal subsidies such as carbon credits) in order to be competitive with high-cost electricity areas of the world or peak pricing electricity rates (certain industry research firms believe $4.00/watt would be low enough). In our view, the progress that has been made in the solar PV industry over the past 10 years (and particularly the last four years) has resulted in increased confidence by government interests that costs will continue to decline and that continued government support for the industry is justified. The continued rise in traditional non-renewable energy costs and rising environmental concerns increases our confidence. Further government support for growth in the solar sector will continue to lead to lower costs through greater economies of scale and the development of better technologies. These developments should ultimately lead to solar power becoming more competitive with a large portion of the traditional grid within the next five to seven years. Once solar power becomes close to being competitive with the grid, the increase in demand will be significant.
One of the drawbacks of providing government support to an emerging industry is the potential for certain solar industry players to earn abnormal profits. Although manufacturing costs for solar panels have declined over the past two years, solar system prices (the total installed cost of a solar system) have remained relativity stagnant at approximately $5.00/watt-$8.00/watt. As a result, the corporate sector has captured a great deal of the cost reductions over the past three years rather than the consumer. The primary factor behind the continuation of high solar system costs has been the increases in government feed-in tariffs, which had generated artificially higher demand. Various governments (such as Germany, Spain, and the U.S.) may decide to reduce subsidies in order to influence installation prices lower. The industry is also at risk of prices declining from a significant increase in solar module supply and polysilicon supply (see Exhibit 3). Government support may not be enough to keep prices from falling sharply if supply rises faster than demand.
A patch of land covering 63,000 square miles (250 miles x 250 miles) in the U.S. Southwest receives more than 1,100 quadrillion British thermal units (Btu) of solar radiation a year. Converting only 10% of that radiation into electricity would match the total energy consumption in the U.S. for 2006.
Current installed costs for a PV solar generating system of $5.00/watt-$8.00/watt need to be reduced to approximately $2.50/watt-$3.00/watt (with minimal subsidies such as carbon credits) in order to be competitive with high-cost electricity areas of the world or peak pricing electricity rates.
Solar Industry Outlook - May 30, 2008
4
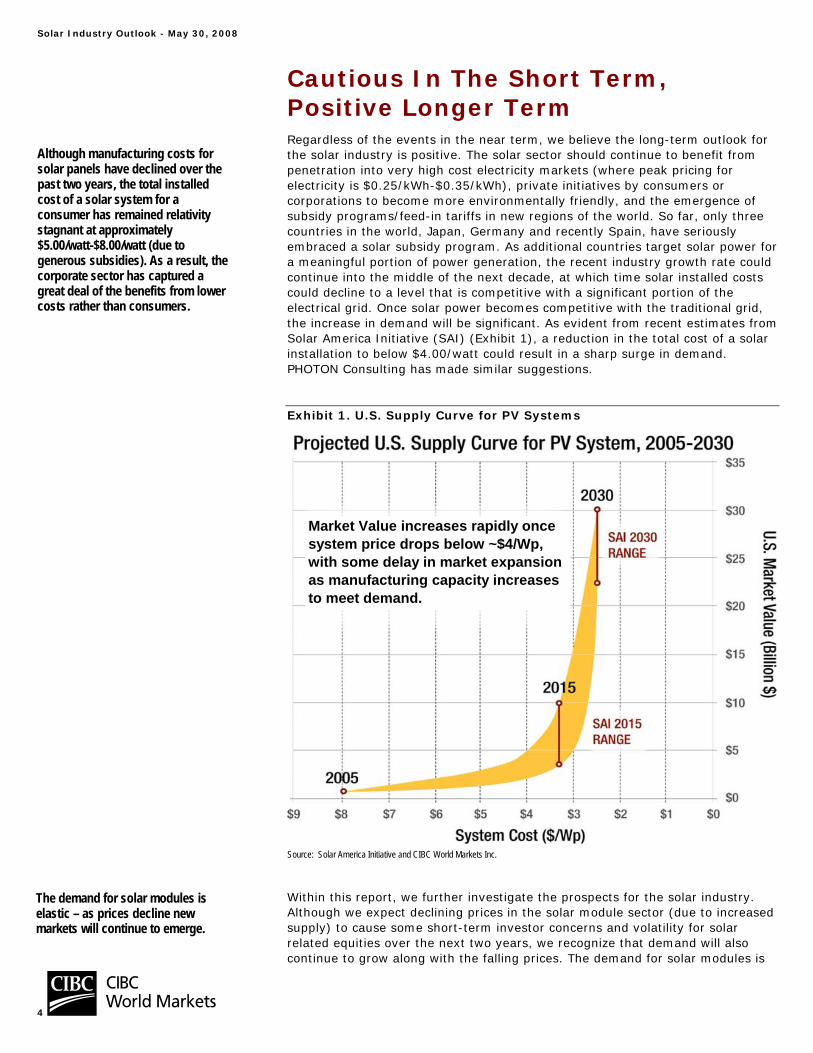
Cautious In The Short Term, Positive Longer Term Regardless of the events in the near term, we believe the long-term outlook for the solar industry is positive. The solar sector should continue to benefit from penetration into very high cost electricity markets (where peak pricing for electricity is $0.25/kWh-$0.35/kWh), private initiatives by consumers or corporations to become more environmentally friendly, and the emergence of subsidy programs/feed-in tariffs in new regions of the world. So far, only three countries in the world, Japan, Germany and recently Spain, have seriously embraced a solar subsidy program. As additional countries target solar power for a meaningful portion of power generation, the recent industry growth rate could continue into the middle of the next decade, at which time solar installed costs could decline to a level that is competitive with a significant portion of the electrical grid. Once solar power becomes competitive with the traditional grid, the increase in demand will be significant. As evident from recent estimates from Solar America Initiative (SAI) (Exhibit 1), a reduction in the total cost of a solar installation to below $4.00/watt could result in a sharp surge in demand. PHOTON Consulting has made similar suggestions.
Exhibit 1. U.S. Supply Curve for PV Systems
Market Value increases rapidly oncesystem price drops below ~$4/Wp,with some delay in market expansion as manufacturing capacity increases to meet demand.
Source: Solar America Initiative and CIBC World Markets Inc.
Within this report, we further investigate the prospects for the solar industry. Although we expect declining prices in the solar module sector (due to increased supply) to cause some short-term investor concerns and volatility for solar related equities over the next two years, we recognize that demand will also continue to grow along with the falling prices. The demand for solar modules is
Although manufacturing costs for solar panels have declined over the past two years, the total installed cost of a solar system for a consumer has remained relativity stagnant at approximately $5.00/watt-$8.00/watt (due to generous subsidies). As a result, the corporate sector has captured a great deal of the benefits from lower costs rather than consumers.
The demand for solar modules is elastic – as prices decline new markets will continue to emerge.
Solar Industry Outlook - May 30, 2008
5
elastic – as prices decline new markets will continue to emerge. Recently, solar supplier Canadian Solar (CSIQ-NASDAQ) indicated that a 15% decline in the price of the company’s solar modules (due to the introduction of a lower cost technology) has created an increase of 100 megawatts (MW) in demand from the U.S. We believe more markets will open up as module prices decline further. Lastly, we believe supply and environmental constraints for fossil fuels will continue to drive traditional electricity prices higher, resulting in the cost differential between solar power and traditional power narrowing even further. Most PV technologies have very little raw material constraints (silicon is the most abundant element on earth). The majority of costs related to solar module manufacturing are labour and overhead, and we believe costs for both will continue to decline as the sector continues to automate manufacturing and as technologies improve.
Initiating Coverage Of ARISE Technologies, Day4 Energy & OPEL International The near-term issues facing the solar industry relate to the evolution of subsidy programs in Germany, Spain and the U.S. If government subsidy programs in any of these countries are retracted significantly at the end of 2008, the reduction in demand in the solar sector, along with an increase in supply as production capacity comes online, could cause a potential decline in solar module prices of 20% due to a price war to gain market share. Recently, the German Solar Ministry proposed a cut in its feed-in tariff rate for 2009 of 8% (which was actually slightly lower-than-the-expected cut of just over 9%) while the Spanish government has yet to announce its cuts for 2009. As a result, we suggest investors consider solar related equities with strong defensive positions due to a low-cost structure, limited financing risks, and reasonable valuations. If generous subsidy programs are continued, investors may decide to trade more leveraged opportunities. Along with this report, as of May 30, we are also initiating coverage of ARISE Technologies (APV-SP), Day4 Energy (DFE-SP), and OPEL International (OPL-SO).
Given our positive outlook of the solar sector, we believe the application of favourable growth multiples is warranted. Some investors will likely attempt to focus on discounted cash flow analysis. However, given that the sector is still in a significant growth phase and continues to undergo significant shifts in sector expectations, some investors will likely favour a momentum style of investing or a more simplistic valuation methodology such as price to earnings. Given that the solar sector is likely to grow 30%-40% annually into the middle of the next decade, we believe earnings multiples of 30x-40x EPS would likely be appropriate in a normal operating environment. However, given that most solar companies are generating operating margins that are likely double sustainable levels, we believe multiples of 15x-20x are more appropriate. For solar related equities that are not yet profitable, price to sales ratios relative to profitable solar companies may be appropriate (after applying an appropriate discount and assuming the unprofitable companies are well positioned to turn profitable).
We suggest investors consider solar related equities with strong defensive positions due to a low-cost structure, limited financing risks, and reasonable valuations.
Solar Industry Outlook - May 30, 2008
6
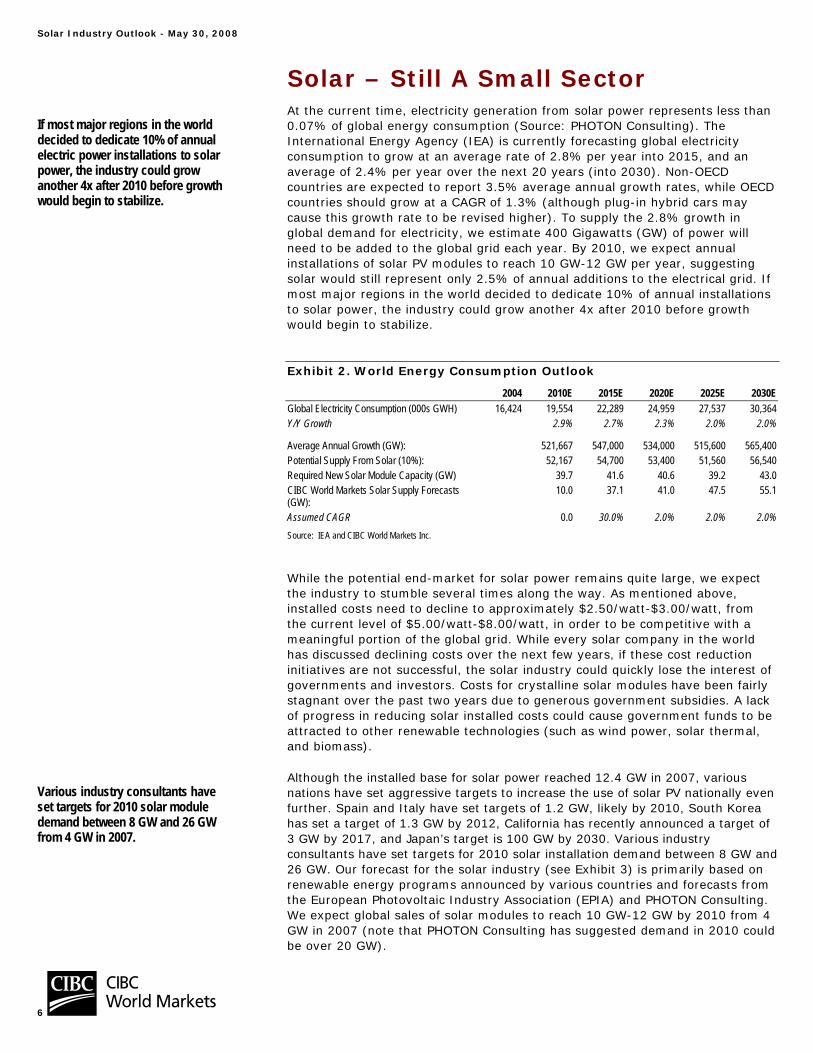
Solar – Still A Small Sector At the current time, electricity generation from solar power represents less than 0.07% of global energy consumption (Source: PHOTON Consulting). The International Energy Agency (IEA) is currently forecasting global electricity consumption to grow at an average rate of 2.8% per year into 2015, and an average of 2.4% per year over the next 20 years (into 2030). Non-OECD countries are expected to report 3.5% average annual growth rates, while OECD countries should grow at a CAGR of 1.3% (although plug-in hybrid cars may cause this growth rate to be revised higher). To supply the 2.8% growth in global demand for electricity, we estimate 400 Gigawatts (GW) of power will need to be added to the global grid each year. By 2010, we expect annual installations of solar PV modules to reach 10 GW-12 GW per year, suggesting solar would still represent only 2.5% of annual additions to the electrical grid. If most major regions in the world decided to dedicate 10% of annual installations to solar power, the industry could grow another 4x after 2010 before growth would begin to stabilize.
Exhibit 2. World Energy Consumption Outlook
2004 2010E 2015E 2020E 2025E 2030EGlobal Electricity Consumption (000s GWH) 16,424 19,554 22,289 24,959 27,537 30,364 Y/Y Growth 2.9% 2.7% 2.3% 2.0% 2.0%
Average Annual Growth (GW): 521,667 547,000 534,000 515,600 565,400 Potential Supply From Solar (10%): 52,167 54,700 53,400 51,560 56,540 Required New Solar Module Capacity (GW) 39.7 41.6 40.6 39.2 43.0 CIBC World Markets Solar Supply Forecasts (GW):
10.0 37.1 41.0 47.5 55.1
Assumed CAGR 0.0 30.0% 2.0% 2.0% 2.0%Source: IEA and CIBC World Markets Inc.
While the potential end-market for solar power remains quite large, we expect the industry to stumble several times along the way. As mentioned above, installed costs need to decline to approximately $2.50/watt-$3.00/watt, from the current level of $5.00/watt-$8.00/watt, in order to be competitive with a meaningful portion of the global grid. While every solar company in the world has discussed declining costs over the next few years, if these cost reduction initiatives are not successful, the solar industry could quickly lose the interest of governments and investors. Costs for crystalline solar modules have been fairly stagnant over the past two years due to generous government subsidies. A lack of progress in reducing solar installed costs could cause government funds to be attracted to other renewable technologies (such as wind power, solar thermal, and biomass).
Although the installed base for solar power reached 12.4 GW in 2007, various nations have set aggressive targets to increase the use of solar PV nationally even further. Spain and Italy have set targets of 1.2 GW, likely by 2010, South Korea has set a target of 1.3 GW by 2012, California has recently announced a target of 3 GW by 2017, and Japan’s target is 100 GW by 2030. Various industry consultants have set targets for 2010 solar installation demand between 8 GW and 26 GW. Our forecast for the solar industry (see Exhibit 3) is primarily based on renewable energy programs announced by various countries and forecasts from the European Photovoltaic Industry Association (EPIA) and PHOTON Consulting. We expect global sales of solar modules to reach 10 GW-12 GW by 2010 from 4 GW in 2007 (note that PHOTON Consulting has suggested demand in 2010 could be over 20 GW).
If most major regions in the world decided to dedicate 10% of annual electric power installations to solar power, the industry could grow another 4x after 2010 before growth would begin to stabilize.
Various industry consultants have set targets for 2010 solar module demand between 8 GW and 26 GW from 4 GW in 2007.
Solar Industry Outlook - May 30, 2008
7
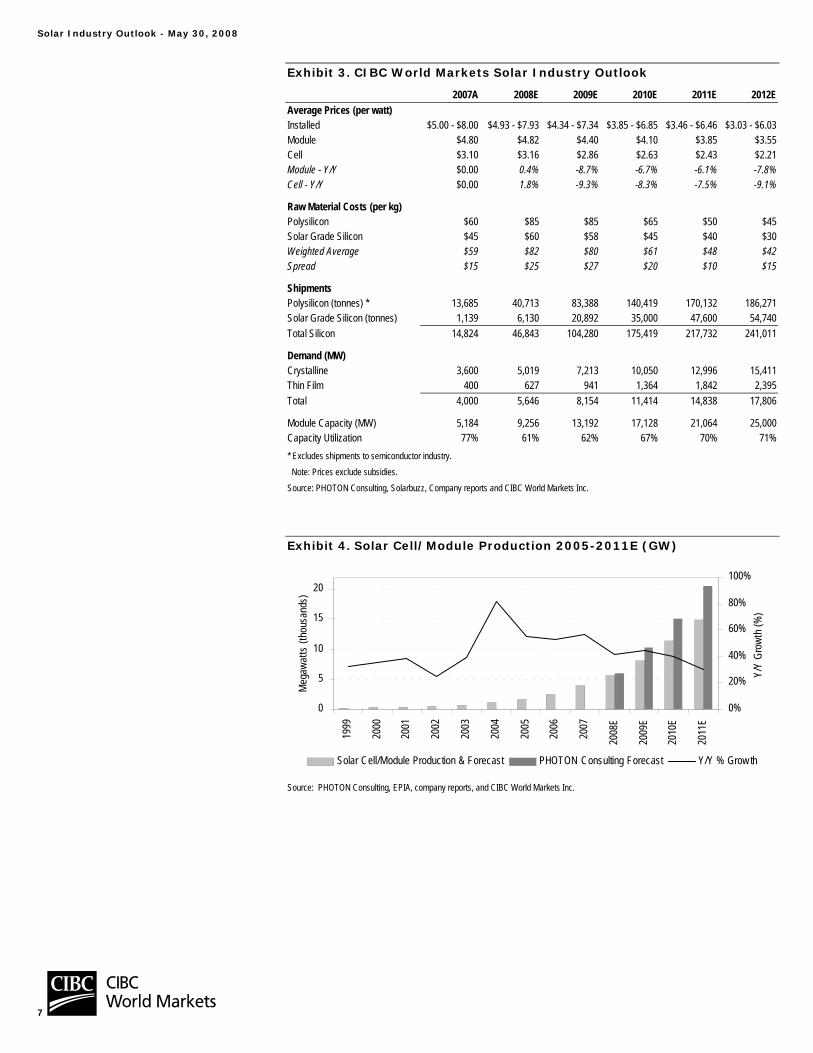
Exhibit 3. CIBC World Markets Solar Industry Outlook
2007A 2008E 2009E 2010E 2011E 2012EAverage Prices (per watt) Installed $5.00 - $8.00 $4.93 - $7.93 $4.34 - $7.34 $3.85 - $6.85 $3.46 - $6.46 $3.03 - $6.03Module $4.80 $4.82 $4.40 $4.10 $3.85 $3.55Cell $3.10 $3.16 $2.86 $2.63 $2.43 $2.21Module - Y/Y $0.00 0.4% -8.7% -6.7% -6.1% -7.8%Cell - Y/Y $0.00 1.8% -9.3% -8.3% -7.5% -9.1%
Raw Material Costs (per kg) Polysilicon $60 $85 $85 $65 $50 $45Solar Grade Silicon $45 $60 $58 $45 $40 $30Weighted Average $59 $82 $80 $61 $48 $42Spread $15 $25 $27 $20 $10 $15
Shipments Polysilicon (tonnes) * 13,685 40,713 83,388 140,419 170,132 186,271Solar Grade Silicon (tonnes) 1,139 6,130 20,892 35,000 47,600 54,740Total Silicon 14,824 46,843 104,280 175,419 217,732 241,011
Demand (MW) Crystalline 3,600 5,019 7,213 10,050 12,996 15,411 Thin Film 400 627 941 1,364 1,842 2,395 Total 4,000 5,646 8,154 11,414 14,838 17,806
Module Capacity (MW) 5,184 9,256 13,192 17,128 21,064 25,000 Capacity Utilization 77% 61% 62% 67% 70% 71%* Excludes shipments to semiconductor industry. Note: Prices exclude subsidies. Source: PHOTON Consulting, Solarbuzz, Company reports and CIBC World Markets Inc.
Exhibit 4. Solar Cell/Module Production 2005-2011E (GW)
0
5
10
15
20
1999
2000
2001
2002
2003
2004
2005
2006
2007
2008
E
2009
E
2010
E
2011
E
Meg
awat
ts (t
hous
ands
)
0%
20%
40%
60%
80%
100%
Y/Y
Grow
th (%
)Solar Cell/Module Production & Forecast PHOTON Consulting Forecast Y/Y % Grow th
Source: PHOTON Consulting, EPIA, company reports, and CIBC World Markets Inc.
Solar Industry Outlook - May 30, 2008
8
Some industry analysts/consultants have suggested that solar is already competitive with the grid in some parts of the world, excluding tariffs. PHOTON Consulting believes that the cost of solar power is below the price of residential grid electricity for 5%-10% of OECD consumption. This would suggest 150 GW-300 GW of solar power, which is significantly higher than the 4 GW installed in 2007. These high-priced markets would include Austria, Belgium, California, Connecticut, Finland, Germany, Hawaii, etc. Peak electricity pricing rates of $0.25/kWh-$0.30/kWh likely exist in a significant portion of these areas. Hawaii is a particularly interesting market since approximately 75%-80% of the state’s electricity production is derived from petroleum (derivatives of crude oil).
While the above revenue growth rate is encouraging, investors are also likely digesting whether this end-market growth will be enough to offset a significant increase in supply over the next few years. As evident from Exhibit 3, using individual company estimates, we are forecasting over 9 GW of solar module supply to come on-line in 2008, and over 17 GW of supply to come on-line over the 2010-2012 time frame. While we believe individual solar companies are willing to operate facilities at below optimal levels of capacity utilization (the extra capacity is merely seen as being opportunistic), we believe a pricing war is possible in the 2009/2010 time frame as manufactures protect market share. Investors are also contemplating about which technologies will be successful in capturing significant market share, and how to align with the best positioned players. Regardless, before we discuss these issues we attempt to answer two of the more basic questions in the solar industry: 1) when will solar power become competitive with traditional grid based electricity?; and, 2) does solar necessarily need to be competitive with the grid in order to be viable?
1. When Will Solar Power Become Competitive With The Grid? Currently, the installed cost for solar systems ranges from $5.00/watt-$8.00/watt (Solarbuzz). Solar module prices are currently at approximately $3.50/watt-$4.80/watt and installation costs typically range from $2.00/watt-$4.00/watt. Module costs typically represent 50%-60% of the installed cost for a full solar energy system. Exhibit 5, provides cost estimates for each part of the solar manufacturing process for a crystalline solar module. Crystalline solar modules supply approximately 85%-90% of the solar industry. See Appendix C for further details related to the solar crystalline production process. Exhibit 6, provides several examples of installations over the past three years at costs that range from $5.00/watt to $10.00/watt.
High-priced electricity markets would include Austria, Belgium, California, Connecticut, Finland, Germany and Hawaii. Hawaii is a particularly interesting market since approximately 75%-80% of the state’s electricity production is derived from petroleum.
Increasing supply is concerning: Based on individual company estimates, we are forecasting over 9 GW of solar module supply to come on-line in 2008, and over 17 GW of supply to come on-line in 2010-2012.

Solar Industry Outlook - May 30, 2008
9
Exhibit 5. Solar System Cost Allocation
20%30%
50%
Approximate Solar System Cost Allocation
Source: Orkla Group, company reports, and CIBC World Markets Inc.
Exhibit 6. Global Solar Installations
Facility Country Application Installation Date
YearSystem Size
MW System Size
kWInstalled Price
$/wShima Seiki Japan Roof Top 2005 0.60 600.00 4.39Tomisuisan Japan Ground Mount 2006 0.10 100.00 5.92Private Investor Spain Ground Tracking 2006 2.44 2,440.00 9.73Napa Valley College United States Ground Tracking 2006 1.20 1,200.00 6.25Bucheim, Wurzburg Germany Ground Mount (TF) 2006 1.70 1,700.00 5.15La Hornera Spain Ground Tracking 2006 0.88 880.00 9.94GE Energy Financial Portugal Ground Tracking 2006 11.00 11,000.00 6.43Monmouth University United States Roof Top 2006 0.46 460.00 6.15Private Investor Germany Roof Top 2006 1.56 1,560.00 6.41Bajadoz Spain Ground Tracking 2006 3.40 3,400.00 9.93Las Gallinas Valley Sanitary District's Treatment Paln United States Ground Mount 2006 0.57 570.00 6.14Community of Waldalgesheim Germany Grand Mount (TF) 2006 4.50 4,500.00 5.56TSK, Gijon Spain Ground Mount (TF) 2006 1.40 1,400.00 5.98Solar University Germany Roof Top 2006 0.55 550.00 6.82MC Architecture United States Ground Mount 2007 0.09 90.00 5.00Fresno State United States Ground Mount 2007 1.10 1,100.00 5.84Nellis Airforce Base United States Ground Tracker / plant 2007 14.00 14,000.00 4.80Sarasota United States Ground Tracker / plant 2008 0.25 250.00 9.75Source: Solarbuzz, Company reports and CIBC World Markets Inc.
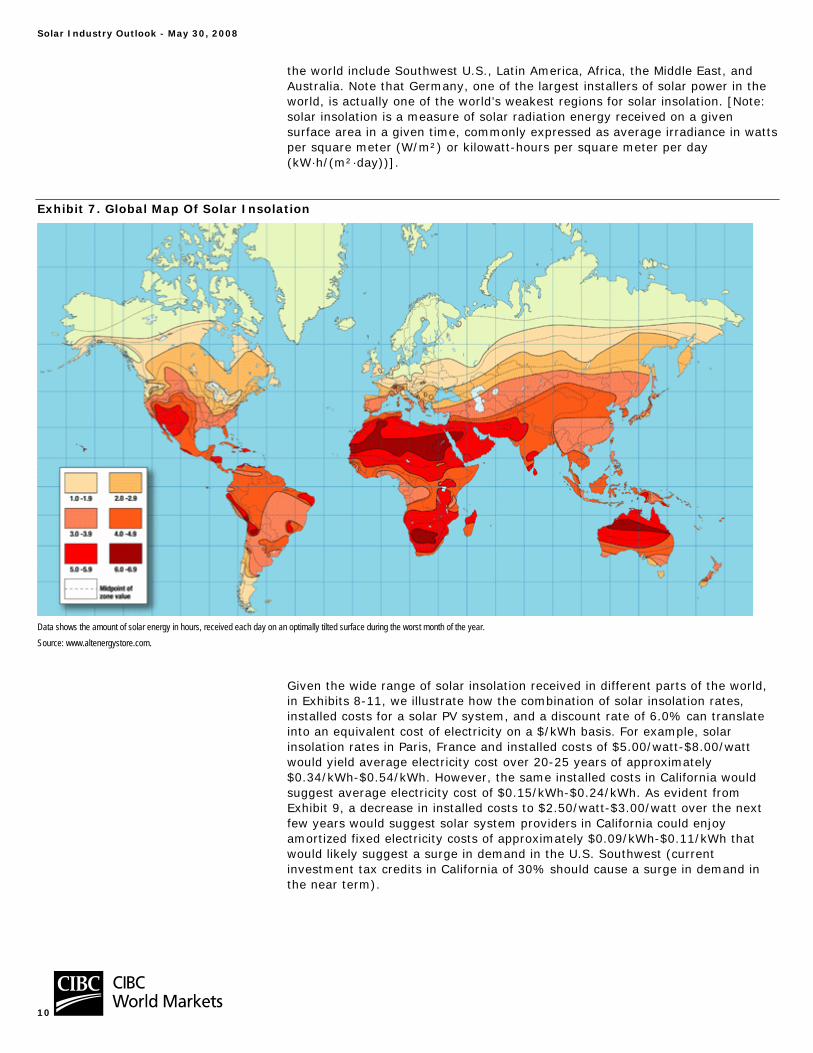
In general, solar competitiveness is essentially a function of existing electricity prices, the amount of sunshine a particular installation receives, and financing costs (interest rates, taxes, etc.). In certain regions of the world where solar radiation is high, PV power can be supplied much more competitively relative to Polar Regions or areas that receive less direct sunlight. Exhibit 7 highlights different areas of the world where solar insolation is best. The best regions of
Solar Industry Outlook - May 30, 2008
10
the world include Southwest U.S., Latin America, Africa, the Middle East, and Australia. Note that Germany, one of the largest installers of solar power in the world, is actually one of the world’s weakest regions for solar insolation. [Note: solar insolation is a measure of solar radiation energy received on a given surface area in a given time, commonly expressed as average irradiance in watts per square meter (W/m²) or kilowatt-hours per square meter per day (kW·h/(m²·day))].
Exhibit 7. Global Map Of Solar Insolation
Data shows the amount of solar energy in hours, received each day on an optimally tilted surface during the worst month of the year. Source: www.altenergystore.com.
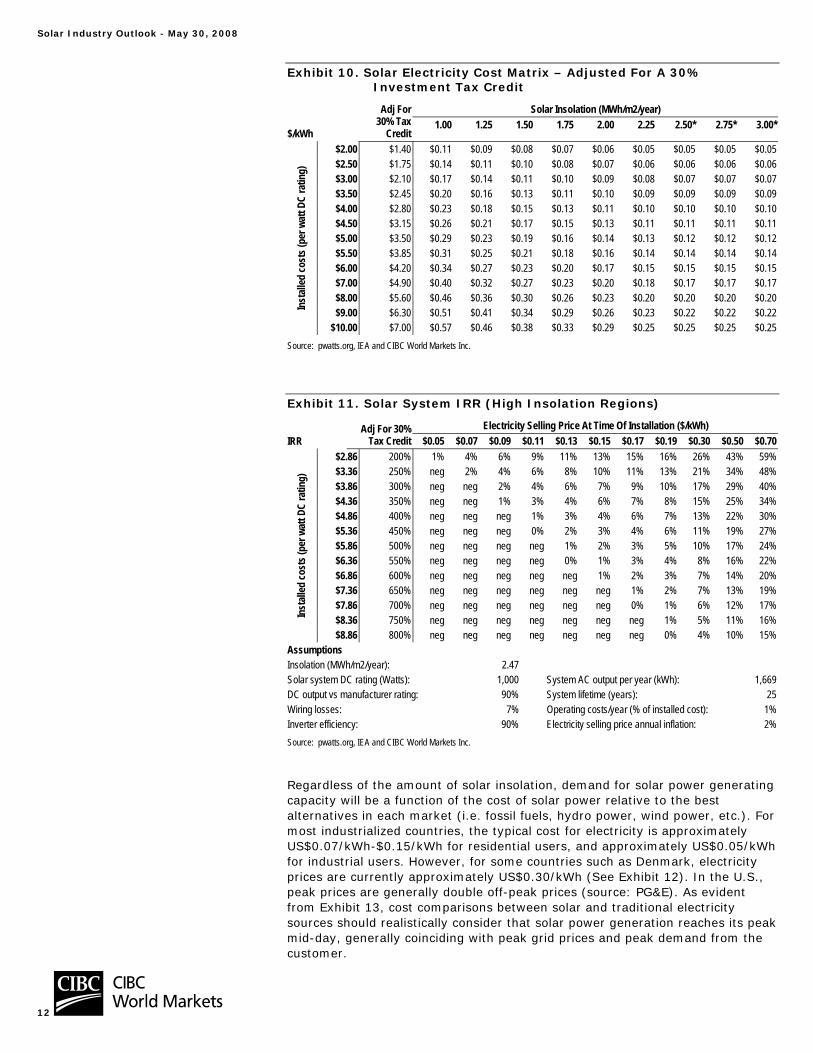
Given the wide range of solar insolation received in different parts of the world, in Exhibits 8-11, we illustrate how the combination of solar insolation rates, installed costs for a solar PV system, and a discount rate of 6.0% can translate into an equivalent cost of electricity on a $/kWh basis. For example, solar insolation rates in Paris, France and installed costs of $5.00/watt-$8.00/watt would yield average electricity cost over 20-25 years of approximately $0.34/kWh-$0.54/kWh. However, the same installed costs in California would suggest average electricity cost of $0.15/kWh-$0.24/kWh. As evident from Exhibit 9, a decrease in installed costs to $2.50/watt-$3.00/watt over the next few years would suggest solar system providers in California could enjoy amortized fixed electricity costs of approximately $0.09/kWh-$0.11/kWh that would likely suggest a surge in demand in the U.S. Southwest (current investment tax credits in California of 30% should cause a surge in demand in the near term).

Solar Industry Outlook - May 30, 2008
11
Exhibit 8. Solar Costs Vary Depending On Solar Insolation
Location Insolation Installed Costs
(per watt) $/kWhTime Value of
MoneyLifetime (Years)
Estimated Grid Costs Difference in Costs
Port Hedland, Western Australia 2.56 $5.00 - $8.00 $0.15 - $0.24 6.0% 25 $0.061 $0.09 - $0.18Daggett, California 2.47 $5.00 - $8.00 $0.16 - $0.25 6.0% 25 $0.121 $0.04 - $0.13Abu Dhabi 2.39 $5.00 - $8.00 $0.16 - $0.26 6.0% 25 $0.074 $0.09 - $0.19Tucson, Arizona 2.35 $5.00 - $8.00 $0.17 - $0.27 6.0% 25 $0.079 $0.09 - $0.19New Delhi, India 2.20 $5.00 - $8.00 $0.18 - $0.28 6.0% 25 $0.043 $0.14 - $0.24Madrid, Spain 1.84 $5.00 - $8.00 $0.21 - $0.34 6.0% 25 $0.091 $0.12 - $0.25Beijing, China 1.78 $5.00 - $8.00 $0.22 - $0.35 6.0% 25 $0.068 $0.15 - $0.28Toronto, Ontario 1.47 $5.00 - $8.00 $0.27 - $0.43 6.0% 25 $0.060 $0.21 - $0.37Munich, Germany 1.30 $5.00 - $8.00 $0.30 - $0.48 6.0% 25 $0.084 $0.22 - $0.40Kagoshima, Japan 1.27 $5.00 - $8.00 $0.31 - $0.49 6.0% 25 $0.121 $0.19 - $0.37Paris, France 1.16 $5.00 - $8.00 $0.34 - $0.54 6.0% 25 $0.053 $0.28 - $0.49* Note that in order to compare the installed costs of power to other traditional forms of electricity in each region we have amortized the installed cost over 25 years (expected life time of the system) and applied a 6% discount rate. Most module companies warrant their products for 20-25 years. However, actual usable lifetimes could be significantly longer. Depending on which region of the world the solar system is installed in, a typical solar panel with a name plate capacity of 100 watts should produce as much as 250Kilowatt hours (kWh) per year in some of the best markets such as Western Australia, California, and Dubai, or as low as 130 kWh in some of the lower insolation areas such as Germany, Japan, or France. Note: Insolation in MWh per square meter per year Source: pvwatts.org, International Energy Agency, CIBC World Markets Inc.
Exhibit 9. Solar Electricity Cost Matrix ($/kWh)
$/kWh Solar Insolation (MWh/m2/year) 1.00 1.25 1.50 1.75 2.00 2.25 2.50* 2.75* 3.00*
$2.00 $0.16 $0.13 $0.11 $0.09 $0.08 $0.07 $0.07 $0.07 $0.07 $2.50 $0.20 $0.16 $0.14 $0.12 $0.10 $0.09 $0.09 $0.09 $0.09 $3.00 $0.24 $0.20 $0.16 $0.14 $0.12 $0.11 $0.11 $0.11 $0.11 $3.50 $0.29 $0.23 $0.19 $0.16 $0.14 $0.13 $0.12 $0.12 $0.12 $4.00 $0.33 $0.26 $0.22 $0.19 $0.16 $0.14 $0.14 $0.14 $0.14 $4.50 $0.37 $0.29 $0.24 $0.21 $0.18 $0.16 $0.16 $0.16 $0.16 $5.00 $0.41 $0.33 $0.27 $0.23 $0.20 $0.18 $0.18 $0.18 $0.18 $5.50 $0.45 $0.36 $0.30 $0.26 $0.22 $0.20 $0.20 $0.20 $0.20 $6.00 $0.49 $0.39 $0.33 $0.28 $0.24 $0.22 $0.21 $0.21 $0.21 $6.50 $0.53 $0.42 $0.35 $0.30 $0.26 $0.24 $0.23 $0.23 $0.23 $7.00 $0.57 $0.46 $0.38 $0.33 $0.29 $0.25 $0.25 $0.25 $0.25 $7.50 $0.61 $0.49 $0.41 $0.35 $0.31 $0.27 $0.27 $0.27 $0.27
Inst
alled
cost
s (pe
r wat
t DC
ratin
g)
$8.00 $0.65 $0.52 $0.43 $0.37 $0.33 $0.29 $0.28 $0.28 $0.28 Assumptions System lifetime (years): 25 DC output vs. manufacturer rating: 90% Time value of money: 6.0% Wiring losses: 7% Cell efficiency: 15% Inverter efficiency: 90% Source: pwatts.org, IEA and CIBC World Markets Inc.
Solar Industry Outlook - May 30, 2008
12
Exhibit 10. Solar Electricity Cost Matrix – Adjusted For A 30% Investment Tax Credit
Solar Insolation (MWh/m2/year)
$/kWh
Adj For 30% Tax
Credit1.00 1.25 1.50 1.75 2.00 2.25 2.50* 2.75* 3.00*
$2.00 $1.40 $0.11 $0.09 $0.08 $0.07 $0.06 $0.05 $0.05 $0.05 $0.05 $2.50 $1.75 $0.14 $0.11 $0.10 $0.08 $0.07 $0.06 $0.06 $0.06 $0.06 $3.00 $2.10 $0.17 $0.14 $0.11 $0.10 $0.09 $0.08 $0.07 $0.07 $0.07 $3.50 $2.45 $0.20 $0.16 $0.13 $0.11 $0.10 $0.09 $0.09 $0.09 $0.09 $4.00 $2.80 $0.23 $0.18 $0.15 $0.13 $0.11 $0.10 $0.10 $0.10 $0.10 $4.50 $3.15 $0.26 $0.21 $0.17 $0.15 $0.13 $0.11 $0.11 $0.11 $0.11 $5.00 $3.50 $0.29 $0.23 $0.19 $0.16 $0.14 $0.13 $0.12 $0.12 $0.12 $5.50 $3.85 $0.31 $0.25 $0.21 $0.18 $0.16 $0.14 $0.14 $0.14 $0.14 $6.00 $4.20 $0.34 $0.27 $0.23 $0.20 $0.17 $0.15 $0.15 $0.15 $0.15 $7.00 $4.90 $0.40 $0.32 $0.27 $0.23 $0.20 $0.18 $0.17 $0.17 $0.17 $8.00 $5.60 $0.46 $0.36 $0.30 $0.26 $0.23 $0.20 $0.20 $0.20 $0.20 $9.00 $6.30 $0.51 $0.41 $0.34 $0.29 $0.26 $0.23 $0.22 $0.22 $0.22 In
stall
ed co
sts (
per w
att D
C ra
ting)
$10.00 $7.00 $0.57 $0.46 $0.38 $0.33 $0.29 $0.25 $0.25 $0.25 $0.25 Source: pwatts.org, IEA and CIBC World Markets Inc.
Exhibit 11. Solar System IRR (High Insolation Regions)
Electricity Selling Price At Time Of Installation ($/kWh) IRR
Adj For 30% Tax Credit $0.05 $0.07 $0.09 $0.11 $0.13 $0.15 $0.17 $0.19 $0.30 $0.50 $0.70
$2.86 200% 1% 4% 6% 9% 11% 13% 15% 16% 26% 43% 59%$3.36 250% neg 2% 4% 6% 8% 10% 11% 13% 21% 34% 48%$3.86 300% neg neg 2% 4% 6% 7% 9% 10% 17% 29% 40%$4.36 350% neg neg 1% 3% 4% 6% 7% 8% 15% 25% 34%$4.86 400% neg neg neg 1% 3% 4% 6% 7% 13% 22% 30%$5.36 450% neg neg neg 0% 2% 3% 4% 6% 11% 19% 27%$5.86 500% neg neg neg neg 1% 2% 3% 5% 10% 17% 24%$6.36 550% neg neg neg neg 0% 1% 3% 4% 8% 16% 22%$6.86 600% neg neg neg neg neg 1% 2% 3% 7% 14% 20%$7.36 650% neg neg neg neg neg neg 1% 2% 7% 13% 19%$7.86 700% neg neg neg neg neg neg 0% 1% 6% 12% 17%$8.36 750% neg neg neg neg neg neg neg 1% 5% 11% 16%In
stall
ed co
sts (
per w
att D
C ra
ting)
$8.86 800% neg neg neg neg neg neg neg 0% 4% 10% 15%Assumptions Insolation (MWh/m2/year): 2.47 Solar system DC rating (Watts): 1,000 System AC output per year (kWh): 1,669DC output vs manufacturer rating: 90% System lifetime (years): 25Wiring losses: 7% Operating costs/year (% of installed cost): 1%Inverter efficiency: 90% Electricity selling price annual inflation: 2%Source: pwatts.org, IEA and CIBC World Markets Inc.
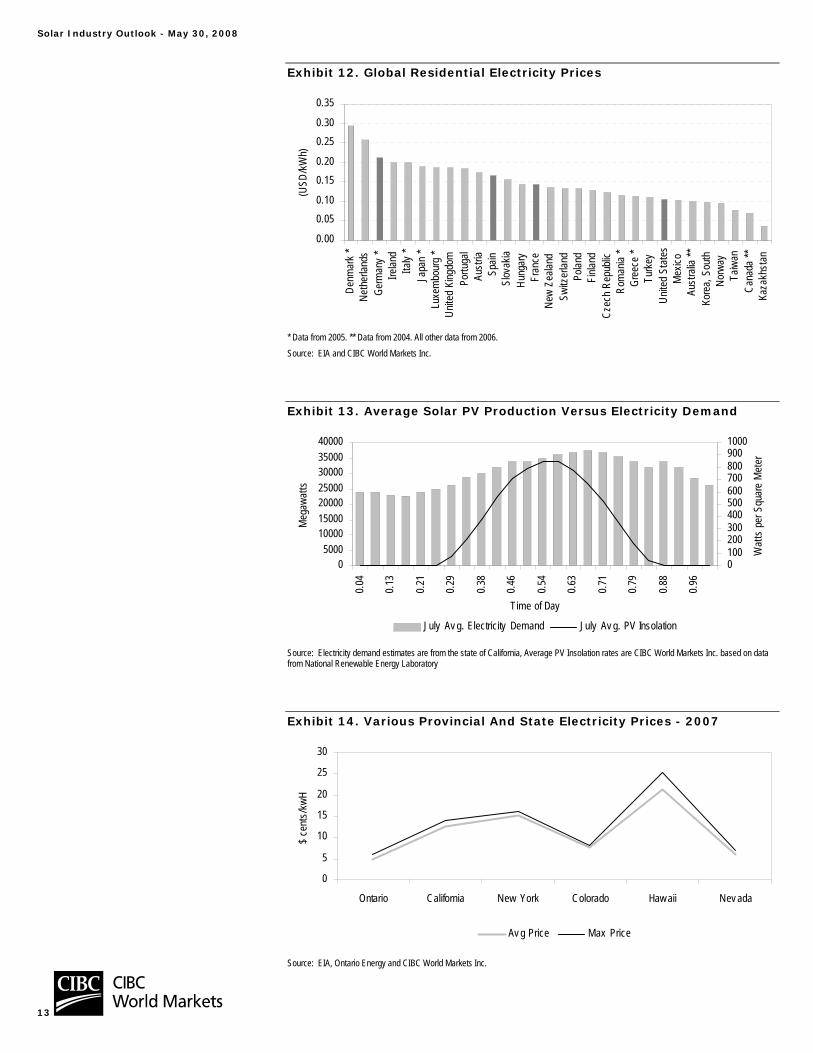
Regardless of the amount of solar insolation, demand for solar power generating capacity will be a function of the cost of solar power relative to the best alternatives in each market (i.e. fossil fuels, hydro power, wind power, etc.). For most industrialized countries, the typical cost for electricity is approximately US$0.07/kWh-$0.15/kWh for residential users, and approximately US$0.05/kWh for industrial users. However, for some countries such as Denmark, electricity prices are currently approximately US$0.30/kWh (See Exhibit 12). In the U.S., peak prices are generally double off-peak prices (source: PG&E). As evident from Exhibit 13, cost comparisons between solar and traditional electricity sources should realistically consider that solar power generation reaches its peak mid-day, generally coinciding with peak grid prices and peak demand from the customer.
Solar Industry Outlook - May 30, 2008
13
Exhibit 12. Global Residential Electricity Prices
0.00
0.050.10
0.150.20
0.250.30
0.35
Denm
ark
*Ne
ther
lands
Ge
rman
y *
Irelan
d Ita
ly *
Japa
n *
Luxe
mbo
urg
*Un
ited
King
dom
Po
rtuga
l Au
stria
Sp
ain
Slov
akia
Hung
ary
Fran
ce
New
Zeala
nd
Switz
erlan
d Po
land
Finla
nd
Czec
h Re
publi
c Ro
man
ia *
Gree
ce *
Turk
ey
Unite
d St
ates
Mex
ico
Aust
ralia
**Ko
rea,
Sou
th
Norw
ay
Taiw
anCa
nada
**Ka
zakh
stan
(USD
/kW
h)
* Data from 2005. ** Data from 2004. All other data from 2006. Source: EIA and CIBC World Markets Inc.
Exhibit 13. Average Solar PV Production Versus Electricity Demand
05000
10000150002000025000300003500040000
0.04
0.13
0.21
0.29
0.38
0.46
0.54
0.63
0.71
0.79
0.88
0.96
Time of Day
Meg
awat
ts
01002003004005006007008009001000
Wat
ts p
er S
quar
e M
eter
July Av g. Electricity Demand July Av g. PV Insolation
Source: Electricity demand estimates are from the state of California, Average PV Insolation rates are CIBC World Markets Inc. based on data from National Renewable Energy Laboratory
Exhibit 14. Various Provincial And State Electricity Prices - 2007
0
5
10
15
20
25
30
Ontario California New York Colorado Haw aii Nev ada
$ ce
nts/
kwH
Av g Price Max Price
Source: EIA, Ontario Energy and CIBC World Markets Inc.
Solar Industry Outlook - May 30, 2008
14
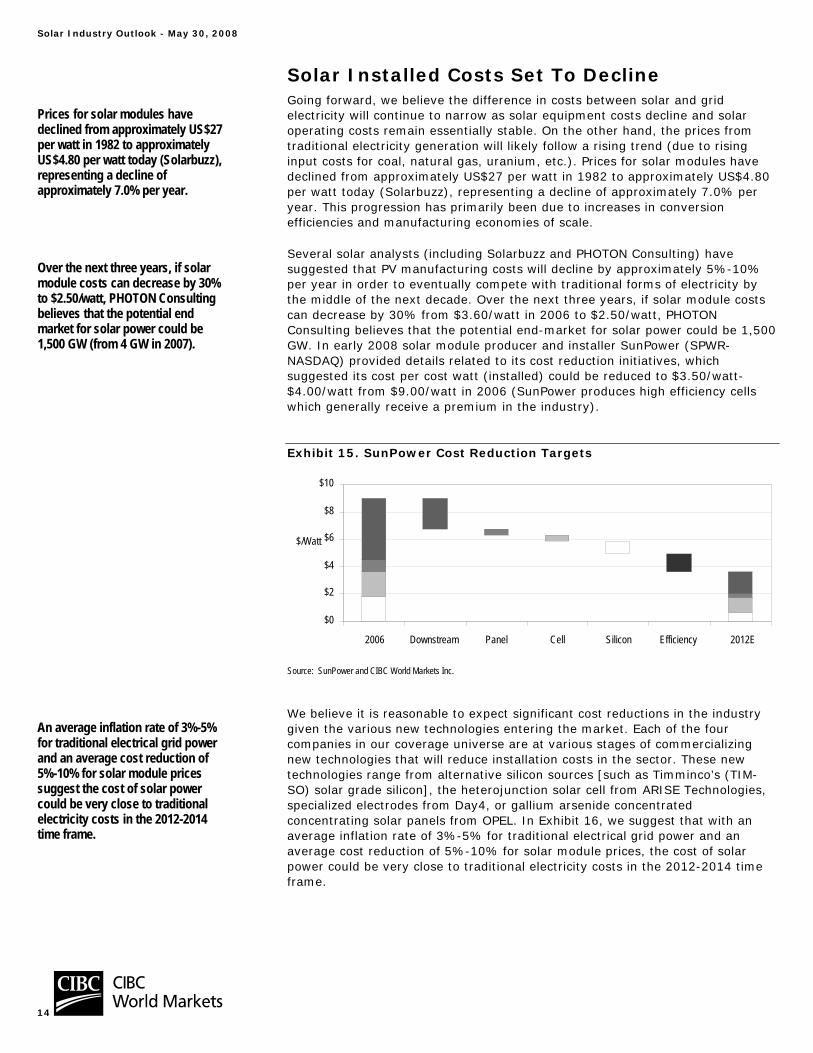
Solar Installed Costs Set To Decline Going forward, we believe the difference in costs between solar and grid electricity will continue to narrow as solar equipment costs decline and solar operating costs remain essentially stable. On the other hand, the prices from traditional electricity generation will likely follow a rising trend (due to rising input costs for coal, natural gas, uranium, etc.). Prices for solar modules have declined from approximately US$27 per watt in 1982 to approximately US$4.80 per watt today (Solarbuzz), representing a decline of approximately 7.0% per year. This progression has primarily been due to increases in conversion efficiencies and manufacturing economies of scale.
Several solar analysts (including Solarbuzz and PHOTON Consulting) have suggested that PV manufacturing costs will decline by approximately 5%-10% per year in order to eventually compete with traditional forms of electricity by the middle of the next decade. Over the next three years, if solar module costs can decrease by 30% from $3.60/watt in 2006 to $2.50/watt, PHOTON Consulting believes that the potential end-market for solar power could be 1,500 GW. In early 2008 solar module producer and installer SunPower (SPWR-NASDAQ) provided details related to its cost reduction initiatives, which suggested its cost per cost watt (installed) could be reduced to $3.50/watt-$4.00/watt from $9.00/watt in 2006 (SunPower produces high efficiency cells which generally receive a premium in the industry).
Exhibit 15. SunPower Cost Reduction Targets
Source: SunPower and CIBC World Markets Inc.
We believe it is reasonable to expect significant cost reductions in the industry given the various new technologies entering the market. Each of the four companies in our coverage universe are at various stages of commercializing new technologies that will reduce installation costs in the sector. These new technologies range from alternative silicon sources [such as Timminco’s (TIM-SO) solar grade silicon], the heterojunction solar cell from ARISE Technologies, specialized electrodes from Day4, or gallium arsenide concentrated concentrating solar panels from OPEL. In Exhibit 16, we suggest that with an average inflation rate of 3%-5% for traditional electrical grid power and an average cost reduction of 5%-10% for solar module prices, the cost of solar power could be very close to traditional electricity costs in the 2012-2014 time frame.
Prices for solar modules have declined from approximately US$27 per watt in 1982 to approximately US$4.80 per watt today (Solarbuzz), representing a decline of approximately 7.0% per year.
Over the next three years, if solar module costs can decrease by 30% to $2.50/watt, PHOTON Consulting believes that the potential end market for solar power could be 1,500 GW (from 4 GW in 2007).
An average inflation rate of 3%-5% for traditional electrical grid power and an average cost reduction of 5%-10% for solar module prices suggest the cost of solar power could be very close to traditional electricity costs in the 2012-2014 time frame.
$0
$2
$4
$6
$8
$10
2006 Downstream Panel Cell Silicon Efficiency 2012E
$/Watt
Solar Industry Outlook - May 30, 2008
15
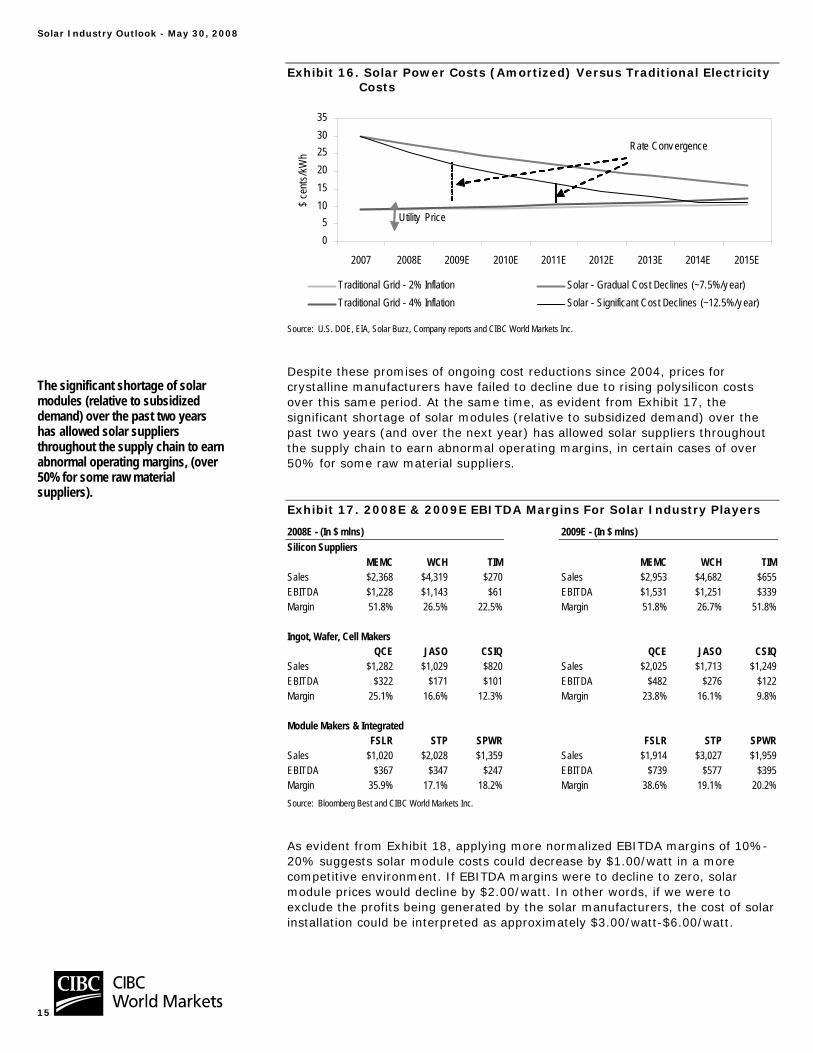
Exhibit 16. Solar Power Costs (Amortized) Versus Traditional Electricity Costs
05
101520253035
2007 2008E 2009E 2010E 2011E 2012E 2013E 2014E 2015E
$ ce
nts/
kWh
Traditional Grid - 2% Inflation Solar - Gradual Cost Declines (~7.5%/y ear)Traditional Grid - 4% Inflation Solar - Significant Cost Declines (~12.5%/y ear)
Utility Price
Rate Conv ergence
Source: U.S. DOE, EIA, Solar Buzz, Company reports and CIBC World Markets Inc.
Despite these promises of ongoing cost reductions since 2004, prices for crystalline manufacturers have failed to decline due to rising polysilicon costs over this same period. At the same time, as evident from Exhibit 17, the significant shortage of solar modules (relative to subsidized demand) over the past two years (and over the next year) has allowed solar suppliers throughout the supply chain to earn abnormal operating margins, in certain cases of over 50% for some raw material suppliers.
Exhibit 17. 2008E & 2009E EBITDA Margins For Solar Industry Players
2008E - (In $ mlns) 2009E - (In $ mlns) Silicon Suppliers
MEMC WCH TIM MEMC WCH TIMSales $2,368 $4,319 $270 Sales $2,953 $4,682 $655 EBITDA $1,228 $1,143 $61 EBITDA $1,531 $1,251 $339 Margin 51.8% 26.5% 22.5% Margin 51.8% 26.7% 51.8% Ingot, Wafer, Cell Makers
QCE JASO CSIQ QCE JASO CSIQSales $1,282 $1,029 $820 Sales $2,025 $1,713 $1,249 EBITDA $322 $171 $101 EBITDA $482 $276 $122 Margin 25.1% 16.6% 12.3% Margin 23.8% 16.1% 9.8% Module Makers & Integrated
FSLR STP SPWR FSLR STP SPWRSales $1,020 $2,028 $1,359 Sales $1,914 $3,027 $1,959 EBITDA $367 $347 $247 EBITDA $739 $577 $395 Margin 35.9% 17.1% 18.2% Margin 38.6% 19.1% 20.2%Source: Bloomberg Best and CIBC World Markets Inc.
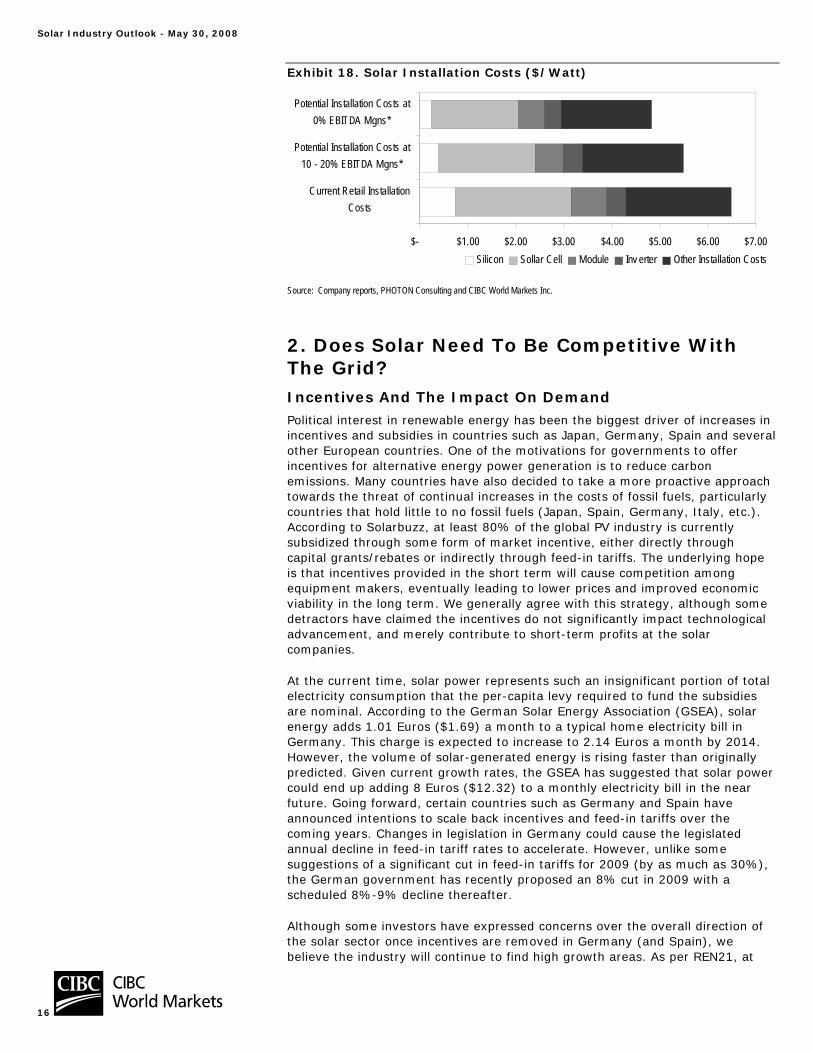
As evident from Exhibit 18, applying more normalized EBITDA margins of 10%-20% suggests solar module costs could decrease by $1.00/watt in a more competitive environment. If EBITDA margins were to decline to zero, solar module prices would decline by $2.00/watt. In other words, if we were to exclude the profits being generated by the solar manufacturers, the cost of solar installation could be interpreted as approximately $3.00/watt-$6.00/watt.
The significant shortage of solar modules (relative to subsidized demand) over the past two years has allowed solar suppliers throughout the supply chain to earn abnormal operating margins, (over 50% for some raw material suppliers).
Solar Industry Outlook - May 30, 2008
16
Exhibit 18. Solar Installation Costs ($/Watt)
$- $1.00 $2.00 $3.00 $4.00 $5.00 $6.00 $7.00
Current Retail InstallationCosts
Potential Installation Costs at10 - 20% EBITDA Mgns*
Potential Installation Costs at0% EBITDA Mgns*
$Silicon Sollar Cell Module Inv erter Other Installation Costs
Source: Company reports, PHOTON Consulting and CIBC World Markets Inc.
2. Does Solar Need To Be Competitive With The Grid? Incentives And The Impact On Demand Political interest in renewable energy has been the biggest driver of increases in incentives and subsidies in countries such as Japan, Germany, Spain and several other European countries. One of the motivations for governments to offer incentives for alternative energy power generation is to reduce carbon emissions. Many countries have also decided to take a more proactive approach towards the threat of continual increases in the costs of fossil fuels, particularly countries that hold little to no fossil fuels (Japan, Spain, Germany, Italy, etc.). According to Solarbuzz, at least 80% of the global PV industry is currently subsidized through some form of market incentive, either directly through capital grants/rebates or indirectly through feed-in tariffs. The underlying hope is that incentives provided in the short term will cause competition among equipment makers, eventually leading to lower prices and improved economic viability in the long term. We generally agree with this strategy, although some detractors have claimed the incentives do not significantly impact technological advancement, and merely contribute to short-term profits at the solar companies.
At the current time, solar power represents such an insignificant portion of total electricity consumption that the per-capita levy required to fund the subsidies are nominal. According to the German Solar Energy Association (GSEA), solar energy adds 1.01 Euros ($1.69) a month to a typical home electricity bill in Germany. This charge is expected to increase to 2.14 Euros a month by 2014. However, the volume of solar-generated energy is rising faster than originally predicted. Given current growth rates, the GSEA has suggested that solar power could end up adding 8 Euros ($12.32) to a monthly electricity bill in the near future. Going forward, certain countries such as Germany and Spain have announced intentions to scale back incentives and feed-in tariffs over the coming years. Changes in legislation in Germany could cause the legislated annual decline in feed-in tariff rates to accelerate. However, unlike some suggestions of a significant cut in feed-in tariffs for 2009 (by as much as 30%), the German government has recently proposed an 8% cut in 2009 with a scheduled 8%-9% decline thereafter.
Although some investors have expressed concerns over the overall direction of the solar sector once incentives are removed in Germany (and Spain), we believe the industry will continue to find high growth areas. As per REN21, at
Solar Industry Outlook - May 30, 2008
17
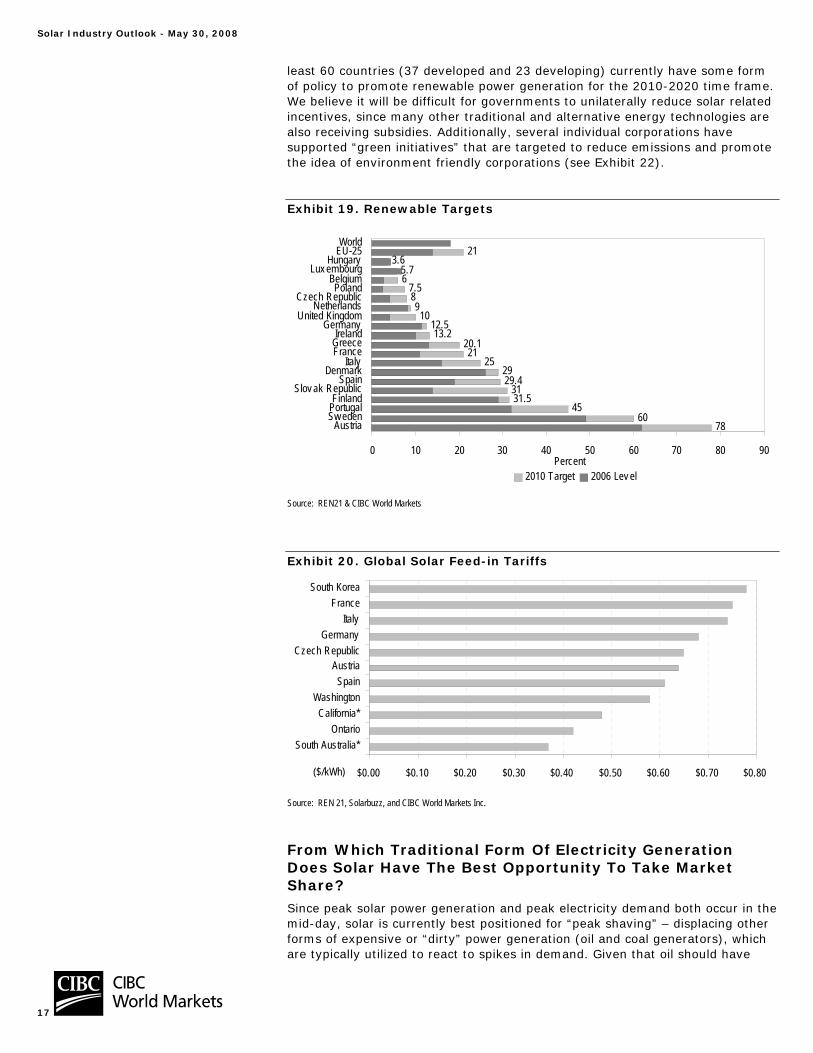
least 60 countries (37 developed and 23 developing) currently have some form of policy to promote renewable power generation for the 2010-2020 time frame. We believe it will be difficult for governments to unilaterally reduce solar related incentives, since many other traditional and alternative energy technologies are also receiving subsidies. Additionally, several individual corporations have supported “green initiatives” that are targeted to reduce emissions and promote the idea of environment friendly corporations (see Exhibit 22).
Exhibit 19. Renewable Targets
7860
4531.531
29.429
2521
20.113.2
12.510
987.5
65.7
3.621
0 10 20 30 40 50 60 70 80 90
AustriaSw edenPortugalFinland
Slov ak RepublicSpain
DenmarkItaly
FranceGreeceIreland
GermanyUnited Kingdom
NetherlandsCzech Republic
PolandBelgium
Lux embourgHungary
EU-25World
Percent2010 Target 2006 Lev el
Source: REN21 & CIBC World Markets
Exhibit 20. Global Solar Feed-in Tariffs
$0.00 $0.10 $0.20 $0.30 $0.40 $0.50 $0.60 $0.70 $0.80
South Australia*Ontario
California*Washington
SpainAustria
Czech RepublicGermany
ItalyFrance
South Korea
($/kWh)
Source: REN 21, Solarbuzz, and CIBC World Markets Inc.
From Which Traditional Form Of Electricity Generation Does Solar Have The Best Opportunity To Take Market Share? Since peak solar power generation and peak electricity demand both occur in the mid-day, solar is currently best positioned for “peak shaving” – displacing other forms of expensive or “dirty” power generation (oil and coal generators), which are typically utilized to react to spikes in demand. Given that oil should have
Solar Industry Outlook - May 30, 2008
18
much more value in the transportation sector, we believe electricity market share for oil will increasingly be taken away by alternative energies such as solar. The use of oil for electricity generation has been declining steadily since the mid-1970s, however, oil still accounted for 5%-6% of global electricity generation in 2004 (most recent statistics available).
Coal-based electricity generation accounted for 38% of world production in 2004, whereas natural gas and renewable energy sources (mainly hydroelectric) each represented approximately 15% and 20%, while nuclear power accounted for 24%. While we believe coal will continue to be a major supplier to the electricity sector because of its low cost, renewable energy will have the best opportunities to take market share away from the coal producers because of the increasing concerns over the production of carbon emissions (see further details below). Natural gas, hydro, and nuclear power will also continue to be dominant sources of electricity for most countries; however, limitations on increasing capacity will cause governments to continue to focus on alternative forms of renewable energy to meet growing demand for electricity.
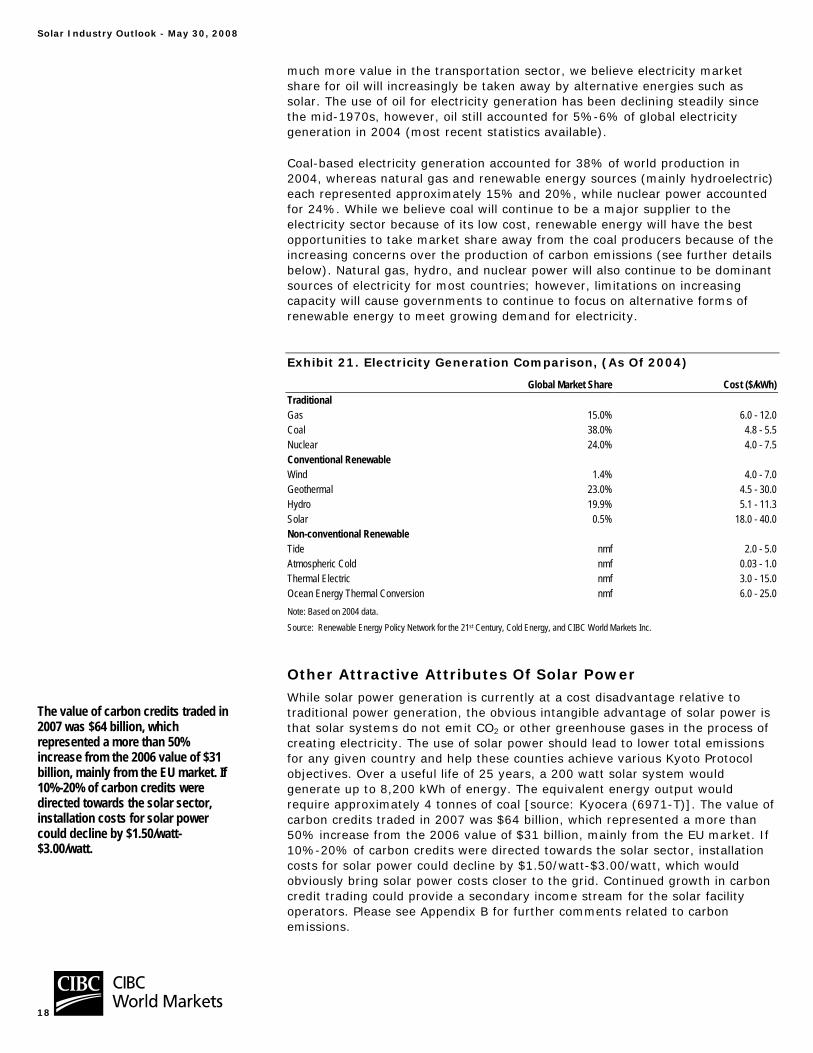
Exhibit 21. Electricity Generation Comparison, (As Of 2004)
Global Market Share Cost ($/kWh)Traditional Gas 15.0% 6.0 - 12.0Coal 38.0% 4.8 - 5.5Nuclear 24.0% 4.0 - 7.5Conventional Renewable Wind 1.4% 4.0 - 7.0Geothermal 23.0% 4.5 - 30.0Hydro 19.9% 5.1 - 11.3Solar 0.5% 18.0 - 40.0Non-conventional Renewable Tide nmf 2.0 - 5.0Atmospheric Cold nmf 0.03 - 1.0Thermal Electric nmf 3.0 - 15.0Ocean Energy Thermal Conversion nmf 6.0 - 25.0Note: Based on 2004 data. Source: Renewable Energy Policy Network for the 21st Century, Cold Energy, and CIBC World Markets Inc.
Other Attractive Attributes Of Solar Power While solar power generation is currently at a cost disadvantage relative to traditional power generation, the obvious intangible advantage of solar power is that solar systems do not emit CO2 or other greenhouse gases in the process of creating electricity. The use of solar power should lead to lower total emissions for any given country and help these counties achieve various Kyoto Protocol objectives. Over a useful life of 25 years, a 200 watt solar system would generate up to 8,200 kWh of energy. The equivalent energy output would require approximately 4 tonnes of coal [source: Kyocera (6971-T)]. The value of carbon credits traded in 2007 was $64 billion, which represented a more than 50% increase from the 2006 value of $31 billion, mainly from the EU market. If 10%-20% of carbon credits were directed towards the solar sector, installation costs for solar power could decline by $1.50/watt-$3.00/watt, which would obviously bring solar power costs closer to the grid. Continued growth in carbon credit trading could provide a secondary income stream for the solar facility operators. Please see Appendix B for further comments related to carbon emissions.
The value of carbon credits traded in 2007 was $64 billion, which represented a more than 50% increase from the 2006 value of $31 billion, mainly from the EU market. If 10%-20% of carbon credits were directed towards the solar sector, installation costs for solar power could decline by $1.50/watt-$3.00/watt.
Solar Industry Outlook - May 30, 2008
19
Other advantages of solar power generation are as follows:
• Cost certainty – solar system costs are primarily up-front. Once equipment is purchased and installation is complete, ongoing maintenance costs are minimal. Variable costs are a larger factor for traditional electricity generation, as prices for coal, uranium, oil and most fossil fuels are relatively much more volatile.
• Scalability – solar systems can be effective at the 100W level and even lower, which is obviously not the case for most other power generation technologies. Wind power is one of the only competitors to solar for rooftop or backyard installations.
• Distributed generation – solar is ideally suited to distributed generation, i.e. generating the electricity closer to where it is used. In some remote areas, costs to construct or tie into an existing grid may be prohibitive, and transportation infrastructure may not be sufficient to deliver gas, oil, etc. There are approximately two billion people in the world in remote locations that currently have no access to electricity. PV systems may be the cheapest method to provide power to some of these locations.
• In general, for any application more than a half mile from the electrical grid, a solar system should be less expensive than power line construction (NREL). As a result, solar has been gaining penetration for non grid-tied products, such as highway warning signs, bus shelters, nautical buoys, and remote communication devices. Nonetheless, the off-grid market remains relatively small, with only approximately 12% of installations worldwide (International Energy Agency).
• Rapid deployment – Due to reduced environmental permitting, solar farms can be constructed far more quickly than other power generating stations such as coal or nuclear.
• Corporate responsibility – Companies such as Wal-Mart (WMT-NYSE), Google (GOOG-NASDAQ), and Costco (COST-NASDAQ), have installed or are installing their own solar power systems. These systems are often promoted in their advertising in order to enhance their company’s image.
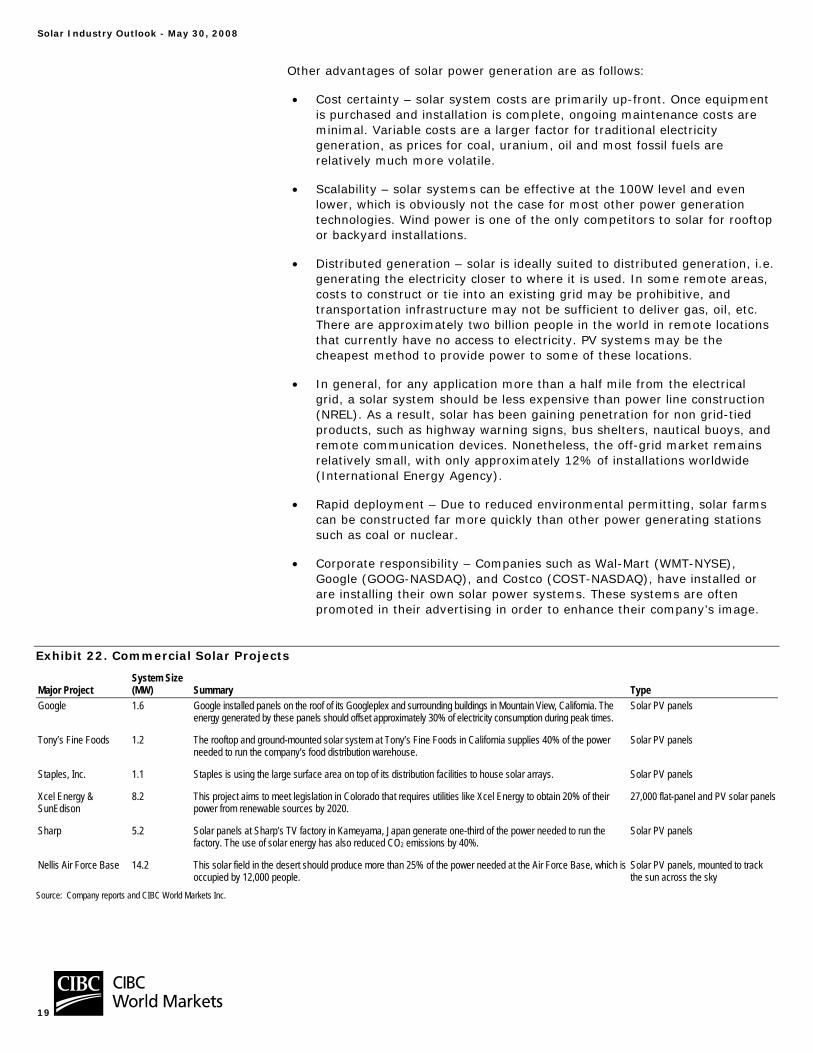
Exhibit 22. Commercial Solar Projects
Major Project System Size (MW) Summary Type
Google 1.6 Google installed panels on the roof of its Googleplex and surrounding buildings in Mountain View, California. The energy generated by these panels should offset approximately 30% of electricity consumption during peak times.
Solar PV panels
Tony’s Fine Foods 1.2 The rooftop and ground-mounted solar system at Tony’s Fine Foods in California supplies 40% of the power needed to run the company’s food distribution warehouse.
Solar PV panels
Staples, Inc. 1.1 Staples is using the large surface area on top of its distribution facilities to house solar arrays. Solar PV panels
Xcel Energy & SunEdison
8.2 This project aims to meet legislation in Colorado that requires utilities like Xcel Energy to obtain 20% of their power from renewable sources by 2020.
27,000 flat-panel and PV solar panels
Sharp 5.2 Solar panels at Sharp’s TV factory in Kameyama, Japan generate one-third of the power needed to run the factory. The use of solar energy has also reduced CO2 emissions by 40%.
Solar PV panels
Nellis Air Force Base 14.2 This solar field in the desert should produce more than 25% of the power needed at the Air Force Base, which is occupied by 12,000 people.
Solar PV panels, mounted to track the sun across the sky
Source: Company reports and CIBC World Markets Inc.
Solar Industry Outlook - May 30, 2008
20
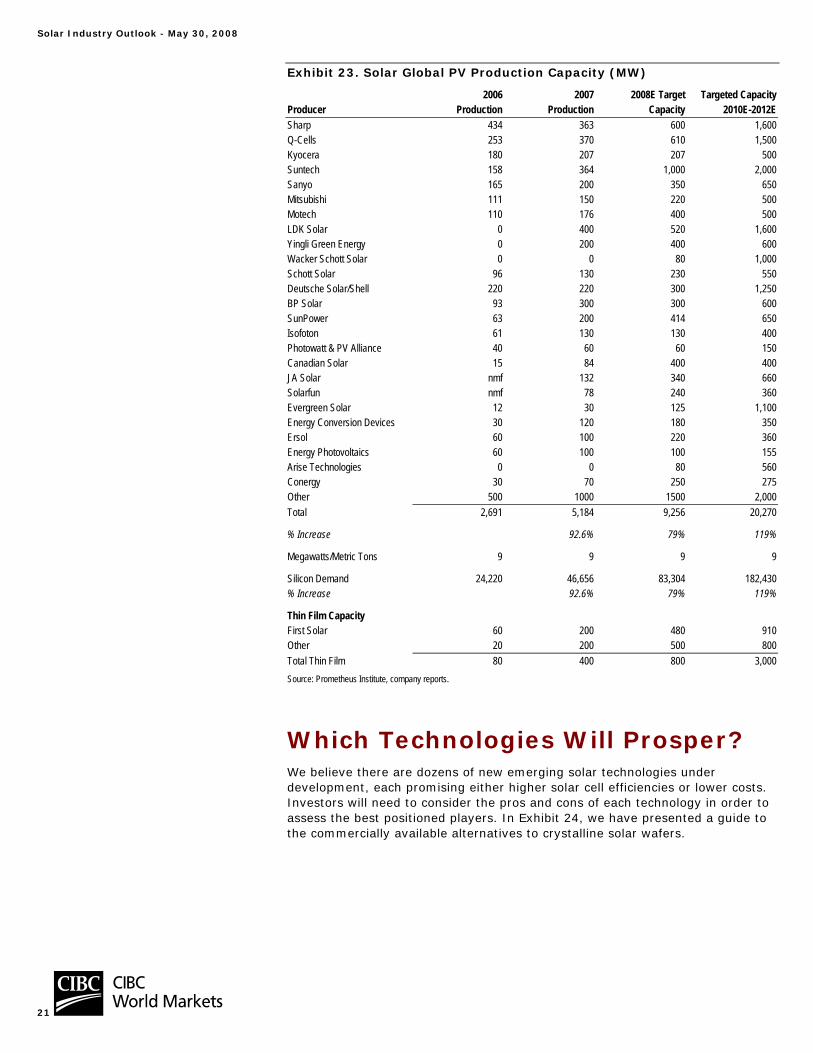
Solar Module Capacity Outlook Solar Module Supply In Exhibit 23, we highlight the major expansions in solar module production capacity that should be coming on-line over the next few years. We have merely accounted for most of the expansion announcements that have been made public, although we are confident several more expansions are already underway or being considered. We estimate that global crystalline based module production was approximately 5,200 MW in 2007. If we consider the expansion targets provided by most solar suppliers, global solar capacity could easily reach 20,000 MW by 2010-2012, which would suggest silicon demand of over 180,000 tonnes. As shown in Exhibit 23, most of the capacity expansions will continue to take place in Europe and China, although capacity in Japan and the U.S. will also continue to increase.
Note that the favourable fundamentals in the solar industry have led to the construction of significantly more module capacity than is likely to be needed over the next few years. We estimate that thin-film solar-based technology will likely add another 2,000 MW-4,000 MW of capacity to global solar module supply. This suggests that silicon demand will not rely on solar module capacity, but instead will rely on the ultimate end-market demand for solar.
Solar Industry Outlook - May 30, 2008
21
Exhibit 23. Solar Global PV Production Capacity (MW)
2006 2007 2008E Target Targeted CapacityProducer Production Production Capacity 2010E-2012ESharp 434 363 600 1,600 Q-Cells 253 370 610 1,500 Kyocera 180 207 207 500 Suntech 158 364 1,000 2,000 Sanyo 165 200 350 650 Mitsubishi 111 150 220 500 Motech 110 176 400 500 LDK Solar 0 400 520 1,600 Yingli Green Energy 0 200 400 600 Wacker Schott Solar 0 0 80 1,000 Schott Solar 96 130 230 550 Deutsche Solar/Shell 220 220 300 1,250 BP Solar 93 300 300 600 SunPower 63 200 414 650 Isofoton 61 130 130 400 Photowatt & PV Alliance 40 60 60 150 Canadian Solar 15 84 400 400 JA Solar nmf 132 340 660 Solarfun nmf 78 240 360 Evergreen Solar 12 30 125 1,100 Energy Conversion Devices 30 120 180 350 Ersol 60 100 220 360 Energy Photovoltaics 60 100 100 155 Arise Technologies 0 0 80 560 Conergy 30 70 250 275 Other 500 1000 1500 2,000 Total 2,691 5,184 9,256 20,270
% Increase 92.6% 79% 119%
Megawatts/Metric Tons 9 9 9 9
Silicon Demand 24,220 46,656 83,304 182,430 % Increase 92.6% 79% 119%
Thin Film Capacity First Solar 60 200 480 910 Other 20 200 500 800 Total Thin Film 80 400 800 3,000 Source: Prometheus Institute, company reports.
Which Technologies Will Prosper? We believe there are dozens of new emerging solar technologies under development, each promising either higher solar cell efficiencies or lower costs. Investors will need to consider the pros and cons of each technology in order to assess the best positioned players. In Exhibit 24, we have presented a guide to the commercially available alternatives to crystalline solar wafers.
Solar Industry Outlook - May 30, 2008
22
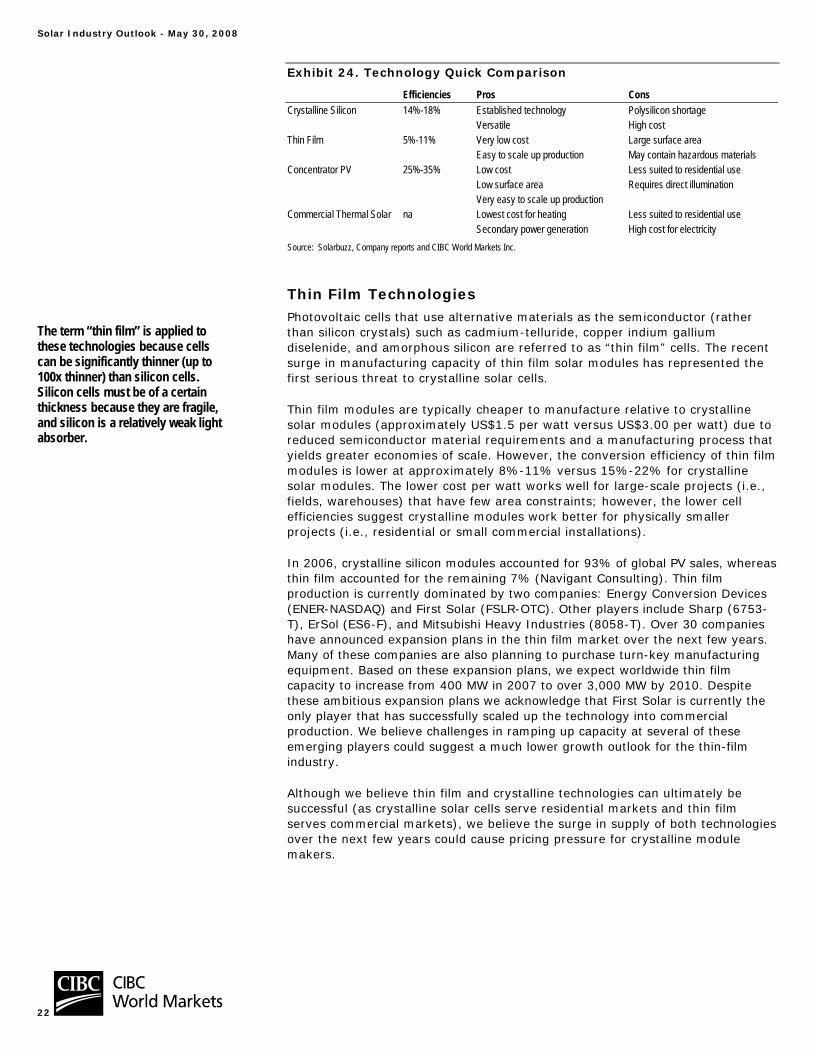
Exhibit 24. Technology Quick Comparison
Efficiencies Pros Cons Crystalline Silicon 14%-18% Established technology Polysilicon shortage Versatile High cost Thin Film 5%-11% Very low cost Large surface area Easy to scale up production May contain hazardous materials Concentrator PV 25%-35% Low cost Less suited to residential use Low surface area Requires direct illumination Very easy to scale up production Commercial Thermal Solar na Lowest cost for heating Less suited to residential use Secondary power generation High cost for electricity Source: Solarbuzz, Company reports and CIBC World Markets Inc.
Thin Film Technologies Photovoltaic cells that use alternative materials as the semiconductor (rather than silicon crystals) such as cadmium-telluride, copper indium gallium diselenide, and amorphous silicon are referred to as “thin film” cells. The recent surge in manufacturing capacity of thin film solar modules has represented the first serious threat to crystalline solar cells.
Thin film modules are typically cheaper to manufacture relative to crystalline solar modules (approximately US$1.5 per watt versus US$3.00 per watt) due to reduced semiconductor material requirements and a manufacturing process that yields greater economies of scale. However, the conversion efficiency of thin film modules is lower at approximately 8%-11% versus 15%-22% for crystalline solar modules. The lower cost per watt works well for large-scale projects (i.e., fields, warehouses) that have few area constraints; however, the lower cell efficiencies suggest crystalline modules work better for physically smaller projects (i.e., residential or small commercial installations).
In 2006, crystalline silicon modules accounted for 93% of global PV sales, whereas thin film accounted for the remaining 7% (Navigant Consulting). Thin film production is currently dominated by two companies: Energy Conversion Devices (ENER-NASDAQ) and First Solar (FSLR-OTC). Other players include Sharp (6753-T), ErSol (ES6-F), and Mitsubishi Heavy Industries (8058-T). Over 30 companies have announced expansion plans in the thin film market over the next few years. Many of these companies are also planning to purchase turn-key manufacturing equipment. Based on these expansion plans, we expect worldwide thin film capacity to increase from 400 MW in 2007 to over 3,000 MW by 2010. Despite these ambitious expansion plans we acknowledge that First Solar is currently the only player that has successfully scaled up the technology into commercial production. We believe challenges in ramping up capacity at several of these emerging players could suggest a much lower growth outlook for the thin-film industry.
Although we believe thin film and crystalline technologies can ultimately be successful (as crystalline solar cells serve residential markets and thin film serves commercial markets), we believe the surge in supply of both technologies over the next few years could cause pricing pressure for crystalline module makers.
The term “thin film” is applied to these technologies because cells can be significantly thinner (up to 100x thinner) than silicon cells. Silicon cells must be of a certain thickness because they are fragile, and silicon is a relatively weak light absorber.
Solar Industry Outlook - May 30, 2008
23
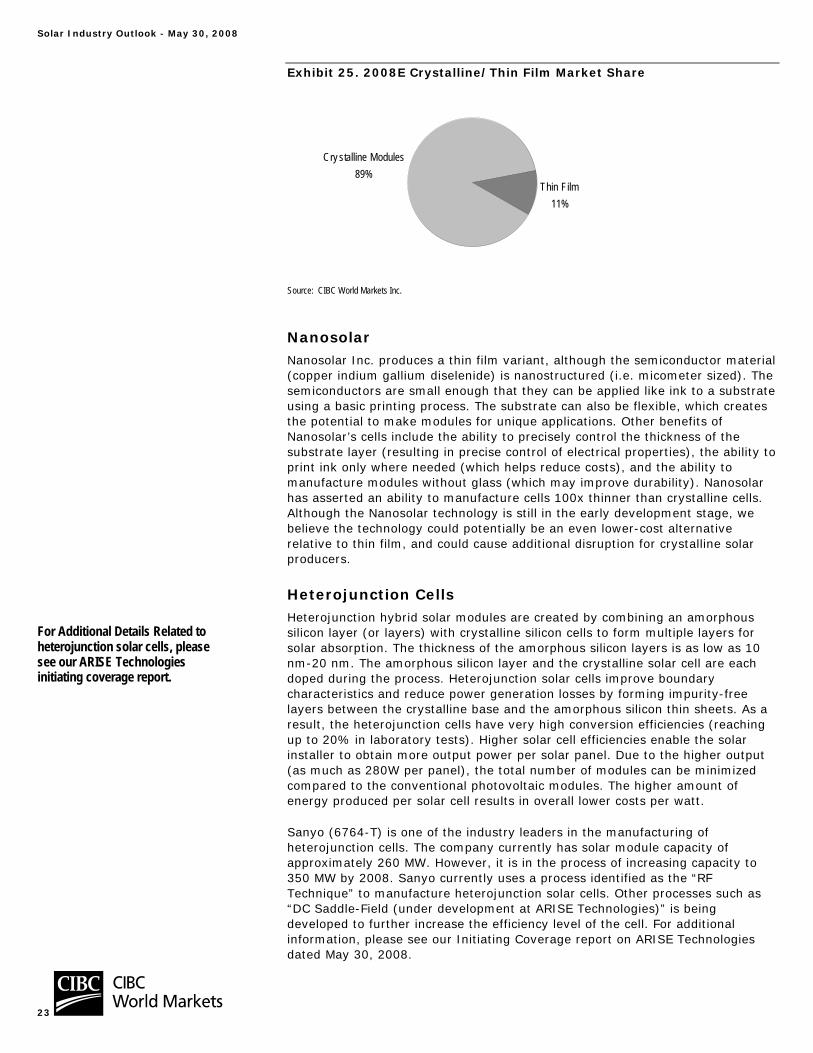
Exhibit 25. 2008E Crystalline/Thin Film Market Share
Cry stalline Modules89%
Thin Film11%
Source: CIBC World Markets Inc.
Nanosolar Nanosolar Inc. produces a thin film variant, although the semiconductor material (copper indium gallium diselenide) is nanostructured (i.e. micometer sized). The semiconductors are small enough that they can be applied like ink to a substrate using a basic printing process. The substrate can also be flexible, which creates the potential to make modules for unique applications. Other benefits of Nanosolar’s cells include the ability to precisely control the thickness of the substrate layer (resulting in precise control of electrical properties), the ability to print ink only where needed (which helps reduce costs), and the ability to manufacture modules without glass (which may improve durability). Nanosolar has asserted an ability to manufacture cells 100x thinner than crystalline cells. Although the Nanosolar technology is still in the early development stage, we believe the technology could potentially be an even lower-cost alternative relative to thin film, and could cause additional disruption for crystalline solar producers.
Heterojunction Cells Heterojunction hybrid solar modules are created by combining an amorphous silicon layer (or layers) with crystalline silicon cells to form multiple layers for solar absorption. The thickness of the amorphous silicon layers is as low as 10 nm-20 nm. The amorphous silicon layer and the crystalline solar cell are each doped during the process. Heterojunction solar cells improve boundary characteristics and reduce power generation losses by forming impurity-free layers between the crystalline base and the amorphous silicon thin sheets. As a result, the heterojunction cells have very high conversion efficiencies (reaching up to 20% in laboratory tests). Higher solar cell efficiencies enable the solar installer to obtain more output power per solar panel. Due to the higher output (as much as 280W per panel), the total number of modules can be minimized compared to the conventional photovoltaic modules. The higher amount of energy produced per solar cell results in overall lower costs per watt.
Sanyo (6764-T) is one of the industry leaders in the manufacturing of heterojunction cells. The company currently has solar module capacity of approximately 260 MW. However, it is in the process of increasing capacity to 350 MW by 2008. Sanyo currently uses a process identified as the “RF Technique” to manufacture heterojunction solar cells. Other processes such as “DC Saddle-Field (under development at ARISE Technologies)” is being developed to further increase the efficiency level of the cell. For additional information, please see our Initiating Coverage report on ARISE Technologies dated May 30, 2008.
For Additional Details Related to heterojunction solar cells, please see our ARISE Technologies initiating coverage report.

Solar Industry Outlook - May 30, 2008
24
Concentrated Photovoltaic Concentrated photovoltaic devices primarily use lenses/mirrors to focus sunlight onto a small solar cell. The primary advantages of concentrated devices are increased conversion efficiencies and smaller (i.e. cheaper) cells. For example, a silicon cell requires approximately 1,250x more active material than a CPV gallium arsenide (GaAs) cell allowing much greater efficiency and a reduced size, compensating for the added cost of GaAs compared to silicon.
In order to maximize the wavelength in the concentrated light, CPVs use multijunction cells. For example, Spectorlab’s [small subsidiary of Boeing (BA-NYSE)] C1MJ is a triple junction cell composed of GaAs, gallium indium phosphide, and a germanium substrate. These cells allow concentrators to operate at an efficiency level approaching 40%. Magnification ratios can range from 10x to 1000x, with higher concentration levels required for commercialization.
CPV systems require direct exposure to the sun at all times making trackers necessary to follow the sun throughout the day. Furthermore, CPVs are less efficient under cloudy conditions restraining its full potential. The additional weight of the concentrating and tracker components has made CPV less attractive for rooftop and other residential applications. However, there have been attempts to build aesthetically pleasing and commercially feasible trackers to overcome this weakness. For further details, please refer to our Initiating Coverage report on OPEL International dated May 30, 2008.
Thermal Solar While not a photovoltaic technology, we have decided to provide a brief description of thermal solar technologies in light of its significant installed capacity and market. For personal use on the residential/building scale, thermal solar energy is primarily used to heat water. On the commercial scale, thermal solar energy is used to create steam to power electric generators. In 2006, solar hot water/heating produced 105 gigawatts-thermal (GW-th) globally, with installations on approximately 50 million households (Source: REN21). REN21 estimates that approximately 23 GW-th were installed in 2007 for $6.4 billion, suggesting 22% growth. Since 2002, the average capacity growth rate has been approximately 17% per annum. China is a significant consumer of solar hot water products, and currently holds approximately 65% global capacity (68 gigawatts-thermal). Turkey, Japan, Germany, Israel, India, Korea, South Africa, and Brazil are also significant markets with government mandates to increase capacity.
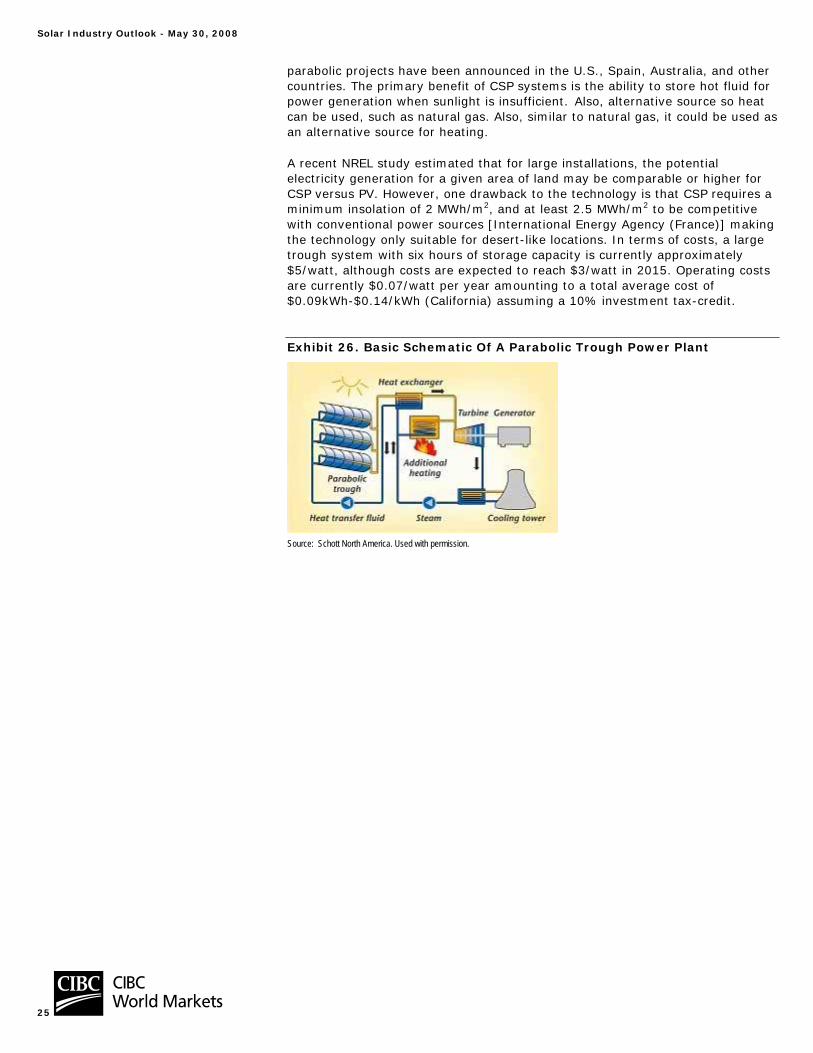
On the commercial scale, there are three primary types of concentrating solar thermal power (CSP) systems: dish, power tower, and parabolic trough. A dish system uses a mirrored dish that concentrates sunlight onto a receiver containing fluid that expands when heated. The expanding fluid places pressure on a turbine, which produces mechanical power that turns a generator to produce electricity. A power tower system uses a field of mirrors that concentrate sunlight onto the top of the tower. The heat from the sunlight melts a salt substrate that is used to boil the water in a steam generator. A parabolic trough system uses U-shaped mirrors that focus sunlight on a pipe that runs through the center of the trough. The pipes carry hot oil from many troughs and the oil is collected centrally. The oil is used to boil water in a steam generator to produce electricity.
CSP facilities were constructed in a variety of countries through to the early-1990s, but from the mid-90s to 2004 there was essentially no investment in commercial scale plants (REN21). However, going forward, a number of large
For Additional Details Related to concentrated photovoltaics, please see our OPEL International initiating coverage report.
Solar Industry Outlook - May 30, 2008
25
parabolic projects have been announced in the U.S., Spain, Australia, and other countries. The primary benefit of CSP systems is the ability to store hot fluid for power generation when sunlight is insufficient. Also, alternative source so heat can be used, such as natural gas. Also, similar to natural gas, it could be used as an alternative source for heating.
A recent NREL study estimated that for large installations, the potential electricity generation for a given area of land may be comparable or higher for CSP versus PV. However, one drawback to the technology is that CSP requires a minimum insolation of 2 MWh/m2, and at least 2.5 MWh/m2 to be competitive with conventional power sources [International Energy Agency (France)] making the technology only suitable for desert-like locations. In terms of costs, a large trough system with six hours of storage capacity is currently approximately $5/watt, although costs are expected to reach $3/watt in 2015. Operating costs are currently $0.07/watt per year amounting to a total average cost of $0.09kWh-$0.14/kWh (California) assuming a 10% investment tax-credit.
Exhibit 26. Basic Schematic Of A Parabolic Trough Power Plant
Source: Schott North America. Used with permission.

Solar Industry Outlook - May 30, 2008
26
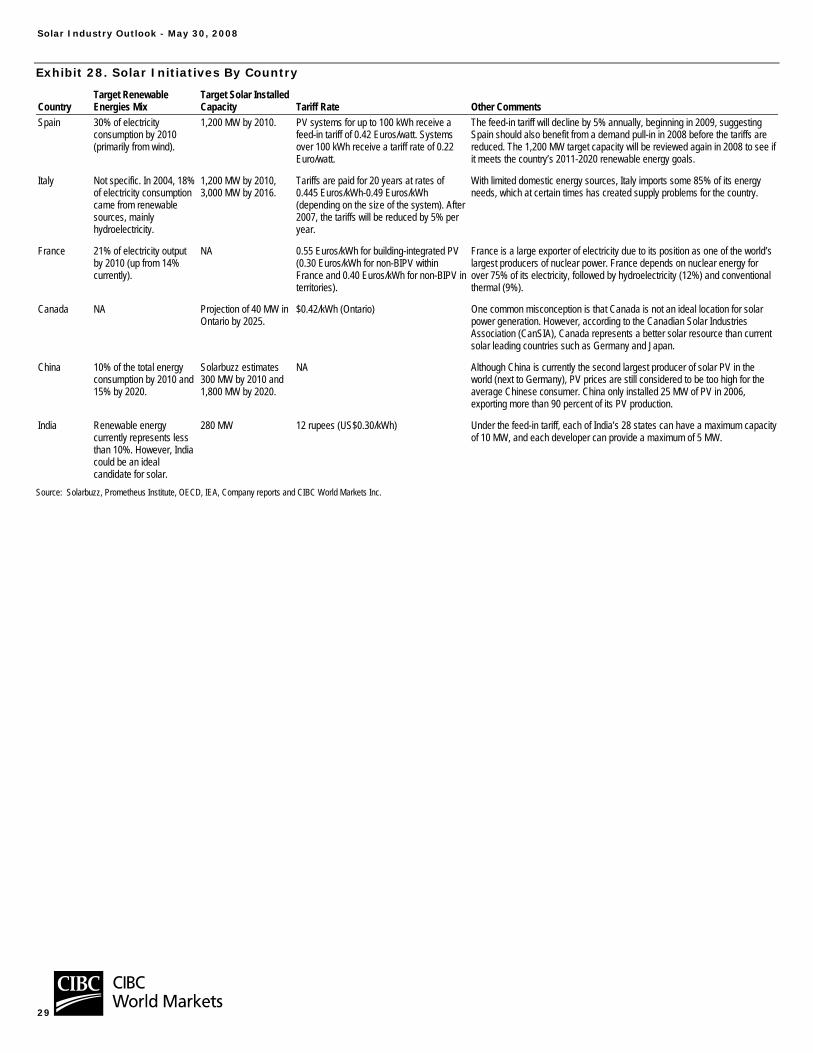
Appendix A: Solar Initiatives By Country Various nations have set aggressive targets to increase the use of solar PV nationally. Spain and Italy have set targets of 1,200 MW, likely by 2010, South Korea has set a target of 1,300 MW by 2012, California has recently announced a target of 3,000 MW by 2017, and Japan’s target is 100,000 MW by 2030. Various industry consultants have set targets for 2010 demand between 6 gigawatts to over 20 GW. Our forecast for the solar industry (see Exhibit 27) is primarily based on renewable energy programs announced by various countries and forecasts from the European Photovoltaic Industry Association (EPIA) and PHOTON Consulting. Government renewable energy promotion programs can be broadly classified as:
• Feed-in tariffs,
• Capital subsidies, grants, or rebates,
• Investment or other tax credits,
• Sales tax, energy tax, excise tax, or VAT tax reductions,
• Energy production payments or tax credits,
• Tradable renewable energy certificates,
• Net metering, and
• Public investments, loans, and financing.
Exhibit 27. Solar Cell/Module Demand By Country (MW)
2002 2003 2004 2005 2006 2007 2008E 2009E 2010EGermany 83 170 546 837 968 1,280 1,600 1,900 2,100 Y/Y Growth 5.1% 104.8% 221.2% 53.3% 15.7% 32.2% 25.0% 18.8% 10.5%Japan 161 218 256 292 300 270 250 280 350Y/Y Growth 32.0% 35.4% 17.4% 14.1% 2.7% -10.0% -7.4% 12.0% 25.0%U.S. 57 66 84 105 141 250 400 650 1,200 Y/Y Growth 54.1% 15.8% 27.3% 25.0% 34.3% 77.3% 60.0% 62.5% 84.6%France nmf Nmf 5.5 6 14 30 150 300 500Y/Y Growth 0.0% 0.0% 0.0% 9.1% 133.3% 114.3% 400.0% 100.0% 66.7%Spain na Na na 35 110 640 800 1,000 1,200 Y/Y Growth 0.0% 0.0% 0.0% 0.0% 214.3% 481.8% 25.0% 25.0% 20.0%Italy/Greece 4 5 5 6.5 20 70 200 400 650Y/Y Growth 0.0% 0.0% 0.0% 0.0% 207.7% 250.0% 185.7% 100.0% 62.5%India na Na na na 12 20 150 450 800 Y/Y Growth 0.0% 0.0% 0.0% 0.0% 0.0% 66.7% 650.0% 200.0% 77.8%South Korea na Na na na 21 50 150 450 800Y/Y Growth 0.0% 0.0% 0.0% 0.0% 0.0% 138.1% 200.0% 200.0% 77.8%Rest of World 125 139 190 399 974 1,390 1,946 2,724 3,814 Y/Y Growth 16.8% 11.2% 36.3% 110.3% 144.4% 42.7% 40.0% 40.0% 40.0%Total 430 598 1,086 1,680 2,560 4,000 5,646 8,154 11,414 Y/Y Growth 24.6% 39.1% 81.6% 54.7% 52.4% 56.3% 41.2% 44.4% 40.0%Source: PHOTON Consulting, Solarbuzz, EPIA, Company reports and CIBC World Markets Inc.
Solar Industry Outlook - May 30, 2008
27
Japan – Began Solar Strategy In 1994 Japan was essentially the first Organization for Economic Co-operation and Development (OECD)-based country to introduce generous incentives and subsidies targeted to support a profitable solar industry. Japan suffers from an acute shortage of domestic sources of energy and therefore imports substantial amounts of crude oil and natural gas. Of Japan’s total generation in 2004, approximately 64% came from thermal (oil, gas, and coal) plants, 23% from nuclear reactors, 10% from hydroelectric dams, and less than 2% from geothermal, solar, and wind. Japan is planning to cut its rate of dependence on oil & gas as a primary energy source from 50% currently to 40% or less by 2030. Under the Kyoto Protocol, Japan will be obliged to cut back CO2 emissions by 6% from 1990 levels by 2008-2012. At the same time, Japan’s nuclear power program has suffered setbacks and public opposition.
The Ministry of Economy, Trade and Industry (METI) of Japan launched a subsidy program for residential PV systems in 1994. Initially, the subsidy covered 50% of the cost of PV systems; the budget for 1994 was 2 billion yen. Spending for the program peaked at 23.5 billion yen in 2001, and by 2005, spending had fallen to 2.63 billion yen. Unit subsidies have been steadily reduced each year with the effect of maintaining net prices (after subsidy) at relatively constant levels. Due to the expiration of its national incentive program, Japan currently offers lower growth prospects than the emerging regions in Europe. However, demand growth in Japan will likely remain in the single digits due to module price declines and escalating traditional energy costs.
Germany The largest share of Germany’s electricity production has come from thermal coal (approximately 47%), followed by nuclear power (26%), natural gas (11%) and wind and hydroelectricity, which together generate 9% of Germany’s electricity needs. Germany’s large domestic coal reserves suggest that coal will remain the country’s main electricity fuel source for the foreseeable future. However, due to environmental concerns, the country has recently increased efforts to develop a solar industry. According to Germany’s Renewable Energies Act, the country aims to increase the share of electricity from renewable sources to 12.5% by 2010, and to 20% by 2020. Under the Act, utilities are obligated to purchase electricity generated from residential and commercial grid-connected PV installations at defined feed-in tariff rates, funded by a small levy on the average German consumer’s electricity bill.
Feed-in tariffs for Germany were introduced in January 1, 2004. The tariff of 0.4342 Euros/kWh resulted in a change from a market in which customer choice was predominantly driven by environmental factors, to one in which an attractive return could be derived from PV installations. The initial rate of 0.4342 Euros/kWh was set to decline at an annual rate of 5% for rooftop installations (6.5% for free-field installations) beginning on the first day of each new year. As a result of these subsidies, solar module sales in Germany grew from 170 MW in 2003 to approximately 1,300 MW in 2007.
We believe demand in 2008-2010 will still be stable, particularly since the recent proposed 8% feed-in tariff rate decline in 2009 was less than the worst case fears of a 30% rate decline. The feed-in tariff will decline by another 8% in 2010 and will decline by 9% in 2011. In light of these tariff declines and the potential for further reductions, we believe many consumers will attempt to complete projects and get them connected to the grid before the end of 2009. For 2010, demand growth in Germany will likely decline due to the accelerated decline of the feed-in tariff and increasing tax burden on consumer’s billings. Today Germany is the largest solar market, but we expect the country’s importance to diminish as demand from new regions accelerates.
Solar Industry Outlook - May 30, 2008
28
U.S.A. According to the Energy Information Administration (EIA), renewable energy accounts for approximately 9.0% of total energy contribution in the U.S. The majority of the renewable energy is produced by hydropower, while PV installations have been relatively minor. In mid-December 2007, the U.S. Senate passed the latest energy bill that primarily focused on corporate average fuel economy (CAFE) standards and biofuels, excluding new incentive guidelines for solar and other renewable energies. Tax credits of approximately US$2,000 for solar installations are currently set to expire at the end of 2008.
We expect the solar industry and environmental groups to pressure Congress and the Senate for a separate bill that includes many of the issues dropped from the energy bill. If an extension of the tax credits is not approved by mid-2008, we would expect a slowdown in solar demand in the U.S. in H2/08. We expect growth in the U.S. to continue mainly driven by state programs such as the ones in California, New Jersey and potentially a major bill in New York. Corporate programs will also continue to be a driver in the U.S.
Next Major Markets – Spain, Italy, France, And Korea The success of the German feed-in tariff program in stimulating solar demand has led other countries such as Spain, Italy, France, and Korea to follow suit. However, Spain, Italy, and France have incorporated megawatt limits on the scale of the programs. The feed-in tariffs in these countries are set at broadly equivalent levels to those in Germany (i.e., above 0.40 Euros/kWh). However, because insolation (sunlight) levels in these countries can be some 50% higher on average, the economics of PV installations are considerably more attractive than in Germany. South Korea is currently offering a feed-in tariff of $0.73/kWh, which is among the highest tariffs in the world. Country specific initiatives are shown in Exhibit 28.
Solar Industry Outlook - May 30, 2008
29
Exhibit 28. Solar Initiatives By Country
Country Target Renewable Energies Mix
Target Solar Installed Capacity Tariff Rate Other Comments
Spain 30% of electricity consumption by 2010 (primarily from wind).
1,200 MW by 2010. PV systems for up to 100 kWh receive a feed-in tariff of 0.42 Euros/watt. Systems over 100 kWh receive a tariff rate of 0.22 Euro/watt.
The feed-in tariff will decline by 5% annually, beginning in 2009, suggesting Spain should also benefit from a demand pull-in in 2008 before the tariffs are reduced. The 1,200 MW target capacity will be reviewed again in 2008 to see if it meets the country’s 2011-2020 renewable energy goals.
Italy Not specific. In 2004, 18% of electricity consumption came from renewable sources, mainly hydroelectricity.
1,200 MW by 2010, 3,000 MW by 2016.
Tariffs are paid for 20 years at rates of 0.445 Euros/kWh-0.49 Euros/kWh (depending on the size of the system). After 2007, the tariffs will be reduced by 5% per year.
With limited domestic energy sources, Italy imports some 85% of its energy needs, which at certain times has created supply problems for the country.
France 21% of electricity output by 2010 (up from 14% currently).
NA 0.55 Euros/kWh for building-integrated PV (0.30 Euros/kWh for non-BIPV within France and 0.40 Euros/kWh for non-BIPV in territories).
France is a large exporter of electricity due to its position as one of the world’s largest producers of nuclear power. France depends on nuclear energy for over 75% of its electricity, followed by hydroelectricity (12%) and conventional thermal (9%).
Canada NA Projection of 40 MW in Ontario by 2025.
$0.42/kWh (Ontario) One common misconception is that Canada is not an ideal location for solar power generation. However, according to the Canadian Solar Industries Association (CanSIA), Canada represents a better solar resource than current solar leading countries such as Germany and Japan.
China 10% of the total energy consumption by 2010 and 15% by 2020.
Solarbuzz estimates 300 MW by 2010 and 1,800 MW by 2020.
NA Although China is currently the second largest producer of solar PV in the world (next to Germany), PV prices are still considered to be too high for the average Chinese consumer. China only installed 25 MW of PV in 2006, exporting more than 90 percent of its PV production.
India Renewable energy currently represents less than 10%. However, India could be an ideal candidate for solar.
280 MW 12 rupees (US$0.30/kWh) Under the feed-in tariff, each of India’s 28 states can have a maximum capacity of 10 MW, and each developer can provide a maximum of 5 MW.
Source: Solarbuzz, Prometheus Institute, OECD, IEA, Company reports and CIBC World Markets Inc.
Solar Industry Outlook - May 30, 2008
30
Appendix B: The Drive To Reduce CO2 The Intergovernmental Panel on Climate Change (IPCC) has suggested that average global temperatures will rise 2.5°F-10.4°F (1.5°C-6.0°C) between 1990 and 2100, partially due to increased combustion of fossil fuels. Aside from rising electricity demand, the growing desire of developing nations to reduce carbon emissions (CO2) has led these countries to work towards creating new rules to lower the amount of Green House Gases (GHG) released from the use of fossil fuels. The gases targeted include CO2, methane, nitrous oxide, sulfur hexafluoride, and hydrofluorocarbons. Countries that ratify the protocol commit to either reducing their emissions or purchasing emission credits from a country whose emissions are below the statutory limit.
Global CO2 emissions from the combustion of fossil fuels grew at an average of 1.4% per year from 1980 to 2004. Total CO2 emissions reached 26.9 billion metric tons in 2004, with oil combustion accounting for 42% of these emissions, natural gas accounting for 20%, and coal accounting for 39%. Coal is the most carbon-intensive of these fuel sources, while natural gas is the least. Countries wishing to reduce CO2 emissions will likely focus on switching from the high carbon content coal to the relatively low carbon content natural gas, however, this would entail a significant economic burden, as natural gas is priced at a 5x premium to coal.
Despite this environmental movement, the rise of manufacturing intensive industries in developing countries such as China has continued to add to global CO2 emissions. Developing countries contributed 90% of the growth in emissions in 2007 (a 50% increase compared to 2006), surpassing the OECD countries’ emission by 2,500 million metric tons (mmt). Given such circumstances, there has been increasing regional movements (both regulatory and voluntary) along with the Kyoto Protocol to both reduce the GHG level and imbalances of regulation that govern the respective countries
Initiatives To Reduce Carbon Emissions To address the rising concerns of global warming and environmental degradation, industrialized countries (180) adopted the Kyoto Protocol promising to reduce the GHG emissions levels by 5% compared to that in 1990. The agreement came into force in 2005 with participants still in the process of meeting the target amounts. There is still ongoing concern and debate as to whether the target levels are achievable given that certain industries are more affected than others. For example, Canada’s oil and gas companies have strongly opposed such standards pointing out the added burden and costs of establishing carbon capture facilities to reduce the emissions.
In order to address such resistance while committing to the Protocol, there has been a movement to create alternative means of reducing emissions. Such initiatives include both punitive (i.e. carbon tax) and economic (i.e. carbon emissions trading market) initiatives, with the latter growing significantly. The European Union has created the European Climate Exchange where “Assigned Allocation Units” of carbon emission is traded amongst the constituents. These credits were created under UN’s protocol to allow members to buy and sell carbon to meet their regulatory demands.
Solar Industry Outlook - May 30, 2008
31
Carbon Trading Market - Financial A total of 2,983 tonnes of CO2 were traded in 2007 compared to 2006 figures of 1,745 tonnes. The value of carbon credits traded in 2007 was $64 billion, which represented a more than 50% increase from the 2006 value of $31 billion, mainly from the EU market (Source: World bank). In comparison, we estimate total sales of solar installations in 2007 were approximately $28 billion. If 10%-20% of carbon credits were directed towards the solar sector, installation costs for solar power could decline by $1.50/watt-$3.00/watt, which would obviously bring solar power costs closer to the grid.
The existence of such credit markets has attracted significant project financing in the developing nations providing further incentives to build climate-friendly facilities. The presence of such instruments allows for companies to snatch additional returns through the selling of such instruments. The value of CDM projects in developing countries amount to $7.4 billion, which represents 551 mmt of CO2 equivalents.
Outlook Most developed countries have established reduction levels with a target year. However, given the growing manufacturing intensive industries in developing nations such as China and India, the total amount of CO2 is not expected to decrease significantly in the future. EIA estimates the average annual percentage change in emissions at 0.8% amongst OECD countries versus a 2.6% in the non-OECD countries from 2004–2030. This is larger than the 1.2% and 2.3% average annual increases during the 1990–2004 periods.
The potential for global trading of carbon emissions credits continues to gain momentum. In light of the growth in the EU, other voluntary compliance exchanges have developed to match the demand and supply of such products. U.S.’s Chicago Climate Exchange has provided means to trade Carbon Financial Futures and lately, Canada has joined the group with its launch of the Montreal Climate Exchange.
Solar Industry Outlook - May 30, 2008
32
Appendix C: Converting Sunlight To Electricity The first practical photovoltaic cell was developed by Bell Laboratories in 1954. Satellites were the primary initial market for photovoltaics, where there was a need for a reliable and long lasting power source, and where costs were of little concern. Following the OPEC oil embargo of 1973, photovoltaics began to be considered as a potential terrestrial power source.
Although photovoltaic cells can be produced using a variety of structures, the most commonly utilized are semiconductors, which are materials that share the properties of both metals (where electrons are loosely bound) and insulators (where electrons are tightly bound). Other types of structures include photo electrochemical, although these are typically only used for research purposes and are not available for commercial purposes.
At normal solar cell operating temperatures, the conductivity of a semiconductor is very low. As such, controlled amounts of impurities are introduced to increase conductivity to more useable levels (commonly known as “doping”). With a silicon semiconductor, if pure silicon (which is in column-IV of the periodic table) was available, it would have to be doped with column-III materials (boron, aluminum, gallium or indium regarded as electron “acceptors”) or with column-V materials (phosphorous, arsenic or antimony know as electron “donors”). Obviously, in the case of polysilicon and UMG-Si, various levels of these dopants already exist in the material. The column-V dopant leaves an additional, loosely bound electron within the crystalline structure, whereas the column-III dopant creates an electron deficiency (or an electron “hole”). Silicon that has been doped with column-III elements is called a p-type semiconductor; whereas silicon that has been doped with column-V elements is called an n-type semiconductor.
When a p-type semiconductor is metallurgically joined to an n-type semiconductor, the configuration produces a p-n junction. Initially, there is a much larger concentration of electrons on the n-side than on the p-side. Conversely, there is a much larger concentration of holes on the p-side than on the n-side. At this initial state, electrons flow from the n-side into the p-side, and holes flow from the p-side to the n-side. This flow results in a region near the junction that is depleted of electrons on the n-side and depleted of holes on the p-side.
The column-V and column III dopants in this depletion region are no longer balanced by the free charges that were there prior to the formation of the junction. As a result of the imbalance, an internal electric field is created with a direction that opposes further flow of electrons from the n-side and holes from the p-side. Thus, in the absence of an external power source no additional current will flow across the junction. If a negative voltage is applied to the p-side, this further discourages current flow. However, if a positive voltage is applied to the p-side, this encourages current flow across the junction. The ability for current to flow in only one direction is critical to the operation of a photovoltaic device.
Energy contained in light is absorbed and promotes electrons to a higher energy state. This disturbs the equilibrium conditions at the depletion region. High energy electrons in the p-side and holes in the n-side are created in sufficient quantities to overcome the electric field which opposes further flow. This results in current flowing from the n-side to the p-side. Since the flow is unidirectional,
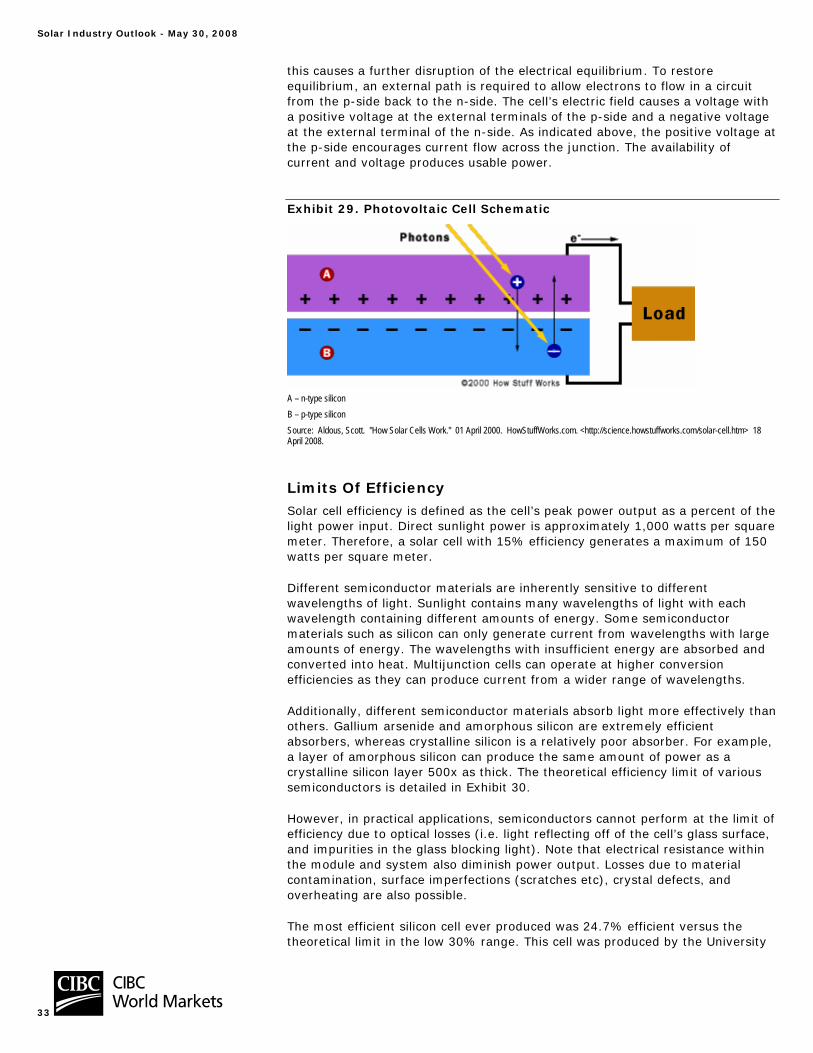
Solar Industry Outlook - May 30, 2008
33
this causes a further disruption of the electrical equilibrium. To restore equilibrium, an external path is required to allow electrons to flow in a circuit from the p-side back to the n-side. The cell’s electric field causes a voltage with a positive voltage at the external terminals of the p-side and a negative voltage at the external terminal of the n-side. As indicated above, the positive voltage at the p-side encourages current flow across the junction. The availability of current and voltage produces usable power.
Exhibit 29. Photovoltaic Cell Schematic
A – n-type silicon B – p-type silicon Source: Aldous, Scott. "How Solar Cells Work." 01 April 2000. HowStuffWorks.com. <http://science.howstuffworks.com/solar-cell.htm> 18 April 2008.
Limits Of Efficiency Solar cell efficiency is defined as the cell’s peak power output as a percent of the light power input. Direct sunlight power is approximately 1,000 watts per square meter. Therefore, a solar cell with 15% efficiency generates a maximum of 150 watts per square meter.
Different semiconductor materials are inherently sensitive to different wavelengths of light. Sunlight contains many wavelengths of light with each wavelength containing different amounts of energy. Some semiconductor materials such as silicon can only generate current from wavelengths with large amounts of energy. The wavelengths with insufficient energy are absorbed and converted into heat. Multijunction cells can operate at higher conversion efficiencies as they can produce current from a wider range of wavelengths.
Additionally, different semiconductor materials absorb light more effectively than others. Gallium arsenide and amorphous silicon are extremely efficient absorbers, whereas crystalline silicon is a relatively poor absorber. For example, a layer of amorphous silicon can produce the same amount of power as a crystalline silicon layer 500x as thick. The theoretical efficiency limit of various semiconductors is detailed in Exhibit 30.
However, in practical applications, semiconductors cannot perform at the limit of efficiency due to optical losses (i.e. light reflecting off of the cell’s glass surface, and impurities in the glass blocking light). Note that electrical resistance within the module and system also diminish power output. Losses due to material contamination, surface imperfections (scratches etc), crystal defects, and overheating are also possible.
The most efficient silicon cell ever produced was 24.7% efficient versus the theoretical limit in the low 30% range. This cell was produced by the University

Solar Industry Outlook - May 30, 2008
34
of New South Wales (Australia) at approximately 100x the cost of a conventional cell. The cells can be purchased from the university for US$300 each.
The most efficient thin film cell ever produced was manufactured by NREL in March 2008. This cell utilized copper indium gallium diselenide and was 19.9% efficient. We believe the most efficient commercially available cell is the Spectrolab gallium arsenide triple junction cell that is 40.7% efficient. The most efficient cell ever produced in a lab was the 45% efficient zinc-manganese-tellurium cell produced by the Lawrence Berkeley National Laboratories.
Exhibit 30. Theoretical Limits Of Conversion Efficiencies
0%
10%
20%
30%
40%
50%
Gallium Arsenide Copper IndiumDiselenide
Cadmium Telluride Silicon Amorphous Silicon
Source: Solarserver and CIBC World Markets Inc.

Solar Industry Outlook - May 30, 2008
35
Appendix D: Are Solar Stocks Too Risky? While share prices of most solar related equities have been volatile over the past two years, most share prices have still followed an upward trajectory. As per Exhibit 31, the Sharpe Ratio (share price return minus the risk free rate over standard deviation) has remained favourable over the past three years. The more challenging outlook for the solar industry in 2009 and 2010 could translate into a less attractive Sharpe Ratio, suggesting that even if share price returns for the sector remain above 10% per year, the volatility in the share prices may be undesirable for many investors.
Exhibit 31. Solar Bellwether Historical Sharpe Ratios
-10%-5%0%5%
10%15%20%25%30%
Jun-
05
Aug-
05
Oct-0
5
Dec-
05
Feb-
06
Apr-0
6
Jun-
06
Aug-
06
Sep-
06
Nov-
06
Jan-
07
Mar
-07
May
-07
Jul-0
7
Sep-
07
Nov-
07
Jan-
08
Feb-
08
Market cap weighted sharpe ratios of SPWR, STP, FSLR, QCE (US$), WFR Source: Bloomberg, Company Reports & CIBC World Markets Inc.
Solar Industry Outlook - May 30, 2008
36
Appendix E: Web Resources How photovoltaics work (a more scientific version) – http://www.thesolarguide.com/solar-energy-systems/solar-photovoltaics-fully-explained.aspx
How photovoltaics work (a more basic version) – http://science.howstuffworks.com/solar-cell1.htm
International Energy Agency national survey reports (including manufacturing data, installation data, and policy developments) – http://www.iea-pvps.org/countries/
NREL (National Renewable Energy Laboratory, USA) – http://www.nrel.gov
PHOTON Consulting – photon-consulting.com
REN21 (Renewable Energy Policy Network for the 21st Century – www.ren21.net
Solarbuzz – www.solarbuzz.com
Solarserver – www.solarserver.de
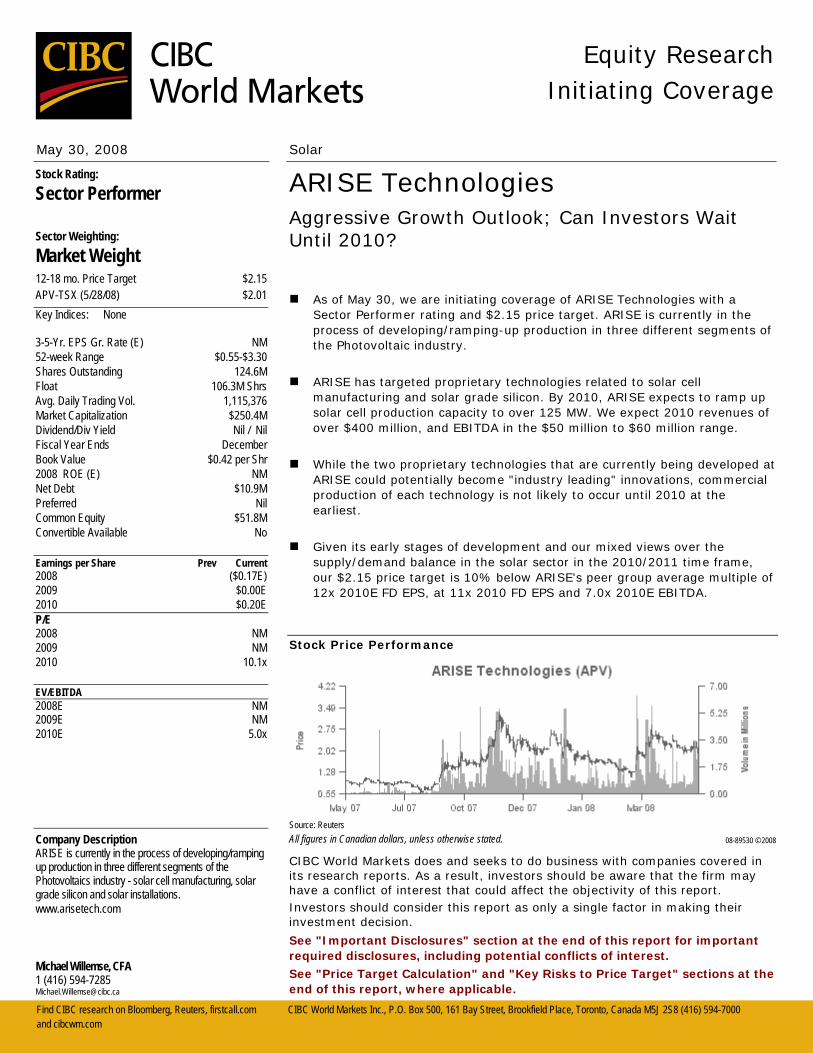
Find CIBC research on Bloomberg, Reuters, firstcall.com CIBC World Markets Inc., P.O. Box 500, 161 Bay Street, Brookfield Place, Toronto, Canada M5J 2S8 (416) 594-7000 and cibcwm.com
Equity Research
Initiating Coverage
May 30, 2008 Solar
ARISE Technologies Aggressive Growth Outlook; Can Investors Wait Until 2010?
As of May 30, we are initiating coverage of ARISE Technologies with a Sector Performer rating and $2.15 price target. ARISE is currently in the process of developing/ramping-up production in three different segments of the Photovoltaic industry.
ARISE has targeted proprietary technologies related to solar cell manufacturing and solar grade silicon. By 2010, ARISE expects to ramp up solar cell production capacity to over 125 MW. We expect 2010 revenues of over $400 million, and EBITDA in the $50 million to $60 million range.
While the two proprietary technologies that are currently being developed at ARISE could potentially become "industry leading" innovations, commercial production of each technology is not likely to occur until 2010 at the earliest.
Given its early stages of development and our mixed views over the supply/demand balance in the solar sector in the 2010/2011 time frame, our $2.15 price target is 10% below ARISE's peer group average multiple of 12x 2010E FD EPS, at 11x 2010 FD EPS and 7.0x 2010E EBITDA.
Stock Price Performance
Source: Reuters All figures in Canadian dollars, unless otherwise stated. 08-89530 © 2008
CIBC World Markets does and seeks to do business with companies covered in its research reports. As a result, investors should be aware that the firm may have a conflict of interest that could affect the objectivity of this report. Investors should consider this report as only a single factor in making their investment decision.
See "Important Disclosures" section at the end of this report for important required disclosures, including potential conflicts of interest. See "Price Target Calculation" and "Key Risks to Price Target" sections at the end of this report, where applicable.
Michael Willemse, CFA 1 (416) 594-7285 [email protected]
Stock Rating:
Sector Performer
Sector Weighting:
Market Weight 12-18 mo. Price Target $2.15 APV-TSX (5/28/08) $2.01 Key Indices: None
3-5-Yr. EPS Gr. Rate (E) NM 52-week Range $0.55-$3.30 Shares Outstanding 124.6M Float 106.3M Shrs Avg. Daily Trading Vol. 1,115,376 Market Capitalization $250.4M Dividend/Div Yield Nil / Nil Fiscal Year Ends December Book Value $0.42 per Shr 2008 ROE (E) NM Net Debt $10.9M Preferred Nil Common Equity $51.8M Convertible Available No Earnings per Share Prev Current 2008 ($0.17E) 2009 $0.00E 2010 $0.20E P/E 2008 NM 2009 NM 2010 10.1x EV/EBITDA 2008E NM 2009E NM 2010E 5.0x Company Description ARISE is currently in the process of developing/ramping up production in three different segments of the Photovoltaics industry - solar cell manufacturing, solar grade silicon and solar installations. www.arisetech.com
Aggressive Growth Outlook; Can Investors Wait Until 2010? - May 30, 2008
38
Investment Summary As of May 30, 2008 we are initiating coverage of ARISE Technologies (APV-TSX) with a Sector Performer rating and a price target of $2.15. ARISE is currently in the process of developing/ramping-up production in three different segments of the Photovoltaic (PV) industry. The company has targeted proprietary technologies related to solar cell manufacturing and solar grade silicon production. Longer term, ARISE expects to also become more active in the solar installations market, particularly in Ontario, Canada. By 2010, we expect the company to ramp up solar cell production capacity to over 125 MW. For 2010 we expect revenues to increase to over $400 million, EBITDA to reach $50 million-$60 million (based on targeted gross margins of approximately 18%-22%), and FD EPS to be in the $0.15 to $0.25 range.
While the two proprietary technologies that are currently being developed at ARISE could potentially become “industry leading” innovations, commercial production of either is not likely to occur until 2010. We also hold mixed views over the supply/demand balance in the solar sector in the 2010/2011 time frame, when ARISE is expected to start ramping up its value added technologies. A significant increase in solar cell capacity and polysilicon supply in 2010/2011 could result in margin pressure throughout the supply chain, suggesting that our 2010 gross margin estimate of 18%-22% may be too optimistic. Furthermore, the scale up in capacity at ARISE could still be considered too small relative to larger global players that may have greater economies of scale. Despite our view of a potential oversupply situation in 2010/2011, we believe the longer-term outlook for the solar sector is favourable. Rising global energy prices, increasing electricity needs in developing countries, and greater environmental concerns will continue to position the solar sector favourably into the next decade.
Our $2.15 valuation of ARISE is based on 11.0x our 2010 FD EPS estimate and 7.0x 2010E EBITDA, at a 10% discount to global solar cell manufacturers and polysilicon suppliers based on 2010 estimates. We believe greater execution risk at ARISE will likely cause the shares to continue to trade at the low-end of the range into 2010. Note that our mixed views of the solar sector supply/demand balance suggest continued volatility in solar-related share prices (including ARISE). We recommend investors build positions conservatively and avoid chasing share prices following positive news announcements. The best time to buy solar-related equities is when cell and module prices have declined and investors begin to panic about the longer-term industry prospects.
Corporate Profile ARISE entered the solar market in 1996 and has operations in Waterloo, Ontario, Canada, and Bischofswerda, Germany. ARISE operates in three primary segments: 1) Photovoltaic Cell Technology; 2) Silicon Technology; and 3) PV Systems. ARISE is currently developing two compelling and potentially disruptive technologies: a hybrid photovoltaic cell that combines thin-film and crystalline cells, and a low-cost solar silicon refining process.
We believe greater execution risk at ARISE will likely cause the shares to continue to trade at the low end of the peer group range into 2010.
ARISE operates in three primary segments: 1) Photovoltaic Cell Technology; 2) Silicon Technology; and 3) PV Systems.

Aggressive Growth Outlook; Can Investors Wait Until 2010? - May 30, 2008
39
Longer-term Outlook ARISE Technologies is a growth story; however, in the near term the company will likely struggle to be competitive against much larger industry players in the solar sector. The company’s current expansion phase will bring annual solar cell capacity to 80 MW and solar grade silicon capacity to 50 tonnes by mid-2009 (with no additional funding requirements). At these capacity levels (in mid-2009) ARISE should achieve revenues of $250 million and EBITDA margins of 10%-15%, with potential annual EBITDA of $25 million-$35 million, and FD EPS of $0.08-$0.13 towards the end of 2009. This in turn would imply a current trading multiple of approximately 15x-25x FD EPS, in-line with the peer average in the solar sector based on 2009 FD EPS. If ARISE can secure an additional $20 million-$30 million of equity financing, the earnings leverage would be significant since this capital could be used to fill-out the company’s existing facility in Bischofswerda, Germany, raising total solar cell capacity to 125 MW. At 125 MW of capacity, we believe ARISE could achieve revenues of $330 million (assuming lower solar cell pricing in 2010) and annual EBITDA margins of 13%-18%, with potential EBITDA of $50 million-$65 million, and FD EPS of $0.20-$0.25. This would imply a current trading multiple of approximately 8.5x-11.0x FD EPS in 2010. If ARISE can be opportunistic and is able to generate all of its future funding without resorting to raising further equity financing (either by raising debt or from government funding), the share price could see even greater upside.
Even if ARISE can reach annual sales of $330 million, the company’s capacity in solar grade silicon will need to be increased further in order to reach proper economies of scale. Ultimately, ARISE hopes to reach 560 MW of solar cell capacity and 10,400 tonnes of solar grade silicon capacity by 2012. At these levels (assuming a declining price environment for solar cells and solar grade silicon) ARISE could generate revenue of $1.2 billion and EBITDA of $280 million-$320 million. However, ARISE will need to raise a significant amount of capital before reaching these levels, particularly at the solar grade silicon operations where capital costs should be $500 million-$670 million. We expect the company to continue to source funding through further equity issues, government grants, debt financing and joint ventures.
Current expansion plans will bring annual solar cell capacity to 80 MW and solar grade silicon capacity to 50 tonnes by the end of2009. At these capacity levels ARISE should achieve revenues of $250 million and FD EPS of $0.08-$0.13 towards the end of 2009.
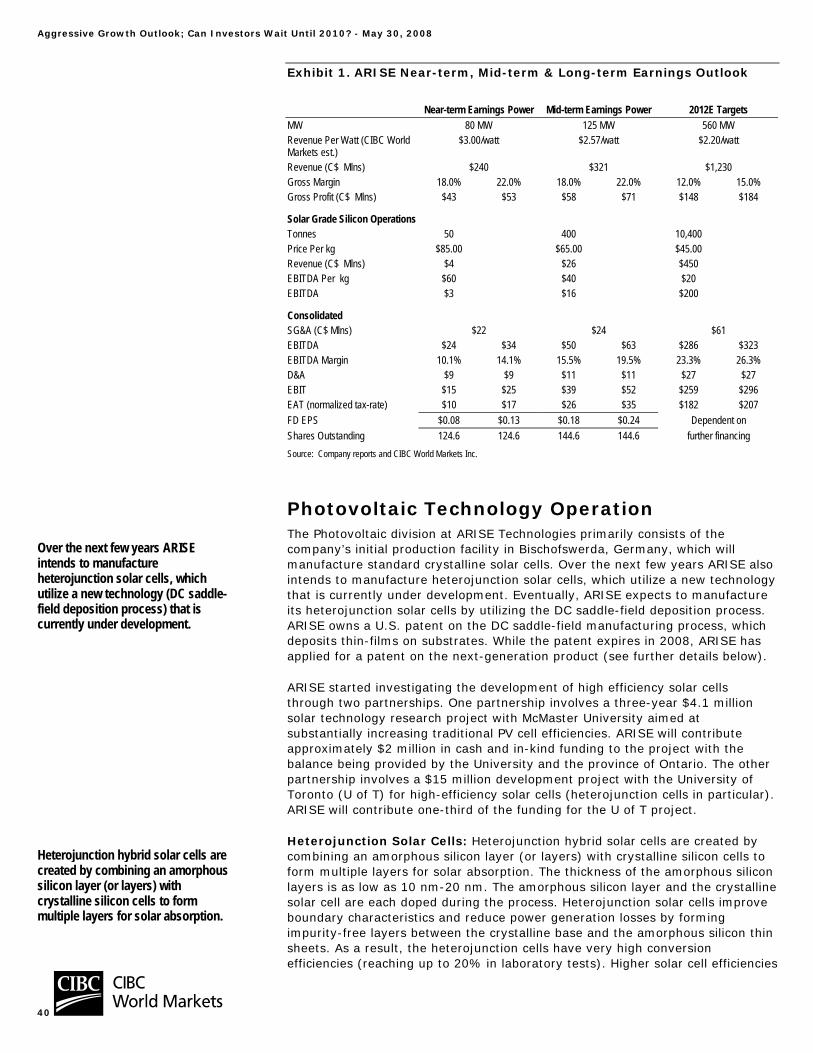
Aggressive Growth Outlook; Can Investors Wait Until 2010? - May 30, 2008
40
Exhibit 1. ARISE Near-term, Mid-term & Long-term Earnings Outlook
Near-term Earnings Power Mid-term Earnings Power 2012E Targets MW 80 MW 125 MW 560 MW Revenue Per Watt (CIBC World Markets est.)
$3.00/watt $2.57/watt $2.20/watt
Revenue (C$ Mlns) $240 $321 $1,230 Gross Margin 18.0% 22.0% 18.0% 22.0% 12.0% 15.0% Gross Profit (C$ Mlns) $43 $53 $58 $71 $148 $184
Solar Grade Silicon Operations Tonnes 50 400 10,400 Price Per kg $85.00 $65.00 $45.00 Revenue (C$ Mlns) $4 $26 $450 EBITDA Per kg $60 $40 $20 EBITDA $3 $16 $200
Consolidated SG&A (C$ Mlns) $22 $24 $61 EBITDA $24 $34 $50 $63 $286 $323 EBITDA Margin 10.1% 14.1% 15.5% 19.5% 23.3% 26.3% D&A $9 $9 $11 $11 $27 $27 EBIT $15 $25 $39 $52 $259 $296 EAT (normalized tax-rate) $10 $17 $26 $35 $182 $207 FD EPS $0.08 $0.13 $0.18 $0.24 Dependent on Shares Outstanding 124.6 124.6 144.6 144.6 further financing Source: Company reports and CIBC World Markets Inc.
Photovoltaic Technology Operation The Photovoltaic division at ARISE Technologies primarily consists of the company’s initial production facility in Bischofswerda, Germany, which will manufacture standard crystalline solar cells. Over the next few years ARISE also intends to manufacture heterojunction solar cells, which utilize a new technology that is currently under development. Eventually, ARISE expects to manufacture its heterojunction solar cells by utilizing the DC saddle-field deposition process. ARISE owns a U.S. patent on the DC saddle-field manufacturing process, which deposits thin-films on substrates. While the patent expires in 2008, ARISE has applied for a patent on the next-generation product (see further details below).
ARISE started investigating the development of high efficiency solar cells through two partnerships. One partnership involves a three-year $4.1 million solar technology research project with McMaster University aimed at substantially increasing traditional PV cell efficiencies. ARISE will contribute approximately $2 million in cash and in-kind funding to the project with the balance being provided by the University and the province of Ontario. The other partnership involves a $15 million development project with the University of Toronto (U of T) for high-efficiency solar cells (heterojunction cells in particular). ARISE will contribute one-third of the funding for the U of T project.
Heterojunction Solar Cells: Heterojunction hybrid solar cells are created by combining an amorphous silicon layer (or layers) with crystalline silicon cells to form multiple layers for solar absorption. The thickness of the amorphous silicon layers is as low as 10 nm-20 nm. The amorphous silicon layer and the crystalline solar cell are each doped during the process. Heterojunction solar cells improve boundary characteristics and reduce power generation losses by forming impurity-free layers between the crystalline base and the amorphous silicon thin sheets. As a result, the heterojunction cells have very high conversion efficiencies (reaching up to 20% in laboratory tests). Higher solar cell efficiencies
Over the next few years ARISE intends to manufacture heterojunction solar cells, which utilize a new technology (DC saddle-field deposition process) that is currently under development.
Heterojunction hybrid solar cells are created by combining an amorphous silicon layer (or layers) with crystalline silicon cells to form multiple layers for solar absorption.
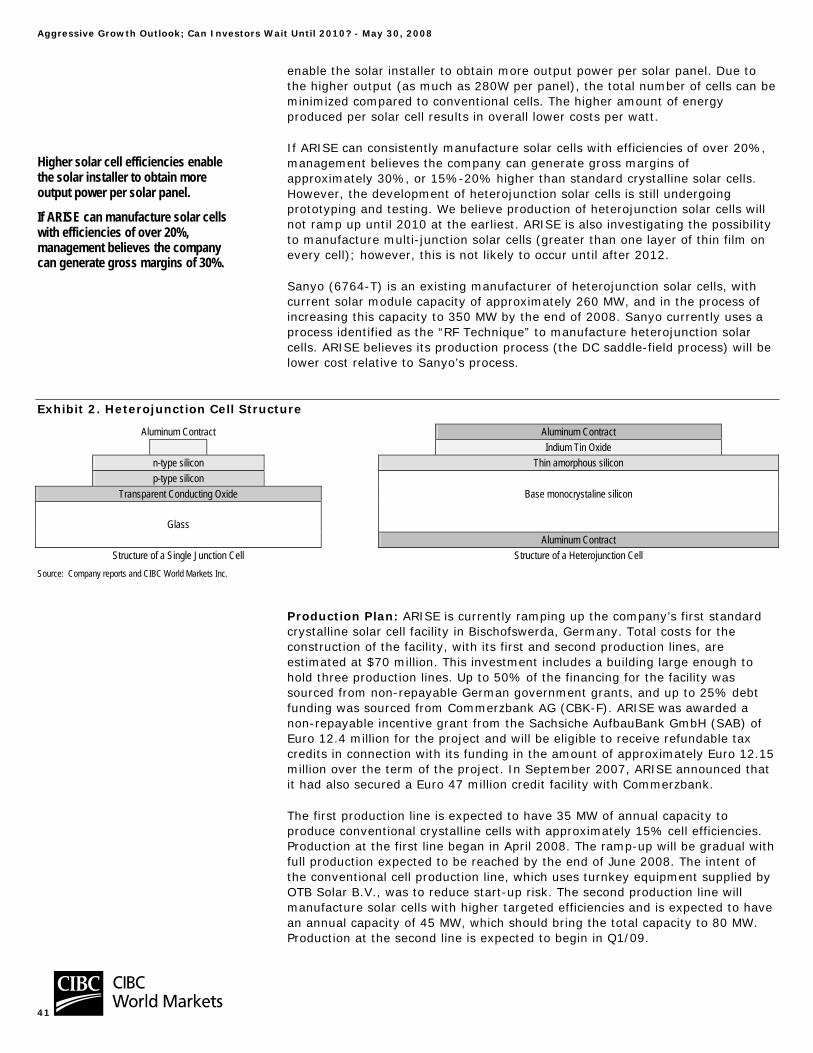
Aggressive Growth Outlook; Can Investors Wait Until 2010? - May 30, 2008
41
enable the solar installer to obtain more output power per solar panel. Due to the higher output (as much as 280W per panel), the total number of cells can be minimized compared to conventional cells. The higher amount of energy produced per solar cell results in overall lower costs per watt.
If ARISE can consistently manufacture solar cells with efficiencies of over 20%, management believes the company can generate gross margins of approximately 30%, or 15%-20% higher than standard crystalline solar cells. However, the development of heterojunction solar cells is still undergoing prototyping and testing. We believe production of heterojunction solar cells will not ramp up until 2010 at the earliest. ARISE is also investigating the possibility to manufacture multi-junction solar cells (greater than one layer of thin film on every cell); however, this is not likely to occur until after 2012.
Sanyo (6764-T) is an existing manufacturer of heterojunction solar cells, with current solar module capacity of approximately 260 MW, and in the process of increasing this capacity to 350 MW by the end of 2008. Sanyo currently uses a process identified as the “RF Technique” to manufacture heterojunction solar cells. ARISE believes its production process (the DC saddle-field process) will be lower cost relative to Sanyo’s process.
Exhibit 2. Heterojunction Cell Structure
Aluminum Contract Aluminum Contract Indium Tin Oxide n-type silicon Thin amorphous silicon p-type silicon
Transparent Conducting Oxide Base monocrystaline silicon
Glass Aluminum Contract
Structure of a Single Junction Cell Structure of a Heterojunction Cell Source: Company reports and CIBC World Markets Inc.
Production Plan: ARISE is currently ramping up the company’s first standard crystalline solar cell facility in Bischofswerda, Germany. Total costs for the construction of the facility, with its first and second production lines, are estimated at $70 million. This investment includes a building large enough to hold three production lines. Up to 50% of the financing for the facility was sourced from non-repayable German government grants, and up to 25% debt funding was sourced from Commerzbank AG (CBK-F). ARISE was awarded a non-repayable incentive grant from the Sachsiche AufbauBank GmbH (SAB) of Euro 12.4 million for the project and will be eligible to receive refundable tax credits in connection with its funding in the amount of approximately Euro 12.15 million over the term of the project. In September 2007, ARISE announced that it had also secured a Euro 47 million credit facility with Commerzbank.
The first production line is expected to have 35 MW of annual capacity to produce conventional crystalline cells with approximately 15% cell efficiencies. Production at the first line began in April 2008. The ramp-up will be gradual with full production expected to be reached by the end of June 2008. The intent of the conventional cell production line, which uses turnkey equipment supplied by OTB Solar B.V., was to reduce start-up risk. The second production line will manufacture solar cells with higher targeted efficiencies and is expected to have an annual capacity of 45 MW, which should bring the total capacity to 80 MW. Production at the second line is expected to begin in Q1/09.
Higher solar cell efficiencies enable the solar installer to obtain more output power per solar panel.
If ARISE can manufacture solar cells with efficiencies of over 20%, management believes the company can generate gross margins of 30%.
Aggressive Growth Outlook; Can Investors Wait Until 2010? - May 30, 2008
42
A third line is expected to be added in late 2009, which would bring total capacity to approximately 125 MW. In total, ARISE plans to install 12 production lines through 2012. Each line will hold capacity of approximately 45 MW-50 MW per year, leading to an ultimate targeted annual capacity of 560 MW by 2012. ARISE is expecting efficiencies from its solar cells to improve by approximately 1% per year from 15% in 2008 to a level in excess of 20% by 2010-2012. At solar cell efficiencies of over 20%, management believes ARISE can generate gross margins in excess of 30%. We estimate capital expenditures will be approximately $25 million-$30 million per line and financing will be derived from similar sources as the first two lines (up to 50% of each line funded by government grants or debt financing). In Exhibit 3, we provide our forecast for cell capacity expansions that will be implemented for each line and the associated capital expenditures.
Exhibit 3. ARISE Solar Cell Capacity Expansion Outlook
07/08E 08/09E 2010E 2011E 2012E 2013E 2014ESolar Cell Division (In C$ Mlns) Total Capacity (MW, end of year) 80.0 125.0 225.0 385.0 560.0 680.0 800.0 Incremental Capacity 80.0 45.0 100.0 160.0 175.0 150.0 150.0 - Capex Per MW $0.88 $0.55 $0.55 $0.55 $0.55 $0.50 $0.50 Capex For Solar Cells $70.0 $24.8 $55.0 $88.0 $96.3 $75.0 $75.0 Source: Company reports and CIBC World Markets Inc.
Further Product Development: ARISE has entered into a research and development collaboration agreement with Komag Inc. (WDC-NYSE) (a supplier of disk drive thin-film platters), whereby the two companies may collaborate on high volume manufacturing of heterojunction cells. ARISE also owns a U.S. manufacturing process patent related to depositing thin-films on silicon wafer heterojunction substrates (the DC saddle-field deposition process). While this process is still three to five years away from commercial production, ARISE believes that it will eventually have a competitive cost advantage by using the DC saddle-field process to build PV cells as both energy and silicon usage are lower with its process. Our channel checks have suggested that downstream solar module manufacturers and system integrators are willing to pay a premium for high-efficiency cells.
DC Saddle-Field: The patented plasma discharge process by ARISE combines the positive attributes of both RF and DC discharge processes to apply thin films of amorphous silicon onto crystalline silicon wafers. It overcomes the drawbacks of configuration difficulties of the RF process and the need for a high pressured environment for the DC process by the placing of the electrodes (anode and cathode) as shown in Exhibit 4. By placing a semi-transparent anode between two cathodes, creating a “sandwich” like formation, electrons approaching the anode can have multiple accesses through both sides of the wall increasing the ionization events that lead to greater control of energy flow while decreasing the need for high pressured environment.
In total, ARISE plans to install 12 solar cell production lines through 2012. Each line will hold capacity of approximately 45 MW-50 MW per year, leading to an ultimate targeted annual capacity of 560 MW by 2012.
The patented plasma discharge process by ARISE combines the positive attributes of both RF and DC discharge processes to apply thin films of amorphous silicon onto crystalline silicon wafers.
Aggressive Growth Outlook; Can Investors Wait Until 2010? - May 30, 2008
43
Exhibit 4. DC Saddle-Field Glow Discharge
Substrate Cathode Anode Cathode Substrate
e-
Wiree-
Amorphous-Micro-Nano-cry staline Silicon Alloy Film
Source: Company Reports, University of Toronto
Supply: ARISE has secured silicon feedstock from several sources. Two contracts were announced in 2007. One of the largest suppliers to ARISE will be Deutsche Solar AG [a subsidiary of SolarWorld (SWV-D)]. Beginning January 1, 2008 and ramping up through to the end of 2017, the 10-year contract will provide wafers sufficient for 200 MW of production. Another supply agreement was reached with Deutschland GmbH for 14 MW of silicon wafers over a three-year period.
In late March 2008, ARISE announced that the company had finalized a total of six silicon wafer supply agreements with volumes to meet approximately 80% of its expected 2008 production requirements. Most of the agreements that have been signed are multi-year supply commitments. ARISE expects the balance of their requirements will be met on a best-efforts basis by these six companies. ARISE also plans to begin small production of its own solar grade silicon at the end of 2008 (see Silicon Feedstock Operations section). ARISE has entered into a $14 million credit facility agreement with Commerzbank AG to be used for the purchase of silicon wafer inventory.
ARISE is hoping for spot silicon prices to decline to near its contract levels sometime in 2009. While this may be overly optimistic (our forecast suggests a balanced supply/demand environment does not evolve until late 2009/2010), we acknowledge that such an outcome is possible. However, we also believe that lower polysilicon costs would likely be offset by lower solar cell prices.
Distribution: ARISE has also signed non-binding letters of intent to supply solar cells to four companies. These agreements account for 60 MW of the 80 MW of total capacity at lines 1 and 2. On January 10, 2008 ARISE announced an agreement with SOLON AG (SOO1-F), a solar module manufacturer based out of Germany, to supply 212 MW of PV cells over a five-year period (from Q2/08 to December 2012). The first year of the five-year agreement is take or pay, with subsequent pricing to be negotiated on a year-by-year basis. Furthermore, on April 30, 2008, ARISE announced that the company had signed a five-year contract to supply PV cells to aleo solar AG (AS1-F) of Germany. Under the terms of the agreement, commencing in Q2/08 through 2012, ARISE will supply aleo with 90 megawatts of PV cells.
Increasing Global Supply Could Be A Concern: As highlighted in our industry outlook (see report, “Solar Industry Outlook”, May 30, 2008), we expect several major expansions of solar cell production capacity to be completed over the next few years at various global industry players. We estimate that global solar cell manufacturing capacity will reach 18,000 MW in the 2010-2012 period from current capacity of 5,000 MW. In Exhibit 5, we
In late March 2008, ARISE announced that the company had finalized a total of six silicon wafer supply agreements with volumes to meet approximately 80% of its expected 2008 production requirements.
ARISE has also signed non-binding letters of intent to supply solar cells to four companies. These agreements account for 60 MW of the 80 MW of total capacity at lines 1 and 2.
We estimate that global solar cell manufacturing capacity will reach 18,000 MW in the 2010-2012 period from current capacity of 5,000 MW.
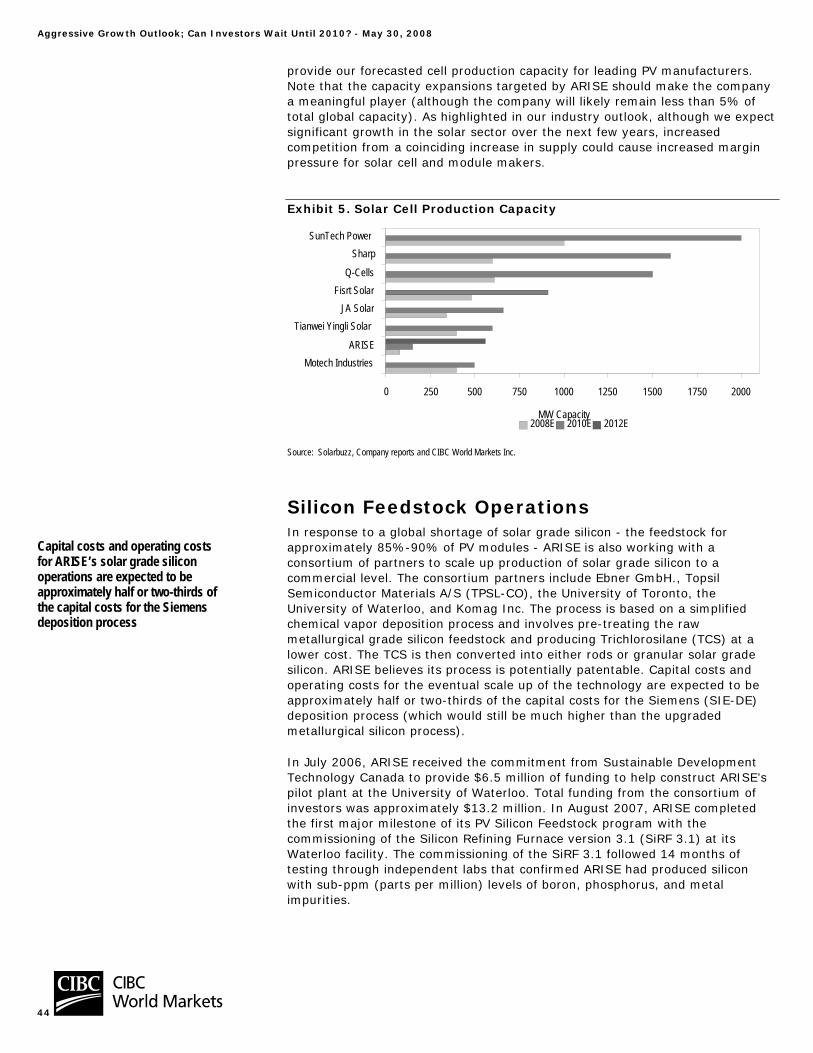
Aggressive Growth Outlook; Can Investors Wait Until 2010? - May 30, 2008
44
provide our forecasted cell production capacity for leading PV manufacturers. Note that the capacity expansions targeted by ARISE should make the company a meaningful player (although the company will likely remain less than 5% of total global capacity). As highlighted in our industry outlook, although we expect significant growth in the solar sector over the next few years, increased competition from a coinciding increase in supply could cause increased margin pressure for solar cell and module makers.
Exhibit 5. Solar Cell Production Capacity
Source: Solarbuzz, Company reports and CIBC World Markets Inc.
Silicon Feedstock Operations In response to a global shortage of solar grade silicon - the feedstock for approximately 85%-90% of PV modules - ARISE is also working with a consortium of partners to scale up production of solar grade silicon to a commercial level. The consortium partners include Ebner GmbH., Topsil Semiconductor Materials A/S (TPSL-CO), the University of Toronto, the University of Waterloo, and Komag Inc. The process is based on a simplified chemical vapor deposition process and involves pre-treating the raw metallurgical grade silicon feedstock and producing Trichlorosilane (TCS) at a lower cost. The TCS is then converted into either rods or granular solar grade silicon. ARISE believes its process is potentially patentable. Capital costs and operating costs for the eventual scale up of the technology are expected to be approximately half or two-thirds of the capital costs for the Siemens (SIE-DE) deposition process (which would still be much higher than the upgraded metallurgical silicon process).
In July 2006, ARISE received the commitment from Sustainable Development Technology Canada to provide $6.5 million of funding to help construct ARISE’s pilot plant at the University of Waterloo. Total funding from the consortium of investors was approximately $13.2 million. In August 2007, ARISE completed the first major milestone of its PV Silicon Feedstock program with the commissioning of the Silicon Refining Furnace version 3.1 (SiRF 3.1) at its Waterloo facility. The commissioning of the SiRF 3.1 followed 14 months of testing through independent labs that confirmed ARISE had produced silicon with sub-ppm (parts per million) levels of boron, phosphorus, and metal impurities.
Capital costs and operating costs for ARISE’s solar grade silicon operations are expected to be approximately half or two-thirds of the capital costs for the Siemens deposition process
0 250 500 750 1000 1250 1500 1750 2000
Motech IndustriesARISE
Tianwei Yingli SolarJA Solar
Fisrt SolarQ-Cells
SharpSunTech Power
MW Capacity 2008E 2010E 2012E
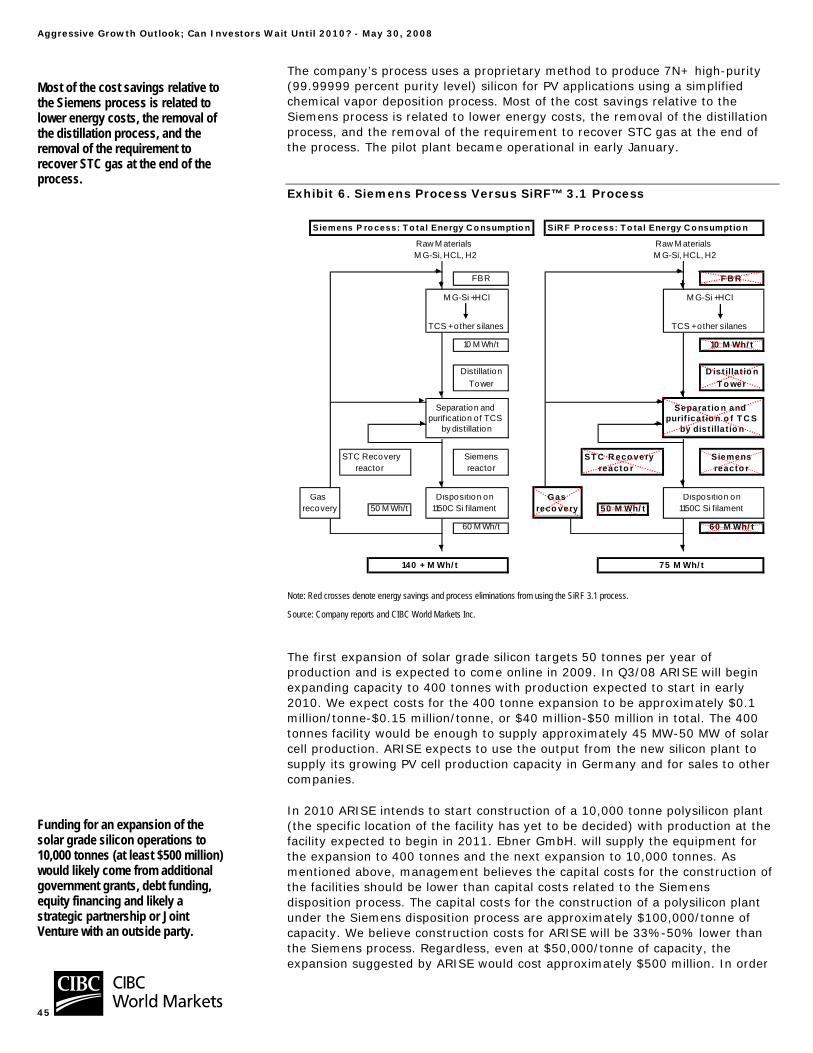
Aggressive Growth Outlook; Can Investors Wait Until 2010? - May 30, 2008
45
The company’s process uses a proprietary method to produce 7N+ high-purity (99.99999 percent purity level) silicon for PV applications using a simplified chemical vapor deposition process. Most of the cost savings relative to the Siemens process is related to lower energy costs, the removal of the distillation process, and the removal of the requirement to recover STC gas at the end of the process. The pilot plant became operational in early January.
Exhibit 6. Siemens Process Versus SiRF™ 3.1 Process
Siemens P ro cess: T o tal Energy C o nsumptio n SiR F P ro cess: T o tal Energy C o nsumptio n
Raw M aterials Raw M aterials M G-Si, HCL, H2 M G-Si, HCL, H2
FBR F B R
M G-Si +HCl M G-Si +HCl
TCS + other silanes TCS + other silanes
10 M Wh/t 10 M Wh/ t
Distillation D ist illa t io nTower T o wer
Separation and Separat io n andpurification of TCS purif icat io n o f T C S by distillation by dist illa t io n
STC Recovery Siemens ST C R eco very Siemens reactor reactor reacto r reacto r
Gas Disposition on Gas Disposition onrecovery 50 M Wh/t 1150C Si filament reco very 50 M Wh/ t 1150C Si filament
60 M Wh/t 60 M Wh/ t
140 + M Wh/ t 75 M Wh/ t
Note: Red crosses denote energy savings and process eliminations from using the SiRF 3.1 process.
Source: Company reports and CIBC World Markets Inc.
The first expansion of solar grade silicon targets 50 tonnes per year of production and is expected to come online in 2009. In Q3/08 ARISE will begin expanding capacity to 400 tonnes with production expected to start in early 2010. We expect costs for the 400 tonne expansion to be approximately $0.1 million/tonne-$0.15 million/tonne, or $40 million-$50 million in total. The 400 tonnes facility would be enough to supply approximately 45 MW-50 MW of solar cell production. ARISE expects to use the output from the new silicon plant to supply its growing PV cell production capacity in Germany and for sales to other companies.
In 2010 ARISE intends to start construction of a 10,000 tonne polysilicon plant (the specific location of the facility has yet to be decided) with production at the facility expected to begin in 2011. Ebner GmbH. will supply the equipment for the expansion to 400 tonnes and the next expansion to 10,000 tonnes. As mentioned above, management believes the capital costs for the construction of the facilities should be lower than capital costs related to the Siemens disposition process. The capital costs for the construction of a polysilicon plant under the Siemens disposition process are approximately $100,000/tonne of capacity. We believe construction costs for ARISE will be 33%-50% lower than the Siemens process. Regardless, even at $50,000/tonne of capacity, the expansion suggested by ARISE would cost approximately $500 million. In order
Most of the cost savings relative to the Siemens process is related to lower energy costs, the removal of the distillation process, and the removal of the requirement to recover STC gas at the end of the process.
Funding for an expansion of the solar grade silicon operations to 10,000 tonnes (at least $500 million) would likely come from additional government grants, debt funding, equity financing and likely a strategic partnership or Joint Venture with an outside party.
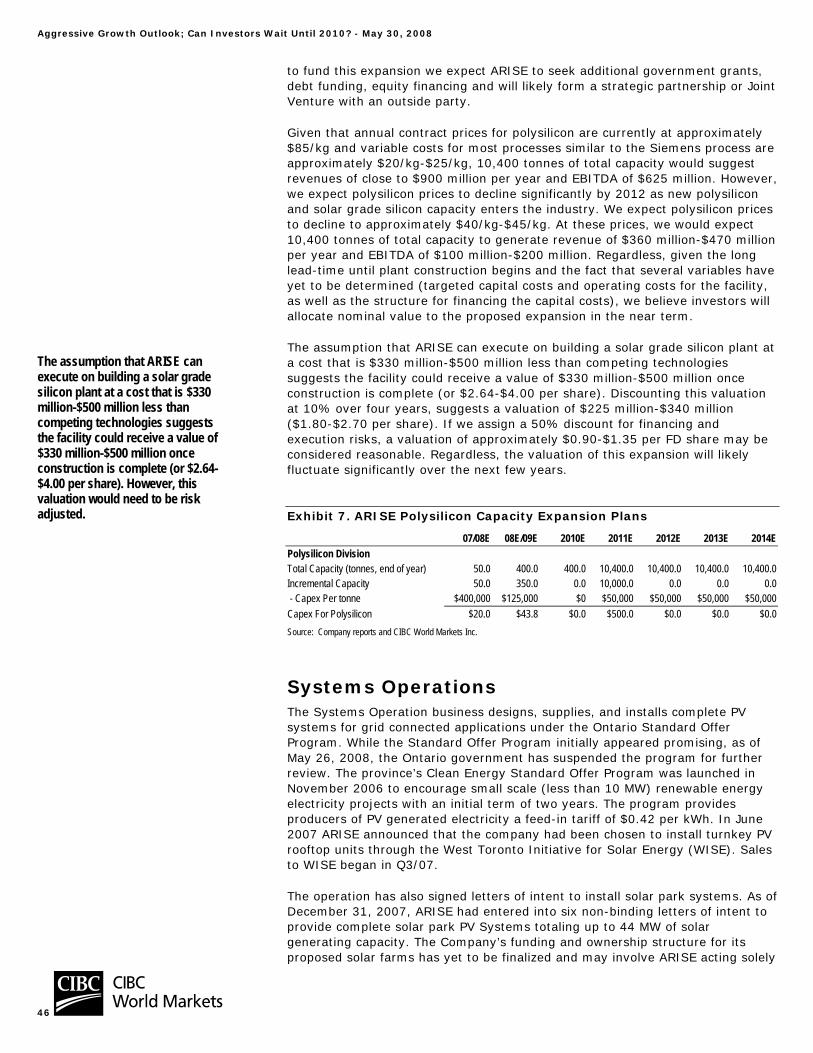
Aggressive Growth Outlook; Can Investors Wait Until 2010? - May 30, 2008
46
to fund this expansion we expect ARISE to seek additional government grants, debt funding, equity financing and will likely form a strategic partnership or Joint Venture with an outside party.
Given that annual contract prices for polysilicon are currently at approximately $85/kg and variable costs for most processes similar to the Siemens process are approximately $20/kg-$25/kg, 10,400 tonnes of total capacity would suggest revenues of close to $900 million per year and EBITDA of $625 million. However, we expect polysilicon prices to decline significantly by 2012 as new polysilicon and solar grade silicon capacity enters the industry. We expect polysilicon prices to decline to approximately $40/kg-$45/kg. At these prices, we would expect 10,400 tonnes of total capacity to generate revenue of $360 million-$470 million per year and EBITDA of $100 million-$200 million. Regardless, given the long lead-time until plant construction begins and the fact that several variables have yet to be determined (targeted capital costs and operating costs for the facility, as well as the structure for financing the capital costs), we believe investors will allocate nominal value to the proposed expansion in the near term.
The assumption that ARISE can execute on building a solar grade silicon plant at a cost that is $330 million-$500 million less than competing technologies suggests the facility could receive a value of $330 million-$500 million once construction is complete (or $2.64-$4.00 per share). Discounting this valuation at 10% over four years, suggests a valuation of $225 million-$340 million ($1.80-$2.70 per share). If we assign a 50% discount for financing and execution risks, a valuation of approximately $0.90-$1.35 per FD share may be considered reasonable. Regardless, the valuation of this expansion will likely fluctuate significantly over the next few years.
Exhibit 7. ARISE Polysilicon Capacity Expansion Plans
07/08E 08E/09E 2010E 2011E 2012E 2013E 2014EPolysilicon Division Total Capacity (tonnes, end of year) 50.0 400.0 400.0 10,400.0 10,400.0 10,400.0 10,400.0 Incremental Capacity 50.0 350.0 0.0 10,000.0 0.0 0.0 0.0 - Capex Per tonne $400,000 $125,000 $0 $50,000 $50,000 $50,000 $50,000 Capex For Polysilicon $20.0 $43.8 $0.0 $500.0 $0.0 $0.0 $0.0 Source: Company reports and CIBC World Markets Inc.
Systems Operations The Systems Operation business designs, supplies, and installs complete PV systems for grid connected applications under the Ontario Standard Offer Program. While the Standard Offer Program initially appeared promising, as of May 26, 2008, the Ontario government has suspended the program for further review. The province’s Clean Energy Standard Offer Program was launched in November 2006 to encourage small scale (less than 10 MW) renewable energy electricity projects with an initial term of two years. The program provides producers of PV generated electricity a feed-in tariff of $0.42 per kWh. In June 2007 ARISE announced that the company had been chosen to install turnkey PV rooftop units through the West Toronto Initiative for Solar Energy (WISE). Sales to WISE began in Q3/07.
The operation has also signed letters of intent to install solar park systems. As of December 31, 2007, ARISE had entered into six non-binding letters of intent to provide complete solar park PV Systems totaling up to 44 MW of solar generating capacity. The Company’s funding and ownership structure for its proposed solar farms has yet to be finalized and may involve ARISE acting solely
The assumption that ARISE can execute on building a solar grade silicon plant at a cost that is $330 million-$500 million less than competing technologies suggests the facility could receive a value of $330 million-$500 million once construction is complete (or $2.64-$4.00 per share). However, this valuation would need to be risk adjusted.
Aggressive Growth Outlook; Can Investors Wait Until 2010? - May 30, 2008
47
as a supplier of turnkey generating systems to third-party solar farm owners and/or ARISE participating in the ownership and operation of solar farms. Other products include portable solar power systems and solar thermal for heating water and swimming pools. Management’s ultimate goal is to install a total of 100 MW of capacity in Ontario by 2010, however, this goal is now dependent upon Ontario legislation.
Competitors in the solar installation sector in Canada include SunEdison, SkyPower and SonnenEnergy Corporation (PWR-V). We believe sales from the solar installations segment could eventually be significant (hundreds of millions of dollars), however, we believe the low barriers to entry will cause margins to be challenging. Additionally, ARISE’s management has suggested that installation costs need to decline further (below $7.00/watt) in order for the $0.42/kWh feed-in tariff to be viable.
Financing Risks Are Diminishing In May 2008 ARISE announced that the company and a corporation controlled by Ian MacLellan (ARISE’s founder and Chief Technology Officer) had entered a bought deal for 20,500,000 common shares from the Company and 500,000 from the Selling Shareholder at a price of $2.20 per common share. Total gross proceeds were $45,100,000 for ARISE and $1,100,000 for the Selling Shareholder. ARISE intends to use the net proceeds to secure additional silicon wafers, to fund the Company's proprietary PV silicon and PV cell technology programs, to provide funding for research and development for the silicon pilot production facility, and for other general corporate purposes.
ARISE has had reasonable success in raising capital over the past two years. The company has: 1) raised approximately $101.6 million through three equity issues; 2) sourced debt financing for approximately 50% of funds required for capacity expansions at the solar cell operations to date; and 3) secured government grants for approximately 20%-25% of capacity expansions ($42.2 million in R&D grants in total).
ARISE’s Historical Financing Activity
• May 2008 - $45.1 million bought deal common share issue.
• October 2007 - $34.5 million bought deal common share issue.
• April 2007 - $22.0 million bought deal common share issue.
• September 2007 – Euro 47.05 million credit facility is established with Commerzbank (Germany).
• 2006-2007 - Total Research & Development Grants – $42.2 million.
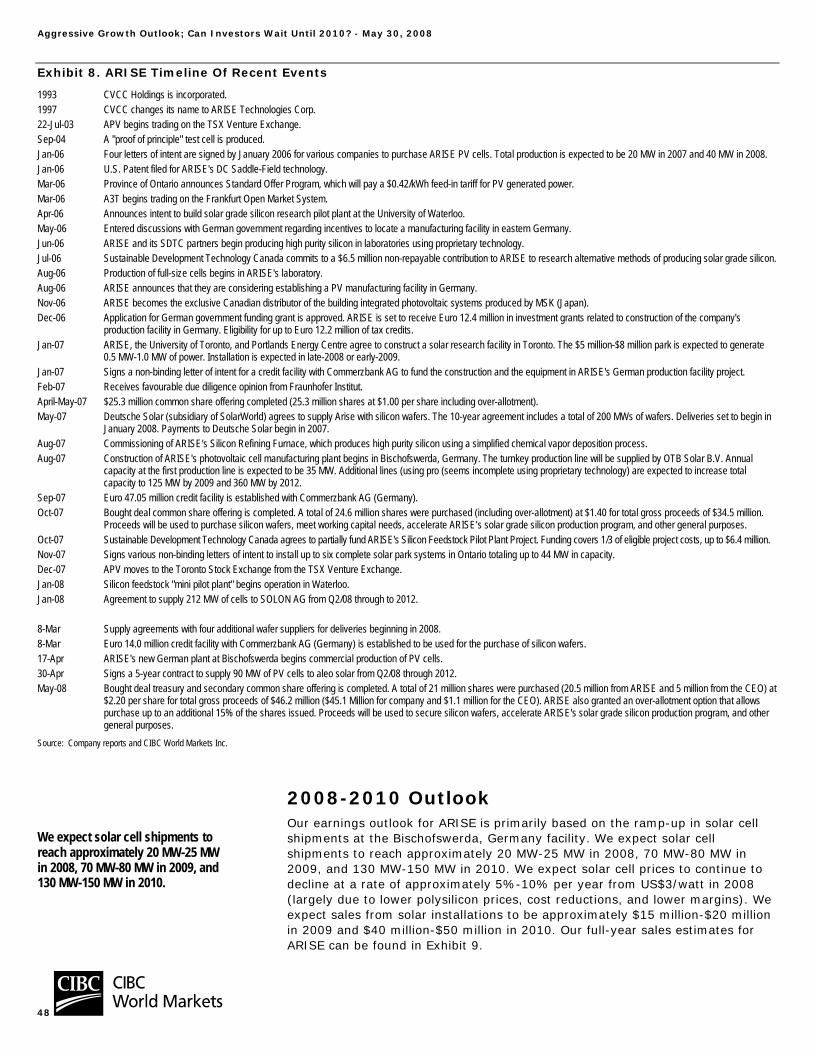
Aggressive Growth Outlook; Can Investors Wait Until 2010? - May 30, 2008
48
Exhibit 8. ARISE Timeline Of Recent Events
1993 CVCC Holdings is incorporated. 1997 CVCC changes its name to ARISE Technologies Corp. 22-Jul-03 APV begins trading on the TSX Venture Exchange. Sep-04 A "proof of principle" test cell is produced. Jan-06 Four letters of intent are signed by January 2006 for various companies to purchase ARISE PV cells. Total production is expected to be 20 MW in 2007 and 40 MW in 2008. Jan-06 U.S. Patent filed for ARISE's DC Saddle-Field technology. Mar-06 Province of Ontario announces Standard Offer Program, which will pay a $0.42/kWh feed-in tariff for PV generated power. Mar-06 A3T begins trading on the Frankfurt Open Market System. Apr-06 Announces intent to build solar grade silicon research pilot plant at the University of Waterloo. May-06 Entered discussions with German government regarding incentives to locate a manufacturing facility in eastern Germany. Jun-06 ARISE and its SDTC partners begin producing high purity silicon in laboratories using proprietary technology. Jul-06 Sustainable Development Technology Canada commits to a $6.5 million non-repayable contribution to ARISE to research alternative methods of producing solar grade silicon.Aug-06 Production of full-size cells begins in ARISE's laboratory. Aug-06 ARISE announces that they are considering establishing a PV manufacturing facility in Germany. Nov-06 ARISE becomes the exclusive Canadian distributor of the building integrated photovoltaic systems produced by MSK (Japan). Dec-06 Application for German government funding grant is approved. ARISE is set to receive Euro 12.4 million in investment grants related to construction of the company's
production facility in Germany. Eligibility for up to Euro 12.2 million of tax credits. Jan-07 ARISE, the University of Toronto, and Portlands Energy Centre agree to construct a solar research facility in Toronto. The $5 million-$8 million park is expected to generate
0.5 MW-1.0 MW of power. Installation is expected in late-2008 or early-2009. Jan-07 Signs a non-binding letter of intent for a credit facility with Commerzbank AG to fund the construction and the equipment in ARISE's German production facility project. Feb-07 Receives favourable due diligence opinion from Fraunhofer Institut. April-May-07 $25.3 million common share offering completed (25.3 million shares at $1.00 per share including over-allotment). May-07 Deutsche Solar (subsidiary of SolarWorld) agrees to supply Arise with silicon wafers. The 10-year agreement includes a total of 200 MWs of wafers. Deliveries set to begin in
January 2008. Payments to Deutsche Solar begin in 2007. Aug-07 Commissioning of ARISE's Silicon Refining Furnace, which produces high purity silicon using a simplified chemical vapor deposition process. Aug-07 Construction of ARISE's photovoltaic cell manufacturing plant begins in Bischofswerda, Germany. The turnkey production line will be supplied by OTB Solar B.V. Annual
capacity at the first production line is expected to be 35 MW. Additional lines (using pro (seems incomplete using proprietary technology) are expected to increase total capacity to 125 MW by 2009 and 360 MW by 2012.
Sep-07 Euro 47.05 million credit facility is established with Commerzbank AG (Germany). Oct-07 Bought deal common share offering is completed. A total of 24.6 million shares were purchased (including over-allotment) at $1.40 for total gross proceeds of $34.5 million.
Proceeds will be used to purchase silicon wafers, meet working capital needs, accelerate ARISE’s solar grade silicon production program, and other general purposes. Oct-07 Sustainable Development Technology Canada agrees to partially fund ARISE's Silicon Feedstock Pilot Plant Project. Funding covers 1/3 of eligible project costs, up to $6.4 million. Nov-07 Signs various non-binding letters of intent to install up to six complete solar park systems in Ontario totaling up to 44 MW in capacity. Dec-07 APV moves to the Toronto Stock Exchange from the TSX Venture Exchange. Jan-08 Silicon feedstock "mini pilot plant" begins operation in Waterloo. Jan-08 Agreement to supply 212 MW of cells to SOLON AG from Q2/08 through to 2012. 8-Mar Supply agreements with four additional wafer suppliers for deliveries beginning in 2008. 8-Mar Euro 14.0 million credit facility with Commerzbank AG (Germany) is established to be used for the purchase of silicon wafers. 17-Apr ARISE's new German plant at Bischofswerda begins commercial production of PV cells. 30-Apr Signs a 5-year contract to supply 90 MW of PV cells to aleo solar from Q2/08 through 2012. May-08 Bought deal treasury and secondary common share offering is completed. A total of 21 million shares were purchased (20.5 million from ARISE and 5 million from the CEO) at
$2.20 per share for total gross proceeds of $46.2 million ($45.1 Million for company and $1.1 million for the CEO). ARISE also granted an over-allotment option that allows purchase up to an additional 15% of the shares issued. Proceeds will be used to secure silicon wafers, accelerate ARISE's solar grade silicon production program, and other general purposes.
Source: Company reports and CIBC World Markets Inc.
2008-2010 Outlook Our earnings outlook for ARISE is primarily based on the ramp-up in solar cell shipments at the Bischofswerda, Germany facility. We expect solar cell shipments to reach approximately 20 MW-25 MW in 2008, 70 MW-80 MW in 2009, and 130 MW-150 MW in 2010. We expect solar cell prices to continue to decline at a rate of approximately 5%-10% per year from US$3/watt in 2008 (largely due to lower polysilicon prices, cost reductions, and lower margins). We expect sales from solar installations to be approximately $15 million-$20 million in 2009 and $40 million-$50 million in 2010. Our full-year sales estimates for ARISE can be found in Exhibit 9.
We expect solar cell shipments to reach approximately 20 MW-25 MW in 2008, 70 MW-80 MW in 2009, and 130 MW-150 MW in 2010.
Aggressive Growth Outlook; Can Investors Wait Until 2010? - May 30, 2008
49
Due to the tightness in polysilicon supply over the next two years, we expect ARISE to continue to struggle to achieve profitability and we expect gross margins to reach 10% (at best). However, once reasonable economies of scale are reached in 2010, we expect profitability to begin to gain some momentum. We expect gross margins to reach 18%-22% in 2010; however, this is highly sensitive to supply/demand balance in the industry. Once ARISE fully develops its heterojunction solar cell technology, gross margins could increase to 30% at full production.
As indicated above, under our expectations for polysilicon prices to decline to approximately $40/kg-$45/kg in 2012, we would expect the polysilicon operations (assuming full production) to generate revenues of $360 million-$470 million per year and EBITDA of $100 million-$200 million. Regardless, given the long lead time until plant construction begins and the fact that several variables have yet to be determined (targeted capital costs or operating costs for the facility and the structure for financing the capital costs), we believe investors will allocate nominal values to the proposed expansion in the near term.
Price Target Calculation Our $2.15 valuation for ARISE is based on 11.0x our 2010 FD EPS estimate and 7.0x 2010E EBITDA, a 10% discount to global integrated solar cell manufacturers and polysilicon producers based on 2010 estimates. We also hold mixed views over the supply/demand balance in the solar sector in the 2010/2011 time frame when ARISE will just begin ramping up its value added technologies.
While the two proprietary technologies that are currently under development at ARISE could potentially become “industry leading” innovations, commercial production of either technology is not likely to occur until 2010. At the same time, the company will likely require further equity financing sometime before 2010 in order to fund growth. Financing risks could cause the share price to fluctuate in the $2.00 to $2.50 range, before any further significant share price appreciation. Additionally, we would prefer to wait to see some further progress with respect to both the solar cell technologies (heterojunction cell) and solar grade silicon process before recommending purchase of the shares.
We prefer to attribute below peer group multiples in our valuations to account for the ramp-up risks at ARISE relative to current established industry players.
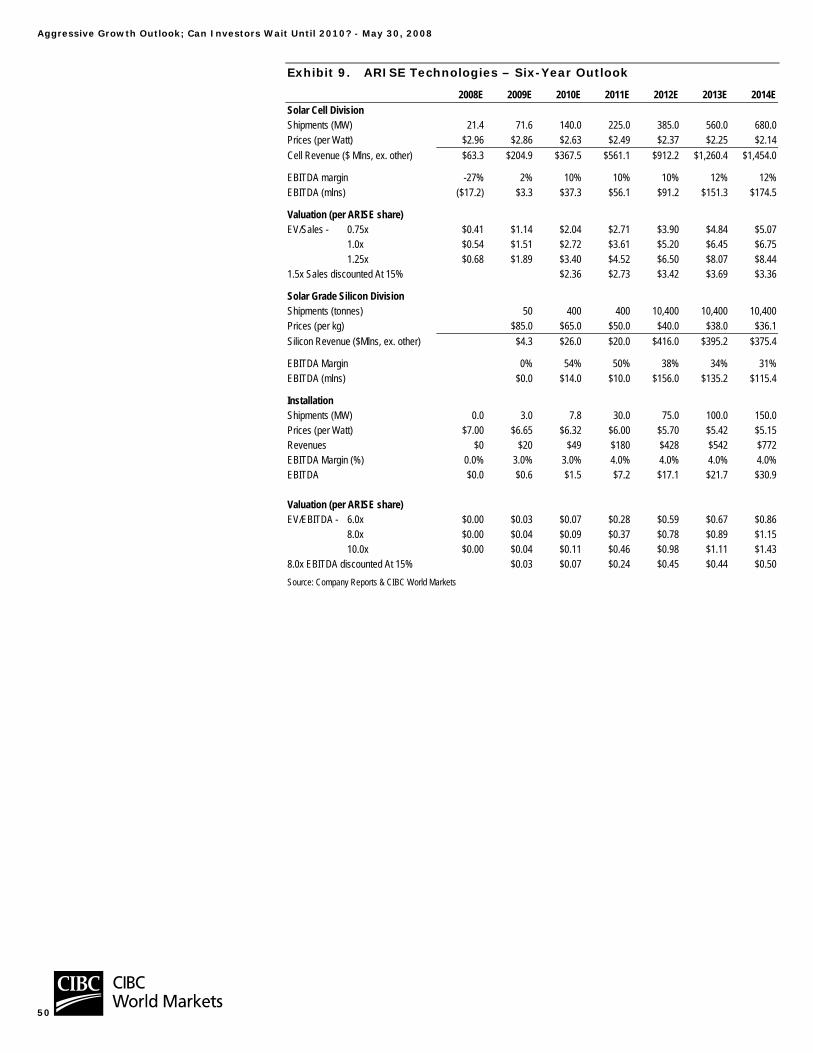
Aggressive Growth Outlook; Can Investors Wait Until 2010? - May 30, 2008
50
Exhibit 9. ARISE Technologies – Six-Year Outlook
2008E 2009E 2010E 2011E 2012E 2013E 2014ESolar Cell Division Shipments (MW) 21.4 71.6 140.0 225.0 385.0 560.0 680.0 Prices (per Watt) $2.96 $2.86 $2.63 $2.49 $2.37 $2.25 $2.14 Cell Revenue ($ Mlns, ex. other) $63.3 $204.9 $367.5 $561.1 $912.2 $1,260.4 $1,454.0
EBITDA margin -27% 2% 10% 10% 10% 12% 12%EBITDA (mlns) ($17.2) $3.3 $37.3 $56.1 $91.2 $151.3 $174.5
Valuation (per ARISE share) EV/Sales - 0.75x $0.41 $1.14 $2.04 $2.71 $3.90 $4.84 $5.07 1.0x $0.54 $1.51 $2.72 $3.61 $5.20 $6.45 $6.75 1.25x $0.68 $1.89 $3.40 $4.52 $6.50 $8.07 $8.44 1.5x Sales discounted At 15% $2.36 $2.73 $3.42 $3.69 $3.36
Solar Grade Silicon Division Shipments (tonnes) 50 400 400 10,400 10,400 10,400 Prices (per kg) $85.0 $65.0 $50.0 $40.0 $38.0 $36.1 Silicon Revenue ($Mlns, ex. other) $4.3 $26.0 $20.0 $416.0 $395.2 $375.4
EBITDA Margin 0% 54% 50% 38% 34% 31%EBITDA (mlns) $0.0 $14.0 $10.0 $156.0 $135.2 $115.4
Installation Shipments (MW) 0.0 3.0 7.8 30.0 75.0 100.0 150.0 Prices (per Watt) $7.00 $6.65 $6.32 $6.00 $5.70 $5.42 $5.15 Revenues $0 $20 $49 $180 $428 $542 $772 EBITDA Margin (%) 0.0% 3.0% 3.0% 4.0% 4.0% 4.0% 4.0%EBITDA $0.0 $0.6 $1.5 $7.2 $17.1 $21.7 $30.9 Valuation (per ARISE share) EV/EBITDA - 6.0x $0.00 $0.03 $0.07 $0.28 $0.59 $0.67 $0.86 8.0x $0.00 $0.04 $0.09 $0.37 $0.78 $0.89 $1.15 10.0x $0.00 $0.04 $0.11 $0.46 $0.98 $1.11 $1.43 8.0x EBITDA discounted At 15% $0.03 $0.07 $0.24 $0.45 $0.44 $0.50 Source: Company Reports & CIBC World Markets
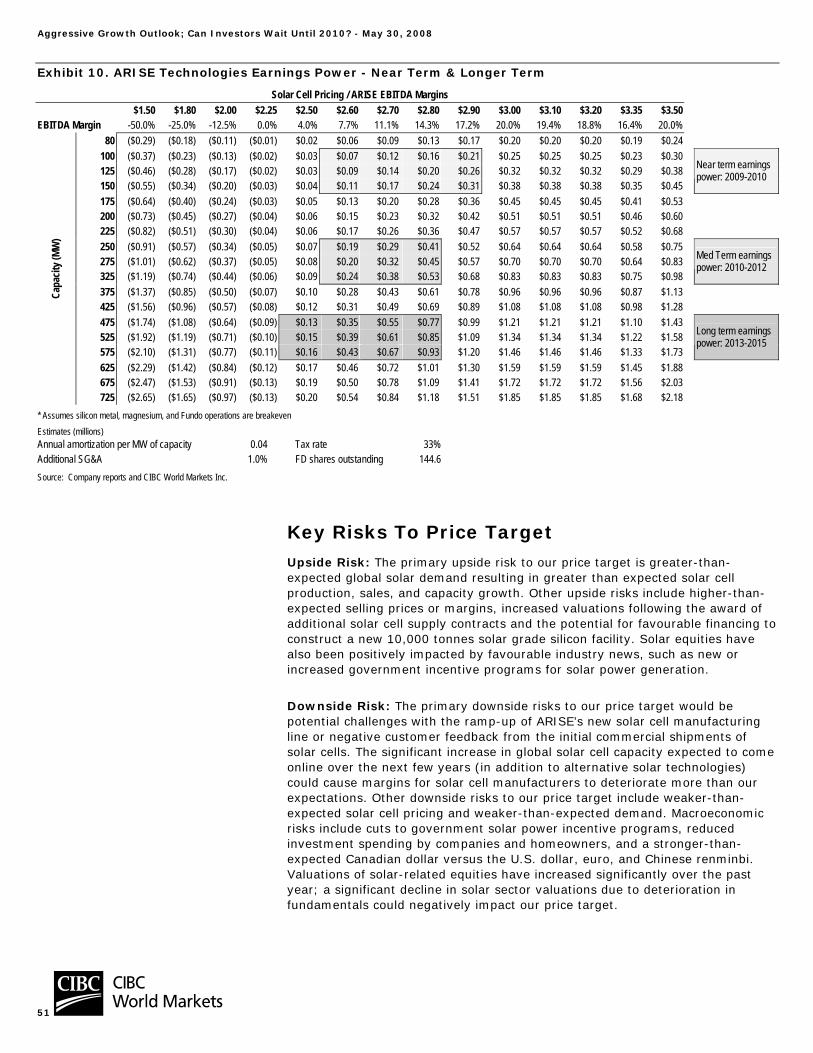
Aggressive Growth Outlook; Can Investors Wait Until 2010? - May 30, 2008
51
Exhibit 10. ARISE Technologies Earnings Power - Near Term & Longer Term
Solar Cell Pricing / ARISE EBITDA Margins $1.50 $1.80 $2.00 $2.25 $2.50 $2.60 $2.70 $2.80 $2.90 $3.00 $3.10 $3.20 $3.35 $3.50
EBITDA Margin -50.0% -25.0% -12.5% 0.0% 4.0% 7.7% 11.1% 14.3% 17.2% 20.0% 19.4% 18.8% 16.4% 20.0%80 ($0.29) ($0.18) ($0.11) ($0.01) $0.02 $0.06 $0.09 $0.13 $0.17 $0.20 $0.20 $0.20 $0.19 $0.24
100 ($0.37) ($0.23) ($0.13) ($0.02) $0.03 $0.07 $0.12 $0.16 $0.21 $0.25 $0.25 $0.25 $0.23 $0.30125 ($0.46) ($0.28) ($0.17) ($0.02) $0.03 $0.09 $0.14 $0.20 $0.26 $0.32 $0.32 $0.32 $0.29 $0.38150 ($0.55) ($0.34) ($0.20) ($0.03) $0.04 $0.11 $0.17 $0.24 $0.31 $0.38 $0.38 $0.38 $0.35 $0.45
Near term earnings power: 2009-2010
175 ($0.64) ($0.40) ($0.24) ($0.03) $0.05 $0.13 $0.20 $0.28 $0.36 $0.45 $0.45 $0.45 $0.41 $0.53200 ($0.73) ($0.45) ($0.27) ($0.04) $0.06 $0.15 $0.23 $0.32 $0.42 $0.51 $0.51 $0.51 $0.46 $0.60225 ($0.82) ($0.51) ($0.30) ($0.04) $0.06 $0.17 $0.26 $0.36 $0.47 $0.57 $0.57 $0.57 $0.52 $0.68250 ($0.91) ($0.57) ($0.34) ($0.05) $0.07 $0.19 $0.29 $0.41 $0.52 $0.64 $0.64 $0.64 $0.58 $0.75275 ($1.01) ($0.62) ($0.37) ($0.05) $0.08 $0.20 $0.32 $0.45 $0.57 $0.70 $0.70 $0.70 $0.64 $0.83325 ($1.19) ($0.74) ($0.44) ($0.06) $0.09 $0.24 $0.38 $0.53 $0.68 $0.83 $0.83 $0.83 $0.75 $0.98
Med Term earnings power: 2010-2012
375 ($1.37) ($0.85) ($0.50) ($0.07) $0.10 $0.28 $0.43 $0.61 $0.78 $0.96 $0.96 $0.96 $0.87 $1.13425 ($1.56) ($0.96) ($0.57) ($0.08) $0.12 $0.31 $0.49 $0.69 $0.89 $1.08 $1.08 $1.08 $0.98 $1.28475 ($1.74) ($1.08) ($0.64) ($0.09) $0.13 $0.35 $0.55 $0.77 $0.99 $1.21 $1.21 $1.21 $1.10 $1.43525 ($1.92) ($1.19) ($0.71) ($0.10) $0.15 $0.39 $0.61 $0.85 $1.09 $1.34 $1.34 $1.34 $1.22 $1.58575 ($2.10) ($1.31) ($0.77) ($0.11) $0.16 $0.43 $0.67 $0.93 $1.20 $1.46 $1.46 $1.46 $1.33 $1.73
Long term earnings power: 2013-2015
625 ($2.29) ($1.42) ($0.84) ($0.12) $0.17 $0.46 $0.72 $1.01 $1.30 $1.59 $1.59 $1.59 $1.45 $1.88675 ($2.47) ($1.53) ($0.91) ($0.13) $0.19 $0.50 $0.78 $1.09 $1.41 $1.72 $1.72 $1.72 $1.56 $2.03
Capa
city (
MW)
725 ($2.65) ($1.65) ($0.97) ($0.13) $0.20 $0.54 $0.84 $1.18 $1.51 $1.85 $1.85 $1.85 $1.68 $2.18* Assumes silicon metal, magnesium, and Fundo operations are breakeven Estimates (millions) Annual amortization per MW of capacity 0.04 Tax rate 33%Additional SG&A 1.0% FD shares outstanding 144.6 Source: Company reports and CIBC World Markets Inc.
Key Risks To Price Target Upside Risk: The primary upside risk to our price target is greater-than-expected global solar demand resulting in greater than expected solar cell production, sales, and capacity growth. Other upside risks include higher-than-expected selling prices or margins, increased valuations following the award of additional solar cell supply contracts and the potential for favourable financing to construct a new 10,000 tonnes solar grade silicon facility. Solar equities have also been positively impacted by favourable industry news, such as new or increased government incentive programs for solar power generation.
Downside Risk: The primary downside risks to our price target would be potential challenges with the ramp-up of ARISE’s new solar cell manufacturing line or negative customer feedback from the initial commercial shipments of solar cells. The significant increase in global solar cell capacity expected to come online over the next few years (in addition to alternative solar technologies) could cause margins for solar cell manufacturers to deteriorate more than our expectations. Other downside risks to our price target include weaker-than-expected solar cell pricing and weaker-than-expected demand. Macroeconomic risks include cuts to government solar power incentive programs, reduced investment spending by companies and homeowners, and a stronger-than-expected Canadian dollar versus the U.S. dollar, euro, and Chinese renminbi. Valuations of solar-related equities have increased significantly over the past year; a significant decline in solar sector valuations due to deterioration in fundamentals could negatively impact our price target.
Aggressive Growth Outlook; Can Investors Wait Until 2010? - May 30, 2008
52
ARISE will require significant additional funds over the medium term to complete the commercialization of its PV technology. Additionally, failure to meet conditions related to government funding (particularly from Sustainable Development Technologies Canada, Ontario Centres of Excellence, and the Industrial Investment Council of Germany) may have an adverse impact on the company.
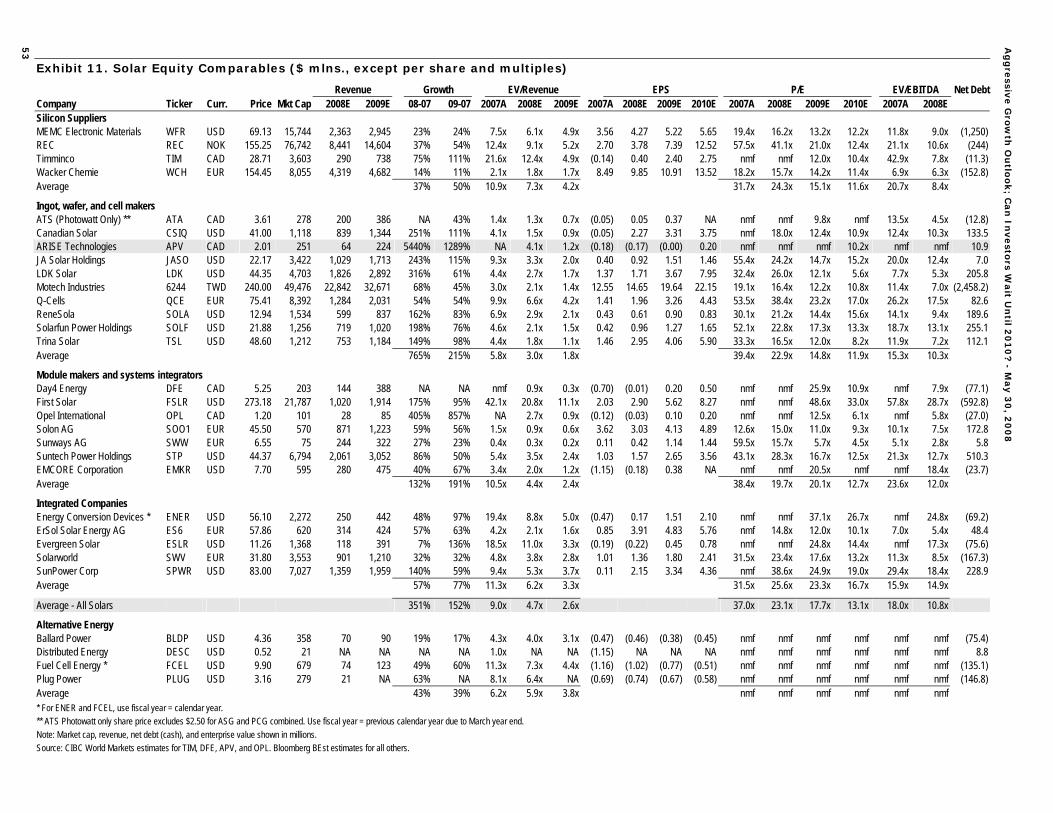
Ag
gre
ssive G
row
th O
utlo
ok; C
an
Investo
rs Wait U
ntil 2
01
0? -
May 3
0, 2
00
8
53
Exhibit 11. Solar Equity Comparables ($ mlns., except per share and multiples)
Revenue Growth EV/Revenue EPS P/E EV/EBITDA Net Debt Company Ticker Curr. Price Mkt Cap 2008E 2009E 08-07 09-07 2007A 2008E 2009E 2007A 2008E 2009E 2010E 2007A 2008E 2009E 2010E 2007A 2008E Silicon Suppliers MEMC Electronic Materials WFR USD 69.13 15,744 2,363 2,945 23% 24% 7.5x 6.1x 4.9x 3.56 4.27 5.22 5.65 19.4x 16.2x 13.2x 12.2x 11.8x 9.0x (1,250) REC REC NOK 155.25 76,742 8,441 14,604 37% 54% 12.4x 9.1x 5.2x 2.70 3.78 7.39 12.52 57.5x 41.1x 21.0x 12.4x 21.1x 10.6x (244) Timminco TIM CAD 28.71 3,603 290 738 75% 111% 21.6x 12.4x 4.9x (0.14) 0.40 2.40 2.75 nmf nmf 12.0x 10.4x 42.9x 7.8x (11.3) Wacker Chemie WCH EUR 154.45 8,055 4,319 4,682 14% 11% 2.1x 1.8x 1.7x 8.49 9.85 10.91 13.52 18.2x 15.7x 14.2x 11.4x 6.9x 6.3x (152.8) Average 37% 50% 10.9x 7.3x 4.2x 31.7x 24.3x 15.1x 11.6x 20.7x 8.4x
Ingot, wafer, and cell makers ATS (Photowatt Only) ** ATA CAD 3.61 278 200 386 NA 43% 1.4x 1.3x 0.7x (0.05) 0.05 0.37 NA nmf nmf 9.8x nmf 13.5x 4.5x (12.8) Canadian Solar CSIQ USD 41.00 1,118 839 1,344 251% 111% 4.1x 1.5x 0.9x (0.05) 2.27 3.31 3.75 nmf 18.0x 12.4x 10.9x 12.4x 10.3x 133.5 ARISE Technologies APV CAD 2.01 251 64 224 5440% 1289% NA 4.1x 1.2x (0.18) (0.17) (0.00) 0.20 nmf nmf nmf 10.2x nmf nmf 10.9 JA Solar Holdings JASO USD 22.17 3,422 1,029 1,713 243% 115% 9.3x 3.3x 2.0x 0.40 0.92 1.51 1.46 55.4x 24.2x 14.7x 15.2x 20.0x 12.4x 7.0 LDK Solar LDK USD 44.35 4,703 1,826 2,892 316% 61% 4.4x 2.7x 1.7x 1.37 1.71 3.67 7.95 32.4x 26.0x 12.1x 5.6x 7.7x 5.3x 205.8 Motech Industries 6244 TWD 240.00 49,476 22,842 32,671 68% 45% 3.0x 2.1x 1.4x 12.55 14.65 19.64 22.15 19.1x 16.4x 12.2x 10.8x 11.4x 7.0x (2,458.2) Q-Cells QCE EUR 75.41 8,392 1,284 2,031 54% 54% 9.9x 6.6x 4.2x 1.41 1.96 3.26 4.43 53.5x 38.4x 23.2x 17.0x 26.2x 17.5x 82.6 ReneSola SOLA USD 12.94 1,534 599 837 162% 83% 6.9x 2.9x 2.1x 0.43 0.61 0.90 0.83 30.1x 21.2x 14.4x 15.6x 14.1x 9.4x 189.6 Solarfun Power Holdings SOLF USD 21.88 1,256 719 1,020 198% 76% 4.6x 2.1x 1.5x 0.42 0.96 1.27 1.65 52.1x 22.8x 17.3x 13.3x 18.7x 13.1x 255.1 Trina Solar TSL USD 48.60 1,212 753 1,184 149% 98% 4.4x 1.8x 1.1x 1.46 2.95 4.06 5.90 33.3x 16.5x 12.0x 8.2x 11.9x 7.2x 112.1 Average 765% 215% 5.8x 3.0x 1.8x 39.4x 22.9x 14.8x 11.9x 15.3x 10.3x
Module makers and systems integrators Day4 Energy DFE CAD 5.25 203 144 388 NA NA nmf 0.9x 0.3x (0.70) (0.01) 0.20 0.50 nmf nmf 25.9x 10.9x nmf 7.9x (77.1) First Solar FSLR USD 273.18 21,787 1,020 1,914 175% 95% 42.1x 20.8x 11.1x 2.03 2.90 5.62 8.27 nmf nmf 48.6x 33.0x 57.8x 28.7x (592.8) Opel International OPL CAD 1.20 101 28 85 405% 857% NA 2.7x 0.9x (0.12) (0.03) 0.10 0.20 nmf nmf 12.5x 6.1x nmf 5.8x (27.0) Solon AG SOO1 EUR 45.50 570 871 1,223 59% 56% 1.5x 0.9x 0.6x 3.62 3.03 4.13 4.89 12.6x 15.0x 11.0x 9.3x 10.1x 7.5x 172.8 Sunways AG SWW EUR 6.55 75 244 322 27% 23% 0.4x 0.3x 0.2x 0.11 0.42 1.14 1.44 59.5x 15.7x 5.7x 4.5x 5.1x 2.8x 5.8 Suntech Power Holdings STP USD 44.37 6,794 2,061 3,052 86% 50% 5.4x 3.5x 2.4x 1.03 1.57 2.65 3.56 43.1x 28.3x 16.7x 12.5x 21.3x 12.7x 510.3 EMCORE Corporation EMKR USD 7.70 595 280 475 40% 67% 3.4x 2.0x 1.2x (1.15) (0.18) 0.38 NA nmf nmf 20.5x nmf nmf 18.4x (23.7) Average 132% 191% 10.5x 4.4x 2.4x 38.4x 19.7x 20.1x 12.7x 23.6x 12.0x
Integrated Companies Energy Conversion Devices * ENER USD 56.10 2,272 250 442 48% 97% 19.4x 8.8x 5.0x (0.47) 0.17 1.51 2.10 nmf nmf 37.1x 26.7x nmf 24.8x (69.2) ErSol Solar Energy AG ES6 EUR 57.86 620 314 424 57% 63% 4.2x 2.1x 1.6x 0.85 3.91 4.83 5.76 nmf 14.8x 12.0x 10.1x 7.0x 5.4x 48.4 Evergreen Solar ESLR USD 11.26 1,368 118 391 7% 136% 18.5x 11.0x 3.3x (0.19) (0.22) 0.45 0.78 nmf nmf 24.8x 14.4x nmf 17.3x (75.6) Solarworld SWV EUR 31.80 3,553 901 1,210 32% 32% 4.8x 3.8x 2.8x 1.01 1.36 1.80 2.41 31.5x 23.4x 17.6x 13.2x 11.3x 8.5x (167.3) SunPower Corp SPWR USD 83.00 7,027 1,359 1,959 140% 59% 9.4x 5.3x 3.7x 0.11 2.15 3.34 4.36 nmf 38.6x 24.9x 19.0x 29.4x 18.4x 228.9 Average 57% 77% 11.3x 6.2x 3.3x 31.5x 25.6x 23.3x 16.7x 15.9x 14.9x
Average - All Solars 351% 152% 9.0x 4.7x 2.6x 37.0x 23.1x 17.7x 13.1x 18.0x 10.8x
Alternative Energy Ballard Power BLDP USD 4.36 358 70 90 19% 17% 4.3x 4.0x 3.1x (0.47) (0.46) (0.38) (0.45) nmf nmf nmf nmf nmf nmf (75.4) Distributed Energy DESC USD 0.52 21 NA NA NA NA 1.0x NA NA (1.15) NA NA NA nmf nmf nmf nmf nmf nmf 8.8 Fuel Cell Energy * FCEL USD 9.90 679 74 123 49% 60% 11.3x 7.3x 4.4x (1.16) (1.02) (0.77) (0.51) nmf nmf nmf nmf nmf nmf (135.1) Plug Power PLUG USD 3.16 279 21 NA 63% NA 8.1x 6.4x NA (0.69) (0.74) (0.67) (0.58) nmf nmf nmf nmf nmf nmf (146.8) Average 43% 39% 6.2x 5.9x 3.8x nmf nmf nmf nmf nmf nmf * For ENER and FCEL, use fiscal year = calendar year. ** ATS Photowatt only share price excludes $2.50 for ASG and PCG combined. Use fiscal year = previous calendar year due to March year end. Note: Market cap, revenue, net debt (cash), and enterprise value shown in millions. Source: CIBC World Markets estimates for TIM, DFE, APV, and OPL. Bloomberg BEst estimates for all others.
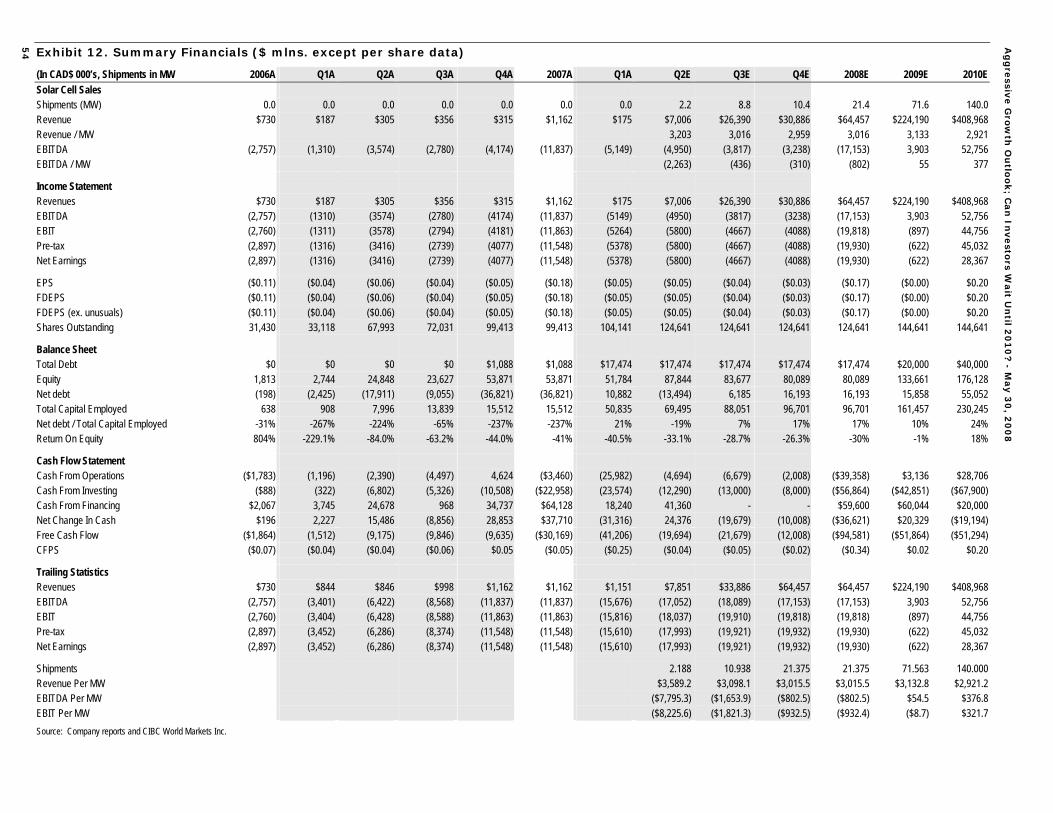
Ag
gre
ssive G
row
th O
utlo
ok; C
an
Investo
rs Wait U
ntil 2
01
0? -
May 3
0, 2
00
8
54 Exhibit 12. Summary Financials ($ mlns. except per share data)
(In CAD$ 000’s, Shipments in MW 2006A Q1A Q2A Q3A Q4A 2007A Q1A Q2E Q3E Q4E 2008E 2009E 2010E Solar Cell Sales Shipments (MW) 0.0 0.0 0.0 0.0 0.0 0.0 0.0 2.2 8.8 10.4 21.4 71.6 140.0 Revenue $730 $187 $305 $356 $315 $1,162 $175 $7,006 $26,390 $30,886 $64,457 $224,190 $408,968 Revenue / MW 3,203 3,016 2,959 3,016 3,133 2,921 EBITDA (2,757) (1,310) (3,574) (2,780) (4,174) (11,837) (5,149) (4,950) (3,817) (3,238) (17,153) 3,903 52,756 EBITDA / MW (2,263) (436) (310) (802) 55 377
Income Statement Revenues $730 $187 $305 $356 $315 $1,162 $175 $7,006 $26,390 $30,886 $64,457 $224,190 $408,968 EBITDA (2,757) (1310) (3574) (2780) (4174) (11,837) (5149) (4950) (3817) (3238) (17,153) 3,903 52,756 EBIT (2,760) (1311) (3578) (2794) (4181) (11,863) (5264) (5800) (4667) (4088) (19,818) (897) 44,756 Pre-tax (2,897) (1316) (3416) (2739) (4077) (11,548) (5378) (5800) (4667) (4088) (19,930) (622) 45,032 Net Earnings (2,897) (1316) (3416) (2739) (4077) (11,548) (5378) (5800) (4667) (4088) (19,930) (622) 28,367
EPS ($0.11) ($0.04) ($0.06) ($0.04) ($0.05) ($0.18) ($0.05) ($0.05) ($0.04) ($0.03) ($0.17) ($0.00) $0.20 FDEPS ($0.11) ($0.04) ($0.06) ($0.04) ($0.05) ($0.18) ($0.05) ($0.05) ($0.04) ($0.03) ($0.17) ($0.00) $0.20 FDEPS (ex. unusuals) ($0.11) ($0.04) ($0.06) ($0.04) ($0.05) ($0.18) ($0.05) ($0.05) ($0.04) ($0.03) ($0.17) ($0.00) $0.20 Shares Outstanding 31,430 33,118 67,993 72,031 99,413 99,413 104,141 124,641 124,641 124,641 124,641 144,641 144,641
Balance Sheet Total Debt $0 $0 $0 $0 $1,088 $1,088 $17,474 $17,474 $17,474 $17,474 $17,474 $20,000 $40,000 Equity 1,813 2,744 24,848 23,627 53,871 53,871 51,784 87,844 83,677 80,089 80,089 133,661 176,128 Net debt (198) (2,425) (17,911) (9,055) (36,821) (36,821) 10,882 (13,494) 6,185 16,193 16,193 15,858 55,052 Total Capital Employed 638 908 7,996 13,839 15,512 15,512 50,835 69,495 88,051 96,701 96,701 161,457 230,245 Net debt / Total Capital Employed -31% -267% -224% -65% -237% -237% 21% -19% 7% 17% 17% 10% 24% Return On Equity 804% -229.1% -84.0% -63.2% -44.0% -41% -40.5% -33.1% -28.7% -26.3% -30% -1% 18%
Cash Flow Statement Cash From Operations ($1,783) (1,196) (2,390) (4,497) 4,624 ($3,460) (25,982) (4,694) (6,679) (2,008) ($39,358) $3,136 $28,706 Cash From Investing ($88) (322) (6,802) (5,326) (10,508) ($22,958) (23,574) (12,290) (13,000) (8,000) ($56,864) ($42,851) ($67,900) Cash From Financing $2,067 3,745 24,678 968 34,737 $64,128 18,240 41,360 - - $59,600 $60,044 $20,000 Net Change In Cash $196 2,227 15,486 (8,856) 28,853 $37,710 (31,316) 24,376 (19,679) (10,008) ($36,621) $20,329 ($19,194) Free Cash Flow ($1,864) (1,512) (9,175) (9,846) (9,635) ($30,169) (41,206) (19,694) (21,679) (12,008) ($94,581) ($51,864) ($51,294) CFPS ($0.07) ($0.04) ($0.04) ($0.06) $0.05 ($0.05) ($0.25) ($0.04) ($0.05) ($0.02) ($0.34) $0.02 $0.20
Trailing Statistics Revenues $730 $844 $846 $998 $1,162 $1,162 $1,151 $7,851 $33,886 $64,457 $64,457 $224,190 $408,968 EBITDA (2,757) (3,401) (6,422) (8,568) (11,837) (11,837) (15,676) (17,052) (18,089) (17,153) (17,153) 3,903 52,756 EBIT (2,760) (3,404) (6,428) (8,588) (11,863) (11,863) (15,816) (18,037) (19,910) (19,818) (19,818) (897) 44,756 Pre-tax (2,897) (3,452) (6,286) (8,374) (11,548) (11,548) (15,610) (17,993) (19,921) (19,932) (19,930) (622) 45,032 Net Earnings (2,897) (3,452) (6,286) (8,374) (11,548) (11,548) (15,610) (17,993) (19,921) (19,932) (19,930) (622) 28,367
Shipments 2.188 10.938 21.375 21.375 71.563 140.000 Revenue Per MW $3,589.2 $3,098.1 $3,015.5 $3,015.5 $3,132.8 $2,921.2 EBITDA Per MW ($7,795.3) ($1,653.9) ($802.5) ($802.5) $54.5 $376.8 EBIT Per MW ($8,225.6) ($1,821.3) ($932.5) ($932.4) ($8.7) $321.7 Source: Company reports and CIBC World Markets Inc.
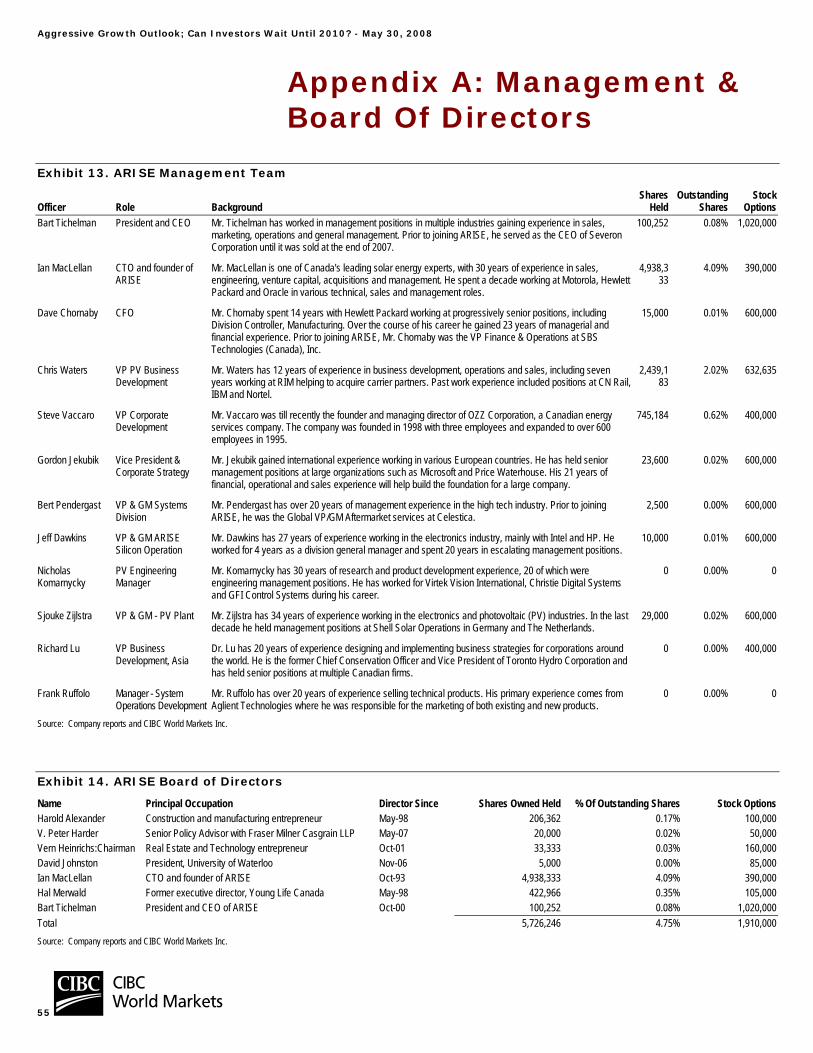
Aggressive Growth Outlook; Can Investors Wait Until 2010? - May 30, 2008
55
Appendix A: Management & Board Of Directors
Exhibit 13. ARISE Management Team
Officer Role Background Shares
HeldOutstanding
SharesStock
OptionsBart Tichelman President and CEO Mr. Tichelman has worked in management positions in multiple industries gaining experience in sales,
marketing, operations and general management. Prior to joining ARISE, he served as the CEO of Severon Corporation until it was sold at the end of 2007.
100,252 0.08% 1,020,000
Ian MacLellan CTO and founder of ARISE
Mr. MacLellan is one of Canada's leading solar energy experts, with 30 years of experience in sales, engineering, venture capital, acquisitions and management. He spent a decade working at Motorola, Hewlett Packard and Oracle in various technical, sales and management roles.
4,938,333
4.09% 390,000
Dave Chornaby CFO Mr. Chornaby spent 14 years with Hewlett Packard working at progressively senior positions, including Division Controller, Manufacturing. Over the course of his career he gained 23 years of managerial and financial experience. Prior to joining ARISE, Mr. Chornaby was the VP Finance & Operations at SBS Technologies (Canada), Inc.
15,000 0.01% 600,000
Chris Waters VP PV Business Development
Mr. Waters has 12 years of experience in business development, operations and sales, including seven years working at RIM helping to acquire carrier partners. Past work experience included positions at CN Rail, IBM and Nortel.
2,439,183
2.02% 632,635
Steve Vaccaro VP Corporate Development
Mr. Vaccaro was till recently the founder and managing director of OZZ Corporation, a Canadian energy services company. The company was founded in 1998 with three employees and expanded to over 600 employees in 1995.
745,184 0.62% 400,000
Gordon Jekubik Vice President & Corporate Strategy
Mr. Jekubik gained international experience working in various European countries. He has held senior management positions at large organizations such as Microsoft and Price Waterhouse. His 21 years of financial, operational and sales experience will help build the foundation for a large company.
23,600 0.02% 600,000
Bert Pendergast VP & GM Systems Division
Mr. Pendergast has over 20 years of management experience in the high tech industry. Prior to joining ARISE, he was the Global VP/GM Aftermarket services at Celestica.
2,500 0.00% 600,000
Jeff Dawkins VP & GM ARISE Silicon Operation
Mr. Dawkins has 27 years of experience working in the electronics industry, mainly with Intel and HP. He worked for 4 years as a division general manager and spent 20 years in escalating management positions.
10,000 0.01% 600,000
Nicholas Komarnycky
PV Engineering Manager
Mr. Komarnycky has 30 years of research and product development experience, 20 of which were engineering management positions. He has worked for Virtek Vision International, Christie Digital Systems and GFI Control Systems during his career.
0 0.00% 0
Sjouke Zijlstra VP & GM - PV Plant Mr. Zijlstra has 34 years of experience working in the electronics and photovoltaic (PV) industries. In the last decade he held management positions at Shell Solar Operations in Germany and The Netherlands.
29,000 0.02% 600,000
Richard Lu VP Business Development, Asia
Dr. Lu has 20 years of experience designing and implementing business strategies for corporations around the world. He is the former Chief Conservation Officer and Vice President of Toronto Hydro Corporation and has held senior positions at multiple Canadian firms.
0 0.00% 400,000
Frank Ruffolo Manager - System Operations Development
Mr. Ruffolo has over 20 years of experience selling technical products. His primary experience comes from Aglient Technologies where he was responsible for the marketing of both existing and new products.
0 0.00% 0
Source: Company reports and CIBC World Markets Inc.
Exhibit 14. ARISE Board of Directors
Name Principal Occupation Director Since Shares Owned Held % Of Outstanding Shares Stock OptionsHarold Alexander Construction and manufacturing entrepreneur May-98 206,362 0.17% 100,000V. Peter Harder Senior Policy Advisor with Fraser Milner Casgrain LLP May-07 20,000 0.02% 50,000Vern Heinrichs:Chairman Real Estate and Technology entrepreneur Oct-01 33,333 0.03% 160,000David Johnston President, University of Waterloo Nov-06 5,000 0.00% 85,000Ian MacLellan CTO and founder of ARISE Oct-93 4,938,333 4.09% 390,000Hal Merwald Former executive director, Young Life Canada May-98 422,966 0.35% 105,000Bart Tichelman President and CEO of ARISE Oct-00 100,252 0.08% 1,020,000Total 5,726,246 4.75% 1,910,000Source: Company reports and CIBC World Markets Inc.
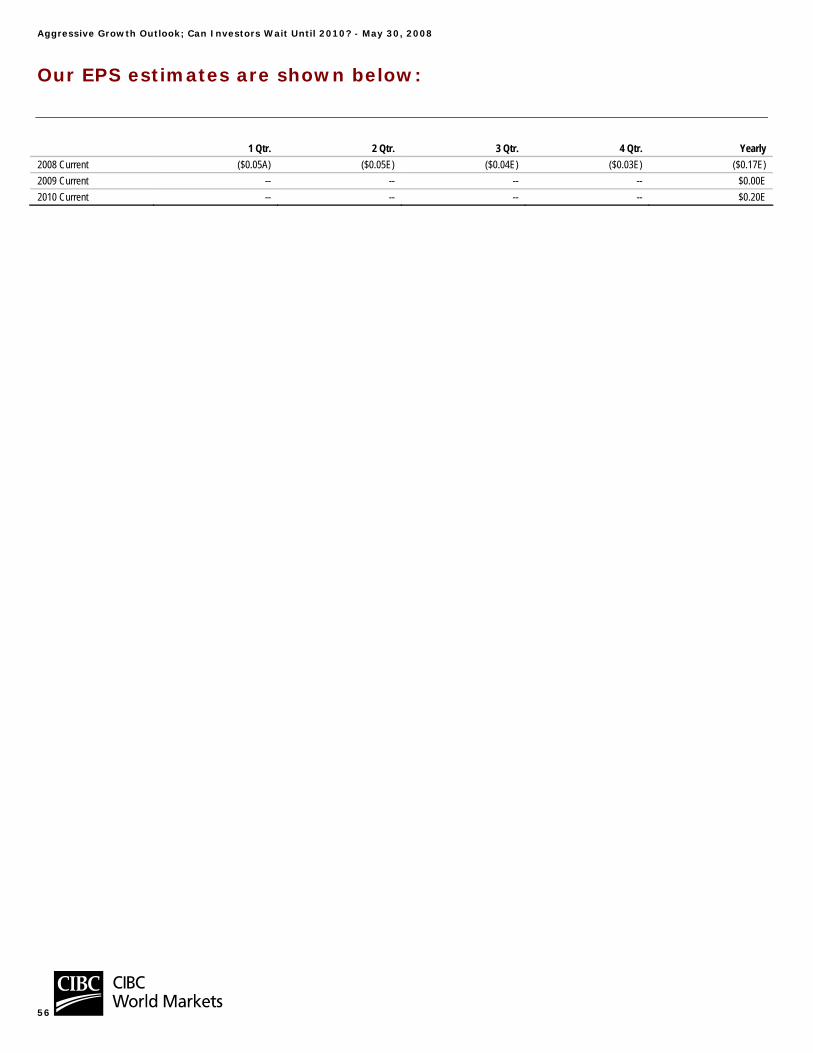
Aggressive Growth Outlook; Can Investors Wait Until 2010? - May 30, 2008
56
Our EPS estimates are shown below:
1 Qtr. 2 Qtr. 3 Qtr. 4 Qtr. Yearly 2008 Current ($0.05A) ($0.05E) ($0.04E) ($0.03E) ($0.17E) 2009 Current -- -- -- -- $0.00E 2010 Current -- -- -- -- $0.20E
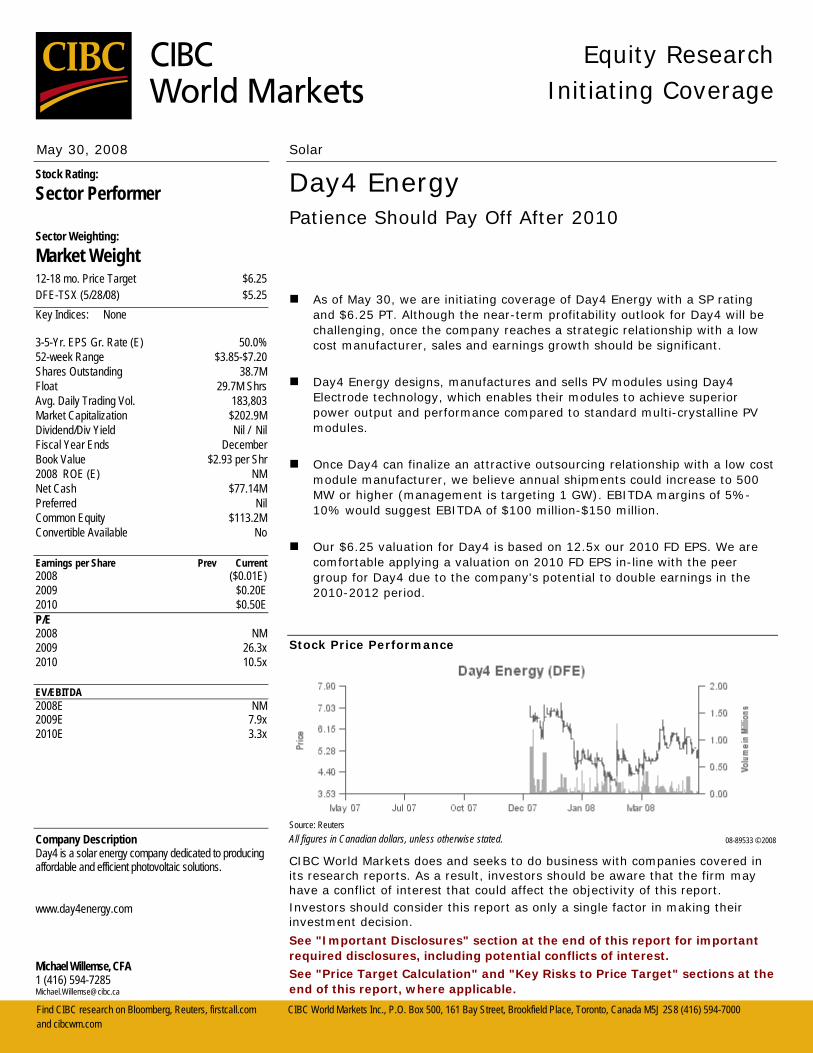
Find CIBC research on Bloomberg, Reuters, firstcall.com CIBC World Markets Inc., P.O. Box 500, 161 Bay Street, Brookfield Place, Toronto, Canada M5J 2S8 (416) 594-7000 and cibcwm.com
Equity Research
Initiating Coverage
May 30, 2008 Solar
Day4 Energy Patience Should Pay Off After 2010
As of May 30, we are initiating coverage of Day4 Energy with a SP rating and $6.25 PT. Although the near-term profitability outlook for Day4 will be challenging, once the company reaches a strategic relationship with a low cost manufacturer, sales and earnings growth should be significant.
Day4 Energy designs, manufactures and sells PV modules using Day4 Electrode technology, which enables their modules to achieve superior power output and performance compared to standard multi-crystalline PV modules.
Once Day4 can finalize an attractive outsourcing relationship with a low cost module manufacturer, we believe annual shipments could increase to 500 MW or higher (management is targeting 1 GW). EBITDA margins of 5%-10% would suggest EBITDA of $100 million-$150 million.
Our $6.25 valuation for Day4 is based on 12.5x our 2010 FD EPS. We are comfortable applying a valuation on 2010 FD EPS in-line with the peer group for Day4 due to the company's potential to double earnings in the 2010-2012 period.
Stock Price Performance
Source: Reuters All figures in Canadian dollars, unless otherwise stated. 08-89533 © 2008
CIBC World Markets does and seeks to do business with companies covered in its research reports. As a result, investors should be aware that the firm may have a conflict of interest that could affect the objectivity of this report. Investors should consider this report as only a single factor in making their investment decision.
See "Important Disclosures" section at the end of this report for important required disclosures, including potential conflicts of interest. See "Price Target Calculation" and "Key Risks to Price Target" sections at the end of this report, where applicable.
Michael Willemse, CFA 1 (416) 594-7285 [email protected]
Stock Rating:
Sector Performer
Sector Weighting:
Market Weight 12-18 mo. Price Target $6.25 DFE-TSX (5/28/08) $5.25 Key Indices: None
3-5-Yr. EPS Gr. Rate (E) 50.0% 52-week Range $3.85-$7.20 Shares Outstanding 38.7M Float 29.7M Shrs Avg. Daily Trading Vol. 183,803 Market Capitalization $202.9M Dividend/Div Yield Nil / Nil Fiscal Year Ends December Book Value $2.93 per Shr 2008 ROE (E) NM Net Cash $77.14M Preferred Nil Common Equity $113.2M Convertible Available No Earnings per Share Prev Current 2008 ($0.01E) 2009 $0.20E 2010 $0.50E P/E 2008 NM 2009 26.3x 2010 10.5x EV/EBITDA 2008E NM 2009E 7.9x 2010E 3.3x Company Description Day4 is a solar energy company dedicated to producing affordable and efficient photovoltaic solutions.
www.day4energy.com
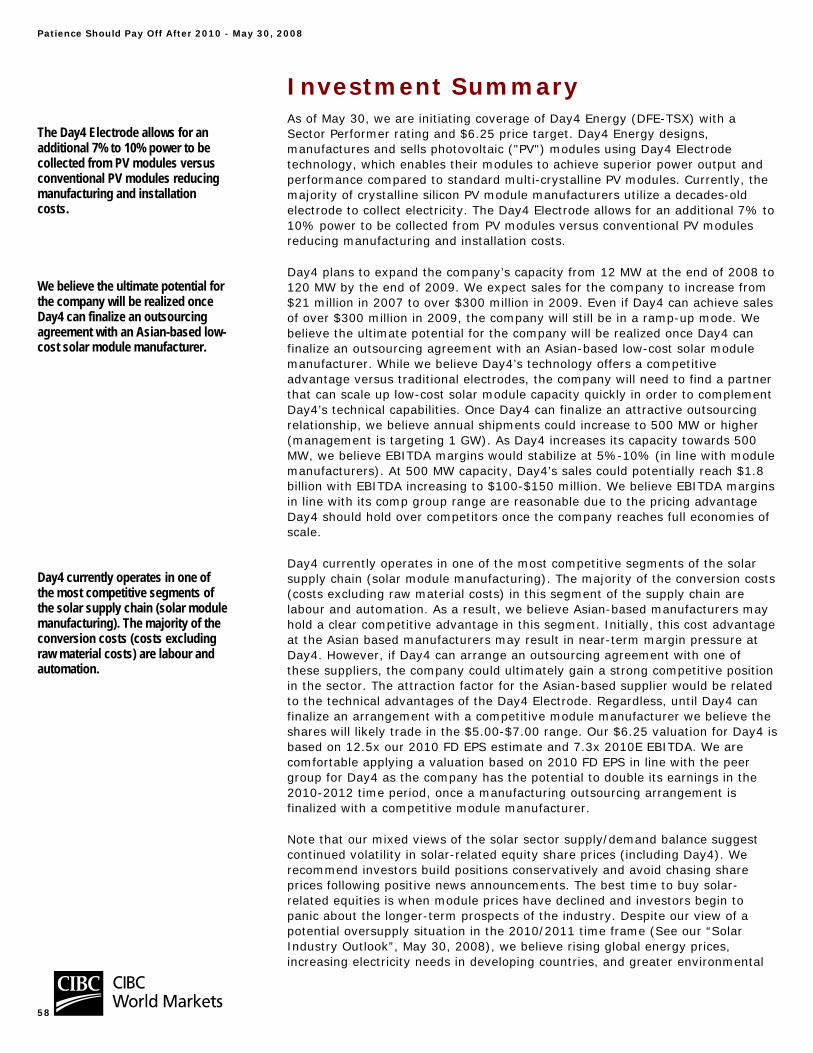
Patience Should Pay Off After 2010 - May 30, 2008
58
Investment Summary As of May 30, we are initiating coverage of Day4 Energy (DFE-TSX) with a Sector Performer rating and $6.25 price target. Day4 Energy designs, manufactures and sells photovoltaic ("PV") modules using Day4 Electrode technology, which enables their modules to achieve superior power output and performance compared to standard multi-crystalline PV modules. Currently, the majority of crystalline silicon PV module manufacturers utilize a decades-old electrode to collect electricity. The Day4 Electrode allows for an additional 7% to 10% power to be collected from PV modules versus conventional PV modules reducing manufacturing and installation costs.
Day4 plans to expand the company’s capacity from 12 MW at the end of 2008 to 120 MW by the end of 2009. We expect sales for the company to increase from $21 million in 2007 to over $300 million in 2009. Even if Day4 can achieve sales of over $300 million in 2009, the company will still be in a ramp-up mode. We believe the ultimate potential for the company will be realized once Day4 can finalize an outsourcing agreement with an Asian-based low-cost solar module manufacturer. While we believe Day4’s technology offers a competitive advantage versus traditional electrodes, the company will need to find a partner that can scale up low-cost solar module capacity quickly in order to complement Day4’s technical capabilities. Once Day4 can finalize an attractive outsourcing relationship, we believe annual shipments could increase to 500 MW or higher (management is targeting 1 GW). As Day4 increases its capacity towards 500 MW, we believe EBITDA margins would stabilize at 5%-10% (in line with module manufacturers). At 500 MW capacity, Day4’s sales could potentially reach $1.8 billion with EBITDA increasing to $100-$150 million. We believe EBITDA margins in line with its comp group range are reasonable due to the pricing advantage Day4 should hold over competitors once the company reaches full economies of scale.
Day4 currently operates in one of the most competitive segments of the solar supply chain (solar module manufacturing). The majority of the conversion costs (costs excluding raw material costs) in this segment of the supply chain are labour and automation. As a result, we believe Asian-based manufacturers may hold a clear competitive advantage in this segment. Initially, this cost advantage at the Asian based manufacturers may result in near-term margin pressure at Day4. However, if Day4 can arrange an outsourcing agreement with one of these suppliers, the company could ultimately gain a strong competitive position in the sector. The attraction factor for the Asian-based supplier would be related to the technical advantages of the Day4 Electrode. Regardless, until Day4 can finalize an arrangement with a competitive module manufacturer we believe the shares will likely trade in the $5.00-$7.00 range. Our $6.25 valuation for Day4 is based on 12.5x our 2010 FD EPS estimate and 7.3x 2010E EBITDA. We are comfortable applying a valuation based on 2010 FD EPS in line with the peer group for Day4 as the company has the potential to double its earnings in the 2010-2012 time period, once a manufacturing outsourcing arrangement is finalized with a competitive module manufacturer.
Note that our mixed views of the solar sector supply/demand balance suggest continued volatility in solar-related equity share prices (including Day4). We recommend investors build positions conservatively and avoid chasing share prices following positive news announcements. The best time to buy solar-related equities is when module prices have declined and investors begin to panic about the longer-term prospects of the industry. Despite our view of a potential oversupply situation in the 2010/2011 time frame (See our “Solar Industry Outlook”, May 30, 2008), we believe rising global energy prices, increasing electricity needs in developing countries, and greater environmental
The Day4 Electrode allows for an additional 7% to 10% power to be collected from PV modules versus conventional PV modules reducing manufacturing and installation costs.
We believe the ultimate potential for the company will be realized once Day4 can finalize an outsourcing agreement with an Asian-based low-cost solar module manufacturer.
Day4 currently operates in one of the most competitive segments of the solar supply chain (solar module manufacturing). The majority of the conversion costs (costs excluding raw material costs) are labour and automation.
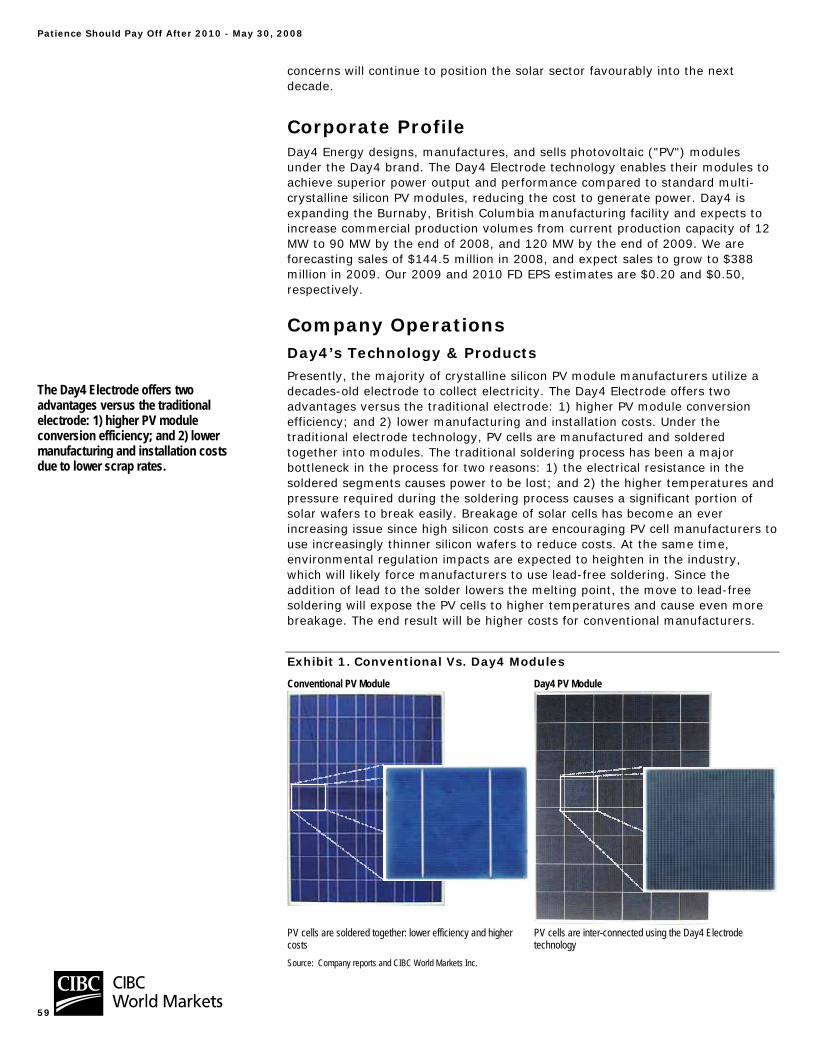
Patience Should Pay Off After 2010 - May 30, 2008
59
concerns will continue to position the solar sector favourably into the next decade.
Corporate Profile Day4 Energy designs, manufactures, and sells photovoltaic ("PV") modules under the Day4 brand. The Day4 Electrode technology enables their modules to achieve superior power output and performance compared to standard multi-crystalline silicon PV modules, reducing the cost to generate power. Day4 is expanding the Burnaby, British Columbia manufacturing facility and expects to increase commercial production volumes from current production capacity of 12 MW to 90 MW by the end of 2008, and 120 MW by the end of 2009. We are forecasting sales of $144.5 million in 2008, and expect sales to grow to $388 million in 2009. Our 2009 and 2010 FD EPS estimates are $0.20 and $0.50, respectively.
Company Operations Day4’s Technology & Products Presently, the majority of crystalline silicon PV module manufacturers utilize a decades-old electrode to collect electricity. The Day4 Electrode offers two advantages versus the traditional electrode: 1) higher PV module conversion efficiency; and 2) lower manufacturing and installation costs. Under the traditional electrode technology, PV cells are manufactured and soldered together into modules. The traditional soldering process has been a major bottleneck in the process for two reasons: 1) the electrical resistance in the soldered segments causes power to be lost; and 2) the higher temperatures and pressure required during the soldering process causes a significant portion of solar wafers to break easily. Breakage of solar cells has become an ever increasing issue since high silicon costs are encouraging PV cell manufacturers to use increasingly thinner silicon wafers to reduce costs. At the same time, environmental regulation impacts are expected to heighten in the industry, which will likely force manufacturers to use lead-free soldering. Since the addition of lead to the solder lowers the melting point, the move to lead-free soldering will expose the PV cells to higher temperatures and cause even more breakage. The end result will be higher costs for conventional manufacturers.
Exhibit 1. Conventional Vs. Day4 Modules
Conventional PV Module Day4 PV Module
PV cells are soldered together: lower efficiency and higher costs
PV cells are inter-connected using the Day4 Electrode technology
Source: Company reports and CIBC World Markets Inc.
The Day4 Electrode offers two advantages versus the traditional electrode: 1) higher PV module conversion efficiency; and 2) lower manufacturing and installation costs due to lower scrap rates.

Patience Should Pay Off After 2010 - May 30, 2008
60
Day4 has invented and patented the Day4 Electrode technology, which provides a solder-free method to connect PV cells into modules and collect the power generated from the modules. The Day4 Electrode is manufactured by coating copper wires with an alloy that melts at relatively low temperatures, and embedding the coated wires in polymer film. When the electrode is applied to the PV cells, it creates a low-resistance contact with the cells. The electrode is manufactured as a long strip, and cut into pieces to be applied to PV cells. Day4 has indicated that the use of their electrode allows for an additional 7% to 10% power to be collected from PV modules versus conventional PV modules. For high efficiency solar cells (16%-16.5% efficiencies) the increase in yield is significant. In laboratory testing, Day4 has demonstrated solar cell efficiencies of 18.5% for mono-crystalline silicon PV cells versus typical industry performance of 16.0%-16.5% for similar cells.
The manufacturing and installation costs are also reduced by using the Day4 technology. Since soldering is not required, cell manufacturers can innovate without the restriction that cells must be solder compatible. This could lead to cheaper cells with fewer manufacturing steps and better use of raw materials. The modules can also be manufactured at a lower cost due to lower cell breakage (typically 2%-5% of production in a standard module manufacturing facility). Installation costs are reduced due to the higher conversion efficiency of Day4 modules. The higher efficiency will require fewer modules to complete a project since each module will contribute more electricity. Therefore, fewer inputs of time and materials are needed, which results in lower costs.
Exhibit 2. Steps To Module Assembly
Prepare glass sheets
Prepare encapsulationmaterials
Apply add'l encapsulation material and back-sheet
Produce Day 4 Electrode
Position PV cells on glass encapsulate sandw ich
Apply Day 4 Electrode on PV
Cells
LaminationSolar simulator and high potential current leakage
testing
Framing and electrical leads assembly
DAY4 SPECIFIC STEPS
CONVENTIONAL ASSEMBLY STEPS
Source: Company reports and CIBC World Markets Inc.
Manufacturing Process Assembly - After the Day4 Electrode has been applied to the PV cells, they are positioned on a sheet of glass and encapsulation material, forming the electrical circuit. Another layer of encapsulation is added to the PV laminate sandwich. A layer of back-sheet film is added for protection and electrical insulation. The rest of the PV module assembly is similar to conventional assembly, and can easily be outsourced. The remaining steps include: laminating the sandwiches; framing and fitting with electrical leads; inspecting and testing for electrical power and current leakage.
Since soldering is not required, cell manufacturers can innovate without the restriction that cells must be solder compatible. This could lead to cheaper cells with fewer manufacturing steps and better use of raw materials.

Patience Should Pay Off After 2010 - May 30, 2008
61
Although Day4 intends to continue using third-party manufacturers to expand their production capacity of PV cells, the company plans to incorporate its newest technology at its Burnaby, B.C. operations, while outsourcing its earlier, more standardized technologies to leading solar cell manufacturers. Day4’s in-house production, administration, and R&D facilities are located at their two premises in Burnaby, B.C. totaling approximately 55,000 sq. ft., with leases valid to 2012-2013 time frame. The company leased a further 90,000 sq. ft in the same area during April 2007, bringing the total leased space to over 145,000 sq. ft. At the end of December 2007, Day4 had 103 employees: 13 in management and administration, eight in R&D, 12 in sales & marketing, and 70 in manufacturing.
Products Day4’s current flagship product is the Day4 48MC PV module, which is designed to be used in grid-connected residential and commercial systems. Multiple modules are usually connected together to form a multi-PV module PV system. Each module contains 48 multi-crystalline PV cells, with total power capacity ranging from 155W to 190W depending on the efficiency of the PV cells used. The removal of the stringing and tabbing steps in the manufacturing process allows for uniform blue modules, which are more aesthetically pleasing than conventional modules. The modules comply with the appropriate manufacturing standards for North American and European markets. As of the end of 2007, Day4 held four patents related to the Day4 Electrode, registered in most major global markets with varying expiry dates up to 2023.
Equipment Suppliers In January 2008, the first batch of proprietary PV production machinery was delivered to Day4 from their supplier, ACI-ecoTec GmbH & Co. KG (“ACI-ecoTec”), which is located in St. Georgen, Germany. ACI-ecoTec works with customers to create custom machinery for automated processes and production systems that are modular, standardized, and process-oriented. In addition to the photovoltaic industry, ACI-ecoTec also builds systems for the electronics, semiconductor, automotive, pharmaceutical, and medical industries.
Third-party Verification The Department of Industrial Engineering at the Albstadt-Sigmaringen University in Germany began collecting data on Day4’s solar modules in July 2007 in order to run tests on the modules. The university has been involved with monitoring and testing solar power generation since 1996, and these activities are currently headed by Professor Franz Josef Kuhn.
The tests compare the power output, density, and efficiency of various mono-crystalline, multi-crystalline, and thin-film cells. They are conducted at 12 test sites with different levels of irradiance and temperature. In April 2008, the test results for Day4’s 48MC solar modules were released; the university indicated that the Day4 module had the highest power density rating that the university had ever seen.
New Opportunities At the end of 2007, the Research and Development (R&D) group at Day4 consisted of eight employees. The company also holds strong working relationships with a number of research institutes including the University of Konstanz, Germany and ISE Fraunhofer Institute in Germany. Since 2003, Day4 has invested in excess of $5.4 million in R&D activities and obtained government grant funding and tax credits of $2.2 million. Current R&D projects include utilizing the Day4 technology that would be compatible with the emerging thin-
In April 2008, the Albstadt-Sigmaringen University provided positive feedback following test results for Day4’s 48MC solar module. The university indicated that the Day4 module had the highest power density rating that the university had ever seen.
Patience Should Pay Off After 2010 - May 30, 2008
62
film sector. Day4 is particularly interested in the development of flexible substrate thin-film PV cell technologies. We believe investors would look favourably upon an entrance by Day4 into the fast growing thin-film market. We believe the end market for thin-film could increase by 2x-3x over the next three to four years (for further information related to our outlook for the thin-film market see our recent report titled, “Solar Industry Outlook”, May 30, 2008).
Customers & Suppliers Customers The end-users of Day4’s systems typically fall into the following categories: residential, commercial real estate, or independent power producers/utilities. Target customers for Day4 include PV system integrators and operators consisting of independent power producers of electrical power utilities such as EnBW Systeme Infrastruktur Support GmbH (EBK-F) and Conergy Inc. (CGY-F). Revenues are largely concentrated with these two customers. However, under current contracts, Day4 expects revenues in 2008 to be far less concentrated; only 13% of revenues will come from the largest customer, while the average customer will account for 5% of sales volume.
The majority of sales in 2007 were to customers in Europe (65%, with 64% in Germany) and to a lesser extent North America (35%, with 31% in the U.S.). The company plans to increase its proportion of sales to Europe in the near term due to its higher degree of government support (and higher prices) in these countries. However, Day4 plans to maintain a position in the North American market, since the company believes that longer term, the North American market has the potential to be the most significant source of growth for the company. At the end of 2007, the sales force at Day4 consisted of 12 employees located in Canada, Germany, and Italy.
Suppliers Since all of Day4’s PV cell production is outsourced and PV cells represent approximately 70% of cost of goods sold, strong relationships with suppliers are critical for the company. In aggregate, Day4 has secured access to a maximum of 310 MW of PV cells over the next four years. Developing relationships with multiple suppliers is important for many reasons including: securing a supply of PV cells, potential pricing discounts on large volume orders, and familiarity working with Day4’s R&D team to optimize production lines.
Q-Cells (QCE-F) - Located in Germany, Q-Cells is the world's second largest PV cell manufacturer. Q-Cells began producing cells for Day4 in 2006 and supplied over 80% of the PV cells used in the company’s PV modules during 2007. Contracts run until 2010 and total up to 90 MW of PV cells. While Q-Cells will continue to be Day4’s largest supplier in 2008, Q-Cell’s concentration as a supplier will be much lower.
Other Suppliers – Day4 signed contracts with two Taiwanese PV manufacturers in 2007. Motech (6244-TW) is the larger of the two suppliers and will supply up to 90 MW of PV cells under a five-year contract. Day4 has also entered into a manufacturing contract with Gintech (3514-TW) for 3 MW of PV cells in 2008. If the manufacturing relationship proceeds favourably, Gintech could provide up to 75 MW of PV cells over the next two years. In order to further diversify the company’s supply base, Day4 has continuously negotiated with two additional PV cell suppliers. Pricing for each PV cell manufacturing contract contains provisions for periodic price negotiations as well as acceptable product performance and quality clauses.
We believe investors would look favourably upon an entrance by Day4 into the fast growing thin-film market. We believe the end market for thin-film could increase by 2x-3x over the next three to four years
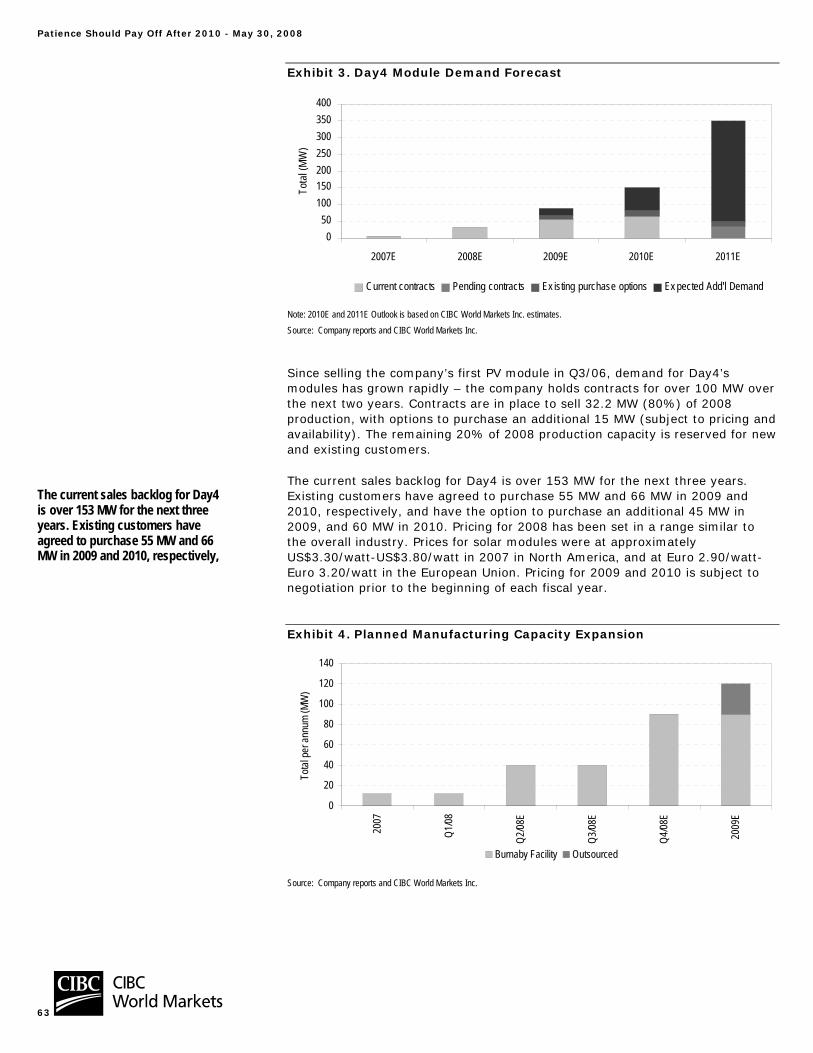
Patience Should Pay Off After 2010 - May 30, 2008
63
Exhibit 3. Day4 Module Demand Forecast
050
100150200250300350400
2007E 2008E 2009E 2010E 2011E
Tota
l (M
W)
Current contracts Pending contracts Ex isting purchase options Ex pected Add'l Demand
Note: 2010E and 2011E Outlook is based on CIBC World Markets Inc. estimates. Source: Company reports and CIBC World Markets Inc.
Since selling the company’s first PV module in Q3/06, demand for Day4’s modules has grown rapidly – the company holds contracts for over 100 MW over the next two years. Contracts are in place to sell 32.2 MW (80%) of 2008 production, with options to purchase an additional 15 MW (subject to pricing and availability). The remaining 20% of 2008 production capacity is reserved for new and existing customers.
The current sales backlog for Day4 is over 153 MW for the next three years. Existing customers have agreed to purchase 55 MW and 66 MW in 2009 and 2010, respectively, and have the option to purchase an additional 45 MW in 2009, and 60 MW in 2010. Pricing for 2008 has been set in a range similar to the overall industry. Prices for solar modules were at approximately US$3.30/watt-US$3.80/watt in 2007 in North America, and at Euro 2.90/watt-Euro 3.20/watt in the European Union. Pricing for 2009 and 2010 is subject to negotiation prior to the beginning of each fiscal year.
Exhibit 4. Planned Manufacturing Capacity Expansion
0
20
40
60
80
100
120
140
2007
Q1/08
Q2/08
E
Q3/08
E
Q4/08
E
2009
E
Total
per a
nnum
(MW
)
Burnaby Facility Outsourced
Source: Company reports and CIBC World Markets Inc.
The current sales backlog for Day4 is over 153 MW for the next three years. Existing customers have agreed to purchase 55 MW and 66 MW in 2009 and 2010, respectively,
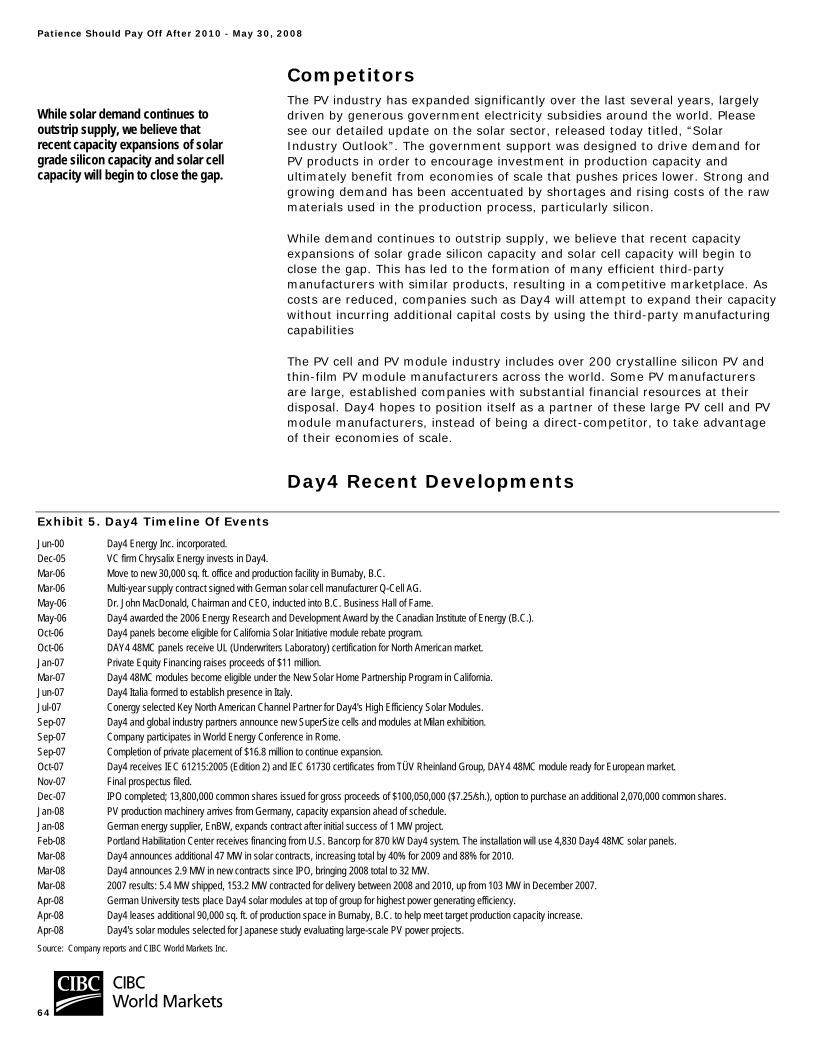
Patience Should Pay Off After 2010 - May 30, 2008
64
Competitors The PV industry has expanded significantly over the last several years, largely driven by generous government electricity subsidies around the world. Please see our detailed update on the solar sector, released today titled, “Solar Industry Outlook”. The government support was designed to drive demand for PV products in order to encourage investment in production capacity and ultimately benefit from economies of scale that pushes prices lower. Strong and growing demand has been accentuated by shortages and rising costs of the raw materials used in the production process, particularly silicon.
While demand continues to outstrip supply, we believe that recent capacity expansions of solar grade silicon capacity and solar cell capacity will begin to close the gap. This has led to the formation of many efficient third-party manufacturers with similar products, resulting in a competitive marketplace. As costs are reduced, companies such as Day4 will attempt to expand their capacity without incurring additional capital costs by using the third-party manufacturing capabilities
The PV cell and PV module industry includes over 200 crystalline silicon PV and thin-film PV module manufacturers across the world. Some PV manufacturers are large, established companies with substantial financial resources at their disposal. Day4 hopes to position itself as a partner of these large PV cell and PV module manufacturers, instead of being a direct-competitor, to take advantage of their economies of scale.
Day4 Recent Developments
Exhibit 5. Day4 Timeline Of Events
Jun-00 Day4 Energy Inc. incorporated. Dec-05 VC firm Chrysalix Energy invests in Day4. Mar-06 Move to new 30,000 sq. ft. office and production facility in Burnaby, B.C. Mar-06 Multi-year supply contract signed with German solar cell manufacturer Q-Cell AG. May-06 Dr. John MacDonald, Chairman and CEO, inducted into B.C. Business Hall of Fame. May-06 Day4 awarded the 2006 Energy Research and Development Award by the Canadian Institute of Energy (B.C.). Oct-06 Day4 panels become eligible for California Solar Initiative module rebate program. Oct-06 DAY4 48MC panels receive UL (Underwriters Laboratory) certification for North American market. Jan-07 Private Equity Financing raises proceeds of $11 million. Mar-07 Day4 48MC modules become eligible under the New Solar Home Partnership Program in California. Jun-07 Day4 Italia formed to establish presence in Italy. Jul-07 Conergy selected Key North American Channel Partner for Day4's High Efficiency Solar Modules. Sep-07 Day4 and global industry partners announce new SuperSize cells and modules at Milan exhibition. Sep-07 Company participates in World Energy Conference in Rome. Sep-07 Completion of private placement of $16.8 million to continue expansion. Oct-07 Day4 receives IEC 61215:2005 (Edition 2) and IEC 61730 certificates from TÜV Rheinland Group, DAY4 48MC module ready for European market. Nov-07 Final prospectus filed. Dec-07 IPO completed; 13,800,000 common shares issued for gross proceeds of $100,050,000 ($7.25/sh.), option to purchase an additional 2,070,000 common shares. Jan-08 PV production machinery arrives from Germany, capacity expansion ahead of schedule. Jan-08 German energy supplier, EnBW, expands contract after initial success of 1 MW project. Feb-08 Portland Habilitation Center receives financing from U.S. Bancorp for 870 kW Day4 system. The installation will use 4,830 Day4 48MC solar panels. Mar-08 Day4 announces additional 47 MW in solar contracts, increasing total by 40% for 2009 and 88% for 2010. Mar-08 Day4 announces 2.9 MW in new contracts since IPO, bringing 2008 total to 32 MW. Mar-08 2007 results: 5.4 MW shipped, 153.2 MW contracted for delivery between 2008 and 2010, up from 103 MW in December 2007. Apr-08 German University tests place Day4 solar modules at top of group for highest power generating efficiency. Apr-08 Day4 leases additional 90,000 sq. ft. of production space in Burnaby, B.C. to help meet target production capacity increase. Apr-08 Day4's solar modules selected for Japanese study evaluating large-scale PV power projects. Source: Company reports and CIBC World Markets Inc.
While solar demand continues to outstrip supply, we believe that recent capacity expansions of solar grade silicon capacity and solar cell capacity will begin to close the gap.

Patience Should Pay Off After 2010 - May 30, 2008
65
2007 & Q1/08 Highlights For all of 2007, Day4 generated revenue of $22.0 million from shipments of 5.4 MW (or approximately $4.07 per watt) versus revenue of $1.9 million and 0.5 MW in 2006. EBITDA loss for 2007 was reported at $10.2 million. Adjusted for unusual items of $2.9 million, the EBITDA loss would have been $11.0 million. Unusual items included non-cash expenses related to the issuance of the September 2007 convertible debenture, financing costs and a September 30, net realizable value write-down of inventory.
The company generated an operating loss of $11.0 million versus a loss of $3.8 million in 2006. The loss in 2007 reflected increased losses from product sales (due to below optimal capacity utilization levels), increased overhead, (staff and operational resources), financing costs, and inventory write-downs. Due to below optimal capacity utilization levels, losses are expected to continue until the end of 2008 at which time 2008 expansion plans will be complete and the company should move towards positive EBITDA.
Day4 generated approximately $128 million from three financings in 2007. The company completed a private placement of approximately $10 million in January 2007, a convertible debenture issue of $18 million in September 2007, and an initial public offering (IPO) in December 2007 that generated proceeds of $100.0 million. Capital expenditures in 2007 were $5.5 million versus $1.9 million in 2006. We expect capital expenditures in 2008 to be approximately $29 million that will be directed towards expanding capacity to 28 MW by mid-2008, and up to 90 MW by the end of 2008.
For Q1/08 Day4 reported sales of $13.5 million and achieved positive gross margins (of 2.0%) for the first time. EBITDA loss was $2.0 million (-15.0% margin). Management expects the company to reach breakeven EBITDA by Q4/08. The net cash position for Day4 as of Q1/08 was $74.1 million.
2008 & 2009 Outlook Our outlook for sales and earnings growth for Day4 is primarily based on continued capacity expansions. We expect shipments of solar modules to be approximately 32 MW in 2008 and 90 MW in 2009. In 2010 shipments should increase to 150 MW, which reflects further growth beyond the company’s targeted capacity for the end of 2009. We expect prices in 2008 to be in-line with industry pricing at approximately $4.50 per watt. For 2009 and 2010 we have assumed an average annual decline in pricing of approximately 7%-10%, which is in-line with our industry pricing outlook. Based on these parameters, we estimate 2008 and 2009 sales of approximately $145 million and $388 million, respectively. We expect Day4 to reach industry average gross margins (for module manufacturers) of approximately 8%-10% in 2009 and 2010. Our 2008 FD EPS estimate is a loss of $0.01, followed by positive earnings of $0.20 and $0.50 in 2009 and 2010, respectively.
Price Target Calculation Our $6.25 valuation for Day4 is based on 12.5x our 2010 FD EPS estimate and 7.3x 2010E EBITDA., We are comfortable applying a valuation based on 2010E FD EPS in-line with the peer group for Day4 as the company has the potential to double earnings in the 2010-2012 time frame, once a manufacturing outsourcing arrangement is finalized with a competitive module manufacturer. We would be buyers of shares below $5.00 and would take profits closer to $6.00.
Note that our mixed views of the solar sector supply/demand balance suggest continued volatility in solar-related equity share prices (including Day4). We
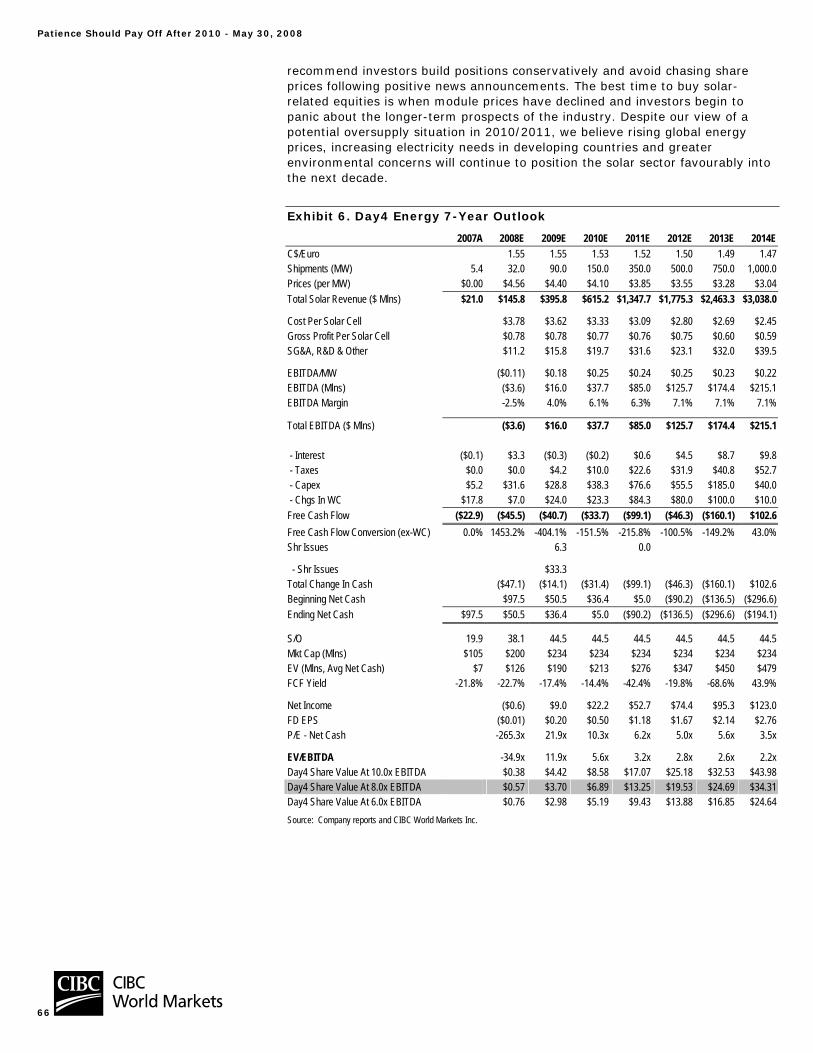
Patience Should Pay Off After 2010 - May 30, 2008
66
recommend investors build positions conservatively and avoid chasing share prices following positive news announcements. The best time to buy solar-related equities is when module prices have declined and investors begin to panic about the longer-term prospects of the industry. Despite our view of a potential oversupply situation in 2010/2011, we believe rising global energy prices, increasing electricity needs in developing countries and greater environmental concerns will continue to position the solar sector favourably into the next decade.
Exhibit 6. Day4 Energy 7-Year Outlook
2007A 2008E 2009E 2010E 2011E 2012E 2013E 2014EC$/Euro 1.55 1.55 1.53 1.52 1.50 1.49 1.47Shipments (MW) 5.4 32.0 90.0 150.0 350.0 500.0 750.0 1,000.0Prices (per MW) $0.00 $4.56 $4.40 $4.10 $3.85 $3.55 $3.28 $3.04Total Solar Revenue ($ Mlns) $21.0 $145.8 $395.8 $615.2 $1,347.7 $1,775.3 $2,463.3 $3,038.0
Cost Per Solar Cell $3.78 $3.62 $3.33 $3.09 $2.80 $2.69 $2.45Gross Profit Per Solar Cell $0.78 $0.78 $0.77 $0.76 $0.75 $0.60 $0.59SG&A, R&D & Other $11.2 $15.8 $19.7 $31.6 $23.1 $32.0 $39.5
EBITDA/MW ($0.11) $0.18 $0.25 $0.24 $0.25 $0.23 $0.22EBITDA (Mlns) ($3.6) $16.0 $37.7 $85.0 $125.7 $174.4 $215.1EBITDA Margin -2.5% 4.0% 6.1% 6.3% 7.1% 7.1% 7.1%
Total EBITDA ($ Mlns) ($3.6) $16.0 $37.7 $85.0 $125.7 $174.4 $215.1 - Interest ($0.1) $3.3 ($0.3) ($0.2) $0.6 $4.5 $8.7 $9.8 - Taxes $0.0 $0.0 $4.2 $10.0 $22.6 $31.9 $40.8 $52.7 - Capex $5.2 $31.6 $28.8 $38.3 $76.6 $55.5 $185.0 $40.0 - Chgs In WC $17.8 $7.0 $24.0 $23.3 $84.3 $80.0 $100.0 $10.0Free Cash Flow ($22.9) ($45.5) ($40.7) ($33.7) ($99.1) ($46.3) ($160.1) $102.6Free Cash Flow Conversion (ex-WC) 0.0% 1453.2% -404.1% -151.5% -215.8% -100.5% -149.2% 43.0%Shr Issues 6.3 0.0
- Shr Issues $33.3 Total Change In Cash ($47.1) ($14.1) ($31.4) ($99.1) ($46.3) ($160.1) $102.6Beginning Net Cash $97.5 $50.5 $36.4 $5.0 ($90.2) ($136.5) ($296.6)Ending Net Cash $97.5 $50.5 $36.4 $5.0 ($90.2) ($136.5) ($296.6) ($194.1)
S/O 19.9 38.1 44.5 44.5 44.5 44.5 44.5 44.5Mkt Cap (Mlns) $105 $200 $234 $234 $234 $234 $234 $234EV (Mlns, Avg Net Cash) $7 $126 $190 $213 $276 $347 $450 $479FCF Yield -21.8% -22.7% -17.4% -14.4% -42.4% -19.8% -68.6% 43.9%
Net Income ($0.6) $9.0 $22.2 $52.7 $74.4 $95.3 $123.0FD EPS ($0.01) $0.20 $0.50 $1.18 $1.67 $2.14 $2.76P/E - Net Cash -265.3x 21.9x 10.3x 6.2x 5.0x 5.6x 3.5x
EV/EBITDA -34.9x 11.9x 5.6x 3.2x 2.8x 2.6x 2.2xDay4 Share Value At 10.0x EBITDA $0.38 $4.42 $8.58 $17.07 $25.18 $32.53 $43.98Day4 Share Value At 8.0x EBITDA $0.57 $3.70 $6.89 $13.25 $19.53 $24.69 $34.31Day4 Share Value At 6.0x EBITDA $0.76 $2.98 $5.19 $9.43 $13.88 $16.85 $24.64Source: Company reports and CIBC World Markets Inc.

Patience Should Pay Off After 2010 - May 30, 2008
67
Key Risks To Price Target Upside Risk: The primary upside risk to our price target is greater than expected global solar demand resulting in greater than expected solar module production, sales, and capacity growth. Other upside risks include higher-than-expected selling prices or margins, increased valuations following the award of additional solar module supply contracts and the potential for significant earnings through the outsourcing of the Day4 electrode. Solar equities have also been positively impacted by favourable industry news, such as new or increased government incentive programs for solar power generation.
Downside Risk: The primary downside risks to our price target would be potential challenges with the ramp-up of Day4’s new solar electrode technology or negative customer feedback from the initial commercial shipments of Day4 solar modules. Other downside risks to our price target include weaker-than-expected solar module pricing and weaker-than-expected demand. Macroeconomic risks include cuts to government solar power incentive programs, reduced investment spending by companies and homeowners, and a stronger-than-expected Canadian dollar versus the U.S. dollar, Euro, and Chinese renminbi. Valuations of solar-related equities have increased significantly over the past year; a significant decline in solar sector valuations due to deterioration in fundamentals could negatively impact our price target.
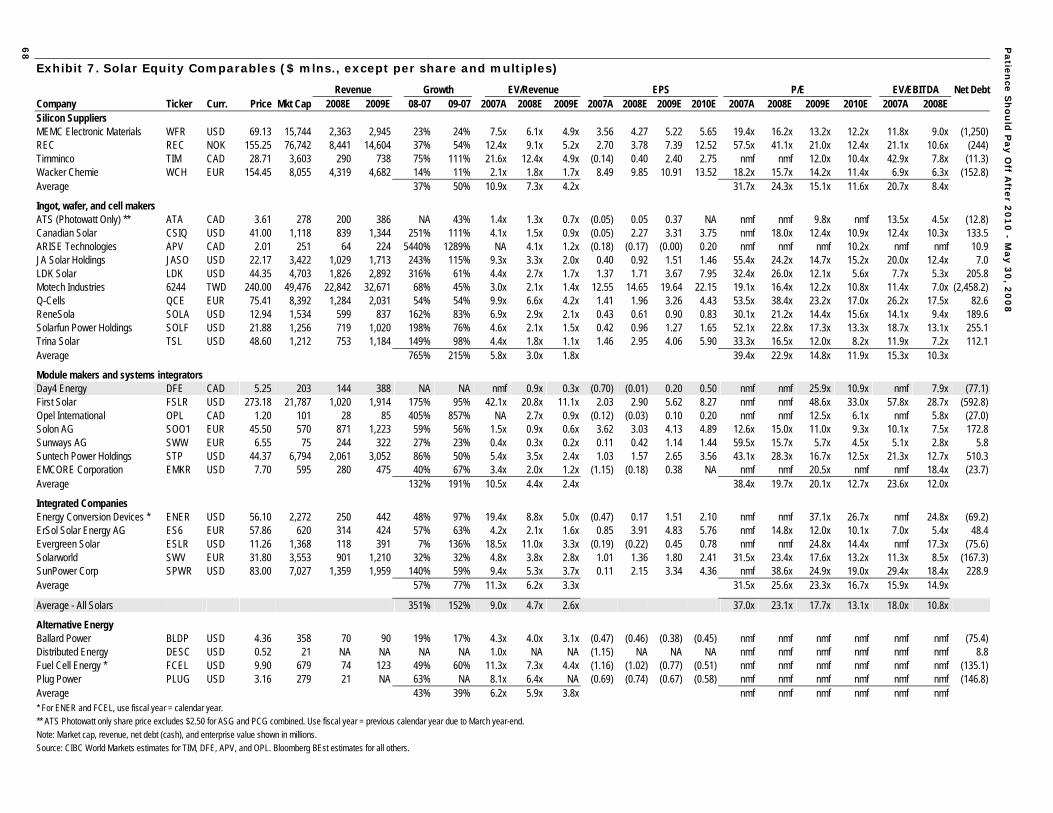
Patie
nce
Sh
ou
ld P
ay O
ff Afte
r 20
10
- May 3
0, 2
00
8
68
Exhibit 7. Solar Equity Comparables ($ mlns., except per share and multiples)
Revenue Growth EV/Revenue EPS P/E EV/EBITDA Net Debt Company Ticker Curr. Price Mkt Cap 2008E 2009E 08-07 09-07 2007A 2008E 2009E 2007A 2008E 2009E 2010E 2007A 2008E 2009E 2010E 2007A 2008E Silicon Suppliers MEMC Electronic Materials WFR USD 69.13 15,744 2,363 2,945 23% 24% 7.5x 6.1x 4.9x 3.56 4.27 5.22 5.65 19.4x 16.2x 13.2x 12.2x 11.8x 9.0x (1,250) REC REC NOK 155.25 76,742 8,441 14,604 37% 54% 12.4x 9.1x 5.2x 2.70 3.78 7.39 12.52 57.5x 41.1x 21.0x 12.4x 21.1x 10.6x (244) Timminco TIM CAD 28.71 3,603 290 738 75% 111% 21.6x 12.4x 4.9x (0.14) 0.40 2.40 2.75 nmf nmf 12.0x 10.4x 42.9x 7.8x (11.3) Wacker Chemie WCH EUR 154.45 8,055 4,319 4,682 14% 11% 2.1x 1.8x 1.7x 8.49 9.85 10.91 13.52 18.2x 15.7x 14.2x 11.4x 6.9x 6.3x (152.8) Average 37% 50% 10.9x 7.3x 4.2x 31.7x 24.3x 15.1x 11.6x 20.7x 8.4x
Ingot, wafer, and cell makers ATS (Photowatt Only) ** ATA CAD 3.61 278 200 386 NA 43% 1.4x 1.3x 0.7x (0.05) 0.05 0.37 NA nmf nmf 9.8x nmf 13.5x 4.5x (12.8) Canadian Solar CSIQ USD 41.00 1,118 839 1,344 251% 111% 4.1x 1.5x 0.9x (0.05) 2.27 3.31 3.75 nmf 18.0x 12.4x 10.9x 12.4x 10.3x 133.5 ARISE Technologies APV CAD 2.01 251 64 224 5440% 1289% NA 4.1x 1.2x (0.18) (0.17) (0.00) 0.20 nmf nmf nmf 10.2x nmf nmf 10.9 JA Solar Holdings JASO USD 22.17 3,422 1,029 1,713 243% 115% 9.3x 3.3x 2.0x 0.40 0.92 1.51 1.46 55.4x 24.2x 14.7x 15.2x 20.0x 12.4x 7.0 LDK Solar LDK USD 44.35 4,703 1,826 2,892 316% 61% 4.4x 2.7x 1.7x 1.37 1.71 3.67 7.95 32.4x 26.0x 12.1x 5.6x 7.7x 5.3x 205.8 Motech Industries 6244 TWD 240.00 49,476 22,842 32,671 68% 45% 3.0x 2.1x 1.4x 12.55 14.65 19.64 22.15 19.1x 16.4x 12.2x 10.8x 11.4x 7.0x (2,458.2) Q-Cells QCE EUR 75.41 8,392 1,284 2,031 54% 54% 9.9x 6.6x 4.2x 1.41 1.96 3.26 4.43 53.5x 38.4x 23.2x 17.0x 26.2x 17.5x 82.6 ReneSola SOLA USD 12.94 1,534 599 837 162% 83% 6.9x 2.9x 2.1x 0.43 0.61 0.90 0.83 30.1x 21.2x 14.4x 15.6x 14.1x 9.4x 189.6 Solarfun Power Holdings SOLF USD 21.88 1,256 719 1,020 198% 76% 4.6x 2.1x 1.5x 0.42 0.96 1.27 1.65 52.1x 22.8x 17.3x 13.3x 18.7x 13.1x 255.1 Trina Solar TSL USD 48.60 1,212 753 1,184 149% 98% 4.4x 1.8x 1.1x 1.46 2.95 4.06 5.90 33.3x 16.5x 12.0x 8.2x 11.9x 7.2x 112.1 Average 765% 215% 5.8x 3.0x 1.8x 39.4x 22.9x 14.8x 11.9x 15.3x 10.3x
Module makers and systems integrators Day4 Energy DFE CAD 5.25 203 144 388 NA NA nmf 0.9x 0.3x (0.70) (0.01) 0.20 0.50 nmf nmf 25.9x 10.9x nmf 7.9x (77.1) First Solar FSLR USD 273.18 21,787 1,020 1,914 175% 95% 42.1x 20.8x 11.1x 2.03 2.90 5.62 8.27 nmf nmf 48.6x 33.0x 57.8x 28.7x (592.8) Opel International OPL CAD 1.20 101 28 85 405% 857% NA 2.7x 0.9x (0.12) (0.03) 0.10 0.20 nmf nmf 12.5x 6.1x nmf 5.8x (27.0) Solon AG SOO1 EUR 45.50 570 871 1,223 59% 56% 1.5x 0.9x 0.6x 3.62 3.03 4.13 4.89 12.6x 15.0x 11.0x 9.3x 10.1x 7.5x 172.8 Sunways AG SWW EUR 6.55 75 244 322 27% 23% 0.4x 0.3x 0.2x 0.11 0.42 1.14 1.44 59.5x 15.7x 5.7x 4.5x 5.1x 2.8x 5.8 Suntech Power Holdings STP USD 44.37 6,794 2,061 3,052 86% 50% 5.4x 3.5x 2.4x 1.03 1.57 2.65 3.56 43.1x 28.3x 16.7x 12.5x 21.3x 12.7x 510.3 EMCORE Corporation EMKR USD 7.70 595 280 475 40% 67% 3.4x 2.0x 1.2x (1.15) (0.18) 0.38 NA nmf nmf 20.5x nmf nmf 18.4x (23.7) Average 132% 191% 10.5x 4.4x 2.4x 38.4x 19.7x 20.1x 12.7x 23.6x 12.0x
Integrated Companies Energy Conversion Devices * ENER USD 56.10 2,272 250 442 48% 97% 19.4x 8.8x 5.0x (0.47) 0.17 1.51 2.10 nmf nmf 37.1x 26.7x nmf 24.8x (69.2) ErSol Solar Energy AG ES6 EUR 57.86 620 314 424 57% 63% 4.2x 2.1x 1.6x 0.85 3.91 4.83 5.76 nmf 14.8x 12.0x 10.1x 7.0x 5.4x 48.4 Evergreen Solar ESLR USD 11.26 1,368 118 391 7% 136% 18.5x 11.0x 3.3x (0.19) (0.22) 0.45 0.78 nmf nmf 24.8x 14.4x nmf 17.3x (75.6) Solarworld SWV EUR 31.80 3,553 901 1,210 32% 32% 4.8x 3.8x 2.8x 1.01 1.36 1.80 2.41 31.5x 23.4x 17.6x 13.2x 11.3x 8.5x (167.3) SunPower Corp SPWR USD 83.00 7,027 1,359 1,959 140% 59% 9.4x 5.3x 3.7x 0.11 2.15 3.34 4.36 nmf 38.6x 24.9x 19.0x 29.4x 18.4x 228.9 Average 57% 77% 11.3x 6.2x 3.3x 31.5x 25.6x 23.3x 16.7x 15.9x 14.9x
Average - All Solars 351% 152% 9.0x 4.7x 2.6x 37.0x 23.1x 17.7x 13.1x 18.0x 10.8x
Alternative Energy Ballard Power BLDP USD 4.36 358 70 90 19% 17% 4.3x 4.0x 3.1x (0.47) (0.46) (0.38) (0.45) nmf nmf nmf nmf nmf nmf (75.4) Distributed Energy DESC USD 0.52 21 NA NA NA NA 1.0x NA NA (1.15) NA NA NA nmf nmf nmf nmf nmf nmf 8.8 Fuel Cell Energy * FCEL USD 9.90 679 74 123 49% 60% 11.3x 7.3x 4.4x (1.16) (1.02) (0.77) (0.51) nmf nmf nmf nmf nmf nmf (135.1) Plug Power PLUG USD 3.16 279 21 NA 63% NA 8.1x 6.4x NA (0.69) (0.74) (0.67) (0.58) nmf nmf nmf nmf nmf nmf (146.8) Average 43% 39% 6.2x 5.9x 3.8x nmf nmf nmf nmf nmf nmf * For ENER and FCEL, use fiscal year = calendar year. ** ATS Photowatt only share price excludes $2.50 for ASG and PCG combined. Use fiscal year = previous calendar year due to March year-end. Note: Market cap, revenue, net debt (cash), and enterprise value shown in millions. Source: CIBC World Markets estimates for TIM, DFE, APV, and OPL. Bloomberg BEst estimates for all others.
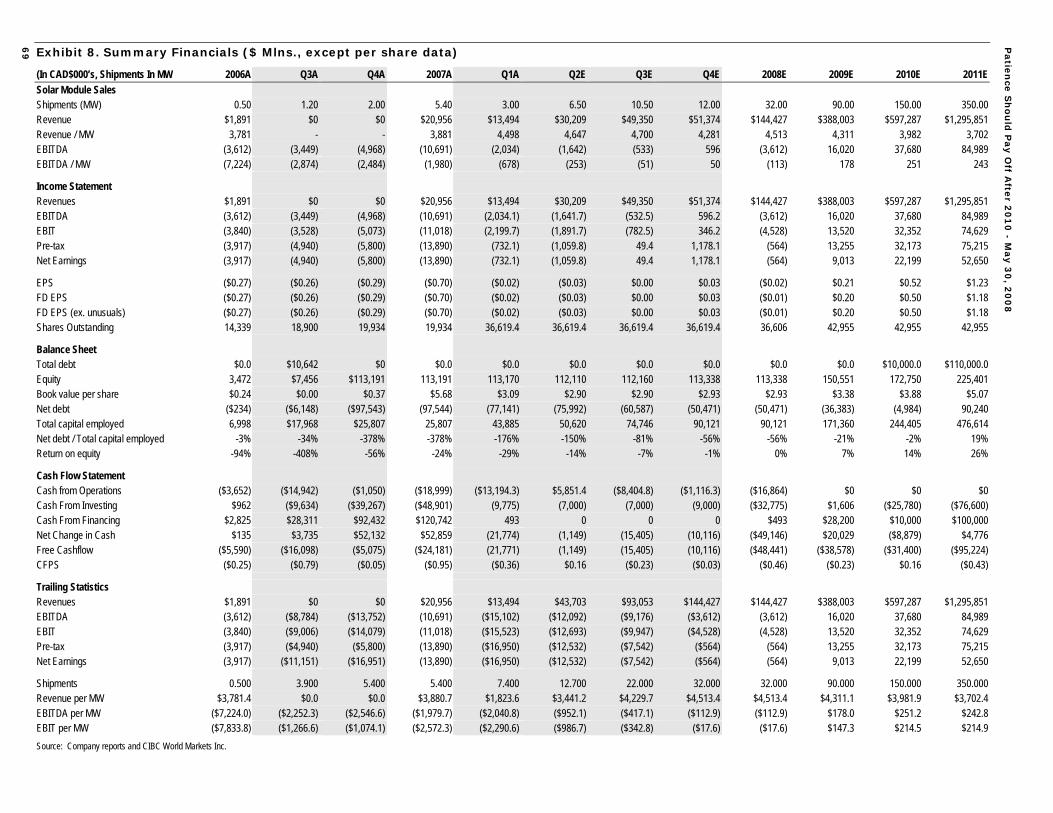
Patie
nce
Sh
ou
ld P
ay O
ff Afte
r 20
10
- May 3
0, 2
00
8
69 Exhibit 8. Summary Financials ($ Mlns., except per share data)
(In CAD$000’s, Shipments In MW 2006A Q3A Q4A 2007A Q1A Q2E Q3E Q4E 2008E 2009E 2010E 2011E Solar Module Sales Shipments (MW) 0.50 1.20 2.00 5.40 3.00 6.50 10.50 12.00 32.00 90.00 150.00 350.00 Revenue $1,891 $0 $0 $20,956 $13,494 $30,209 $49,350 $51,374 $144,427 $388,003 $597,287 $1,295,851 Revenue / MW 3,781 - - 3,881 4,498 4,647 4,700 4,281 4,513 4,311 3,982 3,702 EBITDA (3,612) (3,449) (4,968) (10,691) (2,034) (1,642) (533) 596 (3,612) 16,020 37,680 84,989 EBITDA / MW (7,224) (2,874) (2,484) (1,980) (678) (253) (51) 50 (113) 178 251 243
Income Statement Revenues $1,891 $0 $0 $20,956 $13,494 $30,209 $49,350 $51,374 $144,427 $388,003 $597,287 $1,295,851 EBITDA (3,612) (3,449) (4,968) (10,691) (2,034.1) (1,641.7) (532.5) 596.2 (3,612) 16,020 37,680 84,989 EBIT (3,840) (3,528) (5,073) (11,018) (2,199.7) (1,891.7) (782.5) 346.2 (4,528) 13,520 32,352 74,629 Pre-tax (3,917) (4,940) (5,800) (13,890) (732.1) (1,059.8) 49.4 1,178.1 (564) 13,255 32,173 75,215 Net Earnings (3,917) (4,940) (5,800) (13,890) (732.1) (1,059.8) 49.4 1,178.1 (564) 9,013 22,199 52,650
EPS ($0.27) ($0.26) ($0.29) ($0.70) ($0.02) ($0.03) $0.00 $0.03 ($0.02) $0.21 $0.52 $1.23 FD EPS ($0.27) ($0.26) ($0.29) ($0.70) ($0.02) ($0.03) $0.00 $0.03 ($0.01) $0.20 $0.50 $1.18 FD EPS (ex. unusuals) ($0.27) ($0.26) ($0.29) ($0.70) ($0.02) ($0.03) $0.00 $0.03 ($0.01) $0.20 $0.50 $1.18 Shares Outstanding 14,339 18,900 19,934 19,934 36,619.4 36,619.4 36,619.4 36,619.4 36,606 42,955 42,955 42,955
Balance Sheet Total debt $0.0 $10,642 $0 $0.0 $0.0 $0.0 $0.0 $0.0 $0.0 $0.0 $10,000.0 $110,000.0 Equity 3,472 $7,456 $113,191 113,191 113,170 112,110 112,160 113,338 113,338 150,551 172,750 225,401 Book value per share $0.24 $0.00 $0.37 $5.68 $3.09 $2.90 $2.90 $2.93 $2.93 $3.38 $3.88 $5.07 Net debt ($234) ($6,148) ($97,543) (97,544) (77,141) (75,992) (60,587) (50,471) (50,471) (36,383) (4,984) 90,240 Total capital employed 6,998 $17,968 $25,807 25,807 43,885 50,620 74,746 90,121 90,121 171,360 244,405 476,614 Net debt / Total capital employed -3% -34% -378% -378% -176% -150% -81% -56% -56% -21% -2% 19% Return on equity -94% -408% -56% -24% -29% -14% -7% -1% 0% 7% 14% 26%
Cash Flow Statement Cash from Operations ($3,652) ($14,942) ($1,050) ($18,999) ($13,194.3) $5,851.4 ($8,404.8) ($1,116.3) ($16,864) $0 $0 $0 Cash From Investing $962 ($9,634) ($39,267) ($48,901) (9,775) (7,000) (7,000) (9,000) ($32,775) $1,606 ($25,780) ($76,600) Cash From Financing $2,825 $28,311 $92,432 $120,742 493 0 0 0 $493 $28,200 $10,000 $100,000 Net Change in Cash $135 $3,735 $52,132 $52,859 (21,774) (1,149) (15,405) (10,116) ($49,146) $20,029 ($8,879) $4,776 Free Cashflow ($5,590) ($16,098) ($5,075) ($24,181) (21,771) (1,149) (15,405) (10,116) ($48,441) ($38,578) ($31,400) ($95,224) CFPS ($0.25) ($0.79) ($0.05) ($0.95) ($0.36) $0.16 ($0.23) ($0.03) ($0.46) ($0.23) $0.16 ($0.43)
Trailing Statistics Revenues $1,891 $0 $0 $20,956 $13,494 $43,703 $93,053 $144,427 $144,427 $388,003 $597,287 $1,295,851 EBITDA (3,612) ($8,784) ($13,752) (10,691) ($15,102) ($12,092) ($9,176) ($3,612) (3,612) 16,020 37,680 84,989 EBIT (3,840) ($9,006) ($14,079) (11,018) ($15,523) ($12,693) ($9,947) ($4,528) (4,528) 13,520 32,352 74,629 Pre-tax (3,917) ($4,940) ($5,800) (13,890) ($16,950) ($12,532) ($7,542) ($564) (564) 13,255 32,173 75,215 Net Earnings (3,917) ($11,151) ($16,951) (13,890) ($16,950) ($12,532) ($7,542) ($564) (564) 9,013 22,199 52,650
Shipments 0.500 3.900 5.400 5.400 7.400 12.700 22.000 32.000 32.000 90.000 150.000 350.000 Revenue per MW $3,781.4 $0.0 $0.0 $3,880.7 $1,823.6 $3,441.2 $4,229.7 $4,513.4 $4,513.4 $4,311.1 $3,981.9 $3,702.4 EBITDA per MW ($7,224.0) ($2,252.3) ($2,546.6) ($1,979.7) ($2,040.8) ($952.1) ($417.1) ($112.9) ($112.9) $178.0 $251.2 $242.8 EBIT per MW ($7,833.8) ($1,266.6) ($1,074.1) ($2,572.3) ($2,290.6) ($986.7) ($342.8) ($17.6) ($17.6) $147.3 $214.5 $214.9 Source: Company reports and CIBC World Markets Inc.
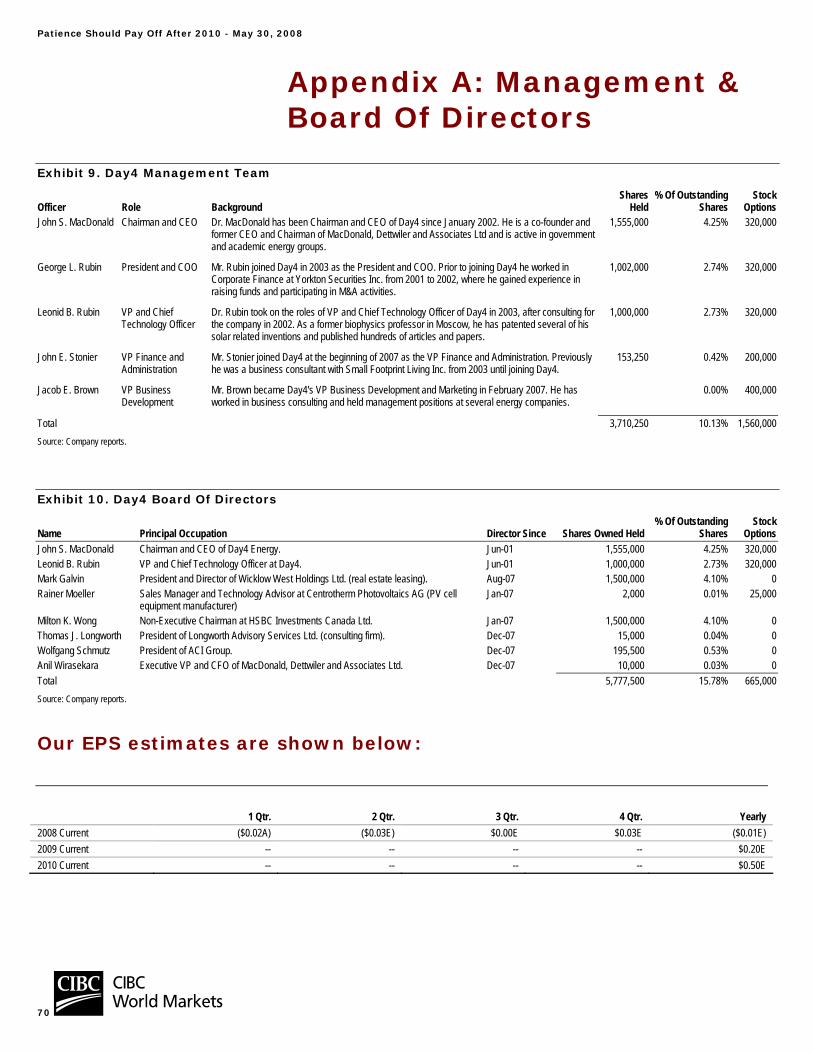
Patience Should Pay Off After 2010 - May 30, 2008
70
Appendix A: Management & Board Of Directors
Exhibit 9. Day4 Management Team
Officer Role Background Shares
Held % Of Outstanding
SharesStock
OptionsJohn S. MacDonald Chairman and CEO Dr. MacDonald has been Chairman and CEO of Day4 since January 2002. He is a co-founder and
former CEO and Chairman of MacDonald, Dettwiler and Associates Ltd and is active in government and academic energy groups.
1,555,000 4.25% 320,000
George L. Rubin President and COO Mr. Rubin joined Day4 in 2003 as the President and COO. Prior to joining Day4 he worked in Corporate Finance at Yorkton Securities Inc. from 2001 to 2002, where he gained experience in raising funds and participating in M&A activities.
1,002,000 2.74% 320,000
Leonid B. Rubin VP and Chief Technology Officer
Dr. Rubin took on the roles of VP and Chief Technology Officer of Day4 in 2003, after consulting for the company in 2002. As a former biophysics professor in Moscow, he has patented several of his solar related inventions and published hundreds of articles and papers.
1,000,000 2.73% 320,000
John E. Stonier VP Finance and Administration
Mr. Stonier joined Day4 at the beginning of 2007 as the VP Finance and Administration. Previously he was a business consultant with Small Footprint Living Inc. from 2003 until joining Day4.
153,250 0.42% 200,000
Jacob E. Brown VP Business Development
Mr. Brown became Day4's VP Business Development and Marketing in February 2007. He has worked in business consulting and held management positions at several energy companies.
0.00% 400,000
Total 3,710,250 10.13% 1,560,000Source: Company reports.
Exhibit 10. Day4 Board Of Directors
Name Principal Occupation Director Since Shares Owned Held % Of Outstanding
SharesStock
OptionsJohn S. MacDonald Chairman and CEO of Day4 Energy. Jun-01 1,555,000 4.25% 320,000Leonid B. Rubin VP and Chief Technology Officer at Day4. Jun-01 1,000,000 2.73% 320,000Mark Galvin President and Director of Wicklow West Holdings Ltd. (real estate leasing). Aug-07 1,500,000 4.10% 0Rainer Moeller Sales Manager and Technology Advisor at Centrotherm Photovoltaics AG (PV cell
equipment manufacturer) Jan-07 2,000 0.01% 25,000
Milton K. Wong Non-Executive Chairman at HSBC Investments Canada Ltd. Jan-07 1,500,000 4.10% 0Thomas J. Longworth President of Longworth Advisory Services Ltd. (consulting firm). Dec-07 15,000 0.04% 0Wolfgang Schmutz President of ACI Group. Dec-07 195,500 0.53% 0Anil Wirasekara Executive VP and CFO of MacDonald, Dettwiler and Associates Ltd. Dec-07 10,000 0.03% 0Total 5,777,500 15.78% 665,000Source: Company reports.
Our EPS estimates are shown below:
1 Qtr. 2 Qtr. 3 Qtr. 4 Qtr. Yearly 2008 Current ($0.02A) ($0.03E) $0.00E $0.03E ($0.01E) 2009 Current -- -- -- -- $0.20E 2010 Current -- -- -- -- $0.50E
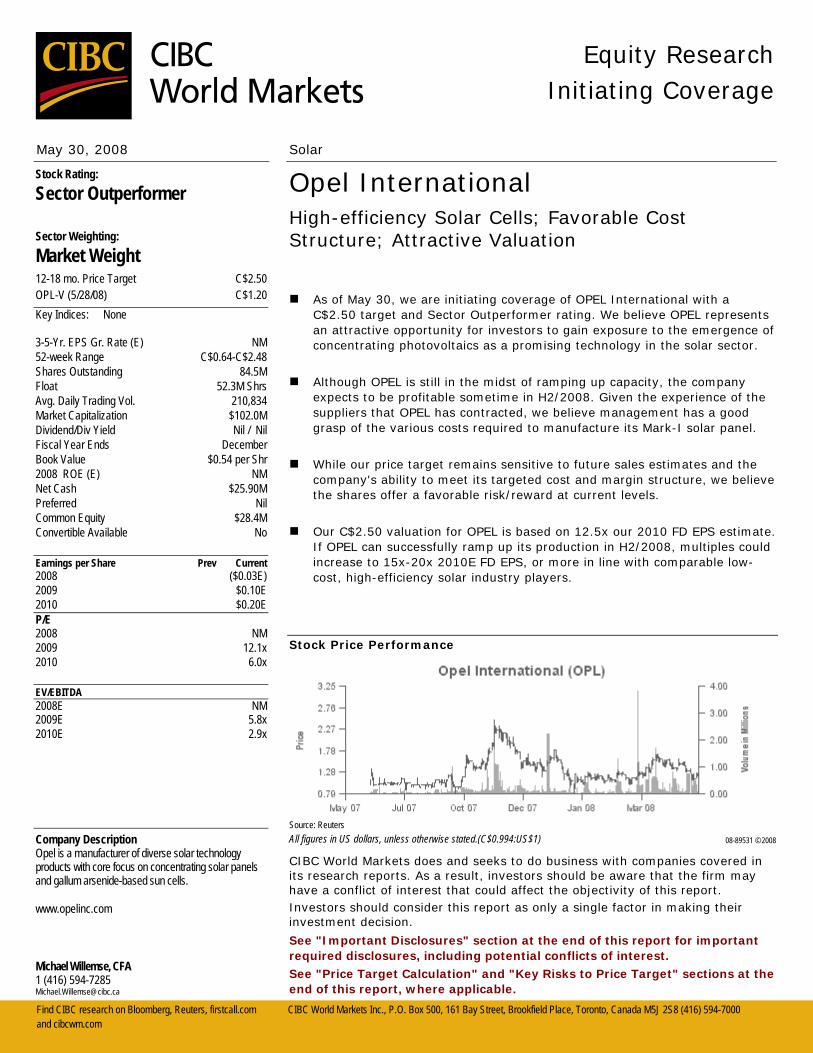
Find CIBC research on Bloomberg, Reuters, firstcall.com CIBC World Markets Inc., P.O. Box 500, 161 Bay Street, Brookfield Place, Toronto, Canada M5J 2S8 (416) 594-7000 and cibcwm.com
Equity Research
Initiating Coverage
May 30, 2008 Solar
Opel International High-efficiency Solar Cells; Favorable Cost Structure; Attractive Valuation
As of May 30, we are initiating coverage of OPEL International with a C$2.50 target and Sector Outperformer rating. We believe OPEL represents an attractive opportunity for investors to gain exposure to the emergence of concentrating photovoltaics as a promising technology in the solar sector.
Although OPEL is still in the midst of ramping up capacity, the company expects to be profitable sometime in H2/2008. Given the experience of the suppliers that OPEL has contracted, we believe management has a good grasp of the various costs required to manufacture its Mark-I solar panel.
While our price target remains sensitive to future sales estimates and the company's ability to meet its targeted cost and margin structure, we believe the shares offer a favorable risk/reward at current levels.
Our C$2.50 valuation for OPEL is based on 12.5x our 2010 FD EPS estimate. If OPEL can successfully ramp up its production in H2/2008, multiples could increase to 15x-20x 2010E FD EPS, or more in line with comparable low-cost, high-efficiency solar industry players.
Stock Price Performance
Source: Reuters All figures in US dollars, unless otherwise stated.(C$0.994:US$1) 08-89531 © 2008
CIBC World Markets does and seeks to do business with companies covered in its research reports. As a result, investors should be aware that the firm may have a conflict of interest that could affect the objectivity of this report. Investors should consider this report as only a single factor in making their investment decision.
See "Important Disclosures" section at the end of this report for important required disclosures, including potential conflicts of interest. See "Price Target Calculation" and "Key Risks to Price Target" sections at the end of this report, where applicable.
Michael Willemse, CFA 1 (416) 594-7285 [email protected]
Stock Rating:
Sector Outperformer
Sector Weighting:
Market Weight 12-18 mo. Price Target C$2.50 OPL-V (5/28/08) C$1.20 Key Indices: None
3-5-Yr. EPS Gr. Rate (E) NM 52-week Range C$0.64-C$2.48 Shares Outstanding 84.5M Float 52.3M Shrs Avg. Daily Trading Vol. 210,834 Market Capitalization $102.0M Dividend/Div Yield Nil / Nil Fiscal Year Ends December Book Value $0.54 per Shr 2008 ROE (E) NM Net Cash $25.90M Preferred Nil Common Equity $28.4M Convertible Available No Earnings per Share Prev Current 2008 ($0.03E) 2009 $0.10E 2010 $0.20E P/E 2008 NM 2009 12.1x 2010 6.0x EV/EBITDA 2008E NM 2009E 5.8x 2010E 2.9x Company Description Opel is a manufacturer of diverse solar technology products with core focus on concentrating solar panels and gallum arsenide-based sun cells.
www.opelinc.com

High-efficiency Solar Cells; Favorable Cost Structure; Attractive Valuation - May 30, 2008
72
Investment Summary As of May 30 we are initiating coverage of OPEL International (OPL–V) with a C$2.50 price target and a Sector Outperformer rating. We believe that OPEL represents an attractive opportunity for investors to gain exposure to the emergence of high-efficiency gallium arsenide solar panels, otherwise known as Concentrating Photovoltaic (CPV) panels, as a promising technology in the solar sector. OPEL is in the process of transitioning to commercial production. Any issues during the ramp-up period could result in some sensitivity to our forward earnings estimates, which is reflected in our valuation. However, we believe that management has a good grasp of the various costs required to manufacture its flagship product, the high-concentration Mark-I solar panel. OPEL will source the components for its Mark-I solar panel as follows: gallium arsenide solar wafers/cells from Spectrolab, a subsidiary of Boeing Corporation (BA–NYSE); solar tracker systems from FEiNA SCP (from Spain); and aluminum stampings and assembly outsourcing to Flextronics International (FLEX–SP). We believe that the most critical supplier to OPEL is Spectrolab, which has been manufacturing semiconductor solar cells and panels (for satellites) to the space industry since 1959. FEiNA has manufactured solar tracker systems for the past 10 years.
One of OPEL’s major challenges will be whether its panel design (the Mark-1) can be manufactured by its contractors/suppliers at its desired cost structure. Management believes that OPEL can achieve a 20% gross margin in H2/2008 and 30% in 2009. OPEL is targeting a $3.25/watt selling price for its solar panels, well below current pricing for crystalline solar modules of approximately $4.00/watt–$4.80/watt. OPEL’s competitive cost structure is primarily due to much higher solar panel cell efficiencies (26%–28% versus crystalline solar modules at 15%–18%). Despite OPEL’s significant cost advantage over traditional crystalline solar modules, management believes its cost structure can improve further in 2009–2011.
Given the experience of the suppliers and manufacturers that have been contracted by OPEL, we believe OPEL shares offer a favorable risk/reward profile relative to our price target of C$2.50. OPEL expects to ship only 8 megawatts (MW) in H2/2008, but management believes the company can be profitable during this period. If OPEL can generate a profit of $0.01–$0.02 in either Q3/2008 or Q4/2008, we believe investors will quickly gauge the earnings power of the company for 2009. Given the potential to ramp up shipments to as high as 50 MW in 2009/2010 from 8 MW in H2/2008 we believe a potential earnings power of $0.10–$0.20 is reasonable. Our C$2.50 valuation for OPEL is based on a multiple of 12.5x our 2010 FD EPS estimate. If OPEL can successfully ramp up its production in H2/2008, multiples could increase to 15x–20x 2010E FD EPS, or more in line with comparable low-cost, high-efficiency solar industry players. A multiple of 15x–20x 2010E EPS would suggest a price target of C$3.00–C$4.00.
Nonetheless, until H2/2008 results are released and larger customer awards are granted, we believe investors may prefer a more conservative valuation, or a risk-adjusted valuation. If OPEL is unable to reach profitability by H2/2008, we believe downside risk in the shares would be limited to C$0.55, or the company’s current cash per share (basic).
The critical supplier to OPEL is Spectrolab, which has been manufacturing semiconductor solar cells and panels (for satellites) to the space industry since 1959. FEiNA has manufactured solar tracker systems for the past 10 years
OPEL’s competitive cost structure is primarily due to much higher solar panel cell efficiencies (26%–28% versus crystalline solar modules at 15%–18%). Despite OPEL’s existing cost advantage, management believes its cost structure can improve further in 2009–2011.

High-efficiency Solar Cells; Favorable Cost Structure; Attractive Valuation - May 30, 2008
73
Company Profile OPEL International is an early-stage company that has developed gallium arsenide (GaAs) based microchip products since the company’s founding in December 2000. The company’s initial purpose was to develop GaAs photonics technology for fiber optics and military applications such as laser and infrared detection. OPEL was able to decrease the size and cost of these devices by integrating multiple components on a single GaAs chip. Subsequently, OPEL discovered that its technology also worked well in solar applications. Shortly thereafter, the majority of OPEL’s resources were allocated to developing concentrated photovoltaic (PV) products.
OPEL has also been conducting R&D in fiber optic transceivers and infrared detection devices through a relationship with the University of Connecticut. Potential applications for fiber optic transceivers include solar integrated electronic control circuits for telecommunication applications such as Fiber To the Home (FTTH). OPEL was listed on the TSX Venture Exchange in June 2007.
Technology & Products OPEL is launching two primary products: the high-concentration Mark-I solar panel and the low-concentration Mark-III solar panel. In addition, OPEL came to an agreement recently with Solarfun Power Holdings (SOLF–NASDAQ) to market its silicon-based PV modules in North America and Brazil. OPEL developed the concentrating assembly single-handedly and developed the optics in conjunction with the Canadian National Research Council. The Mark-I solar panel is OPEL’s flagship product. Each panel is officially rated to produce a minimum of 85 watts using six Spectrolab GaAs cells and Fresnel type lenses that concentrate sunlight at 500x (see Exhibit 2). The Mark-I panel is ideally suited to areas with very high levels of solar irradiance. The Fresnel-type lenses, made from acrylic, are approximately 25 cm x 25 cm, whereas the GaAs cells are 1 cm x 1 cm. OPEL has filed for 46 patents related to its concentrator assembly, its Fresnel lenses, and its own multi-junction solar cells (23 patents granted to date).
OPEL will primarily utilize Spectrolab’s C1MJ cell, which is rated at a minimum average efficiency of 36%, although OPEL has recorded an average efficiency of 39% on recent deliveries of cells from Spectrolab. OPEL rates its solar panels at 26% to 28% efficiency. The reduction in efficiency is due to resistance from the Fresnel lens. Early attempts to utilize gallium arsenide cells had encountered challenges due to efficiency losses, but the value-added technologies provided by OPEL, such as the Acrylic Fresnel Lens and the inner prism, have improved efficiencies from prior levels (patented by OPEL but manufacturing is outsourced). In comparison, conventional silicon flat-plate panels typically operate at 15%–19% efficiency levels. A comparison between concentrator PV power and alternative PV technologies is provided in Exhibit 1.
The Mark-I panel is ideally suited to areas with very high levels of solar irradiance.
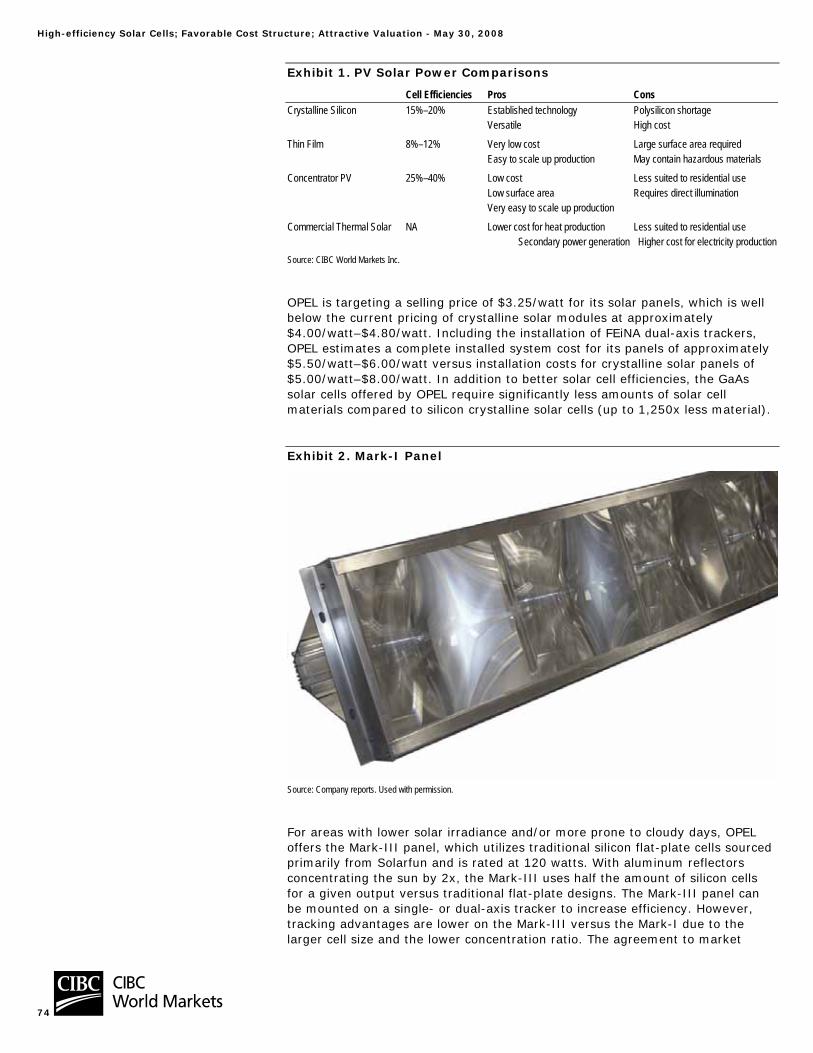
High-efficiency Solar Cells; Favorable Cost Structure; Attractive Valuation - May 30, 2008
74
Exhibit 1. PV Solar Power Comparisons
Cell Efficiencies Pros Cons Crystalline Silicon 15%–20% Established technology Polysilicon shortage Versatile High cost
Thin Film 8%–12% Very low cost Large surface area required Easy to scale up production May contain hazardous materials
Concentrator PV 25%–40% Low cost Less suited to residential use Low surface area Requires direct illumination Very easy to scale up production
Commercial Thermal Solar NA Lower cost for heat production Less suited to residential use Secondary power generation Higher cost for electricity production
Source: CIBC World Markets Inc.
OPEL is targeting a selling price of $3.25/watt for its solar panels, which is well below the current pricing of crystalline solar modules at approximately $4.00/watt–$4.80/watt. Including the installation of FEiNA dual-axis trackers, OPEL estimates a complete installed system cost for its panels of approximately $5.50/watt–$6.00/watt versus installation costs for crystalline solar panels of $5.00/watt–$8.00/watt. In addition to better solar cell efficiencies, the GaAs solar cells offered by OPEL require significantly less amounts of solar cell materials compared to silicon crystalline solar cells (up to 1,250x less material).
Exhibit 2. Mark-I Panel
Source: Company reports. Used with permission.
For areas with lower solar irradiance and/or more prone to cloudy days, OPEL offers the Mark-III panel, which utilizes traditional silicon flat-plate cells sourced primarily from Solarfun and is rated at 120 watts. With aluminum reflectors concentrating the sun by 2x, the Mark-III uses half the amount of silicon cells for a given output versus traditional flat-plate designs. The Mark-III panel can be mounted on a single- or dual-axis tracker to increase efficiency. However, tracking advantages are lower on the Mark-III versus the Mark-I due to the larger cell size and the lower concentration ratio. The agreement to market
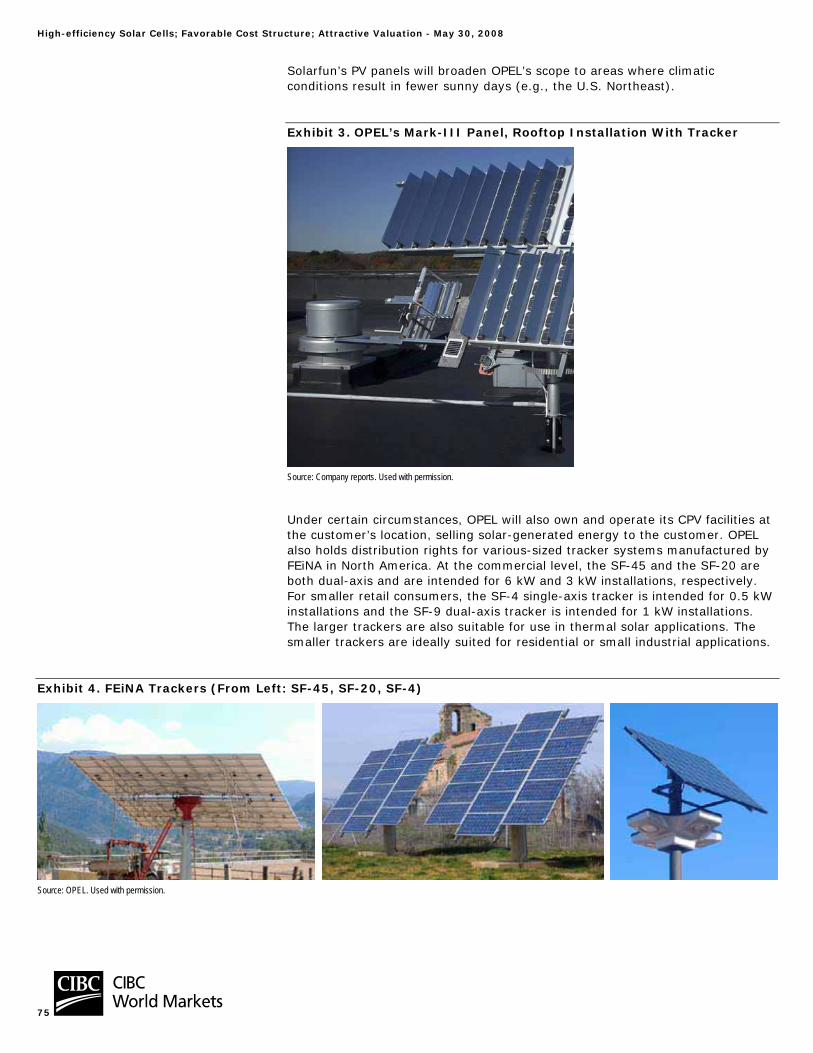
High-efficiency Solar Cells; Favorable Cost Structure; Attractive Valuation - May 30, 2008
75
Solarfun’s PV panels will broaden OPEL’s scope to areas where climatic conditions result in fewer sunny days (e.g., the U.S. Northeast).
Exhibit 3. OPEL’s Mark-III Panel, Rooftop Installation With Tracker
Source: Company reports. Used with permission.
Under certain circumstances, OPEL will also own and operate its CPV facilities at the customer’s location, selling solar-generated energy to the customer. OPEL also holds distribution rights for various-sized tracker systems manufactured by FEiNA in North America. At the commercial level, the SF-45 and the SF-20 are both dual-axis and are intended for 6 kW and 3 kW installations, respectively. For smaller retail consumers, the SF-4 single-axis tracker is intended for 0.5 kW installations and the SF-9 dual-axis tracker is intended for 1 kW installations. The larger trackers are also suitable for use in thermal solar applications. The smaller trackers are ideally suited for residential or small industrial applications.
Exhibit 4. FEiNA Trackers (From Left: SF-45, SF-20, SF-4)
Source: OPEL. Used with permission.
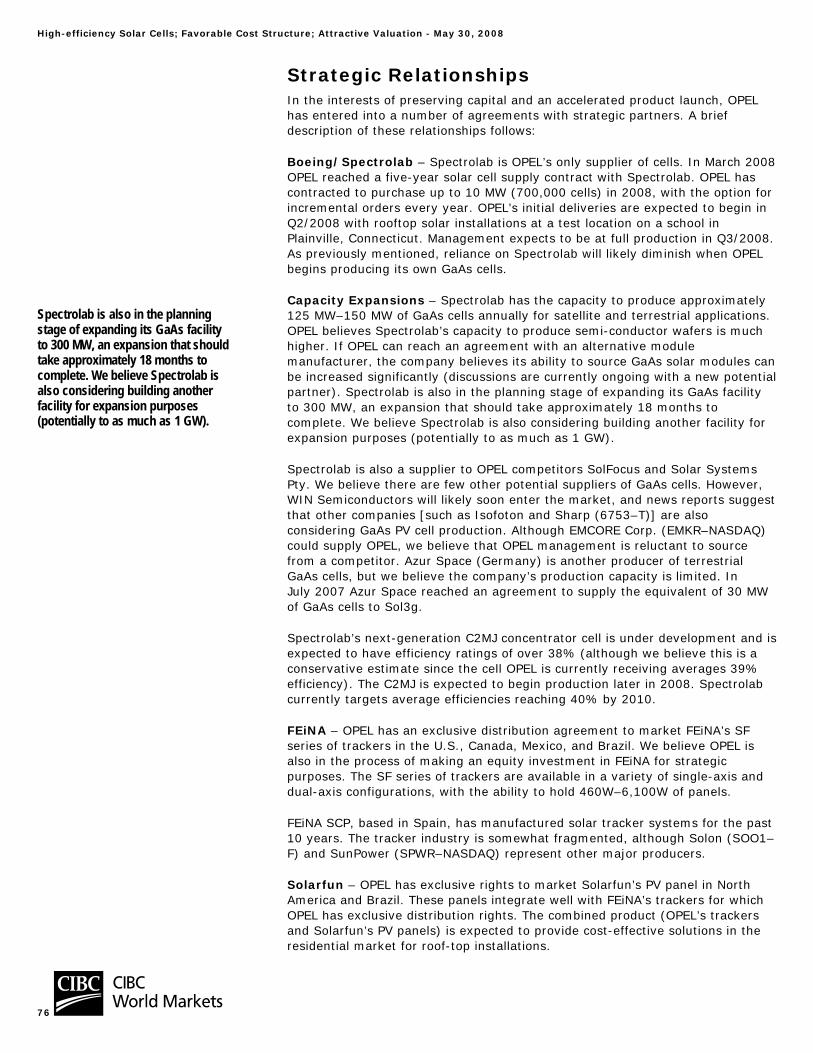
High-efficiency Solar Cells; Favorable Cost Structure; Attractive Valuation - May 30, 2008
76
Strategic Relationships In the interests of preserving capital and an accelerated product launch, OPEL has entered into a number of agreements with strategic partners. A brief description of these relationships follows:
Boeing/Spectrolab – Spectrolab is OPEL’s only supplier of cells. In March 2008 OPEL reached a five-year solar cell supply contract with Spectrolab. OPEL has contracted to purchase up to 10 MW (700,000 cells) in 2008, with the option for incremental orders every year. OPEL’s initial deliveries are expected to begin in Q2/2008 with rooftop solar installations at a test location on a school in Plainville, Connecticut. Management expects to be at full production in Q3/2008. As previously mentioned, reliance on Spectrolab will likely diminish when OPEL begins producing its own GaAs cells.
Capacity Expansions – Spectrolab has the capacity to produce approximately 125 MW–150 MW of GaAs cells annually for satellite and terrestrial applications. OPEL believes Spectrolab’s capacity to produce semi-conductor wafers is much higher. If OPEL can reach an agreement with an alternative module manufacturer, the company believes its ability to source GaAs solar modules can be increased significantly (discussions are currently ongoing with a new potential partner). Spectrolab is also in the planning stage of expanding its GaAs facility to 300 MW, an expansion that should take approximately 18 months to complete. We believe Spectrolab is also considering building another facility for expansion purposes (potentially to as much as 1 GW).
Spectrolab is also a supplier to OPEL competitors SolFocus and Solar Systems Pty. We believe there are few other potential suppliers of GaAs cells. However, WIN Semiconductors will likely soon enter the market, and news reports suggest that other companies [such as Isofoton and Sharp (6753–T)] are also considering GaAs PV cell production. Although EMCORE Corp. (EMKR–NASDAQ) could supply OPEL, we believe that OPEL management is reluctant to source from a competitor. Azur Space (Germany) is another producer of terrestrial GaAs cells, but we believe the company’s production capacity is limited. In July 2007 Azur Space reached an agreement to supply the equivalent of 30 MW of GaAs cells to Sol3g.
Spectrolab’s next-generation C2MJ concentrator cell is under development and is expected to have efficiency ratings of over 38% (although we believe this is a conservative estimate since the cell OPEL is currently receiving averages 39% efficiency). The C2MJ is expected to begin production later in 2008. Spectrolab currently targets average efficiencies reaching 40% by 2010.
FEiNA – OPEL has an exclusive distribution agreement to market FEiNA’s SF series of trackers in the U.S., Canada, Mexico, and Brazil. We believe OPEL is also in the process of making an equity investment in FEiNA for strategic purposes. The SF series of trackers are available in a variety of single-axis and dual-axis configurations, with the ability to hold 460W–6,100W of panels.
FEiNA SCP, based in Spain, has manufactured solar tracker systems for the past 10 years. The tracker industry is somewhat fragmented, although Solon (SOO1–F) and SunPower (SPWR–NASDAQ) represent other major producers.
Solarfun – OPEL has exclusive rights to market Solarfun’s PV panel in North America and Brazil. These panels integrate well with FEiNA’s trackers for which OPEL has exclusive distribution rights. The combined product (OPEL’s trackers and Solarfun’s PV panels) is expected to provide cost-effective solutions in the residential market for roof-top installations.
Spectrolab is also in the planning stage of expanding its GaAs facility to 300 MW, an expansion that should take approximately 18 months to complete. We believe Spectrolab is also considering building another facility for expansion purposes (potentially to as much as 1 GW).

High-efficiency Solar Cells; Favorable Cost Structure; Attractive Valuation - May 30, 2008
77
Contract Manufacturers – Flextronics is under contract to manufacture products for OPEL at its 100,000-sq.-ft. facility in Guadalajara, Mexico. The first assembly line recently began production, although full automation has not yet been achieved. Other contractors also manufacture lenses for OPEL. Obviously the contract manufacturing arrangement reduces OPEL’s investment and working capital requirements. Management indicated that arrangements are in place to source additional production if demand is greater than anticipated.
Research And Development – R&D partners for OPEL include the University of Ottawa, University of Sherbrooke, and the National Research Council of Canada. Since inception OPEL has filed 46 patent applications, of which 23 have been granted.
Customer Trial Programs A number of customer CPV trial programs are ongoing in North America and Europe, the purpose of each trial program typically being to test the power output in different weather conditions, durability, and maintenance. Three significant trials are being conducted with SunPeak Solar, Energy21, and Algonquin Power (APF.UN–SP).
SunPeak Solar is contemplating the construction of a solar farm in California of up to 1 GW. The company indicated that, following comprehensive tests, CPV has been selected as the preferred technology for the project. SunPeak is negotiating power purchase agreements with utilities in California, Colorado, and Oregon. OPEL does not believe that SunPeak would be willing to enter equipment purchase agreements until agreements were struck with the utilities. However, a 1 kilowatt Mark-I test system has been installed at the proposed site using a large-scale tracker of SunPeak’s design. OPEL management believes there is potential for SunPeak to order a 1.5 MW installation later in 2008.
On January 31, 2008, another CPV manufacturer, EMCORE, announced that it had signed a memorandum of understanding to supply between 200 MW and 700 MW of CPV solar power systems to SunPeak. EMCORE suggested that deliveries will not begin until 2009.
OPEL recently installed a trial system for Energy21, a utility based in the Czech Republic. OPEL’s Mark-I panels and trackers were compared side-by-side with other PV technologies. Following positive results, Energy21 signed a letter of intent (LOI) to order a system with 5 MW of output. Subsequent to the LOI Energy21 has restructured to expand outside Central Europe. Additional service areas for Energy21 now include Greece, Croatia and, most significantly, Spain. In light of this recent expansion, OPEL believes Energy21 may be considering increasing its potential order size.
OPEL has agreed to install a trial system for Algonquin Power near the Toronto Pearson International Airport. The 2 kW trial systems will use Mark-III panels and trackers. Assuming positive test results, OPEL expects Algonquin Power to follow up with a 1 MW order later in 2008.
OPEL has also received initial test orders from numerous customers in Korea, Spain, Greece, Australia, and Germany. The company expects to receive significant follow-on orders from each customer once initial testing has been completed. Announced sales agreements are outlined in Exhibit 5.
SunPeak Solar is contemplating the construction of a solar farm in California of up to 1 GW. The company indicated that, following comprehensive tests, CPV has been selected as the preferred technology for the project.
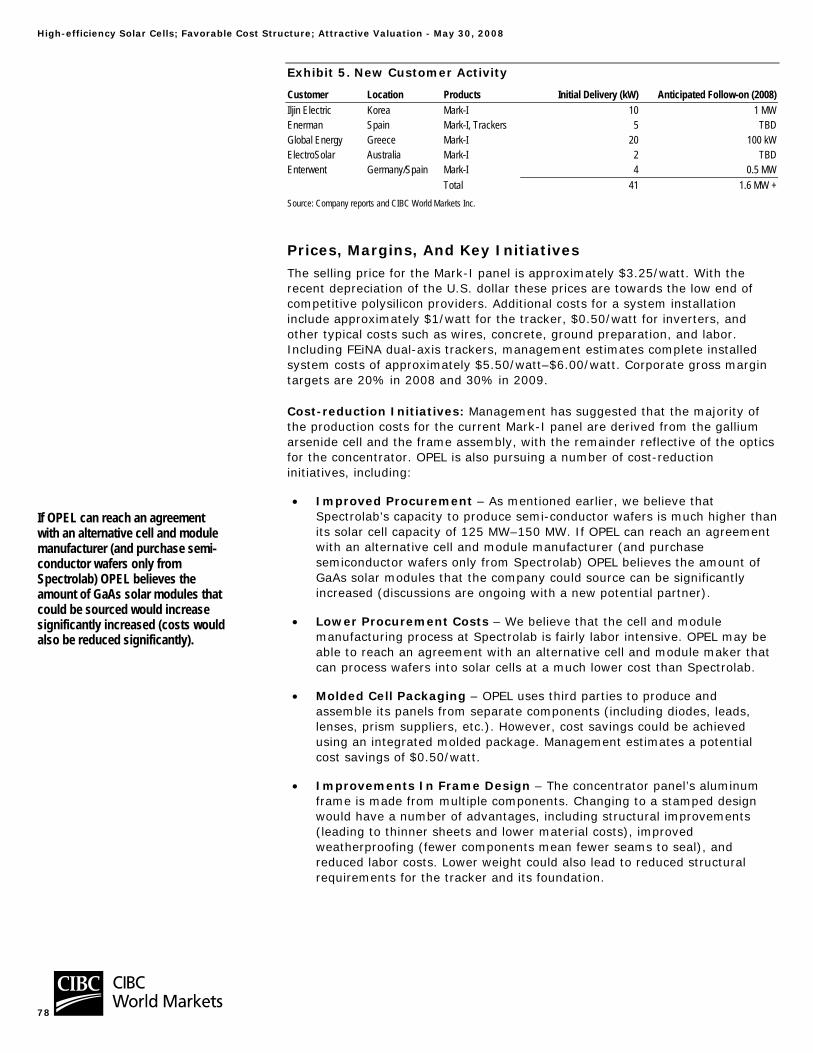
High-efficiency Solar Cells; Favorable Cost Structure; Attractive Valuation - May 30, 2008
78
Exhibit 5. New Customer Activity
Customer Location Products Initial Delivery (kW) Anticipated Follow-on (2008)Iljin Electric Korea Mark-I 10 1 MWEnerman Spain Mark-I, Trackers 5 TBDGlobal Energy Greece Mark-I 20 100 kWElectroSolar Australia Mark-I 2 TBDEnterwent Germany/Spain Mark-I 4 0.5 MW Total 41 1.6 MW +Source: Company reports and CIBC World Markets Inc.
Prices, Margins, And Key Initiatives The selling price for the Mark-I panel is approximately $3.25/watt. With the recent depreciation of the U.S. dollar these prices are towards the low end of competitive polysilicon providers. Additional costs for a system installation include approximately $1/watt for the tracker, $0.50/watt for inverters, and other typical costs such as wires, concrete, ground preparation, and labor. Including FEiNA dual-axis trackers, management estimates complete installed system costs of approximately $5.50/watt–$6.00/watt. Corporate gross margin targets are 20% in 2008 and 30% in 2009.
Cost-reduction Initiatives: Management has suggested that the majority of the production costs for the current Mark-I panel are derived from the gallium arsenide cell and the frame assembly, with the remainder reflective of the optics for the concentrator. OPEL is also pursuing a number of cost-reduction initiatives, including:
• Improved Procurement – As mentioned earlier, we believe that Spectrolab’s capacity to produce semi-conductor wafers is much higher than its solar cell capacity of 125 MW–150 MW. If OPEL can reach an agreement with an alternative cell and module manufacturer (and purchase semiconductor wafers only from Spectrolab) OPEL believes the amount of GaAs solar modules that the company could source can be significantly increased (discussions are ongoing with a new potential partner).
• Lower Procurement Costs – We believe that the cell and module manufacturing process at Spectrolab is fairly labor intensive. OPEL may be able to reach an agreement with an alternative cell and module maker that can process wafers into solar cells at a much lower cost than Spectrolab.
• Molded Cell Packaging – OPEL uses third parties to produce and assemble its panels from separate components (including diodes, leads, lenses, prism suppliers, etc.). However, cost savings could be achieved using an integrated molded package. Management estimates a potential cost savings of $0.50/watt.
• Improvements In Frame Design – The concentrator panel’s aluminum frame is made from multiple components. Changing to a stamped design would have a number of advantages, including structural improvements (leading to thinner sheets and lower material costs), improved weatherproofing (fewer components mean fewer seams to seal), and reduced labor costs. Lower weight could also lead to reduced structural requirements for the tracker and its foundation.
If OPEL can reach an agreement with an alternative cell and module manufacturer (and purchase semi-conductor wafers only from Spectrolab) OPEL believes the amount of GaAs solar modules that could be sourced would increase significantly increased (costs would also be reduced significantly).

High-efficiency Solar Cells; Favorable Cost Structure; Attractive Valuation - May 30, 2008
79
• Improvements In Module Design – OPEL’s Mark-I and Mark-III products were designed as drop-in replacements to flat-plate collectors and, as such, their dimensions were constrained. As OPEL’s CPV systems gain standalone acceptance, OPEL can optimize the size and shape of the products. Competitor Amonix is currently producing 5 kW “MegaModules,” which utilize comparable design characteristics as OPEL’s Mark-I product; however, where the Mark-I uses six cells, the MegaModule uses over 1,100. Amonix claims this design reduces costs by 75%.
Licensed GaAs Cells A consortium of partners (including the University of Ottawa, the University of Sherbrooke, the Canadian Photonics Fabrication Centre, and Cyrium Technologies) is developing a proprietary GaAs cell. Cell efficiencies are being targeted at the 39% level – similar to current products from Spectrolab. OPEL is contributing concentrator panels and related development to assist in the cell design. Through this relationship, OPEL has access to license production of the cell.
Prototypes are expected by the end of 2008 with the cells expected to be ready for production by the end of 2009. When the design is ready, OPEL plans to contract cell manufacturing to the Canadian Photonics Fabrication Centre. Since the cell is such a critical component of OPEL’s product, management expects to add the licensed cells as a secondary source for its Mark-I solar panels, keeping Spectrolab as the main source of GaAs cells. OPEL currently plans to produce approximately 25 MW–30 MW of output. Management has not expressed any plans to enter the satellite market with its GaAs cells.
Planar Optoelectronic Technology OPEL’s Planar Opto-Electronic Technology (POET) includes infrared sensing technology, optical/laser development, and the integration of electronic control circuits and lasers on a single chip. The “laser on chip” products serve as a low-cost alternative to transceiver optical components due to reduced production costs and reduced material costs.
At this time essentially all of the revenues from the POET program are derived from infrared sensors for military contracts. OPEL has been awarded several U.S. Department of Defense projects since 2001 totaling $5.23 million. While there is currently essentially no demand for the POET products from the telecommunications industry, management may allocate more development time to the POET project if demand materializes.
Understanding Concentrated Photovoltaics Concentrated photovoltaic devices primarily use lenses to focus sunlight onto a small solar cell. Some concentrator systems use mirrors instead of lenses, but mirrors are more typically used for low-concentration applications. In order to make maximum use of every wavelength in the concentrated light, CPV cells are typically multi-junction. The Spectrolab C1MJ cell, while generally referred to as a GaAs cell, is actually a triple-junction cell composed of GaAs, gallium indium phosphide, and a germanium substrate. Concentrator cells typically operate at greater than 30% conversion efficiencies, significantly higher than conventional flat-plate cells. Magnification ratios can range from 10x to 1,000x, although higher concentration levels (greater than 400x) are required to be commercially viable (Spectrolab). While overall output tends to increase at a higher magnification, efficiency tends to decrease due to series resistance. Due to the magnification, CPV cells must also have excellent thermal tolerance.
Magnification ratios can range from 10x to 1,000x, although higher concentration levels (greater than 400x) are required to be commercially viable (Spectrolab).
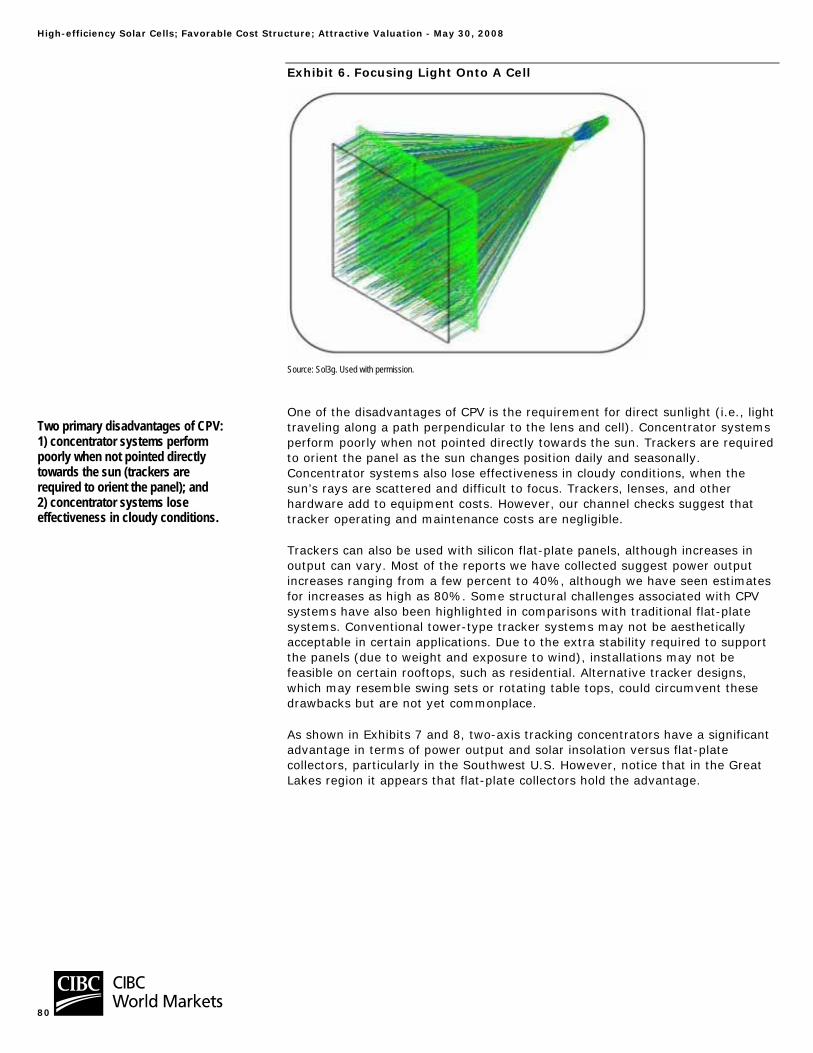
High-efficiency Solar Cells; Favorable Cost Structure; Attractive Valuation - May 30, 2008
80
Exhibit 6. Focusing Light Onto A Cell
Source: Sol3g. Used with permission.
One of the disadvantages of CPV is the requirement for direct sunlight (i.e., light traveling along a path perpendicular to the lens and cell). Concentrator systems perform poorly when not pointed directly towards the sun. Trackers are required to orient the panel as the sun changes position daily and seasonally. Concentrator systems also lose effectiveness in cloudy conditions, when the sun’s rays are scattered and difficult to focus. Trackers, lenses, and other hardware add to equipment costs. However, our channel checks suggest that tracker operating and maintenance costs are negligible.
Trackers can also be used with silicon flat-plate panels, although increases in output can vary. Most of the reports we have collected suggest power output increases ranging from a few percent to 40%, although we have seen estimates for increases as high as 80%. Some structural challenges associated with CPV systems have also been highlighted in comparisons with traditional flat-plate systems. Conventional tower-type tracker systems may not be aesthetically acceptable in certain applications. Due to the extra stability required to support the panels (due to weight and exposure to wind), installations may not be feasible on certain rooftops, such as residential. Alternative tracker designs, which may resemble swing sets or rotating table tops, could circumvent these drawbacks but are not yet commonplace.
As shown in Exhibits 7 and 8, two-axis tracking concentrators have a significant advantage in terms of power output and solar insolation versus flat-plate collectors, particularly in the Southwest U.S. However, notice that in the Great Lakes region it appears that flat-plate collectors hold the advantage.
Two primary disadvantages of CPV: 1) concentrator systems perform poorly when not pointed directly towards the sun (trackers are required to orient the panel); and 2) concentrator systems lose effectiveness in cloudy conditions.
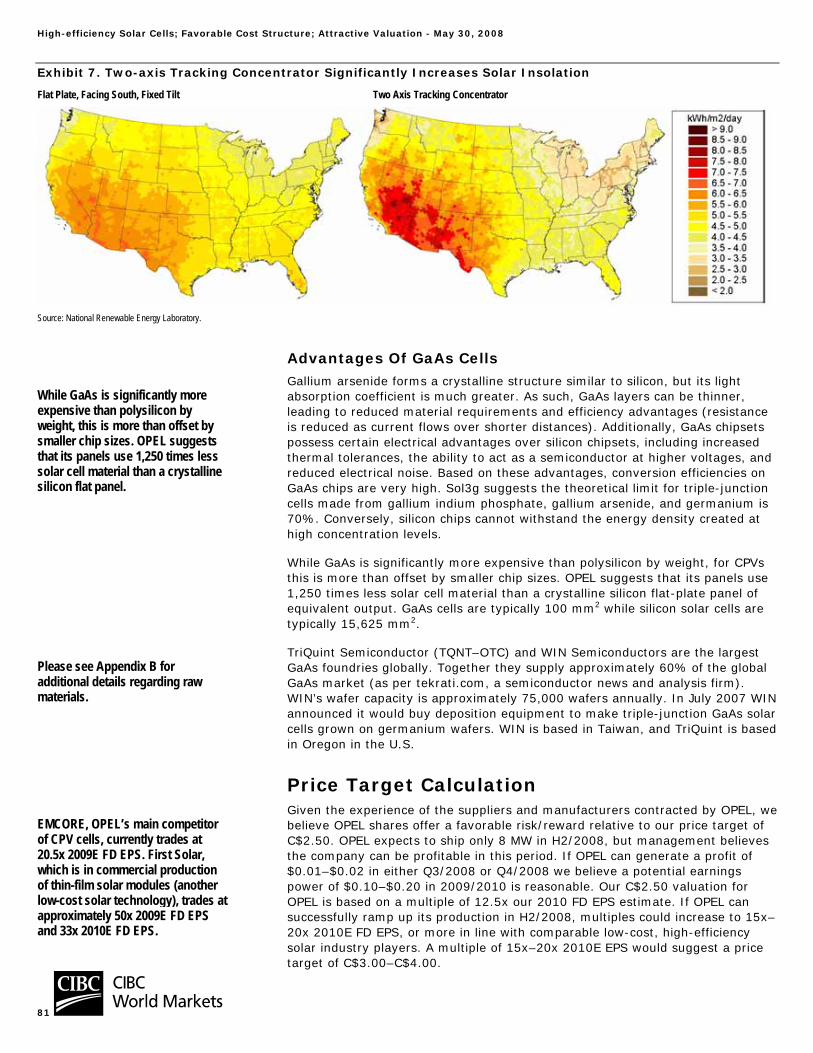
High-efficiency Solar Cells; Favorable Cost Structure; Attractive Valuation - May 30, 2008
81
Exhibit 7. Two-axis Tracking Concentrator Significantly Increases Solar Insolation
Flat Plate, Facing South, Fixed Tilt Two Axis Tracking Concentrator
Source: National Renewable Energy Laboratory.
Advantages Of GaAs Cells Gallium arsenide forms a crystalline structure similar to silicon, but its light absorption coefficient is much greater. As such, GaAs layers can be thinner, leading to reduced material requirements and efficiency advantages (resistance is reduced as current flows over shorter distances). Additionally, GaAs chipsets possess certain electrical advantages over silicon chipsets, including increased thermal tolerances, the ability to act as a semiconductor at higher voltages, and reduced electrical noise. Based on these advantages, conversion efficiencies on GaAs chips are very high. Sol3g suggests the theoretical limit for triple-junction cells made from gallium indium phosphate, gallium arsenide, and germanium is 70%. Conversely, silicon chips cannot withstand the energy density created at high concentration levels.
While GaAs is significantly more expensive than polysilicon by weight, for CPVs this is more than offset by smaller chip sizes. OPEL suggests that its panels use 1,250 times less solar cell material than a crystalline silicon flat-plate panel of equivalent output. GaAs cells are typically 100 mm2 while silicon solar cells are typically 15,625 mm2.
TriQuint Semiconductor (TQNT–OTC) and WIN Semiconductors are the largest GaAs foundries globally. Together they supply approximately 60% of the global GaAs market (as per tekrati.com, a semiconductor news and analysis firm). WIN’s wafer capacity is approximately 75,000 wafers annually. In July 2007 WIN announced it would buy deposition equipment to make triple-junction GaAs solar cells grown on germanium wafers. WIN is based in Taiwan, and TriQuint is based in Oregon in the U.S.
Price Target Calculation Given the experience of the suppliers and manufacturers contracted by OPEL, we believe OPEL shares offer a favorable risk/reward relative to our price target of C$2.50. OPEL expects to ship only 8 MW in H2/2008, but management believes the company can be profitable in this period. If OPEL can generate a profit of $0.01–$0.02 in either Q3/2008 or Q4/2008 we believe a potential earnings power of $0.10–$0.20 in 2009/2010 is reasonable. Our C$2.50 valuation for OPEL is based on a multiple of 12.5x our 2010 FD EPS estimate. If OPEL can successfully ramp up its production in H2/2008, multiples could increase to 15x–20x 2010E FD EPS, or more in line with comparable low-cost, high-efficiency solar industry players. A multiple of 15x–20x 2010E EPS would suggest a price target of C$3.00–C$4.00.
While GaAs is significantly more expensive than polysilicon by weight, this is more than offset by smaller chip sizes. OPEL suggests that its panels use 1,250 times less solar cell material than a crystalline silicon flat panel.
Please see Appendix B for additional details regarding raw materials.
EMCORE, OPEL’s main competitor of CPV cells, currently trades at 20.5x 2009E FD EPS. First Solar, which is in commercial production of thin-film solar modules (another low-cost solar technology), trades at approximately 50x 2009E FD EPS and 33x 2010E FD EPS.

High-efficiency Solar Cells; Favorable Cost Structure; Attractive Valuation - May 30, 2008
82
EMCORE, OPEL’s main competitor of CPV cells, currently trades at 20.5x 2009E FD EPS. First Solar (FSLR–NASDAQ), which is in commercial production of thin-film solar modules (another low-cost solar technology), trades at approximately 50x 2009E FD EPS and 33x 2010E FD EPS. Until H2/2008 results are released and additional positive customer feedback has been generated, we believe investors may prefer a more conservative valuation, or a risk-adjusted valuation for OPEL. If OPEL is unable to reach profitability in H2/2008 we believe downside risk in the shares would be limited to C$0.55, or the company’s current cash per share (basic).
The share prices of several solar-related equities have increased significantly over the past year, with some companies now trading at significant premiums relative to traditional industrial and manufacturing companies. Obviously, the valuation premiums reflect expectations for significantly higher growth rates in the solar industry over the next few years as several countries participate in generous subsidy programs. While we believe there will be great success stories in the solar industry over the next few years, will also expect some disappointments given the significant amount of new solar module supply coming online, as well as a significant number of new technologies. For further details see our accompanying industry report, Solar Industry Outlook, dated May 30.
Exhibit 8. DCF Analysis ($ mlns., unless otherwise specified)
2008E 2009E 2010E 2011E 2012E 2013E 2014EShipments (MW) 8.0 25.0 45.0 75.0 150.0 300.0 500.0 Prices (Per W) $3.25 $3.25 $2.93 $2.63 $2.37 $2.13 $1.50 Equipment Sales ($ mlns.) $26.0 $81.3 $131.6 $197.4 $355.4 $639.7 $750.0
EBITDA/MW ($0.33) $0.50 $0.57 $0.53 $0.47 $0.43 $0.23 EBITDA Margin (10.1%) 15.5% 19.4% 20.0% 20.0% 20.0% 15.0%
EBITDA ($ mlns.) ($2.6) $12.6 $25.5 $39.5 $71.1 $127.9 $112.5
– Interest ($0.6) ($0.5) ($0.7) ($0.7) ($1.5) ($3.1) ($5.5)– Taxes $0.0 $0.6 $8.5 $12.4 $21.7 $39.2 $35.3 – Capex $1.6 $2.0 $2.0 $3.0 $3.0 $3.0 $3.0 – Changes In Working Capital $14.8 $13.7 $10.5 $11.3 $22.5 $35.0 $10.0 Free Cash Flow ($18.4) ($3.2) $5.2 $13.5 $25.3 $53.8 $69.7 Free Cash Flow Conversion (Ex-WC) 1269.2% (134.5%) (20.7%) 5.8% 4.0% 14.7% 53.0%
Beginning Net Cash $27.0 $8.6 $5.4 $10.6 $24.1 $49.5 $103.2 Ending Net Cash $8.6 $5.4 $10.6 $24.1 $49.5 $103.2 $172.9
Shares Outstanding 84.5 85.0 85.0 85.0 85.0 85.0 85.0 Market Cap. ($ mlns.) $95 $96 $96 $96 $96 $96 $96 EV ($ mlns, Average Net Cash) $78 $89 $88 $79 $59 $20 ($42)Free Cash Flow Yield (19.3%) (3.3%) 5.4% 14.1% 26.4% 56.1% 72.7%
Net Income ($2.2) $12.4 $17.5 $27.6 $50.6 $91.6 $82.5 FD EPS ($0.03) $0.10 $0.20 $0.32 $0.60 $1.08 $0.97 P/E – Net Cash NM 11.0x 5.0x 2.6x 0.9x (0.1x) (0.9x)
EV/EBITDA (29.6x) 7.1x 3.4x 2.0x 0.8x 0.2x (0.4x)OPEL Share Value At 8.0x EBITDA ($0.15) $1.25 $2.53 $4.00 $7.27 $13.26 $12.63 OPEL Share Value At 6.0x EBITDA ($0.08) $0.95 $1.93 $3.07 $5.60 $10.25 $9.98 OPEL Share Value At 4.0x EBITDA ($0.02) $0.66 $1.33 $2.14 $3.93 $7.24 $7.33
Current Share Price $1.13 Discounted Cash Flow (10.0%) $6.39 Terminal Value: $995 Discounted Cash Flow (8.0%) $7.38 (Discount Rate = 9%, Growth Rate = 3%)Source: Company reports and CIBC World Markets Inc.
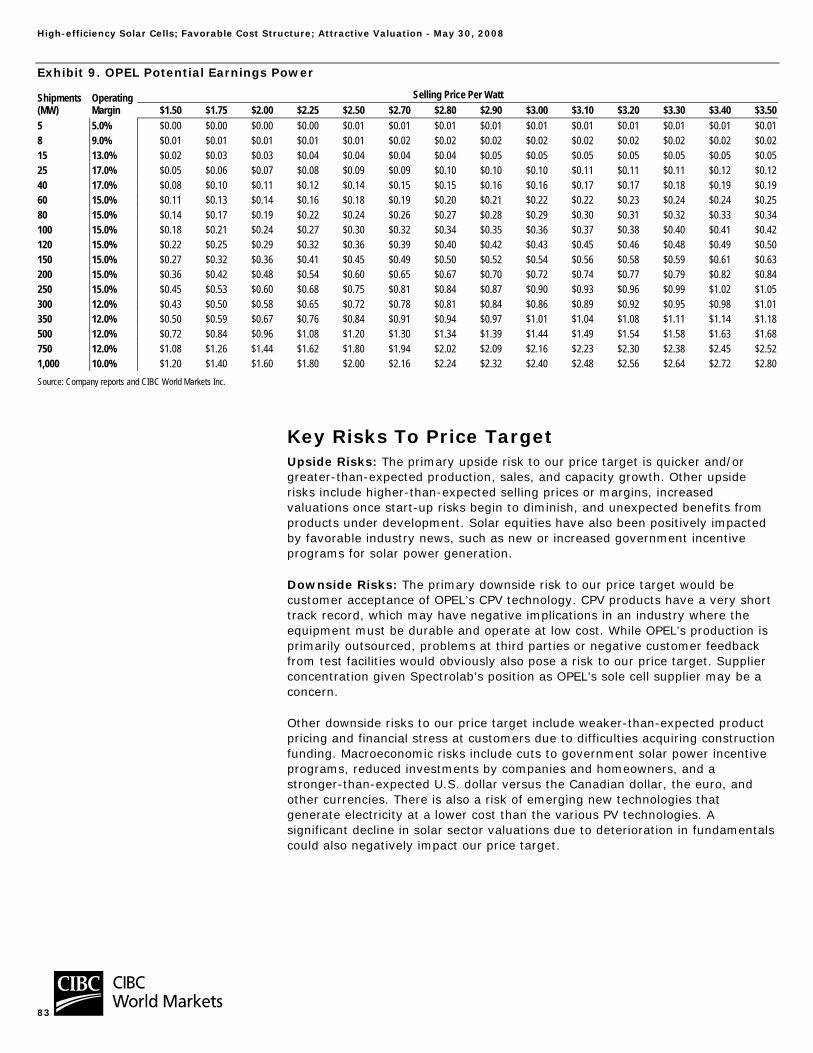
High-efficiency Solar Cells; Favorable Cost Structure; Attractive Valuation - May 30, 2008
83
Exhibit 9. OPEL Potential Earnings Power
Selling Price Per Watt Shipments (MW)
Operating Margin $1.50 $1.75 $2.00 $2.25 $2.50 $2.70 $2.80 $2.90 $3.00 $3.10 $3.20 $3.30 $3.40 $3.50
5 5.0% $0.00 $0.00 $0.00 $0.00 $0.01 $0.01 $0.01 $0.01 $0.01 $0.01 $0.01 $0.01 $0.01 $0.018 9.0% $0.01 $0.01 $0.01 $0.01 $0.01 $0.02 $0.02 $0.02 $0.02 $0.02 $0.02 $0.02 $0.02 $0.0215 13.0% $0.02 $0.03 $0.03 $0.04 $0.04 $0.04 $0.04 $0.05 $0.05 $0.05 $0.05 $0.05 $0.05 $0.0525 17.0% $0.05 $0.06 $0.07 $0.08 $0.09 $0.09 $0.10 $0.10 $0.10 $0.11 $0.11 $0.11 $0.12 $0.1240 17.0% $0.08 $0.10 $0.11 $0.12 $0.14 $0.15 $0.15 $0.16 $0.16 $0.17 $0.17 $0.18 $0.19 $0.1960 15.0% $0.11 $0.13 $0.14 $0.16 $0.18 $0.19 $0.20 $0.21 $0.22 $0.22 $0.23 $0.24 $0.24 $0.2580 15.0% $0.14 $0.17 $0.19 $0.22 $0.24 $0.26 $0.27 $0.28 $0.29 $0.30 $0.31 $0.32 $0.33 $0.34100 15.0% $0.18 $0.21 $0.24 $0.27 $0.30 $0.32 $0.34 $0.35 $0.36 $0.37 $0.38 $0.40 $0.41 $0.42120 15.0% $0.22 $0.25 $0.29 $0.32 $0.36 $0.39 $0.40 $0.42 $0.43 $0.45 $0.46 $0.48 $0.49 $0.50150 15.0% $0.27 $0.32 $0.36 $0.41 $0.45 $0.49 $0.50 $0.52 $0.54 $0.56 $0.58 $0.59 $0.61 $0.63200 15.0% $0.36 $0.42 $0.48 $0.54 $0.60 $0.65 $0.67 $0.70 $0.72 $0.74 $0.77 $0.79 $0.82 $0.84250 15.0% $0.45 $0.53 $0.60 $0.68 $0.75 $0.81 $0.84 $0.87 $0.90 $0.93 $0.96 $0.99 $1.02 $1.05300 12.0% $0.43 $0.50 $0.58 $0.65 $0.72 $0.78 $0.81 $0.84 $0.86 $0.89 $0.92 $0.95 $0.98 $1.01350 12.0% $0.50 $0.59 $0.67 $0.76 $0.84 $0.91 $0.94 $0.97 $1.01 $1.04 $1.08 $1.11 $1.14 $1.18500 12.0% $0.72 $0.84 $0.96 $1.08 $1.20 $1.30 $1.34 $1.39 $1.44 $1.49 $1.54 $1.58 $1.63 $1.68750 12.0% $1.08 $1.26 $1.44 $1.62 $1.80 $1.94 $2.02 $2.09 $2.16 $2.23 $2.30 $2.38 $2.45 $2.521,000 10.0% $1.20 $1.40 $1.60 $1.80 $2.00 $2.16 $2.24 $2.32 $2.40 $2.48 $2.56 $2.64 $2.72 $2.80Source: Company reports and CIBC World Markets Inc.
Key Risks To Price Target Upside Risks: The primary upside risk to our price target is quicker and/or greater-than-expected production, sales, and capacity growth. Other upside risks include higher-than-expected selling prices or margins, increased valuations once start-up risks begin to diminish, and unexpected benefits from products under development. Solar equities have also been positively impacted by favorable industry news, such as new or increased government incentive programs for solar power generation.
Downside Risks: The primary downside risk to our price target would be customer acceptance of OPEL’s CPV technology. CPV products have a very short track record, which may have negative implications in an industry where the equipment must be durable and operate at low cost. While OPEL’s production is primarily outsourced, problems at third parties or negative customer feedback from test facilities would obviously also pose a risk to our price target. Supplier concentration given Spectrolab’s position as OPEL’s sole cell supplier may be a concern.
Other downside risks to our price target include weaker-than-expected product pricing and financial stress at customers due to difficulties acquiring construction funding. Macroeconomic risks include cuts to government solar power incentive programs, reduced investments by companies and homeowners, and a stronger-than-expected U.S. dollar versus the Canadian dollar, the euro, and other currencies. There is also a risk of emerging new technologies that generate electricity at a lower cost than the various PV technologies. A significant decline in solar sector valuations due to deterioration in fundamentals could also negatively impact our price target.
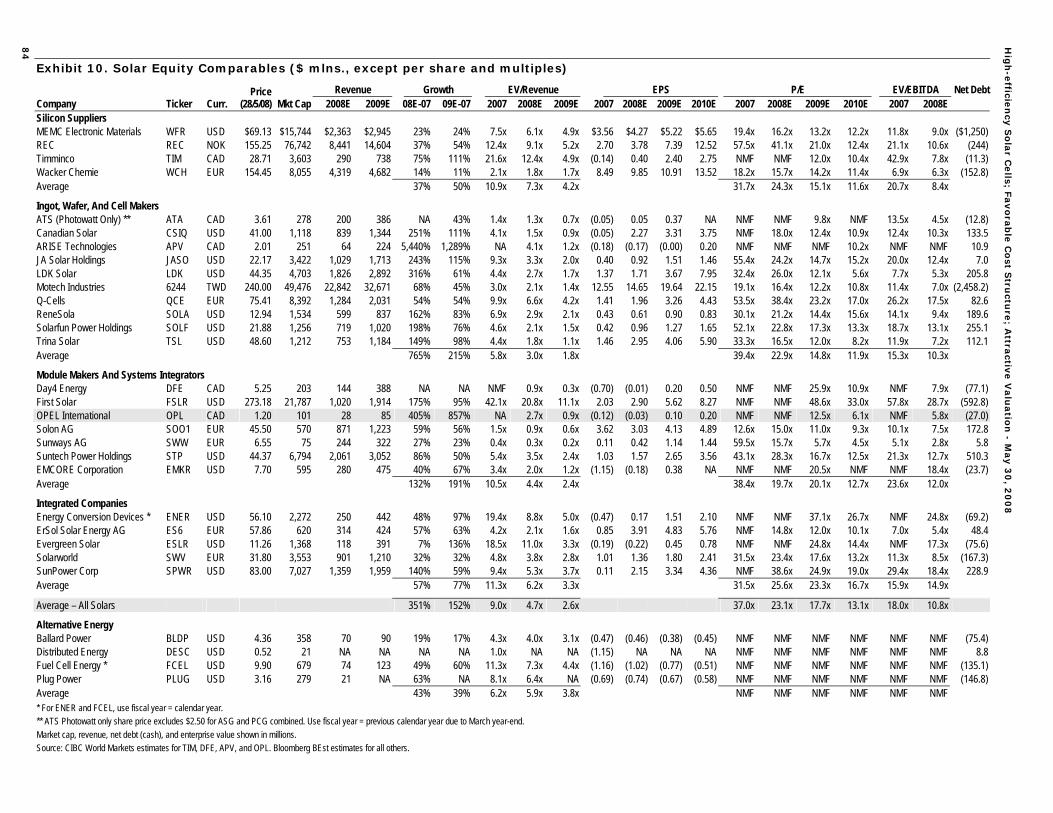
Hig
h-e
fficien
cy S
ola
r Cells; F
avo
rab
le C
ost S
tructu
re; A
ttractiv
e V
alu
atio
n -
May 3
0, 2
00
8
84
Exhibit 10. Solar Equity Comparables ($ mlns., except per share and multiples)
Revenue Growth EV/Revenue EPS P/E EV/EBITDA Net Debt Company Ticker Curr.
Price (28/5/08) Mkt Cap 2008E 2009E 08E-07 09E-07 2007 2008E 2009E 2007 2008E 2009E 2010E 2007 2008E 2009E 2010E 2007 2008E
Silicon Suppliers MEMC Electronic Materials WFR USD $69.13 $15,744 $2,363 $2,945 23% 24% 7.5x 6.1x 4.9x $3.56 $4.27 $5.22 $5.65 19.4x 16.2x 13.2x 12.2x 11.8x 9.0x ($1,250) REC REC NOK 155.25 76,742 8,441 14,604 37% 54% 12.4x 9.1x 5.2x 2.70 3.78 7.39 12.52 57.5x 41.1x 21.0x 12.4x 21.1x 10.6x (244) Timminco TIM CAD 28.71 3,603 290 738 75% 111% 21.6x 12.4x 4.9x (0.14) 0.40 2.40 2.75 NMF NMF 12.0x 10.4x 42.9x 7.8x (11.3) Wacker Chemie WCH EUR 154.45 8,055 4,319 4,682 14% 11% 2.1x 1.8x 1.7x 8.49 9.85 10.91 13.52 18.2x 15.7x 14.2x 11.4x 6.9x 6.3x (152.8) Average 37% 50% 10.9x 7.3x 4.2x 31.7x 24.3x 15.1x 11.6x 20.7x 8.4x
Ingot, Wafer, And Cell Makers ATS (Photowatt Only) ** ATA CAD 3.61 278 200 386 NA 43% 1.4x 1.3x 0.7x (0.05) 0.05 0.37 NA NMF NMF 9.8x NMF 13.5x 4.5x (12.8) Canadian Solar CSIQ USD 41.00 1,118 839 1,344 251% 111% 4.1x 1.5x 0.9x (0.05) 2.27 3.31 3.75 NMF 18.0x 12.4x 10.9x 12.4x 10.3x 133.5 ARISE Technologies APV CAD 2.01 251 64 224 5,440% 1,289% NA 4.1x 1.2x (0.18) (0.17) (0.00) 0.20 NMF NMF NMF 10.2x NMF NMF 10.9 JA Solar Holdings JASO USD 22.17 3,422 1,029 1,713 243% 115% 9.3x 3.3x 2.0x 0.40 0.92 1.51 1.46 55.4x 24.2x 14.7x 15.2x 20.0x 12.4x 7.0 LDK Solar LDK USD 44.35 4,703 1,826 2,892 316% 61% 4.4x 2.7x 1.7x 1.37 1.71 3.67 7.95 32.4x 26.0x 12.1x 5.6x 7.7x 5.3x 205.8 Motech Industries 6244 TWD 240.00 49,476 22,842 32,671 68% 45% 3.0x 2.1x 1.4x 12.55 14.65 19.64 22.15 19.1x 16.4x 12.2x 10.8x 11.4x 7.0x (2,458.2) Q-Cells QCE EUR 75.41 8,392 1,284 2,031 54% 54% 9.9x 6.6x 4.2x 1.41 1.96 3.26 4.43 53.5x 38.4x 23.2x 17.0x 26.2x 17.5x 82.6 ReneSola SOLA USD 12.94 1,534 599 837 162% 83% 6.9x 2.9x 2.1x 0.43 0.61 0.90 0.83 30.1x 21.2x 14.4x 15.6x 14.1x 9.4x 189.6 Solarfun Power Holdings SOLF USD 21.88 1,256 719 1,020 198% 76% 4.6x 2.1x 1.5x 0.42 0.96 1.27 1.65 52.1x 22.8x 17.3x 13.3x 18.7x 13.1x 255.1 Trina Solar TSL USD 48.60 1,212 753 1,184 149% 98% 4.4x 1.8x 1.1x 1.46 2.95 4.06 5.90 33.3x 16.5x 12.0x 8.2x 11.9x 7.2x 112.1 Average 765% 215% 5.8x 3.0x 1.8x 39.4x 22.9x 14.8x 11.9x 15.3x 10.3x
Module Makers And Systems Integrators Day4 Energy DFE CAD 5.25 203 144 388 NA NA NMF 0.9x 0.3x (0.70) (0.01) 0.20 0.50 NMF NMF 25.9x 10.9x NMF 7.9x (77.1) First Solar FSLR USD 273.18 21,787 1,020 1,914 175% 95% 42.1x 20.8x 11.1x 2.03 2.90 5.62 8.27 NMF NMF 48.6x 33.0x 57.8x 28.7x (592.8) OPEL International OPL CAD 1.20 101 28 85 405% 857% NA 2.7x 0.9x (0.12) (0.03) 0.10 0.20 NMF NMF 12.5x 6.1x NMF 5.8x (27.0) Solon AG SOO1 EUR 45.50 570 871 1,223 59% 56% 1.5x 0.9x 0.6x 3.62 3.03 4.13 4.89 12.6x 15.0x 11.0x 9.3x 10.1x 7.5x 172.8 Sunways AG SWW EUR 6.55 75 244 322 27% 23% 0.4x 0.3x 0.2x 0.11 0.42 1.14 1.44 59.5x 15.7x 5.7x 4.5x 5.1x 2.8x 5.8 Suntech Power Holdings STP USD 44.37 6,794 2,061 3,052 86% 50% 5.4x 3.5x 2.4x 1.03 1.57 2.65 3.56 43.1x 28.3x 16.7x 12.5x 21.3x 12.7x 510.3 EMCORE Corporation EMKR USD 7.70 595 280 475 40% 67% 3.4x 2.0x 1.2x (1.15) (0.18) 0.38 NA NMF NMF 20.5x NMF NMF 18.4x (23.7) Average 132% 191% 10.5x 4.4x 2.4x 38.4x 19.7x 20.1x 12.7x 23.6x 12.0x
Integrated Companies Energy Conversion Devices * ENER USD 56.10 2,272 250 442 48% 97% 19.4x 8.8x 5.0x (0.47) 0.17 1.51 2.10 NMF NMF 37.1x 26.7x NMF 24.8x (69.2) ErSol Solar Energy AG ES6 EUR 57.86 620 314 424 57% 63% 4.2x 2.1x 1.6x 0.85 3.91 4.83 5.76 NMF 14.8x 12.0x 10.1x 7.0x 5.4x 48.4 Evergreen Solar ESLR USD 11.26 1,368 118 391 7% 136% 18.5x 11.0x 3.3x (0.19) (0.22) 0.45 0.78 NMF NMF 24.8x 14.4x NMF 17.3x (75.6) Solarworld SWV EUR 31.80 3,553 901 1,210 32% 32% 4.8x 3.8x 2.8x 1.01 1.36 1.80 2.41 31.5x 23.4x 17.6x 13.2x 11.3x 8.5x (167.3) SunPower Corp SPWR USD 83.00 7,027 1,359 1,959 140% 59% 9.4x 5.3x 3.7x 0.11 2.15 3.34 4.36 NMF 38.6x 24.9x 19.0x 29.4x 18.4x 228.9 Average 57% 77% 11.3x 6.2x 3.3x 31.5x 25.6x 23.3x 16.7x 15.9x 14.9x
Average – All Solars 351% 152% 9.0x 4.7x 2.6x 37.0x 23.1x 17.7x 13.1x 18.0x 10.8x
Alternative Energy Ballard Power BLDP USD 4.36 358 70 90 19% 17% 4.3x 4.0x 3.1x (0.47) (0.46) (0.38) (0.45) NMF NMF NMF NMF NMF NMF (75.4) Distributed Energy DESC USD 0.52 21 NA NA NA NA 1.0x NA NA (1.15) NA NA NA NMF NMF NMF NMF NMF NMF 8.8 Fuel Cell Energy * FCEL USD 9.90 679 74 123 49% 60% 11.3x 7.3x 4.4x (1.16) (1.02) (0.77) (0.51) NMF NMF NMF NMF NMF NMF (135.1) Plug Power PLUG USD 3.16 279 21 NA 63% NA 8.1x 6.4x NA (0.69) (0.74) (0.67) (0.58) NMF NMF NMF NMF NMF NMF (146.8) Average 43% 39% 6.2x 5.9x 3.8x NMF NMF NMF NMF NMF NMF * For ENER and FCEL, use fiscal year = calendar year. ** ATS Photowatt only share price excludes $2.50 for ASG and PCG combined. Use fiscal year = previous calendar year due to March year-end. Market cap, revenue, net debt (cash), and enterprise value shown in millions. Source: CIBC World Markets estimates for TIM, DFE, APV, and OPL. Bloomberg BEst estimates for all others.
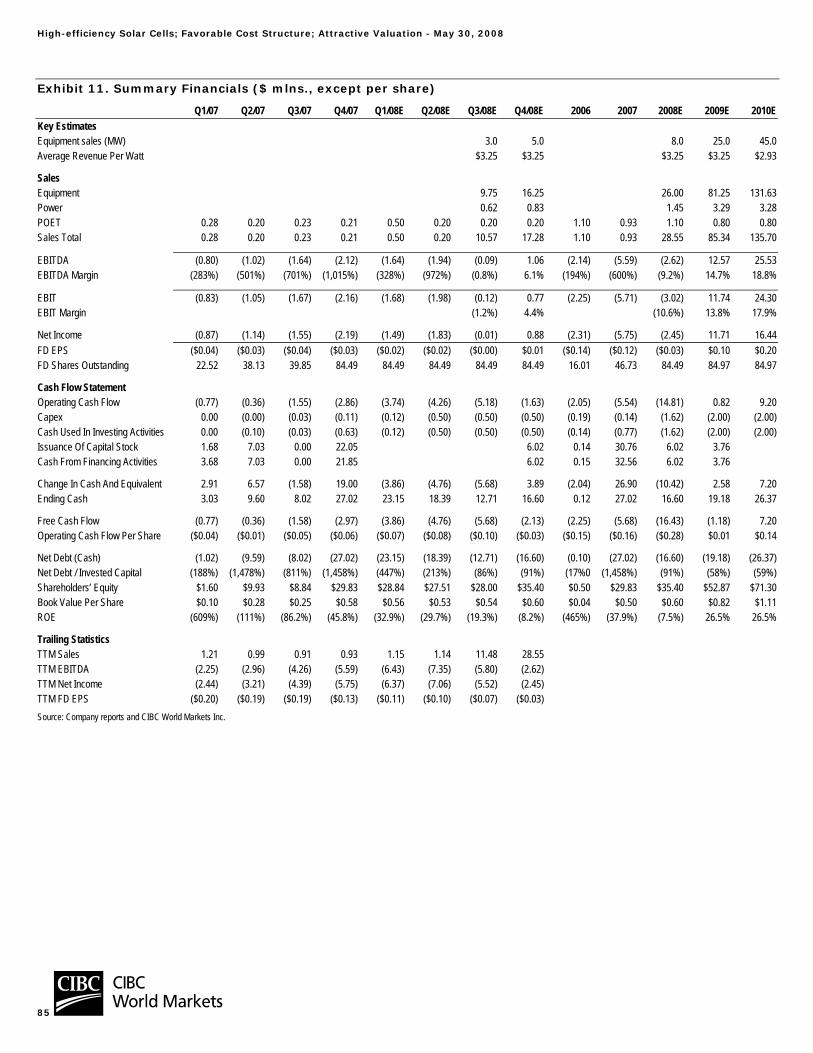
High-efficiency Solar Cells; Favorable Cost Structure; Attractive Valuation - May 30, 2008
85
Exhibit 11. Summary Financials ($ mlns., except per share)
Q1/07 Q2/07 Q3/07 Q4/07 Q1/08E Q2/08E Q3/08E Q4/08E 2006 2007 2008E 2009E 2010EKey Estimates Equipment sales (MW) 3.0 5.0 8.0 25.0 45.0Average Revenue Per Watt $3.25 $3.25 $3.25 $3.25 $2.93
Sales Equipment 9.75 16.25 26.00 81.25 131.63Power 0.62 0.83 1.45 3.29 3.28POET 0.28 0.20 0.23 0.21 0.50 0.20 0.20 0.20 1.10 0.93 1.10 0.80 0.80Sales Total 0.28 0.20 0.23 0.21 0.50 0.20 10.57 17.28 1.10 0.93 28.55 85.34 135.70
EBITDA (0.80) (1.02) (1.64) (2.12) (1.64) (1.94) (0.09) 1.06 (2.14) (5.59) (2.62) 12.57 25.53EBITDA Margin (283%) (501%) (701%) (1,015%) (328%) (972%) (0.8%) 6.1% (194%) (600%) (9.2%) 14.7% 18.8%
EBIT (0.83) (1.05) (1.67) (2.16) (1.68) (1.98) (0.12) 0.77 (2.25) (5.71) (3.02) 11.74 24.30EBIT Margin (1.2%) 4.4% (10.6%) 13.8% 17.9%
Net Income (0.87) (1.14) (1.55) (2.19) (1.49) (1.83) (0.01) 0.88 (2.31) (5.75) (2.45) 11.71 16.44FD EPS ($0.04) ($0.03) ($0.04) ($0.03) ($0.02) ($0.02) ($0.00) $0.01 ($0.14) ($0.12) ($0.03) $0.10 $0.20FD Shares Outstanding 22.52 38.13 39.85 84.49 84.49 84.49 84.49 84.49 16.01 46.73 84.49 84.97 84.97
Cash Flow Statement Operating Cash Flow (0.77) (0.36) (1.55) (2.86) (3.74) (4.26) (5.18) (1.63) (2.05) (5.54) (14.81) 0.82 9.20Capex 0.00 (0.00) (0.03) (0.11) (0.12) (0.50) (0.50) (0.50) (0.19) (0.14) (1.62) (2.00) (2.00)Cash Used In Investing Activities 0.00 (0.10) (0.03) (0.63) (0.12) (0.50) (0.50) (0.50) (0.14) (0.77) (1.62) (2.00) (2.00)Issuance Of Capital Stock 1.68 7.03 0.00 22.05 6.02 0.14 30.76 6.02 3.76Cash From Financing Activities 3.68 7.03 0.00 21.85 6.02 0.15 32.56 6.02 3.76
Change In Cash And Equivalent 2.91 6.57 (1.58) 19.00 (3.86) (4.76) (5.68) 3.89 (2.04) 26.90 (10.42) 2.58 7.20Ending Cash 3.03 9.60 8.02 27.02 23.15 18.39 12.71 16.60 0.12 27.02 16.60 19.18 26.37
Free Cash Flow (0.77) (0.36) (1.58) (2.97) (3.86) (4.76) (5.68) (2.13) (2.25) (5.68) (16.43) (1.18) 7.20Operating Cash Flow Per Share ($0.04) ($0.01) ($0.05) ($0.06) ($0.07) ($0.08) ($0.10) ($0.03) ($0.15) ($0.16) ($0.28) $0.01 $0.14
Net Debt (Cash) (1.02) (9.59) (8.02) (27.02) (23.15) (18.39) (12.71) (16.60) (0.10) (27.02) (16.60) (19.18) (26.37)Net Debt / Invested Capital (188%) (1,478%) (811%) (1,458%) (447%) (213%) (86%) (91%) (17%0 (1,458%) (91%) (58%) (59%)Shareholders’ Equity $1.60 $9.93 $8.84 $29.83 $28.84 $27.51 $28.00 $35.40 $0.50 $29.83 $35.40 $52.87 $71.30Book Value Per Share $0.10 $0.28 $0.25 $0.58 $0.56 $0.53 $0.54 $0.60 $0.04 $0.50 $0.60 $0.82 $1.11ROE (609%) (111%) (86.2%) (45.8%) (32.9%) (29.7%) (19.3%) (8.2%) (465%) (37.9%) (7.5%) 26.5% 26.5%
Trailing Statistics TTM Sales 1.21 0.99 0.91 0.93 1.15 1.14 11.48 28.55 TTM EBITDA (2.25) (2.96) (4.26) (5.59) (6.43) (7.35) (5.80) (2.62) TTM Net Income (2.44) (3.21) (4.39) (5.75) (6.37) (7.06) (5.52) (2.45) TTM FD EPS ($0.20) ($0.19) ($0.19) ($0.13) ($0.11) ($0.10) ($0.07) ($0.03) Source: Company reports and CIBC World Markets Inc.

High-efficiency Solar Cells; Favorable Cost Structure; Attractive Valuation - May 30, 2008
86
Appendix A. Major CPV Competitors In our view, OPEL’s primary CPV competitors are EMCORE (USA) and, to a limited extent, Sol3g (Spain). Both companies have already launched commercial sales of CPV systems, although Sol3g remains a small player. Sharp Electronics Corp. is on the third generation of its CPV products. The third-generation product utilizes III-V triple-junction cells at 700x concentration, and is in testing in Spain and Italy. Other CPV competitors include SolFocus (USA), Amonix (USA), and Concentrix Solar (Germany). Solar Systems (Australia) is launching reflective dish-based concentrator systems and recently signed an agreement to purchase 150 MW of cells from Spectrolab over five years. Indirect competitors in the solar industry include traditional flat-plate PV makers, thermal solar, and other alternative energy technologies (see our solar industry outlook, as highlighted earlier in this report).
EMCORE Corp. EMCORE’s Solar Power division provides products for satellite and terrestrial applications. Terrestrial products include complete utility-scale CPV systems, as well as subcomponents such as GaAs cells. EMCORE claims to be the only global vertically integrated CPV manufacturer. The GaAs cells are triple junction, using the same layer format as Spectrolab’s cells (gallium indium phosphate, gallium arsenide, and germanium). EMCORE’s cell efficiencies are currently at a minimum average of 36%, suggesting a similar-rated minimum average versus Spectrolab’s cells, although as previously mentioned OPEL has recently been receiving average 39% efficiencies from Spectrolab. EMCORE expects to launch an “inverted metamorphic” type cell later in 2008 with an average efficiency of 43%. A second-generation inverted metamorphic cell is expected to launch in 2010 with an average efficiency of 45%. EMCORE’s CPV cells are optimized for operation with 500x to 1,000x concentration.
EMCORE’s PV division was formed in 1998 and initially served the satellite market. The company’s first terrestrial receiver assembly line began production in March 2008. The company currently operates two receiver assembly lines in Albuquerque, New Mexico. CPV-related revenue in Q1/2008 was $4.4 million, although revenue is expected to increase (over $15 million in Q2/2008 and approximately $30 million in Q3/2008), as it is anticipated that the third assembly line will begin shipments in June 2008. A fourth line is under construction in China, and is expected to begin production by August 2008. Total receiver capacity is targeted at over 300 MW/year.
Current system selling prices are $3.60/watt–$4.00/watt, and EMCORE is targeting price reductions to less than $2/watt in three years. In May 2008 EMCORE announced a $28 million agreement to supply 70 MW of cell receivers to ES System (South Korea). Production began immediately, with deliveries spanning 24 months. Following this order, we estimate EMCORE’s terrestrial component backlog is approximately $125 million.
For satellite applications, EMCORE offers fully integrated solar panels as well as subcomponents such as GaAs cells and covered interconnect cells. EMCORE lists Boeing as a major customer. EMCORE also provides compound semiconductor-based components and subsystems for the broadband and fiber optic markets. Management at EMCORE is considering separating the fiber optics and photovoltaics businesses into separate corporations, although no further details are available.
CPV-related revenue is expected to total approximately $30 million in Q3/2008.
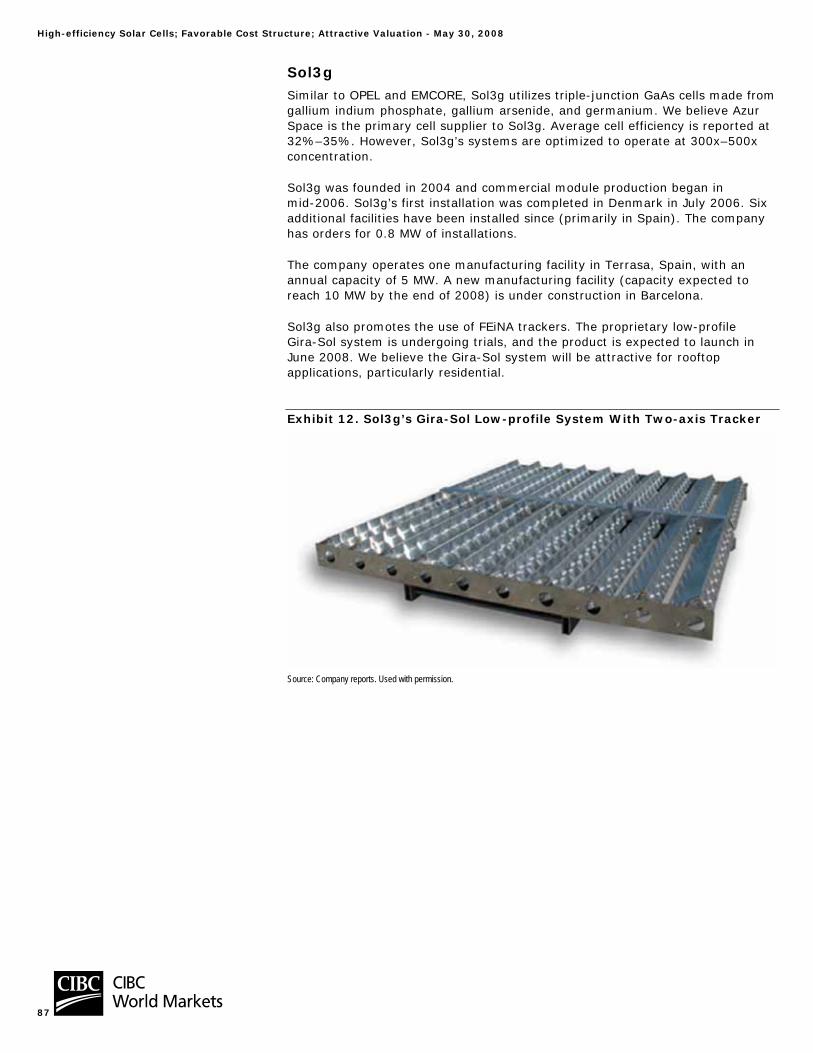
High-efficiency Solar Cells; Favorable Cost Structure; Attractive Valuation - May 30, 2008
87
Sol3g Similar to OPEL and EMCORE, Sol3g utilizes triple-junction GaAs cells made from gallium indium phosphate, gallium arsenide, and germanium. We believe Azur Space is the primary cell supplier to Sol3g. Average cell efficiency is reported at 32%–35%. However, Sol3g’s systems are optimized to operate at 300x–500x concentration.
Sol3g was founded in 2004 and commercial module production began in mid-2006. Sol3g’s first installation was completed in Denmark in July 2006. Six additional facilities have been installed since (primarily in Spain). The company has orders for 0.8 MW of installations.
The company operates one manufacturing facility in Terrasa, Spain, with an annual capacity of 5 MW. A new manufacturing facility (capacity expected to reach 10 MW by the end of 2008) is under construction in Barcelona.
Sol3g also promotes the use of FEiNA trackers. The proprietary low-profile Gira-Sol system is undergoing trials, and the product is expected to launch in June 2008. We believe the Gira-Sol system will be attractive for rooftop applications, particularly residential.
Exhibit 12. Sol3g’s Gira-Sol Low-profile System With Two-axis Tracker
Source: Company reports. Used with permission.
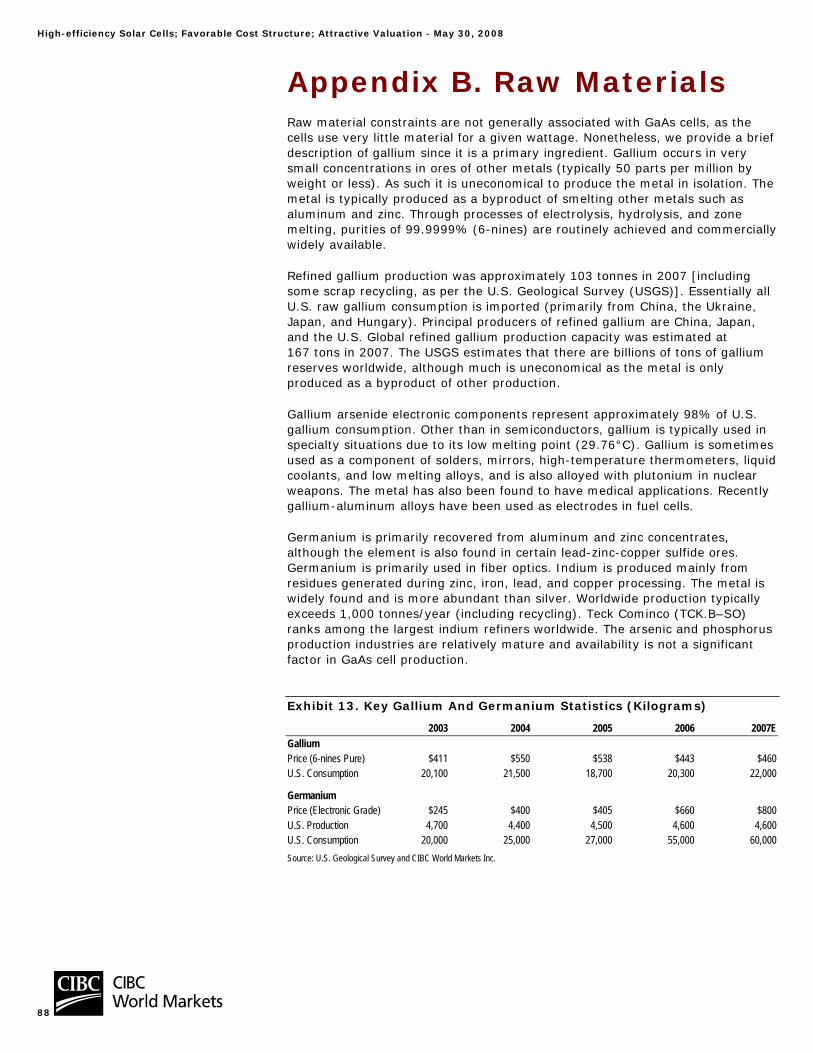
High-efficiency Solar Cells; Favorable Cost Structure; Attractive Valuation - May 30, 2008
88
Appendix B. Raw Materials Raw material constraints are not generally associated with GaAs cells, as the cells use very little material for a given wattage. Nonetheless, we provide a brief description of gallium since it is a primary ingredient. Gallium occurs in very small concentrations in ores of other metals (typically 50 parts per million by weight or less). As such it is uneconomical to produce the metal in isolation. The metal is typically produced as a byproduct of smelting other metals such as aluminum and zinc. Through processes of electrolysis, hydrolysis, and zone melting, purities of 99.9999% (6-nines) are routinely achieved and commercially widely available.
Refined gallium production was approximately 103 tonnes in 2007 [including some scrap recycling, as per the U.S. Geological Survey (USGS)]. Essentially all U.S. raw gallium consumption is imported (primarily from China, the Ukraine, Japan, and Hungary). Principal producers of refined gallium are China, Japan, and the U.S. Global refined gallium production capacity was estimated at 167 tons in 2007. The USGS estimates that there are billions of tons of gallium reserves worldwide, although much is uneconomical as the metal is only produced as a byproduct of other production.
Gallium arsenide electronic components represent approximately 98% of U.S. gallium consumption. Other than in semiconductors, gallium is typically used in specialty situations due to its low melting point (29.76°C). Gallium is sometimes used as a component of solders, mirrors, high-temperature thermometers, liquid coolants, and low melting alloys, and is also alloyed with plutonium in nuclear weapons. The metal has also been found to have medical applications. Recently gallium-aluminum alloys have been used as electrodes in fuel cells.
Germanium is primarily recovered from aluminum and zinc concentrates, although the element is also found in certain lead-zinc-copper sulfide ores. Germanium is primarily used in fiber optics. Indium is produced mainly from residues generated during zinc, iron, lead, and copper processing. The metal is widely found and is more abundant than silver. Worldwide production typically exceeds 1,000 tonnes/year (including recycling). Teck Cominco (TCK.B–SO) ranks among the largest indium refiners worldwide. The arsenic and phosphorus production industries are relatively mature and availability is not a significant factor in GaAs cell production.
Exhibit 13. Key Gallium And Germanium Statistics (Kilograms)
2003 2004 2005 2006 2007EGallium Price (6-nines Pure) $411 $550 $538 $443 $460U.S. Consumption 20,100 21,500 18,700 20,300 22,000
Germanium Price (Electronic Grade) $245 $400 $405 $660 $800U.S. Production 4,700 4,400 4,500 4,600 4,600U.S. Consumption 20,000 25,000 27,000 55,000 60,000Source: U.S. Geological Survey and CIBC World Markets Inc.

High-efficiency Solar Cells; Favorable Cost Structure; Attractive Valuation - May 30, 2008
89
Appendix C. Management & Board Of Directors Please see below for bios on OPEL’s current officers and directors. A few of OPEL’s officers were previously at TranSwitch Corporation (TXCC–OTC), which was formed in the mid-1990s and successfully grew into a multinational semiconductor manufacturer. TranSwitch specializes in manufacturing semiconductors used in the convergence of voice, data, and video network for OEMs. TranSwitch’s products and services are widely applied in the networks of carriers and manufacturers. Management also has experience designing and manufacturing customized silicon-based products, and provides services such as synthesis, time closure, and package layout. OPEL has also partnered with major semiconductor manufacturing companies such as Faraday (3035–TW), TSMC (2330–TW), and Amkor (AMKR–OTC).
Exhibit 14. OPEL Management Team
Officer Role Background Shares
Held
% Of Outstanding
SharesStock
OptionsRobert G. Pico Chairman and
CEO Mr. Pico is the interim Chairman and founder of OPEL. Prior to establishing the company, he was VP of Business Development at TranSwitch Corporation where he led a wide array of start-up, M&A, and operations management activities. Prior to TranSwitch, Mr. Pico worked at ITT Corporation where he led the worldwide contracting group.
75,000 0.14% 2,138,000
Leon M. Pierhal President and COO
Mr. Pierhal joined OPEL as President and COO after working for nearly 35 years in telecommunications and computing technology development. He has held responsibilities in expanding sales forces, marketing and developing new relationships, and initiating new strategic partners.
1,180,000 2.20% 125,000
Michael C. McCoy Chief Financial Officer
Mr. McCoy took on the role of CFO of OPEL after founding and serving as VP/Controller and Corporate Secretary of TranSwitch Corporation. He has 30 years of financial experience.
25,000 0.05% 568,000
Francisco Middleton VP of Marketing Mr. Middleton brings more than 30 years of experience in general management, marketing, and engineering to OPEL after working in different management roles at TranSwitch. His expertise includes new product strategies, concepts, developments, and marketing.
488,000 0.91% 80,000
Javier Berrios VP of Engineering
Dr. Berrios took on the roles of VP of Engineering after spending two years as VP of Engineering of Tego Inc. Prior to his founding of Tego, he spent 10 years at TranSwitch.
0 0.00% 120,000
Total 1,768,000 3.30% 3,031,000Source: Company reports.
Exhibit 15. OPEL Board Of Directors
Name Principal Occupation Director Since Shares
Owned Held
% Of Outstanding
SharesStock
OptionsRobert G. Pico Chairman and CEO of OPEL International 6/25/2007–5/9/2008 75,000 0.14% 2,138,000Leon M. Pierhal President and COO of OPEL International 6/25/2007 1,180,000 2.20% 125,000Michael C. McCoy Chief Financial Officer of OPEL International 6/25/2007 25,000 0.05% 568,000Francisco Middleton VP of Marketing of OPEL International 6/25/2007 488,000 0.91% 80,000Larry R. Kunkel Chief Economist and Director of Corporate Strategy, Federal Home Loan Bank of Chicago, New York
Life Insurance Company and Ryan Edwards Global Strategic Advisors 6/25/2007 200,000 0.37% 109,000
Denis Colbourne President and CEO, DC-Technologies Ltd. 6/25/2007 0 0.00% 121,000Samuel Peralta President and CEO, Evergence Inc. & Director of Business Development, Kinectrics Inc. 6/25/2007 0 0.00% 109,000Total 1,968,000 3.67% 3,250,000Source: Company reports.
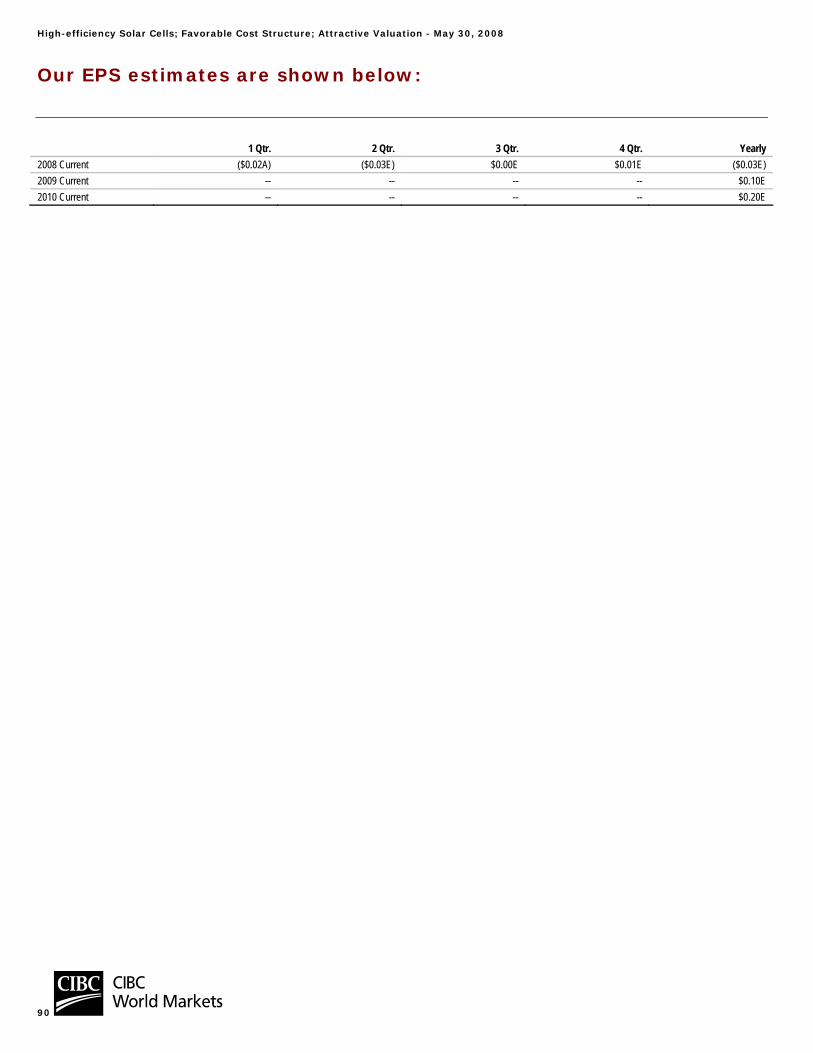
High-efficiency Solar Cells; Favorable Cost Structure; Attractive Valuation - May 30, 2008
90
Our EPS estimates are shown below:
1 Qtr. 2 Qtr. 3 Qtr. 4 Qtr. Yearly 2008 Current ($0.02A) ($0.03E) $0.00E $0.01E ($0.03E) 2009 Current -- -- -- -- $0.10E 2010 Current -- -- -- -- $0.20E
Solar Industry Outlook - May 30, 2008
91
IMPORTANT DISCLOSURES:
Analyst Certification: Each CIBC World Markets research analyst named on the front page of this research report, or at the beginning of any subsection hereof, hereby certifies that (i) the recommendations and opinions expressed herein accurately reflect such research analyst's personal views about the company and securities that are the subject of this report and all other companies and securities mentioned in this report that are covered by such research analyst and (ii) no part of the research analyst's compensation was, is, or will be, directly or indirectly, related to the specific recommendations or views expressed by such research analyst in this report.
Potential Conflicts of Interest: Equity research analysts employed by CIBC World Markets are compensated from revenues generated by various CIBC World Markets businesses, including the CIBC World Markets Investment Banking Department within the Corporate and Leveraged Finance Division. Research analysts do not receive compensation based upon revenues from specific investment banking transactions. CIBC World Markets generally prohibits any research analyst and any member of his or her household from executing trades in the securities of a company that such research analyst covers. Additionally, CIBC World Markets generally prohibits any research analyst from serving as an officer, director or advisory board member of a company that such analyst covers.
In addition to 1% ownership positions in covered companies that are required to be specifically disclosed in this report, CIBC World Markets may have a long position of less than 1% or a short position or deal as principal in the securities discussed herein, related securities or in options, futures or other derivative instruments based thereon.
Recipients of this report are advised that any or all of the foregoing arrangements, as well as more specific disclosures set forth below, may at times give rise to potential conflicts of interest.
Solar Industry Outlook - May 30, 2008
92
Important Disclosure Footnotes for Companies Mentioned in this Report that Are Covered by CIBC World Markets: Stock Prices as of 05/30/2008: Algonquin Power Income Fund (2a, 2e, 2g) (APF.UN-TSX, C$7.95, Sector Performer) ARISE Technologies (2a, 2c, 2e) (APV-TSX, C$1.99, Sector Performer) ATS Automation Tooling Systems Inc. (ATA-TSX, C$6.05, Sector Outperformer) BP p.l.c. (2g) (BP-NYSE, US$72.34, Sector Performer) Canadian National Railway Co. (2g, 7, 9) (CNI-NYSE, US$56.59, Sector Performer) Celestica Inc. (2g, 6a, 7, 9, 12) (CLS-NYSE, US$9.16, Sector Outperformer) Day4 Energy (2a, 2c, 2e) (DFE-TSX, C$5.00, Sector Performer) Flextronics International Ltd. (6a) (FLEX-NASDAQ, $10.64, Sector Performer) MacDonald, Dettwiler and Associates Ltd. (2g) (MDA-TSX, $42.50, Sector Outperformer) Opel International (OPL-V, C$1.20, Sector Outperformer) Royal Dutch Shell (2g) (RDS.A-NYSE, US$85.15, Sector Performer) Teck Cominco Ltd. (2a, 2g, 7, 9, 12) (TCK.B-TSX, C$48.60, Sector Outperformer) Timminco Limited (2g) (TIM-TSX, C$30.50, Sector Outperformer)
Companies Mentioned in this Report that Are Not Covered by CIBC World Markets: Stock Prices as of 05/30/2008: Agilent Technologies (A-NYSE, US$37.16, Not Rated) Aleo Solar AG (AS1-F, €6.72, Not Rated) Amkor Technology (AMKR-OTC, $10.73, Not Rated) Ballard Power Systems, Inc. (BLDP-NASDAQ, $4.23, Not Rated) Canadian Solar Inc. (CSIQ-NASDAQ, US$40.10, Not Rated) Centrotherm PV (CTN-F, €65.51, Not Rated) Commerzbank AG (CBK-F, €32.44, Not Rated) Conergy (CGY-F, €20.43, Not Rated) Costco Wholesale Corp. (COST-NASDAQ, US$71.28, Not Rated) Distributed Energy Systems Corp. (DESC-NASDAQ, $0.51, Not Rated) Emcore Corporation (EMKR-NASDAQ, $7.87, Not Rated) Energie Baden-Wurttemberg AG (EBK-F, €52.70, Not Rated) Energy Conversion Devices (ENER-NASDAQ, US$61.89, Not Rated) ErSol Solar Energy AG (ES6-F, €59.90, Not Rated) Evergreen Solar, Inc. (ESLR-NASDAQ, US$10.46, Not Rated) Faraday Technology Corporation (3035-TW, [TWD]60.10, Not Rated) First Solar, Inc. (FSLR-OTC, US$272.89, Not Rated) FuelCell Energy Inc. (FCEL-NASDAQ, $10.06, Not Rated) General Electric (GE-NYSE, US$30.80, Not Rated) Gintech Energy Corporation (3514-TW, [TWD]215.00, Not Rated) Google Inc. (GOOG-NASDAQ, US$589.81, Not Rated) Hewlett-Packard (HPQ-NYSE, US$47.38, Not Rated) HSBC Corp. (HSBA-LN, €852.50, Not Rated) Intel Corporation (INTC-NASDAQ, US$23.44, Not Rated) International Business Machines (IBM-NYSE, US$129.91, Not Rated) JA Solar Holdings Co. Ltd. (JASO-NASDAQ, US$22.37, Not Rated) Kyocera Corp. (6971-T, ¥10150.00, Not Rated) LDK Solar Co., Ltd. (LDK-NYSE, US$45.73, Not Rated)

Solar Industry Outlook - May 30, 2008
93
MEMC Electronic Materials Inc. (WFR-NYSE, US$70.03, Not Rated) Microsoft Corporation (MSFT-OTC, US$28.49, Not Rated) Mitsubishi Corp (8058-T, ¥3640.00, Not Rated) Motech Industries (6244-TW, [TWD]279.00, Not Rated) Motorola, Inc. (MOT-NYSE, US$9.33, Not Rated) Nortel Networks Corporation (NT-NYSE, US$8.23, Not Rated) Oracle Corporation (ORCL-OTC, US$22.87, Not Rated) Plug Power Inc. (PLUG-NASDAQ, $3.10, Not Rated) Q-Cells AG (QCE-F, €78.25, Not Rated) ReneSola (SOLA-L, p633.44, Not Rated) Renewable Energy Corporation ASA (REC-OL, [NOK]151.50, Not Rated) Sanyo Electronic Co. Ltd. (6764-T, ¥269.00, Not Rated) SBS Technologies (SBSE-OTC, US$16.48, Not Rated) Sharp Corp. (6753-T, ¥1840.00, Not Rated) Siemens AG (SIE-DE, €72.92, Not Rated) Shima Seiki Manufacturing Ltd (6222-T, ¥3440.00, Not Rated) Solarfun Power Holdings Co. Ltd. (SOLF-NASDAQ, US$21.31, Not Rated) Solarworld (SWV-D, €35.07, Not Rated) Solon AG (SOO1-F, €59.89, Not Rated) SONNENENERGY CORP (PWR-V, $0.24, Not Rated) Staples Inc. (SPLS-NASDAQ, US$21.70, Not Rated) SunPower Corporation (SPWR-NASDAQ, US$81.65, Not Rated) Suntech Power Holdings Co. Ltd. (STP-NYSE, US$42.84, Not Rated) Sunways AG (SWW-D, €8.89, Not Rated) Taiwan Semiconductor Manufacturing Co., Ltd. (2330-TW, [TWD]65.60, Not Rated) The Boeing Company (BA-NYSE, US$82.40, Not Rated) Topsil Seminconductor Materials (TPSL-CO, [DKK]1.38, Not Rated) TranSwitch Corporation (TXCC-OTC, $0.78, Not Rated) Trina Solar Ltd. (TSL-NYSE, $45.94, Not Rated) TriQuint Semiconductor, Inc. (TQNT-OTC, $6.72, Not Rated) U.S. Bancorp (USB-NYSE, US$33.08, Not Rated) Virtek Vision International Inc. (VRK-TSX, $0.55, Not Rated) Wacker Chemie (WCH-F, €151.90, Not Rated) Wal-Mart (WMT-NYSE, US$57.83, Not Rated) Western Digital (WDC-NYSE, US$36.89, Not Rated) Xcel Energy Inc (XEL-NYSE, US$21.33, Not Rated) Yingli Green Energy Holding Co. Ltd. (YGE-NYSE, US$20.58, Not Rated) Important disclosure footnotes that correspond to the footnotes in this table may be found in the "Key to Important Disclosure Footnotes" section of this report.
Solar Industry Outlook - May 30, 2008
94
Key to Important Disclosure Footnotes: 1 CIBC World Markets Corp. makes a market in the securities of this company. 2a This company is a client for which a CIBC World Markets company has performed investment banking services
in the past 12 months. 2b CIBC World Markets Corp. has managed or co-managed a public offering of securities for this company in the
past 12 months. 2c CIBC World Markets Inc. has managed or co-managed a public offering of securities for this company in the
past 12 months. 2d CIBC World Markets Corp. has received compensation for investment banking services from this company in
the past 12 months. 2e CIBC World Markets Inc. has received compensation for investment banking services from this company in the
past 12 months. 2f CIBC World Markets Corp. expects to receive or intends to seek compensation for investment banking services
from this company in the next 3 months. 2g CIBC World Markets Inc. expects to receive or intends to seek compensation for investment banking services
from this company in the next 3 months. 3a This company is a client for which a CIBC World Markets company has performed non-investment banking,
securities-related services in the past 12 months. 3b CIBC World Markets Corp. has received compensation for non-investment banking, securities-related services
from this company in the past 12 months. 3c CIBC World Markets Inc. has received compensation for non-investment banking, securities-related services
from this company in the past 12 months. 4a This company is a client for which a CIBC World Markets company has performed non-investment banking,
non-securities-related services in the past 12 months. 4b CIBC World Markets Corp. has received compensation for non-investment banking, non-securities-related
services from this company in the past 12 months. 4c CIBC World Markets Inc. has received compensation for non-investment banking, non-securities-related
services from this company in the past 12 months. 5a The CIBC World Markets Corp. analyst(s) who covers this company also has a long position in its common
equity securities. 5b A member of the household of a CIBC World Markets Corp. research analyst who covers this company has a
long position in the common equity securities of this company. 6a The CIBC World Markets Inc. fundamental analyst(s) who covers this company also has a long position in its
common equity securities. 6b A member of the household of a CIBC World Markets Inc. fundamental research analyst who covers this
company has a long position in the common equity securities of this company. 7 CIBC World Markets Corp., CIBC World Markets Inc., and their affiliates, in the aggregate, beneficially own 1%
or more of a class of equity securities issued by this company. 8 A partner, director or officer of CIBC World Markets Inc. or any analyst involved in the preparation of this
research report has provided services to this company for remuneration in the past 12 months. 9 A senior executive member or director of Canadian Imperial Bank of Commerce ("CIBC"), the parent company
to CIBC World Markets Inc. and CIBC World Markets Corp., or a member of his/her household is an officer, director or advisory board member of this company or one of its subsidiaries.
10 Canadian Imperial Bank of Commerce ("CIBC"), the parent company to CIBC World Markets Inc. and CIBC World Markets Corp., has a significant credit relationship with this company.
11 The equity securities of this company are restricted voting shares. 12 The equity securities of this company are subordinate voting shares. 13 The equity securities of this company are non-voting shares. 14 The equity securities of this company are limited voting shares.
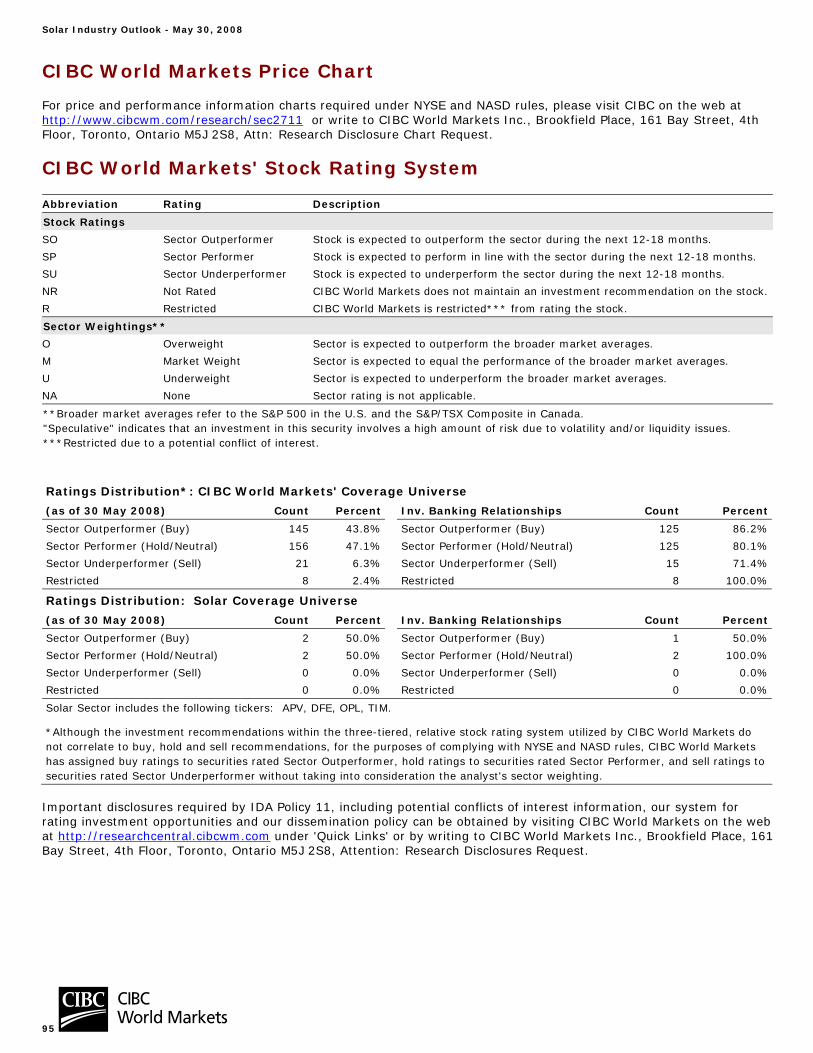
Solar Industry Outlook - May 30, 2008
95
CIBC World Markets Price Chart
For price and performance information charts required under NYSE and NASD rules, please visit CIBC on the web at http://www.cibcwm.com/research/sec2711 or write to CIBC World Markets Inc., Brookfield Place, 161 Bay Street, 4th Floor, Toronto, Ontario M5J 2S8, Attn: Research Disclosure Chart Request.
CIBC World Markets' Stock Rating System
Abbreviation Rating Description
Stock Ratings
SO Sector Outperformer Stock is expected to outperform the sector during the next 12-18 months.
SP Sector Performer Stock is expected to perform in line with the sector during the next 12-18 months.
SU Sector Underperformer Stock is expected to underperform the sector during the next 12-18 months.
NR Not Rated CIBC World Markets does not maintain an investment recommendation on the stock.
R Restricted CIBC World Markets is restricted*** from rating the stock.
Sector Weightings**
O Overweight Sector is expected to outperform the broader market averages.
M Market Weight Sector is expected to equal the performance of the broader market averages.
U Underweight Sector is expected to underperform the broader market averages.
NA None Sector rating is not applicable.
**Broader market averages refer to the S&P 500 in the U.S. and the S&P/TSX Composite in Canada. "Speculative" indicates that an investment in this security involves a high amount of risk due to volatility and/or liquidity issues. ***Restricted due to a potential conflict of interest.
Ratings Distribution*: CIBC World Markets' Coverage Universe
(as of 30 May 2008) Count Percent Inv. Banking Relationships Count Percent
Sector Outperformer (Buy) 145 43.8% Sector Outperformer (Buy) 125 86.2%
Sector Performer (Hold/Neutral) 156 47.1% Sector Performer (Hold/Neutral) 125 80.1%
Sector Underperformer (Sell) 21 6.3% Sector Underperformer (Sell) 15 71.4%
Restricted 8 2.4% Restricted 8 100.0%
Ratings Distribution: Solar Coverage Universe
(as of 30 May 2008) Count Percent Inv. Banking Relationships Count Percent
Sector Outperformer (Buy) 2 50.0% Sector Outperformer (Buy) 1 50.0%
Sector Performer (Hold/Neutral) 2 50.0% Sector Performer (Hold/Neutral) 2 100.0%
Sector Underperformer (Sell) 0 0.0% Sector Underperformer (Sell) 0 0.0%
Restricted 0 0.0% Restricted 0 0.0%
Solar Sector includes the following tickers: APV, DFE, OPL, TIM.
*Although the investment recommendations within the three-tiered, relative stock rating system utilized by CIBC World Markets do not correlate to buy, hold and sell recommendations, for the purposes of complying with NYSE and NASD rules, CIBC World Markets has assigned buy ratings to securities rated Sector Outperformer, hold ratings to securities rated Sector Performer, and sell ratings to securities rated Sector Underperformer without taking into consideration the analyst's sector weighting.
Important disclosures required by IDA Policy 11, including potential conflicts of interest information, our system for rating investment opportunities and our dissemination policy can be obtained by visiting CIBC World Markets on the web at http://researchcentral.cibcwm.com under 'Quick Links' or by writing to CIBC World Markets Inc., Brookfield Place, 161 Bay Street, 4th Floor, Toronto, Ontario M5J 2S8, Attention: Research Disclosures Request.

Solar Industry Outlook - May 30, 2008
96
Legal Disclaimer
This report is issued and approved for distribution by (i) in Canada, CIBC World Markets Inc., a member of the Investment Dealers Association ("IDA"), the Toronto Stock Exchange, the TSX Venture Exchange and CIPF, (ii) in the United Kingdom, CIBC World Markets plc, which is regulated by the Financial Services Authority ("FSA"), and (iii) in Australia, CIBC World Markets Australia Limited, a member of the Australian Stock Exchange and regulated by the ASIC (collectively, "CIBC World Markets"). This report is distributed in the Unites States by CIBC World Markets Inc. and has not been reviewed or approved by CIBC World Markets Corp., a member of the New York Stock Exchange ("NYSE"), NASD and SIPC. This report is intended for distribution in the United States only to Major Institutional Investors (as such term is defined in SEC 15a-6 and Section 15 of the Securities Exchange Act of 1934, as amended) and is not intended for the use of any person or entity that is not a major institutional investor. Major Institutional Investors receiving this report should effect transactions in securities discussed in the report through CIBC World Markets Corp. This report is provided, for informational purposes only, to institutional investor and retail clients of CIBC World Markets in Canada, and does not constitute an offer or solicitation to buy or sell any securities discussed herein in any jurisdiction where such offer or solicitation would be prohibited. This document and any of the products and information contained herein are not intended for the use of private investors in the United Kingdom. Such investors will not be able to enter into agreements or purchase products mentioned herein from CIBC World Markets plc. The comments and views expressed in this document are meant for the general interests of clients of CIBC World Markets Australia Limited. The securities mentioned in this report may not be suitable for all types of investors. This report does not take into account the investment objectives, financial situation or specific needs of any particular client of CIBC World Markets. Recipients should consider this report as only a single factor in making an investment decision and should not rely solely on investment recommendations contained herein, if any, as a substitution for the exercise of independent judgment of the merits and risks of investments. The analyst writing the report is not a person or company with actual, implied or apparent authority to act on behalf of any issuer mentioned in the report. Before making an investment decision with respect to any security recommended in this report, the recipient should consider whether such recommendation is appropriate given the recipient's particular investment needs, objectives and financial circumstances. CIBC World Markets suggests that, prior to acting on any of the recommendations herein, Canadian retail clients of CIBC World Markets contact one of our client advisers in your jurisdiction to discuss your particular circumstances. Non-client recipients of this report who are not institutional investor clients of CIBC World Markets should consult with an independent financial advisor prior to making any investment decision based on this report or for any necessary explanation of its contents. CIBC World Markets will not treat non-client recipients as its clients by virtue of their receiving this report. Past performance is not a guarantee of future results, and no representation or warranty, express or implied, is made regarding future performance of any security mentioned in this report. The price of the securities mentioned in this report and the income they produce may fluctuate and/or be adversely affected by exchange rates, and investors may realize losses on investments in such securities, including the loss of investment principal. CIBC World Markets accepts no liability for any loss arising from the use of information contained in this report, except to the extent that liability may arise under specific statutes or regulations applicable to CIBC World Markets. Information, opinions and statistical data contained in this report were obtained or derived from sources believed to be reliable, but CIBC World Markets does not represent that any such information, opinion or statistical data is accurate or complete (with the exception of information contained in the Important Disclosures section of this report provided by CIBC World Markets or individual research analysts), and they should not be relied upon as such. All estimates, opinions and recommendations expressed herein constitute judgments as of the date of this report and are subject to change without notice. Nothing in this report constitutes legal, accounting or tax advice. Since the levels and bases of taxation can change, any reference in this report to the impact of taxation should not be construed as offering tax advice on the tax consequences of investments. As with any investment having potential tax implications, clients should consult with their own independent tax adviser. This report may provide addresses of, or contain hyperlinks to, Internet web sites. CIBC World Markets has not reviewed the linked Internet web site of any third party and takes no responsibility for the contents thereof. Each such address or hyperlink is provided solely for the recipient's convenience and information, and the content of linked third-party web sites is not in any way incorporated into this document. Recipients who choose to access such third-party web sites or follow such hyperlinks do so at their own risk. Although each company issuing this report is a wholly owned subsidiary of Canadian Imperial Bank of Commerce ("CIBC"), each is solely responsible for its contractual obligations and commitments, and any securities products offered or recommended to or purchased or sold in any client accounts (i) will not be insured by the Federal Deposit Insurance Corporation ("FDIC"), the Canada Deposit Insurance Corporation or other similar deposit insurance, (ii) will not be deposits or other obligations of CIBC, (iii) will not be endorsed or guaranteed by CIBC, and (iv) will be subject to investment risks, including possible loss of the principal invested. The CIBC trademark is used under license. © 2008 CIBC World Markets Inc. All rights reserved. Unauthorized use, distribution, duplication or disclosure without the prior written permission of CIBC World Markets is prohibited by law and may result in prosecution.