Embed Size (px)
Citation preview

Journal of Geography and Earth Sciences June 2016, Vol. 4, No. 1, pp. 31-45
ISSN 2334-2447 (Print) 2334-2455 (Online) Copyright © The Author(s). All Rights Reserved.
Published by American Research Institute for Policy Development DOI: 10.15640/jges.v4n1a3
URL: https://doi.org/10.15640/jges.v4n1a3
Seismic Power of Tabriz Fault and Casualties in Tabriz Metropolitan Assessment by Experimental Models and GIS
Mousa Abedini1 & Nader Sarmasti2
Abstract
In order to establishment of urban centers in high-risk earthquake zones, these cities put potentially at risk of serious injury. Most of the harmful effects caused by earthquakes are due to developing urban patterns in the fault zones. Non-considered development of urban areas in near fault regions has caused the occurrence of earthquake leads to a human tragedy. Tabriz metropolitan is Iran's only major city which is located in the susceptibility with a very high relative risk. Tabriz fault is located in the immediate vicinity of the city and some parts of the city are constructed along the fault. The Tabriz fault is a prominent tectonic feature in the vicinity of the city. Tabriz metropolitan has experienced destructive earthquakes during history as a consequence of locating in vicinity to the Tabriz fault. Today, Tabriz metropolis is extremely growing with a population of more than 2000000 people and many high buildings in the privacy of active fault zone. Because of the importance of the issue, in this study, seismic power of Tabriz fault and casualties in Tabriz metropolitan is estimated based on experimental models and GIS. The results demonstrate that the Tabriz fault can cause earthquakes with magnitude over 6 in the Richter scale. Assuming seismic activity Tabriz fault scenario, 1632526 casualties were estimated at night of total population in Tabriz metropolis including 858123 people dead, 774403 people injured
Keywords: Seismic power, Casualties, Tabriz fault, GIS 1. Introduction
Earthquake is direct consequence of shifting tectonic plates that its vibrational energy propagates as seismic waves. Most of the harmful effects caused by earthquakes are due to developing urban patterns in the fault zones [13].
1 Associate professor of geomorphology, University of Mohaghegh Ardabili, Iran. E-mail addresses: [email protected]. 2 Graduate student of geomorphology, University of Mohaghegh Ardabili, Iran.
32 Journal of Geography and Earth Sciences, Vol. 4(1), June 2016
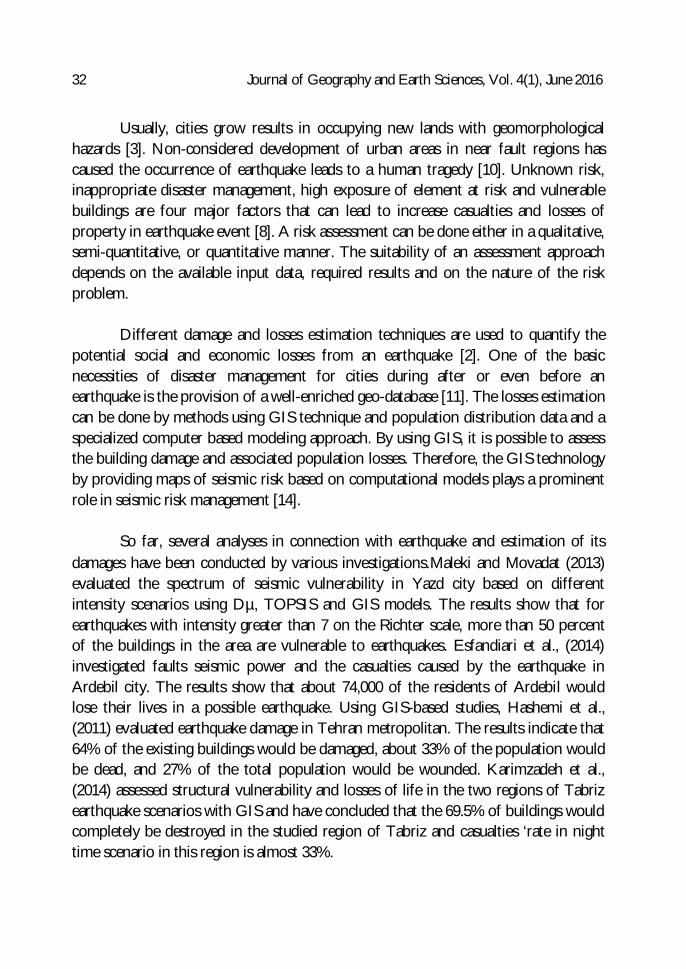
Usually, cities grow results in occupying new lands with geomorphological hazards [3]. Non-considered development of urban areas in near fault regions has caused the occurrence of earthquake leads to a human tragedy [10]. Unknown risk, inappropriate disaster management, high exposure of element at risk and vulnerable buildings are four major factors that can lead to increase casualties and losses of property in earthquake event [8]. A risk assessment can be done either in a qualitative, semi-quantitative, or quantitative manner. The suitability of an assessment approach depends on the available input data, required results and on the nature of the risk problem.
Different damage and losses estimation techniques are used to quantify the
potential social and economic losses from an earthquake [2]. One of the basic necessities of disaster management for cities during after or even before an earthquake is the provision of a well-enriched geo-database [11]. The losses estimation can be done by methods using GIS technique and population distribution data and a specialized computer based modeling approach. By using GIS, it is possible to assess the building damage and associated population losses. Therefore, the GIS technology by providing maps of seismic risk based on computational models plays a prominent role in seismic risk management [14].
So far, several analyses in connection with earthquake and estimation of its
damages have been conducted by various investigations.Maleki and Movadat (2013) evaluated the spectrum of seismic vulnerability in Yazd city based on different intensity scenarios using Dµ, TOPSIS and GIS models. The results show that for earthquakes with intensity greater than 7 on the Richter scale, more than 50 percent of the buildings in the area are vulnerable to earthquakes. Esfandiari et al., (2014) investigated faults seismic power and the casualties caused by the earthquake in Ardebil city. The results show that about 74,000 of the residents of Ardebil would lose their lives in a possible earthquake. Using GIS-based studies, Hashemi et al., (2011) evaluated earthquake damage in Tehran metropolitan. The results indicate that 64% of the existing buildings would be damaged, about 33% of the population would be dead, and 27% of the total population would be wounded. Karimzadeh et al., (2014) assessed structural vulnerability and losses of life in the two regions of Tabriz earthquake scenarios with GIS and have concluded that the 69.5% of buildings would completely be destroyed in the studied region of Tabriz and casualties ‘rate in night time scenario in this region is almost 33%.
Abedini & Sarmasti 33
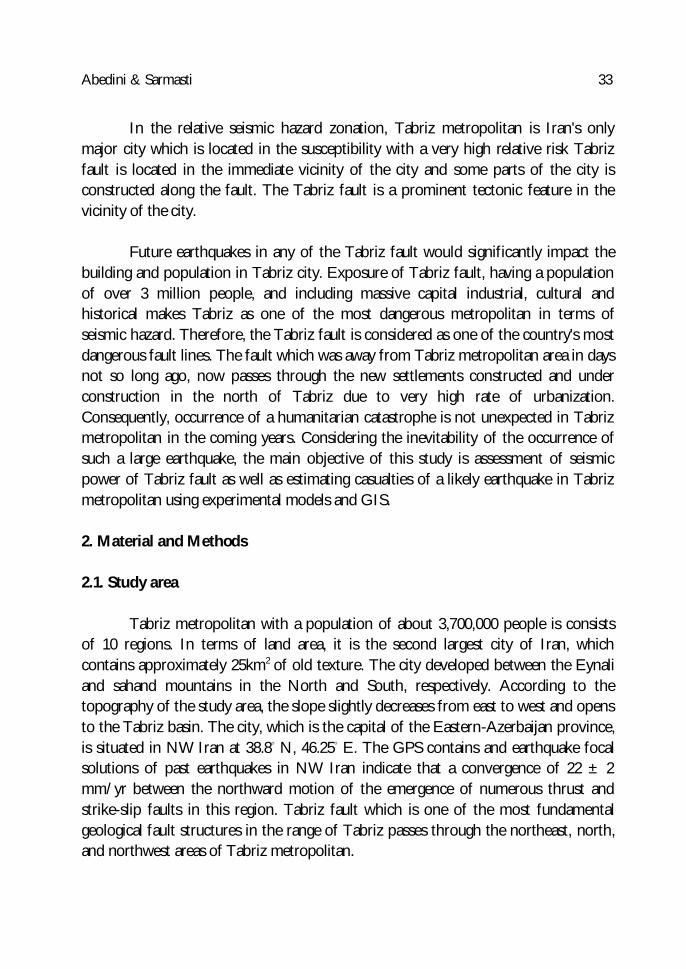
In the relative seismic hazard zonation, Tabriz metropolitan is Iran's only major city which is located in the susceptibility with a very high relative risk Tabriz fault is located in the immediate vicinity of the city and some parts of the city is constructed along the fault. The Tabriz fault is a prominent tectonic feature in the vicinity of the city.
Future earthquakes in any of the Tabriz fault would significantly impact the
building and population in Tabriz city. Exposure of Tabriz fault, having a population of over 3 million people, and including massive capital industrial, cultural and historical makes Tabriz as one of the most dangerous metropolitan in terms of seismic hazard. Therefore, the Tabriz fault is considered as one of the country's most dangerous fault lines. The fault which was away from Tabriz metropolitan area in days not so long ago, now passes through the new settlements constructed and under construction in the north of Tabriz due to very high rate of urbanization. Consequently, occurrence of a humanitarian catastrophe is not unexpected in Tabriz metropolitan in the coming years. Considering the inevitability of the occurrence of such a large earthquake, the main objective of this study is assessment of seismic power of Tabriz fault as well as estimating casualties of a likely earthquake in Tabriz metropolitan using experimental models and GIS. 2. Material and Methods 2.1. Study area
Tabriz metropolitan with a population of about 3,700,000 people is consists
of 10 regions. In terms of land area, it is the second largest city of Iran, which contains approximately 25km2 of old texture. The city developed between the Eynali and sahand mountains in the North and South, respectively. According to the topography of the study area, the slope slightly decreases from east to west and opens to the Tabriz basin. The city, which is the capital of the Eastern-Azerbaijan province, is situated in NW Iran at 38.8◦ N, 46.25◦ E. The GPS contains and earthquake focal solutions of past earthquakes in NW Iran indicate that a convergence of 22 ± 2 mm/yr between the northward motion of the emergence of numerous thrust and strike-slip faults in this region. Tabriz fault which is one of the most fundamental geological fault structures in the range of Tabriz passes through the northeast, north, and northwest areas of Tabriz metropolitan.
34 Journal of Geography and Earth Sciences, Vol. 4(1), June 2016
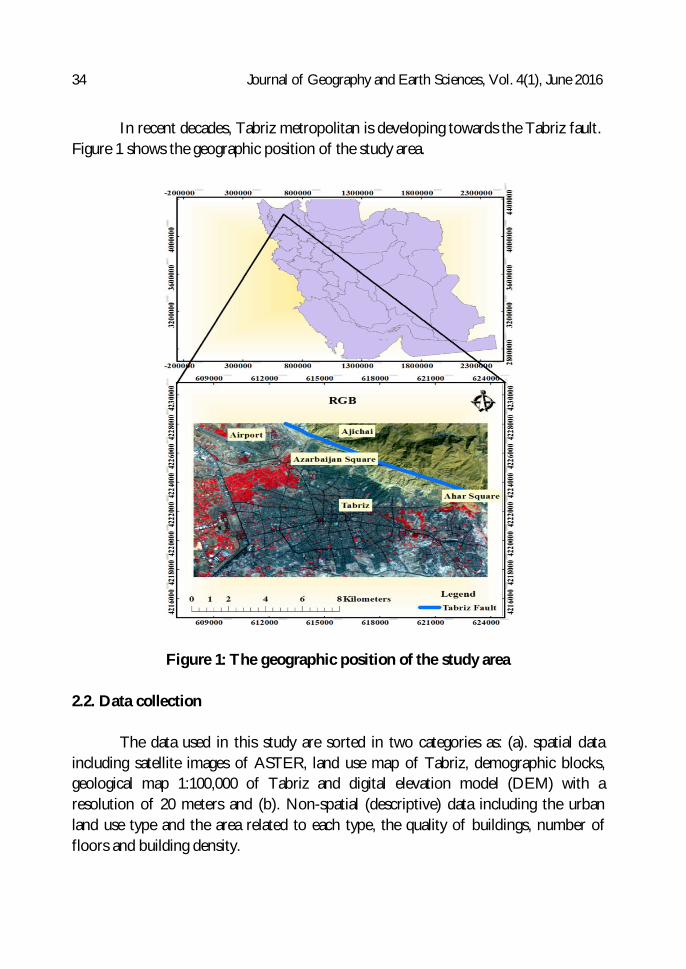
In recent decades, Tabriz metropolitan is developing towards the Tabriz fault. Figure 1 shows the geographic position of the study area.
Figure 1: The geographic position of the study area
2.2. Data collection The data used in this study are sorted in two categories as: (a). spatial data
including satellite images of ASTER, land use map of Tabriz, demographic blocks, geological map 1:100,000 of Tabriz and digital elevation model (DEM) with a resolution of 20 meters and (b). Non-spatial (descriptive) data including the urban land use type and the area related to each type, the quality of buildings, number of floors and building density.
Abedini & Sarmasti 35
2.3. Data analysis In this study due to the importance subject specifications, at first seismic
power of Tabriz fault calculated using the quantitative correlations of Noroozi and Ashjai, Selmoonez, Ambersize and Melvil, Norrozi, Cooper Esmit and Zare. Then, an earthquake scenario for buildings vulnerability assessment is assumed using the GIS analysis. Moreover, casualties are estimated considering this scenario and seismicity qualifications of typical buildings in Iran.
3. Results and Discussions
3.1. Seismic power analysis of fault
Various correlations have been proposed to seismic power assessment of
faults. In these formulas seismic power is directly proportional to the faults length [7]. Empirical formulas published in the literature or determining the seismic power and relative intensity of faults are as follow:
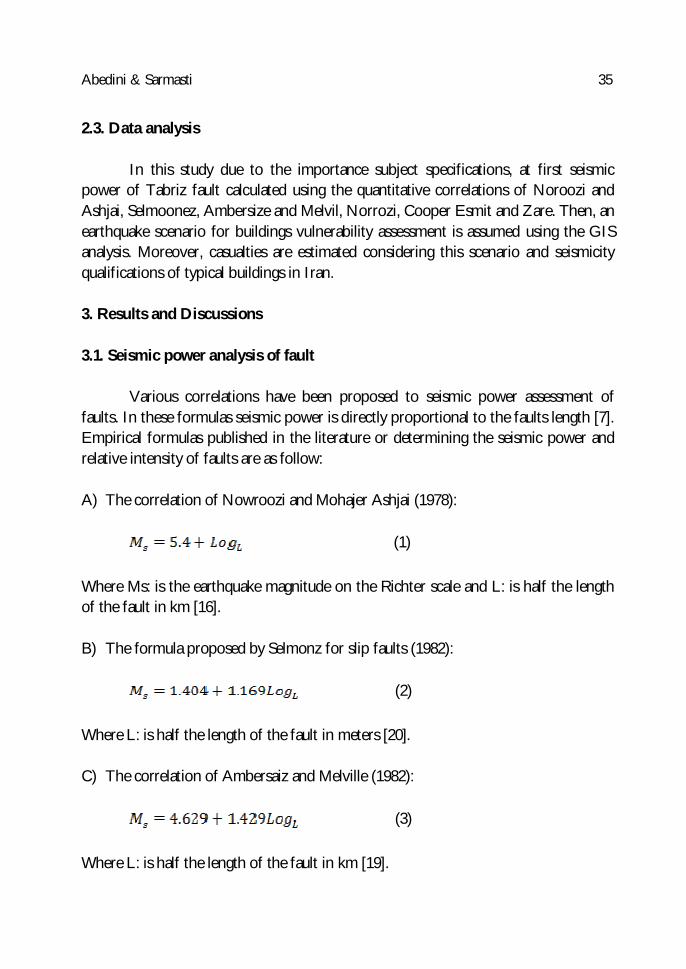
A) The correlation of Nowroozi and Mohajer Ashjai (1978):
(1)
Where Ms: is the earthquake magnitude on the Richter scale and L: is half the length of the fault in km [16]. B) The formula proposed by Selmonz for slip faults (1982):
(2)
Where L: is half the length of the fault in meters [20].
C) The correlation of Ambersaiz and Melville (1982):
(3)
Where L: is half the length of the fault in km [19].
36 Journal of Geography and Earth Sciences, Vol. 4(1), June 2016
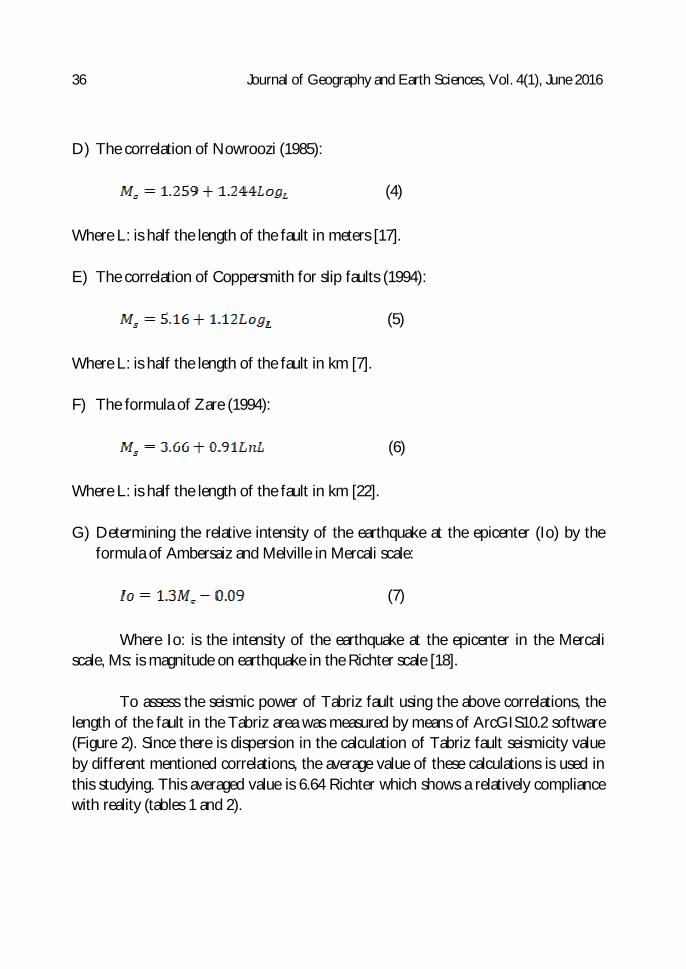
D) The correlation of Nowroozi (1985):
(4)
Where L: is half the length of the fault in meters [17]. E) The correlation of Coppersmith for slip faults (1994):
(5)
Where L: is half the length of the fault in km [7]. F) The formula of Zare (1994):
(6)
Where L: is half the length of the fault in km [22].
G) Determining the relative intensity of the earthquake at the epicenter (Io) by the
formula of Ambersaiz and Melville in Mercali scale:
(7) Where Io: is the intensity of the earthquake at the epicenter in the Mercali
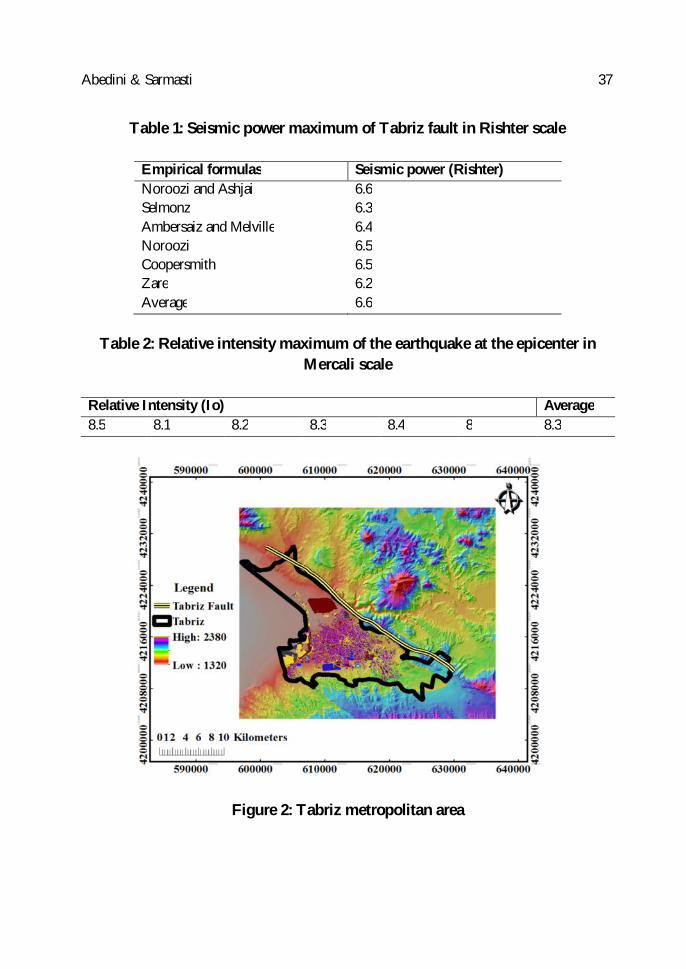
scale, Ms: is magnitude on earthquake in the Richter scale [18]. To assess the seismic power of Tabriz fault using the above correlations, the
length of the fault in the Tabriz area was measured by means of ArcGIS10.2 software (Figure 2). Since there is dispersion in the calculation of Tabriz fault seismicity value by different mentioned correlations, the average value of these calculations is used in this studying. This averaged value is 6.64 Richter which shows a relatively compliance with reality (tables 1 and 2).
Abedini & Sarmasti 37
Table 1: Seismic power maximum of Tabriz fault in Rishter scale
Empirical formulas Seismic power (Rishter) Noroozi and Ashjai 6.6 Selmonz 6.3 Ambersaiz and Melville 6.4 Noroozi 6.5 Coopersmith 6.5 Zare 6.2 Average 6.6
Table 2: Relative intensity maximum of the earthquake at the epicenter in
Mercali scale
Average Relative Intensity (Io) 8.3 8 8.4 8.3 8.2 8.1 8.5
Figure 2: Tabriz metropolitan area

38 Journal of Geography and Earth Sciences, Vol. 4(1), June 2016
3.2. Vulnerability analysis
3.2.1. City vulnerability estimation The weighted overlay is one of the overlay analysis tools included in the
Spatial Analysis extension. Commonly, it is used to solve multi-criteria problems such as optimal site selection or suitability modeling. It is a technique for applying a common scale of values to diverse and dissimilar inputs to create an integrated analysis. In this method, the relative importance of various criterions is determined by the administrator through assigning a weighting factor for any criterion. Then, the assigned weight of each criterion is multiplied by the option score and the total score for each option obtained by summing the results [21].
In this study to assess the urban vulnerability against earthquake risk, a series
of natural and human factors gathered according to different expert opinions. Then, vulnerability of Tabriz metropolitan against earthquake is estimated using the weighted overlay model and multi-criteria analysis. Extracting required layers of information considering the standards in the process of urban vulnerability is the first practical stage of this research. After data collection step, the privacy of faults was traced with ArcGIS10.2 software buffer function.
Then, with intersect overlapping function; the interface section between
buffer layer and layers of geology, slope, urban land use and demographic units was prepared as anew layer with a database. In the next stages, using the polygon conversion to raster based on the data fields of descriptive tables were extracted raster layers. Layers based on the existing fields standardized in the five priority categories. Since the selected layers importance is not the same, layers should be scored. In order to score the layers, various expert opinions are used through designing a questionnaire and the final score is given in the table 3. Finally, vulnerability of metropolitan Tabriz against earthquake was modeled by combining and overlapping layers using the weight overlap indexical model based on the final weight of criteria (Figure 3).
Abedini & Sarmasti 39
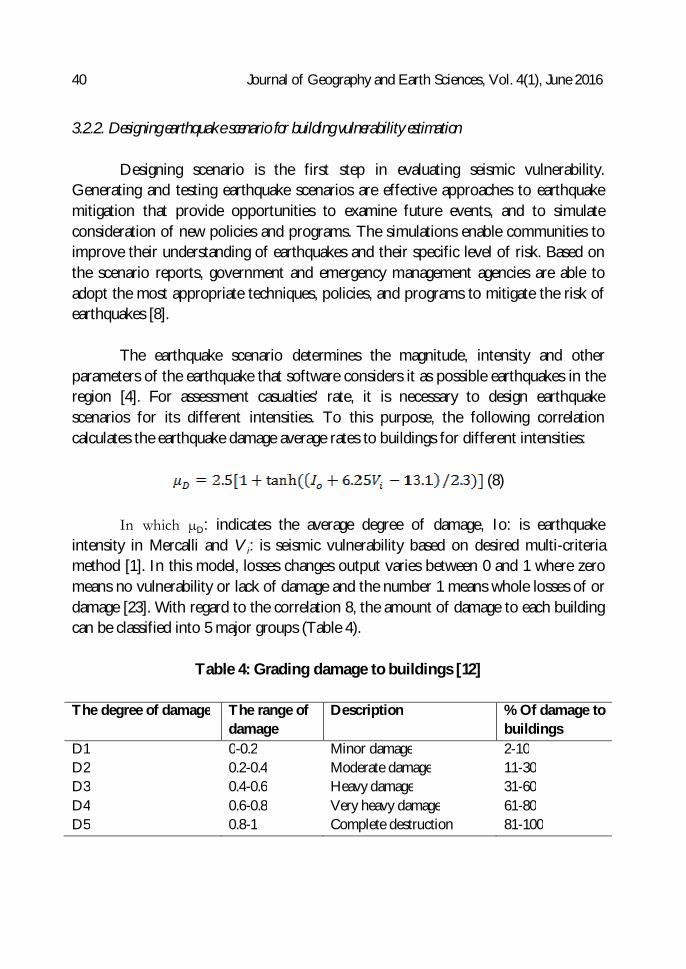
Table 3: The final rating criteria’s
Row Criteria Criteria’s Weight 1 Distance of Fault 19.8 2 Geological formations 12.6 3 Slope 7.8 4 Population density 11.5 5 Building Density (%) 6.9 6 Quality Buildings 17.7 7 Size (M2) 5.5 8 Land Use 6.4 9 Building Floors 7.9
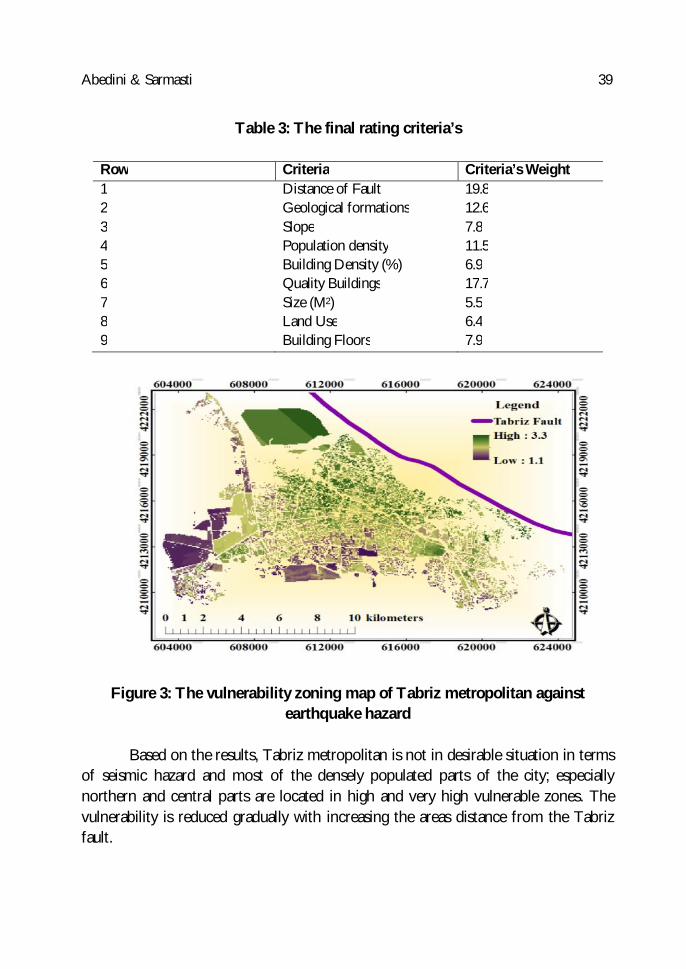
Figure 3: The vulnerability zoning map of Tabriz metropolitan against earthquake hazard
Based on the results, Tabriz metropolitan is not in desirable situation in terms
of seismic hazard and most of the densely populated parts of the city; especially northern and central parts are located in high and very high vulnerable zones. The vulnerability is reduced gradually with increasing the areas distance from the Tabriz fault.
40 Journal of Geography and Earth Sciences, Vol. 4(1), June 2016
3.2.2. Designing earthquake scenario for building vulnerability estimation Designing scenario is the first step in evaluating seismic vulnerability.
Generating and testing earthquake scenarios are effective approaches to earthquake mitigation that provide opportunities to examine future events, and to simulate consideration of new policies and programs. The simulations enable communities to improve their understanding of earthquakes and their specific level of risk. Based on the scenario reports, government and emergency management agencies are able to adopt the most appropriate techniques, policies, and programs to mitigate the risk of earthquakes [8].
The earthquake scenario determines the magnitude, intensity and other
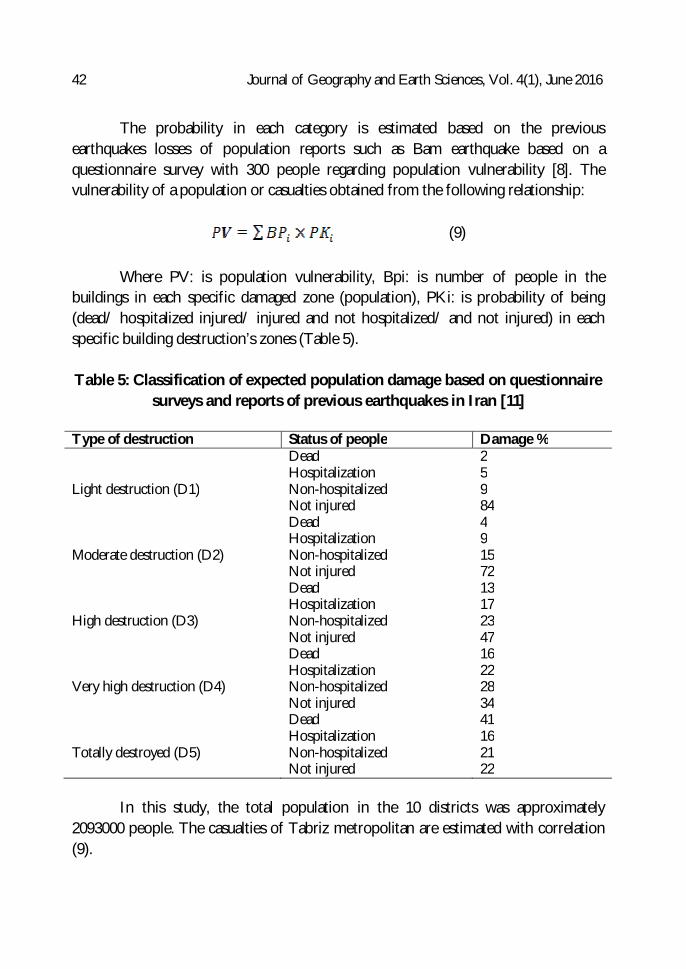
parameters of the earthquake that software considers it as possible earthquakes in the region [4]. For assessment casualties' rate, it is necessary to design earthquake scenarios for its different intensities. To this purpose, the following correlation calculates the earthquake damage average rates to buildings for different intensities:
(8)
In which µD: indicates the average degree of damage, Io: is earthquake
intensity in Mercalli and Vi: is seismic vulnerability based on desired multi-criteria method [1]. In this model, losses changes output varies between 0 and 1 where zero means no vulnerability or lack of damage and the number 1 means whole losses of or damage [23]. With regard to the correlation 8, the amount of damage to each building can be classified into 5 major groups (Table 4).
Table 4: Grading damage to buildings [12]
The degree of damage The range of
damage Description
% Of damage to buildings
D1 0-0.2 Minor damage 2-10 D2 0.2-0.4 Moderate damage 11-30 D3 0.4-0.6 Heavy damage 31-60 D4 0.6-0.8 Very heavy damage 61-80 D5 0.8-1 Complete destruction 81-100

Abedini & Sarmasti 41
The degree of damage to Tabriz metropolitan buildings in earthquake with relative intensity average of 8.3 Mercali is evaluated using the correlation (8). The results indicate that the majority of buildings in Tabriz metropolitan are in grade between 0.8 to 1 (D5) with the full destruction vulnerability (Figure 4).
Figure 4: The buildings vulnerability zoning map of Tabriz metropolitan against earthquake hazard
3.2.3. Population vulnerability estimation
Population vulnerability is a key category of vulnerability analysis defined as
the degree of population losses from a natural disaster, such as an earthquake. The fatalities due to large-scale earthquakes mostly result from buildings collapse [11]. The extent of damage from an earthquake increases dramatically with increases of population growth, in particular in large cities. Earthquakes cause death and injuries in different ways. Building collapse is the main cause of human fatalities in earthquakes worldwide, accounting for about 75 percent of deaths. The expected number of a population who died/ hospitalized injured/ non-hospitalized/ and not injured are a product of the number of occupants of the building at the time of earthquake (population) in each specific damaged zone (no destruction, light, moderate, heavy, very heavy destruction and completely collapsed in building vulnerability database).
42 Journal of Geography and Earth Sciences, Vol. 4(1), June 2016
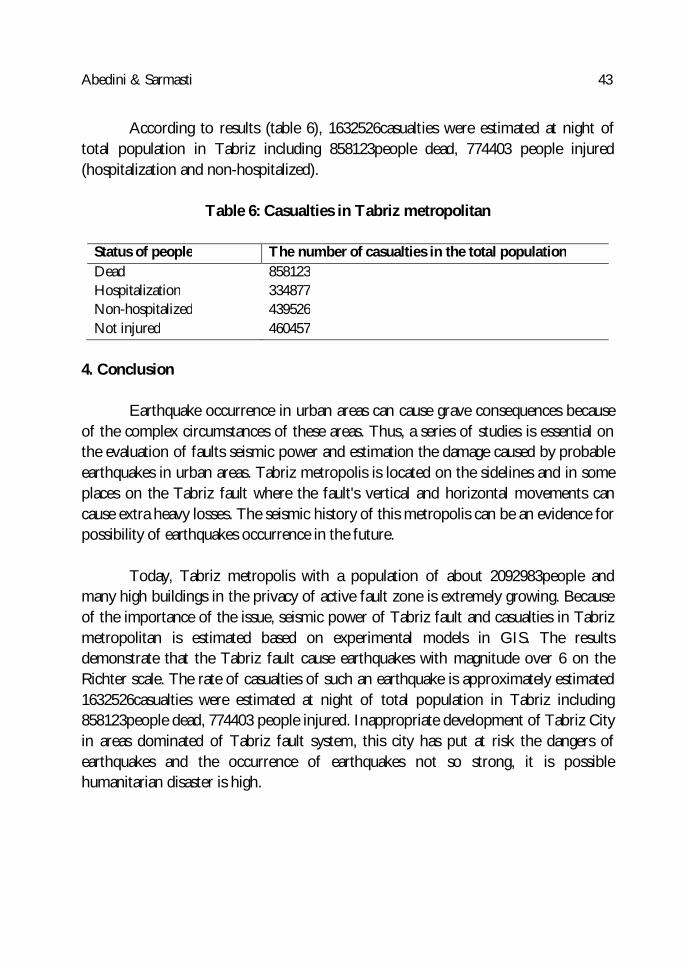
The probability in each category is estimated based on the previous earthquakes losses of population reports such as Bam earthquake based on a questionnaire survey with 300 people regarding population vulnerability [8]. The vulnerability of a population or casualties obtained from the following relationship:
(9)
Where PV: is population vulnerability, Bpi: is number of people in the
buildings in each specific damaged zone (population), PKi: is probability of being (dead/ hospitalized injured/ injured and not hospitalized/ and not injured) in each specific building destruction’s zones (Table 5).
Table 5: Classification of expected population damage based on questionnaire
surveys and reports of previous earthquakes in Iran [11] Type of destruction Status of people Damage % Dead 2
Hospitalization 5 Light destruction (D1) Non-hospitalized 9
Not injured 84 Dead 4 Hospitalization 9
Moderate destruction (D2) Non-hospitalized 15 Not injured 72 Dead 13 Hospitalization 17
High destruction (D3) Non-hospitalized 23 Not injured 47 Dead 16 Hospitalization 22
Very high destruction (D4) Non-hospitalized 28 Not injured 34 Dead 41 Hospitalization 16
Totally destroyed (D5) Non-hospitalized 21 Not injured 22
In this study, the total population in the 10 districts was approximately
2093000 people. The casualties of Tabriz metropolitan are estimated with correlation (9).
Abedini & Sarmasti 43
According to results (table 6), 1632526casualties were estimated at night of total population in Tabriz including 858123people dead, 774403 people injured (hospitalization and non-hospitalized).
Table 6: Casualties in Tabriz metropolitan
Status of people The number of casualties in the total population Dead 858123 Hospitalization 334877 Non-hospitalized 439526 Not injured 460457
4. Conclusion
Earthquake occurrence in urban areas can cause grave consequences because
of the complex circumstances of these areas. Thus, a series of studies is essential on the evaluation of faults seismic power and estimation the damage caused by probable earthquakes in urban areas. Tabriz metropolis is located on the sidelines and in some places on the Tabriz fault where the fault's vertical and horizontal movements can cause extra heavy losses. The seismic history of this metropolis can be an evidence for possibility of earthquakes occurrence in the future.
Today, Tabriz metropolis with a population of about 2092983people and
many high buildings in the privacy of active fault zone is extremely growing. Because of the importance of the issue, seismic power of Tabriz fault and casualties in Tabriz metropolitan is estimated based on experimental models in GIS. The results demonstrate that the Tabriz fault cause earthquakes with magnitude over 6 on the Richter scale. The rate of casualties of such an earthquake is approximately estimated 1632526casualties were estimated at night of total population in Tabriz including 858123people dead, 774403 people injured. Inappropriate development of Tabriz City in areas dominated of Tabriz fault system, this city has put at risk the dangers of earthquakes and the occurrence of earthquakes not so strong, it is possible humanitarian disaster is high.
44 Journal of Geography and Earth Sciences, Vol. 4(1), June 2016
References
Ahadnezhadroveshti M, garakhlo M, and Ziari K (2009) The modeling of the seismic building vulnerability of urban areas using AHP model in GIS, Geography and Development, No. 19, pp. 171-198.
Ara S, (2013) Analyzing population distribution and its effect on earthquake losses estimation in Sylhet, Bangladesh, Thesis submitted to the faculty of Geo-Information science and earth observation of the University of Twente in partial fulfillment of the requirement’s for the degree of Master of science in Geo-Information science and earth observation, Supervisors: Dr. C.J. (Cees) van Westen.
Abedini M (2013) Assessment formations headquarters Sarein tourist town with emphasis on the study of topography, tectonic and climate for the optimal use of urban land use of GIS, Geography and Environmental Planning, No. 1, pp. 51-68.
Amini J, Karami J, Alimohamadisarab A, and Safarad T (2011) Evaluation Radius model to estimate the damage caused by the earthquake in GIS (Case study: zone of Tehran), urban and regional studies and research, No. 11, pp. 23-40.
Esfandiari F, Ghfarigilandeh A, and Khodada L (2014) Evaluation seismic power of faults and estimation of casualties due to the earthquake in urban areas (case study: the city of Ardabil), a geomorphological research, No. 4, pp. 17-36.
Gasemi A (2008) tectonic, fourth edition, Tehran: the Piamnoor publication. Hosseinpur M (2006) Reviews Sizemotectovniki northwest Iran and the earthquake
hazard in the city of Tabriz, MSc thesis, Department of Earth Sciences, University of Tabriz.
Hassanzadeh R, Zorica N, Alavir A, Norouzzadeh M, and Hodhodkian H (2013) Interactive approach GIS-based earthquake scenario development and resource estimation, Computers & Geosciences, Vol.51, PP.324-338.
Hashemi M and Alesheikh AA (2011) A GIS-based earthquake damage assessment and settlement methodology, Soil Dynamics and Earthquake Engineering, Vol.31, PP.1607-1617.
Kamelbasmanj B, MirJafari B and Seiedali A (2013) Evaluation of seismic vulnerability of in the region of Tabriz using a multi-criteria analysis, spatial planning and Humanities teacher preparation room, No. 2, pp. 121-140.
Abedini & Sarmasti 45
Karimzadeh S, Miyajima M, Hassanzadeh, R, Amiraslanzadeh R and Kamel B (2014) A GIS-based seismic hazard, building vulnerability and casualties assessment for the earthquake scenario in Tabriz, Soil Dynamics and Earthquake Engineering, Vol.66, PP.263-280.
Lantada N Pujades LG and Barbat HA (2009) Vulnerability index and capacity spectrum based methods for urban seismic risk evaluation, Nat Hazards, Vol.51, PP. 501-524.
Mogimi E (2009) urban geomorphology, Fourth Edition, Tehran, Tehran University Press.
Mansouri B Nourjou R and Hosseini KA (2008) Comprehensive GIS-Based solution for road blockage due to seismic building collapse in Tehran, the 14th World Conference Earthquake Engineering, October 12-17, Beijing, China, PP. 1-6.
Maleki S and Movadat E (2013) Evaluation of seismic vulnerability of urban range based on the severity scenarios using models µD, TOPSIS, GIS (Case Study: Yazd), geography and environmental hazards, No. 5, PP. 127-142.
Nowroozi AA and Mohajer A (1987) Observed and probable Intensity zoning of Iran, Tectonophysics, PP.21-30.
Nowroozi AA (1985) Empirical relations between magnitude and fault parameters for earthquakes in Iran, Bull SeismolSoc Am, PP.1327-38.
Sadatriazirad Z Kinezad A and Qmioili J (2008) Review Seismicity in Noshahr and determine potential areas of high risk, Journal of the Earth, No. 4, pp. 77-89.
Safari H.O. Pirasteh S, Pradhan B. and Gharibvand L.K. (2010) Use of remote sensing data and GIS tools for seismic hazard assessment for shallow oilfields and its impact on the settlements at Masjed-i-Soleiman area, Zagros Mountains, Iran,Open Access Remote Sensing, Vol.2, PP.1367-1377.
Valizadehkamran K (2005) Second phase of decentralized management of natural disasters province Computer Consulting Engineers Co. Bandyshan December, pp. 1-28.
Yachk M (2005) GIS and multi criteria decision analysis, translation and gave great pious Ghafarigilandeh Ata, printing, Tehran research organization and editing books of Social Sciences (right).
Zare M (2000) Risk of earthquakes and the construction of the North Tabriz fault and Privacy Policy faulting earthquake Iranian, Journal of Seismology and Earthquake Engineering, No. 2 and No. 3, pp. 46-57.
Zahra'i S.M. and Lili E. (2004) evaluate the seismic vulnerability of buildings in the city of Qazvin, College of Engineering, Volume 39, No. 3, pp. 287-297.