Embed Size (px)
Citation preview
INTERNATIONAL SYMPOSIUM ON “GEODETIC, PHOTOGRAMMETRIC AND SATELLITE TECHNOLOGIES - DEVELOPMENT AND INTEGRATED APPLICATIONS”
Sofia, 08 - 09 November 2001
Semi-automatic 3D building reconstruction using Softplotter
Maarten Vermeij and Siyka Zlatanova
Abstract An increasing number of applications need 3D models in the last few years, e.g. telecommunications, city planning and management, environmental monitoring. Among the issues related to building and maintaining 3D models, 3D reconstruction of man-made objects is the research area attracting most of the attention. Bearing in mind the amount of manual work required, many researchers concentrate on automatic methods for 3D reconstruction basically from imagery (aerial or terrestrial). Despite encouraging results reported in the literature, a limited number of man-made objects are successfully reconstructed using fully automatic approaches. In this paper, we concentrate on a semi-automatic method. The paper presents a procedure for reconstructing buildings using aerial stereo-models and a Digital Terrain Model (DTM). The procedure is based on manual digitising of skeletal points of building roofs in the digital photogrammetric station Softplotter and further automatic computation of the complete shape of the building. The focus is on the extension of the software for automatic 3D reconstruction in order to assemble it with Softplotter. The paper presents the reconstruction procedure, discusses the necessary modifications and finishes with conclusions on the applicability and usability of the approach for the reconstruction of different building shapes.
1 Introduction Approaches for 3D reconstruction of man-made objects is one of the most fertile areas of research and software development in the last several years. A variety of approaches utilising different data sources, tools and techniques have been presented in the literature. Among all, the focus is on automatic methods for reconstruction from aerial images. The complexity of 3D shapes in the real world varies in such large extends that makes difficult and often impossible to apply fully automatic methods to all kinds of shapes. We concentrate on a semi-automatic procedure that requires manual digitising of minimal set of roof points and further fully automatic reconstruction of the 3D shape. The procedure is based on stereo-models and a Digital Terrain Model (DTM). The manual part of this process consists of measuring the corners of the roof outline of buildings. The automated part involves projection of the measured points onto a DTM and constructing the various faces of the model. A similar approach is described by A. Grün and X. Wang in [1]. Their approach utilises point clouds to reconstruct roofs. The order in which the points belonging to one roof are measured is not important for this procedure. The measurements themselves have to be done manually. Using an automated classification process a suitable model for a roof is selected from a library containing various possible roof models. Once the roof has been modelled the faces of the building can be reconstructed by projection onto a DTM, which is similar to the approach presented in this paper. A different approach is the reconstructing of buildings using predefined CAD models for the various parts that make up a building. Such an approach is described by A. Streilein in [8]. A human operator approximates parts of a building with a predefined geometric topology. This topology is then matched to image data of multiple images, by a photogrammetric algorithm.

The initial procedure and the 3D modelling-software described in this paper have been developed at the International Institute for Aerospace Survey and Earth Sciences (ITC) in Enschede, the Netherlands (see [6], [11]). We have modified and extended the software in order to assemble it with the digital photogrammetric station Softplotter. The paper begins with a description of the procedure for the reconstruction. After that an elaborated discussion on the extensions and test of the procedure follows. The paper finishes with conclusions on the applicability of the procedure for large reconstruction works. 2 The reconstruction procedure The procedure has been developed to reduce the amount of manual labour necessary for reconstructing three-dimensional building-models. This reduction is achieved by measuring a limited number of points (e.g. corners of the roofs) of buildings. The co-ordinates of the footprints of the buildings are calculated by projecting the measured points onto a DTM. The manual measurements of the points assure that both 1) the correct points are considered and 2) they are measured accurately. This comes in contrast to fully automatic procedures that may have trouble identifying the appropriate points for reconstruction. Furthermore the operator can indicate some semantic information such as usage of building (educational, administrative, commercial etc.), which can be used in a GIS. The manual measurements allow certain rules for digitising to be specified that facilitate the process of data structuring, i.e. permits organisation of the reconstructed objects in a topological data structure, which can be used for various analyses. Using the manual measurements, in-hose software automatically reconstructs the complete shape of the 3D objects and organises them in a topological model. The procedure can be used for the reconstruction of different 3D objects, i.e. building, surfaces, lampposts, etc. In this paper we concentrate on buildings with flat roof. 2.1 3D reconstruction of buildings with flat roofs
The procedure begins with manual measurement of all the corners composing the flat roof. The measurements of the corners are done using a stereo-model, which contains the buildings to be modelled. This way, three-dimensional co-ordinates of these corners become available. The points are connected with lines that represent the top face of the building. The roof-outline is stored as a polygon, which contains all the corners of the roof. Next, the ground co-ordinates of these points (i.e. footprint of the building) have to be calculated. This is done by projecting the points on a DTM of the underlying terrain (see Figure 1). The method assumes buildings without overhanging roofs. The points are therefore projected vertically onto the DTM. Theoretically, the procedure does not have requirements for the DTM representation, i.e. it can be both grid and Triangular Irregular Network (TIN). Currently, the 3D modelling software utilises a TIN structure. The set of points, which is acquired through the measurements, and the corresponding projection on the terrain, does not provide a complete 3D model. The walls of the buildings are still to be created and organised in an appropriate data structure. This step is completed by an automatic 3D reconstruction procedure (i.e. Phem [16]). The procedure relies on the order in which the roof points are measured. Therefore the direction of digitising is strictly specified, i.e. anti clockwise. This way, the normal vector to roof facets and all the walls is orientated outwards (see Figure 2). The walls are constructed using both sets of points, i.e. measured points in the correct order and terrain points obtained from the projection of measured points onto the DTM. The final reconstructed model consists of a set of oriented faces (see Figure 3). The orientation of the faces is important for at least two reasons. One of them is 3D visualisation. If a face is orientated incorrectly, it may appear invisible in certain viewpoints in the 3D viewer. Indeed, this depends on the functionality of the utilised visualisation engine. Some of the engines provided

options for double-sided rendering, which is a way to tackle incorrect oriented faces. However, the real time navigation using this option is relatively slow and therefore has to be avoided. Another use of the orientation is volume-calculations for which it is important to know which is the inside of a body and what the outside.
Figure 1: Projecting of a measure onto TIN
Figure 2 The order of the points in the polygon
determines the orientation, i. e. which side is visible
2.2 Reconstruction of complex buildings with flat roofs
The reconstruction steps explained above can be easily extended for reconstructing more complex buildings with flat roofs. Suppose the roof of a building contains a specific type of additional constructions (e.g. a second part, which walls do not reach the terrain), these can be modelled in the same way as the main roof. The difference is that the measured points are not projected onto the DTM but onto the underlying roof. This is shown in the left part of Figure 3. To make this possible, a “small” DTM has to be made of this roof. Then the procedure is identical to the procedure described above. The measured points are projected onto the underlying DTM, which in this case is the lower roof, and all the faces are reconstructed. The model of the entire building is then assembled from the various sub-models. The result of this extend procedure is visualised in Figure 4. As seen in Figure 4 additional step (i.e. projection on a supplementary DTM) would not influence the visualisation of the complete 3D model (i.e. together with the lower part). The upper part can be projected onto the ground as well. While unproblematic for visualisation of shaded models, this technique may cause troubles in other cases. For example if textures, like photographs of the building, are to be visualised on the faces, they might appear stretched or incorrectly placed. Another problem could be the inconsistency in metric calculations, i.e. incorrect calculation of the volume of a building. Buildings with more complex roofs (i.e. gable roofs, star roofs) are discussed in [6].
Figure 3: The building is reconstructed as a set of oriented faces.

Figure 4: Left: Projection of additional construction onto the bottom; Right: Projection onto the lower roof; Middle: The final visualisation might not show the difference.
2.3 3D data structure and 3D visualisation
The relationships established among the points and the faces are organised in a 3D topological model (see [6], [10], [11]). The 3D topological model used (i.e. 3D FDS) is a typical example of so-called boundary representation, i.e. it maintains arcs, nodes and faces to store the shape of an object (see [5] for further details). Using this model, faces are described by a sequence of oriented arcs. The order in which the arcs are recorded determines which side of the face is orientated towards the inside of the building and which side to the outside, as is visualised in Figure 2. VRML (i.e. Virtual Reality Modelling Language, see [12]) is used to visualise the reconstructed objects. This file format has been designed for visualisation, navigation through and exploration of three-dimensional models on the Internet. It is also intended to be used as a universal exchange format for three-dimensional models. Models, which are represented in this language, can be viewed on any computer-monitor by web-browsers (e.g. Netscape, Microsoft Explorer) extended with virtual reality plug-ins (e.g. Cosmo Player, Cortona) or by stand-alone applications (e.g. Glview). Using such browsers, users can navigate through the 3D model in nearly real time, which improves the perception and facilitates the understanding of the visualised data. More information about VRML and VRML browsers can be found at the web site of the 3D Web consortium (see [13]). The VRML file is created during the process of reconstruction for the currently modelled object. The operator can view the object prior its storage in the database and, consequently, can control the shape of the object. If the visual examination shows incorrect reconstruction, the measurements or the reconstruction procedure can be repeated.
3 Case study The procedure described above and the corresponding software were originally developed for the digital photogrammetric program LH SocetSet and the CAD editor Microstation. As mentioned before, the focus in the case study is on adapting and extending the procedure for the digital photogrammetric program Softplotter (see [7], [14]). The adaptation of the procedure follows two basic directions: • finding tools in Softplotter for measuring roof points and exporting them in an appropriate format
to the reconstruction software, and • modifying the 3D reconstruction software in order to process the data from Softplotter. 3.1 Measuring with KDMS
The measurements needed for the reconstruction were done using the KDMS tool of the Softplotter photogrammetric software package (see [3], [4]). This is an implementation of the KORK Digital Mapping System within Softplotter. This tool is designed to allow the user to collect geographic data

from various image sources, in this case from digital stereo-images. The collected data is stored as 3D vectors, i.e. lines and polygons. The tool supplies the user with several different options to measure and classify an object. The user selects from a list of available macros the one that mostly suits the object to be digitised and classified. A macro is a set of instructions to the digitising program that allows certain options to be specified when measuring the object, such as the classification code, type of the line connecting points, colour, type of visualisation etc. There are macros for three main groups of objects, i.e. building, water and road. Different macros visualise the digitised objects with different colour and type of line. For example, if choosing the water tool, the user will see the points connected with a blue, continuous line, without rectangular edges. Several building shapes are provided within the building macros supplied with the KDMS tool, i.e. Silo, 4pt_Squared_Strs_&_Land, 3pt_Squared_Stairs, Ortho_Building, Bldg_w/_Azimuth and Building. Although these macros are listed in the manuals with some comments in the code, no information is available about why a certain macro is specifically designed for modelling the objects as it is indicated by the macro name. Unfortunately, none of these macros lead to the result we need. Depending on the shape used, several different problems are encountered. The following comments are referring to the macro Building, which seemed the most obvious one to use.
Figure 5: Left, the available macro’s in the KDMS tool prevents an accurate measuring of curved roofs. Right, the adapted macro’s allows curved roof to be measured precisely
The first problem is related to digitising buildings with curved roofs. These are simplified in such a way that results in loss of points and consequently in loss of details (see Figure 5, left). This simplification is caused by an option in the macro that is intended for use on rectangular buildings (see [3], [4], [7]). It changes almost right angles in exactly right angles. It also deletes points on lines to make more straight lines. For most buildings this option can be useful, however two of the buildings to be reconstructed have mainly curved faces. The Building macro is therefore altered to prevent the simplification when it is not needed (see Figure 5, right). The second one is related to the export of the data from SoftPlotter. Once the buildings have been measured the data has to be exported in order to be used in other programs. The 3D modelling software requires the buildings to be supplied as separated objects. Unfortunately, the standard export-function of Softplotter exports all buildings as one large set containing all the measured points, when the points are digitised using the Building macro. All the tests concerning the export from other macros (i.e. water and road) also failed. For example, the export function of Water objects saves the measured polygons as separated objects, but a problem with the digitising exists. The polygon is closed automatically before the complete outline is measured. Since the classification of the objects is not important for the modelling programs (only buildings are to be measured), we adopt a simple approach. We modify the macros for the measurement of buildings in such a way that the object is classified as being water (see Table 1). When exported, the objects are saved as separated polygons, ready for use in the modelling program. Indeed, other possibilities might

be found, but the one used in our approach requires minimum changes in the macros and thus knowledge about the export-function of the KDMS tool.
Table 1: Modifications made to the Building macro to allow measurements of curved buildings and provide suitable output for the reconstruction program
Original macro Adapted macro 2000 Building 2000X BuildingWater_WoS
$ {Call setup macro} … F-CODE 2000 {Set perm feature code} .T. SQUARE 3.0 {Turn on squaring} .T. STR-CLS {Turn on string close} S-COLL {Turn on string collection} … $$ {End of macro
definition}
$ {Call setup macro} … F-CODE 3100 {CHANGED Set perm
feature code, this is the feature code of lake shore}
.F. SQUARE {Turn off squaring}
.T. STR-CLS {Turn on string close}
S-COLL {Turn on string collection}
… $$ {End of macro definition}
3.2 3D reconstruction
In order to provide appropriate data to the reconstruction software, a supplementary module is developed. It uses the DXF file containing the measurements obtained with the adapted macro. The module reads and parses the DXF file is such a way to separate the data of the individual buildings. Further modifications are not introduced, i.e. the original program Phem creates the walls, ensures the orientation of the faces and records the building in the topological model.
Figure 6: Left: The modelled buildings are highlighted; Right: The final model with the unconstrained TIN
3.3 Advantages and disadvantages
Having the procedure running on SoftPlotter, we have reconstructed several buildings of the University campus, the Delft University of Technology, the Netherlands. The modelled buildings include the post office (round building) at the Mekelweg street and large parts of the Department of Applied Physic and parts of the Faculty of Mechanical Engineering and Marine Technology. The reconstructed buildings are given with light colour on the topographic map (see Figure 6, left). A snapshot from VRML browser with the obtained 3D model can be seen on Figure 6, right.

The DTM used in this test, is based on data obtained through airborne laser-altimetry. The laser-altimetry data is filtered for non-terrain points and then converted to TIN (using [15]). As a result of the filtering, all the laser points reflected from trees, buildings, cars, etc. are rejected from the data set. TIN created in such way can be successfully used with the modelling software. Details on the procedures for filtering and conversion to TIN can be found in [9]. At later stage, digital data from the 2D topographic map of the Netherlands were obtained, which allowed some terrain objects (e.g. streets, parking lots and bicycle paths) to be incorporated in the TIN (see Figure 7, left).
Figure 7: Left: Constrained TIN, using, among others, roadsides as constraints; Right: Unconstrained TIN (Delaney triangulation).
The work with procedure has showed the following two major advantages: • Reconstruction of 3D buildings in relatively short time. A significant benefit of the procedure is
the limited number of required measurements, i.e. one should measure only the roofs of buildings to obtain a complete three-dimensional model. The corners of the roofs are usually clearly visible in aerial photographs, which allows their accurate measurement. The “bottom-corners” of the buildings, often badly visible, are not needed. Further, if the faces are correctly assumed to be vertical, the accuracy of the final model could be as good as a model made by measuring all corners, provided that the accuracy of DTM is in acceptable ranges. During the case study no additional investigation into the quality of the model was performed.
• Lack of gaps between the DTM and the reconstructed models, i.e. the model does not “fly” above or “sink” in the DTM. Since the roof points are projected onto the DTM, all the footprints are part of faces of the terrain. It is still possible to have gaps between the bottom faces of the buildings and the DTM, but a re-triangulation of the TIN with the bottom face as a constraint eliminates them (see Figure 7, left).
The most significant disadvantages are discussed bellow:
• Occluded roof points. Examples of such points are lean-over roofs and buildings with constructions on the roof that are located at the edge of the roof.
• Connection between different parts of a building-complex. Often the roofs of the various parts are located at different heights. This problem occurs when more than one height has to be measured at the same x, y position. The lower corners might then be occluded by the higher part. This can be the case in one or both of the photographs of the used stereo-model. If a corner is visible in only one photo, it is impossible to determine the height of that point directly. This problem can be solved by measuring the height of the roof on a part that is visible in both photographs. This height can than be stored. The corner can be measured in one photograph to acquire the planimetric co-ordinates (x and y). Using the stored height, the position of the point is then known in all three dimensions. Using this information it is even

possible to compute the position of the point in the image where it is not visible directly. Figure 8 gives an illustration of this situation.
• Gaps between the modelled parts of one building. Even if the lower corners at the connection between different parts of the building are visible, they have to be measured very accurately to avoid gaps between the modelled parts. This effect can be increased by the previously described problem with the occlusions. If the operator attempts to solve this problem by measuring the point “inside” the higher part, an overlap between the parts will occur. The complete model might then appear correct, while in fact it is incorrect. Thus a variety of problems might arise, e.g. in case of volume-calculations. Figure 9 portrays both situations.
Figure 8: Example of points, which can only be measured in one photograph of a stereo-model. The indicated corners were measured in the lower photograph. The software calculated their position in the upper photograph.
Figure 9: If the structure on the left is attempted to be modelled, the result will be two parts which either have a gap between them, or there is an overlap between the two.
1
2
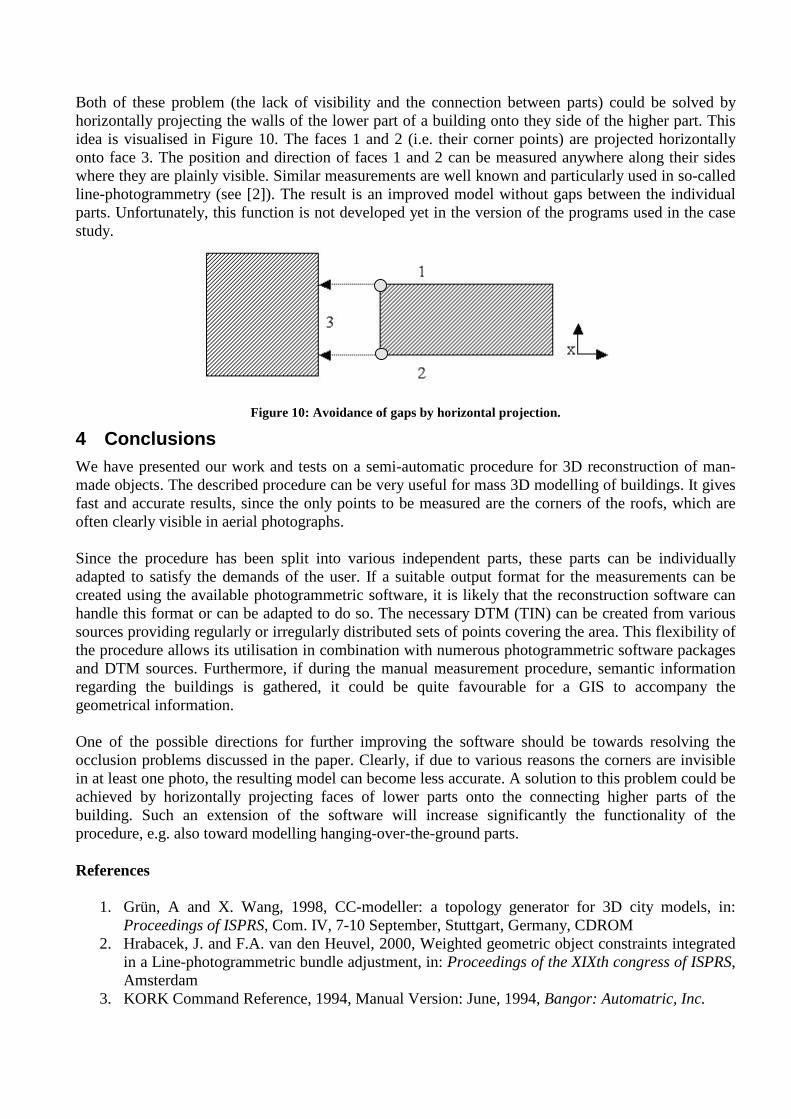
Both of these problem (the lack of visibility and the connection between parts) could be solved by horizontally projecting the walls of the lower part of a building onto they side of the higher part. This idea is visualised in Figure 10. The faces 1 and 2 (i.e. their corner points) are projected horizontally onto face 3. The position and direction of faces 1 and 2 can be measured anywhere along their sides where they are plainly visible. Similar measurements are well known and particularly used in so-called line-photogrammetry (see [2]). The result is an improved model without gaps between the individual parts. Unfortunately, this function is not developed yet in the version of the programs used in the case study.
Figure 10: Avoidance of gaps by horizontal projection.
4 Conclusions We have presented our work and tests on a semi-automatic procedure for 3D reconstruction of man-made objects. The described procedure can be very useful for mass 3D modelling of buildings. It gives fast and accurate results, since the only points to be measured are the corners of the roofs, which are often clearly visible in aerial photographs. Since the procedure has been split into various independent parts, these parts can be individually adapted to satisfy the demands of the user. If a suitable output format for the measurements can be created using the available photogrammetric software, it is likely that the reconstruction software can handle this format or can be adapted to do so. The necessary DTM (TIN) can be created from various sources providing regularly or irregularly distributed sets of points covering the area. This flexibility of the procedure allows its utilisation in combination with numerous photogrammetric software packages and DTM sources. Furthermore, if during the manual measurement procedure, semantic information regarding the buildings is gathered, it could be quite favourable for a GIS to accompany the geometrical information. One of the possible directions for further improving the software should be towards resolving the occlusion problems discussed in the paper. Clearly, if due to various reasons the corners are invisible in at least one photo, the resulting model can become less accurate. A solution to this problem could be achieved by horizontally projecting faces of lower parts onto the connecting higher parts of the building. Such an extension of the software will increase significantly the functionality of the procedure, e.g. also toward modelling hanging-over-the-ground parts. References
1. Grün, A and X. Wang, 1998, CC-modeller: a topology generator for 3D city models, in:
Proceedings of ISPRS, Com. IV, 7-10 September, Stuttgart, Germany, CDROM 2. Hrabacek, J. and F.A. van den Heuvel, 2000, Weighted geometric object constraints integrated
in a Line-photogrammetric bundle adjustment, in: Proceedings of the XIXth congress of ISPRS, Amsterdam
3. KORK Command Reference, 1994, Manual Version: June, 1994, Bangor: Automatric, Inc.

4. KORK User’s Guide, 1994, Manual Version: June, 1994, Bangor: Automatric, Inc. 5. Molenaar, M., 1990, A Formal Data Structure for 3D Vector Maps, Proceedings of EGIS’90,
Vol. 2, Amsterdam, The Netherlands, pp. 770-781 6. Paintsil, J., 1997, 3D Topographic Data By Aerial Photogrammetry, MSc thesis, ITC,
Enschede, The Netherlands 7. Softplotter 2.0 User’s Guide, 1999, Bangor: Automatric, Inc. 8. Streilein, A., 1996, Utilization of CAD models for the object oriented measurement of
industrial and architectural objects, in: International Archives of Photogrammetry and Remote Sensing, Vol. XXI, Part B5, Vienna
9. Vosselman, G., 2000, Slope based filtering of laser altimetry data, International Archives of Photogrammetry and Remote Sensing, XXXIII, B3/2, pp. 935-942
10. Worboys, F., 1998, GIS: A Computing Perspective, Taylor Francis Ltd., London 11. Zlatanova, S., M. Pilouk and K. Tempfli, 1996, Building reconstruction from aerial images
and creation of 3D topologic data structure, in: F.Leberl, R.Kalliany, M.Gruber (eds), Mapping Buildings, Roads and other Man-Made Structures from Images, Proceedings of the IAPR TC-7, 2-3 September, Graz, Austria, pp. 259-274
Websites: 12. VRML97, http://www.vrml.org/Specifications/VRML97/part1/introduction.html 13. 3D Web consortium http://www.web3d.org/ Software: 14. Softplotter 2.0, Autometric Inc. 15. Mkbigtin, ITC, B. Gorte 16. Phem, ITC, J. Paintsil and S. Zlatanova.
Authors: Maarten J. Vermeij Student at the Delft University of Technology, Department of Geodesy Thijsseweg 11, 2629 JA, Delft, The Netherlands E-mail: [email protected], Dr. Eng. Siyka Zlatanova Researcher at the Delft University of Technology, Department of Geodesy Thijsseweg 11, 2629 JA, Delft, The Netherlands Phone +31 15 278 2714, fax +31 15 278 2745 E-mail: [email protected]