Embed Size (px)
Citation preview
BRITISH STANDARD BS ISO 10399:2004
Sensory analysis — Methodology — Duo-trio test
ICS 67.240
���������������� ������������������������������� �������������
Lice
nsed
Cop
y: U
ni o
f Sci
ence
& T
echn
olog
y U
ser,
Uni
vers
ity o
f Sci
ence
& T
ech,
Sat
Sep
17
03:3
1:17
BS
T 2
005,
Unc
ontr
olle
d C
opy,
(c)
BS
I
www.sinofood.com.cn
BS ISO 10399:2004
This British Standard was published under the authority of the Standards Policy and Strategy Committee on 2 July 2004
© BSI 2 July 2004
ISBN 0 580 44008 7
National forewordThis British Standard reproduces verbatim ISO 10399:2004 and implements it as the UK national standard. It supersedes BS 5929-8:1992 which is withdrawn.
The UK participation in its preparation was entrusted to Technical Committee AW/12, Sensory analysis, which has the responsibility to:
A list of organizations represented on this committee can be obtained on request to its secretary.
Cross-references
The British Standards which implement international publications referred to in this document may be found in the BSI Catalogue under the section entitled “International Standards Correspondence Index”, or by using the “Search” facility of the BSI Electronic Catalogue or of British Standards Online.
This publication does not purport to include all the necessary provisions of a contract. Users are responsible for its correct application.
Compliance with a British Standard does not of itself confer immunity from legal obligations.
— aid enquirers to understand the text;
— present to the responsible international/European committee any enquiries on the interpretation, or proposals for change, and keep the UK interests informed;
— monitor related international and European developments and promulgate them in the UK.
Summary of pages
This document comprises a front cover, an inside front cover, the ISO title page, pages ii to iv, pages 1 to 19 and a back cover.
The BSI copyright notice displayed in this document indicates when the document was last issued.
Amendments issued since publication
Amd. No. Date Comments
Lice
nsed
Cop
y: U
ni o
f Sci
ence
& T
echn
olog
y U
ser,
Uni
vers
ity o
f Sci
ence
& T
ech,
Sat
Sep
17
03:3
1:17
BS
T 2
005,
Unc
ontr
olle
d C
opy,
(c)
BS
I
www.sinofood.com.cn
Reference numberISO 10399:2004(E)
NINRETOITALAN ADNATSDR
OSI19930
ceSond deition-400251-60
Sensory analysis — Methodology — Duo-trio test
Analyse sensorielle — Méthodologie — Essai duo-trio
Referecne unbmerOSI 99301002:)E(4
INTERNATIONAL STANDARD
ISO10399
Second edition2004-06-15
rosneSy anlayisteM — sholodogy — ouDoirt- sett
anAlyse ssneroiell— e Métodoholeig — sEsad i-ourtoi
BS ISO 10399:2004
Lice
nsed
Cop
y: U
ni o
f Sci
ence
& T
echn
olog
y U
ser,
Uni
vers
ity o
f Sci
ence
& T
ech,
Sat
Sep
17
03:3
1:17
BS
T 2
005,
Unc
ontr
olle
d C
opy,
(c)
BS
I
www.sinofood.com.cn

ii
BS ISO 10399:2004
Lice
nsed
Cop
y: U
ni o
f Sci
ence
& T
echn
olog
y U
ser,
Uni
vers
ity o
f Sci
ence
& T
ech,
Sat
Sep
17
03:3
1:17
BS
T 2
005,
Unc
ontr
olle
d C
opy,
(c)
BS
I
www.sinofood.com.cn
iii
Contents Page
Foreword............................................................................................................................................................ iv 1 Scope...................................................................................................................................................... 1 2 Normative references ........................................................................................................................... 1 3 Terms and definitions........................................................................................................................... 2 4 Principle ................................................................................................................................................. 2 5 General test conditions and requirements......................................................................................... 3 6 Assessors .............................................................................................................................................. 3 6.1 Qualification .......................................................................................................................................... 3 6.2 Number of assessors............................................................................................................................ 4 7 Procedure............................................................................................................................................... 4 8 Analysis and interpretation of results ................................................................................................ 5 8.1 When testing for a difference .............................................................................................................. 5 8.2 When testing for similarity ................................................................................................................... 5 9 Test report.............................................................................................................................................. 6 10 Precision and bias ................................................................................................................................ 6 Annex A (normative) Tables .............................................................................................................................. 7 Annex B (informative) Examples..................................................................................................................... 12 Bibliography ..................................................................................................................................................... 19
BS ISO 10399:2004
Lice
nsed
Cop
y: U
ni o
f Sci
ence
& T
echn
olog
y U
ser,
Uni
vers
ity o
f Sci
ence
& T
ech,
Sat
Sep
17
03:3
1:17
BS
T 2
005,
Unc
ontr
olle
d C
opy,
(c)
BS
I
www.sinofood.com.cn
iv
Foreword
ISO (the International Organization for Standardization) is a worldwide federation of national standards bodies (ISO member bodies). The work of preparing International Standards is normally carried out through ISO technical committees. Each member body interested in a subject for which a technical committee has been established has the right to be represented on that committee. International organizations, governmental and non-governmental, in liaison with ISO, also take part in the work. ISO collaborates closely with the International Electrotechnical Commission (IEC) on all matters of electrotechnical standardization.
International Standards are drafted in accordance with the rules given in the ISO/IEC Directives, Part 2.
The main task of technical committees is to prepare International Standards. Draft International Standards adopted by the technical committees are circulated to the member bodies for voting. Publication as an International Standard requires approval by at least 75 % of the member bodies casting a vote.
Attention is drawn to the possibility that some of the elements of this document may be the subject of patent rights. ISO shall not be held responsible for identifying any or all such patent rights.
ISO 10399 was prepared by Technical Committee ISO/TC 34, Food products, Subcommittee SC 12, Sensory analysis.
This second edition cancels and replaces the first edition (ISO 10399:1991), which has been technically revised.
BS ISO 10399:2004
Lice
nsed
Cop
y: U
ni o
f Sci
ence
& T
echn
olog
y U
ser,
Uni
vers
ity o
f Sci
ence
& T
ech,
Sat
Sep
17
03:3
1:17
BS
T 2
005,
Unc
ontr
olle
d C
opy,
(c)
BS
I
www.sinofood.com.cn
INTENRATIONAL TSANDADR IS:99301 O4002(E)
1
Sensory analysis — Methodology — Duo-trio test
1 Scope
This International Standard describes a procedure for determining whether a perceptible sensory difference or similarity exists between samples of two products. The method is a forced-choice procedure. The method is applicable whether a difference exists in a single sensory attribute or in several attributes.
The method is statistically less efficient than the triangle test (described in ISO 4120) but is easier to perform by the assessors.
The method is applicable even when the nature of the difference is unknown [i.e. it determines neither the size nor the direction of difference between samples, nor is there any indication of the attribute(s) responsible for the difference]. The method is applicable only if the products are fairly homogeneous.
The method is effective for
a) determining that
either a perceptible difference results (duo-trio testing for difference), or
a perceptible difference does not result (duo-trio testing for similarity) when, for example, a change is made in ingredients, processing, packaging, handling or storage;
b) or for selecting, training and monitoring assessors.
Two forms of the method are described:
the constant-reference technique, used when one product is familiar to the assessors (e.g. a sample from regular production), and
the balanced-reference technique, used when one product is not more familiar than the other.
2 Normative references
The following referenced documents are indispensable for the application of this document. For dated references, only the edition cited applies. For undated references, the latest edition of the referenced document (including any amendments) applies.
ISO 5492:1992, Sensory analysis — Vocabulary
ISO 8589:1988, Sensory analysis — General guidance for the design of test rooms
BS ISO 10399:2004
Lice
nsed
Cop
y: U
ni o
f Sci
ence
& T
echn
olog
y U
ser,
Uni
vers
ity o
f Sci
ence
& T
ech,
Sat
Sep
17
03:3
1:17
BS
T 2
005,
Unc
ontr
olle
d C
opy,
(c)
BS
I
www.sinofood.com.cn
2
3 Terms and definitions
For the purposes of this document, the terms and definitions given in ISO 5492 and the following apply.
3.1 alpha-risk αααα-risk probability of concluding that a perceptible difference exists when one does not
NOTE This is also known as Type I error, significance level or false positive rate.
3.2 beta-risk ββββ-risk probability of concluding that no perceptible difference exists when one does
NOTE This is also known as Type II error or false negative rate.
3.3 difference situation in which samples can be distinguished based on their sensory properties
NOTE The proportion of assessments in which a perceptible difference is detected between the two products is given the symbol pd.
3.4 product material to be evaluated
3.5 sample unit of product prepared, presented and evaluated in the test
3.6 sensitivity general term used to summarize the performance characteristics of the test
NOTE In statistical terms, the sensitivity of the test is defined by the values of α, β and pd.
3.7 similarity situation in which any perceptible differences between the samples are so small that the products can be used interchangeably
3.8 triad those three samples given to an assessor in the duo-trio test
NOTE In the duo-trio test, one sample is labelled as the reference, the other two are marked with different codes. One of the coded samples is the same product as the reference; the other coded sample is the other product in the test.
4 Principle
The number of assessors is chosen based on the sensitivity desired for the test. (See 6.2 and the discussion in A.3.)
Assessors receive a set of three samples (i.e. a triad), one sample of which is labelled as a reference and the other two samples have different codes. The assessors are informed that one of the coded samples is the
BS ISO 10399:2004
Lice
nsed
Cop
y: U
ni o
f Sci
ence
& T
echn
olog
y U
ser,
Uni
vers
ity o
f Sci
ence
& T
ech,
Sat
Sep
17
03:3
1:17
BS
T 2
005,
Unc
ontr
olle
d C
opy,
(c)
BS
I
www.sinofood.com.cn
3
same as the reference and that one is different. Based on their training and the instructions given prior to the test, the assessors report either which of the coded samples they believe to be same as the reference, or which of the coded samples they believe to be different from the reference.
The number of correct responses is counted and the significance is determined by reference to a statistical table.
5 General test conditions and requirements
5.1 Clearly define the test objective in writing.
5.2 Carry out the test under conditions that prevent communication among assessors until all the evaluations have been completed using facilities and booths that comply with ISO 8589.
5.3 Prepare the samples out of sight of the assessors and in an identical manner (i.e. same apparatus, same vessels, same quantity of product).
5.4 Assessors shall not be able to identify the samples from the way in which they are presented. For example, in a taste test, avoid any differences in appearance. Mask any irrelevant colour differences using light filters and/or subdued illumination.
5.5 Code the vessels containing the samples in a uniform manner, preferably using three-digit numbers, chosen at random for each test. Each triad is composed of three samples, one labelled as the reference and two labelled with different codes. Preferably, different codes should be used for each assessor during a session. However, the same two codes may be used for all assessors within a test, provided that each code is used only once per assessor during a test session (e.g., if several duo-trio tests on different products are being conducted in the same session).
5.6 The quantity or volume served shall be identical for the three samples in each triad, just as that of all the other samples in a series of tests on a given type of product. The quantity or volume to be evaluated may be imposed. If it is not, the assessors should be told to take quantities or volumes that are always similar whatever the sample.
5.7 The temperature of the three samples in each triad shall be identical, just as that of all the other samples in a series of tests on a given type of product. It is preferable to present the samples at the temperature at which the product is generally consumed.
5.8 The assessors shall be told whether or not they are to swallow the samples or whether they are free to do as they please. In this latter case, they shall be requested to proceed in the same manner for all samples.
5.9 During the test sessions, avoid giving information about product identity, expected treatment effects, or individual performance until all testing is completed.
6 Assessors
6.1 Qualification
All assessors should possess the same level of qualification, this level being chosen on the basis of the test objective (see ISO 8586-1 and ISO 8586-2 for guidance). Experience and familiarity with the product may improve the performance of an assessor and, therefore, may increase the likelihood of finding a significant difference. Monitoring the performance of assessors over time may be useful for increased sensitivity.
All assessors shall be familiar with the mechanics of the duo-trio test (i.e. the format, task and evaluation procedure).
BS ISO 10399:2004
Lice
nsed
Cop
y: U
ni o
f Sci
ence
& T
echn
olog
y U
ser,
Uni
vers
ity o
f Sci
ence
& T
ech,
Sat
Sep
17
03:3
1:17
BS
T 2
005,
Unc
ontr
olle
d C
opy,
(c)
BS
I
www.sinofood.com.cn
4
6.2 Number of assessors
Choose the number of assessors so as to obtain the sensitivity required for the test (see discussion in A.3). Using large numbers of assessors increases the likelihood of detecting small differences between the products. However, in practice, the number of assessors often is determined by material conditions (e.g. duration of the experiment, number of available assessors, quantity of product). When testing for a difference, typical numbers of assessors are between 32 and 36. When testing for no meaningful difference (i.e. similarity), twice as many assessors (i.e. approximately 72) are needed for equivalent sensitivity.
Avoid replicate evaluations by the same assessor whenever possible. However, if replicate evaluations are needed to produce a sufficient number of total evaluations, every effort should be made to have each assessor perform the same number of replicate evaluations. For example, if only twelve assessors are available, have each assessor evaluate three triads to obtain a total of 36 evaluations.
NOTE Treating three evaluations performed by twelve assessors as 36 independent evaluations is not valid when testing for similarity using Table A.2. However, the test for difference using Table A.1 is valid even when replicate evaluations are performed (see [9] and [10]). Recent publications (see [7] and [8]) on replicated discrimination tests suggest alternative approaches for analysing replicated evaluations in discrimination tests.
7 Procedure
7.1 If the product is familiar to the assessors (e.g. a control sample from the production line), use the constant reference technique. If neither product is more familiar than the other, use the balanced-reference technique
a) Constant-reference technique: Prepare worksheets and scoresheets (see B.2) in advance of the test so as to utilize an equal number of the two possible sequences of two products, A and B:
A-REF AB A-REF BA
Distribute these at random in groups of two among the assessors (i.e. use each sequence once among the first two assessors; use each sequence once again among the next two assessors, etc.) This will minimize the imbalance that results if the total number of assessors is not an even number.
b) Balanced-reference technique: Prepare worksheets and scoresheets (see B.1) in advance of the test so as to utilize an equal number of the four possible sequences of two products, A and B:
A-REF AB A-REF BA
B-REF AB B-REF BA
where the first two triads contain product A as the reference (i.e. A-REF) and the last two triads contain product B as the reference (i.e. B-REF). Distribute these at random in groups of four among the assessors (i.e. use each sequence once among the first group of four assessors; use each sequence once again among the next group of four assessors, etc.). This will minimize the imbalance that results if the total number of assessors is not a multiple of four.
7.2 Present the three samples of each triad simultaneously if possible, following the same spatial arrangement for each assessor (e.g. on a line to be sampled always from left to right, in a triangular array). Within the triad, assessors are generally allowed to make repeated evaluations of each sample as desired (if, of course, the nature of the product allows for repeated evaluations).
7.3 Instruct the assessors to evaluate the reference sample first, then evaluate the two coded samples in the order in which they were presented. Inform the assessors that one of the coded samples is the same as the reference and that one is different from the reference. Instruct the assessors to indicate either which of the two coded samples is the same as the reference, or which of the two coded samples is different from the reference.
BS ISO 10399:2004
Lice
nsed
Cop
y: U
ni o
f Sci
ence
& T
echn
olog
y U
ser,
Uni
vers
ity o
f Sci
ence
& T
ech,
Sat
Sep
17
03:3
1:17
BS
T 2
005,
Unc
ontr
olle
d C
opy,
(c)
BS
I
www.sinofood.com.cn
5
NOTE When deciding whether to instruct the assessors to select the sample that is the same as the reference or to select the sample that is different from the reference, consideration should be given to whether or not the panel routinely uses other discrimination test methods. Many discrimination test methods like the triangle test, for example, focus on identifying the “odd” or “different” sample in the test. Instructing the assessors to identify the “different” sample in one method and to identify the “same” sample in another method may cause confusion and lead to higher levels of incorrect responses.
7.4 Each scoresheet should provide for a single triad of samples. If an assessor is to carry out more than one test in a session, collect the completed scoresheet and unused samples prior to serving the subsequent triad. The assessor shall not go back to any of the previous samples or change the verdict on any previous test.
7.5 Do not ask questions about preference, acceptance or degree of difference after the assessor has made a selection. The selection the assessor has just made may bias the reply to any additional questions. Responses to such questions may be obtained through separate tests for preference, acceptance, degree of difference, etc., see ISO 6658. A comment section asking why the choice was made may be included for the assessor’s remarks.
7.6 The duo-trio test is a forced-choice procedure; assessors are not allowed the option of reporting “no difference”. An assessor who detects no difference between the samples should be instructed to randomly select one of the samples and to indicate that the selection was only a guess in the comments section of the scoresheet.
8 Analysis and interpretation of results
8.1 When testing for a difference
Use Table A.1 to analyse the data obtained from a duo-trio test. If the number of correct responses is greater than or equal to the number given in Table A.1 (corresponding to the number of assessors and the α-risk level chosen for the test), conclude that a perceptible difference exists between the samples (see B.1).
If desired, calculate a confidence interval on the proportion of the population that can distinguish the samples. The method is described in B.3.
8.2 When testing for similarity1)
Use Table A.2 to analyse the data obtained from a duo-trio test. If the number of correct responses is less than or equal to the number given in Table A.2 (corresponding to the number of assessors, the β-risk level and the value of pd chosen for the test), conclude that no meaningful difference exists between the samples (see B.2). If results will be compared from one test to another, then the same value of pd should be chosen for all tests.
If desired, calculate a confidence interval on the proportion of the population that can distinguish the samples. The method is described in B.3.
1) In this International Standard, “similar” does not mean “identical”. Rather, “similar” means that the two products are sufficiently alike to be used interchangeably. It is not possible to prove that two products are identical. However, it can be demonstrated that any difference that does exist between two products is so small as to have no practical significance.
BS ISO 10399:2004
Lice
nsed
Cop
y: U
ni o
f Sci
ence
& T
echn
olog
y U
ser,
Uni
vers
ity o
f Sci
ence
& T
ech,
Sat
Sep
17
03:3
1:17
BS
T 2
005,
Unc
ontr
olle
d C
opy,
(c)
BS
I
www.sinofood.com.cn
6
9 Test report
Report the test objective, the results and the conclusions. The following additional information is recommended:
the purpose of the test and the nature of the treatment studied;
full identification of the samples (i.e. origin, method of preparation, quantity, shape, storage prior to testing, serving size, temperature); sample information should communicate that all storage, handling and preparation was done in such a way as to yield samples that differ only due to the variable of interest, if at all;
the number of assessors, the number of correct responses and the result of the statistical evaluation (including the values of α, β and pd used for the test);
assessors: experience (in sensory testing, with the product, with the samples in the test), age and gender (see ISO 8586-1 and ISO 8586-2 for guidance);
any information and any specific recommendations given to the assessors in connection with the test;
the test environment (i.e test facility used, simultaneous or sequential presentation, if the identity of samples was disclosed after the test, if so, in what manner);
the location, date of the test and name of the panel leader.
10 Precision and bias
Because results of sensory discrimination tests are functions of individual sensitivities, a general statement regarding the reproducibility of results that is applicable to all populations of assessors cannot be made. Precision regarding a particular population of assessors increases as the size of the panel increases and also with training and with exposure to the product.
As a forced-choice procedure is used, results obtained by this method are bias-free, provided that the precautions in Clause 7 are fully observed.
BS ISO 10399:2004
Lice
nsed
Cop
y: U
ni o
f Sci
ence
& T
echn
olog
y U
ser,
Uni
vers
ity o
f Sci
ence
& T
ech,
Sat
Sep
17
03:3
1:17
BS
T 2
005,
Unc
ontr
olle
d C
opy,
(c)
BS
I
www.sinofood.com.cn
7
Annex A (normative)
Tables
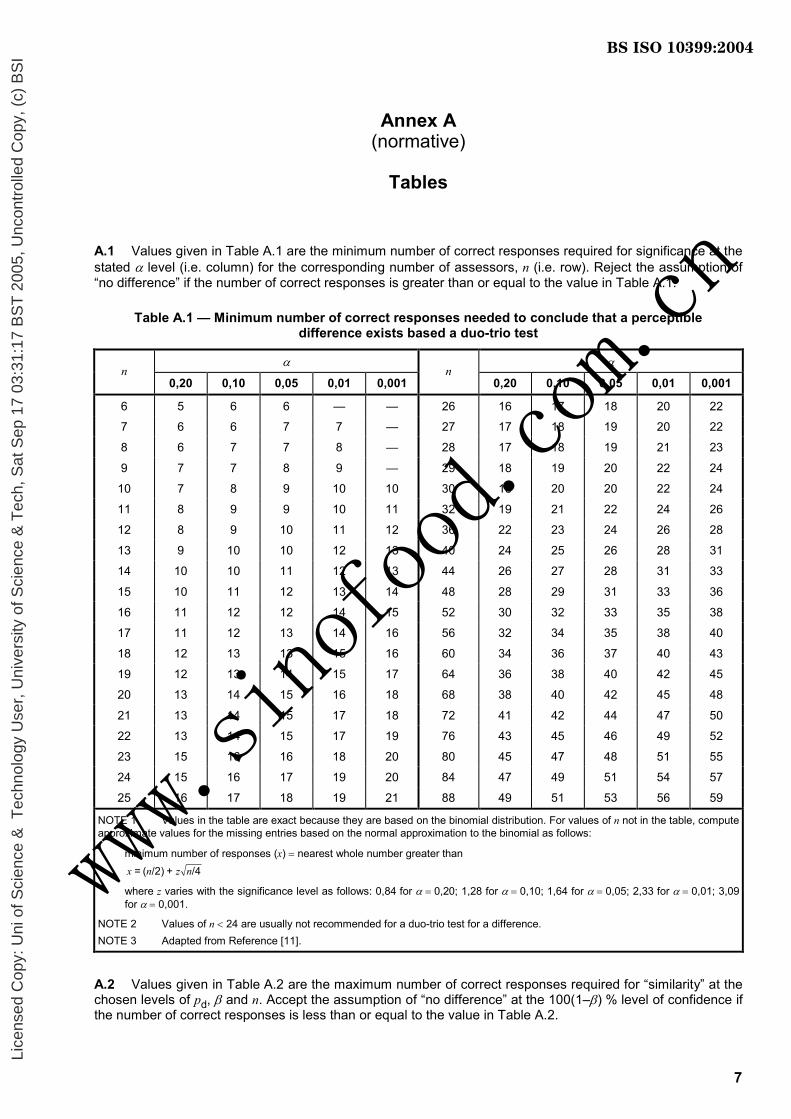
A.1 Values given in Table A.1 are the minimum number of correct responses required for significance at the stated α level (i.e. column) for the corresponding number of assessors, n (i.e. row). Reject the assumption of “no difference” if the number of correct responses is greater than or equal to the value in Table A.1.
Table A.1 — Minimum number of correct responses needed to conclude that a perceptible difference exists based a duo-trio test
α α n
0,20 0,10 0,05 0,01 0,001 n
0,20 0,10 0,05 0,01 0,001
6 5 6 6 — — 26 16 17 18 20 22
7 6 6 7 7 — 27 17 18 19 20 22
8 6 7 7 8 — 28 17 18 19 21 23
9 7 7 8 9 — 29 18 19 20 22 24
10 7 8 9 10 10 30 18 20 20 22 24
11 8 9 9 10 11 32 19 21 22 24 26
12 8 9 10 11 12 36 22 23 24 26 28
13 9 10 10 12 13 40 24 25 26 28 31
14 10 10 11 12 13 44 26 27 28 31 33
15 10 11 12 13 14 48 28 29 31 33 36
16 11 12 12 14 15 52 30 32 33 35 38
17 11 12 13 14 16 56 32 34 35 38 40
18 12 13 13 15 16 60 34 36 37 40 43
19 12 13 14 15 17 64 36 38 40 42 45
20 13 14 15 16 18 68 38 40 42 45 48
21 13 14 15 17 18 72 41 42 44 47 50
22 13 14 15 17 19 76 43 45 46 49 52
23 15 16 16 18 20 80 45 47 48 51 55
24 15 16 17 19 20 84 47 49 51 54 57
25 16 17 18 19 21 88 49 51 53 56 59
NOTE 1 Values in the table are exact because they are based on the binomial distribution. For values of n not in the table, compute approximate values for the missing entries based on the normal approximation to the binomial as follows:
minimum number of responses (x) = nearest whole number greater than = ( /2) + /4x n z n
where z varies with the significance level as follows: 0,84 for α = 0,20; 1,28 for α = 0,10; 1,64 for α = 0,05; 2,33 for α = 0,01; 3,09 for α = 0,001.
NOTE 2 Values of n < 24 are usually not recommended for a duo-trio test for a difference. NOTE 3 Adapted from Reference [11].
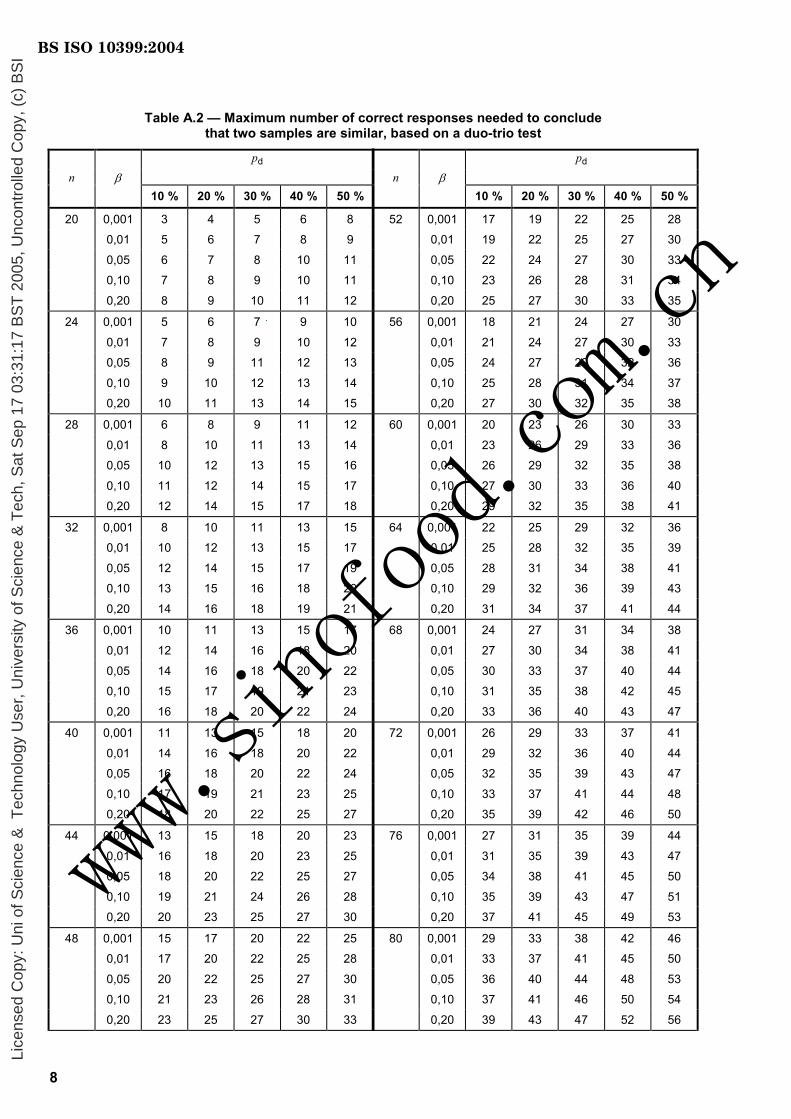
A.2 Values given in Table A.2 are the maximum number of correct responses required for “similarity” at the chosen levels of pd, β and n. Accept the assumption of “no difference” at the 100(1–β) % level of confidence if the number of correct responses is less than or equal to the value in Table A.2.
BS ISO 10399:2004
Lice
nsed
Cop
y: U
ni o
f Sci
ence
& T
echn
olog
y U
ser,
Uni
vers
ity o
f Sci
ence
& T
ech,
Sat
Sep
17
03:3
1:17
BS
T 2
005,
Unc
ontr
olle
d C
opy,
(c)
BS
I
www.sinofood.com.cn
8
Table A.2 — Maximum number of correct responses needed to conclude that two samples are similar, based on a duo-trio test
pd n β 10 % 20 % 30 % 40 % 50 %
20 0,001 3 4 5 6 8 0,01 5 6 7 8 9
0,05 6 7 8 10 11 0,10 7 8 9 10 11
0,20 8 9 10 11 12
24 0,001 5 6 7 9 10
0,01 7 8 9 10 12 0,05 8 9 11 12 13
0,10 9 10 12 13 14 0,20 10 11 13 14 15
28 0,001 6 8 9 11 12
0,01 8 10 11 13 14 0,05 10 12 13 15 16
0,10 11 12 14 15 17 0,20 12 14 15 17 18
32 0,001 8 10 11 13 15 0,01 10 12 13 15 17
0,05 12 14 15 17 19 0,10 13 15 16 18 20
0,20 14 16 18 19 21
36 0,001 10 11 13 15 17
0,01 12 14 16 18 20
0,05 14 16 18 20 22 0,10 15 17 19 21 23
0,20 16 18 20 22 24
40 0,001 11 13 15 18 20
0,01 14 16 18 20 22 0,05 16 18 20 22 24
0,10 17 19 21 23 25 0,20 18 20 22 25 27
44 0,001 13 15 18 20 23
0,01 16 18 20 23 25 0,05 18 20 22 25 27
0,10 19 21 24 26 28 0,20 20 23 25 27 30
48 0,001 15 17 20 22 25 0,01 17 20 22 25 28
0,05 20 22 25 27 30 0,10 21 23 26 28 31
0,20 23 25 27 30 33
pd n β 10 % 20 % 30 % 40 % 50 %
52 0,001 17 19 22 25 28 0,01 19 22 25 27 30
0,05 22 24 27 30 33 0,10 23 26 28 31 34
0,20 25 27 30 33 35
56 0,001 18 21 24 27 30
0,01 21 24 27 30 33 0,05 24 27 29 32 36
0,10 25 28 31 34 37 0,20 27 30 32 35 38
60 0,001 20 23 26 30 33
0,01 23 26 29 33 36 0,05 26 29 32 35 38
0,10 27 30 33 36 40 0,20 29 32 35 38 41
64 0,001 22 25 29 32 36 0,01 25 28 32 35 39
0,05 28 31 34 38 41 0,10 29 32 36 39 43
0,20 31 34 37 41 44
68 0,001 24 27 31 34 38
0,01 27 30 34 38 41
0,05 30 33 37 40 44 0,10 31 35 38 42 45
0,20 33 36 40 43 47
72 0,001 26 29 33 37 41
0,01 29 32 36 40 44 0,05 32 35 39 43 47
0,10 33 37 41 44 48 0,20 35 39 42 46 50
76 0,001 27 31 35 39 44
0,01 31 35 39 43 47 0,05 34 38 41 45 50
0,10 35 39 43 47 51 0,20 37 41 45 49 53
80 0,001 29 33 38 42 46 0,01 33 37 41 45 50
0,05 36 40 44 48 53 0,10 37 41 46 50 54
0,20 39 43 47 52 56
BS ISO 10399:2004
Lice
nsed
Cop
y: U
ni o
f Sci
ence
& T
echn
olog
y U
ser,
Uni
vers
ity o
f Sci
ence
& T
ech,
Sat
Sep
17
03:3
1:17
BS
T 2
005,
Unc
ontr
olle
d C
opy,
(c)
BS
I
www.sinofood.com.cn
9
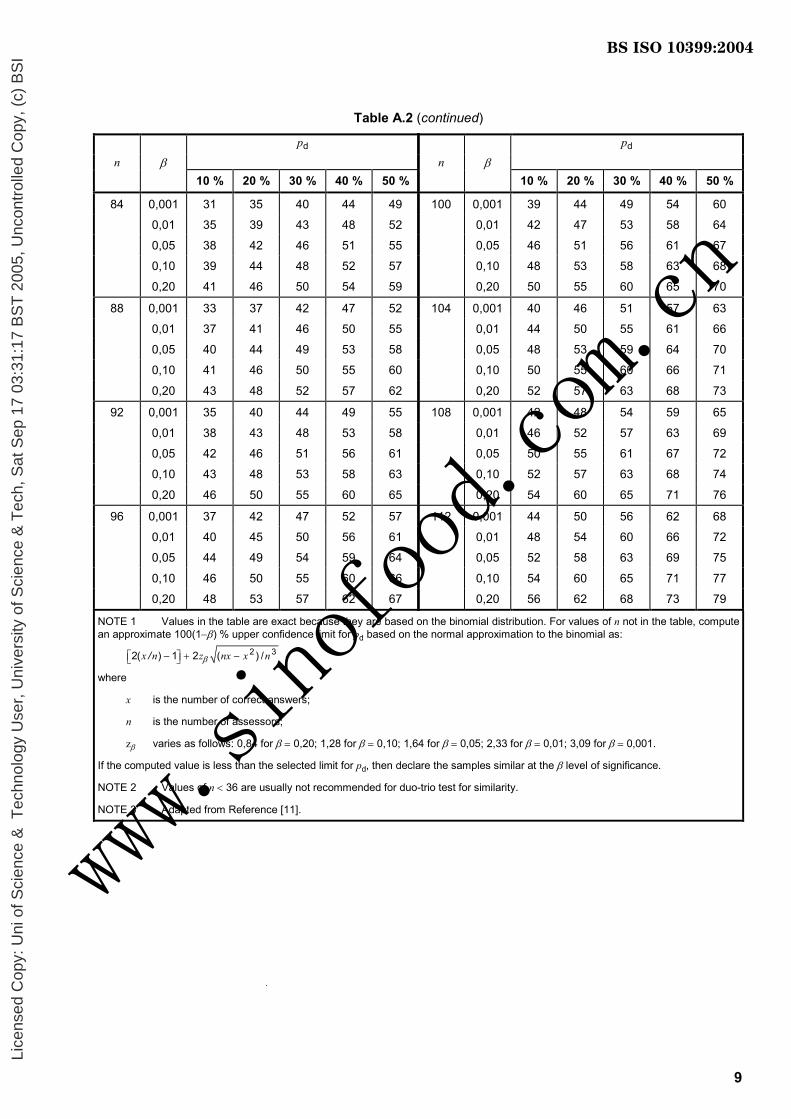
Table A.2 (continued)
pd n β 10 % 20 % 30 % 40 % 50 %
84 0,001 31 35 40 44 49
0,01 35 39 43 48 52
0,05 38 42 46 51 55
0,10 39 44 48 52 57
0,20 41 46 50 54 59
88 0,001 33 37 42 47 52
0,01 37 41 46 50 55
0,05 40 44 49 53 58
0,10 41 46 50 55 60
0,20 43 48 52 57 62
92 0,001 35 40 44 49 55
0,01 38 43 48 53 58
0,05 42 46 51 56 61
0,10 43 48 53 58 63
0,20 46 50 55 60 65
96 0,001 37 42 47 52 57
0,01 40 45 50 56 61
0,05 44 49 54 59 64
0,10 46 50 55 60 66
0,20 48 53 57 62 67
pd n β 10 % 20 % 30 % 40 % 50 %
100 0,001 39 44 49 54 60
0,01 42 47 53 58 64
0,05 46 51 56 61 67
0,10 48 53 58 63 68
0,20 50 55 60 65 70
104 0,001 40 46 51 57 63
0,01 44 50 55 61 66
0,05 48 53 59 64 70
0,10 50 55 60 66 71
0,20 52 57 63 68 73
108 0,001 42 48 54 59 65
0,01 46 52 57 63 69
0,05 50 55 61 67 72
0,10 52 57 63 68 74
0,20 54 60 65 71 76
112 0,001 44 50 56 62 68
0,01 48 54 60 66 72
0,05 52 58 63 69 75
0,10 54 60 65 71 77
0,20 56 62 68 73 79
NOTE 1 Values in the table are exact because they are based on the binomial distribution. For values of n not in the table, compute an approximate 100(1−β) % upper confidence limit for pd based on the normal approximation to the binomial as:
2 32( ) 1 2 ( ) /x n z nx x nβ− + − /
where
x is the number of correct answers;
n is the number of assessors;
zβ varies as follows: 0,84 for β = 0,20; 1,28 for β = 0,10; 1,64 for β = 0,05; 2,33 for β = 0,01; 3,09 for β = 0,001.
If the computed value is less than the selected limit for pd, then declare the samples similar at the β level of significance.
NOTE 2 Values of n < 36 are usually not recommended for duo-trio test for similarity.
NOTE 3 Adapted from Reference [11].
BS ISO 10399:2004
Lice
nsed
Cop
y: U
ni o
f Sci
ence
& T
echn
olog
y U
ser,
Uni
vers
ity o
f Sci
ence
& T
ech,
Sat
Sep
17
03:3
1:17
BS
T 2
005,
Unc
ontr
olle
d C
opy,
(c)
BS
I
www.sinofood.com.cn
10
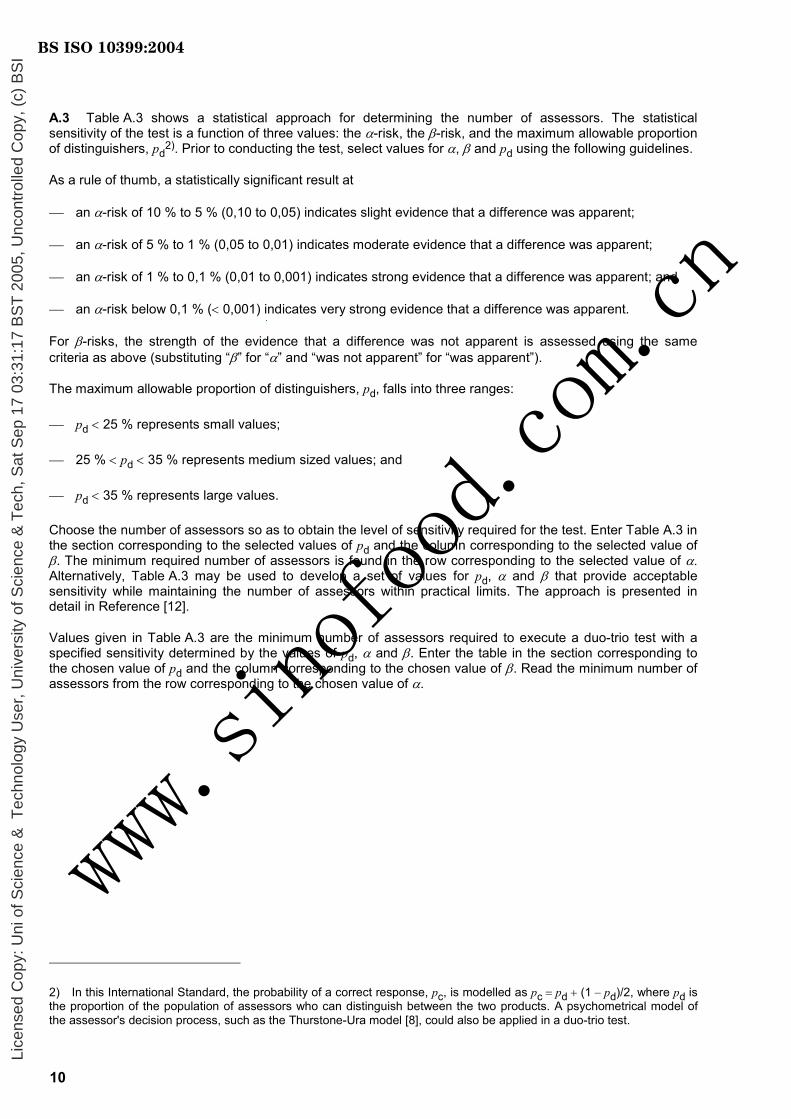
A.3 Table A.3 shows a statistical approach for determining the number of assessors. The statistical sensitivity of the test is a function of three values: the α-risk, the β-risk, and the maximum allowable proportion of distinguishers, pd
2). Prior to conducting the test, select values for α, β and pd using the following guidelines.
As a rule of thumb, a statistically significant result at
an α-risk of 10 % to 5 % (0,10 to 0,05) indicates slight evidence that a difference was apparent;
an α-risk of 5 % to 1 % (0,05 to 0,01) indicates moderate evidence that a difference was apparent;
an α-risk of 1 % to 0,1 % (0,01 to 0,001) indicates strong evidence that a difference was apparent; and
an α-risk below 0,1 % (< 0,001) indicates very strong evidence that a difference was apparent.
For β-risks, the strength of the evidence that a difference was not apparent is assessed using the same criteria as above (substituting “β” for “α” and “was not apparent” for “was apparent”).
The maximum allowable proportion of distinguishers, pd, falls into three ranges:
pd < 25 % represents small values;
25 % < pd < 35 % represents medium sized values; and
pd < 35 % represents large values.
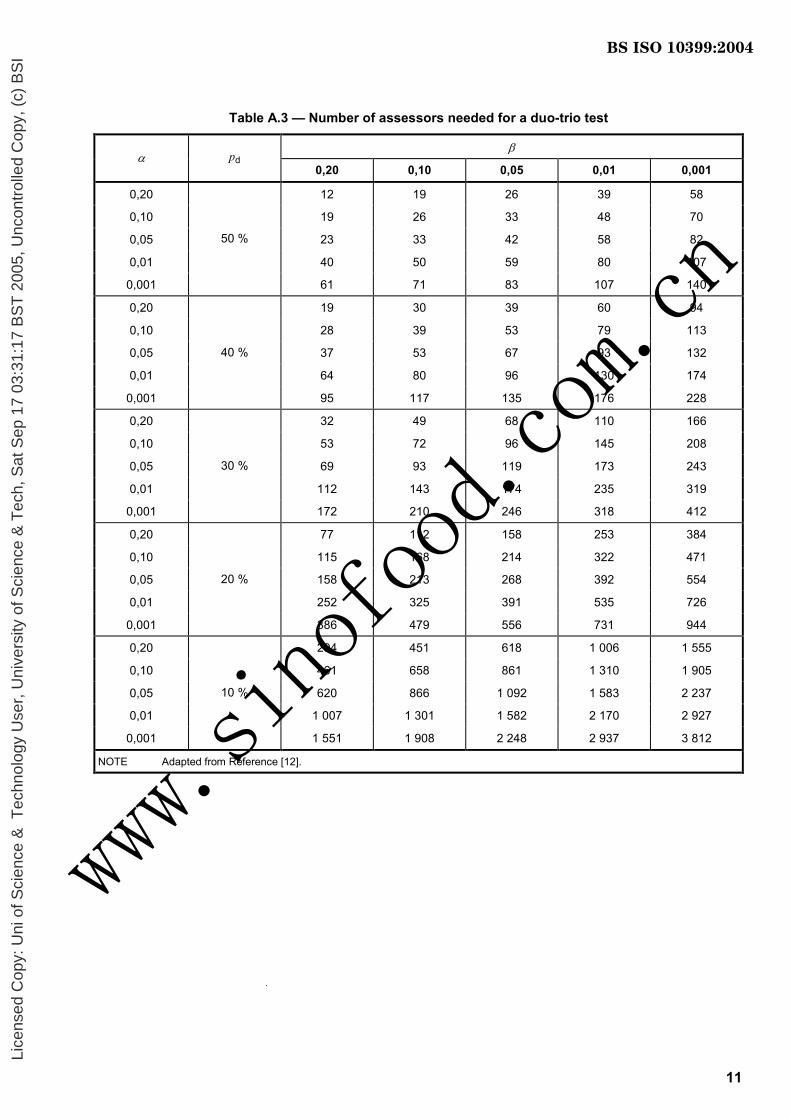
Choose the number of assessors so as to obtain the level of sensitivity required for the test. Enter Table A.3 in the section corresponding to the selected values of pd and the column corresponding to the selected value of β. The minimum required number of assessors is found in the row corresponding to the selected value of α. Alternatively, Table A.3 may be used to develop a set of values for pd, α and β that provide acceptable sensitivity while maintaining the number of assessors within practical limits. The approach is presented in detail in Reference [12].
Values given in Table A.3 are the minimum number of assessors required to execute a duo-trio test with a specified sensitivity determined by the values of pd, α and β. Enter the table in the section corresponding to the chosen value of pd and the column corresponding to the chosen value of β. Read the minimum number of assessors from the row corresponding to the chosen value of α.
2) In this International Standard, the probability of a correct response, pc, is modelled as pc = pd + (1 − pd)/2, where pd is the proportion of the population of assessors who can distinguish between the two products. A psychometrical model of the assessor's decision process, such as the Thurstone-Ura model [8], could also be applied in a duo-trio test.
BS ISO 10399:2004
Lice
nsed
Cop
y: U
ni o
f Sci
ence
& T
echn
olog
y U
ser,
Uni
vers
ity o
f Sci
ence
& T
ech,
Sat
Sep
17
03:3
1:17
BS
T 2
005,
Unc
ontr
olle
d C
opy,
(c)
BS
I
www.sinofood.com.cn
11
Table A.3 — Number of assessors needed for a duo-trio test
β α pd
0,20 0,10 0,05 0,01 0,001
0,20 12 19 26 39 58
0,10 19 26 33 48 70
0,05 23 33 42 58 82
0,01 40 50 59 80 107
0,001
50 %
61 71 83 107 140
0,20 19 30 39 60 94
0,10 28 39 53 79 113
0,05 37 53 67 93 132
0,01 64 80 96 130 174
0,001
40 %
95 117 135 176 228
0,20 32 49 68 110 166
0,10 53 72 96 145 208
0,05 69 93 119 173 243
0,01 112 143 174 235 319
0,001
30 %
172 210 246 318 412
0,20 77 112 158 253 384
0,10 115 168 214 322 471
0,05 158 213 268 392 554
0,01 252 325 391 535 726
0,001
20 %
386 479 556 731 944
0,20 294 451 618 1 006 1 555
0,10 461 658 861 1 310 1 905
0,05 620 866 1 092 1 583 2 237
0,01 1 007 1 301 1 582 2 170 2 927
0,001
10 %
1 551 1 908 2 248 2 937 3 812
NOTE Adapted from Reference [12].
BS ISO 10399:2004
Lice
nsed
Cop
y: U
ni o
f Sci
ence
& T
echn
olog
y U
ser,
Uni
vers
ity o
f Sci
ence
& T
ech,
Sat
Sep
17
03:3
1:17
BS
T 2
005,
Unc
ontr
olle
d C
opy,
(c)
BS
I
www.sinofood.com.cn
12
Annex B (informative)
Examples
B.1 Example 1: Duo-trio test to confirm that a difference exists — Balanced reference technique
B.1.1 Background
A tomato soup manufacturer would like to introduce a new and more costly low-salt formula in the hope of gaining a market advantage. Before submitting it to a consumer test in comparison with the old formula, the company wishes to confirm that the two products can be distinguished sensorially. The duo-trio test in the balanced reference mode is chosen because the complex flavour of the product makes it important that the assessors’ decision process is uncomplicated. The head of production is willing to take only a small chance of concluding that a difference exists when one does not. However, because the old product is still very acceptable, he is willing to accept a greater risk of missing a difference that does exist.
B.1.2 Test objective
The objective is to confirm that the new product (B) can be distinguished from the current product (A) in order to justify testing with consumers.
B.1.3 Number of assessors
To provide the head of production with substantial protection against falsely concluding that a difference exists, the sensory analyst proposes α = 0,01. In order to balance the order of presentation of the samples, the analyst decides to recruit 36 assessors.
B.1.4 Conducting the test
Samples (54 servings of “A” and 54 servings of “B”) are prepared. Of these, 18 “A” samples and 18 “B” samples are labelled as references. The remaining 36 “A” samples and 36 “B” samples are coded with unique random three-digit numbers. The entire collection of samples is then sorted into nine series, each comprising four sets of samples as shown below. The first serving in each set is the reference, designated A-REF or B-REF as the case may be:
A-REF AB B-REF AB
A-REF BA B-REF BA
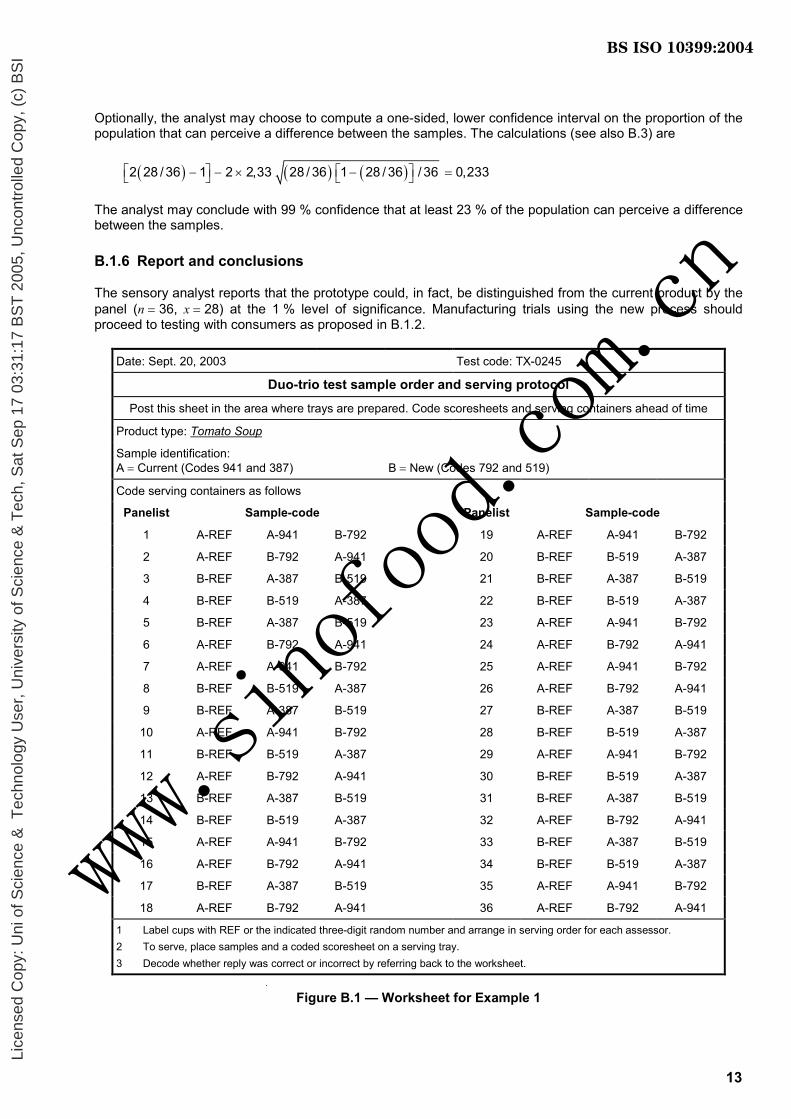
Each of the four triads is presented nine times so as to cover the 36 assessors in a balanced random order. See Figure B.1 for the worksheet. An example of the scoresheet used is shown in Figure B.2.
B.1.5 Analysis and interpretation of results
A total of 28 assessors correctly identify the sample that is the same as the reference. In Table A.1, in the row corresponding to 36 assessors and the column corresponding to α = 0,01, the sensory analyst finds that 26 correct responses are required to conclude that a perceptible difference exists at the α = 0,01. Therefore, 28 correct responses are sufficient to conclude that the two products are perceptibly different.
BS ISO 10399:2004
Lice
nsed
Cop
y: U
ni o
f Sci
ence
& T
echn
olog
y U
ser,
Uni
vers
ity o
f Sci
ence
& T
ech,
Sat
Sep
17
03:3
1:17
BS
T 2
005,
Unc
ontr
olle
d C
opy,
(c)
BS
I
www.sinofood.com.cn
13
Optionally, the analyst may choose to compute a one-sided, lower confidence interval on the proportion of the population that can perceive a difference between the samples. The calculations (see also B.3) are
( ) ( ) ( )2 28 / 36 1 2 2,33 28 / 36 1 28 / 36 / 36 0,233 − − × − =
The analyst may conclude with 99 % confidence that at least 23 % of the population can perceive a difference between the samples.
B.1.6 Report and conclusions
The sensory analyst reports that the prototype could, in fact, be distinguished from the current product by the panel (n = 36, x = 28) at the 1 % level of significance. Manufacturing trials using the new process should proceed to testing with consumers as proposed in B.1.2.
Date: Sept. 20, 2003 Test code: TX-0245
Duo-trio test sample order and serving protocol Post this sheet in the area where trays are prepared. Code scoresheets and serving containers ahead of time
Product type: Tomato Soup
Sample identification: A = Current (Codes 941 and 387)
B = New (Codes 792 and 519)
Code serving containers as follows
Panelist Sample-code Panelist Sample-code
1 A-REF A-941 B-792 19 A-REF A-941 B-792
2 A-REF B-792 A-941 20 B-REF B-519 A-387
3 B-REF A-387 B-519 21 B-REF A-387 B-519
4 B-REF B-519 A-387 22 B-REF B-519 A-387
5 B-REF A-387 B-519 23 A-REF A-941 B-792
6 A-REF B-792 A-941 24 A-REF B-792 A-941
7 A-REF A-941 B-792 25 A-REF A-941 B-792
8 B-REF B-519 A-387 26 A-REF B-792 A-941
9 B-REF A-387 B-519 27 B-REF A-387 B-519
10 A-REF A-941 B-792 28 B-REF B-519 A-387
11 B-REF B-519 A-387 29 A-REF A-941 B-792
12 A-REF B-792 A-941 30 B-REF B-519 A-387
13 B-REF A-387 B-519 31 B-REF A-387 B-519
14 B-REF B-519 A-387 32 A-REF B-792 A-941
15 A-REF A-941 B-792 33 B-REF A-387 B-519
16 A-REF B-792 A-941 34 B-REF B-519 A-387
17 B-REF A-387 B-519 35 A-REF A-941 B-792
18 A-REF B-792 A-941 36 A-REF B-792 A-941
1 Label cups with REF or the indicated three-digit random number and arrange in serving order for each assessor. 2 To serve, place samples and a coded scoresheet on a serving tray. 3 Decode whether reply was correct or incorrect by referring back to the worksheet.
Figure B.1 — Worksheet for Example 1
BS ISO 10399:2004
Lice
nsed
Cop
y: U
ni o
f Sci
ence
& T
echn
olog
y U
ser,
Uni
vers
ity o
f Sci
ence
& T
ech,
Sat
Sep
17
03:3
1:17
BS
T 2
005,
Unc
ontr
olle
d C
opy,
(c)
BS
I
www.sinofood.com.cn
14
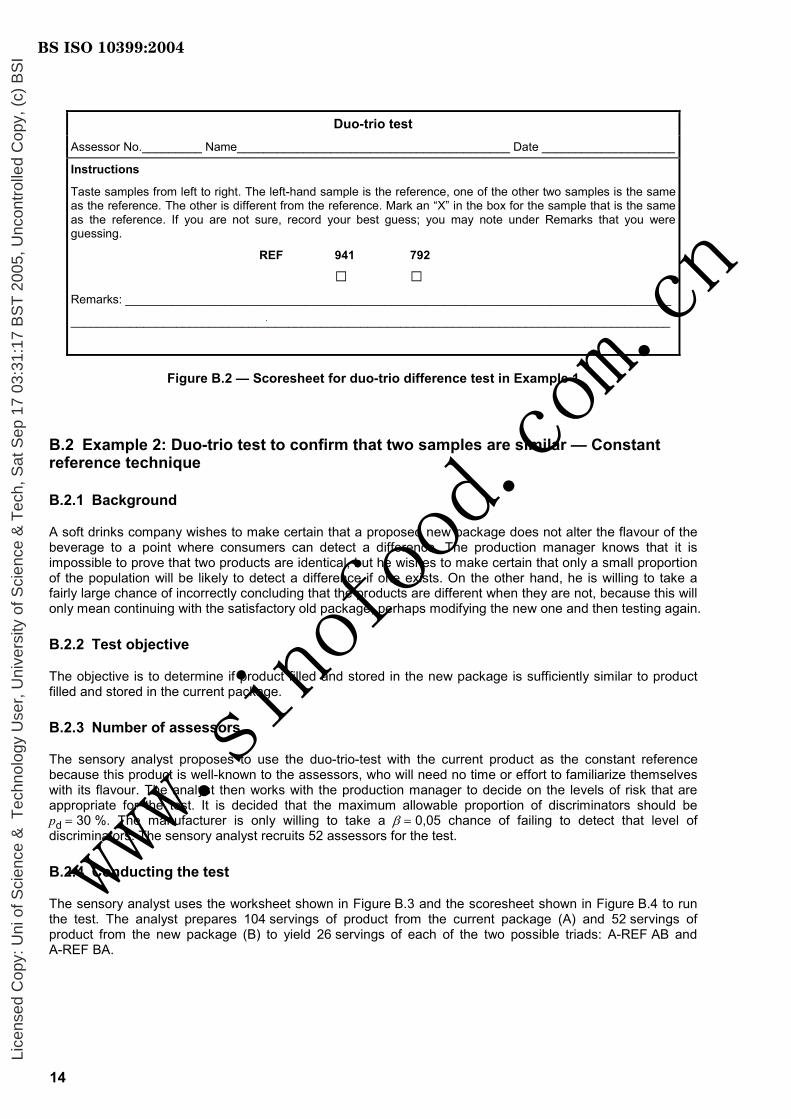
Duo-trio test Assessor No._________ Name_________________________________________ Date ____________________
Instructions
Taste samples from left to right. The left-hand sample is the reference, one of the other two samples is the same as the reference. The other is different from the reference. Mark an “X” in the box for the sample that is the same as the reference. If you are not sure, record your best guess; you may note under Remarks that you were guessing.
REF 941 792
□ □ Remarks: __________________________________________________________________________________
___________________________________________________________________________________________
Figure B.2 — Scoresheet for duo-trio difference test in Example 1
B.2 Example 2: Duo-trio test to confirm that two samples are similar — Constant reference technique
B.2.1 Background
A soft drinks company wishes to make certain that a proposed new package does not alter the flavour of the beverage to a point where consumers can detect a difference. The production manager knows that it is impossible to prove that two products are identical, but he wishes to make certain that only a small proportion of the population will be likely to detect a difference if one exists. On the other hand, he is willing to take a fairly large chance of incorrectly concluding that the products are different when they are not, because this will only mean continuing with the satisfactory old package, perhaps modifying the new one and then testing again.
B.2.2 Test objective
The objective is to determine if product filled and stored in the new package is sufficiently similar to product filled and stored in the current package.
B.2.3 Number of assessors
The sensory analyst proposes to use the duo-trio-test with the current product as the constant reference because this product is well-known to the assessors, who will need no time or effort to familiarize themselves with its flavour. The analyst then works with the production manager to decide on the levels of risk that are appropriate for the test. It is decided that the maximum allowable proportion of discriminators should be pd = 30 %. The manufacturer is only willing to take a β = 0,05 chance of failing to detect that level of discriminators. The sensory analyst recruits 52 assessors for the test.
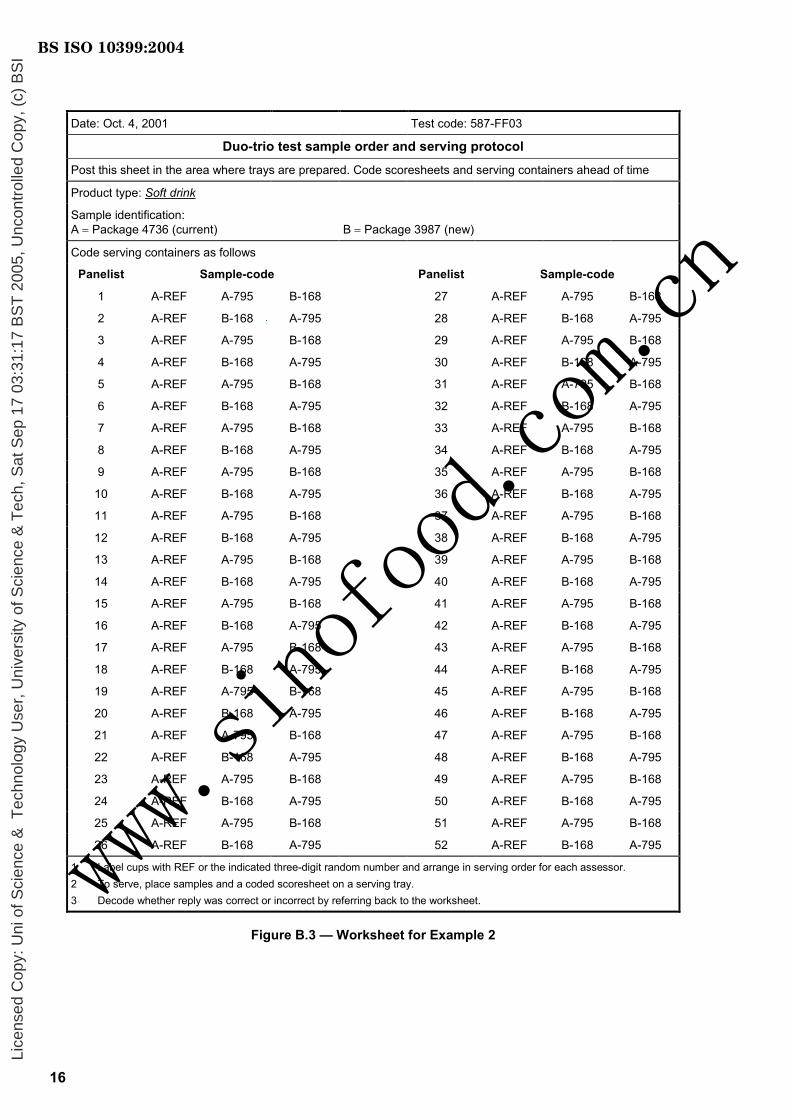
B.2.4 Conducting the test
The sensory analyst uses the worksheet shown in Figure B.3 and the scoresheet shown in Figure B.4 to run the test. The analyst prepares 104 servings of product from the current package (A) and 52 servings of product from the new package (B) to yield 26 servings of each of the two possible triads: A-REF AB and A-REF BA.
BS ISO 10399:2004
Lice
nsed
Cop
y: U
ni o
f Sci
ence
& T
echn
olog
y U
ser,
Uni
vers
ity o
f Sci
ence
& T
ech,
Sat
Sep
17
03:3
1:17
BS
T 2
005,
Unc
ontr
olle
d C
opy,
(c)
BS
I
www.sinofood.com.cn
15
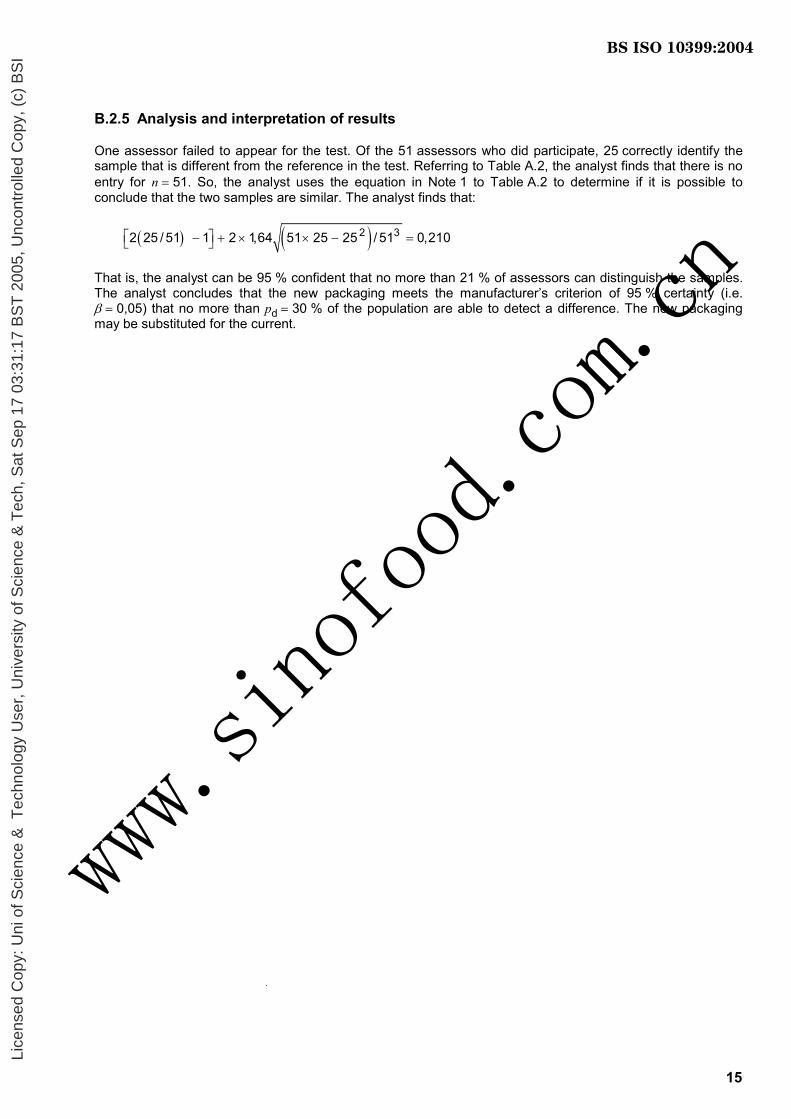
B.2.5 Analysis and interpretation of results
One assessor failed to appear for the test. Of the 51 assessors who did participate, 25 correctly identify the sample that is different from the reference in the test. Referring to Table A.2, the analyst finds that there is no entry for n = 51. So, the analyst uses the equation in Note 1 to Table A.2 to determine if it is possible to conclude that the two samples are similar. The analyst finds that:
( ) ( )2 32 25 / 51 1 2 1,64 51 25 25 / 51 0,210 − + × × − =
That is, the analyst can be 95 % confident that no more than 21 % of assessors can distinguish the samples. The analyst concludes that the new packaging meets the manufacturer’s criterion of 95 % certainty (i.e. β = 0,05) that no more than pd = 30 % of the population are able to detect a difference. The new packaging may be substituted for the current.
BS ISO 10399:2004
Lice
nsed
Cop
y: U
ni o
f Sci
ence
& T
echn
olog
y U
ser,
Uni
vers
ity o
f Sci
ence
& T
ech,
Sat
Sep
17
03:3
1:17
BS
T 2
005,
Unc
ontr
olle
d C
opy,
(c)
BS
I
www.sinofood.com.cn
16
Date: Oct. 4, 2001 Test code: 587-FF03
Duo-trio test sample order and serving protocol Post this sheet in the area where trays are prepared. Code scoresheets and serving containers ahead of time
Product type: Soft drink
Sample identification: A = Package 4736 (current)
B = Package 3987 (new)
Code serving containers as follows
Panelist Sample-code Panelist Sample-code
1 A-REF A-795 B-168 27 A-REF A-795 B-168
2 A-REF B-168 A-795 28 A-REF B-168 A-795
3 A-REF A-795 B-168 29 A-REF A-795 B-168
4 A-REF B-168 A-795 30 A-REF B-168 A-795
5 A-REF A-795 B-168 31 A-REF A-795 B-168
6 A-REF B-168 A-795 32 A-REF B-168 A-795
7 A-REF A-795 B-168 33 A-REF A-795 B-168
8 A-REF B-168 A-795 34 A-REF B-168 A-795
9 A-REF A-795 B-168 35 A-REF A-795 B-168
10 A-REF B-168 A-795 36 A-REF B-168 A-795
11 A-REF A-795 B-168 37 A-REF A-795 B-168
12 A-REF B-168 A-795 38 A-REF B-168 A-795
13 A-REF A-795 B-168 39 A-REF A-795 B-168
14 A-REF B-168 A-795 40 A-REF B-168 A-795
15 A-REF A-795 B-168 41 A-REF A-795 B-168
16 A-REF B-168 A-795 42 A-REF B-168 A-795
17 A-REF A-795 B-168 43 A-REF A-795 B-168
18 A-REF B-168 A-795 44 A-REF B-168 A-795
19 A-REF A-795 B-168 45 A-REF A-795 B-168
20 A-REF B-168 A-795 46 A-REF B-168 A-795
21 A-REF A-795 B-168 47 A-REF A-795 B-168
22 A-REF B-168 A-795 48 A-REF B-168 A-795
23 A-REF A-795 B-168 49 A-REF A-795 B-168
24 A-REF B-168 A-795 50 A-REF B-168 A-795
25 A-REF A-795 B-168 51 A-REF A-795 B-168
26 A-REF B-168 A-795 52 A-REF B-168 A-795
1 Label cups with REF or the indicated three-digit random number and arrange in serving order for each assessor. 2 To serve, place samples and a coded scoresheet on a serving tray. 3 Decode whether reply was correct or incorrect by referring back to the worksheet.
Figure B.3 — Worksheet for Example 2
BS ISO 10399:2004
Lice
nsed
Cop
y: U
ni o
f Sci
ence
& T
echn
olog
y U
ser,
Uni
vers
ity o
f Sci
ence
& T
ech,
Sat
Sep
17
03:3
1:17
BS
T 2
005,
Unc
ontr
olle
d C
opy,
(c)
BS
I
www.sinofood.com.cn
17
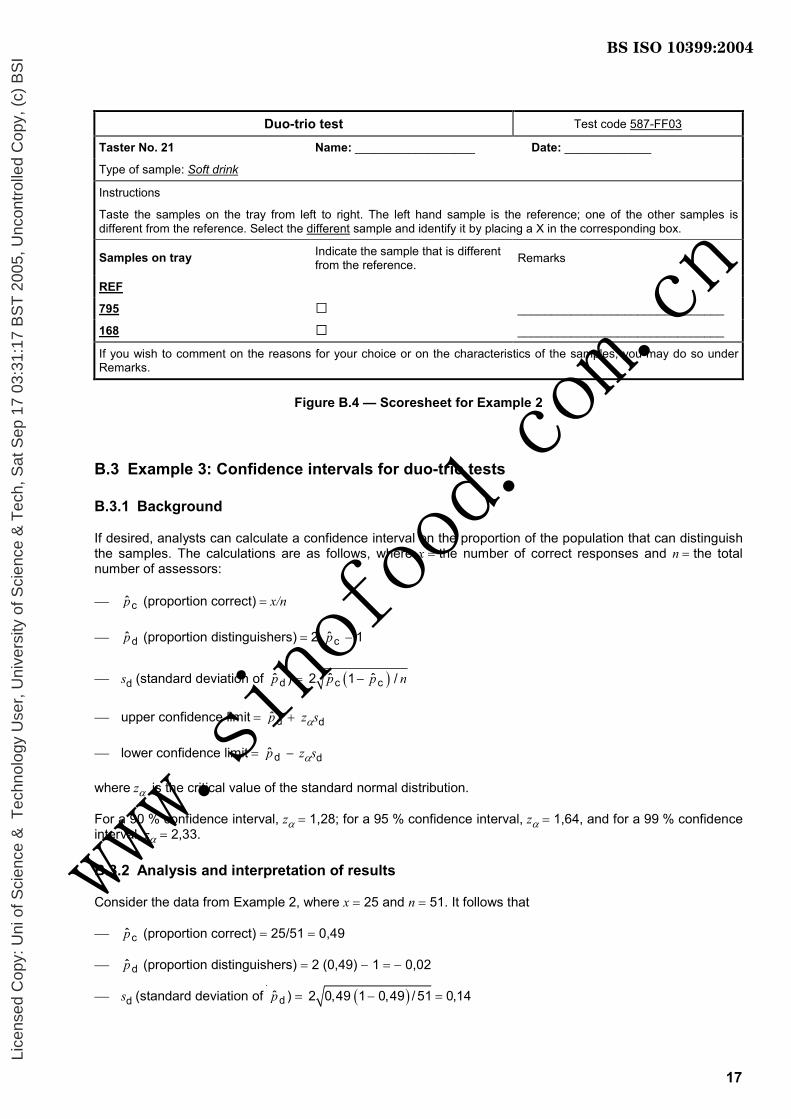
Duo-trio test Test code 587-FF03
Taster No. 21 Name: __________________ Date: _____________
Type of sample: Soft drink
Instructions
Taste the samples on the tray from left to right. The left hand sample is the reference; one of the other samples is different from the reference. Select the different sample and identify it by placing a X in the corresponding box.
Samples on tray Indicate the sample that is different from the reference. Remarks
REF
795 □ _______________________________
168 □ _______________________________
If you wish to comment on the reasons for your choice or on the characteristics of the samples, you may do so under Remarks.
Figure B.4 — Scoresheet for Example 2
B.3 Example 3: Confidence intervals for duo-trio tests
B.3.1 Background
If desired, analysts can calculate a confidence interval on the proportion of the population that can distinguish the samples. The calculations are as follows, where x = the number of correct responses and n = the total number of assessors:
cp̂ (proportion correct) = x/n
dp̂ (proportion distinguishers) = 2 cp̂ − 1
sd (standard deviation of dp̂ ) = ( )c cˆ ˆ2 1 /p p n−
upper confidence limit = dp̂ + zαsd
lower confidence limit = dp̂ − zαsd
where zα is the critical value of the standard normal distribution.
For a 90 % confidence interval, zα = 1,28; for a 95 % confidence interval, zα = 1,64, and for a 99 % confidence interval, zα = 2,33.
B.3.2 Analysis and interpretation of results
Consider the data from Example 2, where x = 25 and n = 51. It follows that
cp̂ (proportion correct) = 25/51 = 0,49
dp̂ (proportion distinguishers) = 2 (0,49) − 1 = − 0,02
sd (standard deviation of dp̂ ) = ( )2 0,49 1 0,49 / 51 0,14− =
BS ISO 10399:2004
Lice
nsed
Cop
y: U
ni o
f Sci
ence
& T
echn
olog
y U
ser,
Uni
vers
ity o
f Sci
ence
& T
ech,
Sat
Sep
17
03:3
1:17
BS
T 2
005,
Unc
ontr
olle
d C
opy,
(c)
BS
I
www.sinofood.com.cn

18
95 % upper confidence limit = − 0,02 + 1,64 × 0,14 = 0,21
95 % lower confidence limit = − 0,02 − 1,64 × 0,14 = − 0,25
If the analyst were testing for similarity, the analyst could be 95 % confident that the actual proportion of the population that could distinguish the samples was no more than 21 %. On the other hand, if the analyst were testing for a difference, since the lower 95 % confidence limit is negative, pd = 0 % is in the interval and is therefore a possible value, thus supporting the conclusion that there is no perceptible difference between the samples.
Taken together, the confidence interval allows for a 5 % error for both the upper and lower limits, so the sensory analyst can be 90 % confident that the true proportion of distinguishers is somewhere between 0 % and 21 % of the population. Depending on the objective of the study, the researcher may choose to use the one-sided upper confidence limit, the one–sided lower confidence limit, or the combined, two-sided confidence limits.
BS ISO 10399:2004
Lice
nsed
Cop
y: U
ni o
f Sci
ence
& T
echn
olog
y U
ser,
Uni
vers
ity o
f Sci
ence
& T
ech,
Sat
Sep
17
03:3
1:17
BS
T 2
005,
Unc
ontr
olle
d C
opy,
(c)
BS
I
www.sinofood.com.cn
19
Bibliography
[1] ISO 3534-1, Statistics — Vocabulary and symbols — Part 1: Probability and general statistical terms
[2] ISO 4120, Sensory analysis — Methodology — Triangle test
[3] ISO 6658, Sensory analysis — Methodology — General guidance
[4] ISO 8586-1, Sensory analysis — General guidance for the selection, training and monitoring of assessors — Part 1: Selected assessors
[5] ISO 8586-2, Sensory analysis — General guidance for the selection, training and monitoring of assessors — Part 2: Experts
[6] BROCKHOFF, P.B. and SCHLICH, P. Handling replications in discrimination tests. Food Quality and Preference, 9 (5), 1998, pp. 303-312
[7] ENNIS, D.M. and BI, J. The Beta-Binomial Model: Accounting for Inter-trial Variation in Replicated Difference and Preference Tests. Journal of Sensory Studies, 13 (4), 1998, pp. 389-412
[8] FRIJTERS, J.E.R. Three-Stimulus Procedure in Olfactory Psycholophysics: An Experimental Comparison of Thurstone-Ura and Three-Alternative Forced-Choice Models of Signal Detection Theory. Perception & Psychophysics, 28 (5), 1980, pp. 390-397
[9] KUNERT, J. and MEYNERS, M. On the triangle test with replications. Food Quality and Preference, 10, 1999
[10] KUNERT, J. On repeated difference testing. Food Quality and Preference, 12, 2001, pp 385-391
[11] MEILGAARD, M., CIVILLE, G.V., Carr, B.T. Sensory Evaluation Techniques, 2nd Edition, CRC Press, Inc., Boca Raton, FL, 1991, p. 338
[12] SCHLICH, P. RISK Tables for Discrimination Tests. Food Quality and Preference, 4, 1993, pp. 141-151
BS ISO 10399:2004
Lice
nsed
Cop
y: U
ni o
f Sci
ence
& T
echn
olog
y U
ser,
Uni
vers
ity o
f Sci
ence
& T
ech,
Sat
Sep
17
03:3
1:17
BS
T 2
005,
Unc
ontr
olle
d C
opy,
(c)
BS
I
www.sinofood.com.cn
BS ISO 10399:2004
BSI
389 Chiswick High Road
London
W4 4AL
BSI — British Standards InstitutionBSI is the independent national body responsible for preparing British Standards. It presents the UK view on standards in Europe and at the international level. It is incorporated by Royal Charter.
Revisions
British Standards are updated by amendment or revision. Users of British Standards should make sure that they possess the latest amendments or editions.
It is the constant aim of BSI to improve the quality of our products and services. We would be grateful if anyone finding an inaccuracy or ambiguity while using this British Standard would inform the Secretary of the technical committee responsible, the identity of which can be found on the inside front cover. Tel: +44 (0)20 8996 9000. Fax: +44 (0)20 8996 7400.
BSI offers members an individual updating service called PLUS which ensures that subscribers automatically receive the latest editions of standards.
Buying standards
Orders for all BSI, international and foreign standards publications should be addressed to Customer Services. Tel: +44 (0)20 8996 9001. Fax: +44 (0)20 8996 7001. Email: [email protected]. Standards are also available from the BSI website at http://www.bsi-global.com.
In response to orders for international standards, it is BSI policy to supply the BSI implementation of those that have been published as British Standards, unless otherwise requested.
Information on standards
BSI provides a wide range of information on national, European and international standards through its Library and its Technical Help to Exporters Service. Various BSI electronic information services are also available which give details on all its products and services. Contact the Information Centre. Tel: +44 (0)20 8996 7111. Fax: +44 (0)20 8996 7048. Email: [email protected].
Subscribing members of BSI are kept up to date with standards developments and receive substantial discounts on the purchase price of standards. For details of these and other benefits contact Membership Administration. Tel: +44 (0)20 8996 7002. Fax: +44 (0)20 8996 7001. Email: [email protected].
Information regarding online access to British Standards via British Standards Online can be found at http://www.bsi-global.com/bsonline.
Further information about BSI is available on the BSI website at http://www.bsi-global.com.
Copyright
Copyright subsists in all BSI publications. BSI also holds the copyright, in the UK, of the publications of the international standardization bodies. Except as permitted under the Copyright, Designs and Patents Act 1988 no extract may be reproduced, stored in a retrieval system or transmitted in any form or by any means – electronic, photocopying, recording or otherwise – without prior written permission from BSI.
This does not preclude the free use, in the course of implementing the standard, of necessary details such as symbols, and size, type or grade designations. If these details are to be used for any other purpose than implementation then the prior written permission of BSI must be obtained.
Details and advice can be obtained from the Copyright & Licensing Manager. Tel: +44 (0)20 8996 7070. Fax: +44 (0)20 8996 7553. Email: [email protected].
Lice
nsed
Cop
y: U
ni o
f Sci
ence
& T
echn
olog
y U
ser,
Uni
vers
ity o
f Sci
ence
& T
ech,
Sat
Sep
17
03:3
1:17
BS
T 2
005,
Unc
ontr
olle
d C
opy,
(c)
BS
I
www.sinofood.com.cn


![Pervyj Koncert MONACHOV [Solo] [Duo] [Trio] [Quarteto] Gtr](https://img.pdfslide.net/doc/110x75/577cde5a1a28ab9e78aef893/pervyj-koncert-monachov-solo-duo-trio-quarteto-gtr.jpg)