Embed Size (px)
Citation preview

Seward Park Planning Process
Meeting 4: Wednesday, October 20th, 2010
AgendaAnswer outstanding Committee questions
Summarize development game and program progress to dateHousing Scenarios Discussion
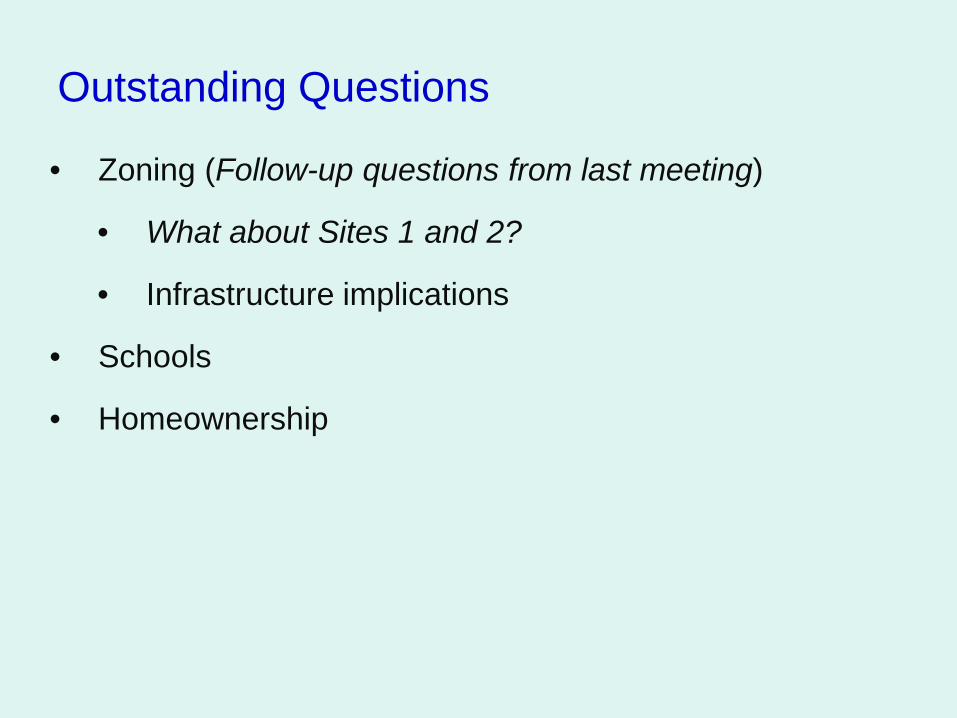
• Zoning (Follow-up questions from last meeting)
• What about Sites 1 and 2?
• Infrastructure implications
• Schools
• Homeownership
Outstanding Questions
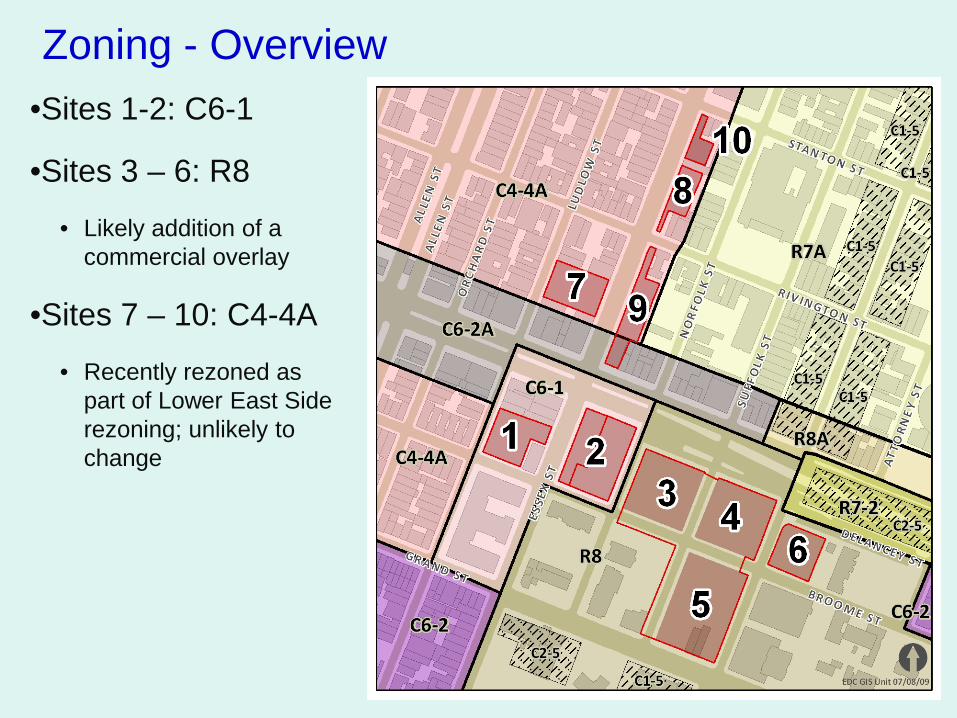
Zoning - Overview•Sites 1-2: C6-1
•Sites 3 – 6: R8
• Likely addition of a commercial overlay
•Sites 7 – 10: C4-4A
• Recently rezoned as part of Lower East Side rezoning; unlikely to change
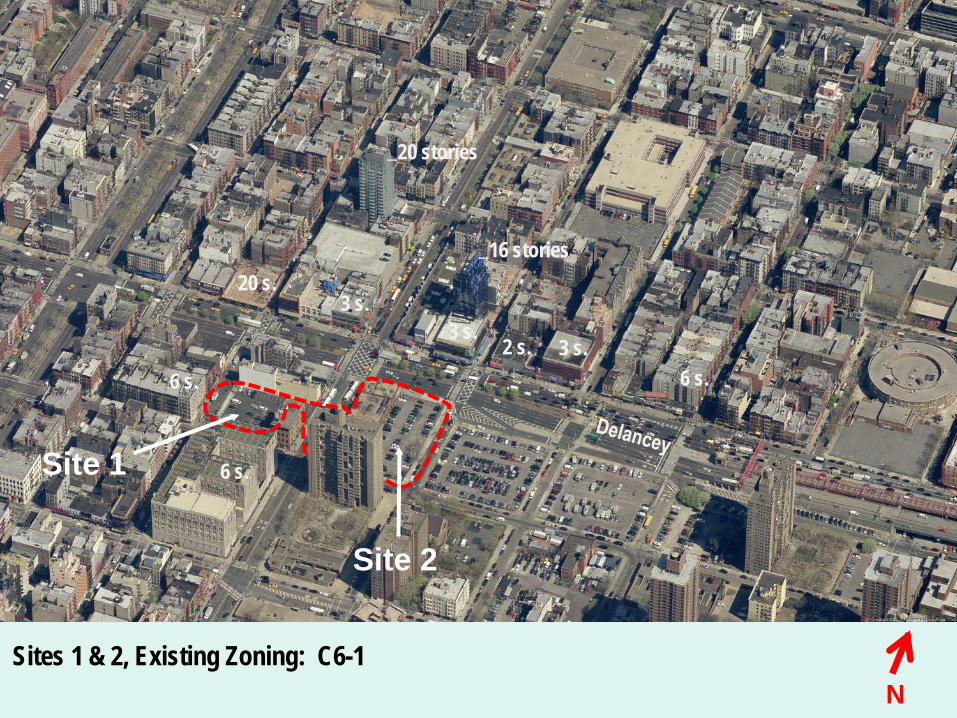
Sites 1 & 2, Existing Zoning: C6-1
─16 stories
─20 stories
20 s.
6 s.3 s.2 s.
3 s.3 s.
6 s.
6 s.
N
Site 1
Site 2

R8 (C6-2 equivalent)
Maximum FAR – 6.02 (7.2)Found in – Clinton, Morningside
Heights, Downtown BrooklynDowntown Brooklyn
11 floors
Seward Park Houses21 floors

R9 (C6-3 equivalent)
Maximum FAR – 7.52Found in – Upper Fifth Avenue, Upper
West Side
Upper West SideHeight – 140’
14 floors
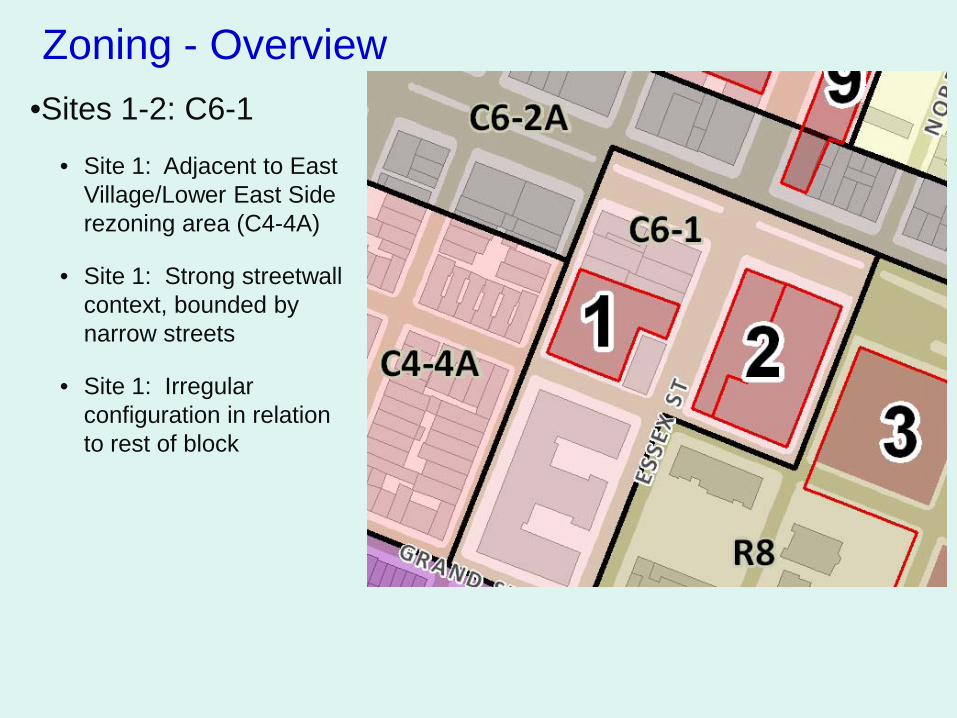
Zoning - Overview•Sites 1-2: C6-1
• Site 1: Adjacent to East Village/Lower East Side rezoning area (C4-4A)
• Site 1: Strong streetwall context, bounded by narrow streets
• Site 1: Irregular configuration in relation to rest of block

Site 1, Existing Zoning: C6-1
Site 1
Site 1
view to the west along Broome Streetview to the north along Ludlow Street
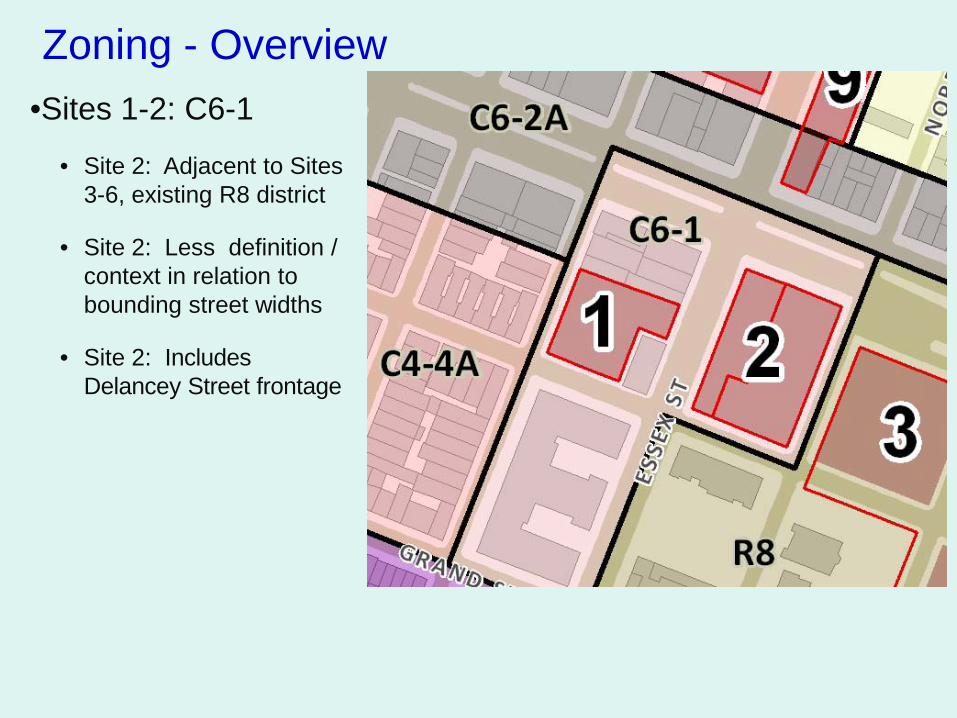
Zoning - Overview•Sites 1-2: C6-1
• Site 2: Adjacent to Sites 3-6, existing R8 district
• Site 2: Less definition / context in relation to bounding street widths
• Site 2: Includes Delancey Street frontage
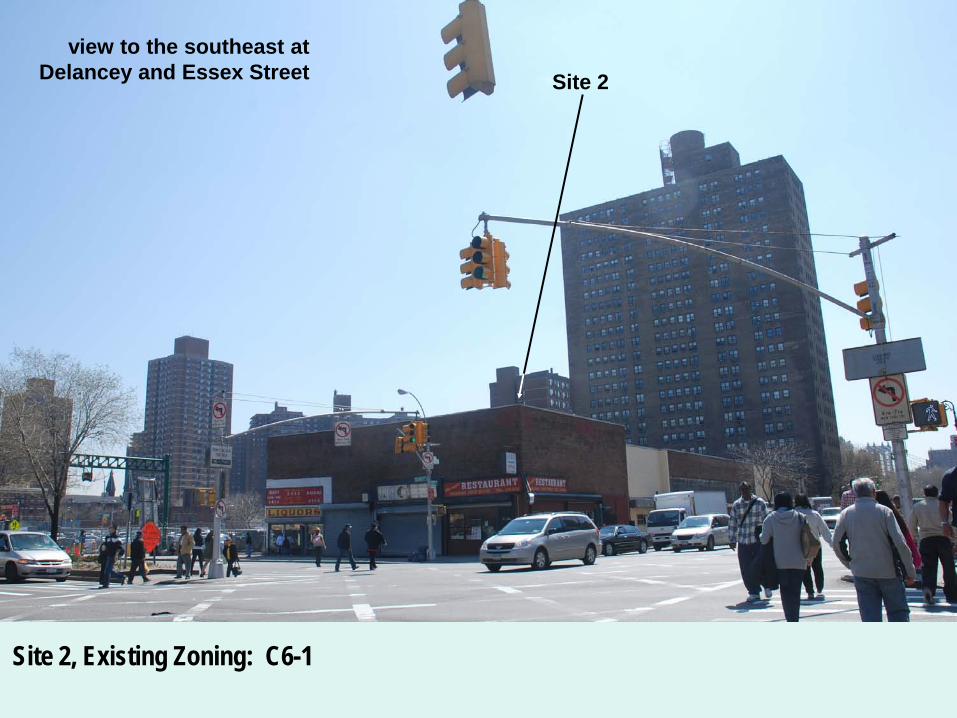
Site 2, Existing Zoning: C6-1
Site 2view to the southeast at
Delancey and Essex Street
• Rezoning Site 1 is not a viable option
• Site 2 could potentially be rezoned after further study
Zoning

• DEP will require an Amended Drainage Plan with rezonings that increase square feet/density• Jamaica rezoning triggered re-examination of policy (2007)
• An Amended Drainage Plan (ADP)• Examines the topography of the surrounding area• Involves extensive review of existing capacity for sewer, water
and stormwater lines• Requires calculations based on anticipated increase in flow
rates• Potentially results in additional required infrastructure work
throughout neighborhood
Zoning Changes – Drainage Plan
• Recent projects which have required amended drainage plans:• Hunter’s Point South• Hudson Yards• Hunts Point
• Conducting an ADP can take from 1 to 3 years, with extensive review by DEP
Zoning Changes – Drainage Plan
• Revenue from additional units would have to cover increased costs (~$40M, conservative estimate)• Infrastructure• Construction
• Rezoning Sites 2-6 to the R9 (or equivalent) could add:• ~ 450,000 sf of residential
• Significantly reduces commercial options on Site 2
• In order to generate enough revenue to cover the increased costs:• R9 development (or equivalent): ~70% of new units need to
be market rate• More affordable units could not cover the added
infrastructure costs
Zoning Changes – Ground Costs
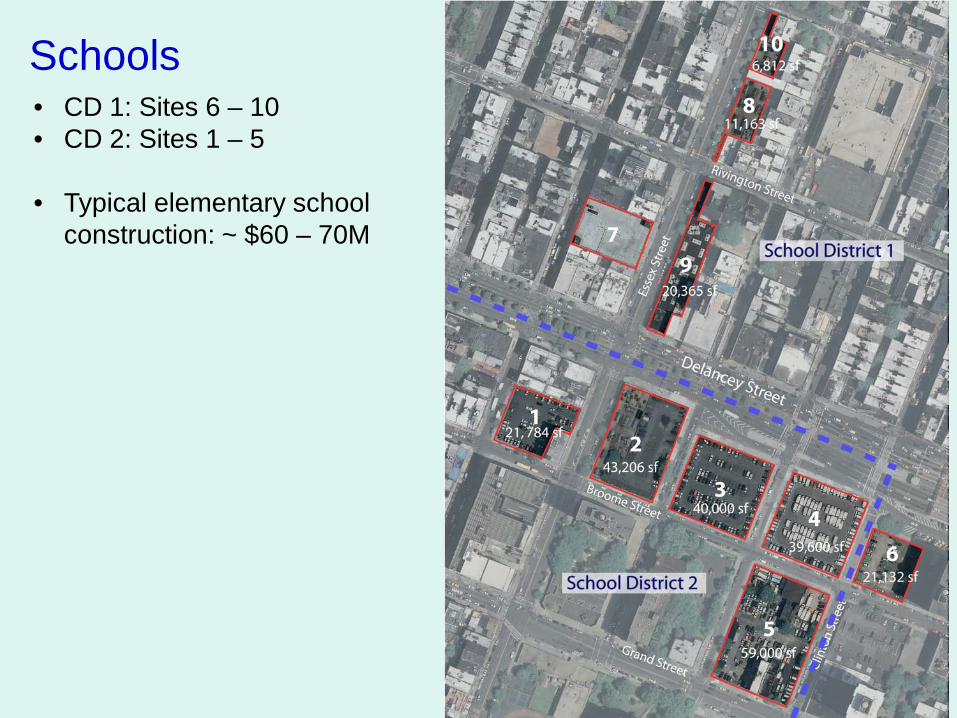
Schools• CD 1: Sites 6 – 10• CD 2: Sites 1 – 5
• Typical elementary school construction: ~ $60 – 70M
Homeownership• Current economic conditions do not support
construction of new homeownership units
• Longer-term planning for the site could include homeownership, when feasible
• Property-tax incentives encourage homeownership developments to include 20% of the units at 125% of AMI
• Depending on financing, a mix of middle and moderate income homeownership units may be feasible
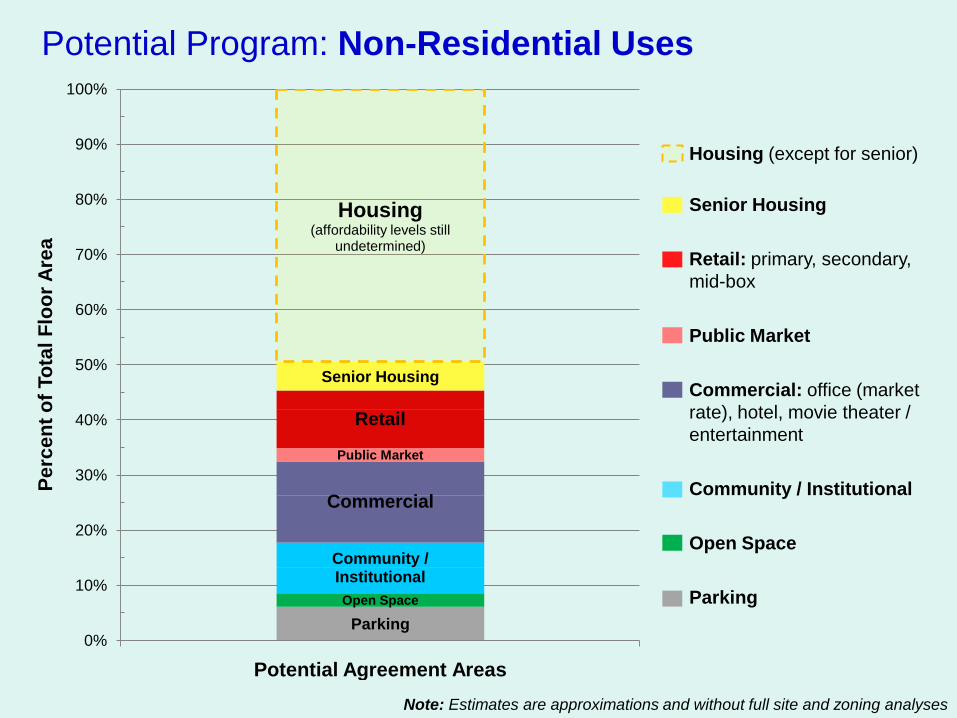
Note: Estimates are approximations and without full site and zoning analyses
Potential Program: Non-Residential Uses
Housing (except for senior)
Senior Housing
Retail: primary, secondary, mid-box
Public Market
Commercial: office (market rate), hotel, movie theater / entertainment
Community / Institutional
Open Space
ParkingParking
Open Space
Community / Institutional
Commercial
Public Market
Retail
Senior Housing
Housing(affordability levels still
undetermined)
0%
10%
20%
30%
40%
50%
60%
70%
80%
90%
100%
Potential Agreement Areas
Perc
ent o
f Tot
al F
loor
Are
a
123456789
10111213141516171819
Percent of Total Floor Area
Com
mitt
ee M
embe
r
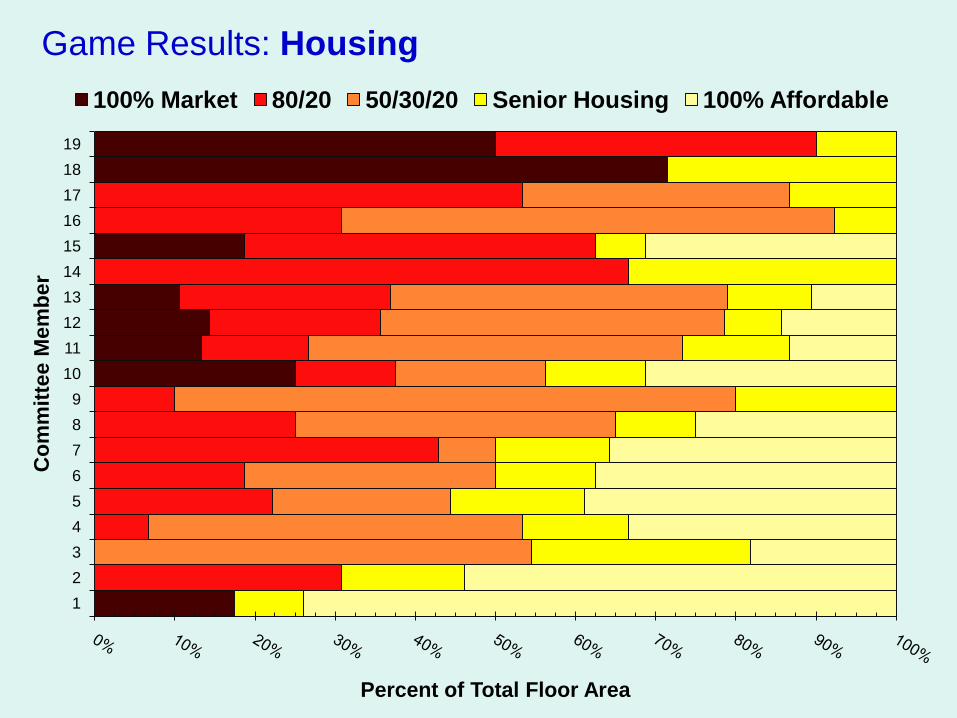
100% Market 80/20 50/30/20 Senior Housing 100% Affordable
Game Results: Housing
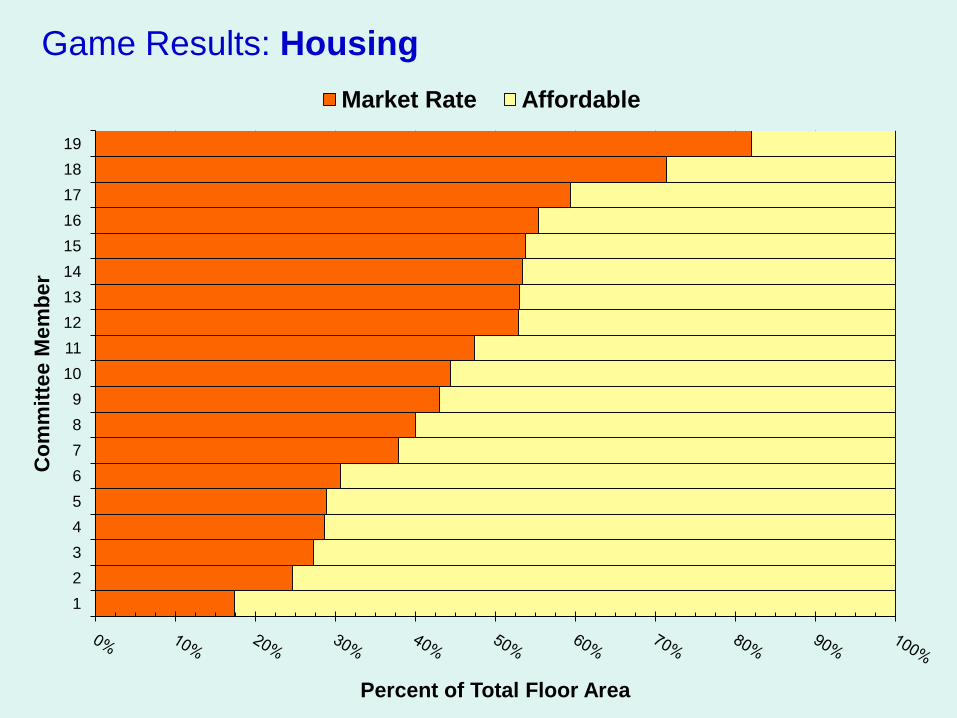
123456789
10111213141516171819
Percent of Total Floor Area
Com
mitt
ee M
embe
r
Market Rate Affordable
Game Results: Housing
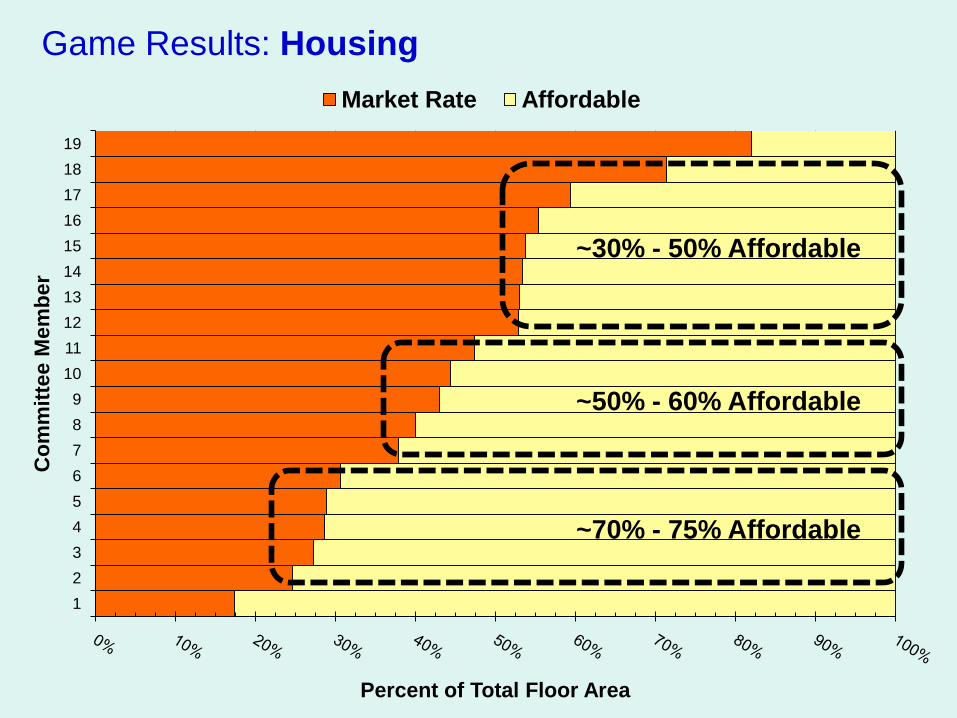
123456789
10111213141516171819
Percent of Total Floor Area
Com
mitt
ee M
embe
r
Market Rate Affordable
Game Results: Housing
~30% - 50% Affordable
~50% - 60% Affordable
~70% - 75% Affordable
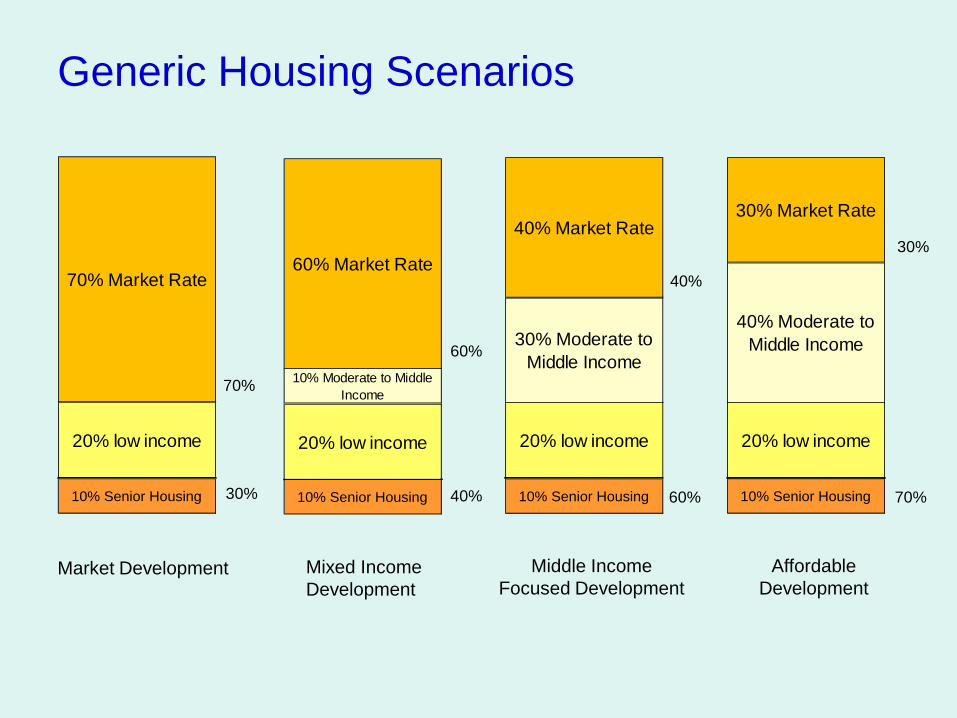
Generic Housing Scenarios
10% Senior Housing
20% low income 20% low income
10% Senior Housing
70% Market Rate
20% low income
10% Senior Housing 10% Senior Housing
20% low income
10% Moderate to Middle Income
60% Market Rate
30% Moderate to Middle Income
40% Market Rate
40% Moderate to Middle Income
30% Market Rate
Market Development
70%
30%
Mixed Income Development
60%
40%
Middle Income Focused Development
40%
60%
Affordable Development
30%
70%
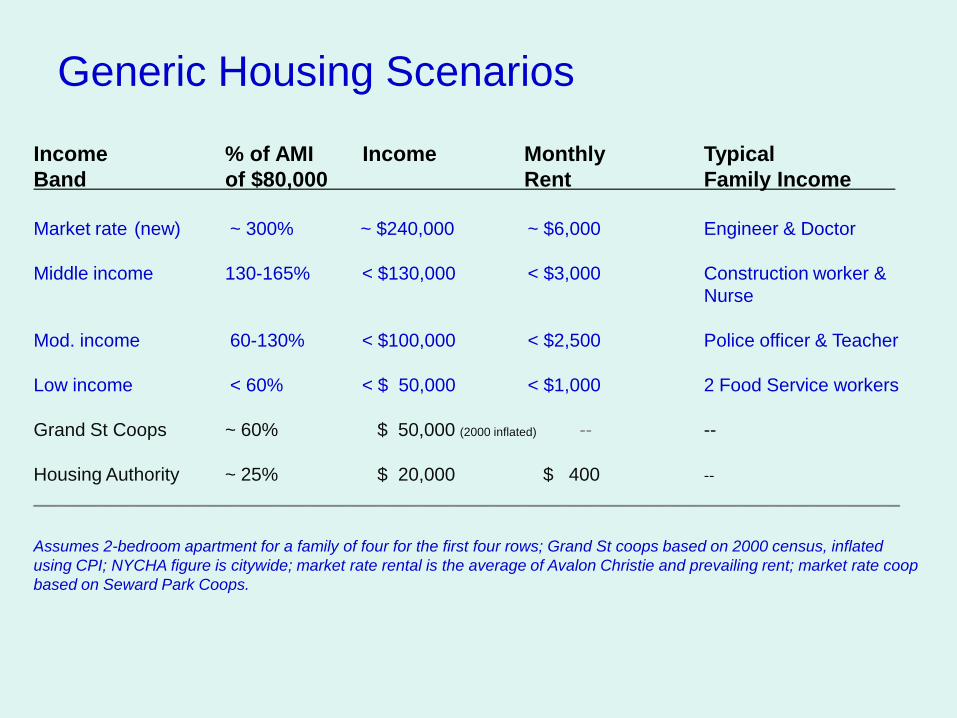
Generic Housing Scenarios
Income % of AMI Income Monthly Typical Band of $80,000 Rent Family Income
Market rate (new) ~ 300% ~ $240,000 ~ $6,000 Engineer & Doctor
Middle income 130-165% < $130,000 < $3,000 Construction worker & Nurse
Mod. income 60-130% < $100,000 < $2,500 Police officer & Teacher
Low income < 60% < $ 50,000 < $1,000 2 Food Service workers
Grand St Coops ~ 60% $ 50,000 (2000 inflated) -- --
Housing Authority ~ 25% $ 20,000 $ 400 --____________________________________________________________________________________
Assumes 2-bedroom apartment for a family of four for the first four rows; Grand St coops based on 2000 census, inflated using CPI; NYCHA figure is citywide; market rate rental is the average of Avalon Christie and prevailing rent; market rate coop based on Seward Park Coops.
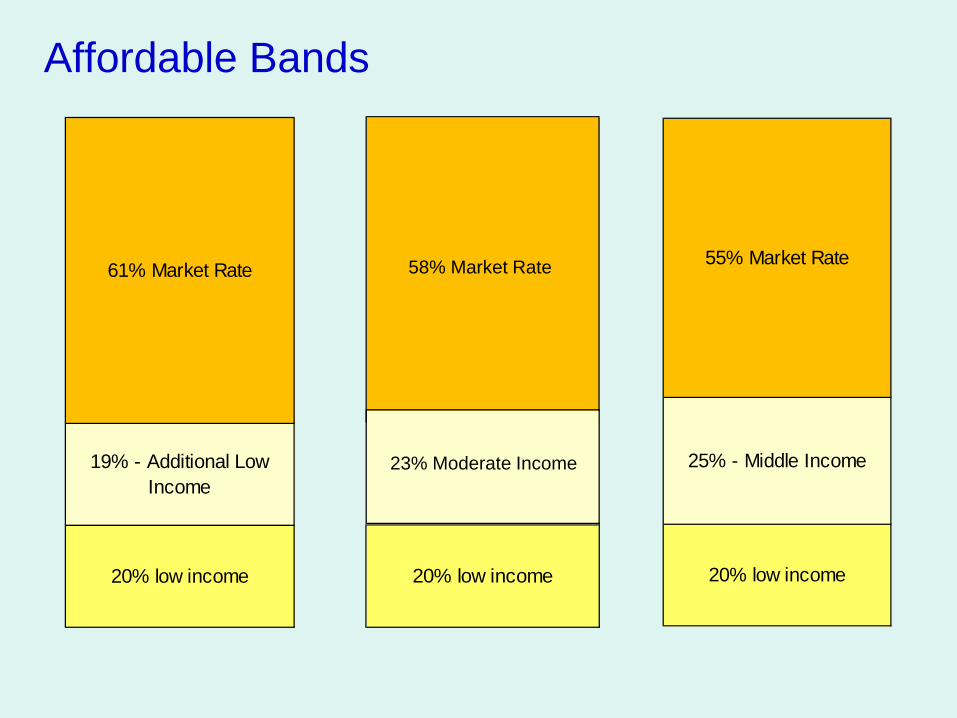
61% Market Rate
19% - Additional Low Income
20% low income 20% low income
25% - Middle Income
55% Market Rate
Affordable Bands
20% low income
23% Moderate Income
58% Market Rate
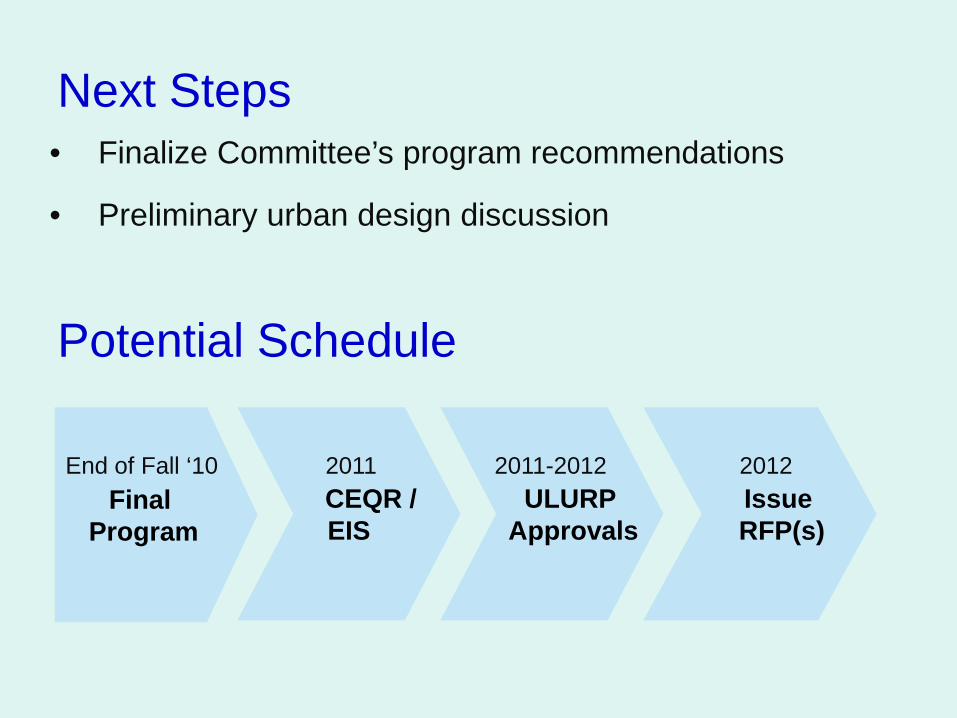
Next Steps• Finalize Committee’s program recommendations
• Preliminary urban design discussion
Potential Schedule
Final Program
CEQR / EIS
ULURPApprovals
Issue RFP(s)
2011-20122011End of Fall ‘10 2012
Contact info
Contact informationEve Baron [email protected] Shapiro [email protected]
Websitewww.nycedc.com/sewardpark