Embed Size (px)
Citation preview
SITE USE AND MIGRATION OF SCOTERS (Melanitta spp.)IN RELATION TO THE SPAWNING OF PACIFIC
HERRING (Clupea pallasi)
by
Erika K. LokDip!. T., British Columbia Institute of Technology, 2003
B.Sc., University of British Columbia, 2000
THESIS SUBMITTED IN PARTIAL FULFILLMENT OFTHE REQUIREMENTS FOR THE DEGREE OF
MASTER OF SCIENCE
In theDepartment
ofBiological Sciences
© Erika K. Lok 2008
SIMON FRASER UNIVERSITY
Spring 2008
All rights reserved. This work may not bereproduced in whole or in part, by photocopy
or other means, without permission of the author.
Name:
Degree:
Title of Thesis:
APPROVAL
Erika Lok
Master of Science
Site use and migration of scoters (Melanitta spp.) in relation to the spawning ofPacific herring (Clupea pallasi)
Examining Committee:
Chair: Dr. J. Guttman, Assistant Professor
Dr. R. Ydenberg, Professor, Senior SupervisorDepartment of Biological Sciences, S.F.U.
Dr. D. Esler, University Research AssociateDepartment of Biological Sciences, S.F.U.
Dr. K. Rothley, Assistant ProfessorDepartment of Biology, Kutztown University
Dr. M. Wilson, Affiliate ProfessorSchool of Fisheries and Ocean Sciences, University of Alaska FairbanksPublic Examiner
12 March 2008Date Approved
ii
S I M 0 N I: R A S E RUN I V E R SIT YLIBRARY
Declaration ofPartial Copyright LicenceThe author, whose copyright is declared on the title page of this work, has grantedto Simon Fraser University the right to lend this thesis, project or extended essayto users of the Simon Fraser University Library, and to make partial or singlecopies only for such users or in response to a request from the library of any otheruniversity, or other educational institution, on its own behalf or for one of its users.
The author has further granted permission to Simon Fraser University to keep ormake a digital copy for use in its circulating collection (currently available to thepublic at the "Institutional Repository" link of the SFU Library website<www.lib.sfu.ca> at: <http://ir.lib.sfu.ca/handle/1892/112>) and, without changingthe content, to translate the thesis/project or extended essays, if technicallypossible, to any medium or format for the purpose of preservation of the digitalwork.
The author has further agreed that permission for multiple copying of this work forscholarly purposes may be granted by either the author or the Dean of GraduateStudies.
It is understood that copying or publication of this work for financial gain shall notbe allowed without the author's written permission.
Permission for public performance, or limited permission for private scholarly use,of any multimedia materials forming part of this work, may have been granted bythe author. This information may be found on the separately cataloguedmultimedia material and in the signed Partial Copyright Licence.
While licensing SFU to permit the above uses, the author retains copyright in thethesis, project or extended essays, including the right to change the work forsubsequent purposes, including editing and publishing the work in whole or inpart, and licensing other parties, as the author may desire.
The original Partial Copyright Licence attesting to these terms, and signed by thisauthor, may be found in the original bound copy of this work, retained in theSimon Fraser University Archive.
Simon Fraser University LibraryBurnaby, BC, Canada
Revised: Fall 2007

STATEMENT OFETHICS APPROVAL
The author, whose name appears on the title page of this work, has obtained, forthe research described in this work, either:
(a) Human research ethics approval from the Simon Fraser University Office ofResearch Ethics,
or
(b) Advance approval of the animal care protocol from the University Animal CareCommittee of Simon Fraser University;
or has conducted the research
(c) as a co-investigator, in a research project approved in advance,
or
(d) as a member of a course approved in advance for minimal risk humanresearch, by the Office of Research Ethics.
A copy of the approval letter has been filed at the Theses Office of the UniversityLibrary at the time of submission of this thesis or project.
The original application for approval and letter of approval are filed with therelevant offices. Inquiries may be directed to those authorities.
Simon Fraser University LibraryBurnaby, BC, Canada
ABSTRACT
I investigated movements and site use by two scoter species during late winter
and spring. In the Strait of Georgia, British Columbia, I found that radio-transmitter-
tagged pre-migratory surf scoters (Melanitta perspicillata) and white-winged scoters
(Melanittafusca) left the areas where they had spent the winter and moved to Pacific
herring (Clupea pallasi) spawn sites coincident with spawn availability in March. In
southeast Alaska, I identified stopover and staging sites of satellite-transmitter-tagged
migrating surf scoters and identified one site, Lynn Canal, as particularly important. I
found that herring spawn availability and proximity to the mainland coast were strong
predictors of site use, suggesting that the resource availability and geography of southeast
Alaska provide important stopover habitat for migrants. Overall, there was strong
phenological correspondence between the northward progression of scoter migration and
herring spawn availability, suggesting that herring spawn is a valuable resource for
scoters in late winter and spring.
Keywords: habitat use; herring spawn; migration; radio telemetry; satellite telemetry;surf scoter; white-winged scoter
Subject Terms: Ducks -- British Columbia -- Georgia Strait Region; Sea birds -- BritishColumbia -- Georgia Strait Region; Ducks British Columbia; Ducks Habitat; DucksAlaska; Migration Birds North America
III
ACKNOWLEDGEMENTS
I have been very lucky to work with an amazing group of researchers and
students, and this thesis would not exist without their contributions. I would first like to
thank my primary supervisor, Dr. Dan Esler, because his guidance and scientific
mentorship are the reasons this thesis was completed. I feel very privileged to have
worked with such a dedicated and insightful scientist, and am grateful for his support,
enthusiasm, and unending sense of humour. I would also like thank Dr. Kristina Rothley
and Dr. Ron Ydenberg for serving on my supervisory committee and helping shape this
project, and Dr. Mary Willson for serving as my external examiner and contributing so
much to this thesis in just a few short hours. I would also like to thank Dr. Sean Boyd and
Dr. John Takekawa for their mentorship, suggestions, and vast array of knowledge.
Primary funding for my research came from the Sea Duck Joint Venture, with additional
thanks to the Environment Canada Science Horizons Program, Simon Fraser University,
and the Centre for Wildlife Ecology.
This project would not have been possible without data provided by my research
partners and other agencies. Thanks to John Takekawa and Susan-Wainwright-De La
Cruz from the U.S.G.S. San Francisco Bay Estuary Field Station, David Ward from the
U.S.G.S. Alaska Science Centre, and Dave Nysewander and Joe Evenson from the
Washington Department of Fish and Wildlife for all their data and support. Thanks to the
Alaska Department of Fish and Game and the Department of Fisheries and Oceans
Canada for herring spawn data. And thanks to David Albert from the Nature Conservancy
for providing the shoreline habitat database for southeast Alaska.
iv

I would like to thank all the people who helped in the field and with logistics. Eric
Anderson, Sam Iverson, Matthew Wilson, and Cooper provided many hours of hard work
and hilarity. Thanks also to the Alaska Department of Fish and Game in Ketchikan for all
their help, particularly Steve Heinl, Bo Meredith, Andy Leitz, Phil Doherty, and Boyd
Porter. Thanks to Gwen Baluss for her birding expertise, and to Dave Douglas for his
generosity in providing a place to stay in Juneau. I would also like to thank pilots Lynn
Bennett and Dave Doyon for many safe hours in the air. Many thanks also to all the
scoter people who came before me: Molly Kirk, Tyler Lewis, and Deb Lacroix, and the
entire Sustainable Shellfish Aquaculture Initiative crew who collected the data used in
Chapter 2.
In the CWE, Connie Smith, Judy Higham, and Monica Court have been infinitely
helpful with the logistics of everything imaginable. Lab meetings with the Ydenberg,
Green, and AWEL labs provided much support and feedback for projects and
presentations, thanks to: Jenn Barrett, Jeanine Bond, Kathy Brodhead, Lindsay Farrell,
Samantha Franks, Kristen Gorman, Dan Guertin, Megan Harrison, Joel Heath, Rebecca
Harrold, Sofi Hindmarch, David Hope, Sarah Jamieson, lain Jones, Christina Kereki,
Molly Kirk, Tyler Lewis, Heather Major, Josh Malt, Shelley Marshall, Lindsay McBlane,
Holly Middleton, Kyle Morrison, Andrea Pomeroy, Sam Quinlan, Dora Repard, Pat
Robinson, Christine Rock, Tina Semeniuk, Mike Silvergieter, and Caz Taylor. A
particularly huge thanks to Molly for all her scoter/data/fashion/life advice.
And finally, wholehearted thanks to my wonderful family and friends for their
moral, financial, emotional, and nutritional support during this whole process. I definitely
owe you one. Or six.
v
TABLE OF CONTENTS
Approval ii
Abstract iii
Acknowledgements iv
Table of Contents vi
List of Figures viii
List of Tables ix
Chapter 11.11.21.31.4
GENERAL INTRODUCTION 1
Thesis Background 1Study Areas 4Thesis Outline 5References 7
Chapter 2 MOVEMENTS OF PRE-MIGRATORY SURF AND WHITEWINGED SCOTERS IN RESPONSE TO PACIFIC HERRINGSPAWN 11
2.12.22.32.4
2.4.12.4.2
2.52.5.12.5.22.5.3
2.62.6.12.6.22.6.3
2.72.82.9
Abstract. 12Introduction 13Study Area 14Methods 15
Radio-telemetry 15Scoter distribution surveys 16
Data Analyses 17Movement metrics 17Habitat use metrics 18Numerical response 19
Results 20Movement response 20Habitat use 20Numerical response 21
Discussion 21Acknowledgements 25References 27
Chapter3 STOPOVER HABITATS OF SPRING lVIIGRATING SURFSCOTERS IN SOUTHEAST ALASKA 40
3.13.23.33.4
3.4.13.4.23.4.3
Abstract. 41Introduction 42Study Area 43Methods 44
Capture and marking 44Location data 45Habitat data 45
VI
3.53.5.13.5.2
3.63.6.13.6.2
3.73.83.9
Data Analyses 47Identification of important stopover sites .47Habitat attributes of important stopover sites .48
Results 50Identification of important stopover sites 50Habitat attributes of important stopover sites 51
Discussion 52Acknowledgements 55References 56
Chapter 4 SPATIOTEMPORAL ASSOCIATIONS BETWEEN PACIFICHERRING SPAWN AND SURF SCOTER SPRINGMIGRATION: EVALUATING A "SILVER WAVE"HYPOTHESIS 66
4.14.24.34.4
4.4.14.4.24.4.34.4.4
4.54.5.14.5.2
4.64.6.14.6.2
4.74.84.9
Chapter 55.15.25.35.4
Abstract. 67Introduction 68Study Area 71Methods 72
Captures and marking 72Location data 72Aerial surveys 73Herring spawn data 74
Data Analyses 74Spawn progression and migration patterns 74Spawn site use metrics 76
Results 78Spawn progression and migration patterns 78Spawn site use metrics 79
Discussion 80Acknowledgements 84References 86
GENERAL CONCLUSIONS 99Thesis Summary 99Future Directions 102Management Implications and Recommendations 104References 107
VB
LIST OF FIGURES
Figure 2.1
Figure 2.2
Figure 2.3
Figure 2.4
Figure 3.1
Figure 3.2
Figure 4.1
Figure 4.2
Figure 4.3
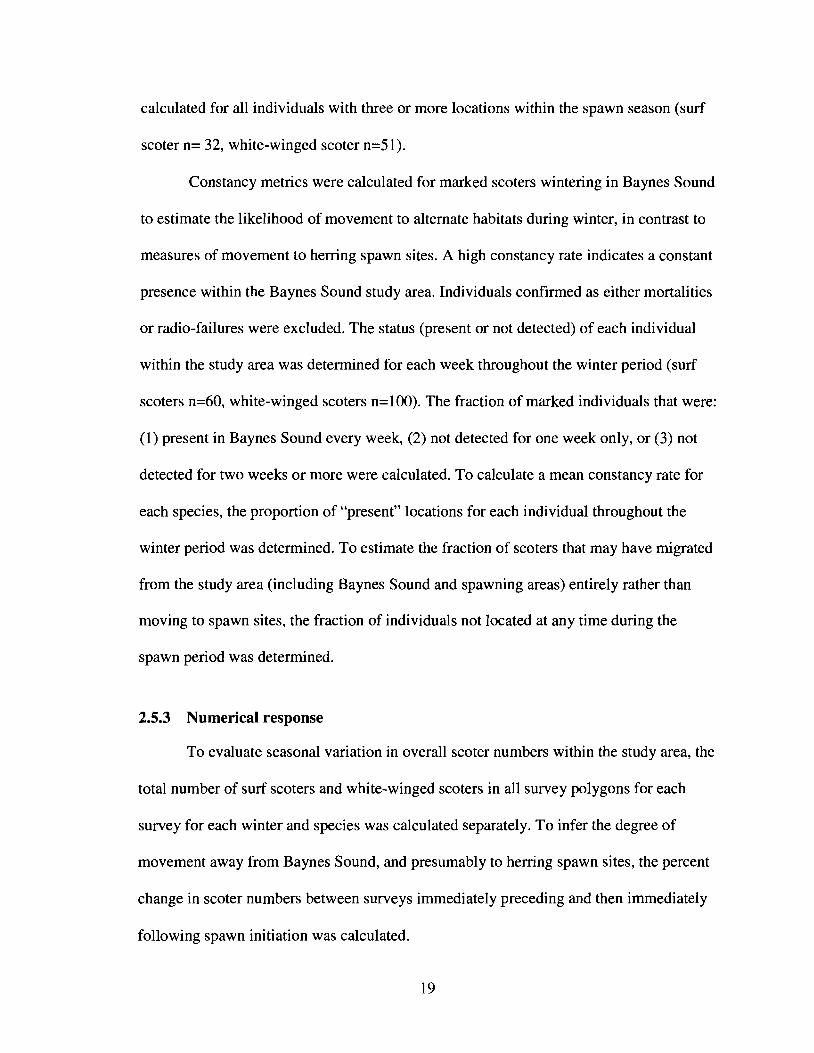
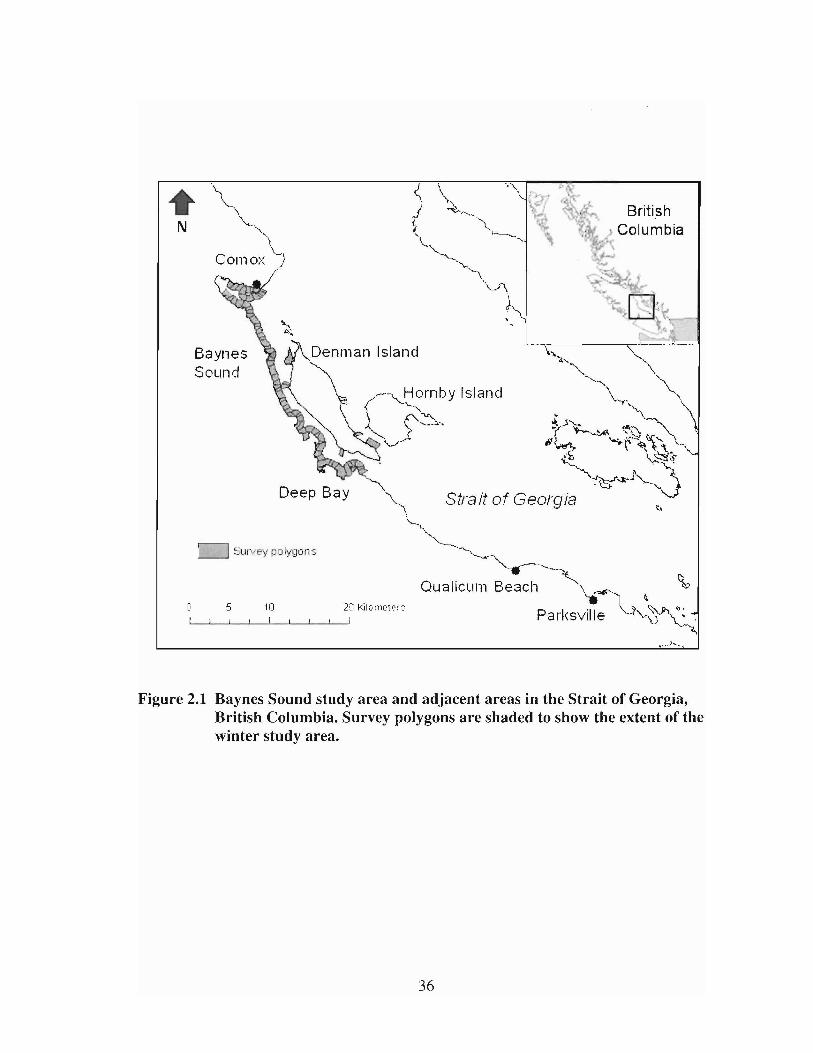
Baynes Sound study area and adjacent areas in the Strait ofGeorgia, Blitish Columbia. Survey polygons are shaded to showthe extent of the winter study area 36
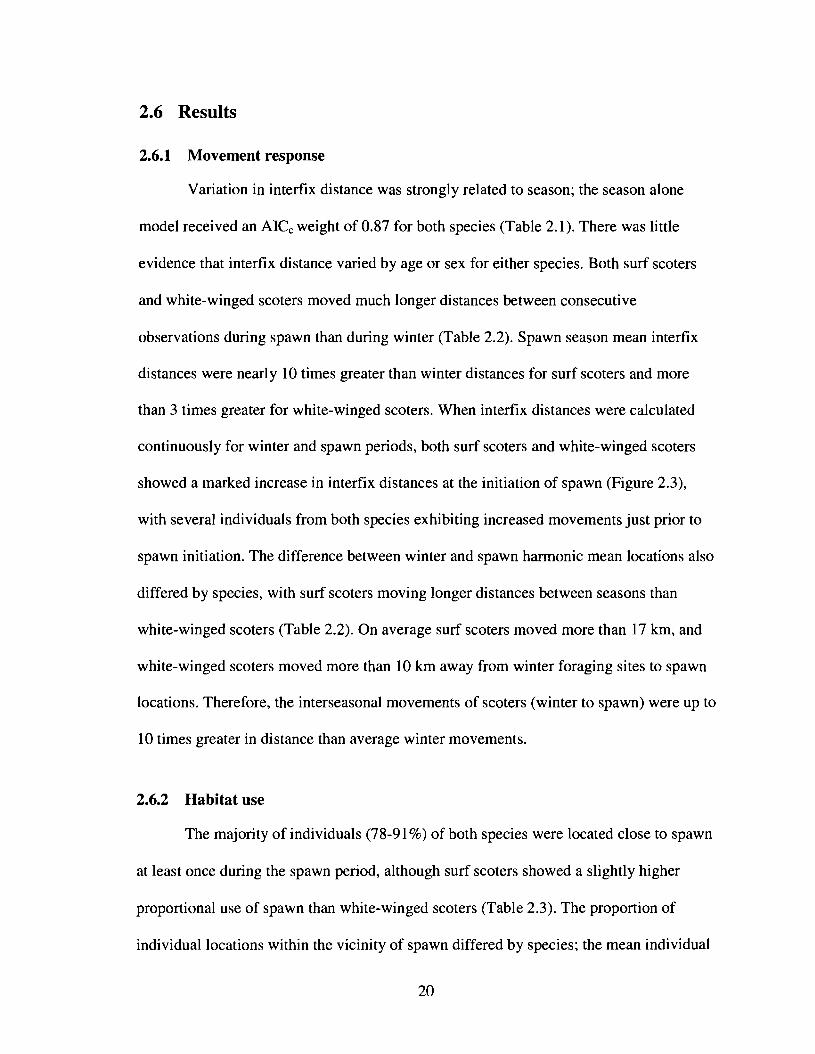
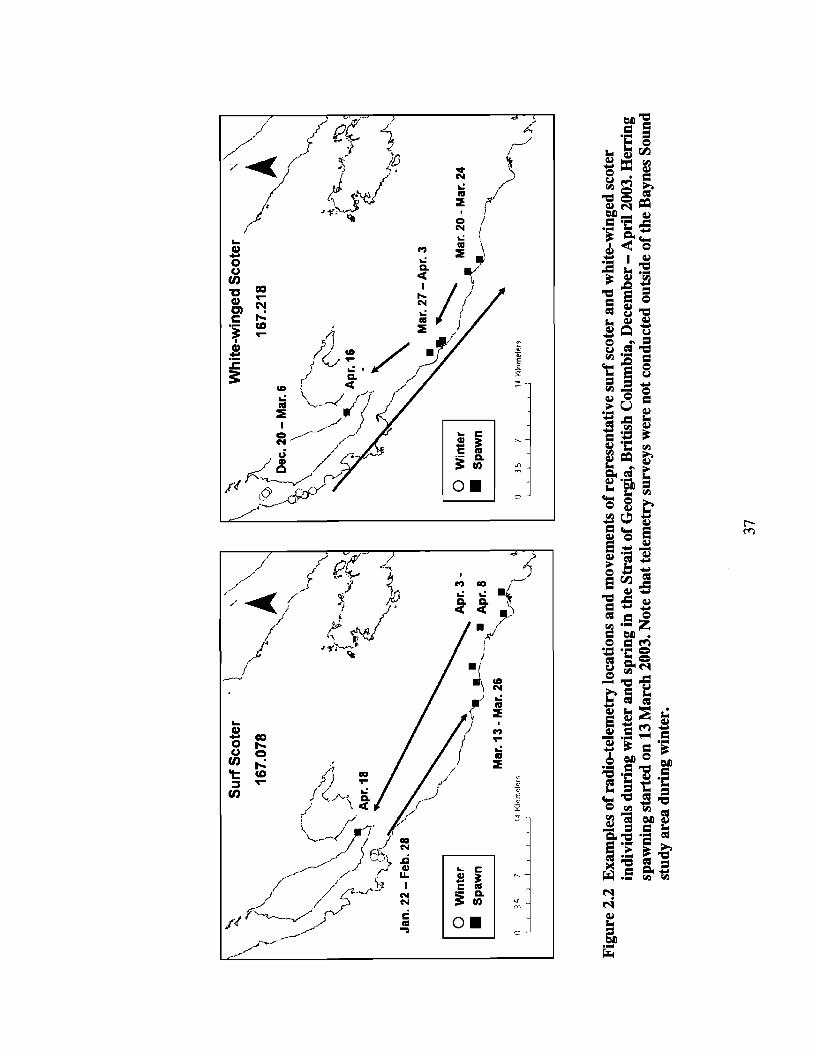
Examples of radio-telemetry locations and movements ofrepresentative surf scoter and white-winged scoter individualsdllling winter and spling in the Strait of Georgia, British Columbia,December - Aplil 2003. Herling spawning started on 13 March2003. Note that telemetry surveys were not conducted outside ofthe Baynes Sound study area duling winter.. .37
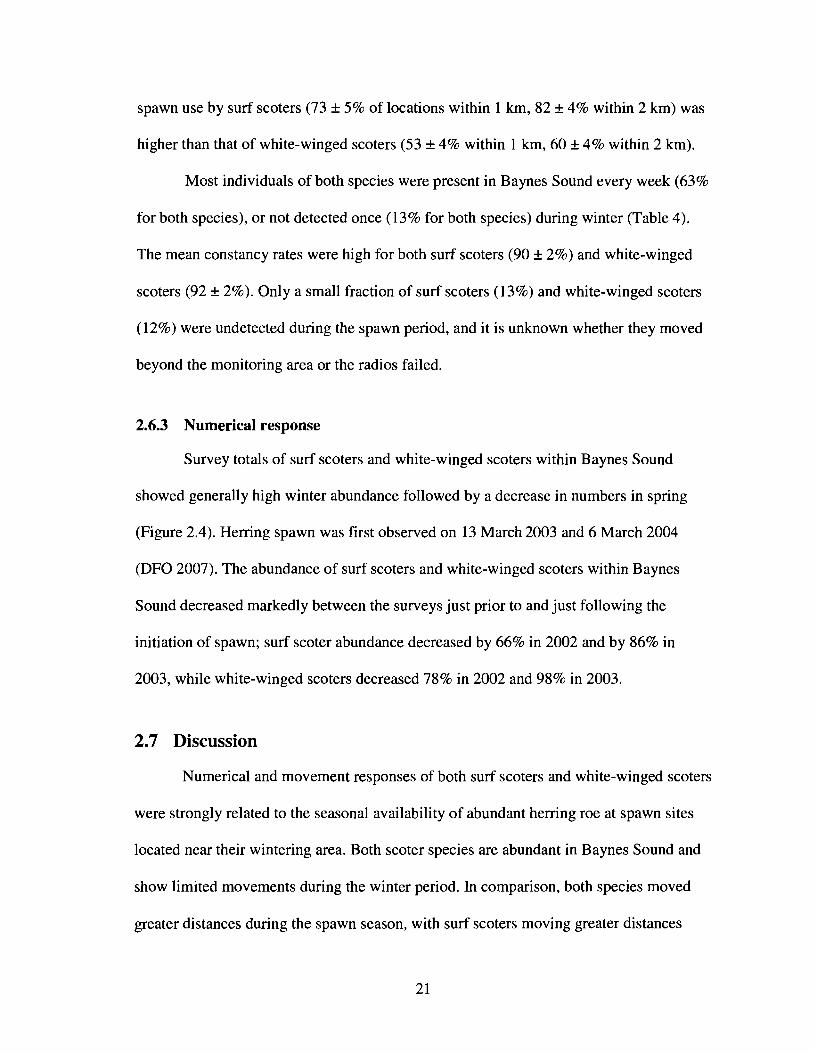
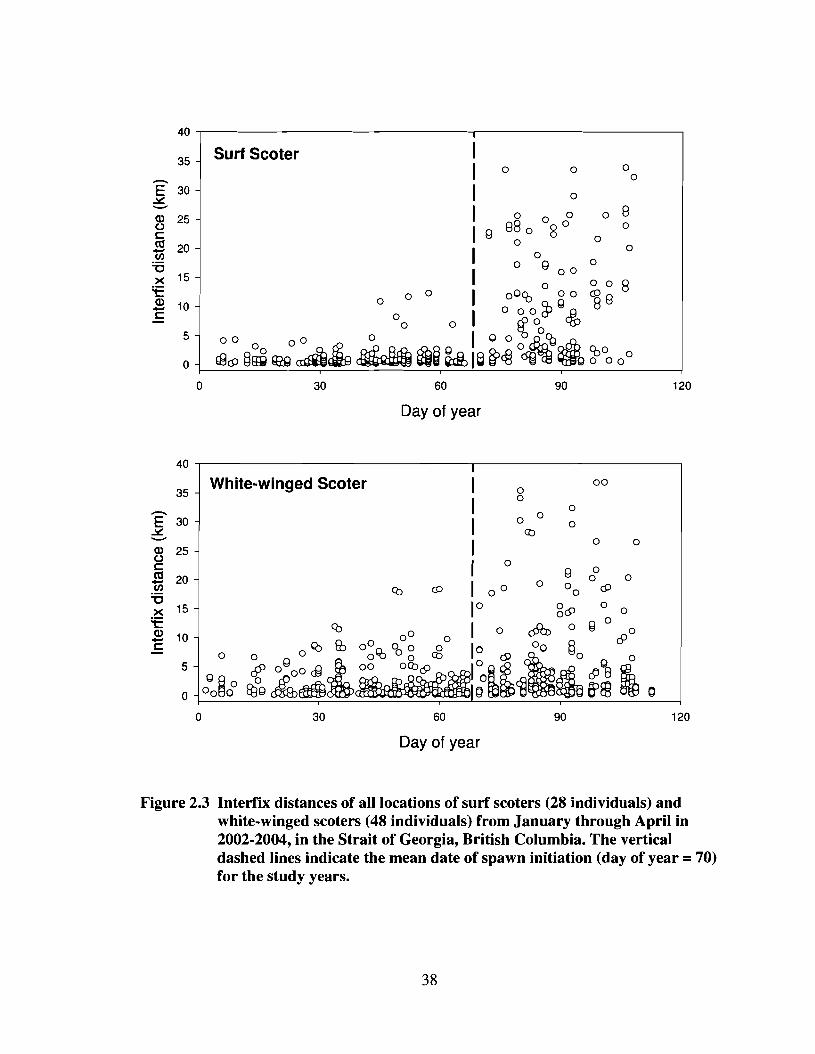
Interfix distances of all locations of surf scoters (28 individuals)and white-winged scoters (48 individuals) from January throughAplil in 2002-2004, in the Strait of Georgia, Blitish Columbia. Thevertical dashed lines indicate the mean date of spawn initiation(day of year = 70) for the study years .38
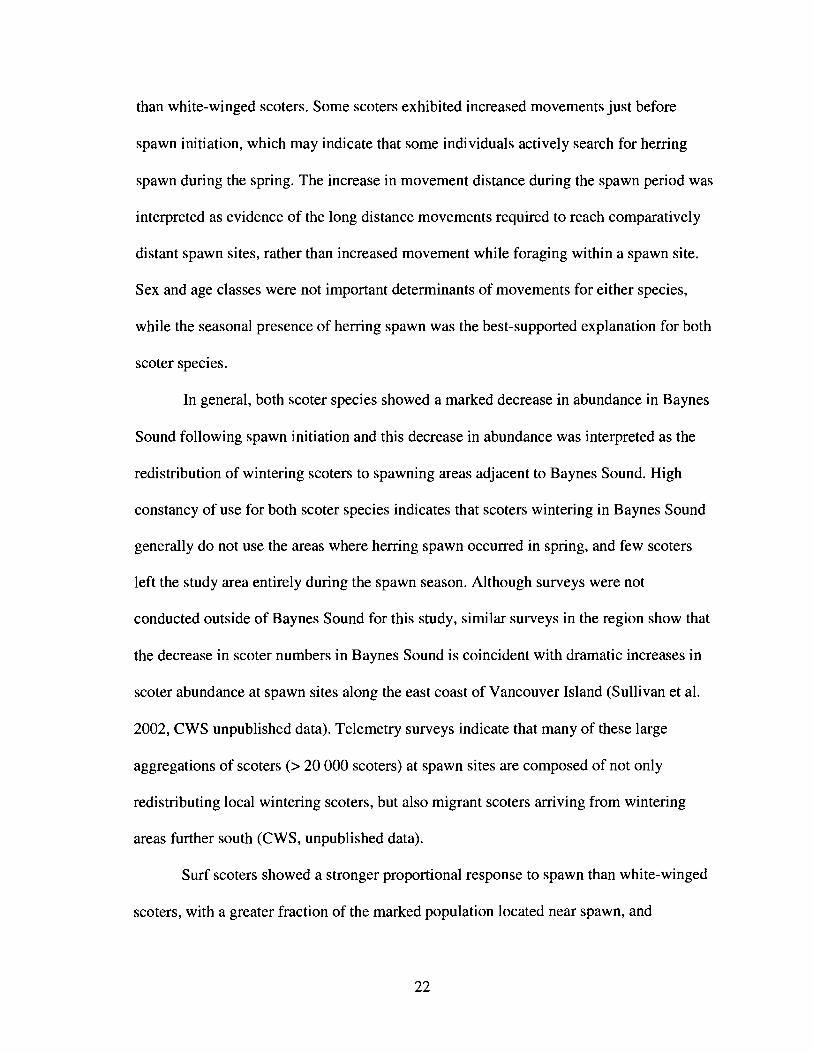
Abundance of surf scoters and white-winged scoters in BaynesSound for surveys from October to April in 2002-2003 and 2003-2004. The veltical dashed line indicates the date of spawninitiation each year. 39
Centroids of stopover areas of use (n=72) of 31 satellite-markedspring migrating surf scoters in southeast Alaska, 2003-2006. Anarea of use is defined as selies of at least two consecutive selectedlocations (representing a location on a single day) within 22 km ofeach other. 64
ImpOltant stopover sites of satellite-marked spling migrating surfscoters in southeast Alaska, 2003 - 2006. The box highlightsnorthern Lynn Canal, which is a unique and very heavily usedstopover area 65
Pacific herling management section centroids along the coasts ofBlitish Columbia and southeast Alaska. Only sections that haddocumented spawning activity from 2003 to 2006 are shown.Survey regions are highlighted by boxes; note that not all coastlinewithin highlighted regions was surveyed 96
Latitude and mean spawning date for all management sections withdocumented Pacific hen"ing spawning activity along the BritishColumbia and southeast Alaska coasts from 2003-2006 97
Comparison of helTing spawn availability and locations of PTT-tagged surf scoters along the coasts of British Columbia andsoutheast Alaska, 2003-2006. HelTing spawn availability (shadedarea) was determined by spawn times and estimates of the timebefore eggs hatch (mean spawn date + 21 days) 98
viii
LIST OF TABLES
Table 2.1 Summary of AIC results from general linear models assessing variationin mean interfix distance (lan) for surf scoters and white-wingedscoters during two seasons (winter and spawn) in Baynes Sound, Be.Individual (lndiv) models include sex and age as variables. Number ofparameters includes +1 for intercept and +1 for model variance.Candidate models are listed by LlA.ICc .32
Table 2.2 Summary of movement metrics of surf scoters and white-wingedscoters in Baynes Sound, British Columbia. Means are reported ± SE .33
Table 2.3 Fraction of radio-marked surf scoters and white-winged scoters locatedclose to active herring spawn sites in the Strait of Georgia, BritishColumbia, March and April 2002-2004 .34
Table 2.4 Fractions of radio-marked surf scoters (n =60) and white-wingedscoters (n =100) located during the winter in Baynes Sound, BritishColumbia. Winter was defined as the time from capture (December) tothe date of herring spawn initiation each spring (March) .35
Table 3.1 Summary of surf scoters marked with platform transmitter terminal(PTT) satellite transmitters in 2003-2006 from four wintering areas:San Quintin Bay, Baja California, Mexico (SQ), San Francisco Bay,California, USA (SF), Puget Sound, Washington, USA (PS), and Straitof Georgia, British Columbia (SG). Transmitters deployed that did notleave wintering areas are not included. Numbers in parentheses denotethe total number of birds used for stopover analyses. Individuals thatmigrated inland directly, died, or experienced radio failure were notincluded in stopover analyses 60
Table 3.2 Migration stopover sites of satellite marked spring migrating surfscoters in southeast Alaska during 2003 - 2006. Sites are ordered bylatitude from north to south 61
Table 3.3 Summary of AIC results from logistic regression models assessinghabitat variation in relation to whether plots were surf scoter stopoversites or random points. Shoreline models include length, depth, width,exposure, streams, and percent rocky substrate. Number of parametersincludes +1 for intercept. Candidate models are listed by ~AICc '" 62
Table 3.4 Habitat attributes of important stopover sites of spring-migrating .surfscoters in comparison to random sites. Attributes are summarized by 5km radius plots. Averages are reported with 95% CI. 63
IX
Table 4.1 Summary of surf scoters marked with platform transmitter terminal(PTT) satellite transmitters in 2003-2006 from four wintering areas:San Quintin Bay, Baja California, Mexico (SQ), San Francisco Bay,California, USA (SF), Puget Sound, Washington, USA (PS), and Straitof Georgia, British Columbia (SG). Transmitters deployed that did notleave wintering areas are not included. Numbers in parentheses denotethe total number of birds used for herring spawn use metrics.Individuals that migrated inland directly, died, or experienced radiofailure during migration were not included in analyses 91
Table 4.2 Summary of AIC results from general linear models assessing variationin spawning activity latitude of Pacific herring along the coasts ofBritish Columbia and southeast Alaska, 2003-2006. Number ofparameters (K) includes +1 for intercept and + 1 for model variance.Candidate models are listed by L\AICc• Note that AICc weights (Wi) sumto 1 and indicate the relative support for each candidate model. 92
Table 4.3 Summed Akaike weights (Wi), weighted parameter estimates, andunconditional standard errors (SEU) of weighted parameter estimatescalculated from all candidate models of herring spawn activity latitudealong the coasts of British Columbia and southeast Alaska, 2003-2006.Day of year is scaled so I January = 1. 93
Table 4.4 Summary of spawn site use metrics for surf scoters observed duringaerial surveys in three regions in southeast Alaska, April - May 2006 94
Table 4.5 Densities of surf scoters observed during aerial surveys in three regions(Ketchikan, Juneau, and Haines) in southeast Alaska, April-May 2006 95
x
CHAPTERl GENERAL INTRODUCTION
1.1 Thesis Background
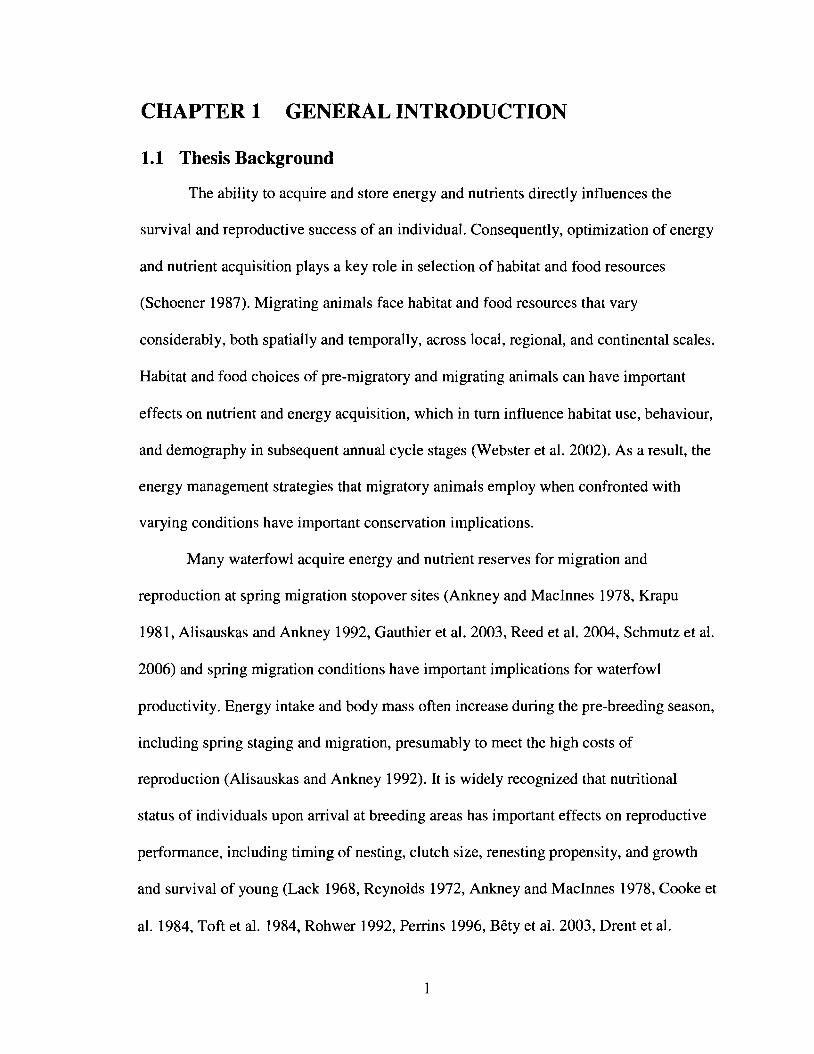
The ability to acquire and store energy and nutrients directly influences the
survival and reproductive success of an individual. Consequently, optimization of energy
and nutrient acquisition plays a key role in selection of habitat and food resources
(Schoener 1987). Migrating animals face habitat and food resources that vary
considerably, both spatially and temporally, across local, regional, and continental scales.
Habitat and food choices of pre-migratory and migrating animals can have important
effects on nutrient and energy acquisition, which in tum influence habitat use, behaviour,
and demography in subsequent annual cycle stages (Webster et al. 2002). As a result, the
energy management strategies that migratory animals employ when confronted with
varying conditions have important conservation implications.
Many waterfowl acquire energy and nutrient reserves for migration and
reproduction at spring migration stopover sites (Ankney and MacInnes 1978, Krapu
1981, Alisauskas and Ankney 1992, Gauthier et al. 2003, Reed et al. 2004, Schmutz et al.
2006) and spring migration conditions have important implications for waterfowl
productivity. Energy intake and body mass often increase during the pre-breeding season,
including spring staging and migration, presumably to meet the high costs of
reproduction (Alisauskas and Ankney 1992). It is widely recognized that nutritional
status of individuals upon arrival at breeding areas has important effects on reproductive
performance, including timing of nesting, clutch size, renesting propensity, and growth
and survival of young (Lack 1968, Reynolds 1972, Ankney and MacInnes 1978, Cooke et
al. 1984, Toft et al. 1984, Rohwer 1992, Perrins 1996, Bety et al. 2003, Drent et al.
1
2003). Habitat conditions and nutrient reserve levels during spring migration have been
implicated as important factors affecting broad-scale and long-term population declines
in lesser scaup (Aythya affinis) (Anteau and Afton 2004), indicating the potential
demographic importance of spring migration habitats.
In addition to the reproductive implications of spring habitat conditions, body
mass and energy intake tend to increase prior to migration, as many species accumulate
fat reserves to be used as fuel during journeys over less suitable habitat (Biebach et al.
1986). Many migrating birds require stopover sites with sufficient resources for building
or restoring reserves that will be used to fuel continued migration and/or reproduction. As
a result, the route and timing of migration are not influenced solely by foraging
conditions in start and end habitats (i.e., wintering and breeding) but also by habitat
conditions along the route. Consequently, migration strategies are influenced by both the
spatial and seasonal variability of food resources (Ottich and Dierschke 2003).
A variety of biotic and abiotic factors influence the distribution of a species,
including the distribution and abundance of food resources (Womble et al. 2005).
Animals modify their behaviour to utilize seasonally available energy pulses (Odum et al.
1995), and many animals depend on seasonally superabundant food for survival,
reproduction, or fueling migration (Botton et al. 1994, Restani et al. 2000). Migrating
herbivorous birds are speculated to strategically time migration phenology to take
advantage of emergent spring growth of forage plants at stopover and staging sites (van
der Graaf et al. 2006). This green wave hypothesis posits that birds travel along a climatic
gradient while migrating from wintering areas to arctic breeding areas to follow the wave
of emergent spring vegetation at higher latitudes (Owen 1980). In coastal ecosystems,
2
many avian species exhibit aggregative responses to ephemeral seasonal resource pulses
such as Pacific herring (Clupea pallasi) and eulachon (Thaleicthyes pacificus) spawning
events, which provide important food resources (Haegele 1993, Marston et al. 2002,
Sullivan et al. 2002, Rodway et al. 2003). The use of these ephemeral and energy-rich
resources has been documented for both mammals and birds on local and regional scales
(Marston et al. 2002, Rodway et al. 2003, Womble et aI. 2005, Zyde1is and Esler 2005),
but have not been considered on a continental or migratory scale.
Scoters are sea ducks (Tribe Mergini) that winter along the Pacific coast from the
Aleutian Islands southward into Mexico and breed throughout the northern boreal and
southern taiga regions of Alaska and western Canada (Savard et al. 1998). In wintering
areas, surf scoters (Melanitta perspicillata) feed primarily on bivalves, consuming
mussels in rocky substrates and clams in soft-bottomed areas (Vermeer 1981, Iverson
2002, Lewis et al. 2005). White-winged scoters (Melanitta fusca) feed primarily on clams
and are more closely associated with soft-bottomed areas (Lewis et al. 2005). Spring
migration ecology is poorly documented for scoters, and little is known about the specific
habitats and attributes that determine use of staging and stopover areas (Savard et al.
1998). Along the Pacific coast, scoters are known to congregate at herring spawn sites
during late winter and early spring (Vermeer 1981, Vermeer et al. 1997, Sullivan et al.
2002), and it has been speculated that they proceed northward during migration in
association with the northward progress of herring spawn (Vermeer 1981, Savard et al.
1998), but these observations are anecdotal and have not been quantified.
The general objective of this thesis was to gain a better understanding about
habitat use by scoters during late winter and spring migration, with particular emphasis
3
on the use of herring spawn as an ephemeral resource. More specifically, the purpose of
this thesis was to (1) evaluate how scoters move in response to the presence of herring
spawn prior to spring migration, (2) identify important stopover sites for spring migrating
surf scoters, and the habitat attributes of these sites, and (3) examine the site use by
spring migrating surf scoters in relation to herring spawn activity at regional and
migratory scales.
Surveys throughout the annual cycle have indicated continental declines in
numbers of scoters (USFWS 1999, Nysewander et al. 2004) and the causes of these
declines are uncertain. Considering the population implications of survival and
reproduction, studies that document patterns of habitat use and energy acquisition by
waterfowl may be used to identify critical stages and habitats in the annual cycle
(LaGrange and Dinsmore 1988). The objectives addressed in this thesis will have direct
implications for the identification of important coastal habitats, and the management of
these areas.
1.2 Study Areas
On a local scale, we considered movements of pre-migratory scoters wintering in
Baynes Sound, British Columbia. Baynes Sound is on the east coast of Vancouver Island,
on the western side of the Strait of Georgia. It is a shallow coastal channel characterized
by many protected bays, intertidal mud and sand flats, and low-gradient deltas. Baynes
Sound is recognized as an Important Bird Area by Bird Studies Canada and Nature
Canada, and is considered globally important due to the large number of over-wintering
water birds. Surveys in the winters of 2002-2003 and 2003-2004 indicated a mean (± SE)
of 6500 ± 250 surf scoters and white-winged scoters (Lewis et al. 2005) and a maximum
4
of 9000 scoters (Canadian Wildlife Service, unpublished data). Behavioural observations
and scoter fecal samples indicate that the scoters here forage almost exclusively on clams
in the soft-bottom beaches (Lewis et al. 2007).
On a regional and continental scale, we concentrated our studies of site use by
migrating scoters in southeast Alaska. The coastal area of Southeast Alaska is extremely
variable, from highly exposed west aspect shores of the Pacific Ocean to very sheltered
fjords and tidewater glaciers along the protected inside passages. The southern part of
southeast Alaska is characterized by extensive networks of islands and protected bays and
channels, while the northern part of southeast Alaska is comprised of numerous long
fjords and several large soft-bottomed river deltas.
1.3 Thesis Outline
The purpose of this thesis was to document site use by scoters in both late winter
and during spring migration, with particular emphasis on the use of herring spawn. It is
intended to be broad in geographic scope, addressing habitat use from local to continental
scales.
Chapter 2 documents the movements and habitat use of pre-migratory surf scoters
and white-winged scoters in relation to herring spawn events in the Strait of Georgia.
Responses were evaluated on a local scale, emphasizing the movements and numerical
responses of surf scoters and white-winged scoters to the presence of an ephemeral
abundant food resource.
Chapter 3 identifies coastal sites in southeast Alaska with surf scoter aggregations
during spring migration based on satellite telemetry. Important staging and stopover sites
were identified for satellite tagged surf scoters from sites throughout their wintering
5
range (Baja California, Mexico; San Francisco Bay; Puget Sound; and the Strait of
Georgia), with the intent of drawing inferences about migration habitat use strategies of
Pacific surf scoters in general. In addition, the biotic and abiotic habitat attributes of
identified sites were related to scoter use during spring migration. Chapter 4 documents
the spatial and temporal availability of herring spawn along the Pacific coast and
compares the migration strategies of spring migrating surf scoters to herring spawn
availability at regional and migratory scales.
Although habitat use during spring has been documented in other sea duck species
and recorded anecdotally, these issues have not been quantified specifically for surf
scoters. In addition, no other study of sea ducks has monitored migration strategies and
habitat use of marked individuals from a broad array of wintering areas. Habitat use by
late spring-staging and migrating surf scoters may have important implications for
understanding the cross-seasonal effects of habitat conditions and nutrient reserve levels
on population dynamics, with subsequent habitat management implications. This study
will contribute to general knowledge about spring migration strategies in surf scoters, by
contributing to ongoing studies of body mass variation in relation to areas, seasons, and
spawn occurrence. This suite of studies will provide an important link for understanding
nutritional status and relationships between wintering, migrating, and breeding areas.
6
1.4 References
Alisauskas, R. T., and C. D. Ankney. 1992. The cost of egg laying and its relationship tonutrient reserves in waterfowl. Pages 30-61 in B. D. J. Batt, A. D. Afton, M. G.Anderson, C. D. Ankney, D. H. Johnson, J. A. Kadlec, and G. L. Krapu, editors.Ecology and management of breeding waterfowl. University of Minnesota PressMinneapolis Minnesota & London England.
Ankney, C. D., and C. D. MacInnes. 1978. Nutrient reserves and reproductiveperformance of female lesser snow geese. Auk 95:459-471.
Anteau, M. J., and A. D. Afton. 2004. Nutrient reserves of lesser scaup (Aythya affinis)during spring migration in the Mississippi Flyway: A test of the spring conditionhypothesis. Auk 121:917-929.
Bety, J., G. Gauthier, and J. F. Giroux. 2003. Body condition, migration, and timing ofreproduction in snow geese: A test of the condition-dependent model of optimalclutch size. American Naturalist 162: 110-121.
Biebach, H., W. Friedrich, and G. Heine. 1986. Interaction of bodymass, fat, foraging andstopover period in trans-Sahara migrating passerine birds. Oecologia 69:370-379.
Botton, M. L., R. E. Loveland, and T. R. Jacobsen. 1994. Site selection by migratoryshorebirds in Delaware Bay, and its relationship to beach characteristics andabundance of horseshoe crab (Limulus polyphemus) eggs. Auk 111:605-616.
Cooke, F., C. S. Findlay, and R. F. Rockwell. 1984. Recruitment and the timing ofreproduction in lesser snow geese (Chen caerulescens caerulescens). Auk101:451-458.
Drent, R., C. Both, M. Green, J. Madsen, and T. Piersma. 2003. Pay-offs and penalties ofcompeting migratory schedules. Oikos 103:274-292.
Gauthier, G., J. Bety, and K. A. Hobson. 2003. Are greater snow geese capital breeders?New evidence from a stable-isotope model. Ecology 84:3250-3264.
Haegele, C. W. 1993. Seabird predation of Pacific herring, Clupea pallasi, spawn inBritish Columbia. Canadian Field-Naturalist 107:73-82.
Iverson, S. A. 2002. Recruitment and the spatial organization of surf scoter (Melanittaperspicillata) populations during winter in the Strait of Georgia, BritishColumbia. MSc Thesis, Simon Fraser University, Burnaby, British Columbia.
Krapu, G. L. 1981. The role of nutrient reserves in mallard reproduction. Auk 98:29-38.
7
Lack, D. 1968. Ecological adaptations for breeding in birds. Methuen & Co. Ltd. London.
LaGrange, T. G., and J. J. Dinsmore. 1988. Nutrient reserve dynamics of female mallardsduring spring migration through central Iowa. Pages 287-297 in Waterfowl inwinter. University of Minnesota Press,Minneapolis, Minnesota, USA.
Lewis, T. L., D. Esler, and W. S. Boyd. 2007. Effects of predation by sea ducks on clamabundance in soft-bottom intertidal habitats. Marine Ecology-Progress Series329:131-144.
Lewis, T. L., D. Esler, W. S. Boyd, and R. Zydelis. 2005. Nocturnal foraging behavior ofwintering surf scoters and white-winged scoters. Condor 107:637-647.
Marston, B. H., M. F. Willson, and S. M. Gende. 2002. Predator aggregations duringeulachon Thaleichthys pacificus spawning runs. Marine Ecology-Progress Series231 :229-236.
Nysewander, D. R., J. R. Evenson, B. M. Murphie, and T. C. Cyra. 2004. Trendsobserved for selected marine bird species during 1993-2002 winter aerial surveys.Proceedings of Georgia BasinJPuget Sound Research Conference.
Odum, W. E., E. P. Odum, and H. T. Odum. 1995. Nature's pulsing paradigm. Estuaries18:547-555.
Ottich, 1., and V. Dierschke. 2003. Exploitation of resources modulates stopoverbehaviour of passerine migrants. Journal Fur Ornithologie 144:307-316.
Owen, M. 1980. Wild geese of the world. Batsford London.
Perrins, C. M. 1996. Eggs, egg formation and the timing of breeding. Ibis 138:2-15.
Reed, E. T., G. Gauthier, and J. F. Giroux. 2004. Effects of spring conditions on breedingpropensity of greater snow goose females. Animal Biodiversity and Conservation27:35-46.
Restani, M., A. R. Harmata, and E. M. Madden. 2000. Numerical and functionalresponses of migrant bald eagles exploiting a seasonally concentrated foodsource. Condor 102:561-568.
Reynolds, C. M. 1972. Mute swan weights in relation to breeding. Wildfowl 23:111-118.
Rodway, M. S., H. M. Regehr, J. Ashley, P. V. Clarkson, R. 1. Goudie, D. E. Hay, C. M.Smith, and K. G. Wright. 2003. Aggregative response of harlequin ducks toherring spawning in the Strait of Georgia, British Columbia. Canadian Journal ofZoology 81:504-514.
8
Rohwer, F. C. 1992. The evolution of reproductive patterns in waterfowl. Pages 486 in B.D. J. Batt, A D. Afton, M. G. Anderson, C. D. Ankney, D. H. Johnson, J. AKadlec, and G. L. Krapu, editors. Ecology and management of breedingwaterfowl. University of Minnesota Press Minneapolis Minnesota & LondonEngland.
Savard, J.-P. L., D. Bordage, and A Reed. 1998. Surf scoter (Melanitta perspicillata).Birds of North America 363:1-27.
Schmutz, J. A, K A. Hobson, and J. A Morse. 2006. An isotopic assessment of proteinfrom diet and endogenous stores: effects on egg production and incubationbehaviour of geese. Ardea 94:385-397.
Schoener, T. W. 1987. A brief history of optimal foraging ecology. Pages 5-67 in A C.Kamil, J. R. Krebs, and H. R. Pulliam, editors. Foraging Behavior. PlenumPress,New York, NY, USA.
Sullivan, T. M., R. W. Butler, and W. S. Boyd. 2002. Seasonal distribution of waterbirdsin relation to spawning Pacific herring, Clupea pallasi, in the Strait of Georgia,British Columbia. Canadian Field-Naturalist 116:366-370.
Toft, C. A, D. L. Trauger, and H. W. Murdy. 1984. Seasonal decline in brood sizes ofsympatric waterfowl (Anas and Aythya, Anatidae) and a proposed evolutionaryexplanation. Journal of Animal Ecology 53:75-92.
USFWS. 1999. Population status and trends of sea ducks in Alaska. U.S. Fish andWildlife Service, unpublished report. Migratory Bird Management, Anchorage,Alaska 99503.
van der Graaf, A J., J. Stahl, A Klimkowska, J. A Bakker, and R. H. Drent. 2006.Surfing on a green wave - how plant growth drives spring migration in thebarnacle goose (Bmnta leucopsis). Ardea 94:567-577.
Vermeer, K 1981. Food and populations of surf scoters in British Columbia. Wildfowl32:107-116.
Vermeer, K, M. Bentley, K H. Morgan, and G. E. J. Smith. 1997. Association of feedingflocks of brant and sea ducks with herring spawn at Skidegate Inlet. CanadianWildlife Service Occasional Paper 93: 102-107.
Webster, M. S., P. P. Marra, S. M. Haig, S. Bensch, and R. T. Holmes. 2002. Linksbetween worlds: unraveling migratory connectivity. Trends in Ecology &Evolution 17:76-83.
9

Womble, J. N., M. F. Willson, M. F. Sigler, B. P. Kelly, and G. R VanBlaricom. 2005.Distribution of Steller sea lions Eumetopias jubatus in relation to spring-spawningfish in SE Alaska. Marine Ecology Progress Series 294:271-282.
Zydelis, R, and D. Esler. 2005. Response of wintering Steller's eiders to herring spawn.Waterbirds 28:344-350.
10
CHAPTER 2 MOVEMENTS OF PRE-MIGRATORY SURFAND WHITE-WINGED SCOTERS IN RESPONSE TOPACIFIC HERRING SPAWN
This chapter has been accepted for publication as follows:
Lok, E. K., M. Kirk, D. Esler, and W. S. Boyd. In press. Movements of pre-migratorySurf and White-winged scoters in response to herring spawn in the Strait ofGeorgia, British Columbia. Waterbirds.
11
2.1 Abstract
We documented the movement and distribution patterns of wintering surf scoters
(Melanitta perspicillata) and white-winged scoters (Melanittajusca) in relation to herring
spawn events in the Strait of Georgia, British Columbia. Radio-telemetry and surveys
were conducted in Baynes Sound, an important wintering area where scoters feed
primarily on clams. In early March, herring spawn events in areas adjacent to Baynes
Sound provide a short-term pulse of abundant and easily accessible food, which we
speculated could affect habitat use by wintering scoters from Baynes Sound. Radio
marked surf scoters and white-winged scoters exhibited limited movements during
winter, in contrast to the spring herring spawn season, when both scoter species moved
greater distances to access herring eggs. Most individuals were located near spawning
locations at least once during the spawning season, and the majority of telemetry
locations were close to spawning sites, with surf scoters showing a higher association
with spawn for both metrics. A marked decrease (66-98%) in the abundance of both
scoter species in Baynes Sound was observed coincident with spawn initiation in adjacent
sites. We conclude that scoters altered their movement and habitat use patterns in spring
to take advantage of herring roe, an energy-rich food source. This dramatic change in
behaviour suggests that herring spawn may be of particular importance to these species.
12
2.2 Introduction
Many animals modify their habitat use to take advantage of seasonally available
foods (Odum et al. 1995) that may enhance survival or reproduction, or fuel migration
(Botton et al. 1994, Restani et al. 2000). In coastal ecosystems, mammals and birds are
known to aggregate at seasonal resource pulses such as fish spawning events and
consume both adult fish and eggs (Bishop and Green 2001, Marston et al. 2002, Sigler et
al. 2004, Womble et al. 2005). The annual spawning of Pacific herring (Clupea pallasi) is
a conspicuous example of a seasonal resource pulse for numerous avian predators.
Although herring spawning locations are very localized (DFO 2007), herring eggs are
abundant at spawn sites for several weeks during late winter and early spring. Scoters and
other sea ducks are known to feed heavily on this resource when it is available (Haegele
1993, Vermeer et al. 1997, Sullivan et al. 2002, Rodway et al. 2003). The importance of
herring spawn as a source of nutrients for migration and reproduction in sea ducks has
been speculated (Rodway et al. 2003, Zydelis and Esler 2005), but this association has
rarely been measured (Bond and Esler 2006).
To evaluate the importance of herring spawn to Pacific scoter populations, the
distribution and movement patterns of individual surf scoters (Melanitta perspicillata)
and white-winged scoters (Melanittafusca) were documented during winter and spring.
Although scoters are known to aggregate at spawn sites, the influence of herring spawn
on distributions and individual movements of local wintering scoters has never been
quantified. We predicted that if herring spawn is an important source of nutrients for
scoters in late winter, we would observe: (1) movements to spawn beyond the normal
winter foraging range of individuals, (2) a high proportion of individuals using spawn, (3)
13

a high use of spawn sites by marked individuals during the spawn period, and (4) changes
in population distribution from winter to spawn seasons.
2.3 Study Area
The study was conducted in and around Baynes Sound, on the east coast of
Vancouver Island (49.5° N, 124.8° W) (Figure 2.1). Baynes Sound is a wide, protected
channel and the intertidal habitat is composed primarily of low-grade deltas and soft
bottomed tidal flats. The winter diet of scoters consists almost exclusively of clams
(Bourne 1984, Lewis et al. 2007a). Annual herring spawn activity in the region generally
starts in the first or second week of March. Although herring spawn events occur at a few
locations within the Baynes Sound study area, most spawn events occur just outside of
Baynes Sound at sites on the east coast of Denman Island, Hornby Island, and along the
east coast of Vancouver Island south of Baynes Sound (DFO 2007).
The Department of Fisheries and Oceans (DFO) calculates a cumulative spawn
habitat index (SHI) that represents the combined long-term frequency and magnitude of
herring spawn events along each kilometer of coastline over time (DFO 2007). This
measure of shoreline utilization by spawning herring is calculated as the product of the
spawn shoreline length (m) and a spawn coefficient based on spawn width (m),
numberegg layers, and percent cover, and is then pooled geographically. The total
cumulative spawn habitat index for shoreline within the Baynes Sound study area is
approximately one quarter of the spawn habitat index in the adjacent areas. Because
herring spawn sites are generally located outside of the Baynes Sound wintering area and
have a markedly higher frequency and magnitude of herring spawn activity, this study
14
area provides a good system for documenting the movement responses of wintering
scoters to herring spawn.
2.4 Methods
2.4.1 Radio-telemetry
Sun scoters and white-winged scoters were captured in late fall during 2001-2003
using a modified floating mist-net system (Kaiser et al. 1995). Birds were banded and
weighed, sex was determined by plumage characteristics (Iverson et al. 2003), and age
class was estimated by bursal probing (Mather and Esler 1999). The birds were fitted
with subcutaneous transmitters or implanted with internal coelomic VHF radios with
external antennae following standard procedures (Mulcahy and Esler 1999). These radio
types penorm well for scoters with low mortality effects and good signal strength,
accuracy, and retention (Iverson et al. 2006). Transmitters had an expected transmission
period of up to 18 months. Over the three study years, radio transmitters were deployed
on 116 sun scoters (2001 n=42, 2002 n=47, 2003 n=27) and 138 white-winged scoters
(2001 n=56, 2002 n=34, 2003 n=48). Radio-marked scoters were tracked within Baynes
Sound throughout the winter and spring. Each individual was located weekly or twice
weekly when possible. At the beginning of herring spawn, the telemetry survey routes
were expanded to include scoter concentrations along the east coast of Vancouver Island,
Denman Island, and Hornby Island (Figure 2.2).
Fixes were obtained by determining the compass range of the null of a signal
using a null/peak combiner (Kuechle 2005). Radio-telemetry was conducted by observers
in two separate vehicles, each mounted with four-element Yagi antennae and
programmable scanning receivers (Advanced Telemetry Systems, Isanti, MN).
15
Simultaneous bearings were taken by the two observers to obtain bi-angulated locations.
Error testing of the telemetry system indicated that observer bearings had a standard
deviation of ± 4.20 from the true bearing and a mean 90% error polygon of 0.07 km2 (±
0.004 SE). Given the size of the study area, these errors are relatively small and yield
locations with adequate accuracy for analyzing movement and habitat use.
Telemetry bearings were processed using Location of a Signal (LOAS) software
(ESS 2004). Biangulated locations were output from LOAS into ArcView 3.3
(Environmental Systems Research Institute 1999) to visually check for accuracy. The
scoter location dataset was filtered to remove locations with non-intersecting bearings,
locations that occurred significantly inland (>100 m), and locations greater than 4 km
from observers that may have been unreliable due to weak signal strength. The scoter
location dataset was divided into winter and spawn seasons based on the date of spawn
initiation for each study year (12 March 2002, 13 March 2003, 6 March 2004). Using the
filtered dataset, all analyses of movement metrics were carried out in ArcView 3.3 using
the Animal Movement extension (AME) (Hooge and Eichenlaub 1997).
2.4.2 Seoter distribution surveys
Surveys were conducted in Baynes Sound to evaluate seasonal variation in scoter
abundance and distribution patterns. The study area (from Comox to Deep Bay) was
divided into survey polygons approximately 1.5 km in length that extended 800 m from
shore (Figure 2.1). Polygons were delineated according to habitat and anthropogenic
characteristics of the environment. Counts were made using spotting scopes from one,
two, or three observation points along the shore of each polygon. Surveys were
conducted approximately biweekly from October to April during winters 2002-2003 and
16
2003-2004. Surveys were carried out only under good visibility conditions (i.e., surveys
were suspended during fog, snow, heavy rain or winds exceeding 10 knots). Surveys
were not conducted at herring spawn sites outside Baynes Sound.
2.5 Data Analyses
2.5.1 Movement metrics
The mean distance between consecutive locations, or interfix distance, was
calculated using all locations for each individual using the "Location Statistics" function
of AME (Kirk et al. 2008). Interfix distances during winter and spawn were calculated for
any individual with three or more locations within a season (surf scoter n=66 winter,
n=32 spawn; white-winged scoter n= 112 winter, n=5l spawn). We combined data across
years based on the findings of Kirk et al. (2008) that winter movements within Baynes
Sound were consistently small. In addition, this metric was calculated continuously for
the winter and spawn seasons combined for individuals that had at least three locations in
both winter and spawn seasons (surf scoter n= 28, white-winged scoter n= 48). The
interseason distance, defined as the distance between the harmonic mean location (i.e.,
centre of activity) for each season (Smith et al. 1999), was calculated for individuals that
had at least three locations in both winter and spawn seasons. The X and Y coordinates
(easting and northing) of the harmonic mean location within each season were used to
calculate the interseason distance (d) as:
2 2 1/2d =[(Xwinter - Xspawn) + (Ywinter - Yspawn) ]
Least squares general linear models were used to evaluate variation in interfix
distances in relation to season and individual attributes for both surf scoters and white-
17
winged scoters. An information theoretic approach to model selection (Burnham and
Anderson 2002) was used to calculate Akaike's Information Criterion adjusted for small
sample sizes (AICc) for each model within a candidate set. The candidate model set used
for each species separately consisted of the following models: season alone, individual
(sex and age class) alone, season and individual additively, a season-individual
interaction (season*sex*age), and a null model. The individual parameter always
included both a sex variable (male or female) and an age variable (hatch-year or adult).
The AICc value of each model was compared to that of the best-fitting model (~AICc) to
assess the relative support for each candidate model. AICcweights, which indicate the
relative support for each model within the candidate model set, were calculated. The
statistical package SAS (SAS Institute 2003) was used to run general linear models.
2.5.2 Habitat use metrics
To estimate the fraction of scoters using spawn, the proportion of marked
individuals present during the spawn season that were located at least once within
specified distances of known herring spawn sites was determined. Shapefiles of spawn
presence in the study area for 2002, 2003, and 2004 were obtained from the Department
of Fisheries and Oceans, and buffers of 1 km and 2 km around these themes were created
in ArcView 3.3. Scoter locations were selected and classified in relation to known spawn
sites (~ 1 km, ~ 2 km, > 2 km) for each year.
The proportion of an individual's total number of locations during the spawn
season that were within the vicinity of spawn using 1 km and 2 km buffers was
determined to calculate an index of spawn use by individual scoters. Spawn use was
18
calculated for all individuals with three or more locations within the spawn season (surf
scoter n= 32, white-winged scoter n=5l).
Constancy metrics were calculated for marked scoters wintering in Baynes Sound
to estimate the likelihood of movement to alternate habitats during winter, in contrast to
measures of movement to herring spawn sites. A high constancy rate indicates a constant
presence within the Baynes Sound study area. Individuals confirmed as either mortalities
or radio-failures were excluded. The status (present or not detected) of each individual
within the study area was detennined for each week throughout the winter period (surf
scoters n=60, white-winged scoters n=100). The fraction of marked individuals that were:
(l) present in Baynes Sound every week, (2) not detected for one week only, or (3) not
detected for two weeks or more were calculated. To calculate a mean constancy rate for
each species, the proportion of "present" locations for each individual throughout the
winter period was determined. To estimate the fraction of scoters that may have migrated
from the study area (including Baynes Sound and spawning areas) entirely rather than
moving to spawn sites, the fraction of individuals not located at any time during the
spawn period was determined.
2.5.3 Numerical response
To evaluate seasonal variation in overall scoter numbers within the study area, the
total number of surf scoters and white-winged scoters in all survey polygons for each
survey for each winter and species was calculated separately. To infer the degree of
movement away from Baynes Sound, and presumably to herring spawn sites, the percent
change in scoter numbers between surveys immediately preceding and then immediately
following spawn initiation was calculated.
19
2.6 Results
2.6.1 Movement response
Variation in interfix distance was strongly related to season; the season alone
model received an Alec weight of 0.87 for both species (Table 2.1). There was little
evidence that interfix distance varied by age or sex for either species. Both surf scoters
and white-winged scoters moved much longer distances between consecutive
observations during spawn than during winter (Table 2.2). Spawn season mean interfix
distances were nearly 10 times greater than winter distances for surf scoters and more
than 3 times greater for white-winged scoters. When interfix distances were calculated
continuously for winter and spawn periods, both surf scoters and white-winged scoters
showed a marked increase in interfix distances at the initiation of spawn (Figure 2.3),
with several individuals from both species exhibiting increased movements just prior to
spawn initiation. The difference between winter and spawn harmonic mean locations also
differed by species, with surf scoters moving longer distances between seasons than
white-winged scoters (Table 2.2). On average surf scoters moved more than 17 km, and
white-winged scoters moved more than 10 km away from winter foraging sites to spawn
locations. Therefore, the interseasonal movements of scoters (winter to spawn) were up to
10 times greater in distance than average winter movements.
2.6.2 Habitat use
The majority of individuals (78-91 %) of both species were located close to spawn
at least once during the spawn period, although surf scoters showed a slightly higher
proportional use of spawn than white-winged scoters (Table 2.3). The proportion of
individual locations within the vicinity of spawn differed by species; the mean individual
20
spawn use by surf scoters (73 ± 5% of locations within I kIn, 82 ± 4% within 2 kIn) was
higher than that of white-winged scoters (53 ± 4% within I km, 60 ± 4% within 2 kIn).
Most individuals of both species were present in Baynes Sound every week (63%
for both species), or not detected once (13% for both species) during winter (Table 4).
The mean constancy rates were high for both surf scoters (90 ± 2%) and white-winged
scoters (92 ± 2%). Only a small fraction of surf scoters (13%) and white-winged scoters
(12%) were undetected during the spawn period, and it is unknown whether they moved
beyond the monitoring area or the radios failed.
2.6.3 Numerical response
Survey totals of surf scoters and white-winged scoters within Baynes Sound
showed generally high winter abundance followed by a decrease in numbers in spring
(Figure 2.4). Herring spawn was first observed on 13 March 2003 and 6 March 2004
(DFO 2007). The abundance of surf scoters and white-winged scoters within Baynes
Sound decreased markedly between the surveys just prior to and just following the
initiation of spawn; surf scoter abundance decreased by 66% in 2002 and by 86% in
2003, while white-winged scoters decreased 78% in 2002 and 98% in 2003.
2.7 Discussion
Numerical and movement responses of both surf scoters and white-winged scoters
were strongly related to the seasonal availability of abundant herring roe at spawn sites
located near their wintering area. Both scoter species are abundant in Baynes Sound and
show limited movements during the winter period. In comparison, both species moved
greater distances during the spawn season, with surf scoters moving greater distances
21
than white-winged scoters. Some scoters exhibited increased movements just before
spawn initiation, which may indicate that some individuals actively search for herring
spawn during the spring. The increase in movement distance during the spawn period was
interpreted as evidence of the long distance movements required to reach comparatively
distant spawn sites, rather than increased movement while foraging within a spawn site.
Sex and age classes were not important determinants of movements for either species,
while the seasonal presence of herring spawn was the best-supported explanation for both
scoter species.
In general, both scoter species showed a marked decrease in abundance in Baynes
Sound following spawn initiation and this decrease in abundance was interpreted as the
redistribution of wintering scoters to spawning areas adjacent to Baynes Sound. High
constancy of use for both scoter species indicates that scoters wintering in Baynes Sound
generally do not use the areas where herring spawn occurred in spring, and few scoters
left the study area entirely during the spawn season. Although surveys were not
conducted outside of Baynes Sound for this study, similar surveys in the region show that
the decrease in scoter numbers in Baynes Sound is coincident with dramatic increases in
scoter abundance at spawn sites along the east coast of Vancouver Island (Sullivan et al.
2002, CWS unpublished data). Telemetry surveys indicate that many of these large
aggregations of scoters (> 20 000 scoters) at spawn sites are composed of not only
redistributing local wintering scoters, but also migrant scoters arriving from wintering
areas further south (CWS, unpublished data).
Surf scoters showed a stronger proportional response to spawn than white-winged
scoters, with a greater fraction of the marked population located near spawn, and
22
individuals located proportionally more often close to spawn. Surf scoters also moved
farther from winter foraging grounds than white-winged scoters to visit spawning sites.
Because these species generally have high winter constancy rates and small winter home
ranges (Kirk et al. 2008), these relocations to spawn events are clear evidence of a
seasonal shift in movement patterns and habitat use.
Scoters in Baynes Sound feed primarily on clams during winter (Bourne 1984,
Lewis et al. 2007a) and switch from their typical winter diet to a presumably more
profitable food resource when it becomes available. Herring eggs are an easily accessible,
high-energy, lipid-rich food item (Paul and Paul 1999) and may be used to build energy
reserves prior to spring migration and reproduction (Bishop and Green 2001, Bond and
Esler 2006, Willson and Womble 2006). Similarly, the lack of shell and small size of
eggs presumably reduces handling time and digestion costs in comparison to bivalves
(Speakman1987, de Leeuw and van Eerden 1992, van Gills et al. 2003). The benefits of
herring spawn events may range beyond direct nutritional value; scoters in Baynes Sound
spent 50% less time foraging and decreased their dive rate when feeding on herring eggs
(Lewis et al. 2007b). Further, herring spawn may allow for increases in non-foraging
behaviours due to reduced feeding time (Rodway and Cooke 2001, Rodway et al. 2003,
Zydelis and Esler 2005). Rodway et aI. (2003) suggested that aggregating at herring
spawn sites may provide opportunity for social interactions for harlequin ducks
(Histrionicus histrionicus) and this may be true for other gregarious sea duck species.
Harlequin ducks and Steller's eiders (Polysticta stelleri) modify their movements
and food habits to use herring spawn (Rodway et al. 2003, Zydelis and Esler 2005).
Although the aggregation of scoters at Pacific herring spawn sites is well documented
23
(Haegele 1993, Venneer et al. 1997, Bishop and Green 2001, Sullivan et al. 2002), this is
the only study that has quantified movement responses of individual scoters using radio
telemetry. The high fraction of both surf scoters and white-winged scoters located close
to herring spawn sites and the greater distances moved during this time period suggest
that herring spawn may be an important food resource for scoters in late winter. Venneer
et al. (1997) speculated that the fraction of a population using herring spawn sites may
indicate the dependence of that population on spawn for acquiring energy. Surf scoters
exhibited higher use of spawn sites and greater movement distances than white-winged
scoters, indicating that herring spawn may be more important for this species. Compared
to white-winged scoters, surf scoters appear to lose more body mass over winter
(Anderson and Lovvorn 2008, E.M. Anderson, unpublished data), and are limited to
smaller sizes of bivalves (E.M. Anderson, unpublished data). Consequently, the depletion
of bivalve prey may limit the ability of surf scoters to meet energy requirements more
than that of white-winged scoters. Species that deplete winter foods, such as surf scoters
(Lacroix 2001, Kirk et al. 2007) may be more likely to rely on herring spawn for building
energy reserves in late winter and early spring (Bond and Esler 2006), and those species
that aggregate at herring spawn may depend on this resource for breeding in less resource
rich areas (Zydelis and Esler 2005).
Late winter and spring migration habitat conditions are known to have important
implications for waterfowl productivity. Energy intake and body mass often increase
during the pre-breeding season, as an energy management strategy to help meet high
costs of reproduction and migration (Alisauskas and Ankney 1992). The effects of habitat
conditions and nutrient reserve levels during the pre-breeding season carryover to
24
subsequent stages of the annual cycle, and can influence variation in survival and
reproductive success (Alisauskas and Ankney 1992, Anteau and Afton 2004, Reed et al.
2004).
Scoter populations have experienced numerical declines on both continental and
regional scales (Goudie et al. 1994, Nysewander et al. 2004) and the causes for these
declines are not known. Scoters are long-lived and have low reproductive outputs
(Krementz et al. 1997) and these life history traits make them particularly sensitive to
changes in the quantity and/or quality of their non-breeding habitats (Goudie et al. 1994,
Esler et al. 2002). Variation in critical non-breeding habitat such as areas supporting
herring spawn may have significant conservation implications. The Strait of Georgia
herring stock is currently in reasonably good condition and consistently ranks highly for
biomass within the province (DFO 2007), and is heavily used by many marine bird
species. However, other traditional spawn sites in the Strait of Georgia have declined in
numbers and shifted in distribution; birds are increasingly restricted to fewer spawn sites.
In addition, herring stocks in nearby regions such as northern Puget Sound and the Strait
of Juan de Fuca have experienced dramatic declines and the implications for the marine
ecosystem are unclear (Stick 2005). Understanding the cross-seasonal links between the
use of herring spawn during late winter and the energy requirements for migration and
reproduction is critical for management and conservation of scoter populations, as well as
other species that use herring spawn.
2.8 Acknowledgements
Funding and support for this project was provided by the Canadian Wildlife
Service of Environment Canada and National Science and Engineering Council (NSERC)
25
strategic grant STPGP246079-0l. We thank the Centre for Wildlife Ecology for
providing scientific and logistic support. M. MeAdie and D. Mulcahy performed the
radio-transmitter implant surgeries. E. Anderson, B. Bartzen, T. Bowman, S. Coulter, R.
Dickson, G. Grigg, S. Iverson, D. Lacroix, R. Lis, A. McLean, E. Sellentin, S. Wallace,
and R. Zydelis helped capture scoters and provided field assistance. We thank all private
landowners and shellfish farmers within Baynes Sound who granted us access to their
properties during winter fieldwork. We thank K. Daniel and B. McCarter of DFO for
assistance with the herring spawn data.
26
2.9 References
Alisauskas R. T. and C. D. Ankney. 1992. The cost of egg laying and its relationship tonutrient reserves in waterfowl. Pages 30-61 in Ecology and management ofbreeding waterfowl (B.DJ. Batt, A.D. Afton, M.G. Anderson, C.D. Ankney, D.H.Johnson, J.A. Kadlec, et al. Eds.) University of Minnesota Press, Minneapolis,Minnesota & London, England.
Anderson, E. M., and J. R. Lovvorn. In press. Gray whales may increase foragingopportunities for avian benthivores. Marine Ecology Progress Series
Anteau M. J. and A. D. Afton. 2004. Nutrient reserves of lesser scaup (Aythya affinis)during spring migration in the Mississippi Flyway: a test of the spring conditionhypothesis. Auk 121(3): 917-929.
Bishop M. A. and S. P. Green. 2001. Predation on Pacific herring (Clupea pallasi) spawnby birds in Prince William Sound, Alaska. Fisheries Oceanography 10(Supplement 1): 149-158.
Bond J. C. and D. Esler. 2006. Nutrient acquisition by female harlequin ducks prior tospring migration and reproduction: evidence for body mass optimization.Canadian Journal of Zoology 84(9): 1223-1229.
Botton M. L., R. E. Loveland, and T. R. Jacobsen. 1994. Site selection by migratoryshorebirds in Delaware Bay, and its relationship to beach characteristics andabundance of horseshoe crab (Limulus polyphemus) eggs. Auk 111(3): 605-616.
Bourne, N. 1984. Clam predation by scoter ducks in the Strait of Georgia, BritishColumbia, Canada. Canadian Technical Report of Fisheries and Aquatic Science1331.
Burnham K. P. and D. R. Anderson. 2002. Model selection and inference: a practicalinformation-theoretic approach, 2nd ed. Springer-Verlag, New York, NY.
Cooke F., C. S. Findlay, and R. F. Rockwell. 1984. Recruitment and the timing ofreproduction in lesser snow geese (Chen caerulescens caerulescens). Auk 101(3):451-458.
de Leeuw, J. J., and M. R. van Eerden. 1992. Size selection in diving tufted ducks Aythyafuligula explained by differential handling of small and large mussels Dreissenapolymorpha. Ardea 80:353-362.
DFO. 2007. Fisheries and Oceans Canada Pacific Herring Geographic Bulletin.http://www.pac.dfo-mpo.gc.ca/sci/herring/herspawn/pages/default5_e.html,accessed 15 May 2007.
27
Esler D., T. D. Bowman, K. A. Trust, B. E. Ballachey, T. A. Dean, S. C. Jewett, and C. E.O'Clair. 2002. Harlequin duck population recovery following the 'Exxon Valdez'oil spill: progress, process and constraints. Marine Ecology Progress Series 241:271-286.
ESRI. 1999. Environmental Systems Research Inc. ArcView GIS Version 3.3. Redlands,California.
ESS. 2004. Ecological Software Systems. LOAS - Location of A Signal Version 2.09.Urnasch, Switzerland.
Goudie R. I., A. V. Kondratyev, S. Brault, M. R. Petersen, B. Conant, and K. Vermeer.1994. The status of sea ducks in the North Pacific Rim: toward their conservationand management. Transactions of the North American Wildlife and NaturalResources Conference 59: 27-49.
Haegele C. W. 1994. Seabird predation of Pacific herring, Clupea pallasi, spawn inBritish Columbia. Canadian Field-Naturalist 107(1): 73-82.
Hooge P. N. and B. Eichenlaub. 1997. Animal movement extension to ArcView. Version1.1. Alaska Biological Science Center, U.S. Geological Survey. Anchorage,Alaska.
Iverson S. A., W. S. Boyd, D. Esler, D. M. Mulcahy, and T. D. Bowman. 2006.Comparison of the effects and performance of four types of radiotransmitters foruse with scoters. Wildlife Society Bulletin 34(3): 656-663.
Iverson S. A., D. Esler, and W. S. Boyd. 2003. Plumage characteristics as an indicator ofage class in the surf scoter. Waterbirds 26(1): 56-61.
Kaiser G. W., A. E. Derocher, S. Crawford, M. J. Gill, and I. A. Manley. 1995. A capturetechnique for marbled murrelets in coastal inlets. Journal of Field Ornithology66(3): 321-333.
Kirk M., D. Esler, S.A. Iverson, and W.S. Boyd.2008. Movements of wintering surfscoters: predator responses to different prey landscapes. Oeco10gia 155(4): 859867
Kirk M., D. Esler, and W. S. Boyd. 2007. Morphology and density of mussels on naturaland aquaculture structure habitats: implications for sea duck predators. MarineEcology Progress Series 346: 179-187.
Krementz D. G., P. W. Brown, F. P. Kehoe, and C. S. Houston. 1997. Populationdynamics of white-winged scoters. Journal of Wildlife Management 61 (1): 222227.
Kuechle L. B. 2005. Selecting receiving antennas for radio-tracking. AdvancedTelemetry Systems Inc. Isanti, Minnesota.
28
Lacroix D. L. 2001. Foraging impacts and patterns of wintering surf scoters feeding onbay mussels in coastal Strait of Georgia, British Columbia. MSc Thesis, SimonFraser University, Burnaby, British Columbia.
Lewis, T. L., D. Esler, and W. S. Boyd. 2007a. Effects of predation by sea ducks on clamabundance in soft-bottom intertidal habitats. Marine Ecology Progress Series 329:131-144.
Lewis T. L., D. Esler, and W. S. Boyd. 2007b. Foraging behaviors of surf scoters andwhite-winged scoters during spawning of Pacific herring. Condor 109(1): 216222.
Marston B. H., M. F. Willson, and S. M. Gende. 2002. Predator aggregations duringeulachon Thaleichthys pacificus spawning runs. Marine Ecology Progress Series231: 229-236.
Mather D. D. and D. Esler. 1999. Evaluation of bursal depth as an indicator of age classof harlequin ducks. Journal of Field Ornithology 70(2): 200-205.
Mulcahy D. M. and D. Esler. 1999. Surgical and immediate post release mortality ofharlequin ducks (Histrionicus histrionicus) implanted with abdominal radiotransmitters with percutaneous antennae. Journal of Zoo and Wildlife Medicine30(3): 397-401.
Nysewander, D.R., J.R. Evenson, B.M. Murphie, T.e. Cyra, D. Kraege, B. Hall, and D.Lambourn. 2007. Satellite Telemetry Project for surf and white-winged scoters inPuget Sound, Washington Department of Fish and Wildlife, Olympia, WA.http://wdfw.wa.gov. Accessed 15 May 2007.
Odum W. E., E. P. Odum, and H. T. Odum. 1995. Nature's pulsing paradigm. Estuaries18(4): 547-555.
Paul A. J. and J. M. Paul. 1999. Energy contents of whole body, ovaries, and ova frompre-spawning Pacific herring. Alaska Fishery Research Bulletin 6(1): 29-34.
Reed E. T., G. Gauthier, and J. Giroux. 2004. Effects of spring conditions on breedingpropensity of Greater Snow Goose females. Animal Biodiversity andConservation 27(1): 35-46.
Restani M., A. R. Harmata, and E. M. Madden. 2000. Numerical and functionalresponses of migrant bald eagles exploiting a seasonally concentrated food source.Condor 102(3): 561-568.
Rodway M. S. and F. Cooke. 2001. Effect of food availability on arrival and departuredecisions of harlequin ducks at diurnal feeding grounds. Condor 103(4): 870-874.
29
Rodway M. S., H. M. Regehr, J. Ashley, P. V. Clarkson, R. I. Goudie, D. E. Hay, C. M.Smith, and K G. Wright. 2003. Aggregative response of harlequin ducks toherring spawning in the Strait of Georgia, British Columbia. Canadian Journal ofZoology 81(3): 504-514.
SAS Institute. 2003. SAS/STAT user's guide. SAS Institute, Cary, North Carolina.
Sigler, M. E, J. N. Womble, and J. J. Vollenweider. 2004. Availability to Steller sea lions(Eumetopias jubatus) of a seasonal prey resource: a prespawning aggregation ofeulachon (Thaleichthys pacificus). Canadian Journal of Fisheries and AquaticScience 61: 1475-1484.
Smith S. A., N. J. Stewart, and J. E. Gates. 1999. Home ranges, habitat selection andmortality of ring-necked pheasants (Phasianus colchicus) in North-centralMaryland. American Midland Naturalist 141(1): 185-197.
Speakman, J. R. 1987. Apparent absorption efficiencies for redshank (Tringa totanus L.)and oystercatchers (Haematopus ostralegus L.): implications for the predictionsof optimal foraging models. American Naturalist 130:677-691.
Stick KC. 2005. Washington State Herring Stock Status Report. Washington Departmentof Fish and Wildlife. Fish Management Program. May 2005.
Sullivan T. M., R. W. Butler, and W. S. Boyd. 2002. Seasonal distribution of waterbirdsin relation to spawning Pacific herring, Clupea pallasi, in the Strait of Georgia,British Columbia. Canadian Field-Naturalist 116(3): 366-370.
van Gills, J. A., T. Piersma, A. Dekinga, and M. W. Dietz. 2003. Cost-benefit analysisof mollusc-eating in a shorebird: optimizing gizzard size in the face of seasonaldemands. Journal of Experimental Biology 206:3369-3380.
Venneer K, M. Bentley, K H. Morgan, and G. E. J. Smith. 1997. Association of feedingflocks of brant and sea ducks with herring spawn at Skidegate Inlet. CanadianWildlife Service Occasional Paper 93: 102-107.
Webster M. S., P. P. Marra, S. M. Haig, S. Bensch, and R. T. Holmes. 2002. Linksbetween worlds: unraveling migratory connectivity. Trends in Ecology &Evolution 17(2): 76-83.
Willson M. F. and J. N. Womble. 2006. Vertebrate exploitation of pulsed marine prey: areview and the example of spawning herring. Reviews in Fish Biology andFisheries 16(2): 183-200.
Womble J. N., M. E Willson, M. E Sigler, B. P. Kelly, and G. R. VanBlaricom. 2005.Distribution of Steller sea lions Eumetopias jubatus in relation to spring-spawningfish in SE Alaska. Marine Ecology Progress Series 294: 271-282.
30

Zydelis R. and D. Esler. 2005. Response of wintering Steller's eiders to herring spawn.Waterbirds 28(3): 344-350.
31
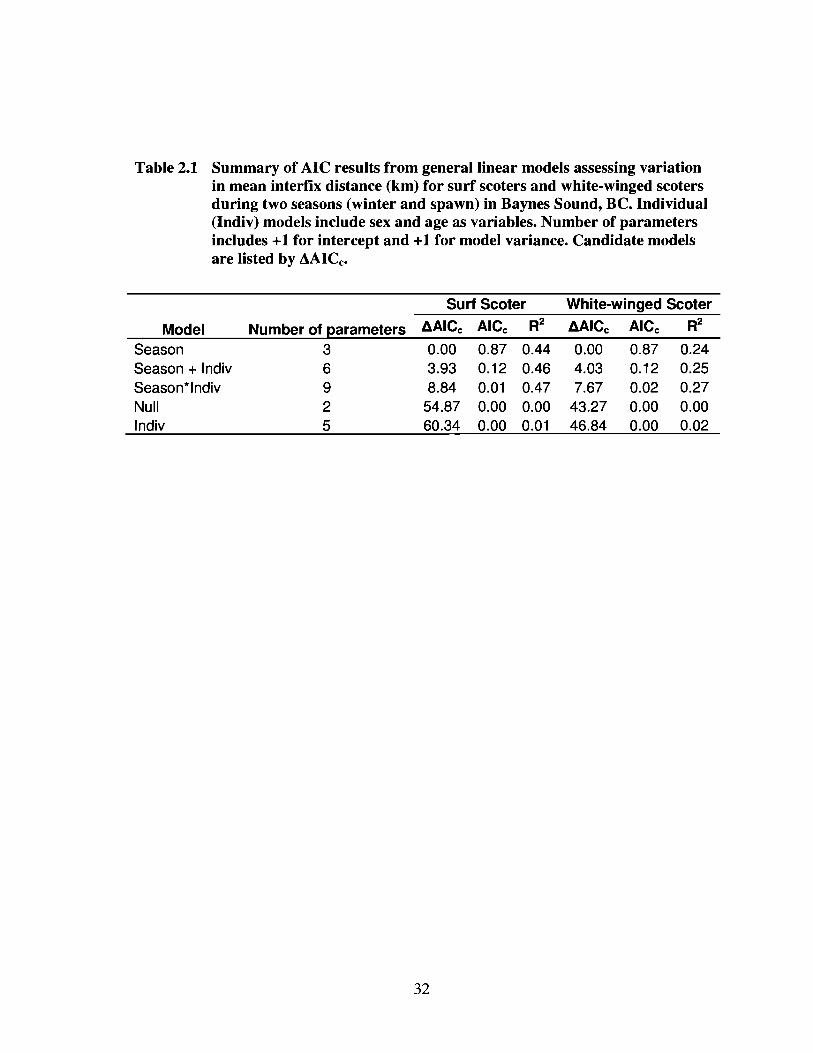
Table 2.1 Summary of AIC results from general linear models assessing variationin mean interfix distance (km) for surf scoters and white-winged scotersduring two seasons (winter and spawn) in Baynes Sound, BC. Individual(Indiv) models include sex and age as variables. Number of parametersincludes +1 for intercept and +1 for model variance. Candidate modelsare listed by AAICc'
ModelSeasonSeason + IndivSeason*lndivNullIndiv
Number of parameters36925
Surf Scoter
0.00 0.87 0.443.93 0.12 0.468.84 0.01 0.47
54.87 0.00 0.0060.34 0.00 0.01
32
White-winged Scoter
0.00 0.87 0.244.03 0.12 0.257.67 0.02 0.27
43.27 0.00 0.0046.84 0.00 0.02
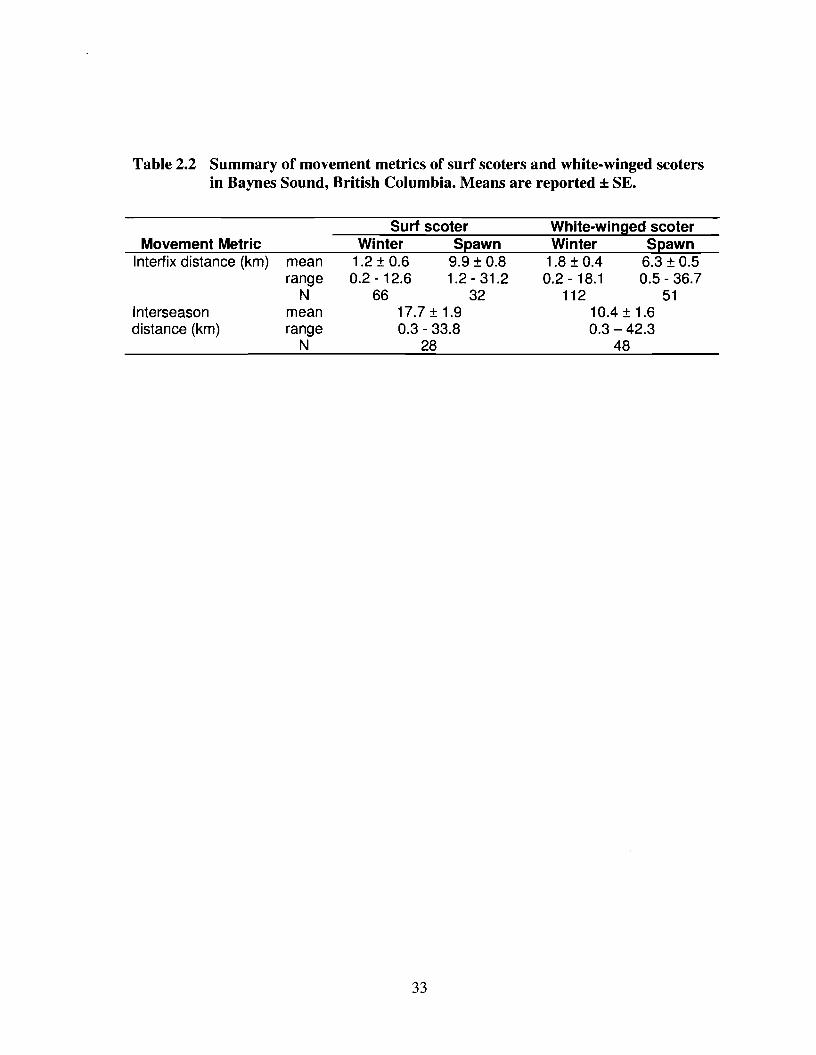
Table 2.2 Summary of movement metrics of surf scoters and white-winged scotersin Baynes Sound, British Columbia. Means are reported ± SE.
Movement MetricInterfix distance (km)
Interseasondistance (km)
meanrange
Nmeanrange
N
Surf seaterWinter Spawn
1.2 ± 0.6 9.9 ± 0.80.2 -12.6 1.2 - 31.2
66 3217.7±1.90.3 - 33.8
28
33
White-winged seaterWinter Spawn
1.8 ± 0.4 6.3 ± 0.50.2 - 18.1 0.5 - 36.7
112 5110.4 ± 1.60.3 -42.3
48
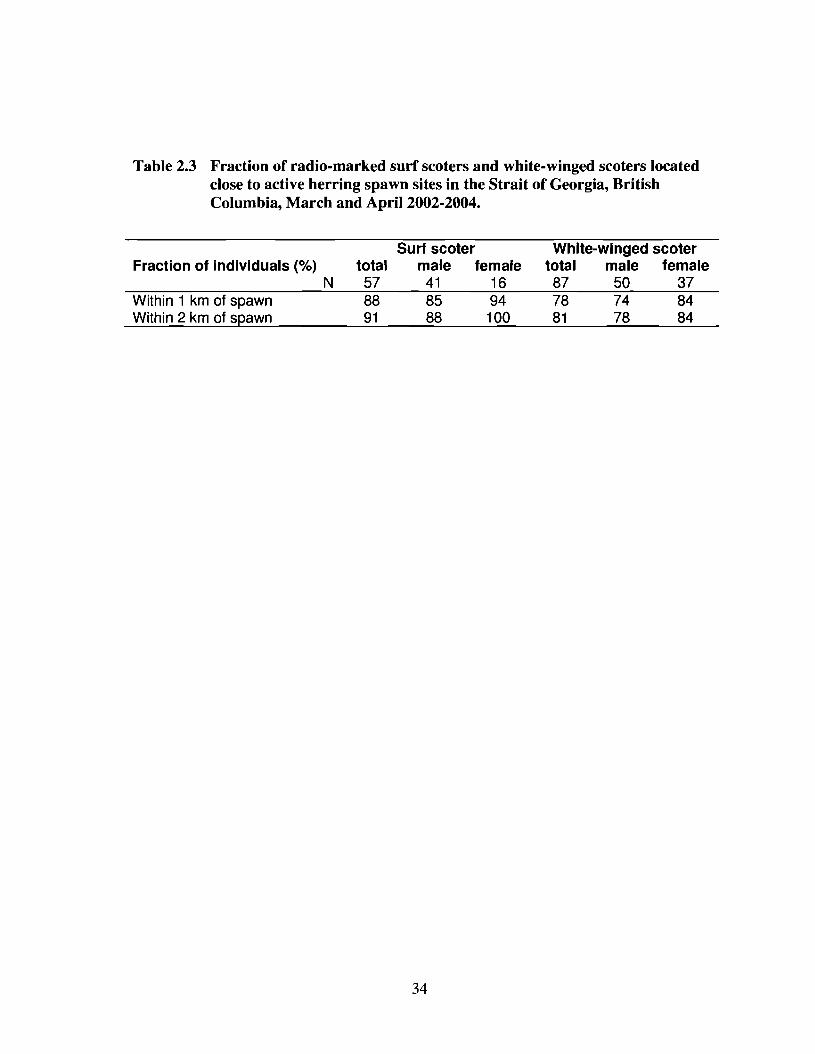
Table 2.3 Fraction of radio-marked surf scoters and white-winged scoters locatedclose to active herring spawn sites in the Strait of Georgia, BritishColumbia, March and April 2002-2004.
Fraction of individuals (%)N
Within 1 km of spawnWithin 2 km of spawn
total578891
Surf seotermale female
41 1685 9488 100
34
White-winged seotertotal male female87 50 3778 74 8481 78 84
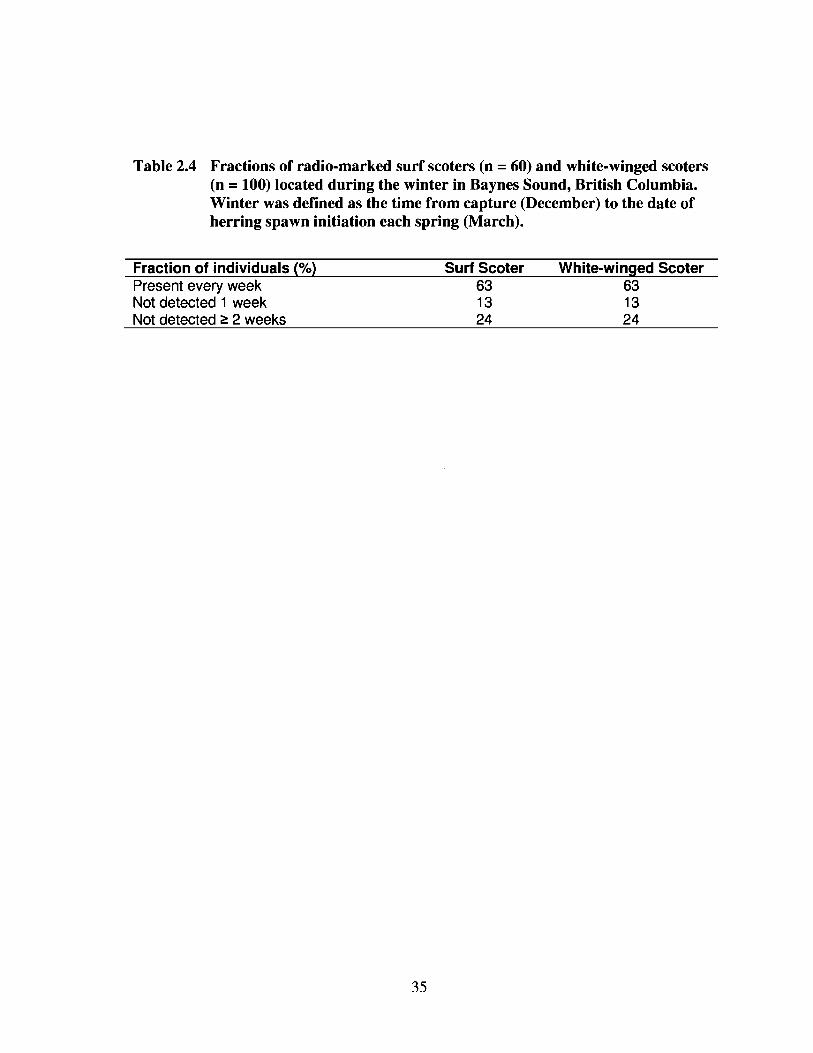
Table 2.4 Fractions of radio-marked surf scoters (n = 60) and white-winged scoters(n =100) located during the winter in Baynes Sound, British Columbia.Winter was defined as the time from capture (December) to the date ofherring spawn initiation each spring (March).
Fraction of individuals (%)Present every weekNot detected 1 weekNot detected ~ 2 weeks
35
Surf Scoter631324
White-winged Scoter631324
BritishColumbia
--Q\./' ..
20 Kilomeierc
~."-
comox)
Deep Bay
BaynesSound
[i 5 10
L-i-l~,-I --'----'-----'-'
N
Figure 2.1 Baynes Sound study area and adjacent areas in the Strait of Georgia,British Columbia. Survey polygons are shaded to show the extent of thewinter study area.
36
.ts-
,..t~
'f
'~.~
\.:"
....
;.("
"'~
IY~
"\'r
~~.
167.
218
Wh
ite-
win
ged
Sco
ter
"'\
"A
\~,
"",
h~
'
"-.,
'"' '\.
-<\. "--
oW
inte
r•
Sp
awn
iJ3
5r
14K
lom
et..,
!I
I!
~
\'~7\
\'01
Dec
.20
_M
ar.
6
\\
\
r'~(
"--'
\,~ft
..~
10~".
")'\
,,(
AP~.
16~~
\.
~~
3\
27-A
pr.
"'\M
ar.
\..~..."
Mar
.20
-M
ar.2
4"'--
----.
"~.,.."....
..---'-~, ~.
.,'\
Apr
.3
-
"j"'\
""',
!\
~A
\""'
.:'" '\,
,\.
{5'h
""w~
.~,
iY~
\"-
',
~~,
~\..
.. "..,\
~~
.,~
....
...~---
•A
pr.
8'"
"---
--\.
.M
ar.1
3-
Mar
.26
~f.Jlt\
",...
}..\.
,.
oW
inte
r
•S
pa
wn
o?I
137
14KJ
lcr'!"
:ele
rs!
!!
I
\.~
Su
rfS
cote
r
\.(7\..
'--.1
67.0
78\
"-\
\\
\
\''''\r~,
V'r
\\"
.~/.
~""
'''-
''~'
Ap
r.18
,.....
(J'
.,.,
1";
)
Fig
ure
2.2
Exa
mpl
eso
frad
io-t
elem
etry
loca
tion
san
dm
ovem
ents
ofre
pres
enta
tive
surf
scot
eran
dw
hite
-win
ged
scot
erin
divi
dual
sdu
ring
win
ter
and
spri
ngin
the
Stra
itof
Geo
rgia
,Bri
tish
Col
umbi
a,D
ecem
ber
-A
pril
2003
.Her
ring
spaw
nin
gst
arte
don
13M
arch
2003
.Not
eth
atte
lem
etry
surv
eys
wer
eno
tco
nduc
ted
outs
ide
ofth
eB
ayne
sSo
und
stud
yar
eadu
ring
win
ter.
37
40 .,---------------------.-----------------,
120
ooo
o
90
o
60
IIII 0 0 0 0 8I 9 8~ 0 8
00 0
I 0 0
I0 9
000
000 8o 0 I o0'b 0 0 co 8
o 0 I 0 oo~g..Q 8o 0 €I' 00 qp
00 00 0 I ° 0 0 eBoCQoQb~<p §~ tR9~"~$~~ Ie ~e§ 0OQ~ ~g ~oo 0
0
Surf Scoter
30
Q) 25(,)c:::CUen 20
"'Cx 15'E2 10c:::
oo
5
35
E 30~-
Day of year
35
E 30~-Q) 25(,)c:::CUen 20
:cX 15'E2 10c:::
5
oo
White-winged Scoter
o
°8 00080
30 60
oo
o 0
co
90
oo
00
o o
120
Day of year
Figure 2.3 Interfix distances of all locations of surf scoters (28 individuals) andwhite-winged scoters (48 individuals) from January through April in2002-2004, in the Strait of Georgia, British Columbia. The verticaldashed lines indicate the mean date of spawn initiation (day of year =70)for the study years.
38
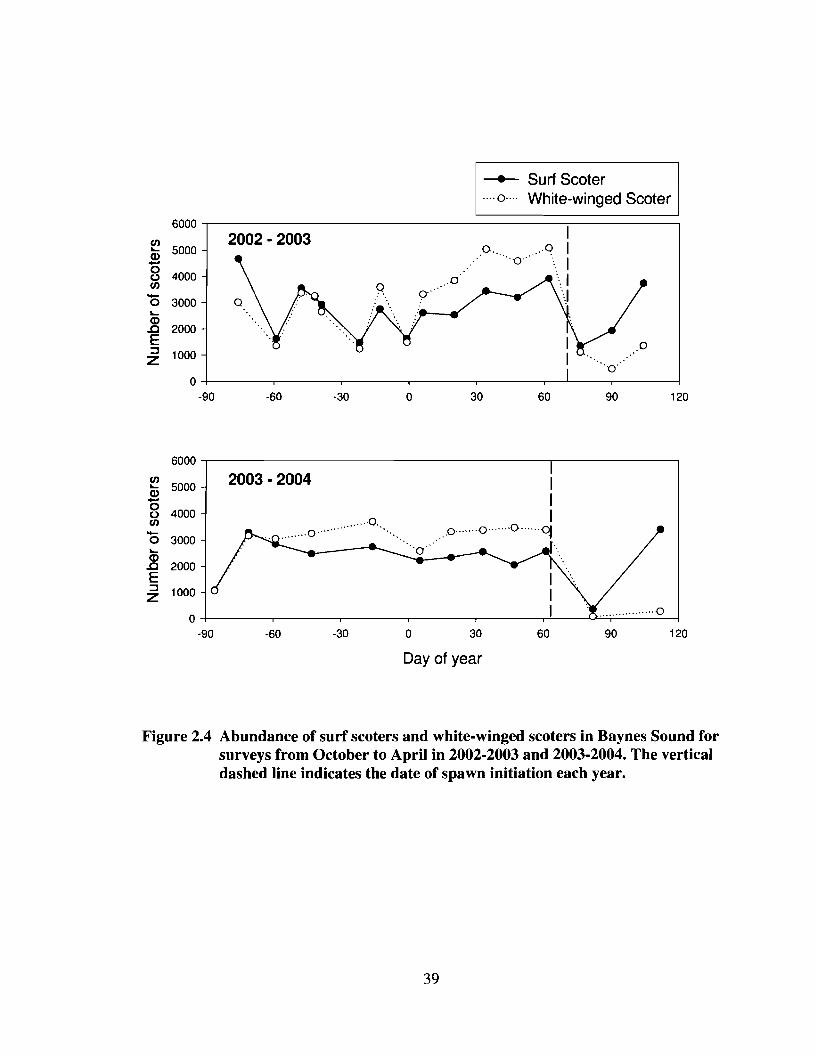
---+- Surf Scoter····0···· White-winged Scoter
o······o·······q.
III
..o·······o·······o ~
'0' r··..
6000
en5000...
Q)-0 4000c.Jen-0 3000...Q).0 2000E:J 1000Z
0-90
6000
en5000...
Q)-0 4000c.Jen-0 3000...Q).0 2000E:J 1000Z
0-90
2002 - 2003
-60
2003 - 2004
-60
-30
-30
o
o
30
30
60
60
90
.............. ···0
90
120
120
Day of year
Figure 2.4 Abundance of surf scoters and white-winged scoters in Baynes Sound forsurveys from October to April in 2002-2003 and 2003-2004. The verticaldashed line indicates the date of spawn initiation each year.
39
CHAPTER 3 STOPOVER HABITATS OF SPRINGlVIIGRATING SURF SCOTERS IN SOUTHEASTALASKA
40
3.1 Abstract
We used satellite telemetry to identify important stopover sites used by surf
scoters migrating through southeast Alaska during spring. We then contrasted the habitat
features of these sites to those of random sites to determine habitat attributes
corresponding to use by migrating scoters. We identified 14 important stopover sites
based on the use of satellite tagged surf scoters. Lynn Canal was identified as being an
exceptionally important stopover site for surf scoters originating throughout the Pacific
winter range; approximately half of the coastally-migrating surf scoters used this site,
many for extended periods. The habitat attributes of important stopover sites were farther
from the outer coast and closer to herring spawn sites than random sites, while physical
shoreline attributes were generally poor predictors of site use. We conclude that the
geography and resource availability within southeast Alaska provides unique and
potentially critical stopover habitat for spring migrating surf scoters. Our work defines
specific sites that deserve conservation consideration, as well as insights into the
underlying mechanisms that make these habitats important.
41
3.2 Introduction
Many migratory birds acquire energy and nutrient reserves at spring stopover
sites, and the availability and quality of resources at these sites may have implications for
success during subsequent stages of the annual cycle (Ankney and MacInnes 1978,
Alisauskas and Ankney 1992, Warnock and Bishop 1998, Smith and Moore 2003,
Morrison and Hobson 2004). Several studies have described cross-seasonal effects of
spring habitats on reproductive performance by migratory waterfowl (Lovvorn et al.
2003, Reed et al. 2004, Schmutz et al. 2006). Because spring stopover sites provide the
energy and nutrients required for reproduction, it follows that population dynamics may
be influenced by habitat quality at these sites.
Recent reviews and commentaries have highlighted the need for research
addressing habitat use and resource availability along migration routes (Webster et al.
2002, Mehlman et al. 2005, Arzel et al. 2006, Drent et al. 2006). This requires
identification of key sites used during spring migration, as well as an understanding of
the habitat features that make these sites attractive to migrants. The importance of
stopover sites has been defined by a number of criteria, often including the duration of
stay (e.g., a brief stopover compared to longer term staging) or the relative value of a site
for energy acquisition (Skagen and Knopf 1994, Farmer and Parent 1997, Warnock and
Bishop 1998).
Little is known about the specific stopover sites used by surf scoters (Melanitta
perspicillata) during spring migration along the Pacific coast. Identification of discrete
areas used during spring migration has been previously limited by the large geographic
42
scale involved, the remoteness of areas used, the continuous nature of potential stopover
habitat along the Pacific coast, and the lack of information about scoter distributions at
this time of year. Habitat conditions and nutrient reserve levels during spring migration
have been suggested as important factors affecting broad-scale and long-term population
declines in other waterfowl (Anteau and Afton 2004). Scoter populations have been
declining continent-wide (USFWS 1999, Nysewander et al. 2004) and this phenomenon
could be similarly related to changes in spring stopover habitats. Hence, identification of
key stopover sites and their associated habitat attributes are important for population
management.
Satellite telemetry provides a useful and relatively unbiased tool for describing
migration routes and identifying stopover sites over a large geographic range. We used
satellite telemetry to track surf scoters using spring stopover sites in southeast Alaska. To
identify potentially important stopover sites we considered migrant use, based on relative
abundance and the frequency and consistency of use as a stopover site (Mehlman et al.
2005). In considering the habitat attributes that make these sites important, we considered
intrinsic characteristics such as resource availability as well as geographical context, such
as proximity to ecological barriers (Mehlman et aL 2005).
3.3 Study Area
The wintering range of surf scoters along the Pacific coast extends from Alaska to
Baja California, Mexico (Savard et al. 1998). We compiled information from studies of
surf scoters captured and marked at wintering areas throughout this range. These
wintering areas included San Quintin Bay, Baja California, Mexico (116.0oW, 30AON);
San Francisco Bay, California, USA (122AoW, 37.8°N); Puget Sound, Washington, USA
43
(122.4°W, 47.5°N); and the Strait of Georgia, British Columbia, Canada (122.4°W,
49.3°N). In the spring, surf scoters migrate along the Pacific coast from these wintering
areas to northern breeding areas throughout the inland boreal forest of western Canada
and Alaska (Savard et al. 1998).
We considered all of southeast Alaska as our study area and examined stopover
site use within this region (Figure 3.1). Southeast Alaska is comprised of a large,
complex archipelago adjacent to a mountainous mainland. These landforms create an
extensive network of protected waterways and nearshore marine areas that provide a wide
variety of habitat types, and the region is a major migration route for many bird species in
the Pacific Flyway.
3.4 Methods
3.4.1 Capture and marking
We captured surf scoters on their wintering grounds between November and
March, 2002-2006, using a floating mistnet (Kaiser et al. 1995, Lewis et al. 2005), or a
netgun (Mechlin and Shaiffer 1980). Birds were banded, weighed, and implanted with
coelomic platform-transmitter-terminal (PIT) satellite-transmitters following standard
procedures (Mulcahy and Esler 1999) (Table 3.1). This transmitter implantation method
has been shown to perform well for scoters relative to other attachment methods (Iverson
et al. 2006). The marked birds were released after a recovery period of at least 1 hour.
PIT transmitters were programmed with duty cycles to transmit location data for 6-8 h
and tum off for 48-96 h.
44
3.4.2 Location data
Satellite transmitter locations were obtained from the Argos data system, which
estimated positions by calculating the Doppler-effect shift with receivers on National
Oceanic and Atmospheric Administration (NOAA) weather satellites. We compiled the
location data from all PTT-marked surf scoters and filtered the data spatially and
temporally to select only coastal spring migration locations (Figure 3.1). PTT locations
were classified by estimated accuracy and number of signals. For Location Classes (LC)
3,2, 1, and 0, in which ~4 messages are received by the satellite, Argos rates accuracy as
<150, 150-350,350-1000, and >1000 m, respectively. Accuracy is not provided for LC A
(3 messages), B (2 messages), and Z (latitude/longitude often provided if>1 message
received). Location data usually included more than one useable location per bird in a
transmission day; a single "Selected Location" for each bird per transmission day was
chosen according to the criteria described in Miller et al. (2005), which favor locations
with LC 3, 2 and 1, but recognize that accurate locations are obtained for a large
proportion of detections within all Argos location quality classes. Although less
conservative than filtering locations of lower location quality classes, this method
allowed us to maximize the number of Selected Locations during the short migration
period, and 91 % of the Selected Locations were of LC 1 or higher.
3.4.3 Habitat data
We assembled Geographic Information System (GIS) data from existing data
sources on shoreline habitat features of southeast Alaska that we considered to be
potentially important predictors of surf scoter stopover habitat use. We assumed that the
use of stopover sites was related to the habitat attributes of those sites, and that habitat
45

characteristics of used sites are related to habitat quality and profitability. In this habitat
analysis, we used shoreline habitat attributes to represent environmental variables related
to general resource availability throughout southeast Alaska. In addition to resource
availability, we considered ecological context, such as the proximity to natural breaks and
migration routes (Mehlman et al. 2005).
Habitat use by surf scoters during winter is well documented and strongly related
to shoreline characteristics and associated bivalve prey distribution and densities (:lydelis
et al. 2006). Shoreline habitat data were obtained from a shoreline ecosystem database
compiled by Audubon Alaska and The Nature Conservancy (Albert and Schoen 2007).
This dataset characterizes shoreline habitat within southeast Alaska using information
from multiple sources, and integrates information about the physical characteristics, wave
exposure, and bathymetry of the study area shoreline (Albert and Schoen 2007). The
physical characteristics summarized for each shoreline segment included the maximum
depth within 1 km of shore (depth), shoreline segment length (length), the maximum
shoreline width between high tide and low tide (width), dominant substrate type
(substrate), and an exposure index (exposure). Substrate was divided into 12 categories,
including rocky shore/cliff, rock platform, rock with gravel beach, rock with sand and
gravel, rock with sand beach, gravel beach, sand and gravel beach, sand and gravel flat,
sand beach, tide flat, salt marsh, and no data. We considered the five categories
containing rock as "rocky substrate" for our analyses. The exposure index is an estimate
of wave energy based on the total area visible over water from each shoreline segment
and increases with increased wave energy and exposure (Albert and Schoen 2007). In
addition, we used this dataset to create a data layer representing the distance to the outer
46
coast of southeast Alaska by selecting the westernmost shoreline segments within the
study area. This data layer was created to evaluate site use as a function of distance to the
outer coast.
The presence of streams may influence prey distribution and provide fresh water
for birds feeding on marine invertebrates (Nystrom and Pehrsson 1988). We obtained
information on stream distribution within southeast Alaska from the USGS Hydrographic
Dataset and created a layer that included only streams that intersect with the ocean.
During late winter and early spring, Pacific herring (Clupea pallasi) spawn along
localized sections of shoreline within southeast Alaska. Surf scoters are known to
aggregate at herring spawning sites and forage on abundant and energy-rich eggs
(Haegele 1993, Vermeer et al. 1997, Bishop and Green 2001, Sullivan et al. 2002,
Rodway et al. 2003), but its influence on stopover site use during spring migration has
not previously been quantified. To evaluate site use as a function of distance to herring
spawn sites, we compiled the distribution of major herring spawn locations in 2003-2006
from the Alaska Department of Fish and Game. The spawn distributions in all four years
were combined into a single layer representing herring spawn distribution within all study
years.
3.5 Data Analyses
3.5.1 Identification of important stopover sites
We used ArcGIS 9.1 (Environmental Systems Research Institute 2005) to analyze
Selected Locations to determine migration stops on 1:250000 digital charts. We defined
a stopover event as the act of an individual stopping at a site for rest or refueling during
migration. Spatially, stopover events were defined as a series of at least two consecutive
47

Selected Locations within 22 km of each other. This distance was based on the 95th
percentile of mean distances between sequential locations for radio-marked surf scoters
in late winter (Lok et al. In press), and was interpreted as a reasonable non-migratory
movement distance within a site. To consider temporal use of sites, we subclassified
stopover events as short stopovers if the site was used for 2-7 days and as staging
stopovers if the site was used for>7 days (Warnock and Bishop 1998).
For each stopover event, we delineated an area of use for each individual by
creating either a minimum convex polygon ~3 locations) or a line (2 locations). The
centroid of each area of use was calculated using the XTools Pro Extension for ArcGIS
9.1 (Data East 2007). Important stopover sites were defined as sites where the centroids
of the areas of use of at least two individuals were within 5 km of each other. A 5 km
distance was chosen to account for variation in PTT location accuracy and to encompass
the areas of use of at least two individuals. Given the limited number of satellite-tagged
individuals, we considered use by two individuals adequate to represent the selection and
use of a specific site. A centroid of each important stopover site was calculated from the
individual centroids of all areas of use within the 5 km radius.
3.5.2 Habitat attributes of important stopover sites
To identify habitat features associated with important stopover sites, we
contrasted habitat attributes of 13 identified important sites with those of a set of 50 sites
randomly distributed throughout the study area. A 5 km radius was selected to be large
enough to encompass the locations of at least two individuals and the associated shoreline
habitat, while being small enough identify a discrete area and minimize the overlapping
of sites. Random plot centroids were created along the shoreline using the random
48

sampling tool in Hawth's Analysis Tools (Beyer 2004). Important stopover site centroids
were fixed related to the shoreline using the snap to line tool. We created 5 km radius
plots around both important stopover sites and random sites using the Buffer Wizard in
ArcGIS 9.1. We then intersected GIS habitat layers with the plots and summarized the
following shoreline characteristics for each plot: length, depth, width, exposure, percent
rocky substrate, distance to outer coast, and distance to herring spawn. The mean
weighted depth, width, and exposure were calculated by weighting each shoreline
segment value by the length of the segment and dividing the sum of weighted segments
by the total plot shoreline length. The percent rocky substrate within each plot was
determined by calculating the length of all segments with a rocky substrate and dividing
by the total shoreline length within the plot. We calculated the number of stream outlets
within each plot. The distance to outer coast and distance to herring spawn were
determined as the minimum distance from the centre of each plot to the outer coast or
herring spawn layers, respectively.
We used logistic regression models to evaluate the use of stopover sites in relation
to habitat characteristics in SAS (SAS Institute 2003). We examined the data for
overdispersion, by calculating a variance inflation factor for the global model, but found
that this was not a concern (c =0.32). We used an information theoretic approach to
model selection (Burnham and Anderson 2002) and calculated Akaike's Information
Criterion adjusted for small sample sizes (AICc) for each model within a candidate set.
For some models, we grouped physical shoreline characteristics into a "shoreline" suite
of predictor variables, which included length, depth, width, exposure, streams and
substrate. The candidate model set consisted of 14 models: (1) length (2) depth (3) width
49

(4) exposure (5) streams (6) rocky substrate (7) shoreline (8) coast (9) spawn (10) coast
+ spawn (11) coast + shoreline (12) spawn + shoreline (13) coast + spawn + shoreline
and (14) a null model. We wanted to consider the relative effects of shoreline features
individually, and to contrast the importance of physical shoreline features of used sites
with food resource features (distance to spawn) and geographic features (distance to outer
coast), in addition to considering additive combinations of physical attributes, resource
availability, and geography. We compared the AICc value of each model to that of the
best-fitting model (L\AICc) to assess the relative support for each candidate model. We
also calculated AICc weights (Wi), which indicate the relative support for each model
within the candidate model set.
3.6 Results
3.6.1 Identification of important stopover sites
We documented a total of 72 stopover events for 37 individual satellite-marked
birds in southeast Alaska (Figure 3.1). We identified 14 important stopover sites within
southeast Alaska (Figure 3.2), which were used by 35 individual satellite-marked scoters
in 62 stopover events (Table 3.2). Only 14% of the individual stopover events of were not
located within an identified important site, and the majority (95%) of all marked surf
scoters visited at least one of these sites during spring migration. Important stopover sites
were identified at Lynn Canal, Berners Bay, Eagle Harbor, Stephens Passage, Gastineau
Channel, Young Bay, Tracy Arm, Seymour Canal, Hobart Bay, Eastern Passage, Vixen
Inlet, West Behm Canal, Klawock Inlet, and Annette Island (Figure 3.2). We identified
the area of Lynn Canal, including Chilkat Inlet, Chilkoot Inlet, and Taiya Inlet, as a
single important stopover and staging site although it did not strictly meet our criteria.
50
We were unable to identify a distinct 5 km radius circumscribing this important stopover
site due to the very high number of overlapping areas of use (22 stopover events, 17
individuals) and instead considered the entire area a single important site. Because of the
unique nature of this area, and the inability to define it as a discrete stopover site, we did
not include it in the habitat analysis.
Temporally, stopovers events were identified as 35 short stopover events (27
individuals) and 37 staging stopover events (32 individuals) (Table 3.2). Approximately
half (49%; n=37) of the marked surf scoters in this study made staging stopovers within
southeast Alaska. The majority of individuals (54%) both stopped (2-7 days) and staged
(> 7 days) at least once in southeast Alaska, while 19% only stopped and 27% only
staged. Most of the identified important sites were used in at least two years, and three of
the sites were used in at least three study years (Table 3.2).
3.6.2 Habitat attributes of important stopover sites
Stopover site use was strongly related to small distances from herring spawn and
to greater distance from the outer coast. Within the candidate model set, the coast +
spawn model best explained stop site use (Wi= 0.97), with no other model receiving
strong support (Table 3.3). Models with the highest L\AICc values included distance to
coast and distance to spawn parameters. This suggests that the distance from the outer
coast and distance from herring spawn provided the best explanation of the variation
between stopover and random sites.
Important stopover sites were located an average of less than 10 km away from
spawn sites while random sites were located more than 50 km away (Table 3.4). Eight of
the identified important stopover sites (Bemers Bay, Young Bay, Seymour Canal, Hobart
51
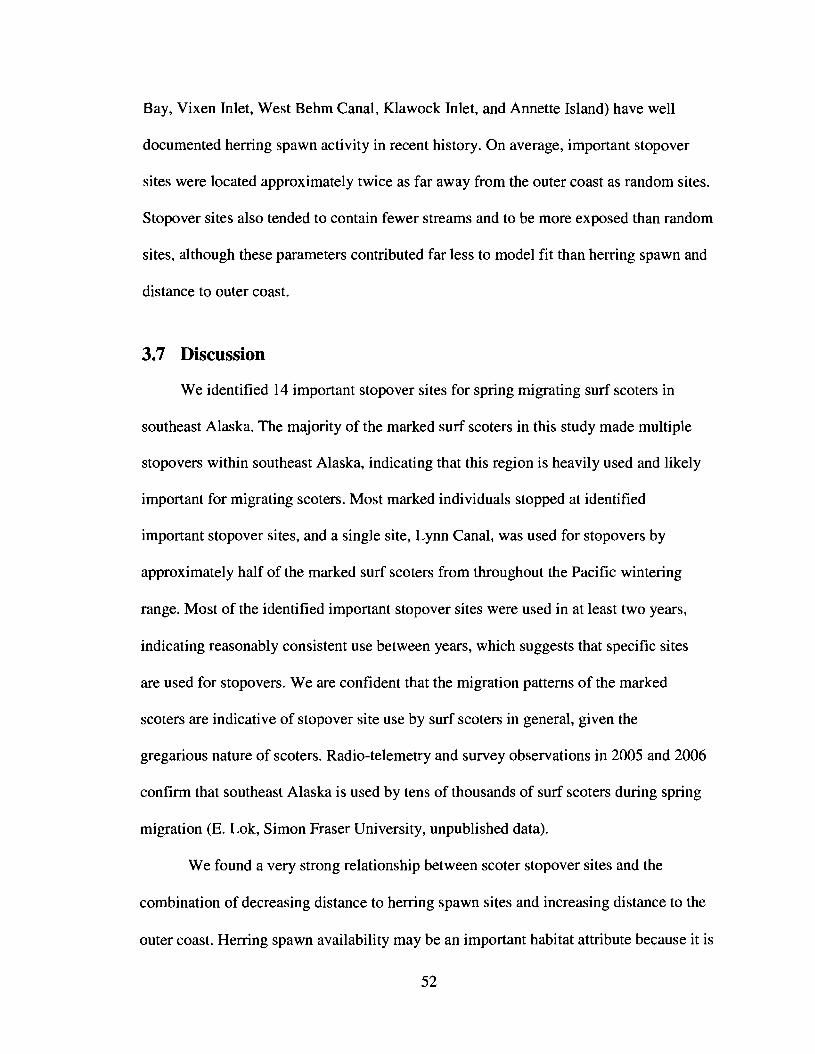
Bay, Vixen Inlet, West Behm Canal, Klawock Inlet, and Annette Island) have well
documented herring spawn activity in recent history. On average, important stopover
sites were located approximately twice as far away from the outer coast as random sites.
Stopover sites also tended to contain fewer streams and to be more exposed than random
sites, although these parameters contributed far less to model fit than herring spawn and
distance to outer coast.
3.7 Discussion
We identified 14 important stopover sites for spring migrating surf scoters in
southeast Alaska. The majority of the marked surf scoters in this study made multiple
stopovers within southeast Alaska, indicating that this region is heavily used and likely
important for migrating scoters. Most marked individuals stopped at identified
important stopover sites, and a single site, Lynn Canal, was used for stopovers by
approximately half of the marked surf scoters from throughout the Pacific wintering
range. Most of the identified important stopover sites were used in at least two years,
indicating reasonably consistent use between years, which suggests that specific sites
are used for stopovers. We are confident that the migration patterns of the marked
scoters are indicative of stopover site use by surf scoters in general, given the
gregarious nature of scoters. Radio-telemetry and survey observations in 2005 and 2006
confirm that southeast Alaska is used by tens of thousands of surf scoters during spring
migration (E. Lok, Simon Fraser University, unpublished data).
We found a very strong relationship between scoter stopover sites and the
combination of decreasing distance to herring spawn sites and increasing distance to the
outer coast. Herring spawn availability may be an important habitat attribute because it is
52
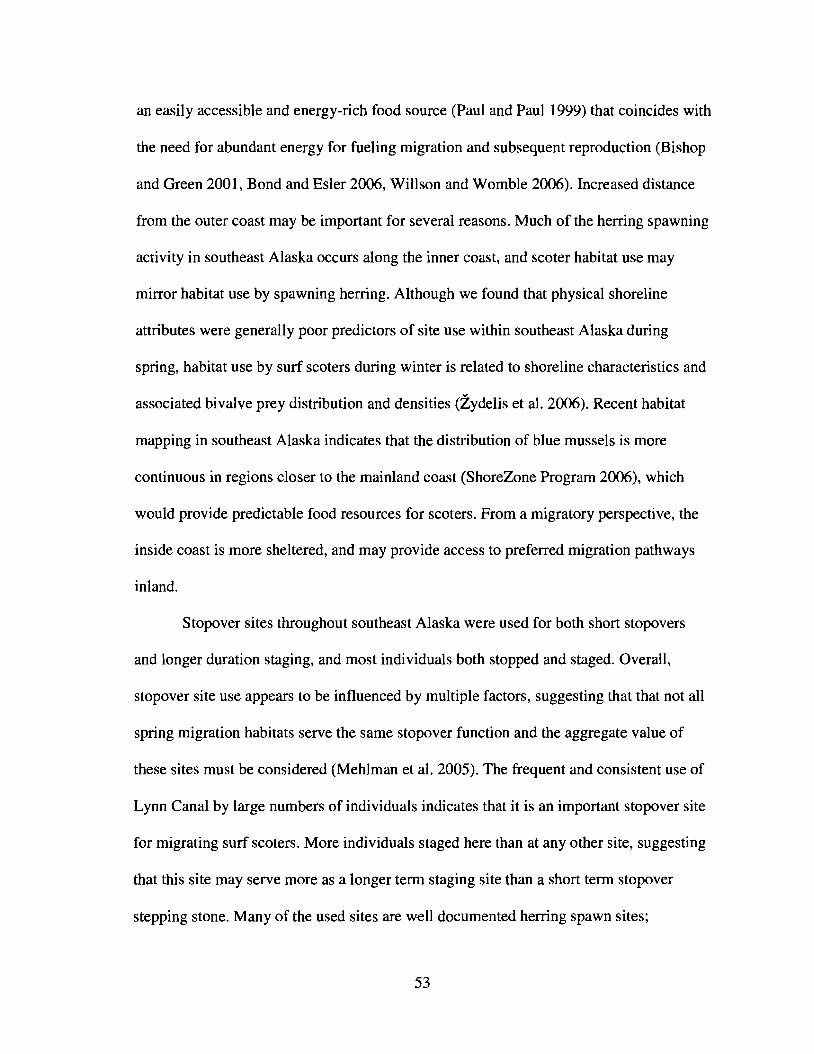
an easily accessible and energy-rich food source (Paul and Paul 1999) that coincides with
the need for abundant energy for fueling migration and subsequent reproduction (Bishop
and Green 2001, Bond and Esler 2006, Willson and Womble 2006). Increased distance
from the outer coast may be important for several reasons. Much of the herring spawning
activity in southeast Alaska occurs along the inner coast, and scoter habitat use may
mirror habitat use by spawning herring. Although we found that physical shoreline
attributes were generally poor predictors of site use within southeast Alaska during
spring, habitat use by surf scoters during winter is related to shoreline characteristics and
associated bivalve prey distribution and densities (Zydelis et al. 2006). Recent habitat
mapping in southeast Alaska indicates that the distribution of blue mussels is more
continuous in regions closer to the mainland coast (ShoreZone Program 2006), which
would provide predictable food resources for scoters. From a migratory perspective, the
inside coast is more sheltered, and may provide access to preferred migration pathways
inland.
Stopover sites throughout southeast Alaska were used for both short stopovers
and longer duration staging, and most individuals both stopped and staged. Overall,
stopover site use appears to be influenced by multiple factors, suggesting that that not all
spring migration habitats serve the same stopover function and the aggregate value of
these sites must be considered (Mehlman et al. 2005). The frequent and consistent use of
Lynn Canal by large numbers of individuals indicates that it is an important stopover site
for migrating surf scoters. More individuals staged here than at any other site, suggesting
that this site may serve more as a longer term staging site than a short term stopover
stepping stone. Many of the used sites are well documented herring spawn sites;
53
however, Lynn Canal was a particular exception in that there was no documented herring
spawn within the site during the study years, having experienced marked declines in
herring stocks in recent years (Willson and Womble 2006). Geographical context may be
an important factor in the use of Lynn Canal as a stopover and staging site, given its
location as the most northeastern waterway in southeast Alaska. This region is likely a
natural break for scoters to take advantage of abundant marine resources and gauge
weather conditions before turning inland to migrate into the boreal forests of northern
Canada.
Aggregations of birds, such as the scoters within Lynn Canal during spring
migration, are vulnerable to stochastic natural events and human activity impacts (Ford et
al. 1982). Of the 14 sites we have identified as important stopovers for surf scoters, only
Berners Bay has been identified as an Important Bird Area (IBA) (Audubon 2008). Given
the large numbers of scoters from throughout the Pacific surf scoter population using this
specific area during such an important period in their annual cycle, scoters in this region
may be particularly vulnerable to events such as contaminant spills.
The strong relationship between important stopover sites and herring spawn
emphasizes the need for integrating the management of herring fisheries with the
management of sea ducks. Several herring stocks in southeast Alaska have decreased to
levels that are no longer commercially viable (Willson and Womble 2006). The
identification of Berners Bay as an IBA is largely based on its importance to numerous
species that depend on the Pacific herring runs which were once widespread throughout
Lynn Canal, but which now occur mainly in Berners Bay (Audubon 2008).
Understanding the importance of herring spawn during stopover and staging and the
54
energy requirements for migration and reproduction is critical for management and
conservation of scoter populations, as well as other species that use this ephemeral spring
resource.
3.8 Acknowledgements
This study was funded by the Sea Duck Joint Venture. This work was conducted
following guidance from Animal Care and Use Committees and with permits from
California Department of Fish and Game, Canadian Wildlife Service, U. S. Fish and
Wildlife Service, USGS Bird Banding Laboratory, Simon Fraser University, and
Washington Department of Fish and Wildlife. Funding was provided by the USGS
Western Ecological Research Center Coastal Ecosystems Program with support from the
Calfed Ecosystem Restoration Program.
55
3.9 References
Albert, D., and J. Schoen. 2007. A conservation assessment for the coastal forests andmountains ecoregion of southeastern Alaska and the Tongass National Forest. inJ. Schoen, and E. Dovichin, editors. The coastal forests and mountains ecoregionof southeastern Alaska and the Tongas National Forest. Audubon Alaska and TheNature Conservancy, Anchorage, AK, USA.
Alisauskas, R. T., and C. D. Ankney. 1992. The cost of egg laying and its relationship tonutrient reserves in waterfowl. Pages 30-61 in B. D. J. Batt, A. D. Afton, M. G.Anderson, C. D. Ankney, D. H. Johnson, J. A. Kadlec, and G. L. Krapu, editors.Ecology and management of breeding waterfowl. University of Minnesota PressMinneapolis Minnesota & London England.
Ankney, C. D., and C. D. MacInnes. 1978. Nutrient reserves and reproductiveperformance of female lesser snow geese. Auk 95:459-471.
Anteau, M. J., and A. D. Afton. 2004. Nutrient reserves of lesser scaup (Aythya affinis)during spring migration in the Mississippi Flyway: A test of the spring conditionhypothesis. Auk 121:917-929.
Arzel, C., J. Elmberg, and M. Guillemain. 2006. Ecology of spring-migrating Anatidae: areview. Journal of Ornithology 147:167-184.
Audubon. 2008. Audubon Alaska Important Bird Areas.http://iba.audubon.org/ibalstateIndex.do?state=US-AK. Accessed 15 January2008.
Beyer, H. L. 2004. Hawth's Analysis Tools for ArcGIS. Version 3.27.http://www.spatialecology.com/htools. Accessed 15 October 2007.
Bond J. C. and D. Esler. 2006. Nutrient acquisition by female harlequin ducks prior tospring migration and reproduction: evidence for body mass optimization.Canadian Journal of Zoology 84(9): 1223-1229.
Bishop, M. A., and S. P. Green. 2001. Predation on Pacific herring (Clupea pallasi)spawn by birds in Prince William Sound, Alaska. Fisheries Oceanography10:149-158
Burnham, K. P., and D. R. Anderson. 2002. Model selection and inference: a practicalinformation-theoretic approach. 2nd edition. Springer-Verlag, New York, NY.
56
Data East. 2007. XTools Pro. Version 5.1. http://www.xtoolspro.com. Accessed 15September 2007.
Drent, R J., A. D. Fox, and J. Stahl. 2006. Travelling to breed. Journal of Ornithology147:122-134.
Environmental Systems Research Institute. 2005. ArcGIS. Version 9.1. ESRI, Redlands,California, USA.
Farmer, A. H., and A. H. Parent. 1997. Effects of the landscape on shorebird movementsat spring migration stopovers. Condor 99:698-707.
Ford, R G., J. A. Weins, D. Heinemann, and G. L. Hunt. 1982. Modelling the sensitivityof colonially breeding marine birds to oil spills: guillemot and kittiwakepopulations on the Pribilof Islands, Bering Sea. Journal of Applied Ecology 19: 131.
Haegele, C. W. 1993. Seabird predation of Pacific herring, Clupea pallasi, spawn inBritish Columbia. Canadian Field-Naturalist 107:73-82.
Iverson, S. A., W. S. Boyd, D. Esler, D. M. Mulcahy, and T. D. Bowman. 2006.Comparison of the effects and performance of four types of radiotransmitters foruse with scoters. Wildlife Society Bulletin 34:656-663.
Kaiser, G. W., A. E. Derocher, S. Crawford, M. J. Gill, and I. A. Manley. 1995. Acapture technique for marbled murrelets in coastal inlets. Journal of FieldOrnithology 66:321-333.
Lewis, T. L., D. Esler, W. S. Boyd, and R Zydelis. 2005. Nocturnal foraging behavior ofwintering surf scoters and white-winged scoters. Condor 107:637-647.
Lok, E. K., M. Kirk, D. Esler, and W. S. Boyd. In press. Movements of pre-migratorysurf and white-winged scoters in response to herring spawn in the Strait ofGeorgia, British Columbia. Waterbirds.
Lovvorn, J. R, S. E. Richman, J. M. Grebmeier, and L. W. Cooper. 2003. Diet and bodycondition of spectacled eiders wintering in pack ice of the Bering Sea. PolarBiology 26:259-267.
Mechlin, L. M., and C. W. Shaiffer. 1980. Net-firing gun for capturing breedingwaterfowl. Journal of Wildlife Management 44:895-896.
Mehlman, D. W., S. E. Mabey, D. N. Ewert, C. Duncan, B. Abel, D. Cimprich, R D.Sutter, and M. Woodrey. 2005. Conserving stopover sites for forest-dwellingmigratory landbirds. Auk 122:1281-1290.
57
Miller, M. R., J. Y. Takekawa, J. P. Fleskes, D. L. Orthmeyer, M. L. Casazza, and W. M.Perry. 2005. Spring migration of northern pintails from California's CentralValley wintering area tracked with satellite telemetry: routes, timing, anddestinations. Canadian Journal of Zoology 83: 1314-1332.
Morrison, R. I. G., and K. A. Hobson. 2004. Use of body stores in shorebirds after arrivalon high-arctic breeding grounds. Auk 121 :333-344.
Mulcahy, D. M., and D. Esler. 1999. Surgical and immediate post release mortality ofharlequin ducks (Histrionicus histrionicus) implanted with abdominal radiotransmitters with percutaneous antennae. Journal of Zoo and Wildlife Medicine30:397-401.
Nysewander, D. R., J. R. Evenson, B. M. Murphie, and T. C. Cyra. 2004. Trendsobserved for selected marine bird species during 1993-2002 winter aerial surveysProceedings of Georgia Basin/Puget Sound Research Conference.
Nystrom, K. G. K., and O. Pehrsson. 1988. Salinity as a constraint affecting food andhabitat choice of mussel-feeding diving ducks. Ibis 130:94-110.
Paul A. J. and J. M. Paul. 1999. Energy contents of whole body, ovaries, and ova frompre-spawning Pacific herring. Alaska Fishery Research Bulletin 6(1): 29-34.
Reed, E. T., G. Gauthier, and J. F. Giroux. 2004. Effects of spring conditions on breedingpropensity of greater snow goose females. Animal Biodiversity and Conservation27:35-46.
Rodway, M. S., H. M. Regehr, 1. Ashley, P. V. Clarkson, R. I. Goudie, D. E. Hay, C. M.Smith, and K. G. Wright. 2003. Aggregative response of harlequin ducks toherring spawning in the Strait of Georgia, British Columbia. Canadian Journal ofZoology 81:504-514.
SAS Institute. 2003. SAS. Version 9.1. SAS Institute, Cary, North Carolina, USA.
Savard, J.-P. L., D. Bordage, and A. Reed. 1998. Surf scoter (Melanitta perspicillata).Birds of North America 363:1-27.
Schmutz, J. A., K. A. Hobson, and J. A. Morse. 2006. An isotopic assessment of proteinfrom diet and endogenous stores: effects on egg production and incubationbehaviour of geese. Ardea 94:385-397.
ShoreZone Program. 2006. ShoreZone Coastal habitat mapping data summary reportSoutheast Alaska 2004-2005. http://www.coastalandoceans.com. Accessed 25January 2007.
58
Skagen, S. K., and F. L. Knopf. 1994. Residency patterns of migrating sandpipers at amidcontinental stopover. Condor 96:949-958.
Smith, R J., and F. R Moore. 2003. Arrival fat and reproductive performance in a longdistance passerine migrant. Oecologia 134:325-331.
Sullivan, T. M., R W. Butler, and W. S. Boyd. 2002. Seasonal distribution of waterbirdsin relation to spawning Pacific herring, Clupea pallasi, in the Strait of Georgia,British Columbia. Canadian Field-Naturalist 116:366-370.
USFWS. 1999. Population status and trends of sea ducks in Alaska. U.S. Fish andWildlife Service, unpublished report. Migratory Bird Management, Anchorage,Alaska 99503.
Vermeer, K., M. Bentley, K. H. Morgan, and G. E. J. Smith. 1997. Association of feedingflocks of brant and sea ducks with herring spawn at Skidegate Inlet. CanadianWildlife Service Occasional Paper 93: 102-107.
Warnock, N., and M. A. Bishop. 1998. Spring stopover ecology of migrant westernsandpipers. Condor 100:456-467.
Webster, M. S., P. P. Marra, S. M. Haig, S. Bensch, and R T. Holmes. 2002. Linksbetween worlds: unraveling migratory connectivity. Trends in Ecology &Evolution 17:76-83.
Willson, M. F., and J. N. Womble. 2006. Vertebrate exploitation of pulsed marine prey: areview and the example of spawning herring. Reviews in Fish Biology andFisheries 16: 183-200.
Zydelis, R, D. Esler, W. S. Boyd, D. L. LaCroix, and M. Kirk. 2006. Habitat use bywintering surf and white-winged scoters: Effects of environmental attributes andshellfish aquaculture. Journal of Wildlife Management 70: 1754-1762.
59
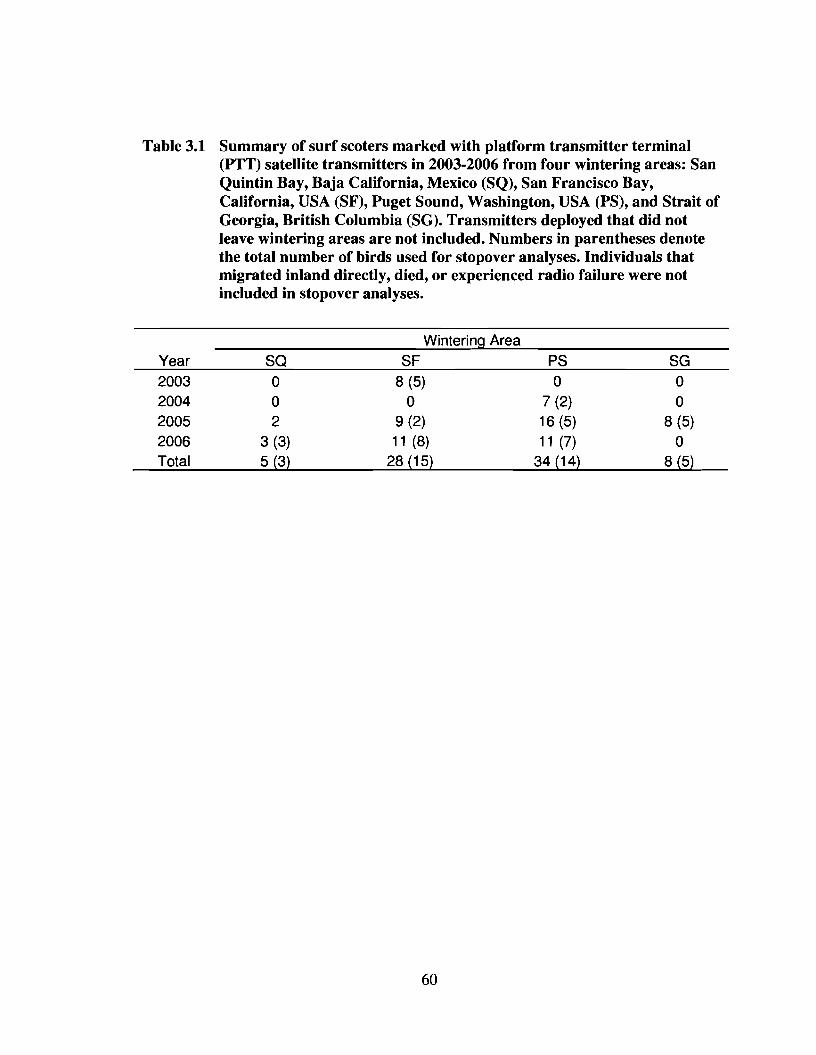
Table 3.1 Summary of surf scoters marked with platform transmitter terminal(PTT) satellite transmitters in 2003-2006 from four wintering areas: SanQuintin Bay, Baja California, Mexico (SQ), San Francisco Bay,California, USA (SF), Puget Sound, Washington, USA (PS), and Strait ofGeorgia, British Columbia (SG). Transmitters deployed that did notleave wintering areas are not included. Numbers in parentheses denotethe total number of birds used for stopover analyses. Individuals thatmigrated inland directly, died, or experienced radio failure were notincluded in stopover analyses.
Wintering Area
Year sa SF PS SG
2003 0 8 (5) 0 0
2004 0 0 7 (2) 02005 2 9 (2) 16 (5) 8 (5)
2006 3 (3) 11 (8) 11 (7) 0Total 5 (3) 28 (15) 34 (14) 8 (5)
60
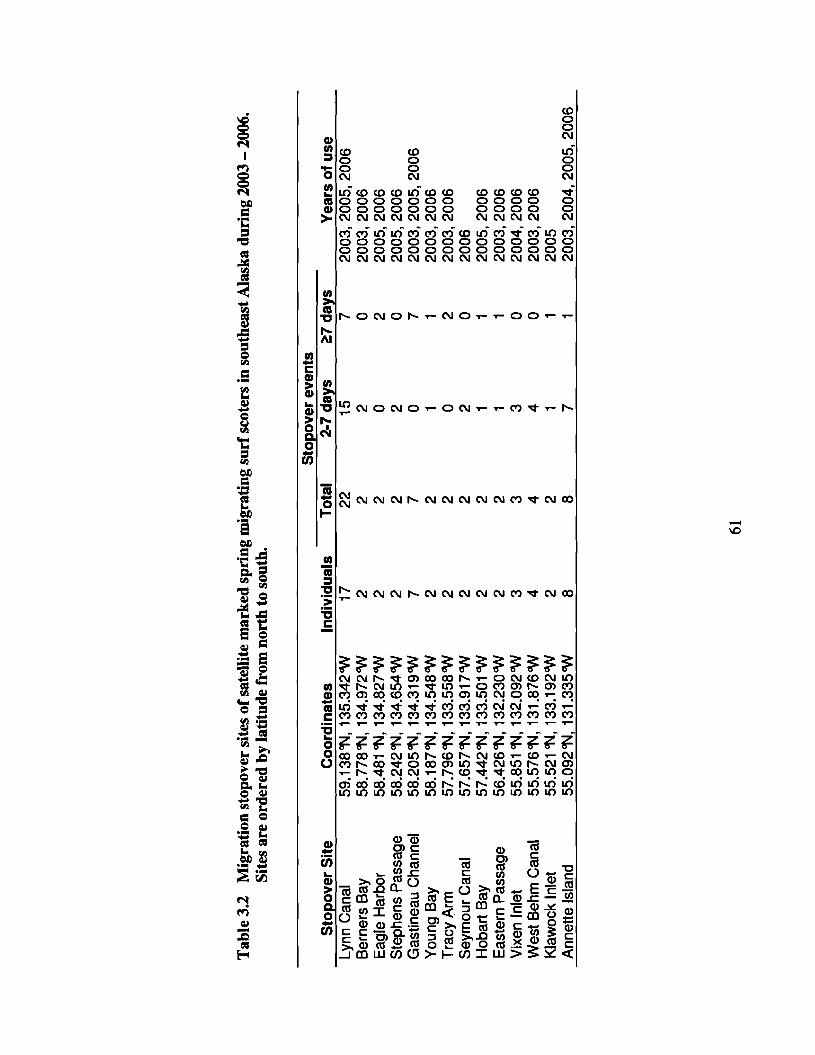
Tab
le3.
2M
igra
tion
stop
over
site
so
fsat
elli
tem
ark
edsp
ring
mig
rati
ngsu
rfsc
oter
sin
sout
heas
tAla
ska
duri
ng20
03-
2006
.S
ites
are
orde
red
by
lati
tude
from
no
rth
toso
uth.
Sto
pove
rS
iteLy
nnC
anal
Ber
ners
Bay
Eag
leH
arbo
rS
teph
ens
Pas
sage
Gas
tinea
uC
hann
elY
oung
Bay
Tra
cyA
rmS
eym
ou
rC
anal
Hob
art
Bay
Eas
tern
Pas
sage
Vix
enIn
let
Wes
tB
ehm
Can
alK
law
ock
Inle
tA
nnet
teIs
land
Coo
rdin
ates
59.1
38<
N,
135.
342C
W58
.778
<N
,134
.972
CW
58.4
81<N
,13
4.82
7CW
58
.24
2<N
,1
34
.65
4CW
58.2
05<
N,1
34.3
19C
W58
.187
<N
,134
.548
CW
57.7
96<
N,
133.
558C
W57
.657
<N
,133
.917
CW
57.4
42<
N,
133.
501
CW56
.426
<N
,13
2.23
0CW
55.8
51<N
,13
2.09
2CW
55.5
76<
N,
131.
876C
W55
.521
<N,
133.
192C
W55
.092
<N
,131
.335
CW
Ind
ivid
ua
ls17 2 2 2 7 2 2 2 2 2 3 4 2 8
61
Tot
al2
2 2 2 2 7 2 2 2 2 2 3 4 2 8
Sto
pove
reve
nts
2-7
days
~7
days
15
72
0o
22
0o
71
1o
22
01
11
13
04
01
17
1
Yea
rso
fuse
20
03
,20
05
,20
06
20
03
,20
06
20
05
,20
06
20
05
,20
06
20
03
,20
05
,20
06
20
03
,20
06
20
03
,20
06
20
06
20
05
,20
06
20
03
,20
06
20
04
,20
06
20
03
,20
06
20
05
20
03
,20
04
,20
05
,20
06
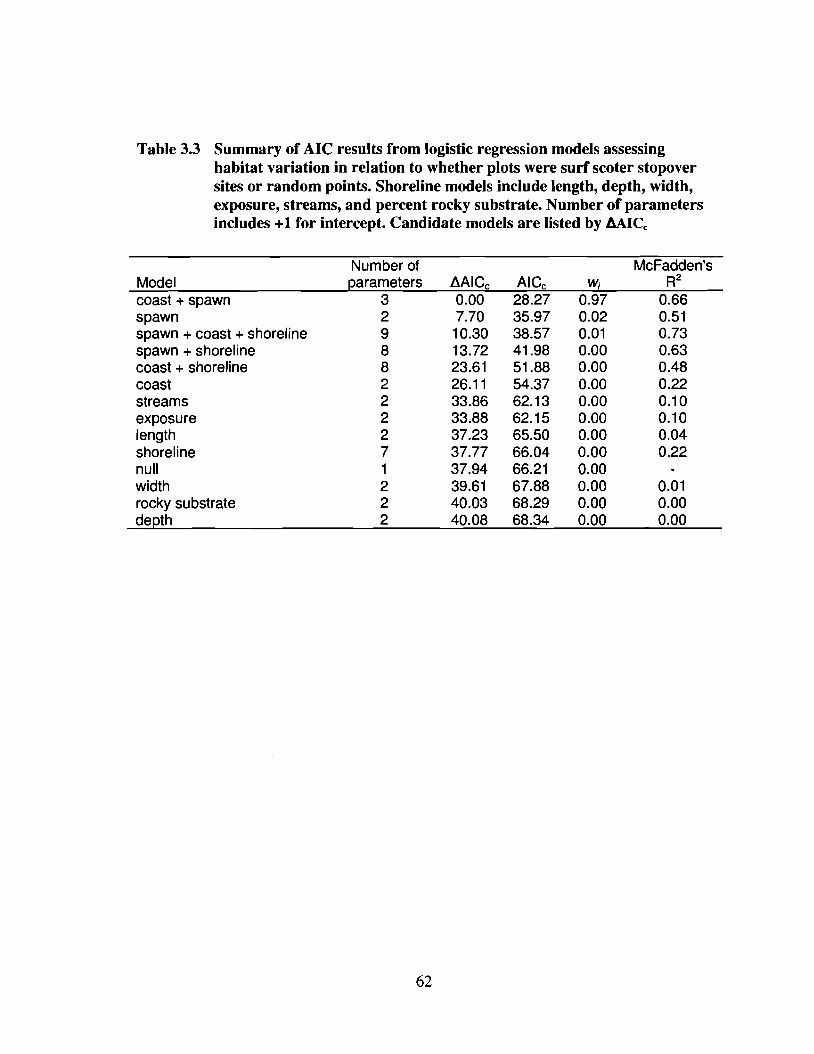
Table 3.3 Summary of AIC results from logistic regression models assessinghabitat variation in relation to whether plots were surf scoter stopoversites or random points. Shoreline models include length, depth, width,exposure, streams, and percent rocky substrate. Number of parametersincludes +1 for intercept. Candidate models are listed by MICe
Modelcoast + spawnspawnspawn + coast + shorelinespawn + shorelinecoast + shorelinecoaststreamsexposurelengthshorelinenullwidthrocky substratedepth
Number ofparameters
32988222271222
62
flAICc0.007.70
10.3013.7223.6126.1133.8633.8837.2337.7737.9439.6140.0340.08
AICc28.2735.9738.5741.9851.8854.3762.1362.1565.5066.0466.2167.8868.2968.34
Wi
0.970.020.010.000.000.000.000.000.000.000.000.000.000.00
McFadden'sR2
0.660.510.730.630.480.220.100.100.040.22
0.010.000.00
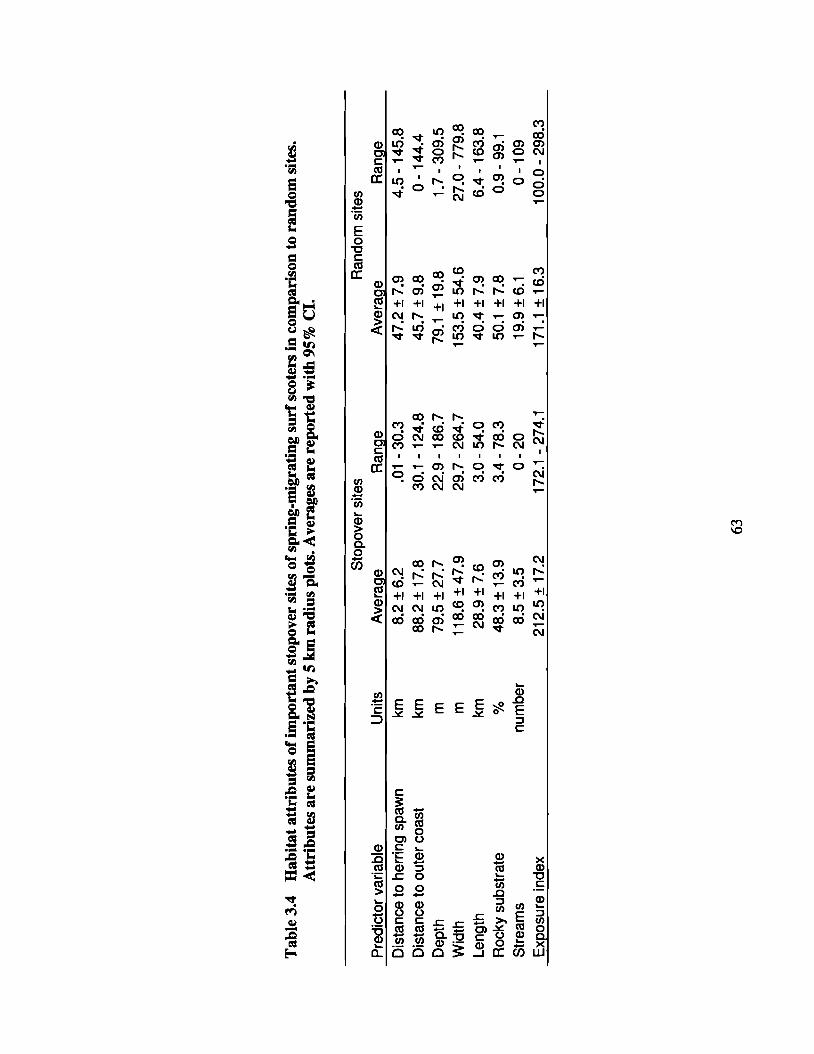
Tab
le3.
4H
abit
atat
trib
utes
ofim
port
ants
topo
vers
ites
ofsp
ring
-mig
rati
ngsu
rfsc
oter
sin
com
pari
son
tora
ndom
site
s.A
ttri
bute
sar
esu
mm
ariz
edby
5kI
nra
dius
plot
s.A
vera
ges
are
repo
rted
wit
h95
%C
I.
Pre
dict
orva
riabl
eD
ista
nce
tohe
rrin
gsp
awn
Dis
tanc
eto
oute
rco
ast
Dep
thW
idth
Leng
thR
ocky
subs
trat
eS
trea
ms
Exp
osur
ein
dex
Uni
tskm km m m km %
num
ber
Sto
pove
rsi
tes
Ran
dom
site
sA
vera
geR
ange
Ave
rage
Ran
ge8.
2±
6.2
.01
-30
.347
.2±
7.9
4.5
-14
5.8
88.2
±17
.830
.1-
124.
845
.7±
9.8
0-
144.
479
.5±
27.7
22.9
-18
6.7
79.1
±19
.81.
7-
309.
51
18
.6±
47
.92
9.7
-26
4.7
15
3.5
±5
4.6
27
.0-7
79
.828
.9±
7.6
3.0
-54
.040
.4±
7.9
6.4
-16
3.8
48.3
±13
.93.
4-
78.3
50.1
±7.
80.
9-
99.1
8.5
±3.
50
-20
19.9
±6.
10
-10
921
2.5
±17
.217
2.1
-27
4.1
171.
1±
16.3
100.
0-
298.
3
63
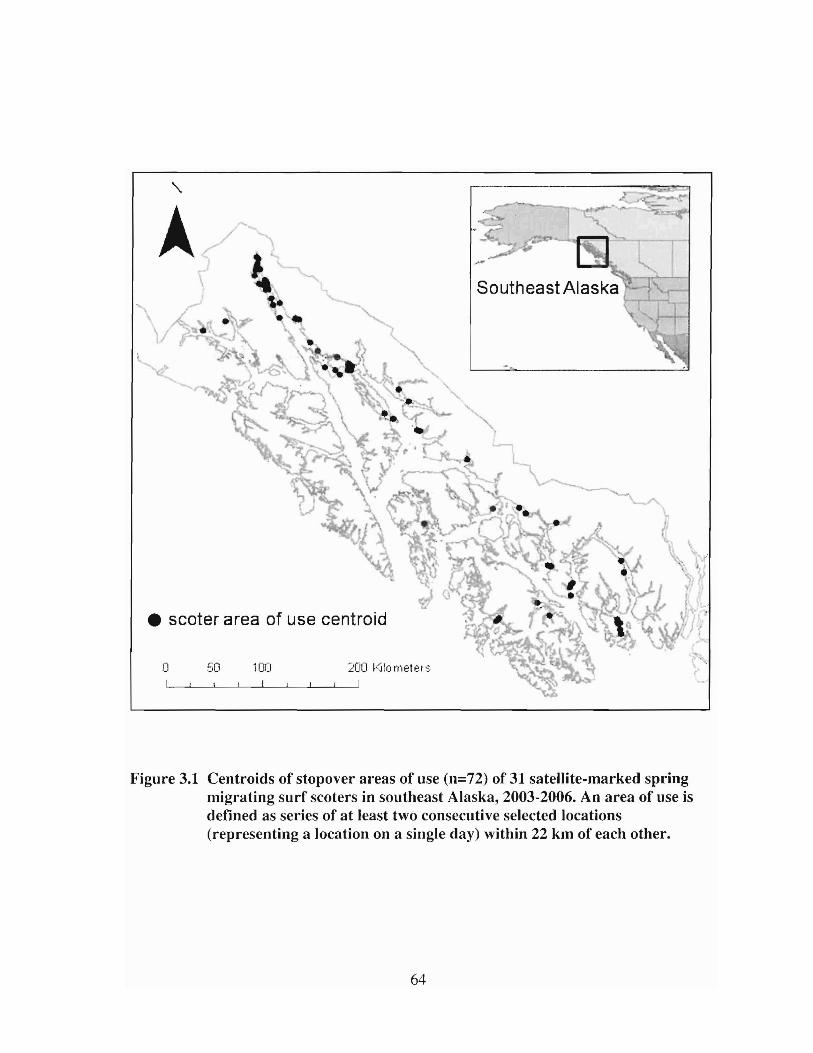
• seater area of use centroid
o 50 100 200 l<ilo rneter sI
Figure 3.1 Centroids of stopover areas of use (n=72) of 31 sateJlite-marked springmigrating surf scoters in southeast Alaska, 2003-2006. An area of use isdefined as series of at least two consecutive selected locations(representing a location on a single day) within 22 km of each other.
64
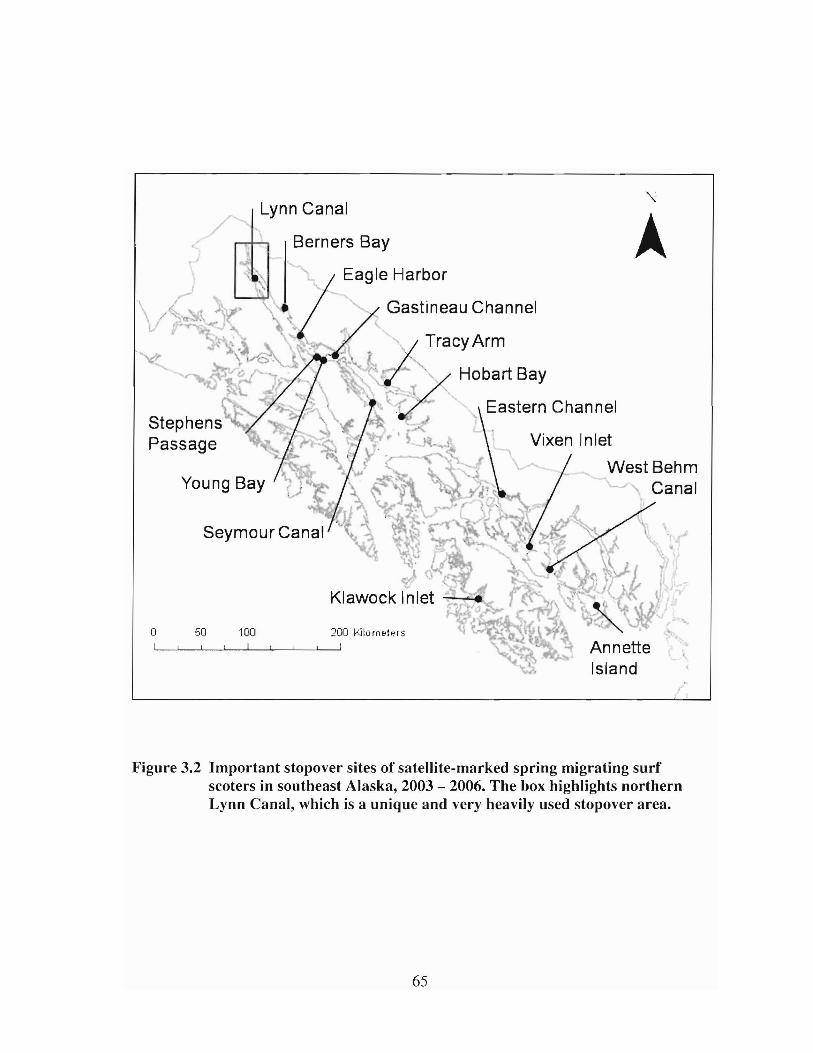
Young Bay
Vixen Inlet
West Behm'. Canal
200 hJlornelers
Lynn Canal
Berners Bay
IEagle Harbor
• ". / Gastineau Channel
\ -~ r I' Tracy Arm, ,<'J.~ , ,
.' .,1" 'y' Hobart Bay
, '-",' Eastern ChannelJ .
100
/
50o
~
StephensPassage
Figure 3.2 Important stopover sites of satellite-marked spring migrating surfscoters in southeast Alaska, 2003 - 2006. The box highlights northernLynn Canal, which is a unique and very heavily used stopover area.
65
CHAPTER 4 SPATIOTEMPORALASSOCIATIONSBETWEEN PACIFIC HERRING SPAWN AND SURFSCOTER SPRING MIGRATION: EVALUATING A"SILVER WAVE" HYPOTHESIS
66
4.1 Abstract
Surf scoters (Melanitta perspicillata) are known to aggregate at spawning sites of
Pacific herring (Clupea pallasi) and forage on the eggs, which are deposited in great
abundance in intertidal and shallow subtidal zones along a small proportion of available
coastline. We considered this relationship on a continental scale, by determining whether
the phenology of scoter spring migration and their selection of stopover locations
corresponded to herring spawn timing and locations; in other words, we evaluated
whether scoters follow a "silver wave" of resource availability that influences when and
where they choose to migrate. We found strong support for a basic assumption of the
silver wave hypothesis, specifically that herring spawn activity initiates later in the year
at higher latitudes, creating a northward-progressing wave of short-term localized food
availability. We compared locations of satellite-tagged surf scoters with spawn
availability and found that surf scoter migration generally coincided with the northward
progression of herring spawn within the study years, although there was considerable
variability in timing of both scoter migration and herring spawn initiation. At a
continental scale, the majority of tagged scoters visited at least one spawn site during
migration, and those that used spawn sites were located at spawn sites for approximately
a third of their migration period. On a regional scale, surf scoters showed strong
spatiotemporal associations with herring spawn sites, confirming that the presence of
herring spawn was an important factor determining habitat use during spring migration
for many individuals. Although the distribution and timing of spawning activity appears
to explain only some of the variation in continental migration strategies, herring spawn is
clearly an important resource for many spring-migrating surf scoters.
67
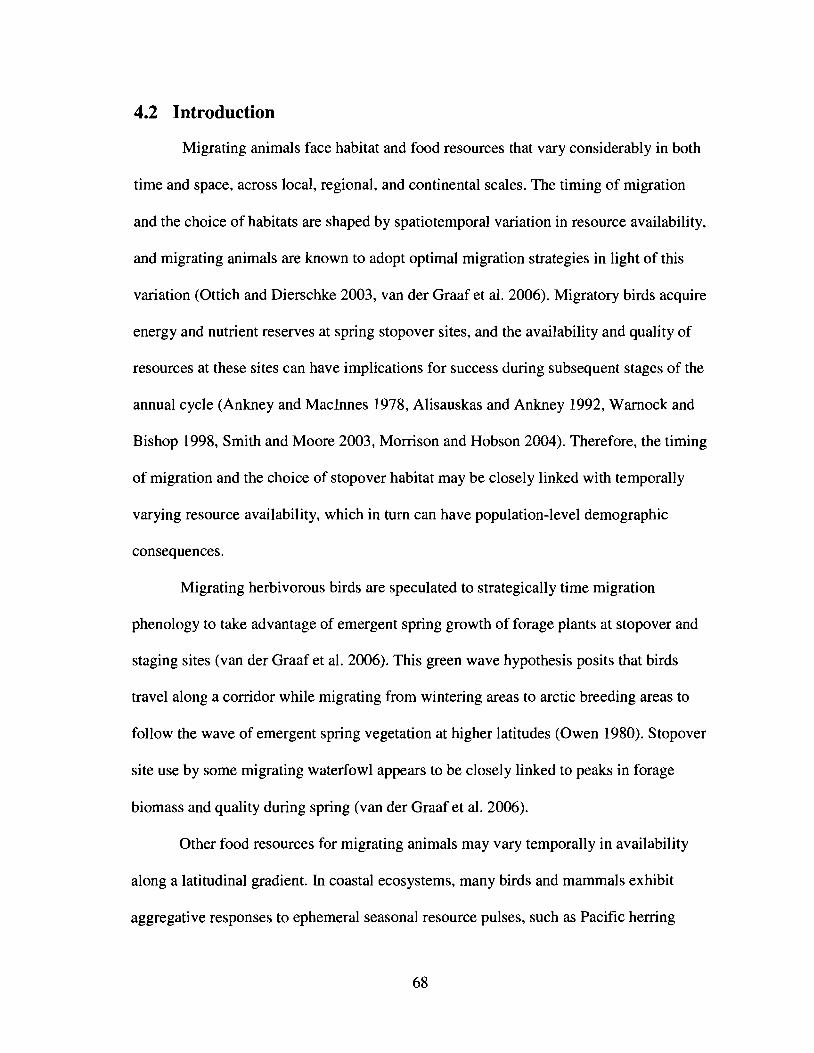
4.2 Introduction
Migrating animals face habitat and food resources that vary considerably in both
time and space, across local, regional, and continental scales. The timing of migration
and the choice of habitats are shaped by spatiotemporal variation in resource availability,
and migrating animals are known to adopt optimal migration strategies in light of this
variation (Ottich and Dierschke 2003, van der Graaf et al. 2006). Migratory birds acquire
energy and nutrient reserves at spring stopover sites, and the availability and quality of
resources at these sites can have implications for success during subsequent stages of the
annual cycle (Ankney and MacInnes 1978, Alisauskas and Ankney 1992, Warnock and
Bishop 1998, Smith and Moore 2003, Morrison and Hobson 2004). Therefore, the timing
of migration and the choice of stopover habitat may be closely linked with temporally
varying resource availability, which in tum can have population-level demographic
consequences.
Migrating herbivorous birds are speculated to strategically time migration
phenology to take advantage of emergent spring growth of forage plants at stopover and
staging sites (van der Graaf et al. 2006). This green wave hypothesis posits that birds
travel along a corridor while migrating from wintering areas to arctic breeding areas to
follow the wave of emergent spring vegetation at higher latitudes (Owen 1980). Stopover
site use by some migrating waterfowl appears to be closely linked to peaks in forage
biomass and quality during spring (van der Graaf et al. 2006).
Other food resources for migrating animals may vary temporally in availability
along a latitudinal gradient. In coastal ecosystems, many birds and mammals exhibit
aggregative responses to ephemeral seasonal resource pulses, such as Pacific herring
68
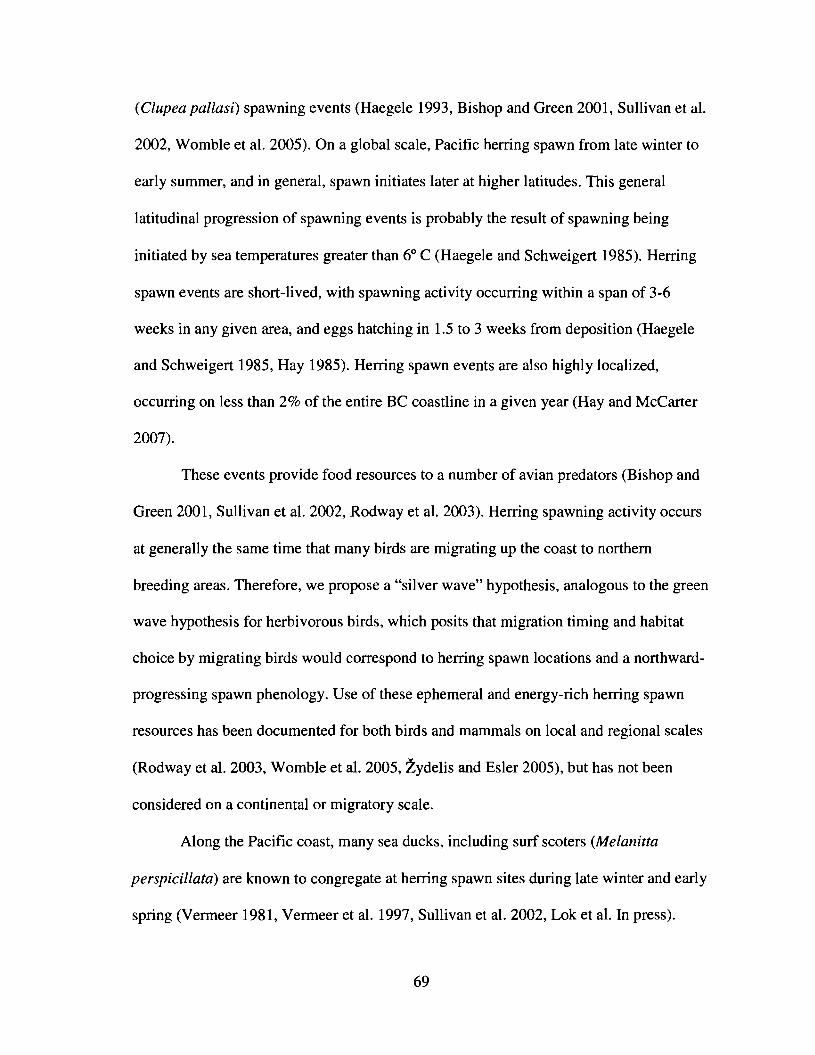
(Clupea pallasi) spawning events (Haegele 1993, Bishop and Green 2001, Sullivan et al.
2002, Womble et al. 2005). On a global scale, Pacific herring spawn from late winter to
early summer, and in general, spawn initiates later at higher latitudes. This general
latitudinal progression of spawning events is probably the result of spawning being
initiated by sea temperatures greater than 6° C (Haegele and Schweigert 1985). Herring
spawn events are short-lived, with spawning activity occurring within a span of 3-6
weeks in any given area, and eggs hatching in 1.5 to 3 weeks from deposition (Haegele
and Schweigert 1985, Hay 1985). Herring spawn events are also highly localized,
occurring on less than 2% of the entire BC coastline in a given year (Hay and McCarter
2007).
These events provide food resources to a number of avian predators (Bishop and
Green 2001, Sullivan et al. 2002, Rodway et al. 2003). Herring spawning activity occurs
at generally the same time that many birds are migrating up the coast to northern
breeding areas. Therefore, we propose a "silver wave" hypothesis, analogous to the green
wave hypothesis for herbivorous birds, which posits that migration timing and habitat
choice by migrating birds would correspond to herring spawn locations and a northward
progressing spawn phenology. Use of these ephemeral and energy-rich herring spawn
resources has been documented for both birds and mammals on local and regional scales
(Rodway et al. 2003, Womble et al. 2005, Zydelis and Esler 2005), but has not been
considered on a continental or migratory scale.
Along the Pacific coast, many sea ducks, including surf scoters (Melanitta
perspicillata) are known to congregate at herring spawn sites during late winter and early
spring (Vermeer 1981, Vermeer et al. 1997, Sullivan et al. 2002, Lok et al. In press).
69
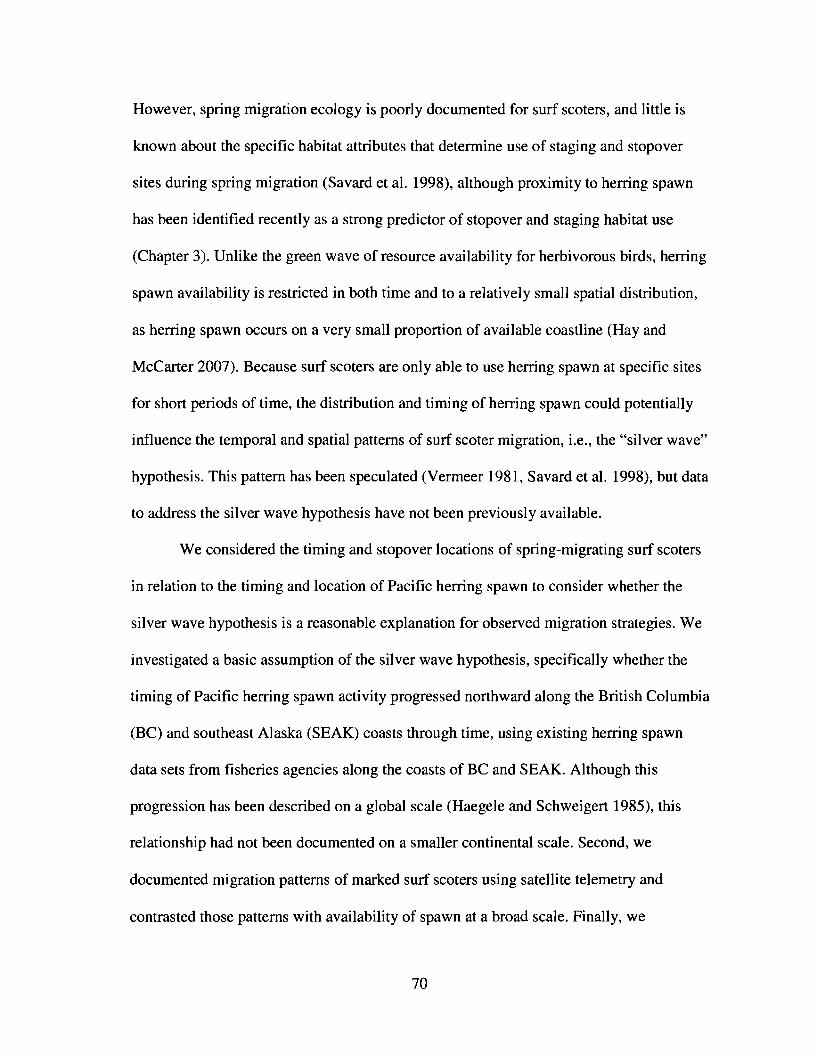
However, spring migration ecology is poorly documented for surf scoters, and little is
known about the specific habitat attributes that determine use of staging and stopover
sites during spring migration (Savard et al. 1998), although proximity to herring spawn
has been identified recently as a strong predictor of stopover and staging habitat use
(Chapter 3). Unlike the green wave of resource availability for herbivorous birds, herring
spawn availability is restricted in both time and to a relatively small spatial distribution,
as herring spawn occurs on a very small proportion of available coastline (Hay and
McCarter 2007). Because surf scoters are only able to use herring spawn at specific sites
for short periods of time, the distribution and timing of herring spawn could potentially
influence the temporal and spatial patterns of surf scoter migration, i.e., the "silver wave"
hypothesis. This pattern has been speculated (Vermeer 1981, Savard et al. 1998), but data
to address the silver wave hypothesis have not been previously available.
We considered the timing and stopover locations of spring-migrating surf scoters
in relation to the timing and location of Pacific herring spawn to consider whether the
silver wave hypothesis is a reasonable explanation for observed migration strategies. We
investigated a basic assumption of the silver wave hypothesis, specifically whether the
timing of Pacific herring spawn activity progressed northward along the British Columbia
(BC) and southeast Alaska (SEAK) coasts through time, using existing herring spawn
data sets from fisheries agencies along the coasts of BC and SEAK. Although this
progression has been described on a global scale (Haegele and Schweigert 1985), this
relationship had not been documented on a smaller continental scale. Second, we
documented migration patterns of marked surf scoters using satellite telemetry and
contrasted those patterns with availability of spawn at a broad scale. Finally, we
70
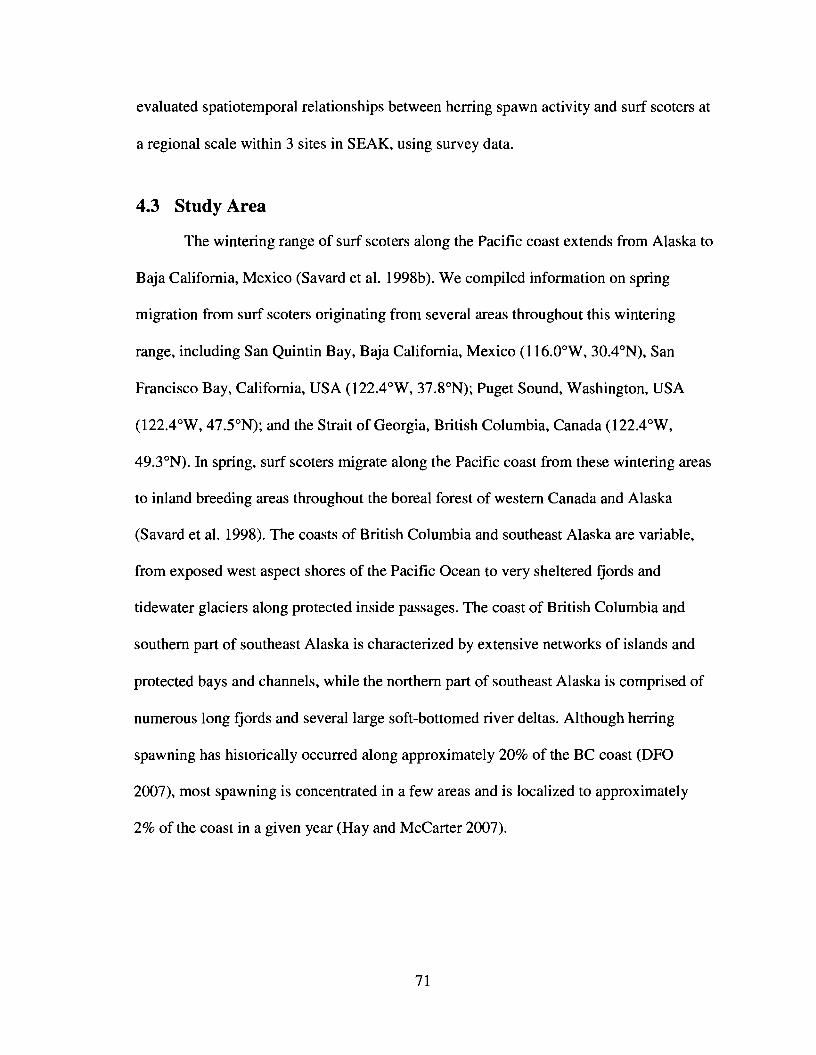
evaluated spatiotemporal relationships between herring spawn activity and surf scoters at
a regional scale within 3 sites in SEAK, using survey data.
4.3 Study Area
The wintering range of surf scoters along the Pacific coast extends from Alaska to
Baja California, Mexico (Savard et al. 1998b). We compiled information on spring
migration from surf scoters originating from several areas throughout this wintering
range, including San Quintin Bay, Baja California, Mexico (l16.0oW, 30AON), San
Francisco Bay, California, USA (l22AoW, 37.8°N)~ Puget Sound, Washington, USA
(122AoW, 47.5°N); and the Strait of Georgia, British Columbia, Canada (122AoW,
49.3°N). In spring, surf scoters migrate along the Pacific coast from these wintering areas
to inland breeding areas throughout the boreal forest of western Canada and Alaska
(Savard et al. 1998). The coasts of British Columbia and southeast Alaska are variable,
from exposed west aspect shores of the Pacific Ocean to very sheltered fjords and
tidewater glaciers along protected inside passages. The coast of British Columbia and
southern part of southeast Alaska is characterized by extensive networks of islands and
protected bays and channels, while the northern part of southeast Alaska is comprised of
numerous long fjords and several large soft-bottomed river deltas. Although herring
spawning has historically occurred along approximately 20% of the BC coast (DFO
2007), most spawning is concentrated in a few areas and is localized to approximately
2% of the coast in a given year (Hay and McCarter 2007).
71
4.4 Methods
4.4.1 Captures and marking
We captured surf scoters on wintering grounds between November and March,
2002-2006, using a floating mistnet (Kaiser et aI. 1995, Lewis et al. 2005), or a net shot
from a netgun (Mech1in and Shaiffer 1980). Birds were implanted with p1atform
transmitter-terminal (PTT) satellite-transmitters (Table 4.1) following standard
procedures (Mulcahy and Esler 1999). This radio implantation method has been shown to
perform well for scoters relative to other attachment methods (Iverson et al. 2006).
Tagged birds were released after a recovery period of at least 1 hour. PTT transmitters
were programmed with duty cycles to transmit location data for 6-8 h and turn off for 48
96 h.
4.4.2 Location data
Satellite transmitter locations were obtained from the Argos data system, which
estimated positions by calculating the Doppler-effect shift with receivers on National
Oceanic and Atmospheric Administration (NOAA) weather satellites. We compiled the
location data from all PTT-tagged surf scoters and filtered the data spatially and
temporally to select only coastal spring migration locations, which we defined as those
locations occurring along the coastline of BC and SEAK. PTT locations are classified by
estimated accuracy and number of signals. For Location Classes (LC) 3, 2, 1, and 0, in
which ~4 messages are received by the satellite, Argos rates accuracy as <150, 150-350,
350-1000, and >1000 m, respectively. Accuracy is not provided for LC A (3 messages),
B (2 messages), and Z (latitude/longitude often provided if>1 message received).
Location data usually included more than one useable location per bird in a transmission
72
day so a "Selected Location" for each transmission day was selected according to the
criteria described by Miller et al. (2005). These criteria favor locations with LC 3, 2 and
1, but recognize that accurate locations are obtained for a large proportion of locations
within all Argos location quality classes. Although less conservative than filtering
locations of lower location quality classes, this method allowed us to maximize the
number of Selected Locations during the short migration period.
4.4.3 Aerial surveys
We conducted aerial surveys to document the distribution and abundance of surf
scoters both before and during the spawning/migration period in 2006. Surveys were
conducted along the shoreline in three regions in SEAK; Ketchikan, Juneau, and Haines
(Figure 4.1). All three areas were surveyed once prior to herring spawning initiation (1
April 2006 to 2 April 2006). During the spawning/migration period, the Ketchikan region
was surveyed twice (20 April 2006 and 24 April 2006), the Juneau region was surveyed
once (8 May 2006), and the Haines region was surveyed twice (9 May 2006 and 15 May
1006). Surveys were conducted in a Cessna 185 or Heliocourier with an experienced
survey pilot and passenger side observer between 0900 hand 1600 h. Surveys followed
the shoreline at altitudes of 150-200 m and flight speeds of <200 km/hour. Survey routes
varied in shoreline length between regions (Ketchikan - 540 km, Juneau - 463 km,
Haines- 394 km) and survey duration varied accordingly. We used digital marine charts
(NOAA 1:250,000) to record locations of all observed surf scoters; groups were recorded
as a single location with an estimate of group size. Groups of <100 were counted
individually; larger group were estimated by lOs, 100s, or 1000s, depending on the size
of the group.
73
4.4.4 Herring spawn data
We created a database documenting the distribution and timing of major herring
spawn events along the BC and SEAK coast in 2003-2006 using existing data from
Department of Fisheries and Oceans (DFO) and the Alaska Department of Fish and
Game (ADFG). The DFO Pacific Herring Geographic Bulletin dataset is available online
(DFO 2007) and reports the timing and magnitude of herring spawning in 101
management sections along the BC coast. The dataset also includes the centroid position
for each section, which is determined by calculating the mean latitude and longitude
coordinates using all the recorded spawning events within the section (Figure 4.1). The
mean spawn date was considered the most representative spawn date of the majority of
spawning herring in a section (B. McCarter, Department of Fisheries and Oceans,
personal communication). We compiled the location and timing of herring spawning
within similar management sections within SEAK from the ADFG and unpublished
sources (J. Womble, National Park Service, unpublished data). For continental scale
analyses, we considered spawn distribution and timing for BC and SEAK combined. For
regional scale analyses, we compiled Geographic Information Systems (GIS) coverages
of herring spawn distribution within SEAK during the study years.
4.5 Data Analyses
4.5.1 Spawn progression and migration patterns
We examined the underlying assumption of the silver wave hypothesis that
Pacific herring spawning activity along the BC and Alaska coast progresses northward
through spring, with spawning activity initiating later at higher latitudes, potentially
providing a progressive wave of short-term food availability. We used least squares
74
general linear models to evaluate variation in latitude of herring spawning activity along
the BC and SEAK coasts in relation to the day of year (doy) and year. We included the
day of year variable as an indicator of seasonal progression, where 1 January =1, while
the year variable and day of year by year interactions were included to account for
potential inter-annual variation in this relationship. We used SAS (SAS Institute 2003)
for statistical analyses. We used an infonnation theoretic approach to model selection
(Burnham and Anderson 2002) and calculated Akaike's Infonnation Criterion adjusted
for small sample sizes (AICc) for each model within a candidate set. The candidate model
set consisted of the following models: (1) day of year (doy) (2) year (3) doy + year (4)
doy + doy*year (5) doy + year + doy*year and (6) a null model. We compared the AICc
value of each model to that of the best-fitting model (~AICc) to assess the relative
support for each candidate model. We calculated AICc weights (w;) to compare the
relative support for each model within the candidate model set, and calculated R2 values
to indicate overall model fit. Finally, we calculated model-averaged parameter estimates
and unconditional standard errors based on Akaike weights for all candidate models
(Burnham and Anderson 2002).
For the silver wave hypothesis to be supported, we would expect a general
correspondence between herring spawn availability and scoter locations, assuming the
basic premise that herring spawn progresses northward over time is correct. To evaluate
this, we compared the temporal and spatial patterns of herring spawn availability with
scoter locations. Estimates of average spawn latitude for each date were calculated from
model-averaged parameter estimates based on Akaike weights (Burnham and Anderson
2002) across the models in the candidate set describing the relationship of herring spawn
75
date by latitude (above). We then regressed the latitude of observed scoter locations
against estimates of the average latitude of herring spawn for the date of each bird
location; under the silver wave hypothesis, we would expect a positive relationship, with
a slope of approximately 1, indicating that the scoters are following the progression of
herring spawn availability exactly.
4.5.2 Spawn site use metrics
The silver wave hypothesis predicts that, in addition to a general latitudinal
correspondence between locations of migrating scoters and herring spawn. We recognize
that a single mean date for each spawning event does not fully represent herring spawn
availability over time and space, so we plotted scoter locations against herring spawn
availability to illustrate the spatiotemporal overlap between herring spawn availability
and migrating scoters. There should be close spatial correspondence between scoter
locations and sites with available herring spawn. Unlike the green wave for herbivorous
birds, in which resource availability occurs in a broad swath related to latitude, herring
spawn occurs at small, spatially discrete sites, so the silver wave hypothesis requires
confirmation that these specific sites are used by migrating birds. We evaluated this
prediction at two geographic scales.
Continental scale - The satellite telemetry location data were imported into
ArcGIS 9.1 (Environmental Systems Research Institute 2005) to create a map of surf
scoter spring migration locations and herring spawning locations. Because spawning
activity varied in both time and space, we filtered location data both spatially and
temporally. We considered spawn site use along the entire Be and SEAK coast. We
created buffers of 22 km radius around documented spawning locations using the Buffer
76
Wizard in ArcGIS 9.1. We considered a location at a spawn site if it was within 22 km of
the centroid of an active spawn management section. The 22 km radius is based on the
95th percentile of mean interfix distances for radio-tagged surf scoters in late winter when
herring spawn is available (Lok et al. In press). Once the data were spatially selected, we
filtered the data temporally by comparing the date of the scoter location to the mean date
of spawning within that management section. Locations were only considered at an active
spawn if the date was on, or within, 21 days following the mean spawning date. We
chose a period of 21 days to account for the presence of eggs from 1.5 - 3 weeks after
deposition and the possibility of spawning events initiating after the mean spawning date
within a management section. Locations at active spawn sites were used to calculate
metrics of spawn site use by scoters. Metrics included the number of individuals located
at spawn sites, the proportion of an individual's locations at spawn sites, the number of
spawn sites visited by an individual, and the proportion of all locations at spawn sites.
Previous work has shown that Lynn Canal (59.138°N, 135.342°W), within the Haines
region of SEAK, is a highly used stopover and staging site for migrating surf scoters
during the study years, despite not having any spawning activity during the study years
(Chapter 3). To account for the apparent alternative function of this unique area, we
calculated the same metrics for all locations in BC and SEAK excluding those in Lynn
Canal.
Regional scale - Aerial survey data were imported into ArcGIS 9.1 to create a
map of surf scoter group locations, scoter abundance, and herring spawn distribution
within each survey region (Ketchikan, Juneau, and Haines). We categorized surveys as
before spawning and during spawning based on the timing of herring spawn activity
77
within each survey area and the dates of surveys. We calculated several metrics of habitat
use before and during spawning. We calculated the density of scoters within the survey
areas before and during spawning activity, and weighted scoter locations by group size to
calculate a mean distance of individual scoter locations to herring spawn sites. To
account for variation in the proportion of coastline with available spawn, we calculated a
density of scoters per km of available spawn. In addition, we used the Buffer Wizard in
ArcGIS 9.1 and created a buffer of 1 km around documented spawning locations to
determine the number and proportion of scoters within 1 km of herring spawn sites.
4.6 Results
4.6.1 Spawn progression and migration patterns
Variation in the latitude of spawning activity was clearly related to the day of year
and year (Figure 4.2). Within the candidate model set, the day of year + day of year*year
model was the most strongly supported model (Wi =0.55, R2=0.61), with the day of year
+ year model receiving slightly more than half the support of the most strongly supported
model (Wi= 0.32, R2=0.61) (Table 4.2). These findings provide strong support for the
underlying assumption of the silver wave hypothesis that herring spawning activity along
the Pacific coast initiates later in the year at higher latitudes. Across all years, the
regression equation describing herring spawn latitude as a function of day of year alone
was herring spawn latitude =41.73 (±0.67) + 0.12( ±D.O1)*doy. In addition, we found
that this relationship varied somewhat inter-annually. Model-averaged parameter
estimates and unconditional standard errors describing the average latitude of herring
spawning activity are shown in Table 4.3.
78
We compared the latitude of PTT-tagged surf scoter locations to the predicted
latitude of spawning activity for the same day of year for all study years combined. We
found that the predicted spawn latitude explained some of the variation in surf scoter
latitude (R2=0.2l). The relationship between predicted spawn latitude and surf scoter
latitude was positive but less than 1 (surf scoter latitude = 19.11 (±2.65) +
0.64(±O.05)*predicted spawn latitude). This indicates that surf scoter locations do not
follow spawning activity exactly, showing a delayed progression up the coast in
comparison to herring spawn activity.
4.6.2 Spawn site use metrics
Continental scale - When we considered a broader date range of spawn
availability, we found that the patterns of surf scoter spring migration only somewhat
paralleled that of northward herring spawn availability (Figure 4.3). However, the
majority of PTT-tagged surf scoters were located at spawn sites at least once. Of 51
individuals located within BC and SEAK, 31 (60%) were located at a spawn site at some
point during spring migration. We found that the mean (±SE) proportion of an individual
scoter's locations located at spawn sites was 33 ± 4%. On average surf scoters visited 2.1
± 0.6 spawn sites during coastal spring migration through BC and SEAK. Overall, 24%
of scoter locations were located at spawn sites. When we considered only locations
outside of Lynn Canal we again found that 31 of 51 individuals were located at a spawn
sites, and the number of individuals and mean number of spawn sites visited by an
individual did not change. However, we found that the proportion of an individual's
locations located at a spawn site was larger (42 ± 4%), and the proportion of all locations
at spawn sites was 31 %.
79
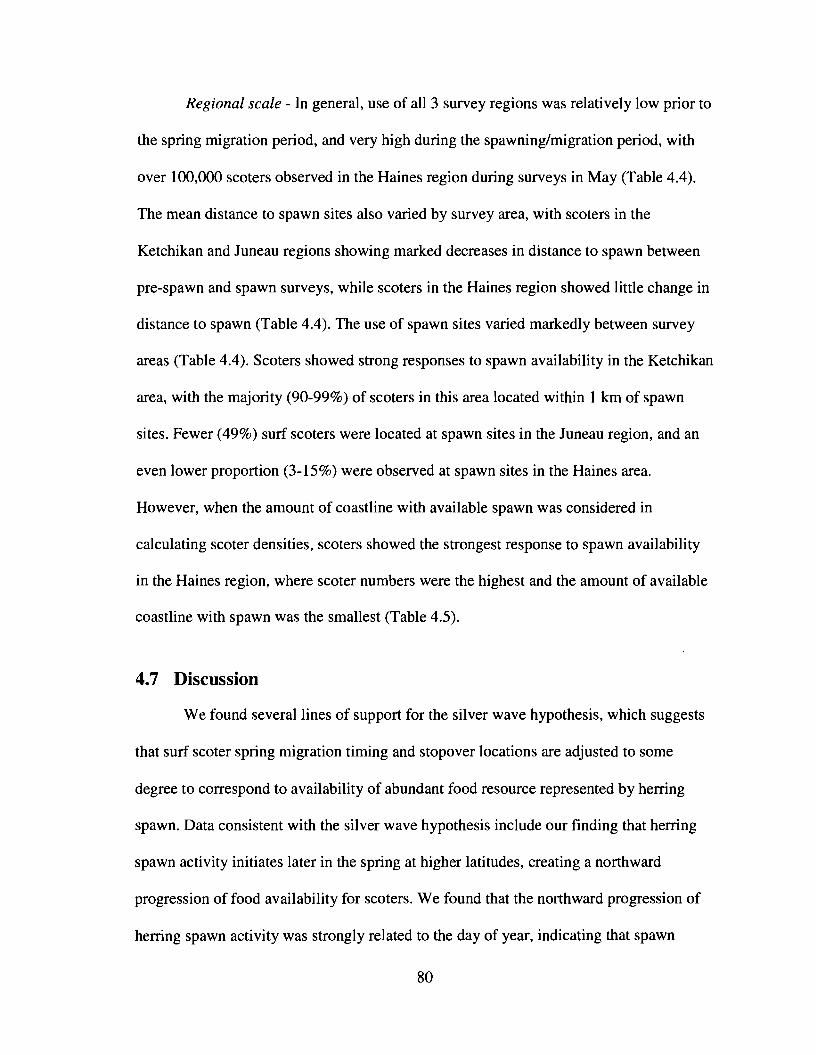
Regional scale - In general, use of all 3 survey regions was relatively low prior to
the spring migration period, and very high during the spawning/migration period, with
over 100,000 scoters observed in the Haines region during surveys in May (Table 4.4).
The mean distance to spawn sites also varied by survey area, with scoters in the
Ketchikan and Juneau regions showing marked decreases in distance to spawn between
pre-spawn and spawn surveys, while scoters in the Haines region showed little change in
distance to spawn (Table 4.4). The use of spawn sites varied markedly between survey
areas (Table 4.4). Scoters showed strong responses to spawn availability in the Ketchikan
area, with the majority (90-99%) of scoters in this area located within I km of spawn
sites. Fewer (49%) surf scoters were located at spawn sites in the Juneau region, and an
even lower proportion (3-15%) were observed at spawn sites in the Haines area.
However, when the amount of coastline with available spawn was considered in
calculating scoter densities, scoters showed the strongest response to spawn availability
in the Haines region, where scoter numbers were the highest and the amount of available
coastline with spawn was the smallest (Table 4.5).
4.7 Discussion
We found several lines of support for the silver wave hypothesis, which suggests
that surf scoter spring migration timing and stopover locations are adjusted to some
degree to correspond to availability of abundant food resource represented by herring
spawn. Data consistent with the silver wave hypothesis include our finding that herring
spawn activity initiates later in the spring at higher latitudes, creating a northward
progression of food availability for scoters. We found that the northward progression of
herring spawn activity was strongly related to the day of year, indicating that spawn
80
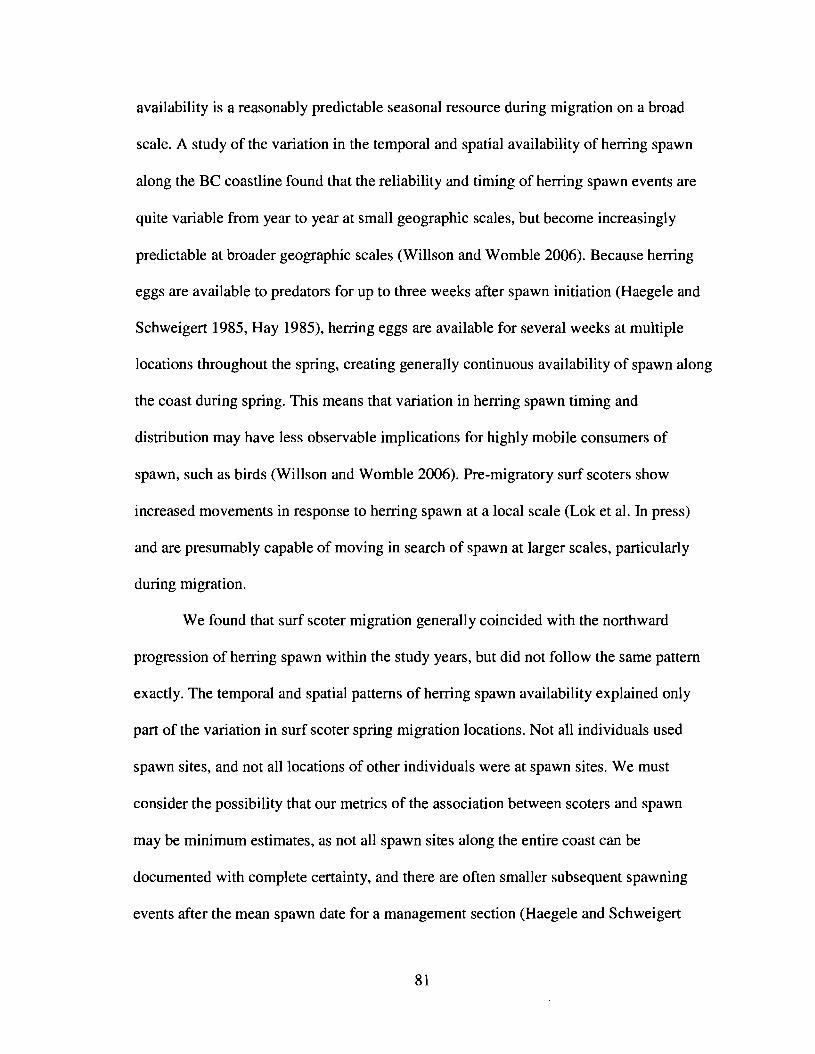
availability is a reasonably predictable seasonal resource during migration on a broad
scale. A study of the variation in the temporal and spatial availability of herring spawn
along the Be coastline found that the reliability and timing of herring spawn events are
quite variable from year to year at small geographic scales, but become increasingly
predictable at broader geographic scales (Willson and Womble 2006). Because herring
eggs are available to predators for up to three weeks after spawn initiation (Haegele and
Schweigert 1985, Hay 1985), herring eggs are available for several weeks at multiple
locations throughout the spring, creating generally continuous availability of spawn along
the coast during spring. This means that variation in herring spawn timing and
distribution may have less observable implications for highly mobile consumers of
spawn, such as birds (Willson and Womble 2006). Pre-migratory surf scoters show
increased movements in response to herring spawn at a local scale (Lok et al. In press)
and are presumably capable of moving in search of spawn at larger scales, particularly
during migration.
We found that surf scoter migration generally coincided with the northward
progression of herring spawn within the study years, but did not follow the same pattern
exactly. The temporal and spatial patterns of herring spawn availability explained only
part of the variation in surf scoter spring migration locations. Not all individuals used
spawn sites, and not all locations of other individuals were at spawn sites. We must
consider the possibility that our metries of the association between scoters and spawn
may be minimum estimates, as not all spawn sites along the entire coast can be
documented with complete certainty, and there are often smaller subsequent spawning
events after the mean spawn date for a management section (Haegele and Schweigert
81
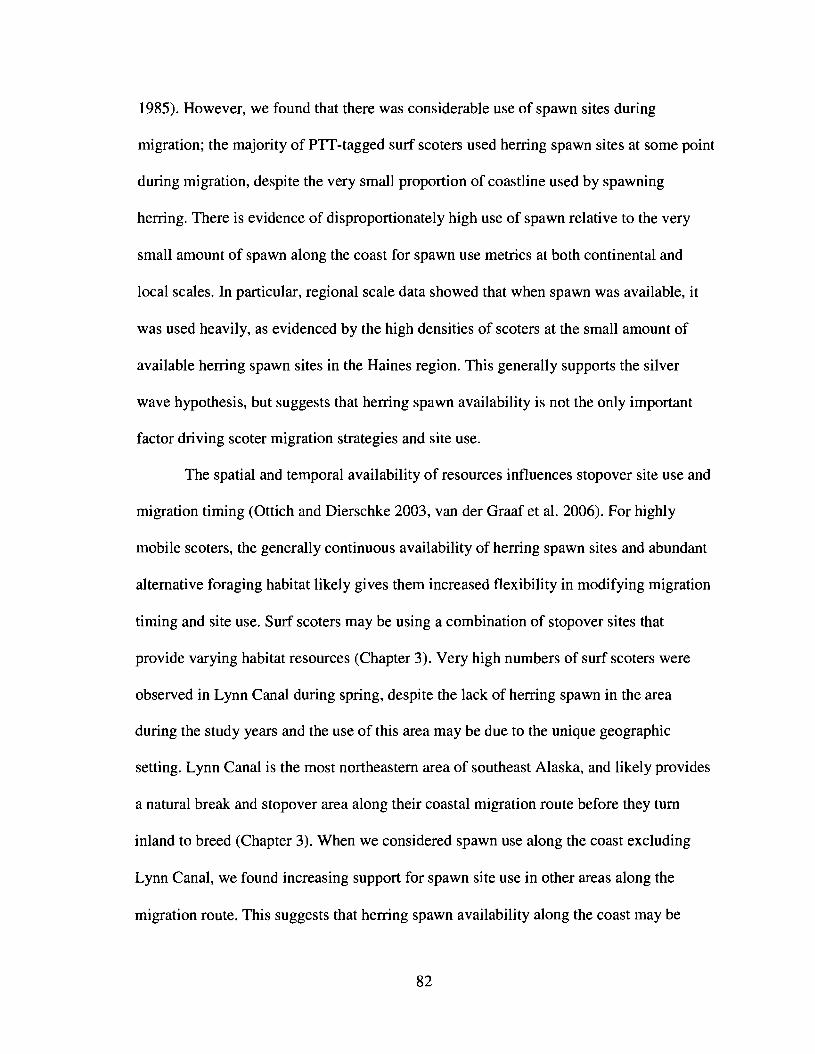
1985). However, we found that there was considerable use of spawn sites during
migration; the majority of PIT-tagged surf scoters used herring spawn sites at some point
during migration, despite the very small proportion of coastline used by spawning
herring. There is evidence of disproportionately high use of spawn relative to the very
small amount of spawn along the coast for spawn use metrics at both continental and
local scales. In particular, regional scale data showed that when spawn was available, it
was used heavily, as evidenced by the high densities of scoters at the small amount of
available herring spawn sites in the Haines region. This generally supports the silver
wave hypothesis, but suggests that herring spawn availability is not the only important
factor driving scoter migration strategies and site use.
The spatial and temporal availability of resources influences stopover site use and
migration timing (Ottich and Dierschke 2003, van der Graaf et al. 2006). For highly
mobile scoters, the generally continuous availability of herring spawn sites and abundant
alternative foraging habitat likely gives them increased flexibility in modifying migration
timing and site use. Surf scoters may be using a combination of stopover sites that
provide varying habitat resources (Chapter 3). Very high numbers of surf scoters were
observed in Lynn Canal during spring, despite the lack of herring spawn in the area
during the study years and the use of this area may be due to the unique geographic
setting. Lynn Canal is the most northeastern area of southeast Alaska, and likely provides
a natural break and stopover area along their coastal migration route before they tum
inland to breed (Chapter 3). When we considered spawn use along the coast excluding
Lynn Canal, we found increasing support for spawn site use in other areas along the
migration route. This suggests that herring spawn availability along the coast may be
82
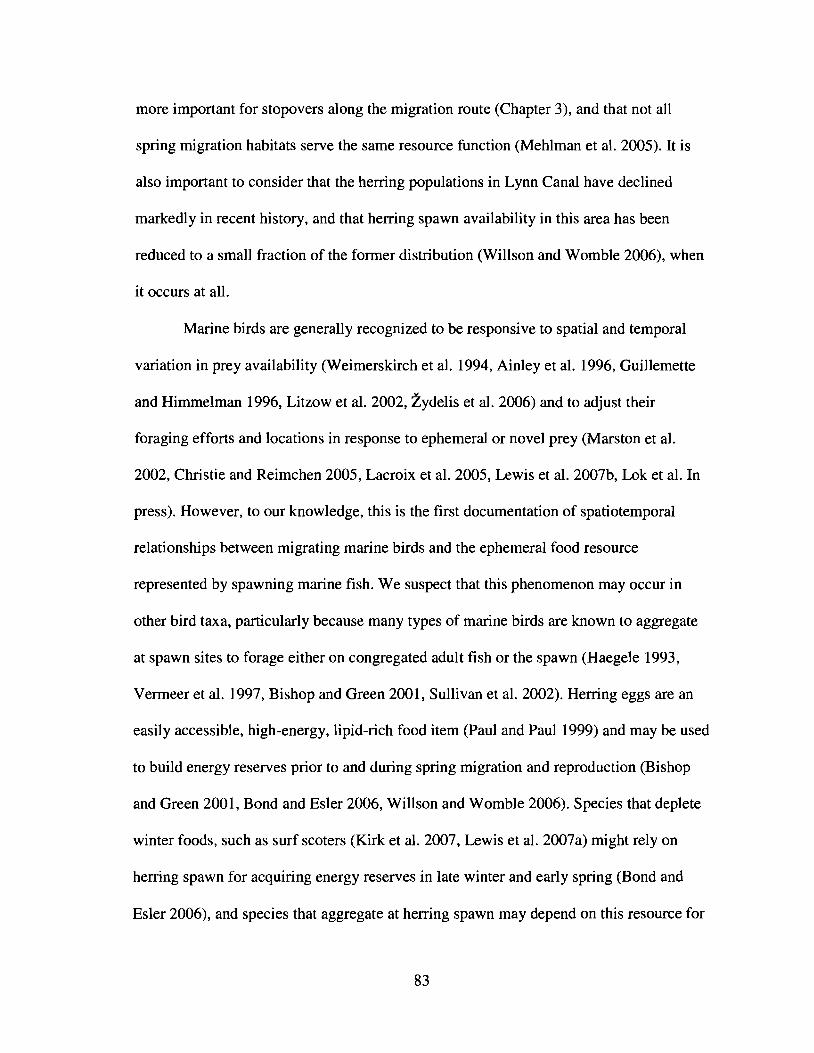
more important for stopovers along the migration route (Chapter 3), and that not all
spring migration habitats serve the same resource function (Mehlman et al. 2005). It is
also important to consider that the herring populations in Lynn Canal have declined
markedly in recent history, and that herring spawn availability in this area has been
reduced to a small fraction of the fonner distribution (Willson and Womble 2006), when
it occurs at all.
Marine birds are generally recognized to be responsive to spatial and temporal
variation in prey availability (Weimerskirch et al. 1994, Ainley et al. 1996, Guillemette
and Himmelman 1996, Litzow et al. 2002, Zydelis et al. 2006) and to adjust their
foraging efforts and locations in response to ephemeral or novel prey (Marston et al.
2002, Christie and Reimchen 2005, Lacroix et al. 2005, Lewis et al. 2007b, Lok et al. In
press). However, to our knowledge, this is the first documentation of spatiotemporal
relationships between migrating marine birds and the ephemeral food resource
represented by spawning marine fish. We suspect that this phenomenon may occur in
other bird taxa, particularly because many types of marine birds are known to aggregate
at spawn sites to forage either on congregated adult fish or the spawn (Haegele 1993,
Venneer et al. 1997, Bishop and Green 2001, Sullivan et al. 2002). Herring eggs are an
easily accessible, high-energy, lipid-rich food item (Paul and Paul 1999) and may be used
to build energy reserves prior to and during spring migration and reproduction (Bishop
and Green 2001, Bond and Esler 2006, Willson and Womble 2006). Species that deplete
winter foods, such as surf scoters (Kirk et al. 2007, Lewis et al. 2007a) might rely on
herring spawn for acquiring energy reserves in late winter and early spring (Bond and
Esler 2006), and species that aggregate at herring spawn may depend on this resource for
83
breeding in less resource rich areas (Zydelis and Esler 2005). Venneer (1997) speculated
that the fraction of a population using herring spawn sites could indicate the dependence
of that population on herring spawn for acquiring energy. The availability and quality of
resources during spring migration may have implications for success during subsequent
stages of the annual cycle (Ankney and MacInnes 1978, Alisauskas and Ankney 1992,
Warnock and Bishop 1998, Smith and Moore 2003, Morrison and Hobson 2004). Several
studies have described cross-seasonal effects of spring habitats on reproductive
perfonnance by migratory waterfowl (Lovvorn et al. 2003, Anteau and Afton 2004, Reed
et al. 2004, Schmutz et al. 2006) and, because these sites provide the energy and nutrients
required for reproduction, it follows that population dynamics may be influenced by
habitat conditions during spring migration.
Variation in non-breeding habitat such as areas supporting herring spawn may
have important conservation implications. Herring spawn sites are heavily used by many
marine bird and mammal species (Haegele 1993, Sullivan et at. 2002, Willson and
Womble 2006). However, traditional spawn sites in many areas have declined in numbers
and shifted in distribution, and species are increasingly restricted to fewer spawn sites
(Stick 2005, Willson and Womble 2006). Understanding the cross-seasonal links between
the use of herring spawn during late winter and the energy requirements for migration
and reproduction is critical for management and conservation of scoter populations, as
well as the many other species that use herring spawn.
4.8 Acknowledgements
This study was funded by the Sea Duck Joint Venture. This work was conducted
following guidance from Animal Care and Use Committees and with permits from
84
California Department of Fish and Game, Canadian Wildlife Service, U. S. Fish and
Wildlife Service, USGS Bird Banding Laboratory, Simon Fraser University, and
Washington Department of Fish and Wildlife. Funding was provided by the USGS
Western Ecological Research Center Coastal Ecosystems Program with support from the
Calfed Ecosystem Restoration Program. We acknowledge the Department of Fisheries
and Oceans, the Alaska Department of Fish and Game, and J. Womble for herring spawn
data. We thank pilots L. Bennett and D. Doyon for aerial survey expertise. B. Meredith,
P. Doherty, S. Heinl, and D. Douglas all provided valuable ground support and
knowledge in Alaska. We acknowledge Environment Canada Science Horizons Program
for financial support, and the Centre for Wildlife Ecology at Simon Fraser University for
financial and logistical support.
85
4.9 References
Ainley, D. G., L. B. Spear, and S. G. Allen. 1996. Variation in the diet of Cassin's aukletreveals spatial, seasonal, and decadal occurrence patterns of euphausiids offCalifornia, USA. Marine Ecology-Progress Series 137:1-10.
Alisauskas, R. T., and C. D. Ankney. 1992. The cost of egg laying and its relationship tonutrient reserves in waterfowl. Pages 30-61 in B. D. J. Batt, A. D. Afton, M. G.Anderson, C. D. Ankney, D. H. Johnson, J. A. Kadlec, and G. L. Krapu, editors.Ecology and management of breeding waterfowl. University of Minnesota PressMinneapolis Minnesota & London England.
Ankney, C. D., and C. D. MacInnes. 1978. Nutrient reserves and reproductiveperformance of female lesser snow geese. Auk 95:459-471.
Anteau, M. J., and A. D. Afton. 2004. Nutrient reserves of lesser scaup (Aythya affinis)during spring migration in the Mississippi Flyway: A test of the spring conditionhypothesis. Auk 121:917-929.
Bishop, M. A., and S. P. Green. 2001. Predation on Pacific herring (Clupea pallasi)spawn by birds in Prince William Sound, Alaska. Fisheries Oceanography 10149-158
Bond, J. C., and D. Esler. 2006. Nutrient acquisition by female harlequin ducks prior tospring migration and reproduction: evidence for body mass optimization.Canadian Journal of Zoology 84:1223-1229.
Burnham, K. P., and D. R. Anderson. 2002. Model selection and inference: a practicalinformation-theoretic approach. 2nd edition. Springer-Verlag, New York, NY.
Christie, K. S., and T. E. Reimchen. 2005. Post-reproductive salmon, Oncorhynchus spp.,as a major nutrient source for large aggregations of gulls, Larus spp. CanadianField-Naturalist 119:202-207.
DFO. 2007. Fisheries and Oceans Canada Pacific Herring Geographic Bulletin.http://www.pac.dfo-mpo.gc.ca/sci/herring/pages/herrin~e.htm.Accessed 15 May2007
Environmental Systems Research Institute. 2005. ArcGIS. Version 9.1. ESRI, Redlands,California, USA.
Guillemette, M., and J. H. Himmelman. 1996. Distribution of wintering common eidersover mussel beds: Does the ideal free distribution apply? Oikos 76:435-442.
86
Haegele, C. W. 1993. Seabird predation of Pacific herring, Clupea pallasi, spawn inBritish Columbia. Canadian Field-Naturalist 107:73-82.
Haegele, C. W., and J. F. Schweigert. 1985. Distribution and characteristics of herringspawning grounds and description of spawning behaviour. Canadian Journal ofFisheries and Aquatic Sciences 43.
Hay, D. E. 1985. Reproductive biology of Pacific herring (Clupea harengus). CanadianJournal of Fisheries and Aquatic Sciences 42 111-126.
Hay, D. E., and P. B. McCarter. 2007. Herring spawning areas of British Columbia: areview, geographical analysis and classification. Revised MS Rept. 2019.http://www.pac.dfo-mpo.gc.calscilherring/herspawnJpages/acknowll_e.htm.Accessed 15 May 2007.
Kaiser, G. W., A E. Derocher, S. Crawford, M. J. Gill, and I. A Manley. 1995. Acapture technique for marbled murrelets in coastal inlets. Journal of FieldOrnithology 66:321-333.
Kirk, M., D. Esler, and W. S. Boyd. 2007. Morphology and density of mussels on naturaland aquaculture structure habitats: implications for sea duck predators. MarineEcology Progress Series 346: 179-187.
Lacroix, D. L., S. Boyd, D. Esler, M. Kirk, T. L. Lewis, and S. Lipovski. 2005. Surfscoters aggregate and forage on ephemerally abundant polychaetes. MarineOrnithology 33:61-65.
Lewis, T. L., D. Esler, and W. S. Boyd. 2007a. Effects of predation by sea ducks on clamabundance in soft-bottom intertidal habitats. Marine Ecology-Progress Series329:131-144.
Lewis, T. L., D. Esler, and W. S. Boyd. 2007b. Foraging behaviors of surf scoters andwhite-winged scoters during spawning of Pacific herring. Condor 109:216-222.
Lewis, T. L., D. Esler, W. S. Boyd, and R. Zydelis. 2005. Nocturnal foraging behavior ofwintering surf scoters and white-winged scoters. Condor 107:637-647.
Litzow, M. A, J. F. Piatt, A K. Prichard, and D. D. Roby. 2002. Response of pigeonguillemots to variable abundance of high-lipid and low-lipid prey. Oecologia133:439-439.
Lok, E. K., M. Kirk, D. Esler, and W. S. Boyd. In press. Movements of pre-migratorysurf and white-winged scoters in response to herring spawn in the Strait ofGeorgia, British Columbia. Waterbirds.
87
Lovvorn, J. R, S. E. Richman, J. M. Grebmeier, and L. W. Cooper. 2003. Diet and bodycondition of spectacled eiders wintering in pack ice of the Bering Sea. PolarBiology 26:259-267.
Marston, B. H., M. F. Willson, and S. M. Gende. 2002. Predator aggregations duringeulachon Thaleichthys pacificus spawning runs. Marine Ecology-Progress Series231 :229-236.
Mechlin, L. M., and C. W. Shaiffer. 1980. Net-firing gun for capturing breedingwaterfowl. Journal of Wildlife Management 44:895-896.
Mehlman, D. W., S. E. Mabey, D. N. Ewert, C. Duncan, B. Abel, D. Cimprich, R D.Sutter, and M. Woodrey. 2005. Conserving stopover sites for forest-dwellingmigratory landbirds. Auk 122: 1281-1290.
Miller, M. R, J. Y. Takekawa, J. P. Fleskes, D. L. Orthmeyer, M. L. Casazza, and W. M.Perry. 2005. Spring migration of northern pintails from California's CentralValley wintering area tracked with satellite telemetry: routes, timing, anddestinations. Canadian Journal of Zoology 83:1314-1332.
Morrison, R 1. G., and K. A. Hobson. 2004. Use of body stores in shorebirds after arrivalon high-arctic breeding grounds. Auk 121:333-344.
Mulcahy, D. M., and D. Esler. 1999. Surgical and immediate postrelease mortality ofharlequin ducks (Histrionicus histrionicus) implanted with abdominal radiotransmitters with percutaneous antennae. Journal of Zoo and Wildlife Medicine30:397-401.
Ottich, 1., and V. Dierschke. 2003. Exploitation of resources modulates stopoverbehaviour of passerine migrants. Journal Fur Ornithologie 144:307-316.
Owen, M. 1980. Wild geese of the world. Batsford London.
Paul, A. J., and J. M. Paul. 1999. Energy contents of whole body, ovaries, and ova frompre-spawning Pacific herring. Alaska Fishery Research Bulletin 6:29-34.
Reed, E. T., G. Gauthier, and J. F. Giroux. 2004. Effects of spring conditions on breedingpropensity of greater snow goose females. Animal Biodiversity and Conservation27:35-46.
Rodway, M. S., H. M. Regehr, J. Ashley, P. V. Clarkson, R I. Goudie, D. E. Hay, C. M.Smith, and K. G. Wright. 2003. Aggregative response of harlequin ducks toherring spawning in the Strait of Georgia, British Columbia. Canadian Journal ofZoology 81:504-514.
SAS Institute. 2003. SAS. Version 9.1. SAS Institute, Cary, North Carolina, USA.
88
Savard, J.-P. L., D. Bordage, and A. Reed. 1998. Surf scoter (Melanitta perspicillata).Birds of North America 363:1-27.
Schmutz, J. A., K. A. Hobson, and J. A. Morse. 2006. An isotopic assessment of proteinfrom diet and endogenous stores: effects on egg production and incubationbehaviour of geese. Ardea 94:385-397.
Smith, R. J., and E R. Moore. 2003. Arrival fat and reproductive performance in a longdistance passerine migrant. Oecologia 134:325-331.
Stick, K. C. 2005. Washington State Herring Stock Status Report. WashingtonDepartment of Fish and Wildlife. Fish Management Program. May 2005
Sullivan, T. M., R. W. Butler, and W. S. Boyd. 2002. Seasonal distribution of waterbirdsin relation to spawning Pacific herring, Clupea pallasi, in the Strait of Georgia,British Columbia. Canadian Field-Naturalist 116:366-370.
van der Graaf, A. J., J. Stahl, A. Klimkowska, J. A. Bakker, and R. H. Drent. 2006.Surfing on a green wave - how plant growth drives spring migration in thebarnacle goose (Branta leucopsis). Ardea 94:567-577.
Vermeer, K. 1981. Food and populations of surf scoters in British Columbia. Wildfowl32:107-116.
Vermeer, K., M. Bentley, K. H. Morgan, and G. E. J. Smith. 1997. Association of feedingflocks of brant and sea ducks with herring spawn at Skidegate Inlet. CanadianWildlife Service Occasional Paper 93: 102-107.
Warnock, N., and M. A. Bishop. 1998. Spring stopover ecology of migrant WesternSandpipers. Condor 100:456-467.
Weimerskirch, H., C. P. Doncaster, and F. Cuenotchaillet. 1994. Pelagic seabirds and themarine-environment - foraging patterns of wandering albatrosses in relation toprey availability and distribution. Proceedings of the Royal Society of LondonSeries B-Biological Sciences 255:91-97.
Willson, M. E, and J. N. Womble. 2006. Vertebrate exploitation of pulsed marine prey: areview and the example of spawning herring. Reviews in Fish Biology andFisheries 16: 183-200.
Womble, J. N., M. E Willson, M. E Sigler, B. P. Kelly, and G. R. VanBlaricom. 2005.Distribution of Steller sea lions Eumetopias jubatus in relation to spring-spawningfish in SE Alaska. Marine Ecology Progress Series 294:271-282.
89

Zydelis, R., and D. Esler. 2005. Response of wintering Steller's eiders to herring spawn.Waterbirds 28:344-350.
Zydelis, R., D. Esler, W. S. Boyd, D. L. LaCroix, and M. Kirk. 2006. Habitat use bywintering surf and white-winged scoters: Effects of environmental attributes andshellfish aquaculture. Journal of Wildlife Management 70: 1754-1762.
90
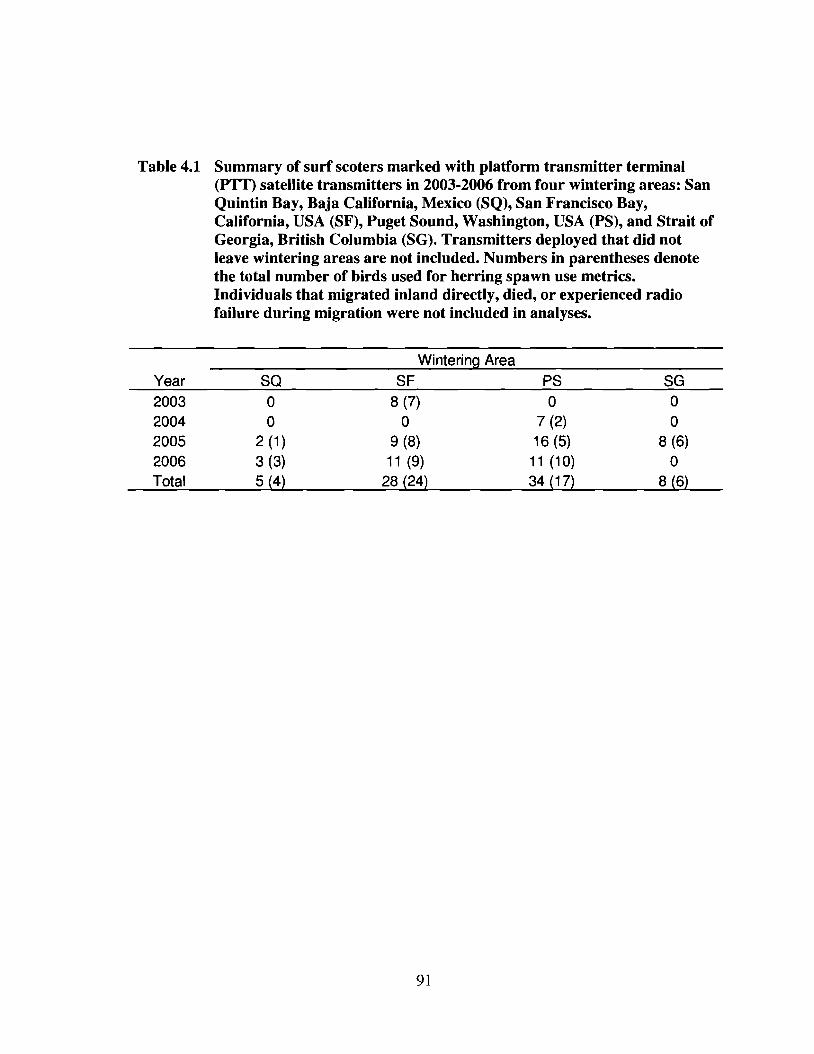
Table 4.1 Summary of surf scoters marked with platform transmitter terminal(PTT) satellite transmitters in 2003-2006 from four wintering areas: SanQuintin Bay, Baja California, Mexico (SQ), San Francisco Bay,California, USA (SF), Puget Sound, Washington, USA (PS), and Strait ofGeorgia, British Columbia (SG). Transmitters deployed that did notleave wintering areas are not included. Numbers in parentheses denotethe total number of birds used for herring spawn use metrics.Individuals that migrated inland directly, died, or experienced radiofailure during migration were not included in analyses.
Wintering Area
Year sa SF PS SG
2003 0 8 (7) 0 02004 0 0 7 (2) 02005 2 (1) 9 (8) 16 (5) 8 (6)2006 3 (3) 11 (9) 11 (10) 0Total 5 (4) 28 (24) 34 (17) 8 (6)
91
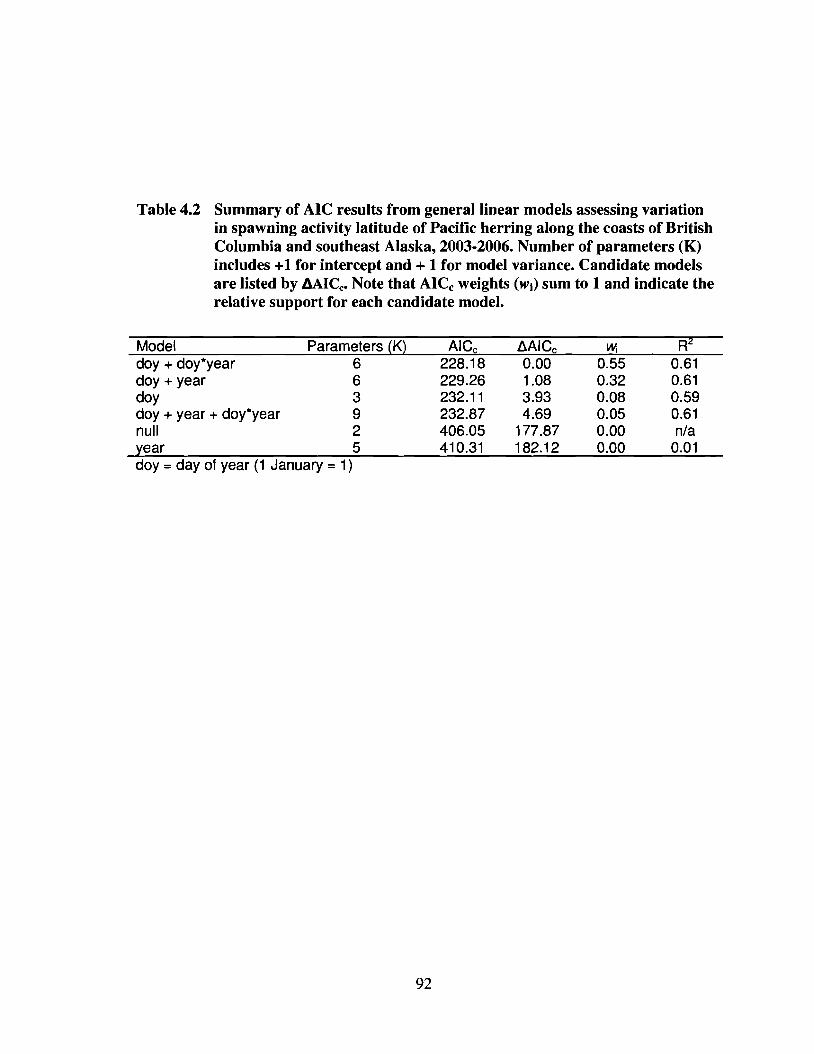
Table 4.2 Summary of AIC results from general linear models assessing variationin spawning activity latitude of Pacific herring along the coasts of BritishColumbia and southeast Alaska, 2003-2006. Number of parameters (K)includes +1 for intercept and + 1 for model variance. Candidate modelsare listed by MICe. Note that AICc weights (Wi) sum to 1 and indicate therelative support for each candidate model.
Model Parameters (K) AICc ~AICc Wi R2
doy + doy*year 6 228.18 0.00 0.55 0.61doy + year 6 229.26 1.08 0.32 0.61doy 3 232.11 3.93 0.08 0.59doy + year + doy*year 9 232.87 4.69 0.05 0.61null 2 406.05 177.87 0.00 n/ayear 5 410.31 182.12 0.00 0.01doy =day of year (1 January = 1)
92
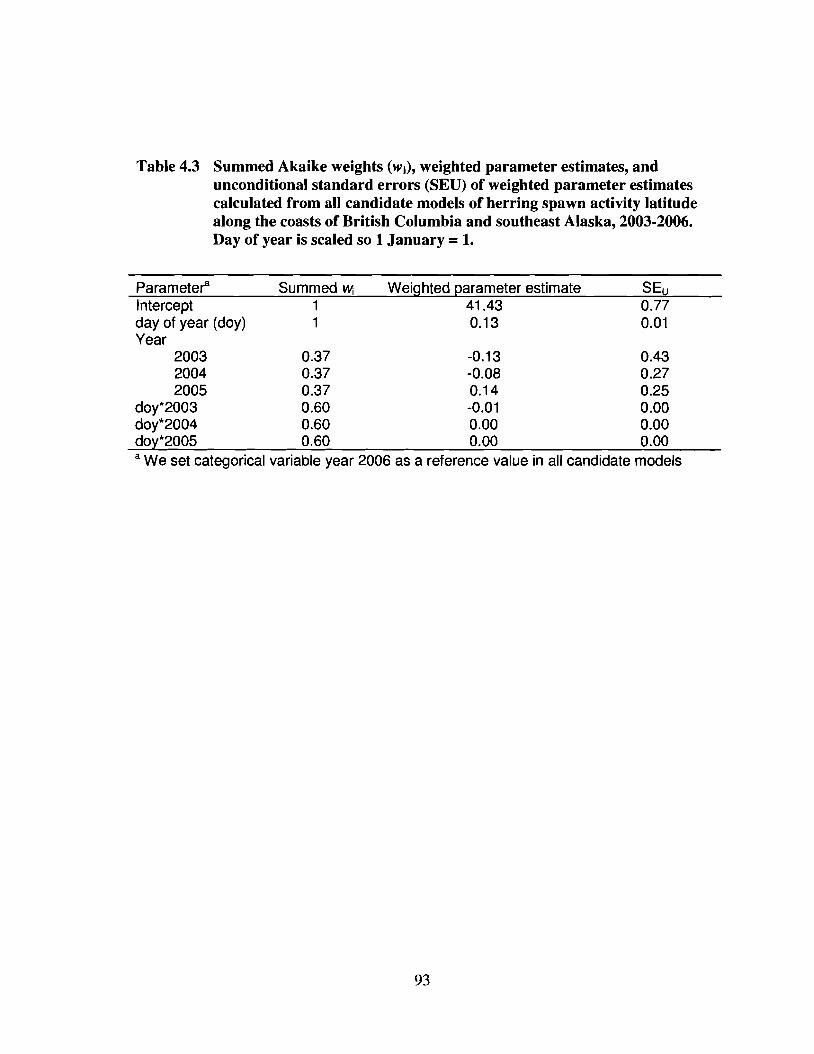
Table 4.3 Summed Akaike weights (Wi), weighted parameter estimates, andunconditional standard errors (SED) of weighted parameter estimatescalculated from all candidate models of herring spawn activity latitudealong the coasts of British Columbia and southeast Alaska, 2003-2006.Day of year is scaled so 1 January =1.
SEu0.770.01
41.430.13
Weighted parameter estimate11
Summed \tVjParamete,-BInterceptday of year (day)Year
2003 0.37 -0.13 0.432004 0.37 -0.08 0.272005 0.37 0.14 0.25
doy*2003 0.60 -0.01 0.00doy*2004 0.60 0.00 0.00doy*2005 0.60 0.00 0.00a We set categorical variable year 2006 as a reference value in all candidate models
93

Tab
le4.
4S
umm
ary
ofsp
awn
site
use
Met
rics
for
surf
scot
ers
obse
rved
duri
ngae
rial
surv
eys
inth
ree
regi
ons
inso
uthe
ast
Ala
ska,
Apr
il-
May
2006
.
Met
ricS
urve
y~ea
__
Pre-
sPC
iwn
surv
eys
Spa
wn
surv
eys 55
.5
15%
0.9
141,
600
90%
0.4
9.5
98%
49%
3% 42.0
Ket
chik
an72
9-
77,8
6024
,530
June
au2,
442
-51
,160
Hai
nes
452
120,
690
Ket
chik
an28
%Ju
neau
30/0
Hai
nes
0%K
etch
ikan
7.3
June
au21
.9H
aine
s52
.9
Mea
ndi
stan
ceto
spaw
nsi
te(k
m)
Fra
ctio
nof
seat
ers
with
in1
kmof
spaw
n(%
)
Num
ber
ofse
ater
sob
serv
ed
94
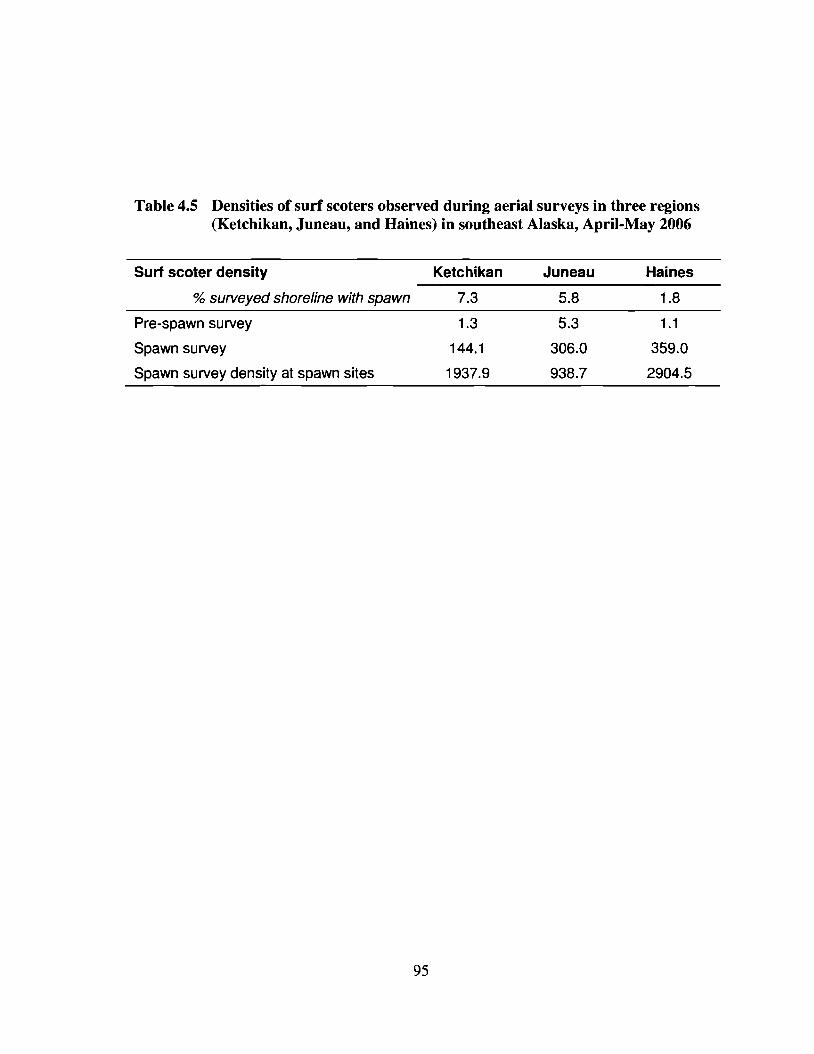
Table 4.5 Densities of surf scoters observed during aerial surveys in three regions(Ketchikan, Juneau, and Haines) in southeast Alaska, April-May 2006
Surf seater density Ketchikan Juneau Haines
% surveyed shoreline with spawn 7.3 5.8 1.8
Pre-spawn survey 1.3 5.3 1.1
Spawn survey 144.1 306.0 359.0
Spawn survey density at spawn sites 1937.9 938.7 2904.5
95
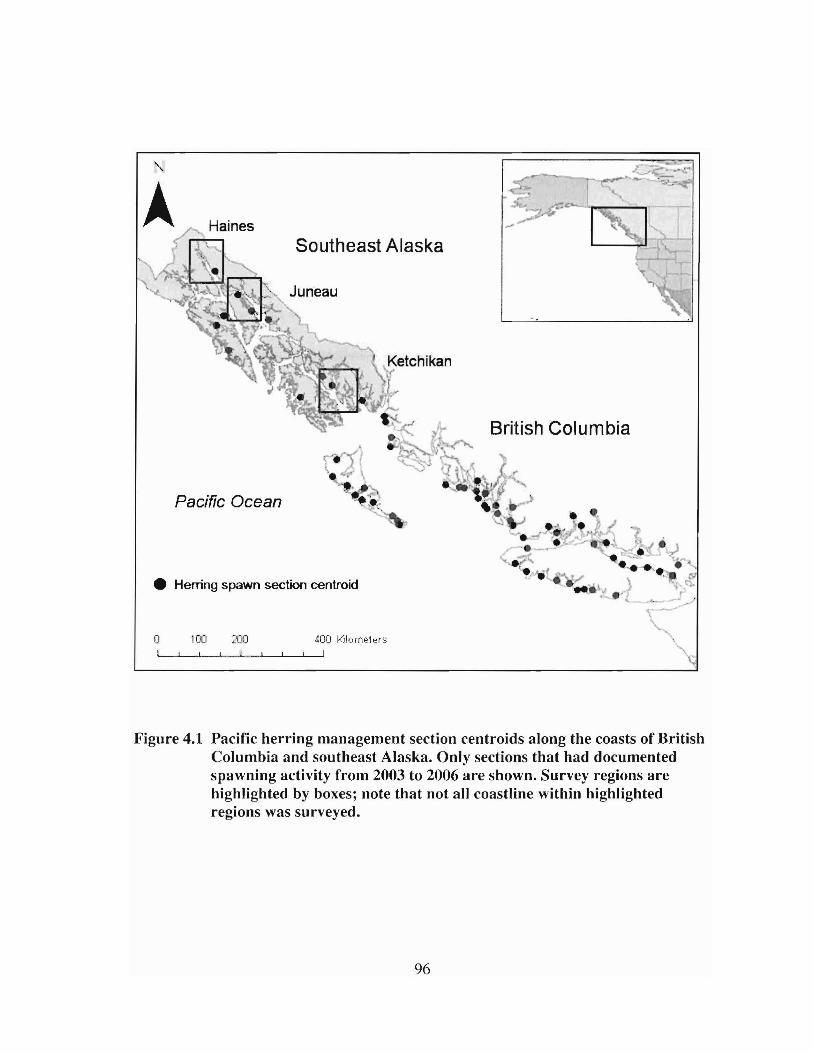
• Herring spawn section centroid
Pacific Ocean
British Columbia
~oo I<ilorn"'lers!
Southeast Alaska
100 :'00o
Figure 4.1 Pacific herring management section centroids along the coasts of BritishColumbia and southeast Alaska. Only sections that had documentedspawning activity from 2003 to 2006 are shown. Survey regions arehighlighted by boxes; note that not all coastline within highlightedregions was surveyed.
96
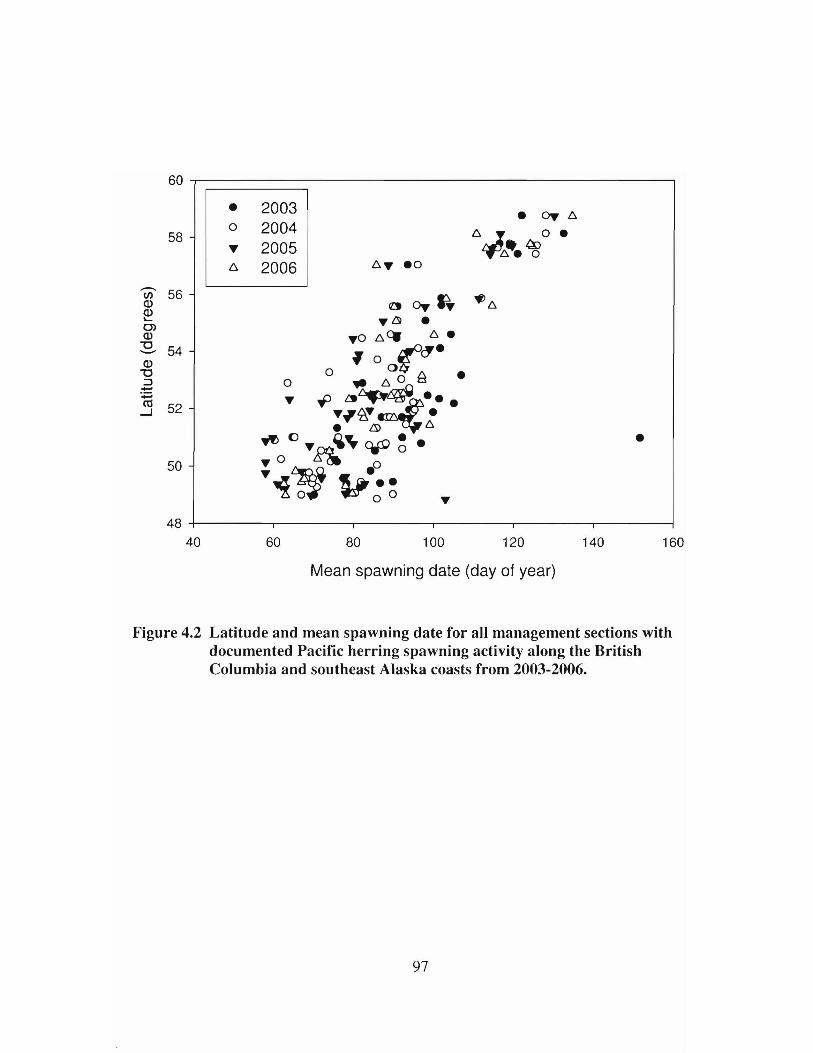
60
• 2003 • ~6.0 2004 6. o •58
~•.~... 20056. 2006 6. ....0
-..56en
ao..,~ ~6.Q)Q)..... ... 61 •CJ)Q) ...0 6.~ 6. •
"'0 54 ~ r~·--Q)o 0 0 A •"'0
:::J 0_ 6. 0- of' ~~•••
.~ ...~ 52.....J ....,Id... •• IS> 6.
~ 0... "~cw:o ~ • •50 ... 0 ~ 0
"'!J •i 0 ";~ ...48
40 60 80 100 120 140 160
Mean spawning date (day of year)
Figure 4.2 Latitude and mean spawning date for all management sections withdocumented Pacific herring spawning activity along the BritishColumbia and southeast Alaska coasts from 2003-2006.
97
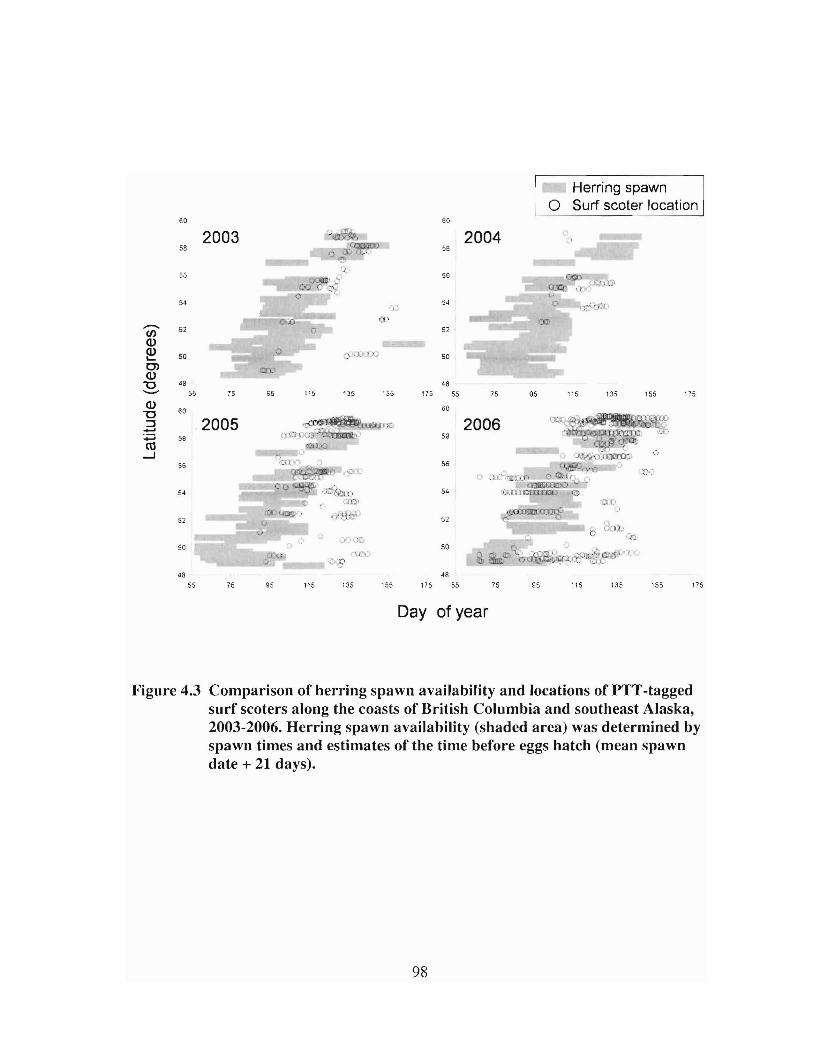
Herring spawn0 Surf scoter location
eo 60
2003 200458 56
S6 56
54 54.,)
f';'p......... 52 52CJ)<l,)<l,)
50 ~)X';,"J.'A.J 50....e><l,)"0 48 48"--" 55 75 95 115 135 155 175 55 75 95 115 135 155 175<l,)
60 60"0:::J 2005 2006.....
:.+:l 58 58
ro,~ ).....I J ~,.~'o::tm:J:l::)
56'1(IL"() 56 ,)
):.'1.. o Q";if \' f"" '-'<>.,
() ~~J·"~D:.r)~
54 54 ~'li):lTQ 01'(.
52 52
'-'.' 1:-50 50
-, il!('t,
\:..2:( J~;~- i' %',"" or,,;' , J.. dim· G '. . t.L
48 48
55 75 95 115 135 155 175 55 75 95 115 135 155 175
Day of year
Figure 4.3 Comparison of herring spawn availability and locations of PTT-taggedsurf scoters along the coasts of British Columbia and southeast Alaska,2003-2006. Herring spawn availability (shaded area) was determined byspawn times and estimates of the time before eggs hatch (mean spawndate + 21 days).
98
CHAPTER 5 GENERAL CONCLUSIONS
5.1 Thesis Summary
Waterfowl acquire energy and nutrient reserves for migration and reproduction at
spring migration stopover areas (Ankney and MacInnes 1978, Krapu 1981, Alisauskas
and Ankney 1992, Gauthier et al. 2003, Reed et al. 2004, Schmutz et al. 2006), and
therefore spring migration habitat conditions can have important implications for
waterfowl productivity. Along the Pacific coast, surf scoters (Melanitta perspicillata) and
white-winged scoters (M. fusca) are known to congregate and forage at Pacific herring
(Clupea pallasi) spawning sites during late winter and early spring (Vermeer 1981,
Vermeer et al. 1997, Sullivan et al. 2002), and it has been speculated that scoters migrate
northward in association with the northward progress of herring spawn (Vermeer 1981,
Savard et al. 1998). In this thesis, I investigated site use of scoters during late winter and
spring migration, with particular emphasis on the use of herring spawn at multiple
geographic scales. First, I documented movement and habitat use of wintering radio
tagged surf scoters and white-winged scoters in relation to herring spawn prior to spring
migration. Second, I identified important stopover and staging sites of migrating surf
scoters, as well as the habitat attributes of these sites. Third, I considered the
spatiotemporal associations of migrating surf scoters with herring spawn availability at
regional and migratory scales. The results and implications of these efforts are described
below.
99
In the Strait of Georgia, British Columbia, herring spawn events in late winter
provide a short-term pulse of abundant and energy-rich food. In Chapter 2, I documented
the movement and site use of wintering surf scoters and white-winged scoters before and
during the period of herring spawn activity. I found that both scoter species exhibited
relatively small movements during winter (interfix distances of 1.2 - 1.8 km, surf scoters
and white-winged scoters respectively), but altered their behaviour markedly when
herring spawn occurred, moving considerably farther with interfix distances of 6.3 km
(white-winged scoters) and 9.9 km (surf scoters). Most (78-91 %) individuals of both
species visited herring spawn sites at least once, and the majority (60-82%) of telemetry
locations were within 2 km of spawn sites during the herring spawn. Surf scoters and
white-winged scoters moved from a wintering area with stable resource availability
(Lewis et al. 2007a) to areas with ephemeral but abundant food resources. I conclude that
scoters altered their movements to take advantage of herring spawn, and the large
proportion of individuals using herring spawn suggests that this resource may be
potentially important for pre-migratory scoters.
Habitat use by surf scoters during spring migration has not been previously
studied in detail. In Chapter 3, I identified important stopover and staging sites used by
surf scoters migrating through southeast Alaska from their wintering areas along the
Pacific Coast. Based on locations of satellite transmitter marked surf scoters, I identified
14 important stopover and staging sites. One site, Lynn Canal, was determined to be an
exceptionally important stopover and staging site for surf scoters from throughout their
Pacific winter range; approximately half of the coastally migrating surf scoters used this
site for stopover or staging. I compared the habitat attributes of stopover and staging sites
100
to randomly selected sites, and found that smaller distances to herring spawn sites and
greater distances to the outer coast were strong predictors of site use, but physical
shoreline habitat characteristics were poor predictors. I conclude that the availability of
herring spawn and the geographical context within southeast Alaska defines selected and
potentially important stopover and staging habitat for spring migrating surf scoters.
Given that herring spawn distribution was a strong predictor of surf scoter
stopover and staging site use, I considered the spatiotemporal associations of migrating
surf scoters with herring spawn availability along the British Columbia and southeast
Alaska coasts (Chapter 4). I evaluated a silver-wave hypothesis, which predicts that surf
scoters follow the availability of herring spawn northward along the coast during spring
migration. I found strong support for the assumption that herring spawn activity initiates
later in the year at higher latitudes, creating a wave of short-term localized food
availability. I also found that surf scoter migration, based on locations of scoters marked
with satellite transmitters, generally coincided with the northward progression of herring
spawn. On a continental scale, the majority of marked scoters visited at least one spawn
site during migration, and those that visited spawn sites were located at spawn sites for
approximately a third of their migration locations. At a regional scale, surf scoters
showed strong spatiotemporal associations with herring spawn sites, confirming that the
presence of herring spawn may be an important factor in determining habitat use during
spring migration. Although the distribution and timing of spawning activity does not
explain all of the variation in continental migration strategies, herring spawn is a
potentially important resource for many migrating surf scoters.
lot
I found that scoters show strong spatiotemporal associations with herring spawn
along the coasts of British Columbia and southeast Alaska throughout the late winter and
spring. Although not all individuals visited spawn sites, the vast majority of individuals
make use of this seasonal resource pulse when it is available, suggesting that it is a
valuable seasonal resource. In considering herring spawn availability as a predictor of
stopover and staging site use, herring spawn appears to be closely associated with site use
during migration, but is not the only factor determining which sites are used. Similarly,
herring spawn availability does not appear to drive surf scoter migration strategies, but
appears to be used considerably when it is available along the migration route.
Collectively, these studies show high use of herring spawn both before and during spring
migration, and suggest that herring spawn is an important resource at a potentially
sensitive time of the annual cycle.
This information contributes to general knowledge about surf scoter spring
migration strategies, and will contribute to ongoing studies of body mass variation in
relation to areas, seasons, and spawn occurrence. Habitat use of late spring-staging and
migrating surf scoters may have important implications for understanding the cross
seasonal effects of habitat conditions and nutrient reserve levels on populations, and may
have habitat management implications. By identifying used and presumably important
spring habitats, this work defines specific sites that deserve conservation consideration,
and provides insights into the underlying mechanisms that make these habitats important.
5.2 Future Directions
The strong associations of surf scoters with herring spawn sites both before and
during migration suggest that herring spawn is likely an important resource for surf
102
scoters. However, use of this resource does not necessarily indicate that it is required.
Therefore, further investigations of the influence of herring spawn on demographic
attributes such as reproductive performance or survival are needed. There is evidence for
body mass optimization in sea ducks prior to migration (Bond and Esler 2006), and surf
scoters show marked increases in body mass both before and during spring migration (E.
Anderson, University of Wyoming, unpublished data). Studies of harlequin ducks
(Histrionicus histrionicus) indicated that nutrients from herring spawn are not allocated
into egg production (Bond et al. 2007), however, the nutrients derived from herring
spawn are most likely used for migration and during other stages of reproduction. Species
that deplete winter foods, such as surf scoters (Lacroix 2001, Kirk et al. 2007) may be
more likely to rely on herring spawn or other alternative prey for building energy reserves
in late winter and early spring (Bond and Esler 2006). The benefits of herring spawn
events may extend beyond nutritional value; scoters in Baynes Sound showed reductions
in foraging time and decreased their dive rate when feeding on herring eggs (Lewis et al.
2007b), allowing for increases in non-foraging behaviours. Even if herring spawn is not
directly responsible for the mass gain or nutrients used in clutch formation, the presence
of an abundant and easily available food may facilitate other important components of the
annual cycle such as courtship, pairing, incubation, and brood-rearing (Rodway et al.
2003).
There is need for further investigation into other factors that influence surf scoter
migration strategies. There are numerous habitat attributes other than herring that may
influence choice of stopover and staging sites that I was unable to address, and
identifying the importance these attributes would provide greater information about
103
habitat use during spring. For example, sea duck distribution in winter is strongly related
to bivalve distribution (Esler et al. 2000, Zydelis and Esler 2005, Zydelis et al. 2006), and
this likely has implications for stopover and staging site use. This may be of particular
importance in an area such as Lynn Canal, which is used heavily by scoters but has
shown marked declines in herring spawn availability (Willson and Womble 2006).
Scoters there are likely consuming mussels, and distribution and quality of mussel beds
make dictate habitat use and condition of scoters in that important staging area. Also,
safety and predator distributions are increasingly recognized as affecting shorebird
migration strategies and this could influence migration strategies in sea ducks.
5.3 Management Implications and Recommendations
I found that surf scoter stopover and staging site use is strongly predicted by
herring spawn availability, but that geographical context is also a strong predictor of
stopover site use. This suggests that the use of spring migration habitats is influenced by
multiple factors. As a result, the management and conservation of spring migration
habitat requires the management of individual identified stopover sites, the aggregate
value of multiple spring migration habitats, and the resources that make these sites
attractive to migrants.
Identifying stopover sites for conservation recognition - I identified 14 important
stopover sites within southeast Alaska, and the majority of marked surf scoters used one
or more of these sites for both short stopovers and staging. This suite of stopover sites
presumably has habitat value beyond the sum of its parts. I recommend that the data that
identify important sites and habitat attributes (Chapter 3) be disseminated to agencies and
organizations that identify, prioritize, and support initiatives that result in the
104
identification of important conservation areas for birds and marine coastal habitat. These
organizations include the U. S. Fish and Wildlife Service, Alaska Department of Fish and
Game (ADFG), U.S. Forest Service, National Park Service, and BirdLife International
and its partner agencies, including Audubon.
In particular, Lynn Canal was identified as a particularly important stopover and
staging area, as it was used by many scoters (>100000 on a single day) from multiple
wintering areas, many for more than 7 days. Lynn Canal is the most northeastern
waterway in southeast Alaska, likely making this site a natural break for scoters to take
advantage of abundant marine resources before turning inland to the boreal forests of
northern Canada to breed. This region may also provide increased access to preferred
routes inland. From a management and conservation perspective, this should make Lynn
Canal a high priority for identification as a site of conservation concern. From survey
estimates, this region may support almost a third of the global population of surf scoters
for several weeks in May (Chapter 4), and fits several of the criteria for a globally
important Important Bird Area under BirdLife International guidelines.
Identifying sites for risk management - Concentrations of birds in a very small
area are at greater risk for catastrophic events such as contaminant spills (Ford et al.
1982). Lynn Canal and surrounding areas are heavily used during spring and summer by
numerous tourism cruise ships, and the high numbers of birds congregated in this small
area during this time period increases the risk of such events. I recommend that stopover
site and survey data that highlights areas and times of higher risk should be distributed to
agencies that manage contaminant spill response to aid in designing response plans in
areas that are potentially critical for surf scoters and other species.
105
Managing important resources - Given the use of herring spawn by scoters, the
management of sea ducks should be closely tied to management of Pacific herring.
Declines and distributional shifts in herring stocks and traditional spawn sites means that
the species that use herring spawn are increasingly restricted to fewer spawn sites (Stick
2005, Willson and Womble 2006). The management and conservation of herring spawn
sites is likely important for not only surf scoters, but also the numerous other species of
birds and mammals that use these sites (Haegele 1993, Sullivan et al. 2002, Willson and
Womble 2006). I recommend communication and data sharing with fisheries agencies
create management plans and objectives that include sea ducks as important consumers of
herring spawn.
106
5.4 References
Alisauskas, R. T., and C. D. Ankney. 1992. The cost of egg laying and its relationship tonutrient reserves in waterfowl. Pages 30-61 in B. D. J. Batt, A. D. Afton, M. G.Anderson, C. D. Ankney, D. H. Johnson, J. A. Kadlec, and G. L. Krapu, editors.Ecology and management of breeding waterfowl. University of Minnesota PressMinneapolis Minnesota & London England.
Ankney, C. D., and C. D. MacInnes. 1978. Nutrient reserves and reproductiveperformance of female lesser snow geese. Auk 95:459-471.
Bond, J. c., and D. Esler. 2006. Nutrient acquisition by female harlequin ducks prior tospring migration and reproduction: evidence for body mass optimization.Canadian Journal of Zoology 84: 1223-1229.
Bond, J. c., D. Esler, and K. A. Hobson. 2007. Isotopic evidence for sources of nutrientsallocated to clutch formation by harlequin ducks. Condor 109:698-704.
Esler, D., T. D. Bowman, T. A. Dean, C. E. O'Clair, S. C. Jewett, and L. L. McDonald.2000. Correlates of harlequin duck densities during winter in Prince WilliamSound, Alaska. Condor 102:920-926.
Ford, R. G., J. A. Weins, D. Heinemann, and G. L. Hunt. 1982. Modelling the sensitivityof colonially breeding marine birds to oil spills: guillemot and kittiwakepopulations on the PribilofIslands, Bering Sea. Journal of Applied Ecology 19:131.
Gauthier, G., J. Bety, and K. A. Hobson. 2003. Are greater snow geese capital breeders?New evidence from a stable-isotope model. Ecology 84:3250-3264.
Haegele, C. W. 1993. Seabird predation of Pacific herring, Clupea pallasi, spawn inBritish Columbia. Canadian Field-Naturalist 107:73-82.
Kirk, M., D. Esler, and W. S. Boyd. 2007. Morphology and density of mussels on naturaland aquaculture structure habitats: implications for sea duck predators. MarineEcology Progress Series 346: 179-187.
Krapu, G. L. 1981. The role of nutrient reserves in mallard reproduction. Auk 98:29-38.
Lacroix, D. L. 2001. Foraging impacts and patterns of wintering surf scoters feeding onbay mussels in coastal Strait of Georgia, British Columbia. MSc Thesis, SimonFraser University, Burnaby, British Columbia.
107
Lewis, T. L., D. Esler, and W. S. Boyd. 2007a. Effects of predation by sea ducks on clamabundance in soft-bottom intertidal habitats. Marine Ecology-Progress Series329: 131-144.
Lewis, T. L., D. Esler, and W. S. Boyd. 2oo7b. Foraging behaviors of surf scoters andwhite-winged scoters during spawning of Pacific herring. Condor 109:216-222.
Reed, E. T., G. Gauthier, and J. F. Giroux. 2004. Effects of spring conditions on breedingpropensity of greater snow goose females. Animal Biodiversity and Conservation27:35-46.
Rodway, M. S., H. M. Regehr, J. Ashley, P. V. Clarkson, R 1. Goudie, D. E. Hay, C. M.Smith, and K. G. Wright. 2003. Aggregative response of harlequin ducks toherring spawning in the Strait of Georgia, British Columbia. Canadian Journal ofZoology 81:504-514.
Savard, J.-P. L., D. Bordage, and A. Reed. 1998. Surf scoter (Melanitta perspicillata).Birds of North America 363:1-27.
Schmutz, J. A., K. A. Hobson, and J. A. Morse. 2006. An isotopic assessment of proteinfrom diet and endogenous stores: effects on egg production and incubationbehaviour of geese. Ardea 94:385-397.
Stick, K. C. 2005. Washington State Herring Stock Status Report. WashingtonDepartment of Fish and Wildlife. Fish Management Program. May 2005
Sullivan, T. M., R W. Butler, and W. S. Boyd. 2002. Seasonal distribution of waterbirdsin relation to spawning Pacific herring, Clupea pallasi, in the Strait of Georgia,British Columbia. Canadian Field-Naturalist 116:366-370.
Vermeer, K. 1981. Food and populations of surf scoters in British Columbia. Wildfowl32:107-116.
Vermeer, K., M. Bentley, K. H. Morgan, and G. E. J. Smith. 1997. Association of feedingflocks of brant and sea ducks with herring spawn at Skidegate Inlet. CanadianWildlife Service Occasional Paper 93: 102-107.
Willson, M. E, and J. N. Womble. 2006. Vertebrate exploitation of pulsed marine prey: areview and the example of spawning herring. Reviews in Fish Biology andFisheries 16: 183-200.
Zydelis, R, and D. Esler. 2005. Response of wintering Steller's eiders to herring spawn.Waterbirds 28:344-350.
108

Zydelis, R., D. Esler, W. S. Boyd, D. L. LaCroix, and M. Kirk. 2006. Habitat use bywintering surf and white-winged scoters: Effects of environmental attributes andshellfish aquaculture. Journal of Wildlife Management 70: 1754-1762.
109