Embed Size (px)
Citation preview
SMARTER BALANCED TECHNICAL REPORT
1
Chapter 4 Test Design ................................................................................................................................. 2
Figure 1. Relationships among Smarter Balanced Content ................................................. 2
A Brief Description of Smarter Balanced Content Structure ................................................................. 2
Table 1. Major Domains Identified for ELA and Mathematics. ................................................. 3
Synopsis of Assessment System Components ...................................................................................... 3
Evidence-Centered Design in Constructing Smarter Balanced Assessments ...................................... 4
Content Alignment in Smarter Balanced Test Design............................................................................ 5
Test Blueprints ......................................................................................................................................... 6
Summative Assessment .......................................................................................................................... 7
Figure 2. Blueprint for grade 6 showing detailed content structure (Assessment Targets),
page 1 of 2 ............................................................................................................................... 9
Figure 3. Blueprint for grade 6 showing detailed content structure (Assessment Targets),
page 2 of 2 ............................................................................................................................ 10
CAT and Performance Task Test Components .................................................................................... 11
Operational Adaptive Test Design ........................................................................................................ 11
Expansion of the Item Pool ................................................................................................................... 12
Performance Task Design .................................................................................................................... 13
Test Scoring ........................................................................................................................................... 14
Field Test Delivery Modes ..................................................................................................................... 15
Measurement Models (IRT) Adopted ................................................................................................... 15
Interim Assessment .............................................................................................................................. 16
ELA/Literacy ICA Blueprints .................................................................................................................. 17
Mathematics ICA Blueprints ................................................................................................................. 17
Table 2. Summary of Interim Test Features for ICAs and IABs. ............................................. 19
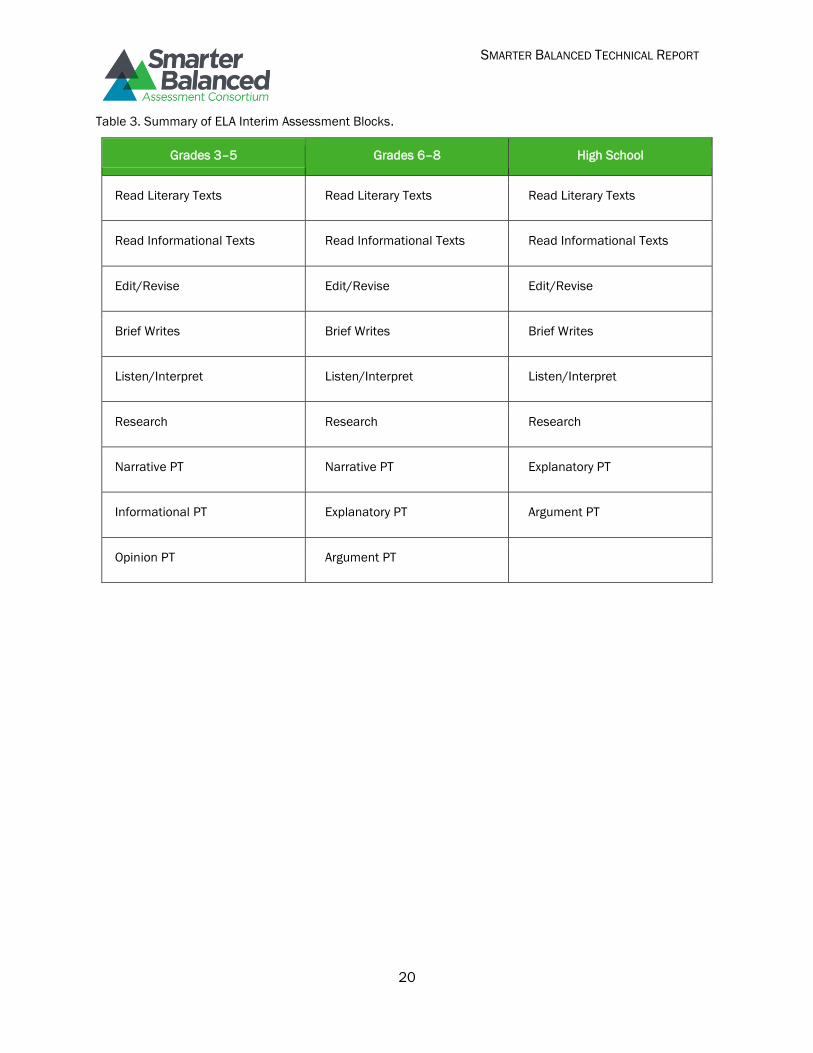
Table 3. Summary of ELA Interim Assessment Blocks. .......................................................... 20
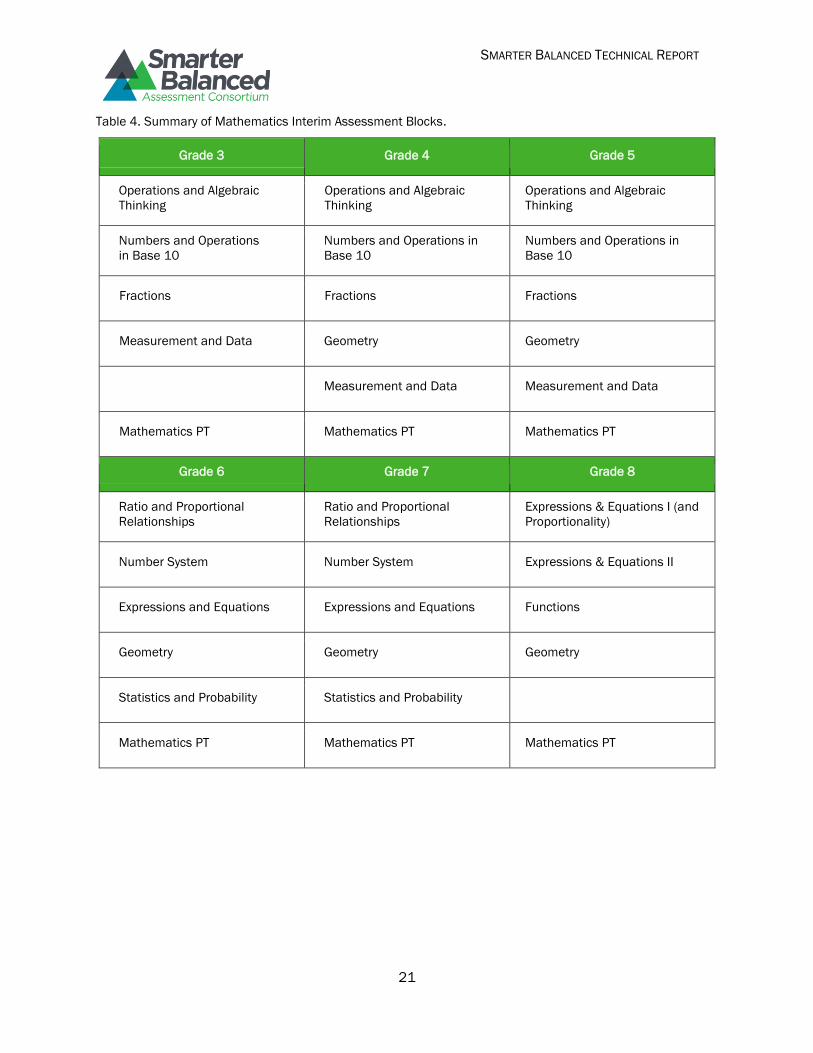
Table 4. Summary of Mathematics Interim Assessment Blocks. .......................................... 21
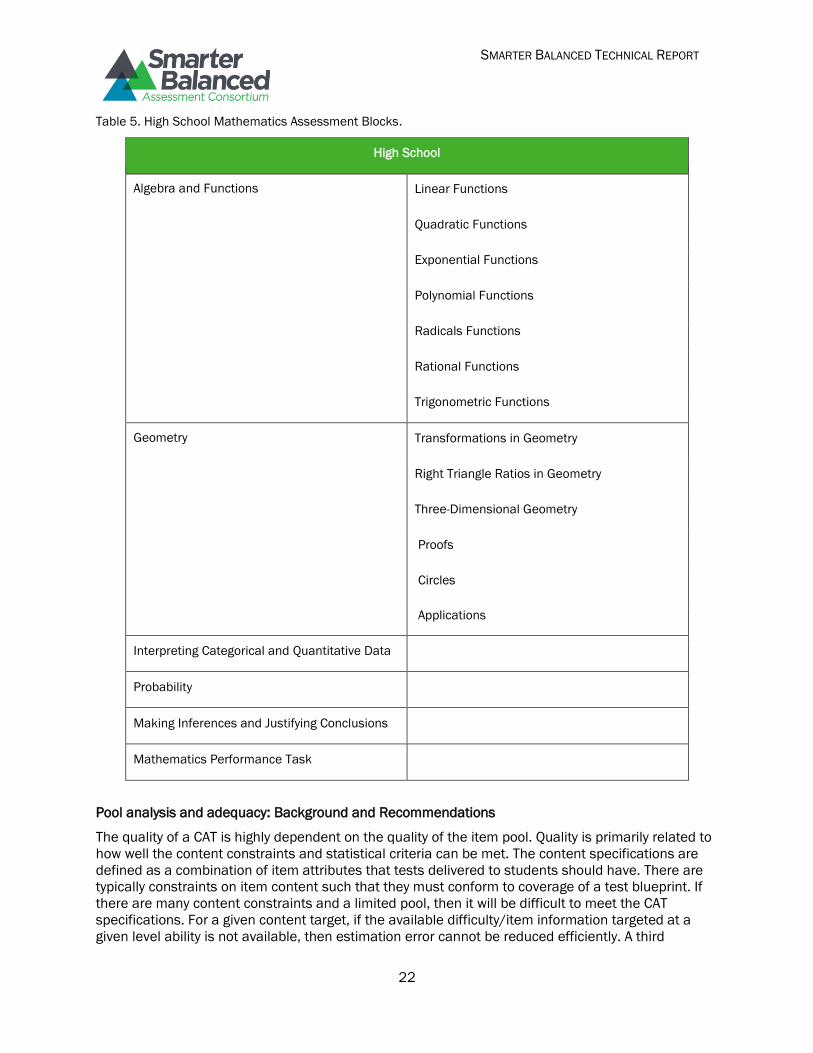
Table 5. High School Mathematics Assessment Blocks. ........................................................ 22
Pool analysis and adequacy: Background and Recommendations ................................................... 22
Simulations Studies for 2014-15 operational summative tests........................................................ 25
Test Design Specifications and Outcomes .......................................................................................... 26
References ............................................................................................................................................ 31
SMARTER BALANCED TECHNICAL REPORT
2
Chapter 4 Test Design
Test design entails developing a test philosophy (i.e., Theory of Action), identifying test purposes, and
determining the targeted examinee populations, test specifications, item pool design, and other
features such as test delivery (Schmeiser & Welch, 2006). The Smarter Balanced Theory of Action,
test purposes, and the targeted examinee population were outlined in Chapter 1 (Introduction). Other
elements of test design are further emphasized here, such as the interim assessments. In
developing a system of assessments, the goal of Smarter Balanced was to ensure that its
measurement properties reflected the expectations of content, rigor, and performance that comprise
the Common Core State Standards (CCSS). The primary mechanism for this was to ensure the
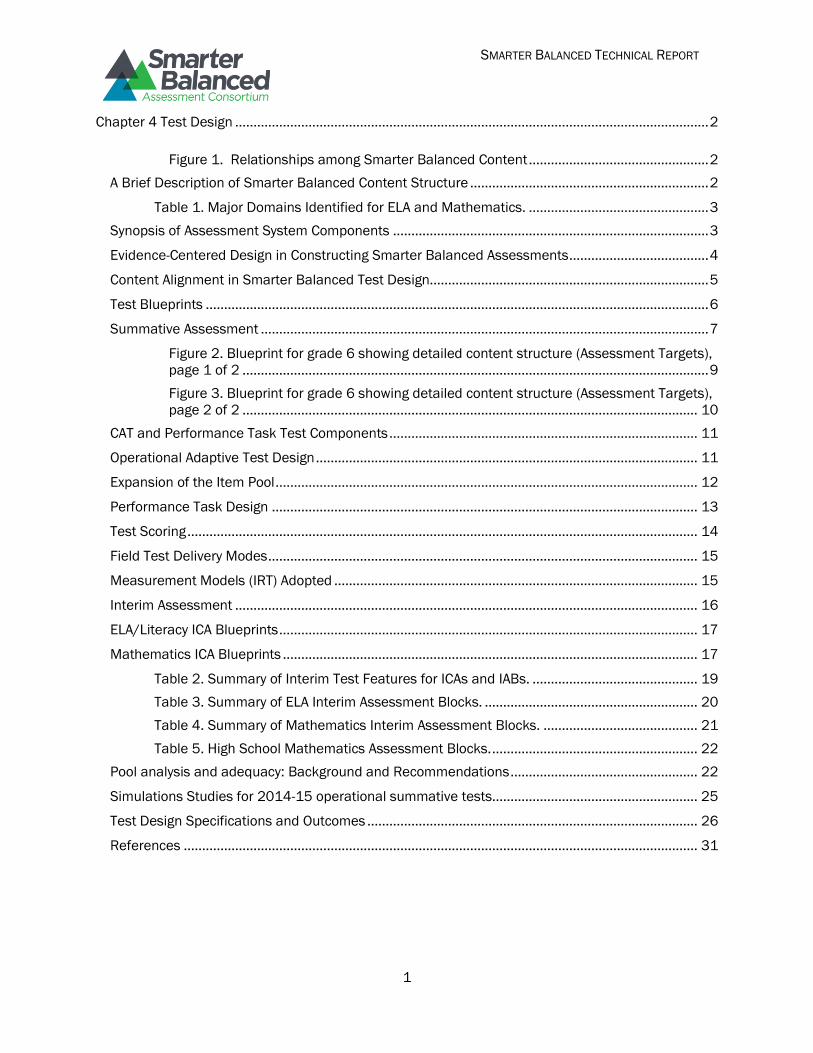
alignment of the Smarter Balanced assessments with the CCSS. Figure 1 briefly encapsulates the
Smarter Balanced content structure.
Common Core of State Standards
↓
Smarter Balanced Content Specifications
Smarter Balanced Specifications for Item/Tasks
↓ ↓
Test Specifications & Blueprints Items & Tasks
↓
Smarter Balanced Assessments
Computer Adaptive Testing Performance Tasks
Figure 1. Relationships among Smarter Balanced Content
A Brief Description of Smarter Balanced Content Structure
The Common Core State Standards are the content standards in English language arts/literacy (ELA)
and mathematics that many states have adopted. Since the Common Core State Standards were not
specifically developed for assessment, they contain extensive rationale and information concerning
instruction. Therefore, adopting previous practices used by many state programs, Smarter Balanced
content experts produced Content Specifications in ELA and mathematics distilling assessment-
focused elements from the Common Core State Standards. The content specifications were
expressly created to guide the structure and content of assessment development. Within each of the
two subject areas in grades 3 to 8 and high school, there are four broad claims. Within each claim,
there are several assessment targets. The claims in ELA and mathematics are given in Table 1.
SMARTER BALANCED TECHNICAL REPORT
3
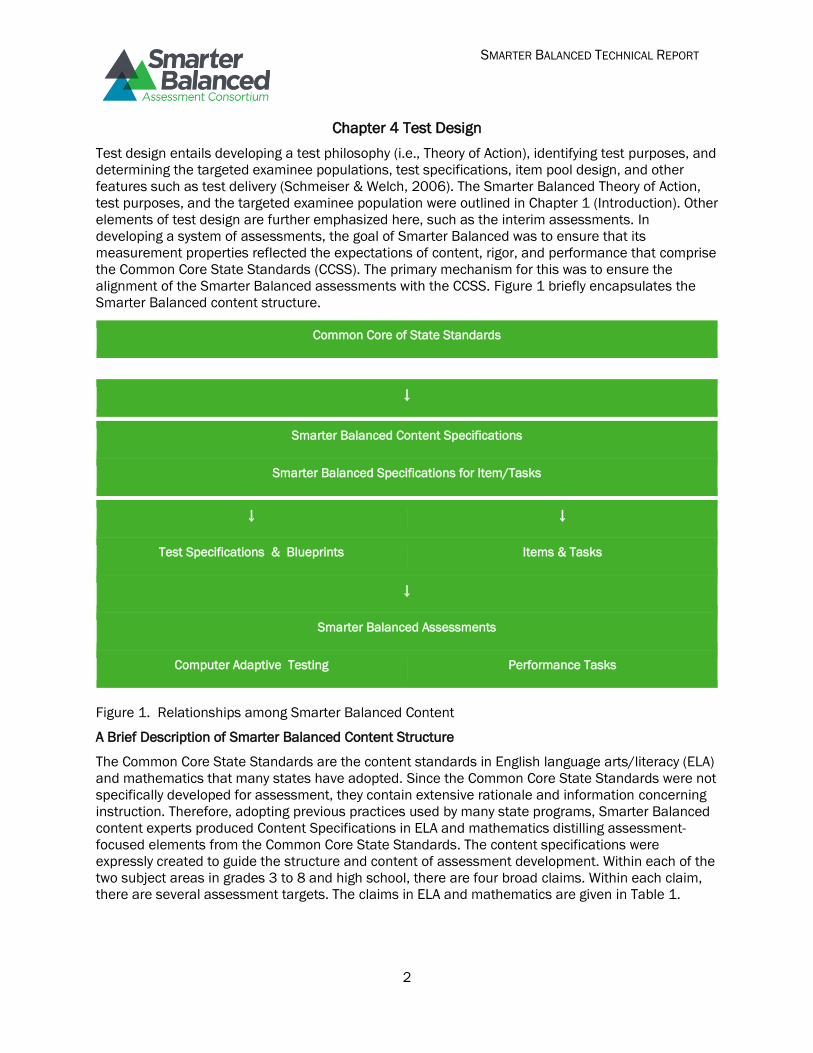
Table 1. Major Domains Identified for ELA and Mathematics.
Claim ELA Mathematics
1 Reading Concepts and Procedures
2 Writing Problem Solving
3 Speaking/Listening Communicating/Reasoning
4 Research Model and Data Analysis
Currently only the listening part of ELA Claim 3 is assessed. In mathematics, Claims 2 and 4 are
reported together, so there are only three reporting categories, but four claims.
Because of the breadth in coverage of the individual claims, the targets within them are needed to
define more specific performance expectations within claim statements. The relationship between
targets and Common Core State Standards elements is made explicit in the Smarter Balanced
content specifications. The Smarter Balanced specifications for items and tasks correspond to
targets in the Smarter Balanced content requirements. For every target, a table was produced
describing the evidence to be gathered to address the target and several models for items to be
developed to measure student performance relative to the target. The item/task specifications and
sample items developed from them are intended to guide item and task developers in the future.
The item/task types include (but are not limited to) selected-response, constructed-response,
technology-enhanced items that capitalize on digital media, and performance tasks. Technology-
enhanced items have the same requirements as selected- and constructed-response items, but have
specialized types of interaction in which students manipulate information using a defined set of
responses. Constructed-response items are intended to address assessment targets and claims that
are of greater complexity and require more analytical thinking and reasoning. Most constructed-
response items should take between 1 and 5 minutes to complete; some more complex types may
take up to 10 minutes for completion. The distinction between constructed-response items given in
the computer adaptive test (CAT) and performance tasks is primarily the context in which the items
are given. Performance tasks are thematically related that are preceded by an associated classroom
activity. The classroom activities are not scored. Smarter Balanced test blueprints/specifications
describe the composition of the two assessment components (computer adaptive test and
performance assessment) and how their results will be combined for score reporting. For the
computer adaptive component, specific items administered to each student are uniquely determined
based on an item-selection algorithm and content constraints embedded in the test blueprint. The
performance tasks (PTs) act in concert with the computer adaptive test items to fulfill the blueprint.
Synopsis of Assessment System Components
The summative assessment consists of two parts: a CAT and a performance task, which is
administered on a computer but is not computer adaptive. The summative assessment is
administered during the last twelve weeks of the school year. The summative assessment scores will
accurately describe student achievement and can be used in modeling growth of student
learning as part of program evaluation and school, district, and state accountability systems;
provide valid, reliable, and fair measures of students’ progress toward, and attainment of,
the knowledge and skills required to be college- and career-ready;
SMARTER BALANCED TECHNICAL REPORT
4
capitalize on the strengths of computer adaptive testing—efficient and precise measurement
across the full range of student achievement; and
utilize performance tasks to provide a measure of the student’s ability to integrate
knowledge and skills across multiple standards.
Optional interim assessments are administered at locally determined intervals in the school
calendar. These assessments provide educators with actionable information about student progress
throughout the year. Interim Comprehensive Assessments (ICAs) use the same design as the
summative assessments. They are designed to include both computer-adaptive and performance
tasks to fulfill the test blueprint. The interim system also includes Interim Assessments Blocks (IABs),
available in both fixed/linear and adaptive formats. Interim Assessments Blocks focus on more
granular aspects of the content standards. In the 2014-15 school year, IABs and ICAs will be
available in fixed forms only. The interim assessments will
assist teachers, students, and parents in understanding the extent to which students are on
track toward the goal of college and career readiness and identify strengths and limitations
in content domains; and
be fully accessible for instruction and professional development (non-secure).
Formative assessment practices and strategies are the basis for the Digital Library of professional
development materials, resources, and tools aligned to the Common Core State Standards and
Smarter Balanced Claims and Assessment Targets. Research-based instructional tools are available
to help teachers address learning challenges and differentiate instruction. The Digital Library
includes professional development materials related to all components of the assessment system,
such as scoring rubrics for performance tasks.
Evidence-Centered Design in Constructing Smarter Balanced Assessments
Evidence-centered design (ECD) is an approach to the creation of educational assessments in terms
of reasoning about evidence (arguments) concerning the intended constructs. The ECD begins with
identifying the claims, or inferences, that users want to make concerning student achievement to
specifying the evidence needed to support those claims, and finally, determining a specification of
the items/tasks capable of eliciting that information (Mislevy, Steinberg, & Almond, 2003). Explicit
attention is paid to the potential influence of unintended constructs. ECD accomplishes this in two
ways. The first is by incorporating an overarching conception of assessment as an argument from
imperfect evidence. This argument makes explicit the claims (the inferences that one intends to
make based on scores) and the nature of the evidence that supports those claims (Hansen &
Mislevy, 2008; Mislevy & Haertel, 2006). The second is by distinguishing the activities and structures
involved in the assessment enterprise in order to exemplify an assessment argument in operational
processes. By making the underlying evidentiary argument more explicit, the framework makes
operational elements more amenable to examination, sharing, and refinement. Making the argument
more explicit also helps designers meet diverse assessment needs caused by changing
technological, social, and legal environments (Hansen & Mislevy, 2008; Zhang, Haertel, Javitz,
Mislevy, Murray, & Wasson, 2009). The ECD process entails five types of activities. The layers focus
in turn on the identification of the substantive domain to be assessed; the assessment argument;
the structure of assessment elements such as tasks, rubrics, and psychometric models; the
implementation of these elements; and the way they function in an operational assessment, as
described below. For Smarter Balanced, a subset of the general ECD elements was used.
Domain Analysis. In this first layer, domain analysis involves determining the specific content
to be included in the assessment. Smarter Balanced uses the Common Core State Standards
as its content domain for mathematics and ELA. Domain analysis was conducted by the
SMARTER BALANCED TECHNICAL REPORT
5
developers of the Common Core State Standards, who first developed college- and career-
readiness standards, to address what students are expected to know and understand by the
time they graduate from high school, followed by development of K-12 standards, which
address expectations for students in elementary through high school.
Domain Modeling. In domain modeling, a high-level description of the overall components of
the assessment is created and documented. For Smarter Balanced, the general components
of the assessment system were articulated in the proposal to the Race to the Top
Assessment Program. At a high level, the components include computer-adaptive summative
and interim assessments in mathematics and ELA/literacy. The domain framework was
developed by organizing the Common Core State Standards into domain areas that form the
structure of test blueprints and reporting categories. This overall structure was created in the
course of Smarter Balanced content specification development.
The Conceptual Assessment Framework. Next, the conceptual assessment framework is
developed. For Smarter tests, this step was accomplished in developing the Smarter
Balanced content specifications, which identify major claim structure, targets within claims,
and the relationship of those elements to underlying content of the Common Core State
Standards. In this step, the knowledge, skills, and abilities to be assessed (otherwise
referred to as the intended constructs or the targets of assessment), the evidence that needs
to be collected, and the features of the tasks that will elicit the evidence are specified in
detail. Ancillary constructs that may be required to respond correctly to an assessment task
but are not the intended target of the assessment are also specified (e.g., reading skills in a
mathematics examination). By identifying any ancillary knowledge, skills, and abilities (KSAs),
construct-irrelevant variance can be identified a priori and minimized during item and task
development—potential barriers created by the ancillary KSAs can be removed or their
effects minimized through the provision of appropriate access features. For Smarter
Balanced, the constructs that are the target of assessment defined in blueprints were based
on the content specifications. The evidence required to support claims about the Assessment
Targets is also defined in the item specification tables. Ancillary constructs are elaborated on
in the item specification tables. Details of these processes are described in Chapter 3 on
item development.
Implementation. This layer involves the development of the assessment items or tasks using
the specifications created in the conceptual assessment framework just described. In
addition, scoring rubrics are created and the scoring process is specified. For Smarter
Balanced, items, performance tasks, and associated scoring rubrics were developed starting
in the spring of 2012. This is also described in Chapter 3, Item Development.
Delivery. In this final layer, the processes for the assessment administration and reporting
are created. The delivery system describes the collection of student, evidence, task,
assembly, and presentation models required for the assessment and how they function
together. The ECD elements chosen lead to the best evaluation of the construct for the
intended test purposes. Test delivery and some elements of scoring are discussed below.
Content Alignment in Smarter Balanced Test Design
In developing a system of assessments, Smarter Balanced is committed to ensuring that its
measurement reflects the expectations of content, rigor, and performance that correspond to the
Common Core State Standards. To that end, Smarter Balanced designed item specifications to
demonstrate alignment through methodologies that reflect ECD theory. According to Webb (2002),
“Alignment of expectations for student learning and assessments for measuring students’
attainment of these expectations is an essential attribute for an effective standards-based education
SMARTER BALANCED TECHNICAL REPORT
6
system.” DeMauro (2004) states, “Alignment activities . . . should be the guiding principle of test
design, and item alignment studies should be sources of validity documentation, as should any
studies of test content.” Test content alignment is at the core of content validity and consequential
validity (Martone & Sireci, 2009). There is a connection between validity and content alignment, with
validity addressing the appropriateness of inferences drawn from test results and alignment
concerning “how well all policy elements [e.g., expectations and assessments] guide instruction and,
ultimately, impact student learning” (Webb, 1997).The Elementary and Secondary Education Act
(ESEA) now requires that state accountability assessments be aligned with state content standards.
Since Consortium states have adopted the Common Core State Standards in ELA and mathematics,
it was imperative that Smarter Balanced conduct the appropriate alignment studies. Accordingly, the
Consortium contracted with the Human Resources Research Organization to conduct an alignment
study (HumRRO, 2014).
Webb (1997) identified several categories of criteria for judging content alignment. The Smarter
Balanced alignment study describes how well the Smarter Balanced tests address the expectations
embodied in the Smarter Balanced content specifications and the CCSS. Test content alignment is at
the core of content validity and consequential validity (Martone and Sireci, 2009). Because of the
high stakes associated with statewide testing and the need to communicate learning goals during
the NCLB era, attention was directed at test alignment in addition to individual item alignment. The
emphasis on test content in alignment and validity studies is understandable. After all, a test is a
small sampling of items from a much larger universe of possible items/tasks representing a very
broad domain. For inferences from test results to be justifiable, that sample of items has to be an
adequate representation of the broad domain, providing strong evidence to support claims based on
the test results.
Assessment is always constrained to some extent by time and resources. Items and tasks that
require extensive time (performance tasks and text responses), items that require expensive scoring,
and items that require a lot of computer bandwidth (videos, animations) must be limited and chosen
carefully. Smarter Balanced content experts carefully scrutinized each blueprint to assure optimal
content coverage and prudent use of time and resources. In general, the Smarter Balanced
blueprints represent content sampling proportions that reflect intended emphasis in instruction and
mastery at each grade level. Specifications for numbers of items by claim, Assessment Target, depth-
of-knowledge, and item type demonstrate the desired proportions within test delivery constraints.
The blueprints were subject to state approval through a formal vote.
The alignment study conducted for the Consortium (HumRRO) discusses alignment among elements
of content standards, content specifications, item specifications, and blueprints. The study itself
extensive, but its overall finding is that Smarter summative tests and supporting item pools exceed
levels of DOK representation recommended by Webb. The analysis is done with test blueprint, item
and test specifications and item pools. The operational test had not yet been delivered at the time
the analysis was completed, so further analysis will be conducted with operationally delivered test
forms.
Test Blueprints
Test specifications and blueprints define the knowledge, skills, and abilities intended to be
measured on an assessment. A blueprint also specifies how skills are sampled from a set of content
standards (i.e., the CCSS). Other important factors such as Depth of Knowledge (DOK) are also
specified. Specifically, a test blueprint is a formal document that guides the development and
assembly of an assessment by explicating the following types of essential information:
SMARTER BALANCED TECHNICAL REPORT
7
content (Claims and Assessment Targets) that is included for each assessed subject and
grade, across various levels of the system (student, classroom, school, district, state);
the relative emphasis or weighting of different content strata (e.g., claims) if there is any
weighting beyond the proportions of items and points;
the relative emphasis of content standards generally indicated as the number of items or
percentage of points per Claim and Assessment Target;
item types used or required, which communicate to item developers how to measure each
Claim and Assessment Target, and to teachers and students about learning expectations;
and
Depth of Knowledge (DOK), indicating the complexity of item types for each Claim and
Assessment Target.
The test blueprint is an essential guide for both assessment developers and for curriculum and
instruction. For assessment developers, the blueprint and related test-specification documents
define how the test will ensure coverage of the full breadth and depth of content and how it will
maintain fidelity to the intent of the Common Core State Standards on which the Smarter Balanced
assessment is based. Full content alignment is necessary in order to ensure that educational
Stakeholders can make valid, reliable, and unbiased inferences concerning students, classrooms,
schools, and state levels. At the instructional level, the test blueprint provides a guide to the relative
importance of competing content demands and suggests how the content is demonstrated, as
indicated by item type and depth-of-knowledge. In summary, an assessment blueprint provides clear
development specifications for test developers and signals to the broader education community both
the full complexity of the Common Core State Standards and how performance on these standards
are substantiated.
Part of the innovative aspect of the Smarter Balanced assessments is that the test blueprints
sample the content domain using both a computer adaptive component (CAT) and a performance
task. The test blueprints can be inspected to determine the contribution of the CAT and performance
task components in a grade and content area toward the construct intended to be measured.
Another aspect of the assessments is the provision of a variety of both machine-scored and human-
scored item types. The contribution of these item types is specified in the Smarter Balanced test
blueprints.
The Governing States of the Smarter Balanced Assessment Consortium adopted blueprints for the
summative assessments of mathematics and ELA/literacy for grades 3 to 8 and high school. Final
blueprints for the Smarter Balanced summative assessments will be adopted by Governing States
prior to full implementation in the 2014-15 school year. In part, two objectives for the Pilot and Field
Tests were to try provisional item types and perform scaling with a representative student sample.
Blueprints used for the Field Test were “preliminary” since they used assessment design features
that could be refined and revised after Field Test analysis.
Summative Assessment
The summative assessment is composed of the CAT and performance task components, which are
described in further detail here. Performance information from both components are combined to
sample the test blueprint in a grade and content area and eventually used to produce the overall
scale score.
Operational Summative Assessment Blueprints and Specifications. For each designated grade range
(3 to 5, 6 to 8, and high school), the blueprint overviews summarize the claim score\reporting
category, content category, stimuli used, items by CAT or performance tasks, and total number of
SMARTER BALANCED TECHNICAL REPORT
8
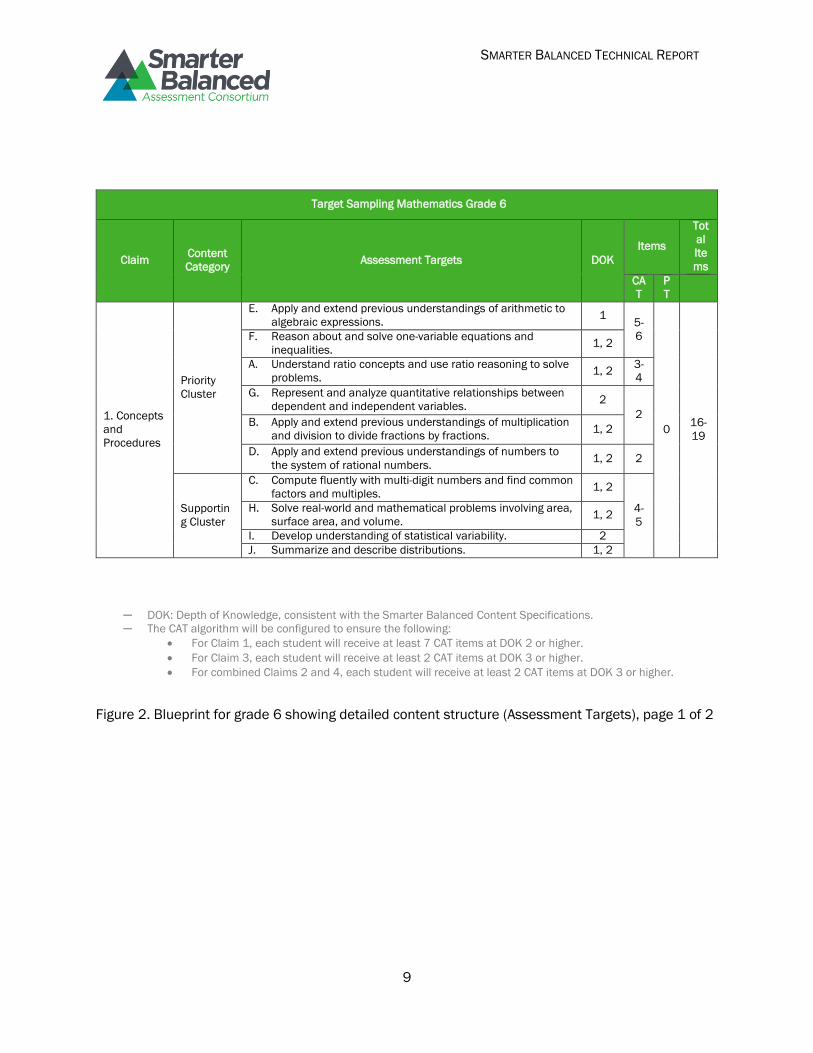
items by claim. Details are given separately for each grade and include Claim, Assessment Target,
DOK, item type (CAT/PT), and the total number of items. The Assessment Targets are nested within
claims and represent a more detailed specification of content. Note that in addition to the nested
hierarchical structure, each blueprint also specifies a number of rules applied at global or claim
levels. Most of these specifications are in the footnotes, which constitute important parts of the test
designs.
The CAT algorithm selects items necessary to conform to the test blueprint and at the same time
meet the IRT target information function. In establishing target requirements for the CAT, designers
took advantage of the adaptive pool to allow more variety than would be present in a fixed form test.
For example, when the number of targets in a domain area is large, blueprints allow choice within
target clusters rather than limiting the number of targets. Since all targets are represented in the
pool, any student could potentially get any target while the full set of content constraints is still
maintained.
To assist in blueprint interpretation, an overview of the grade 6 mathematics test blueprint is given.
Figure 2, for grade six mathematics, presents requirements for each Claim by Assessment Target. It
displays the number of items overall by claim and shows the contribution of the CAT and
performance task portions to the overall design. Note that some Targets are clustered together. For
example, Claim 1 calls for 14 items from targets E, F, A, G, B, and D. Note that six items come from
targets E and F, while only two items come from G and B. This represents the appropriate content
emphasis, while allowing flexibility in item choice. The detailed blueprint shows how performance
tasks and CAT components work in conjunction. Here, the DOK requirements are applied at the
claim level, although DOK ranges are listed for each target. Performance tasks are delivered as a
fixed set of items within a set of performance tasks common to a class or school.
SMARTER BALANCED TECHNICAL REPORT
9
Target Sampling Mathematics Grade 6
Claim Content
Category Assessment Targets DOK
Items
Tot
al
Ite
ms
CA
T
P
T
1. Concepts
and
Procedures
Priority
Cluster
E. Apply and extend previous understandings of arithmetic to
algebraic expressions. 1
5-
6
0 16-
19
F. Reason about and solve one-variable equations and
inequalities. 1, 2
A. Understand ratio concepts and use ratio reasoning to solve
problems. 1, 2
3-
4
G. Represent and analyze quantitative relationships between
dependent and independent variables. 2
2 B. Apply and extend previous understandings of multiplication
and division to divide fractions by fractions. 1, 2
D. Apply and extend previous understandings of numbers to
the system of rational numbers. 1, 2 2
Supportin
g Cluster
C. Compute fluently with multi-digit numbers and find common
factors and multiples. 1, 2
4-
5
H. Solve real-world and mathematical problems involving area,
surface area, and volume. 1, 2
I. Develop understanding of statistical variability. 2
J. Summarize and describe distributions. 1, 2
─ DOK: Depth of Knowledge, consistent with the Smarter Balanced Content Specifications.
─ The CAT algorithm will be configured to ensure the following:
For Claim 1, each student will receive at least 7 CAT items at DOK 2 or higher.
For Claim 3, each student will receive at least 2 CAT items at DOK 3 or higher.
For combined Claims 2 and 4, each student will receive at least 2 CAT items at DOK 3 or higher.
Figure 2. Blueprint for grade 6 showing detailed content structure (Assessment Targets), page 1 of 2
SMARTER BALANCED TECHNICAL REPORT
10
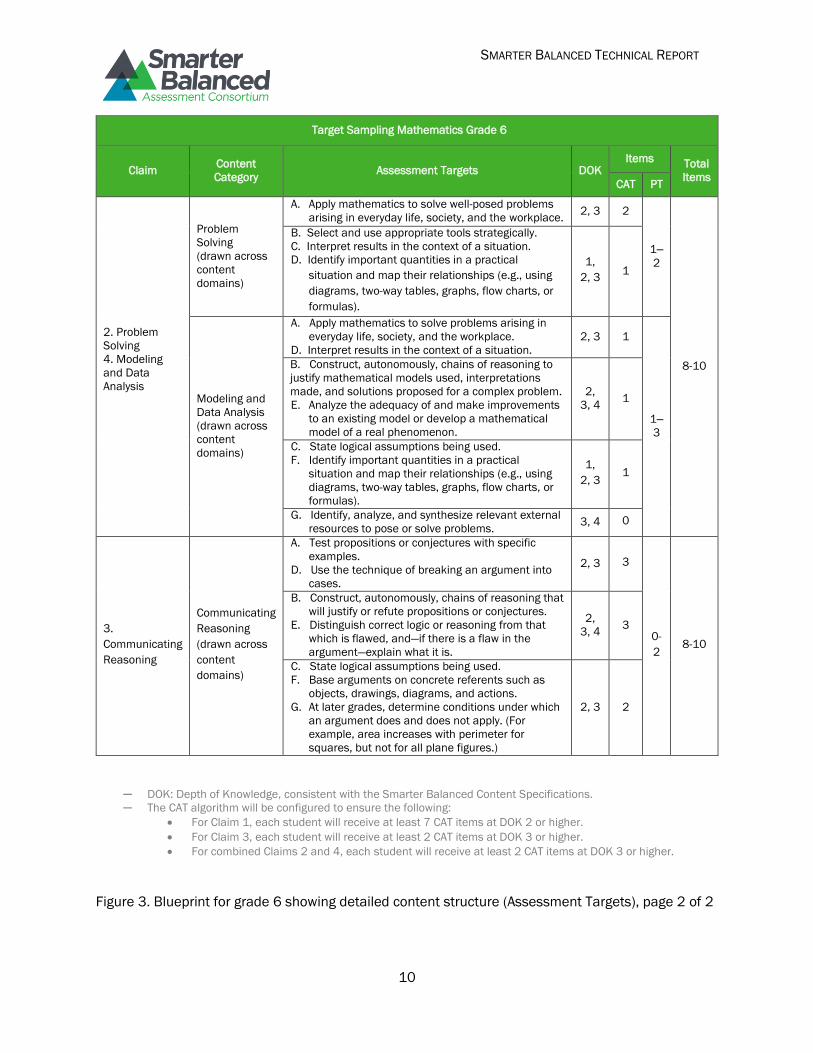
─ DOK: Depth of Knowledge, consistent with the Smarter Balanced Content Specifications.
─ The CAT algorithm will be configured to ensure the following:
For Claim 1, each student will receive at least 7 CAT items at DOK 2 or higher.
For Claim 3, each student will receive at least 2 CAT items at DOK 3 or higher.
For combined Claims 2 and 4, each student will receive at least 2 CAT items at DOK 3 or higher.
Figure 3. Blueprint for grade 6 showing detailed content structure (Assessment Targets), page 2 of 2
Target Sampling Mathematics Grade 6
Claim Content
Category Assessment Targets DOK
Items Total
Items CAT PT
2. Problem
Solving
4. Modeling
and Data
Analysis
Problem
Solving
(drawn across
content
domains)
A. Apply mathematics to solve well-posed problems
arising in everyday life, society, and the workplace. 2, 3 2
1–2
8-10
B. Select and use appropriate tools strategically.
C. Interpret results in the context of a situation.
D. Identify important quantities in a practical
situation and map their relationships (e.g., using
diagrams, two-way tables, graphs, flow charts, or
formulas).
1,
2, 3 1
Modeling and
Data Analysis
(drawn across
content
domains)
A. Apply mathematics to solve problems arising in
everyday life, society, and the workplace.
D. Interpret results in the context of a situation.
2, 3 1
1–3
B. Construct, autonomously, chains of reasoning to
justify mathematical models used, interpretations
made, and solutions proposed for a complex problem.
E. Analyze the adequacy of and make improvements
to an existing model or develop a mathematical
model of a real phenomenon.
2,
3, 4 1
C. State logical assumptions being used.
F. Identify important quantities in a practical
situation and map their relationships (e.g., using
diagrams, two-way tables, graphs, flow charts, or
formulas).
1,
2, 3 1
G. Identify, analyze, and synthesize relevant external
resources to pose or solve problems. 3, 4 0
3.
Communicating
Reasoning
Communicating
Reasoning
(drawn across
content
domains)
A. Test propositions or conjectures with specific
examples.
D. Use the technique of breaking an argument into
cases.
2, 3 3
0-
2 8-10
B. Construct, autonomously, chains of reasoning that
will justify or refute propositions or conjectures.
E. Distinguish correct logic or reasoning from that
which is flawed, and—if there is a flaw in the
argument—explain what it is.
2,
3, 4 3
C. State logical assumptions being used.
F. Base arguments on concrete referents such as
objects, drawings, diagrams, and actions.
G. At later grades, determine conditions under which
an argument does and does not apply. (For
example, area increases with perimeter for
squares, but not for all plane figures.)
2, 3 2
SMARTER BALANCED TECHNICAL REPORT
11
CAT and Performance Task Test Components
Part of the Smarter Balanced Theory of Action is to leverage appropriate technology and innovation.
Two primary assessment components are administered for either summative or interim test
purposes. These consist of a CAT and a separately administered performance task. Both
components can be administered, and associated information can be accessed online. The use of
CAT methodologies helps ensure that students across the range of proficiency have an assessment
experience that presents them with items that are well targeted at their skill level. The intention is
that average-, very low-, and very high-performing students will be more likely to stay engaged in the
assessment because they will be responding to items specifically targeted to their skill level.
Performance tasks are intended to measures a student’s ability to integrate knowledge and skills
across multiple standards.
The CAT tests should be more efficient in that fewer items can be administered compared with fixed
forms to achieve a comparable level of score precision. For the CAT, there are both content
constraints (e.g., a long reading passage in ELA must be administered) as well as psychometric
criteria that must be optimized for each student. Performance tasks are intended to measure a
student’s ability to integrate knowledge and skills across multiple standards in a coherent task that
requires using integrated skill sets. Performance tasks are used to better measure capacities such
as depth of understanding, research skills, and complex analysis, which cannot be completely
assessed with individual, discrete items. Some constructed-response items and performance tasks
are scored automatically; others are hand-scored by trained raters. Each performance task is
preceded by a brief classroom-interaction activity that is grouped into a larger theme for
administration.
The Classroom Activity component is an innovative element designed in concert with assessment
experts from the Shell Centre, Student Achievement Partners, and Stanford University. The intent of
the Classroom Activity is to provide context for the performance tasks. This allows students to
demonstrate skills and knowledge without interference from lack of background knowledge or
vocabulary. The Classroom Activity does not address the assessed skills but describes the setting
and provides related examples or terms. Since performance tasks are often applied using skills in
real world settings, the Classroom Activity provides users with external information so that no
student is given an advantage or disadvantage based on personal experience.
Operational Adaptive Test Design
Automated test assembly for a CAT depends on a number of factors to produce conformable tests.
These depend on the quality of the item bank, reasonableness of the test constraints and precision
targets, and the degree to which content or other qualitative attributes of items are salient and can
be defined as constraints (Luecht, 1998).
For the operational test, an item-level, fully adaptive test is planned in ELA and mathematics. The
adaptive part of summative and interim comprehensive tests is designed to deliver the CAT portion
of blueprints in a manner that efficiently minimizes measurement error and maximizes information.
Efficiency is interpreted as fewer items being needed compared with non-adaptive (fixed) test forms.
The Smarter Balanced Consortium provides a specific CAT delivery engine, but states may choose to
use other engines as long as they can deliver a conforming test blueprint with a minimum degree of
error, avoid item over- or under-exposure, and provide the design features specified by Smarter
Balanced. This section outlines some of the intended design features for the operational adaptive
test component.
Early in the development process, Consortium states established a desire to allow students to go
back to earlier questions and change their answers. This has implications for test design and
delivery. If a student takes a test over the course of two or more days, answers from previous days
SMARTER BALANCED TECHNICAL REPORT
12
cannot be changed. In mathematics, some items permit the use of a calculator, while others forbid
calculator use. Mathematics tests are consequently divided into two sections, one for non-calculator
items, and one that permits calculator use. Students can change answers within sections but not
across different test sections.
Test blueprints display the proportions of items in each area, but not in the order in which students
will encounter them. The adaptive algorithm presents passages and items at varying stages. In ELA,
the first item can come from either Claim 2 or Claim 4 and must be a machine-scored item. Once the
first claim area is administered, the software iterates through claim areas so that the test does not
converge on a final score based on a single claim area. In mathematics, the first item can be
assigned from any claim.
Expansion of the Item Pool
Under certain conditions, the item pool will expand to include items from adjacent grades that
address content in the target test grade. Pool expansion occurs when the following conditions have
been met:
On-Grade content coverage requirements have been met—this is the point at which over 60%
of the CAT session has been administered and all claims have been sampled.
Estimate of performance is clearly far below or far above the proficiency cut score.
Items in the expanded pool will better satisfy content and measurement requirements.
The algorithm selects items until a defined percentage of the test has been administered, sampling
items from all claim areas. A decision point is reached when a substantial proportion of content has
been covered. The rules for ELA/literacy and mathematics are the following:
For the ELA CAT (no human-scored)
1 long info passage (5 items)
1 long lit passage (5 items)
2 listening passages (6 items)
6 writing items (6 items)
5 research items (5 items)
Total 27 items out of 44—61%
For the mathematics CAT (no human-scored)
Claim 1 (14 items)
Claims 2 & 4 (2 items)
Claim 3 (4 items)
Total 21 items out of 32—62%
At this point, the distance of the estimated score from the college content readiness cut score is
evaluated. This is Level 3 as defined in the Achievement Level Descriptors (see Chapter 10 on
standard setting for further details). If there is a determination that the student is in either Level 1 or
Level 4 as defined by the Achievement Level Setting Report, the item pool is expanded to include
items from no more than two adjacent grades in either direction. In grade 3, the expansion includes
items from adjacent upper grades only; in grade 11, only adjacent lower grades are included. Items
from adjacent grades have been reviewed for appropriateness by content experts to ensure that they
SMARTER BALANCED TECHNICAL REPORT
13
are instructionally and developmentally appropriate for the targeted grades. For the remainder of the
test, both on-grade and off-grade items can be administered. The item with the best content and
measurement characteristics is chosen from the pool. Students at or near the cut score when the
decision point is reached do not have an expanded pool, but continue with the original pool. For all
students, the algorithm delivers the remainder of the blueprint until termination of the test, once all
test constraints are met.
Performance Task Design
The Race to the Top Assessment Program Application for the Smarter Balanced Assessment
Consortium highlights the importance of performance tasks to “provide a measure of the student’s
ability to integrate knowledge and skills across multiple standards—a key component of college and
career readiness” (page 42). The development of an assessment system that fulfills this goal
necessitates an understanding of how the world is changing and what skills are required to compete
in an increasingly global economy. Research suggests that measuring college and career readiness
will increasingly require the use of performance-based assessments (Fadel, Honey, & Pasnik, 2007).
A key component of college and career readiness is the ability to integrate knowledge and skills
across multiple content standards. Smarter Balanced derives inferences concerning this ability
through performance tasks. Performance assessments are intended to represent students’
competencies in applying the requisite knowledge and cognitive skills to solve substantive,
meaningful problems. Performance assessments give students opportunities to demonstrate their
ability to find, organize, or use information to solve problems, undertake research, frame and
conduct investigations, analyze and synthesize data, and apply learning to novel situations.
A Smarter Balanced performance task involves interaction of students with stimulus materials
and/or engagement in a problem solution, ultimately leading to an exhibition of the students’
application of knowledge and skills, often in writing. Stimuli include a variety of information forms
(e.g., readings, video clips, data), as well as an assignment or problem situation. As shown in the test
blueprints, performance tasks are an integral part of the Smarter Balanced test design. When a
performance task is assigned and given in its entirety, it fulfills a specific role in the test blueprint for
a grade and content area. Performance tasks are intended to challenge students in applying their
knowledge and skills to complex, contextually rich problems. These activities are meant to measure
capacities such as depth of understanding, writing or research skills, and complex analysis. They
consist of collections of questions and activities coherently connected to a single scenario. The
performance tasks are administered online via computer (not computer adaptive) and require one to
two class periods to complete.
Prior to online administration of the performance task, students engage in non-scored classroom
interactions that provide all students an opportunity to gain access to key information in sources
before they complete the assigned task. The purpose of these classroom interactions is to create a
more level playing field by mitigating the effect of unfamiliar terms or situations. Classroom Activities
provide instructional connection, an important part of the Smarter Balanced Theory of Action. When
teachers are directly involved in the administration of the task, classroom-based activities have the
potential to positively influence teaching. These classroom-based preparatory activities are intended
to have positive outcomes for instruction and learning and to provide avenues for teacher
professional development by demonstrating good instructional and assessment practice. Tasks are
designed to allow for brief context setting and to reduce construct-irrelevant variance. Task models
for the scored independent performance task work do not depend on the pre-work classroom
activities conducted by the teacher or with classroom peers. In mathematics, the teacher might
engage students in an authentic data collection. In ELA, the teacher might tie together key points
from a video that students observed. Classroom Activities can help mitigate potential conflation
SMARTER BALANCED TECHNICAL REPORT
14
between reading skills and writing or mathematics results and may increase accessibility to higher
scores for students with reading deficiencies.
Performance tasks have a high likelihood of introducing task-specific variance because students
have varying levels of knowledge about a particular topic. Classroom activities can reduce this
variance by allowing teachers and students to gain familiarity about the context for a problem (see
Abedi, 2010). For example, in a mathematics task about designing a merry-go-round, it is important
for all students to understand what a merry-go-round is, how it works, and that it comes in many
shapes. By involving the teacher in the process of exploring the context (but not the construct), all
students enter the task with more similar levels of understanding about the task’s primary theme.
Engaging teachers in the process of task administration is consistent with the Smarter Balanced
commitment to building an assessment system that supports teaching and learning.
Performance tasks were constructed so they can be delivered effectively in the school/classroom
environment (Dana and Tippins, 1993). Requirements for task specifications included, but were not
limited to, pre-assessment classroom activities, materials and technology needs, and allotted time
for assessment. Performance tasks adhered to a framework of specifications used by item writers to
develop new tasks that focus on different content but were comparable in contribution to the
blueprint.
All Smarter Balanced performance tasks consist of three basic components: stimulus presentation,
information processing, and scorable product(s) or performance(s). “Information processing” means
student interactions with the stimulus materials and their content. It could include note taking, data
generation, and any other activities that increase students’ understanding of the stimulus content or
the assignment. All activities within a task must have a rationale for inclusion (e.g., to increase
understanding, for scaffolding, as early steps in product creation or for product creation). More detail
on the possibilities within the three basic process components is presented in the specifications for
ELA/literacy and mathematics performance tasks in Chapter 3.
In ELA, each classroom-based performance task comprises a targeted research effort in which
students read sources and respond to at least three research items. During this research
component, students may take notes to which they may later refer. After the research questions are
completed, students write a full essay drawing from source material and research notes. Together,
the research items and the composition of full texts using the writing process correspond to the
classroom-based performance tasks in the summative assessment, the comprehensive interim
assessment, and in the ELA performance task interim blocks. Claim level results in writing and
research are based on both CAT and performance task item responses.
In mathematics, each classroom-based performance task comprises a set of stimulus materials and
a follow-up item set consisting of six items in Claims 2, 3, and 4 that permit the complete blueprint to
be met. Performance tasks address an integrated task in middle and high school and a common
theme in grades 3 to 5. Note that results for Claims 2, 3, and 4 are derived from scored responses to
both performance tasks and CAT items.
Test Scoring
The method of combining item level scores to produce test scores and subscores is presented in
detail in the Test Score Specifications document (AIR, 2014). Scores are calculated using maximum
likelihood estimation (MLE) applied at the overall and subscore levels. No special weights for claims,
item types or performance tasks are applied. Desired score effects are achieved by content
proportions in the blueprints.
SMARTER BALANCED TECHNICAL REPORT
15
Field Test Delivery Modes
For Smarter Balanced operational administrations, a CAT test will be given along with a classroom-
based, thematically related performance task where the context and assessment experiences differ
from the CAT. The design for the Field Test essentially followed these two test components. For the
Field Test, the test delivery modes corresponded to the two separately delivered events, one for the
CAT and one for the performance task.
The performance tasks were delivered using computerized fixed forms/linear administrations. For a
given performance task, students saw the same items in the same order of presentation and
associated test length. Since performance tasks are classroom-based and organized thematically,
they were randomly assigned within Classroom Activities assigned at the school and grade level in
the Field Test. There was no administration ordering of the two components. Students could take
either the CAT or the performance task first.
During the CAT component of the Field Test, linear-on-the-fly testing (LOFT) was used (Gibson &
Weiner, 1998; Folk & Smith, 2002). LOFT delivers tests assembled dynamically to obtain a unique
test for each student from a defined item pool. Note that a LOFT is similar to a CAT in applying
content constraints to fulfill the test blueprint. Each student should obtain a content-conforming
unique test form. The major differences between LOFT and item level adaptive testing is that no IRT
item statistics are used in the administration and adaptation based on student response/ability is
not incorporated into the delivery algorithm. For dynamic real-time LOFT, item exposure control (e.g.,
Hetter & Sympson, 1997) can be used to ensure that uniform rates of item administration are
achieved. That is, it is not desirable to have some items with many observations and others with
correspondingly few in comparison. The LOFT administration is closer to the operational CAT so that
there are some advantages for IRT scaling. This permits the scaling to reflect the operational CAT
deployment. For the test administration, delivering parallel fixed-test forms with potentially
thousands of items in a pool in a given grade and content area was not possible. The major
advantage of using LOFT was that parallel test forms could be constructed dynamically using the test
delivery algorithm. The disadvantage is that some measures of test functioning are not directly
available using LOFT. Classical statistics such as observed test reliability cannot be computed since
every student essentially takes a unique test form. Even the definition of a criterion score for item-
test correlation and for differential item functioning must rely on Item Response Theory (IRT)
methods for computing these statistics.
Measurement Models (IRT) Adopted
A unidimensional scale was conceptualized that combines both CAT and performance tasks. The
results from the Pilot Test factor analysis study supported the use of a unidimensional scale, both
within a grade and across grades in ELA and mathematics, which are presented in detail in the Pilot
Test (Chapter 5). Since no pervasive evidence of multidimensionality was shown, the decision was to
adopt a unidimensional model for scaling and linking. For the choice of an IRT model, examination of
model fit using chi-square showed significant improvement of the two-parameter model over the one-
parameter model. Use of the three-parameter logistic model did not significantly improve model fit.
Consequently, after discussion with the Smarter Balanced Technical Advisory Committee, a two-
parameter unidimensional model was adopted for dichotomous data. The generalized partial credit
mode (GPCM, Muraki, 1992) was used in the case of polytomous items (i.e., constructed-response).
These models were used in scaling, achievement level setting, and the first years of operational
testing. The Consortium plans to revisit the scale and model decisions using a solid base of
operational data.
SMARTER BALANCED TECHNICAL REPORT
16
Interim Assessment
The purpose of the Smarter Balanced interim assessment system in mathematics and ELA is to
complement the Smarter Balanced summative assessment by
providing meaningful information on student progress toward mastery of the skills measured
by the summative assessment;
serving as a repository of items and tasks for assessing the Common Core State Standards
at strategic points during the school year;
yielding actionable information on student skills and understanding in instructionally
targeted areas of interest; and
supporting teaching and learning inside and outside of the classroom.
The items on the interim assessments are developed under the same conditions, protocols, and
review procedures as those used in the summative assessments and is on the same scale. The
items assess the Common Core State Standards, adhere to the same principles of Universal Design
to be accessible to all students, and provide evidence to support all Smarter Balanced claims in
mathematics and ELA. The application of the same ECD processes and procedures in the
development of items and tasks for the interim system ensures that each item or task clearly elicits
student responses that support the relevant evidence that is aligned to the associated content
standards. The interim assessments are available in grades 3 to 8 and high school. Items for the
interim assessments have been administered in the Field Test with all appropriate reviews and
scoring applied. The Consortium plans to provide fixed-form Interim Comprehensive Assessments
(ICAs) and fixed-form Interim Assessment Blocks (IABs) that include universal tools, designated
supports, and accommodations listed in the Usability, Accessibility, and Accommodations Guidelines.
The Interim assessments include two distinct types of tests that draw from the same bank of items
and performance tasks:
Interim Comprehensive Assessments (ICAs) use the same blueprints as the summative
assessments, assessing the same range of standards, and use the same score-reporting
categories. The ICAs include the same item types and formats, including performance tasks,
as the summative assessments, and yield results on the same vertical scale. They are
administered with the same computer-adaptive algorithm or with the option of a fixed form.
The ICAs yield overall scale scores, overall performance level designations, and claim-level
information.
Interim Assessment Blocks (IABs) focus on smaller sets of targets and therefore provide
more detailed information targeted at instructional purposes. The blocks are available either
as fixed forms or with the use of a computer-adaptive algorithm. The IABs are comprised of
several blocks of items and yield overall information for each block. Each block measures a
smaller set of targets than does the ICA. These smaller assessments focus on a particular
cluster of standards and therefore provide more instructionally relevant types of feedback.
They may be computer adaptive or linear, and results are reported on the same scale as the
summative assessment with the caveat that the full summative system takes into account a
broader range of content.
Fixed-form Interim Comprehensive Assessments (ICAs) and fixed-form Interim Assessment Blocks
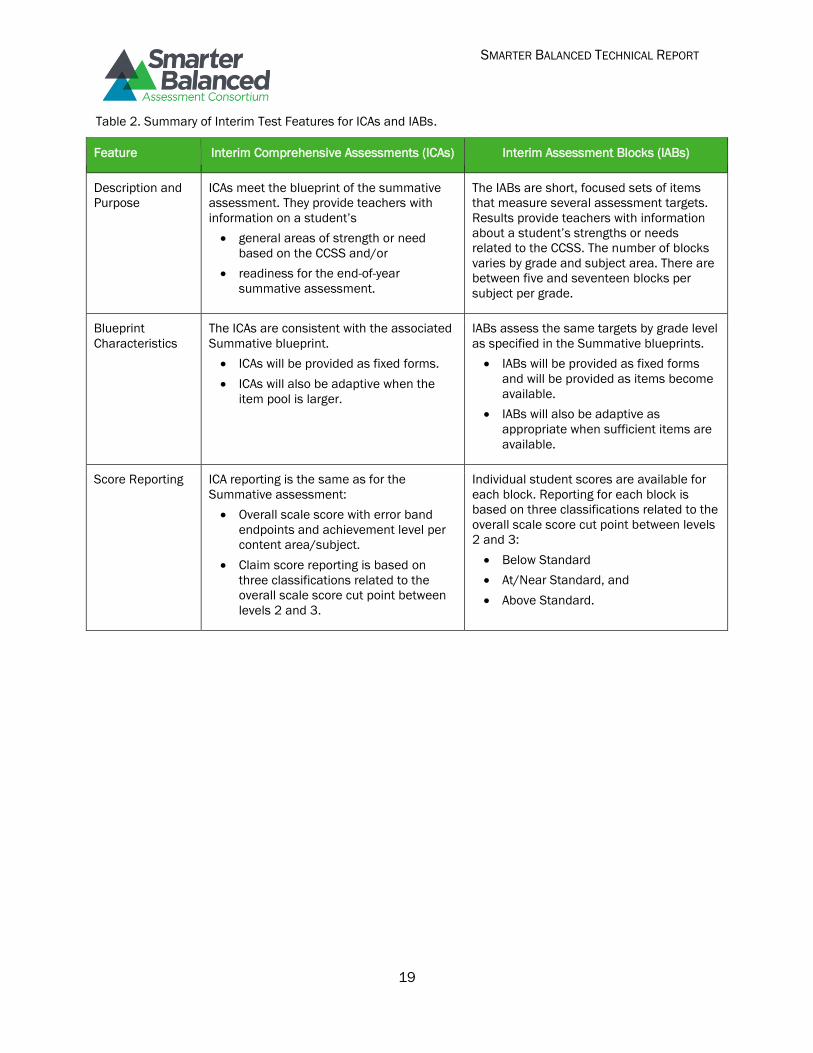
(IABs) include the universal tools, designated supports, and accommodations listed in the Usability, Accessibility, and Accommodations Guidelines. Table 2 gives an overview of interim assessment
features. The interim assessments provide results that teachers and administrators can use to track
student progress throughout the year in relation to the Common Core State Standards and to adjust
SMARTER BALANCED TECHNICAL REPORT
17
instruction accordingly. The full range of assessment options in the interim system will ultimately
depend on the assessment purpose and use of scores, security needs, and the system’s technical
capabilities, such as secure high school end-of-course assessments to support state-level
accountability systems. The ICAs and IABs are available in grades 3 to 8 and high school and can be
administered at any time during the school year. The high-school ICAs are constructed to be
consistent with the grade 11 summative blueprints. High school IABs are constructed to focus on
content that would be appropriate across grade levels. Schools or districts may choose to administer
the high school interim assessments in grades 9 to 12. The high school ICA and IAB are constructed
to be consistent with the grade 11 blueprint; however, the high school ICA and IAB may still be
administered in grades 9 to 12. In addition, the interim assessments are not constrained by grade
level; in other words, students may take an off-grade level Interim assessment. For example, a fifth-
grade ICA/IAB can be administered to grades above or below fifth grade. The item bank in the initial
rollout of the interim assessments will be limited in depth of the available content. Therefore, if ICAs
and IABs are administered repeatedly to the same students, individuals may be exposed to the same
items on occasion. There are no security expectations for the items in the Interim assessment item
bank. The interim assessments are not intended for accountability purposes. Table 3 gives the IABs
available for ELA/literacy, and Tables 4 and 5 present them for mathematics.
The scoring of human-scored aspects of constructed-response items and performance tasks for
interim is a local/state responsibility. Items can be scored automatically by the Smarter Balanced
engine, except for human-scored aspects of performance tasks or selected CAT items, which can be
scored locally by teachers or in support of professional development or by professional raters
according to established standards for accuracy and fairness.
ELA/Literacy ICA Blueprints
The ELA ICA blueprints summarize coverage of items by grade band (3 to 5, 6 to 8, and 11). Each
blueprint specifies the numbers of items by claim (1–4) and content category, item type, and scoring
method (machine scored or hand scored). The short-text items (two in Reading and one in Writing)
are designed to be hand scored but may eventually be machine scored with an application that
yields similar results to hand-scoring.
Like the Summative assessments, the ICAs will report an overall ELA score and scores for four claim-
reporting categories for each grade band, each of which will be reported with the overall ELA score.
Because the ICAs use the same blueprints as the Summative assessments, the ICA blueprints for
both the adaptive and fixed forms begin with the same three-page summary as the ELA/literacy
Summative assessment blueprint. The only difference is that the ELA fixed-form summary does not
refer to CAT items; instead, it refers to these items as non-PT (non-performance task).
The grade band blueprints for the ICAs mirror the summative blueprints exactly in terms of
formatting. Each blueprint specifies the number of items by claim and content category, the number
of items within each claim for all Assessment Targets, DOK levels, and numbers of items by type
(machine scored, short text, and performance task ). The ICA adaptive-form blueprint reflects the
same allocation of items (including ranges of items where appropriate) as the Summative blueprint.
Where item allocations had been specified as ranges in the ICA adaptive-form blueprint, those
ranges were adjusted in the fixed-form blueprint to ensure appropriate levels of coverage of each
assessment target relative to the other assessment targets in the ICA fixed form.
Mathematics ICA Blueprints
The blueprint for the mathematics Summative assessment summarizes coverage of items by grade
band (3 to 5, 6 to 8, and 11). The numbers of items (including performance tasks and other
constructed-response items) by claim (1–4) are specified in the blueprint. In addition, Claim 1 items
are further specified by priority cluster or supporting cluster, with priority and supporting clusters
SMARTER BALANCED TECHNICAL REPORT
18
defined in the Smarter Balanced Content Framework for Mathematics. All CAT items in grades 3 to 5
are designed to be machine scored. Claim 2 (problem solving) and Claim 4 (modeling and data
analysis) have been combined because of content similarity and to provide flexibility for item
development. In grades 6 to 8 and 11, one item per student (from either Claim 3 Target B or Claim 4
Target B) is designated for hand-scoring, which might be machine scored with an application that
yields comparable results. There are still four claims, but only three claim scores will be reported with
the overall mathematics score. Since the ICAs use the same blueprints as the Summative
assessments, the blueprints for both the adaptive and fixed forms of the ICAs for mathematics begin
with the same three-page summary as the mathematics summative assessment blueprint.
The ICA blueprints are organized by grade level (3 to 8 and 11). The ICA blueprints mirror the
Summative blueprints exactly in terms of formatting. Each blueprint specifies the number of items by
claim, and for Claim 1 only, also by priority or supporting cluster. Within each claim, the number of
items for all assessment targets associated with the claim is also specified. Finally, within the
Assessment-Target-level allocations, possible DOK levels are indicated along with numbers of CAT
and performance tasks. The ICA adaptive-form blueprint reflects the same allocation of items
(including ranges of items where appropriate) as the summative blueprint. Item allocations that were
specified as ranges in the ICA adaptive-form blueprint were adjusted in the fixed-form blueprint to
ensure appropriate levels of coverage of each assessment target relative to the other assessment
targets in the ICA fixed form.
Interim and Summative Test Administration and Reporting. Both the ICA and IAB components are
administered online through the Open Source Test Administration System. Since the purpose of the
Smarter Balanced Interim assessment is to provide educators with student-level, CCSS-related
results that can be used to adjust instruction, the interim assessments may be administered at
multiple points throughout the school year. The administration schedule can be determined by each
locale, with some states determining the administration of the interim assessment and others
leaving the administration schedule up to schools/districts. There is no system limit on the number
of times that the ICA and/or IAB can be administered.
The Summative Assessment will report an overall achievement level designation for a grade and
content area and classification at the claim level. The reports will include an overall scale score with
error band endpoints and an achievement level per content area as well as claim-level scores. At the
claim level, students are assigned to one of three levels of classification (“Below Standard,” “At/Near
Standard,” “Above Standard”) related to the overall scale-score at the achievement level 2/3 cut
point. The ICA reporting has the same reporting structure as the summative assessment. Likewise
for the IAB, students will be classified into one of three levels (“Below Standard,” “At/Near
Standard,” “Above Standard”) related to the overall scale-score at the proficient achievement level.
SMARTER BALANCED TECHNICAL REPORT
19
Table 2. Summary of Interim Test Features for ICAs and IABs.
Feature Interim Comprehensive Assessments (ICAs) Interim Assessment Blocks (IABs)
Description and
Purpose
ICAs meet the blueprint of the summative
assessment. They provide teachers with
information on a student’s
general areas of strength or need
based on the CCSS and/or
readiness for the end-of-year
summative assessment.
The IABs are short, focused sets of items
that measure several assessment targets.
Results provide teachers with information
about a student’s strengths or needs
related to the CCSS. The number of blocks
varies by grade and subject area. There are
between five and seventeen blocks per
subject per grade.
Blueprint
Characteristics
The ICAs are consistent with the associated
Summative blueprint.
ICAs will be provided as fixed forms.
ICAs will also be adaptive when the
item pool is larger.
IABs assess the same targets by grade level
as specified in the Summative blueprints.
IABs will be provided as fixed forms
and will be provided as items become
available.
IABs will also be adaptive as
appropriate when sufficient items are
available.
Score Reporting ICA reporting is the same as for the
Summative assessment:
Overall scale score with error band
endpoints and achievement level per
content area/subject.
Claim score reporting is based on
three classifications related to the
overall scale score cut point between
levels 2 and 3.
Individual student scores are available for
each block. Reporting for each block is
based on three classifications related to the
overall scale score cut point between levels
2 and 3:
Below Standard
At/Near Standard, and
Above Standard.
SMARTER BALANCED TECHNICAL REPORT
20
Table 3. Summary of ELA Interim Assessment Blocks.
Grades 3–5 Grades 6–8 High School
Read Literary Texts Read Literary Texts Read Literary Texts
Read Informational Texts Read Informational Texts Read Informational Texts
Edit/Revise Edit/Revise Edit/Revise
Brief Writes Brief Writes Brief Writes
Listen/Interpret Listen/Interpret Listen/Interpret
Research Research Research
Narrative PT Narrative PT Explanatory PT
Informational PT Explanatory PT Argument PT
Opinion PT Argument PT
SMARTER BALANCED TECHNICAL REPORT
21
Table 4. Summary of Mathematics Interim Assessment Blocks.
Grade 3 Grade 4 Grade 5
Operations and Algebraic
Thinking
Operations and Algebraic
Thinking
Operations and Algebraic
Thinking
Numbers and Operations
in Base 10
Numbers and Operations in
Base 10
Numbers and Operations in
Base 10
Fractions Fractions Fractions
Measurement and Data Geometry Geometry
Measurement and Data Measurement and Data
Mathematics PT Mathematics PT Mathematics PT
Grade 6 Grade 7 Grade 8
Ratio and Proportional
Relationships
Ratio and Proportional
Relationships
Expressions & Equations I (and
Proportionality)
Number System Number System Expressions & Equations II
Expressions and Equations Expressions and Equations Functions
Geometry Geometry Geometry
Statistics and Probability Statistics and Probability
Mathematics PT Mathematics PT Mathematics PT
SMARTER BALANCED TECHNICAL REPORT
22
Table 5. High School Mathematics Assessment Blocks.
High School
Algebra and Functions Linear Functions
Quadratic Functions
Exponential Functions
Polynomial Functions
Radicals Functions
Rational Functions
Trigonometric Functions
Geometry Transformations in Geometry
Right Triangle Ratios in Geometry
Three-Dimensional Geometry
Proofs
Circles
Applications
Interpreting Categorical and Quantitative Data
Probability
Making Inferences and Justifying Conclusions
Mathematics Performance Task
Pool analysis and adequacy: Background and Recommendations
The quality of a CAT is highly dependent on the quality of the item pool. Quality is primarily related to
how well the content constraints and statistical criteria can be met. The content specifications are
defined as a combination of item attributes that tests delivered to students should have. There are
typically constraints on item content such that they must conform to coverage of a test blueprint. If
there are many content constraints and a limited pool, then it will be difficult to meet the CAT
specifications. For a given content target, if the available difficulty/item information targeted at a
given level ability is not available, then estimation error cannot be reduced efficiently. A third
SMARTER BALANCED TECHNICAL REPORT
23
dimension is that there is usually some need to monitor the exposure of items such that the “best”
items are not administered at high rates relative to other ones. Therefore, the quality of the item
pools is critical to achieving the benefits that accrue for the CAT over fixed test forms. Quantification
of pool adequacy prior to simulation could be accomplished either through the Reckase (2003) “bin”
method or the van der Linden (2005) “shadow test” method. Both involve an inventory of items by
required blueprint elements and information ranges.
Partitioning the Item Pool. A central question is how many items and what types of items need to be
in a pool. Ideally, the more items there are, the better the assessment, because more items allow for
greater choice in test assembly and reduced exposure of items. Larger pools typically result in more
items that match content criteria, item format, and statistical requirements. For Smarter Balanced,
the available summative item pool comprises all items not used in the Interim assessment or in
Ordered Item Booklets used in achievement level setting.
For the Summative assessment, a robust pool is necessary to implement the CAT efficiently and
maintain exposure control. Since there are a finite number of performance tasks and they are not
part of the CAT delivery, these can simply be assigned using some simple decision rules. Once the
CAT is partitioned for a grade, the subset of items from adjacent grades can also be evaluated. The
preferred method for partitioning the item pools would be to use simulations with the CAT delivery
engine to ensure that the constraints could be met reasonably. Barring that, other methods could be
used to stratify items by item difficulty and content domain (Claims and Assessment Targets). The
problem is to ensure that the summative test has a preponderance of easier and more highly
discriminating items since the census pools contain many difficult items.
Evaluating Item Pool Quality Using Simulation. Computer simulation can be employed to evaluate the
properties of an item pool after the items have been developed and calibrated. In order to evaluate
the delivery system and item pool, the following criteria should be taken into account:
the fidelity of each test event (Summative and Interim), both real and simulated, to test
blueprints and specifications;
measurement errors for simulated scores for both overall and claim subscores;
test information functions;
recovery of simulated examinee ability, including analysis of estimation bias and random
error; and
analysis of summative/interim pool adequacy for scores and claim subscores.
Simulations play an important role in evaluating the operational adaptive algorithm and delivery
system. The simulations should be specific to the Smarter Balanced assessments, using item
parameter estimates from the Field Test and simulated test taker populations representative of the
population of member states. It is suggested that the simulation include 1000 simulees at a given
number of theta values (say 20) equally spaced between -4 and +4 and then run each simulee
through the adaptive algorithm. The results of those 20,000 test events and resulting ability
estimates per item pool can be summarized to examine the degree to which the algorithm and
resulting scores meet the criteria outlined below. While simulations are convenient to conduct, they
provide only one source of evaluation data. There is always a risk that the simulations may not
adequately predict what happens when real students are administered real tests. For that reason,
wherever possible, the results from actual students that participated in the Field Test, as well as
from simulated cases, need to be examined.
Fidelity of Each Summative/Interim Test Event. Early comparisons of adaptive-testing procedures
were made with regard to a narrow set of criteria. Foremost among these was test precision or its
SMARTER BALANCED TECHNICAL REPORT
24
close measure, test efficiency. In a simulation, precision is defined as the degree to which the true
underlying proficiencies of simulated test takers are recovered by simulated tests. Efficiency is
simply test precision divided by test length. Both precision and efficiency are highly prized because
these are the principal “value added” features of adaptive testing. However, when a primary goal of
testing is to find out what a student knows about a certain number of content criteria or subscores,
consistent content coverage assumes the greatest importance. A conforming test is one that meets
all the requirements imposed upon it. Conforming tests, therefore, comply with all content
constraints, minimize item over- and under-exposure, and measure to optimal levels of precision. A
better test administration algorithm is one capable of delivering conforming tests with the best item
exposure rates and lowest measurement errors.
To evaluate the fidelity or conformity of each test event to the test blueprints and specifications, for
both simulated data and real test events, information about the content composition of the adaptive
tests delivered from each item pool is evaluated. During item selection, the algorithm attempts to
meet all the specified criteria. Tables that summarize, for each criterion of the algorithm, both the
mean number of items delivered and the proportion of times each criterion is not met are tabulated.
These values are reported for both the simulated and real data. The simulated data provide a
baseline for how we expect each item pool to perform. Weights can be imposed in the CAT algorithm
that reflect the importance of a given test constraint. Violations of constraints with higher
weights/importance would be considered more serious than violations of constraints with lower
weights.
Measurement Errors for Simulated Scores; Both Overall and Claim Subscores. Test information
functions, recovery of simulated examinee ability, and analysis of bias and error are all highly
interrelated and can be addressed collectively. The definition of test efficiency hinges on the
corresponding definition of test precision. Test precision is loosely defined through the standard
error of measurement. All test scores include an error component, the size of which generally varies
across test takers. Differences in precision across score ranges are ignored by measures of precision
that, like test reliability, are aggregated across score levels. However, IRT provides a related pair of
test precision measures that are specific to, or conditional on, score level. Both the test information
function and the inversely related conditional standard error trace test-precision level across the
score scale. (The conditional standard error function is the inverse of the square root of the test
information function.) In a simulation environment, the score bias function measures the extent to
which score estimates converge to their true values. The smaller the bias and error, the better the
test administration and scoring procedures recover simulated examinee ability. Even if the goal is to
measure each student according to some fixed criteria for test information/conditional standard
error, test precision can vary not just across proficiency levels but across test takers at the same
level of proficiency. However, test administration procedures may differ in the extent to which each
test taker is measured on the targeted precision. It should be noted that exceeding the precision
target is almost as undesirable as falling short. Measuring some test takers more precisely than
necessary wastes resources (in the form of item exposures) that could be used more productively
with other test takers.
The evaluation of how well the adaptive algorithm and item pool can recover simulated examinee
ability can be presented by summarizing results for the 1000 test events at each theta. For example,
summary statistics can be computed for every 1000 simulees with true overall scores and subscores
at given intervals. Conditional means, 25th percentiles, 75th percentiles, conditional standard errors
of measurement (CSEMs), and difference from target values can be reported for each theta interval.
The conditional means and difference from target values will serve as indices of the ability of the
algorithm and pool to recover the true abilities across the score range. The CSEM and 25th and 75th
percentiles serve as a measure of variability in reported scores for each true score.
SMARTER BALANCED TECHNICAL REPORT
25
Analysis of Summative Pool Adequacy for Scores and Subscores. A number of statistics can be
computed to evaluate each of the summative pools in a grade and content area. Any given pool
should be a compilation of all relevant item types representing all subscores, with varying levels of
difficulty and item information. All pools used for any given test should be randomly equivalent. To
investigate this, the composition of each pool should be summarized by reporting the number of
various item types separately for each of the subscore levels. In addition, summary statistics of the
IRT difficulty and discrimination parameters can be calculated for each pool and each subscore level.
These results can be compared across summative pools to see if all pools are similarly composed.
Expected and observed item exposure rates are reported, where item exposure rate is defined as the
proportion of the total number of examinees who were administered a particular item. Item exposure
is monitored for item and test security purposes to keep the same items from being administered to
too many students and to keep pools viable by utilizing as many items as possible. In pools with little
or no exposure control, it is possible that 10% of the items account for 70–80% of the items
administered. The frequency, percent, and cumulative percentage of items in each pool with various
exposure rates can be calculated. Simulated data can be used to obtain the expected rates; actual
data can be used to obtain the observed rates. The correlation between expected and observed
exposure rates, as well as summary statistics (mean, minimum, maximum, standard deviation) for
exposure rates can also be included in this analysis. Overlap between simulated and adaptive test
administration should also be examined. There will be less overlap with unconditional samples than
samples conditioned on ability, so it is important to control (and monitor) exposure conditionally.
Simulations Studies for 2014-15 operational summative tests
Two sets of simulation studies were conducted for the 2014-15 tests using packaged pools with
both the Consortium’s proprietary engine and with CRESST’s simulation engine, which serves as a
baseline for other vendors. These results are published as part of the 2014-15 Technical Report.
Simulation is an ongoing effort conducted for each adaptive test. Conventional reliability statistics
are produced for the fixed form interim tests.
Test Sustainability. This broad and vitally important criterion is not always considered in adaptive-
testing programs. Essentially, sustainability refers to the ease with which a testing program can be
operationally maintained over time. At least three factors are important:
What level of pretesting is needed to maintain summative bank stability? More sustainable
testing programs will require less item development and pretesting to maintain summative
bank size and quality at stable levels.
How balanced is summative pool use? More sustainable testing programs will use items
effectively by balancing use. With balanced item use, every item appears with roughly equal
or uniform frequency. When item use is poorly balanced, a few items appear very often and a
large number are rarely used. Unbalanced item use affects sustainability by making a small
number of exceptional items carry much of the burden. These items risk becoming known to
the test-taker community and so may be removed from use, either temporarily or
permanently. However, a large number of new items must be pretested to find the few that
are exceptional enough to replace those being released. Under a more balanced test design,
items that are more commonplace would be used often enough to reach retirement. Fewer
new items would need to be pretested to replace these more typical items.
How easy are summative pools to develop? Test administration procedures or algorithms
that facilitate summative pool development will be more easily sustained over time. Several
SMARTER BALANCED TECHNICAL REPORT
26
factors will influence the ease or difficulty of summative pool development, with some of
these factors more easily quantified than other ones. One factor concerns the conditions that
the pool must meet in order to be effective. Presumably, summative pools required to meet
fewer and weaker conditions will be easier to develop. However, the extent to which pools
parallel the structure of the summative bank is also important. Pools broadly representative
of the summative bank will likely be easier to develop than pools that sample the bank more
selectively. Finally, pools that operate in ways that are more predictable will be easier to
develop than pools that function unpredictably. Minor changes to summative pools should
result in equally minor changes in the way a pool functions.
Ideally, test sustainability would be evaluated by simulations that predict the effects of several years
of operational test administration. This simulation would start with the item banks as they currently
stand and then work through several years of operational testing. Summative and interim pools
would be built, tests would be administered, item usage would be tracked, frequently administered
items would be retired, and new items would be pretested and enter the item bank. Comparing the
summative bank at the end of this cycle with that at the outset would reveal whether the test
administration procedures and all their assumptions (item development requirements, pretest
volumes, pool specifications, pool development, item retirement limits, etc.) are able to keep the
item banks stable and the testing program sustainable.
Robustness to Aberrant Responding. Student test takers occasionally respond to test items in
unexpected ways. Carelessness, low test-completion rates (speededness), item pre-exposure,
unusual educational backgrounds, and a host of other factors are potential causes. Both
conventional and adaptive tests are likely to poorly measure test takers who respond
idiosyncratically. However, some adaptive administration and scoring procedures may cope better
than other ones. A series of simulations can be conducted to evaluate the chosen procedures in this
regard. Each simulation will be capable of generating data according to one of several identified
nonstandard response models (these would simulate the effects of careless responding,
speededness, lucky guessing) and other sources of anomalous responding. The evaluation will
determine how successful the test administration and scoring procedures are in recovering true
proficiency values despite the presence of unusual or aberrant responding. Although this is less of a
concern for interim assessments, it is more visible to users such as teachers.
Test Design Specifications and Outcomes
Major types of assessment design specifications that did not necessarily occur sequentially are
summarized below that fall generally under the rubric of test design. These steps primarily relate to
content validity of the Smarter Balanced assessments, particularly with respect to nonstandard
administrations. Further details can be obtained in Chapter 3 on item and test development. Other
test specifications concern the establishment of achievement level descriptors and psychometric
specifications that pertain to scaling and implications for scores. In many cases, the results were
reviewed by one or more Stakeholder groups.
1) Conducted Initial Analysis of the Content and Structure of the CCSS
An initial analysis of how each standard within the CCSS could be assessed in terms of item/task
type and DOK was conducted. This was intended to support content and curriculum specialists
and test- and item/task-development experts. Analysis and recommendations were made for all
ELA/literacy and mathematics standards in grades 3 to 8 and high school. Multiple levels of
review were conducted that included the Smarter Balanced Technical Advisory Committee,
Smarter Balanced member states, and Smarter Balanced Executive Committee.
2) Developed Content Specifications for ELA/literacy and Mathematics
SMARTER BALANCED TECHNICAL REPORT
27
Content specifications (e.g., claims, inferences, and evidence), item/task development criteria,
and sample item/task sets were developed. This was intended to support the development of
test blueprints and test specifications. Key constructs underlying each content area and critical
standards/strands were identified in terms of demonstrating evidence of learning. Standards
and bundled standards based on “bigger ideas” within the CCSS that require measurement
through non-selected-response items (e.g., innovative item types) were identified. Reviews were
conducted by CCSS authors, content experts, and assessment specialists.
3) Specified Accessibility and Accommodations Policy Guidelines
Guidelines that describe the accessibility and accommodations framework and related policies
for test participation and administration were created that incorporated evidence-based design
(ECD) principles and outcomes from small-scale trials. State survey and review of best practices
were reviewed as well as recommendations on the use of assessment technology. Input was
solicited from the Smarter Balanced English Language Learners Advisory Committee and the
Students with Disabilities Advisory Committee.
4) Developed Item and Task Specifications
Smarter Balanced item/task type characteristics were defined as sufficient to ensure that
content measured the intent of the CCSS and there was consistency across item/task writers
and editors. This included all item types, such as selected-response, constructed-response,
technology-enhanced, and performance tasks. In addition, passage/stimulus specifications (e.g.,
length, complexity, genre) and scoring rubric specifications for each item/task type were
included. Specifications for developing items for special forms (e.g., braille) were also included.
5) Developed and Refined Test Specifications and Blueprints
The test form components (e.g., number of items/tasks, breadth and depth of content coverage)
necessary to consistently build valid and reliable test forms that reflect emphasized CCSS
content were defined. These specifications included purpose, use, and validity claims of each
test, item/task, test form, and CAT attribute. These were reviewed and revised based on CAT
simulation studies, small-scale trials, Pilot and Field testing, and as other information was made
available.
6) Developed Initial Achievement Level Descriptors
Achievement expectations for mathematics and ELA/literacy were written in a manner that
students, educators, and parents could understand. Panelists were recruited, and panels
consisting of Institutes of Higher Education and a Cross-Consortia Technical Advisory Committee
were convened in order to define college and career readiness. A period for public comment and
various levels of review was implemented by the Smarter Balanced Technical Advisory
Committee and selected focus groups with the approval of Governing States. These activities
were coordinated with the PARCC consortium.
7) Developed Item and Task Prototypes
Prototype items and tasks using accessibility and Universal Design principles were produced that
maximize fairness and minimize bias by using the principles of evidence-based design.
Recommendations were made on how best to measure standards for innovative item types (per
content specifications). This included prototypes for scoring guides, selected-response items,
constructed-response items, and performance tasks. These prototypes were annotated,
describing key features of items/tasks and scoring guides, passage/stimulus specifications (e.g.,
length, complexity, genre), and scoring rubric guidelines for each item/task type. Reviews,
feedback, and revisions were obtained from educator-focus groups and Stakeholders, Smarter
SMARTER BALANCED TECHNICAL REPORT
28
Balanced work groups, the Smarter Balanced English Language Learners Advisory Committee,
and the Students with Disabilities Advisory Committee.
8) Wrote Item and Performance Task Style Guide
The style guide specifies item/task formatting sufficient to ensure consistency of item/task
formatting and display. The style guide specified the font, treatment of emphasized
language/words (e.g., bold, italics), screen-display specifications, constraints on image size,
resolution, colors, and passage/stimulus display configuration. Comprehensive guidelines for
online and paper style requirements for all item types (e.g., selected-response, constructed-
response, technology-enhanced, performance tasks) were specified.
9) Developed Accessibility Guidelines for Item and Task Development
Guidelines were produced for item and task writing/editing that ensure accessibility of test
content that addressed all item types. Interoperability standards at the item and test level were
determined. Reviews, feedback, and revisions were based on educator-focus groups, Smarter
Balanced work groups, the Smarter Balanced English Language Learners Advisory Committee,
and the Students with Disabilities Advisory Committee.
10) Developed and Distributed Item/Task Writing Training Materials
Training materials were created that specified consistent use of item/task specifications, style
guides, accessibility guidelines, and best practices in item/task development (e.g., Universal
Design, bias and sensitivity concerns) that were sufficient to ensure valid and reliable
items/tasks that are free from bias and maximize accessibility to content. Training for item/task
writing and editing was developed as online modules that enabled writers and editors to receive
training remotely. Item writer and editor qualifications were established, and quality control
procedures to ensure item writers were adequately trained were implemented.
11) Reviewed State-Submitted Items and Tasks for Inclusion in Smarter Balanced Item Pool
State-submitted items/tasks were reviewed for inclusion in the Pilot and/or Field Test item bank
using the item bank/authoring system. This consisted of developing protocols for the submission
and collection of state-submitted items/tasks for potential use in Pilot or Field Tests. These items
were reviewed for item/task alignment, appropriateness (including access), and bias and
sensitivity. Feedback was provided to states on the disposition of submitted items/tasks, and a
gap analysis was conducted to determine the item/task procurement needs.
12) Planned and Conducted Small-Scale Trials of New Item and Task Types
Small-scale trials of new item/task types were used to inform potential revision of item/task
specifications and style guides. Cognitive labs were conducted for new item/task types. Small-
scale trials reflected an iterative development process, such that recommended revisions were
evaluated as improvements became available.
13) Developed Automated-Scoring Approaches
The initial automated scoring methodology (e.g., regression, rules-based, or hybrid) was based on
information from the content specifications, item/task specifications, item/task prototypes, and
response data from the small-scale item/task trials. Reports documenting analysis were created,
and independent review of this information with recommendations was made. Consultation,
review, and approval of recommendations by the Smarter Balanced Technical Advisory
Committee were made.
14) Developed Smarter Balanced Item and Task Writing Participation Policies and Guidelines
SMARTER BALANCED TECHNICAL REPORT
29
Documentation of processes for Smarter Balanced member states and Stakeholders to be
involved in Smarter Balanced item/task writing activities (e.g., content and bias/sensitivity, data
review, Pilot Testing, Field Testing) was developed. Criteria for selecting committee members
(e.g., regional representation, expertise, experience) were also made.
15) Developed Content and Bias/Sensitivity Pilot Item and Task Review Materials
Methods for consistent training for content- and bias-review committees and for meeting logistics
guidelines were provided. Review committees were recruited consistent with Smarter Balanced
assessment participation policies.
16) Conducted Content and Bias/Sensitivity Reviews of Passages and Stimuli
Feedback from educators and other Stakeholders regarding passage/stimulus accuracy,
alignment, appropriateness, accessibility, conformance to passage/stimulus specifications and
style guides, and potential bias and sensitivity concerns was obtained. Educator feedback was
documented, and procedures for feedback-reconciliation review were made.
17) Conducted Content and Bias/Sensitivity Pilot and Field Item and Task Review Meetings
Feedback from educators and other Stakeholders regarding item/task accuracy, alignment,
appropriateness, accessibility, conformance to item/task specifications and style guides, and
potential bias and sensitivity concerns was obtained. Reviews included all aspects of
items/tasks (stem, answer choices, art, scoring rubrics) and statistical characteristics.
18) Developed Translation Framework and Specifications Languages
Definitions of item/task translation activities that ensure consistent and valid translation
processes consistent with Smarter Balanced policy were produced. Review and approval of this
process by the ELL Advisory Committee was made.
19) Translated Pilot and Field Test Items and Tasks into Identified Languages
Items/tasks translated into the specified languages were edited in sufficient quantity to support
both Pilot- and Field-testing and operational assessments. Items/tasks included a full array of
Smarter Balanced item types (selected-response, constructed-response, technology-enhanced,
performance tasks). Review for content and bias/sensitivity of item/tasks and passages/stimuli
was conducted.
20) Developed Content and Bias/Sensitivity Field Test Item and Task Review Materials
Supporting materials that ensure consistent training for content- and bias-review committees
and meeting logistics guidelines were developed.
21) Revised Field Test Items and Tasks Based on Content and Bias/Sensitivity Committee Feedback
Fully revised items/tasks were available to be included on Field Test forms. Review panels were
identified and convened, and training of state-level staff to edit and improve items/tasks that
included all aspects of items/tasks (e.g., art, scoring rubrics) was conducted.
22) Developed Translation Framework and Specifications Languages
Definitions of item/task translation activities that ensured consistent and valid translation
processes consistent with Smarter Balanced policy were created and approved by the ELL
Advisory Committee.
23) Translated Pilot and Field Test Items and Tasks into Identified Languages
Translated items/tasks written by vendors, teachers, or provided through state submissions were
edited in sufficient quantity to support Pilot and Field Tests and operational assessment.
SMARTER BALANCED TECHNICAL REPORT
30
24) Developed Content and Bias/Sensitivity Field Test Item and Task Review Materials
Review materials that ensure consistent training for content- and bias-review committees and
meeting logistics guidelines were created. Feedback from educators and other Stakeholders
regarding item/task accuracy, alignment, appropriateness, accessibility, conformance to
item/task specifications and style guides, and potential bias and sensitivity concerns was
obtained.
25) Produced a Single Composite Score Based on the CAT and Performance Tasks
A dimensionality study was conducted to determine whether a single sale and composite score
could be produced or if separate scales for the CAT and performance task components should
be produced. Based on the Pilot Test, a dimensionality study was conducted and the results
presented to the Smarter Balanced Technical Advisory Committee. A unidimensional model was
chosen for the Smarter Balanced Field test.
26) Investigated Test Precision for the CAT Administrations
An investigation of targets was conducted for score precision in the case in which tests are
constructed dynamically from a pool of items and a set of rules must be established for the
adaptive algorithm. A number of supporting simulation studies were conducted. The findings
were used to inform subsequent test design for the operational CAT that was presented to the
Smarter Balanced Technical Advisory Committee.
27) Selected IRT Models for Scaling
Using the Pilot Test data, the characteristics of various IRT models for selected- and constructed-
response items were compared. The results of this study were presented to the Validation and
Psychometrics/Test Design Work Group and the Smarter Balanced Technical Advisory Committee
for comment. The two-parameter logistic (2-PL) model for selected-response and the
Generalized Partial Credit (GPC) Model for constructed-response were chosen as the scaling
models.
SMARTER BALANCED TECHNICAL REPORT
31
References
Abedi, J. (2010). Performance Assessments for English Language Learners. Stanford, CA: Stanford
University, Stanford Center for Opportunity Policy in Education.
American Institutes for Research (2014). Smarter Balanced Scoring Specification: 2014–2015
Administration.
Center for Universal Design (CUD). (1997). About UD: Universal Design Principles.
http://www.design.ncsu.edu/cud/about_ud/udprincipleshtmlformat.html (accessed
February 13, 2009). Archived at http://www.webcitation.org/5eZBa9RhJ.
Cohen, J. & Albright,L. (2014). Smarter Balanced Adaptive Item Selection Algorithm Design Report.
May 9, 2014.
Dana, T. M., & Tippins, D. J. (1993). Considering alternative assessment for middle level learners.
Middle School Journal, 25, 3-5.
DeMauro, G. E. (2004). Test Alignment Considerations for the Meaning of Testing. Paper presented
at the CCSSO Annual Conference on Large Scale Assessment, Boston, MA.
Fadel, C., Honey, M., & Pasnik, S. (2007, May). Assessment in the Age of Innovation. Education Week. May 18, 2007. Retrieved on July 2, 2012 from:
http://www.edweek.org/ew/articles/2007/05/23/38fadel.h26.html?print=1.
Folk, V. G. & Smith, R. L. (2002). Models for Delivery of CBTs. In C. Mills, M. Potenza, J. Fremer, & W.
Ward (Eds.). Computer-Based Testing: Building the Foundation for Future Assessments (pp.
41-66). Mahwah, New Jersey: Lawrence Erlbaum Associates.
Gibson, W. M. & Weiner, J. A. (1998). Generating Random Parallel Test Forms Using CTT in a
Computer-Based Environment. Journal of Educational Measurement, 35, 297-310.
Hetter, R. D. & Sympson, J. B. (1997). Item Exposure Control in CAT-ASVAB. In W.A. Sands, B. K.
Waters, & J. R. McBride (Eds.). Computerized Adaptive Testing: From Inquiry to Operation (pp.
141-144). Washington, DC: American Psychological Association.
HumRRO (2014). Smarter Balanced Assessment Consortium Alignment Study Report. December 30,
2014.
Luecht, R. M. (1998). Computer-Assisted Test Assembly Using Optimization Heuristics. Applied Psychological Measurement, 22, 224-236.
Kane, M., & Mitchell, R. (1996). Implementing Performance Assessment: Promises, Problems, and
Challenges. Mahwah, NJ: Lawrence Erlbaum Associates.
Martone, A., & Sireci, S. G. (2009). Evaluating Alignment Between Curriculum, Assessment, and
Instruction. Review of Educational Research, 79, 1-76.
Muraki, E. (1992). A Generalized Partial Credit Model: Application of an EM Algorithm. Applied Psychological Measurement, 16, 159-176.
Reckase, M. D. (2003). Item pool design for computerized adaptive tests. Paper presented at the
National Council on Measurement in Education, Chicago, IL.
Rose, D., & Meyer, A. (2000). Universal design for learning, associate editor column. Journal of Special Education Technology 15 (1): 66-67.
Schmeiser, C. B., & Welch, C. J. (2006). Test Development. In R. L. Brennan (Ed.) Educational Measurement, 4th Edition (307-353). Washington, DC: American Council on Education.
SMARTER BALANCED TECHNICAL REPORT
32
van der Linden, W. J. (2005). Linear Models for Optimal Test Design. New York: Springer.
Webb, N. L. (1997a, April). Research Monograph No. 6. Criteria for Alignment of Expectations and Assessments in Mathematics and Science Education. Washington, DC: Council of Chief State
School Officers.
Webb, N. L. (March 28, 2002) Depth-of-Knowledge Levels for Four Content Areas, unpublished
paper.
Zhang, T., Haertel, G., Javitz, H., Mislevy, R., Murray, E., & Wasson, J. (2009). A Design Pattern for a Spelling Bee Assessment for Students with Disabilities. A paper presented at the annual
conference of the American Psychological Association, Montreal, Canada.