Embed Size (px)
Citation preview
1
Social Investment in Times of Crisis: A Quiet Revolution or a Shaken Welfare Capitalism?
Overview report on social investment, welfare performance on the level of the nation state – including typology and welfare challenges.
University of Bologna
• Riccardo Prandini • Matteo Orlandini • Alice Guerra
Deliverable 3.1.
2
TABLE OF CONTENTS
Introduction » 3
1. The emergence of the Social Investment paradigm. Re-entering social-democracy
(State) and neo-liberalism (market) in social investment or investing in new actors,
resources and governance?
» 5
1.1. “Temporal Horizons”. From the present to the future, from consuming to
investing policies.
» 6
1.2. “Factual issues”. From repairing to preparing, from passivity to activity, from
compensating to promoting.
» 9
1.3. “Social vision”. From the Principal-Agent model to social poliarchy; from
standardised social services to personalized social services.
» 12
2. Which policies are we considering? Definitions, operationalisations and research
strategy for data analysis.
» 20
2.1. Four different ways to operationalise the social investment definitions » 22
2.2. A strategy of social investment and compensatory-related expenditure
research
» 27
3. Data Analysis. Social spending: different analytical strategies and different
results
» 31
3.1. Total Social Expenditure: the European countries dualisation » 31
3.2. Three areas and cluster of Social Investment: a comparison between
quantitative and qualitative research.
» 35
3.3. Compensation and investment policies: is the shifting from compensating
policies to social investment really happening?
» 41
3.4. Life-course: working age recalibration, childhood and old age reinforcement. » 49
4. Conclusion. A social investment convergence in Europe or a quiet and uneven
revolution?
» 52
References » 55
3
Introduction
The purpose of this report is to analyse and understand whether and how, in the last
twenty years, the EU member countries have to one extent or another adopted welfare
systems which incorporate aspects of social investment.
We undertake a quantitative, comparative study of social investment strategies across
the 28 member states. The aim is to map out and explore the effectiveness of different
social investment strategies. To some extent this builds upon Hemerijck’s recent work and
our key challenge in designing WP3 is to show how we can make a contribution beyond
previous analysis. An overview of macro-level welfare performance indicators consist of a
review of available macro-indicators to assess welfare performance in the light of social
investment decisions. During this stage a typology of social investment at nation state level
is discussed. This typology considers and updates existing models.
By a social investment/welfare synthesis we mean an approach that «stresses the case
for considering certain parts of employment and social policies — and possibly other policy
areas, such as education — as entailing investments improving prospects for future
employment and social participation, together with more social cohesion and stability …
thus stressing the life course dimension of social policies and their long-term benefits for
society». (European Commission, 2013a: 3)
The period under review has been divided into three phases, linked to specific events
characterising the life of the EU. The first lasted from 1994 to 2000 and includes the so-
called pre-Lisbon era; the second goes from 2001 to 2007 with the launch and development
of the Lisbon agenda, including objectives already identified as social investment; the third
covers the period of socio-economic crisis and come up to latest data available.
The Report is divided into four closely related parts.
The first part analyses the major theoretical and empirical contributions related to the
social investment paradigm: we consider whether it could be described as a critical and
modernising reworking of the traditional social policy paradigms, for example, Keynesianism
and neo-liberalism, or rather whether it should be conceived as a new paradigm. At the
centre of this first reflection are the temporal, social and factual innovations of this
4
approach that academic literature has not always sufficiently highlighted. Indeed, the
challenge of the Innosi project is to trigger a new reflection on actors, logic, resources and
governance that go beyond the “classical” welfare system.
In the second part, we specify in operational terms what we mean by social investment
and how such innovation may be quantified. We operationalise the measurement of social
investment adopting four different perspectives. The first perspective is simply to establish
the total social expenditure in order to highlight the existence of growth, recalibration or
retrenchment in social spending. The second point of view is related to the distribution of
spending across different social policies. By this means we intend to highlight the distinction
between capacitating versus compensating spending. The third perspective considers social
expenditure contextualised by life-course events in order to verify the trade-off between
policies targeted at the childhood and youth, at the working age and for elderly. The last
perspective analyses three specific areas of social investment, elaborated by European Social
Policy Network.
In the third part we proceed with statistical data analysis addressing our research
questions:
• Is there a real convergence movement towards the social investment paradigm in EU
countries?
• In which countries could we observe this more clearly?
• What are the policy areas most developed?
• Is it true that the typical social investment policies supersede those compensative?
• How are the European welfare states following citizens life cycle in order to support the
human capital creation?
Reflections and conclusions complete this report. In particular, we consider whether or
not the progress of a social investment context in welfare provision represents a quiet and
uneven revolution or a real convergence movement in Europe.
5
1. The emergence of the Social Investment paradigm. Re-entering social-democracy (State)
and neo-liberalism (market) in social investment or investing in new actors, resources and
governance?
The emerging literature on social investment paradigm focuses on two theoretical and
empirical pillars: 1) the development of a knowledge-based economy driven by the
accumulation of specialised skills, tasks and technologies fostered by human capital
(Acemoglu, 2005); 2) the contrast toward the so-called “new social risks” arising from, for
example, an ageing society, changing household structures, workers temporary (or
otherwise) exclusion from labour markets, the acceleration of technological innovations &c.
(Taylor-Gooby, 2004). As Giuliano Bonoli has it «The social investment perspective is
intended to sustain a different economy than that after 1945 – the knowledge-based
economy. In this new economy, knowledge is considered as the driver of productivity and
economic growth. The knowledge-based economy thus rests on a skilled and flexible labour
force, which can easily adapt to the constantly changing needs of the economy but also be
the motor of these changes. The social investment perspective also aims at modernising the
postwar welfare state so as to better address the new social risks and needs structure of
contemporary societies, such as single parenthood, the need to reconcile work and family
life, lack of continuous careers, more precarious forms of contracts and possessing low or
obsolete skills» (Bonoli, 2005).
If Bonoli is correct, social investment highlights and, to a greater or lesser extent,
addresses the necessity to invest in human, social and cultural capital. The challenge to be
met is to make people flourish as competent and skilled workers (and citizens) enabling
them grasp the huge opportunities that an ever more accelerating destructive creation
presents (Sabel, 2011; Prandini and Sabel, 2013).
We can start our reflection on the social investment paradigm, quoting from one of the
first scientific book entirely dedicated to it which tried to design the developmental path of
this new narrative. Morel, Palier and Palme affirmed in their seminal work: «the social
investment approach rests on policies that both invest in human capital development (early
childhood education and care, education and lifelong training) and that help to make
6
efficient use of human capital (through policies supporting women’s and lone parents’
employment, through active labour market policies, but also through specific forms of
labour market regulation and social protection institutions that promote flexible security),
while fostering greater social inclusion (notably by facilitating access to the labour market
for groups that have traditionally been excluded). Crucial to this new approach is the idea
that social policies should be seen as a productive factor, essential to economic
development and to employment growth» (Morel, Palier and Palme, 2012: 2).
Social investment is a new way to design social policies that can be distinguished, per
differentiam, from the two traditional and more relevant approaches of social policy: neo-
Keynesism and neo-liberalism. It differs from both in regards to four dimensions that have
been identified in the literature as characterising policy paradigms: (1) the diagnosis of the
welfare problems; (2) the values and principles pursued; (3) the norms for public action; and
(4) the instruments used (Hall, 1993; Mandin and Palier, 2004).
We would try to stress the innovative features of social investment in a new way, i.e.
utilizing three different points of view: its “temporal horizon” (concerning the temporal
framework of the policy narratives); its “factual issues” (concerning which specific social
policies are stressed and developed) and its “social vision” (concerning the actors involved in
the policies and their governance).
1.1. “Temporal Horizons”. From the present to the future, from consuming to investing
policies.
From the temporal point of view, Keynesianism is founded on a specific notion of time. In
the Keynesian perspective the temporal horizon was specifically focused to the “here-and-
now”. As Jenson (2012) underlined, the “present” was the most important time horizon
because the inequalities, injustices and challenges of the present would be addressed in the
present. That is why Keynesianism was fundamentally based on countercyclical economic
instruments and social policies, designed to promote and sustain the demand-side, notably
through the development of cash-transfer programmes in the form of social insurances
(Morel, Palier and Palme, 2012: 6) and the making up, by government spending, of
7
unemployment resulting from shortfalls in demand. Keynesian social policy used public
spending to alleviate poverty and inequalities and to support demand in the here and now:
“passive” social policies were promoted to compensate the vulnerable (in practice, often the
male breadwinner) for market failure and to replenish the “present” stock of economic,
social and human resources. Society’s future was conceived as similar to the present, or in
other words its future was like a “present” pushed a little ahead. However, Keynesian
policies, intended to protect the economy from economic shocks, were criticised for
protecting the economy from economic changes.
The neo-liberal perspective, developed after the dramatic economic and socio-political
crisis of the seventies, was much more oriented toward the future. Time horizon begun to
enlarge and future comes in. But it was again a “present-future”, that is the projection of the
present time to the next step. For neoclassical economists, high unemployment and low
growth were the consequences of labour market rigidities, i.e. a structured past that need to
be changed in the present for a future and more efficient market structure. Unemployment
was conceived as a microeconomic problem of market distortions linked to strong job
protection, high minimum wages and generous unemployment insurance, that is to past
inheritances which tended to slow down the pace of possible development.
As stated by Morel, Palier and Palme, «Generous social policy was held responsible for
poor job-search motivation and for creating a culture of dependency. The understanding of
the causes of unemployment and slow growth, and thus the remedies put forward,
therefore shifted from a demand-side to a supply-side approach» (2012: 7). In other words,
the past and present features of the social structure are fundamentally seen as obstacles or
constraints to a new “beginning”, to the full deployment of the future. This is not to say, of
course, that the early neo-liberals supposed that the market clearing wage would always be
sufficient to sustain life. On the contrary, Milton Friedman (1962) recommended negative
income-tax – what we would now-a-days call a Citizen’s Income or Basic Income – to
alleviate the poverty of those who were unable to sustain themselves in the labour market.
Note that such a policy is superior to means-tested welfare as it is not withdrawn as the
individual earns, or at least, only at the prevailing rate of taxation, and therefore motivates
employment as a means of improving one’s condition.
8
Notwithstanding Friedman’s farsighted vision, the Basic Income failed to engage political
support, though there are signs that might be changing (Painter, 2015; Story, 2015). While
social policies were not completely modernised, they were rearranged so that a “new”
orientation towards “activation” was given to policies. Less emphasis was placed on
providing income security compensations and more attention was given to provide
incentives to return to the labour market. In the case that the vulnerable were unable to
command sufficient market power to earn a living wage, means tested benefits were made
available.
As underlined by Jenson, unlike Keynesian social policy, which argued for the use of public
spending to alleviate poverty and inequalities and to support demand in the here and now,
«the neoliberal perspective was much more oriented towards the future: the argument
against public spending and public deficits was made in the name of future generations
whose wellbeing should not be mortgaged; and the argument in favour of policies to curb
wage increases, diminish job protection and to increase corporate profit margins was made
in the name of the jobs this would create in the future. As famously stated by former
German Chancellor Hehnut Schmidt: “today’s profits will be tomorrow’s investments, which
will create the jobs for the day after tomorrow”» (Morel, Palier and Palme, 2012: 8). In the
current economic climate, the extent to which this has been achieved remains debatable.
It is worth noting that both the Keynesian and neo-liberal policies as implemented were
political developments of economic paradigms. In the case of Keynesianism, for example,
the principle that the state should intervene in times of economic crisis does not necessarily
imply the state should continually intervene. Also, as we have noted, the ultimate neo-
liberal social welfare policy, Friedman’s suggestion of Negative Income Tax, (Citizens’
Income) remains to be implemented. Neither paradigm was capable of living up to its
theoretical potential because of the shortfall in associated policy.
Which leads us to the concept of social investment. This new paradigm incorporates
elements of both Keynesianism and pure neo-liberal policies. However, rather than explicit
state engagement in addressing unemployment by boosting demand, this approach to social
policy was explicitly conceptualised as an “investment”, which would yield returns not just in
the present (propping up demand) but also in the future (notably through investment in
9
human capital). Public policies put forward for achieving those new goals are different (from
the Keynesian approach) because their focus is more on the life cycle of individuals, on
stocking skills and capabilities and on the “future” rather than on equality of outcomes in
the “present”. They differ also from the neo-liberal approach, because they insist on
“investment” instead of “cost”.
Here the “future” of society is not conceived as something resulting from freeing society
from inheritances of the past. The main foci of the social investment approach were to
minimise the intergenerational transfer of and to promote the intergenerational
transmission of knowledge rather than at repairing market failures through passive income
maintenance schemes (Cantillon, 2011; Van Lancker and Ghysels, 2012; Taylor-Gooby, Gumy
and Otto, 2015). While, as in the neo-liberal approach, policies focus «on promoting equal
opportunity in the present (by facilitating access to education and training and to the labour
market), this is expected to produce benefits in the future in terms of a reduction in the
intergenerational transfer of poverty and inequalities, but also in terms of economic and
employment growth. Indeed, not only are social policy and economic growth seen as
mutually reinforcing, social policy is in fact seen as a precondition for economic growth»
(Morel, Palier and Palme, 2012: 11).
In a nutshell, social investment appears to be a new social policy paradigm well adapted
to an accelerated changing society where the most relevant time horizon is that of “the
future” and where the most relevant activities are conceived as “investment” on human
capital. However, our consideration of Keynesianism and neo-liberal policies warns us that
however theoretically capable any social paradigm is, the benefits will be realised through
careful implementation. We have seen how two previous welfare approaches have failed to
realise their theoretical promise because of misapplication.
1.2. “Factual issues”. From repairing to preparing, from passivity to activity, from
compensating to promoting.
If we consider the core theme of social investment policies, we can observe a clear shift
toward preparation, activation and promotion of human flourishing. These shifts displays
10
the dramatic orientation of social policies towards the “individuals” – especially women,
young people, not occupied, etc. – in order to capacitate and to endow them with human,
social and economic capital.
In practice, if not in theory, Keynesianism promoted employment and social policies that
basically supported the traditional household structure (male breadwinner model) in which
men’s employment opportunities were central, while women and children benefited from
social benefits (through their familiar relationship). The basic political issues of Keynesianism
were “social equality”, jobs for the breadwinner, de-commodification of social rights,
policies supporting demand, development of social insurance and schemes for income
maintenance, unemployment compensation. As Charles Sabel argues: «In the traditional
welfare state the risks to citizens of participating in the market economy were mitigated by
(nearly) fixed regulatory rules, transfer payments and standard services to educate, heal,
incarcerate and rehabilitate “typical” client populations. The regulations protected the
citizen against harms ranging from food poisoning to financial fraud to polluted air. Transfer
payments, via social insurance systems, redistributed gains from market winners to market
losers, assuring the latter something close to a decent existence no matter how they fared in
competition. Standard services equipment allowed young persons, in theory regardless of
their family background, to join the labour force at a level commensurate with their
capabilities, and older ones to re-join it after some misfortune forced temporary exit»
(Sabel, 2005: 119).
However much Keynesian policy sought to protect the unfortunate from the vicissitudes
of market failure, it also slowed the rate at which the economy could respond to necessary
change. Further, it arguably removed the incentive of economic progress from the individual
and placed it on the state. In contrast, neo-liberalism could be observed as a response to the
breakdown of social security based on hierarchy, command and control assumptions. In the
public sector this signified basically to “privatise” in two senses: a) to allow private providers
to bid to own formerly publicly services; b) to contractualise public services (i.e.to deliver
public services). In an attempt to reconcile private (in many cases foreign) profit with public
good, such contracts required the setting of elaborate and precise goals and carefully
incentivising public or private actors to meet them.
11
As Morel, Palier and Palme argue: «While social policies were not dismantled as such, a
new orientation towards activation was given to social policy. Less emphasis was placed on
providing income security and more focus was placed on providing incentives (in a more or
less coercive fashion) to return to the labour market» (2012: 9). The new social policy key
words became those of “activation and workfare”, “deregulation of the labour market”,
“dismantling old welfare state structures”, etc. Public social expenditure, and the welfare
state in general, became seen as costs and cause of slow growth.
While the basic welfare Keynesian institutions were strongly criticised, the accelerated
process of globalisation undermined the power each of these mitigating institutions. As
Sabel observes: «In a world where markets change too rapidly for firms to design and build
products by traditional, centralised means, it is also impossible for centralised authorities to
write rules protecting the public against risks associated with the new products and services.
As for the system of transfer payments, the new conditions of competition wreak havoc with
the actuarial assumptions matching payers to payees: unemployment insurance, for
instance, typically anticipated seasonal or cyclical downturns, not structural crises that
dislocated entire industries. Put another way, much economic risk became non-actuarial: so
unpredictable that it is impossible to insure against it. In theory public services might have
assumed some of the burden, preparing citizens in various stages of life to mitigate on their
own, or with their families, risks against which they could no longer be insured. But just as
the demands on them were growing, standard public services failed as “clients”’ needs
became more and more differentiated» (Sabel, 2005: 120).
The impossibility to cope with non-actuarial risks is the challenge every welfare state has
to face. Neo-liberalism reacts by trying to capitalise every kind of social and economic
resources, through processes of commodification, marketisation, new public management
culture, etc. It is assumed, in short, that if human agents prefer not to take risks, a business
opportunity, for example, insurance, will exist to mitigate that risk. However, as noted
above, risks less easily quantifiable. Further, commodification and marketisation will not
necessarily lead toward a real investment strategy because it lacks the central issue of social
investment orientation, that is publicly tackling the intergenerational transfer of poverty.
Markets have a tendency to reward those whom they have already blessed. As Milton
12
Friedman recognised, the free-market cannot address the lack of market power which the
vulnerable face. Thus we require policies addressing this lack of market power, beginning
with a “sure start” in the early child care and continuing to develop policies aiming at
generating human capital for all the citizens (Morgan K.J., 2009).
According to the social investment paradigm, none of the traditional forms of “passive”
social policy intervention are able to cope with the needs of the new economy, the so-called
“knowledge economy”. Within this new narrative it is argued that, if a nation is to succeed, it
is necessary to have a highly skilled and educated workforce, which can quickly adapt to the
constantly changing needs of the economy, and which is also the motor of this change
thanks to its creative and innovative potential. In this thinking, «unemployment is linked to a
lack of adequate skills to fill today's jobs, and this lack of adequate skills and education is
also expected to stymie future economic growth and employment creation, unless the
necessary investments are made to foster human capital development» (Morel, Palier and
Palme, 2012: 9). In this context, central to this modernisation of welfare systems is the need
to “prepare” the population to prevent certain social and economic risks associated with
changing employment conditions and family patterns, and to minimise the intergenerational
transfer of poverty, rather than seeking to prevent economic shocks or “repairing” the
consequences of “shocks” through passive income maintenance schemes. At the core of the
social investment approach to welfare policies lies the idea that welfare systems must invest
in robust and resilient human capital rather than in passive cash transfers. As Dräbing,
Hemerijck and Eichhorst state:«Social investment acknowledges the social rights attached to
citizenship however, deviates from the idea that social policies should only decommodify.
Instead social investment builds on Sen’s (1999) idea of freedom as the freedom to develop
and subsequent rights to basic capabilities in terms of access to education, labour, etc. Social
investment embraces the idea of enhancing people’s capacities as to develop across the life-
cycle by its focus on education, reconciliation of work and care». (Dräbing, Hemerijck and
Eichhorst, 2013: 3).
1.3. “Social vision”. From the hierarchical model to social poliarchy; from standardised
social services to personalised social services.
13
1.3.1. The social-democratic and liberal-democratic type of Social investment: differences
and similarities of a welfare state’s recalibration.
One of the less analysed difference between Keynesianism/neo-liberalism and Social
Investment paradigms concerns the actors and institutions included in social policies and
their governance. In practice it is taken from granted that: a) Keynesianism is based on a
positive idea of the “Big State” (Morel, Palier and Palme, 2012: 12-13) intervening to develop
social insurances and to prop up demand for stimulating growth; b) neo-liberalism is based
on the idea of Minimal State and on dismantling welfare structures that slow down the pace
of socio-economic development, while compensating, through cash transfers, the losers of
such change.
In other words Keynesianism and neo-liberalism are both strongly embedded in the
modern idea of a welfare state compensating (in positive or negative way) the outcomes of
capitalism: the so-called welfare capitalism. In the view of Wolfgang Streek, capitalism
developed only because countervailing forces preserve it in a precarious balance. Capitalism
can only pursue profits in a prosperous economy – yet the collectivist nature of
corporations, and their relentless pursuit of growth undermines the prosperity on which
they depend. Thus state control is needed to ensure that capitalism’s relationship with
society is symbiotic.
It might seem paradoxical, yet capitalism has greatly benefitted from the rise of counter
movements against the rule of profit and of the market (Polanyi, 1944): «Socialism and trade
unionism, but also the Christian religion, by putting a brake on commodification, prevented
capitalism from destroying its non-capitalist foundations, like trust, loyalty, good faith,
altruism, thrift, solidarity within families and communities, and the like. Also, under
Keynesianism and Fordism, capitalism’s more or less loyal opposition secured and helped
stabilize aggregate demand, especially in recessions. Where circumstances were favourable,
working class organizations even served as a “productivity whip”, by forcing capital to
embark on more advanced production concepts. It is in this sense that Geoffrey Hodgson
(2001) has argued that capitalism can survive only as long as it is not completely capitalist –
14
as it has not yet rid itself, or the society in which it resides, of “necessary impurities”. Seen
this way, capitalism’s defeat of its opposition may actually have been a Pyrrhic victory,
depriving it of countervailing forces which, while sometimes uncomfortable, had in fact
supported it». (Streeck, 2014: 54-55). Western welfare capitalism has developed in the
twenty century as a fragile socio-economic and political regime strongly based on the
balance between State and market, their actors, institutions, relationships. Very recently
Maurizio Ferrera has interpreted the developments of the European welfare capitalism as
“liberal neo-welfarism”, that is to say a sort of merging between Keynesism and neo-
liberalism (Ferrera, 2013). Charles Sabel argues and demonstrates that both Keynesism and
neo-liberalism (top-down policies) – from one side – and “interactive governance” (bottom-
up policies) on the other side, are based on the same organisational rules. Top-down policies
assume a purported ‘straight-line’ accountability from voter to administrative agent and
require the separation of conception (of citizens’ objectives) from execution (state policy) in
public programs. Policies are designed by politically appointed ministers, supported by
expert staff and hired consultants, to determine strategy, and for public service managers,
eventually complemented or supplanted by private contractors. As Sabel affirms, the overall
result is the assumption of a narrow, flat administrative structure where front-line managers
clearly understand their purpose as increasing the satisfaction of the citizens. In practice,
however, the agents of the state might pursue their own objectives.
In bottom-up services, the logic is assumed to be the opposite, at least in theory. Indeed,
interactive governance has a grass-roots aspect: Interactive governance puts control of state
action in the hands of those most immediately affected by it, the users of key services or the
entities subject to regulatory rules. Such control may be exercised through local advisory
councils empowered to instruct, or create alternatives to, local levels of public
administration, or through deliberative bodies making rules for particular sectors or problem
areas.
But, as Sabel states, on another and more fundamental level, top-down and bottom-up
logics are essentially the same: «Both assume that there exists in the polity or in civil society
principals [citizens] who, because of their current situation (as voters, or as the bearers of
some relevant local knowledge) know with high precision what needs to be done, even if
15
they cannot fully solve some problem in advance of any effort actually to do so. Accordingly,
the chief problems for governance are identifying the knowledgeable actors and devising
institutions that keep the agents that execute tasks firmly under the control of these
principals who, correctly, conceive them. In the case of interactive governance this leads, at
the limit, to collapsing execution into conception (principals as their own agents, or the
public equivalent of the owner-operated firm)» (Sabel, 2004: 6).
In a very precise sense, social investment paradigm too could be interpreted as a
recalibration of social-democracy and liberal-democracy. Its intellectual roots lie in the
advocacy of a new type of welfare system that differs radically from both the post-war male
breadwinner, social insurance welfare model and its 1980s neo-liberal successor of labour
market deregulation and welfare retrenchment.
The philosophy underpinning social investment was well explained in a book edited by
Esping-Andersen, Gallie, Hemerijck and Myles in 2002, Why We Need a New Welfare State.
They endorsed the view that «the single greatest challenge we face today is how to rethink
social policy so that, once again, labour markets and families are welfare optimizers and a
good guarantee that tomorrow’s adult workers will be as productive and resourceful as
possible» (Esping-Andersen et alia, 2002: 25).
In terms of intellectual roots, Jenson (2009, 2012) regards social investment as a new
paradigm, differing from neo-liberalism and Keynesianism in its means, goals and underlying
ideas. But in academic debate, social investment is commonly conceived both as “social-
democratic” or as a so-called “Third Way” social investment (more likely to be found in
liberal countries, e.g Uk and Irelant, than the social-democratic variant) (Jenson, 2012).
Third Way social investment is an inclusive liberal version, focusing on investments in
education, early childhood education, training, and equity across the life-cycle. It does not
seek to reduce the advantage enjoyed by those with social capital, but rather to address the
shortfall of those without. On the labour market, flexsicurity1 can go along with corporatist
partnerships (but not necessarily). There is some awareness of gender-related questions.
The social-democratic social investment type, conversely, distinguishes itself by coupling
1 Flexicurity is a policy strategy that attempts to enhance the flexibility of labour markets, the work organisation and labour
relations on the one hand, and to enhance security notably for weaker groups in and outside the labour market on the other hand (Wilthagen and Rogowski, 2002).
16
social protection and human capital investment in an attempt to address future and present
inequality. In addition, in terms of focusing on children, this social investment type stresses
human capital accumulation and the child as a citizen. Flexicurity is combined with an
engagement of unions and public policies for job creation. Gender equality has also a centre
stage in this social investment approach (Mahon, 2012). Contrary to neoliberalism, the social
investment perspective is based on a more positive theory of the state. While the state is
still portrayed as a dynamic entrepreneur, it is an entrepreneur in the production of a
workforce, rather, as under Keynesianism, than in the goods and services required by a
modern society. Thus «the state is assigned a key role in fostering the development of
human capital (through investments in education and training) and in providing the
necessary services and benefits to help make efficient use of human capital and to avoid
human capital depletion» (Morel, Palier and Palme, 2012: 10).
The most debated and developed scientific definition of social investment was elaborated
by Morel, Palier and Palme (2012: 2): social investment rests on policies that both invest in
human capital development (early childhood education and care, education and lifelong
learning) and that help to make efficient use of human capital (through policies supporting
women’s and lone parents’ employment, through active labour market policies, but also
through specific forms of labour market regulation and social protection institutions that
promote flexible security), while fostering greater social inclusion (notably by facilitating
access to the labour market for groups that have traditionally been excluded). Thus, social
policies should be seen as a productive factor, essential to economic development and to
employment growth.
1.3.2. Beyond the liberal neo-welfarism: the European Commission’s challenge to enlarge the
definitions and practices of Social Investment
This definition is in line with the definition of the European Commission in its
Communication of social investment for growth and social cohesion (2013b: 3). It is worth to
notice that the approach to social investment of the European Commission has two very
important features.
17
1) Welfare systems fulfil three functions: a) social investment, b) social protection and c)
stabilisation of the economy. Social investment is only one of these three functions and
involves strengthening people’s current and future capacities. In other words, as well as
having immediate effects, social policies also have lasting impacts by offering economic and
social returns over time, notably in terms of employment prospects or labour incomes. In
particular, social investment helps to “prepare” people to confront life’s risks, rather than
simply “repairing” the consequences: «Modernisation of social policies requires systematic
introduction of ex-ante result orientation in financing decisions and a systematic approach
of the role social policies play in the different stages in life: from education via
work/unemployment to sickness and old-age» (Ibidem: 3).
2) The European Commission definition stresses the role of other actors than state and
markets, because private and third sector resources are supposed to be required as a
complement or agent of public policy. This distinguishes even Innosi definition from social-
democratic and liberal-democratic social investment paradigms in that we assume resources
for social policies are not limited to those from the public sector. A non-negligible part
comes from people and families. In addition, non-profit organisations provide social services
on a substantial scale: «These range from homeless shelters, support for the elderly, people
with disabilities, to advice centres on social benefits in general. Social enterprises can
complement public sector efforts, and be pioneers in developing new markets, but they
need more support than they are receiving now. The for-profit parts of the private sector
would need to be further encouraged to use the potential of social investment through, for
instance, a healthy and secure social and working environment. This is not limited to
Corporate Social Responsibility alone and includes for example on the job training, in-house
childcare facilities, health promotion and accessible and family-friendly workplaces».
(Ibidem: 5).
Thus, social investment is not conceived as a new “complete” social policy paradigm, but
as a well-defined part of new and innovative welfare system (or regime): «Well-designed
welfare systems combining a strong social investment dimension with the other two
functions, protection and stabilisation, increase the effectiveness and efficiency of social
policies, whilst ensuring continued support for a fairer and more inclusive society. In
18
particular, the modernisation of social policies entails giving activation measures a more
prominent role. This enables people to actively anticipate to the best of their abilities in
society and the economy». (Ibidem: 3).
It is argued that «social investment policies reinforce social policies that protect and
stabilise by addressing some of the causes of disadvantage and giving people tools with
which to improve their social situations» (Ibidem:3). These policies can strengthen people’s
skills and capacities, prepare them for confronting or preventing risks over the life course
and improve their future prospects.
In the Social Investment Package (2013), there is a strong focus on the various risks that
people may face at different stages of their life courses. For example, social disadvantages in
youth can exacerbate risks at later stages of life. It is well known, for example, children from
low-income backgrounds are likely also to earn low incomes when they get older. Early
interventions in peoples’ life courses are the most effective social investments to tackle
social exclusion (European Commission 2013a). Therefore, the Social Investment Package
seeks to mitigate disadvantage and ‘break the cycle of disadvantage’ (European Commission
2013c).
As school years are essentially formative for children’s cognitive and social skills,
educational intervention policies must focus on pre-school education; primary and
secondary curricula; access to quality education; reducing early school-leaving, and the
promotion of vocational, scientific and technological education. Additionally, vulnerable
parents require support in their capacities and resources to invest in their children
(Vandenbroucke, Hemerijck and Palier, 2011; European Commission 2013a, 2013b). «Active
training and mobility policies can only be effective if they complement a strategy of
prevention and this means, once again, the need for major social investments in childhood
and youth» (Esping-Andersen, 2002: 30).
A crucial component of this new social investment paradigm is the provision of
capacitating social services – from education and training through activation to child and
elder care – aimed at the early identification of problems and at equipping an ever more
diverse citizenry to surmount the increasingly uncertain – and thus less insurable in a strict

19
actuarial sense – risks they face in the labour market and the life course. To respond
effectively to these non-actuarial risks, such capacitating services must also be tailored or
customised to the needs of individuals and groups, typically by bringing together specific and
continuously adjusted bundles of assistance from different policy domains (e.g. educational,
psychological, and family services in the case of learning disabilities, or mental health,
substance abuse, housing, child care, and training services in the case of unemployment). As
Charles Sabel puts it «New public services are so idiosyncratic and mutable that they have to
be “co-designed” by client users if they are to be useful at all. Financing for new public
services is not, of course, automatic. The defining difference is simply that the free rider
problem in new public goods is no more important than the problem of specifying the
service in the first place» (Sabel, 2005: 121). Capacitating social services emphasises that
people are not passive recipients, but have assets which can help improve services and co-
produce them in each stage of the provision process (assessment, planning, commissioning,
monitoring, evaluation) (Needham and Carr, 2012).
20
2. Which policies are we considering? Definitions, operationalisations and research
strategy for data analysis.
It is exactly in the intersections between the new welfare regimes requested from the
Social investment approach (going beyond the Principal-Agent model toward a real welfare
societal poliarchy) and the necessity to design new social services in a personalised manner,
that the Innosi elaborates its innovative project.
We adopt, as a working definition for social investment one proposed by the European
Commission:
The social investment approach stresses the case for considering certain parts of
employment and social policies — and possibly other policy areas, such as education
— as entailing investments improving prospects for future employment and social
participation, together with more social cohesion and stability … thus stressing the life
course dimension of social policies and their long-term benefits for society. (European
Commission, 2013a: 3).
Innosi Project decided to adopt a thick definition of Social investment, that is an approach
to public policy which perceives welfare spending as a form of investment and anticipates
social return on investment:
• concretely it maximises human capital;
• encourages active labour market and social participation, and thus promotes social
cohesion and stability.
From a social investment perspective, social policy is understood to be a productive factor
which
• help non-working people (back) into employment,
• complement work income for the working poor,
• enable parents to reconcile career and family life,
• promote gender equality,
• support child development and to provide social services for an ageing society.
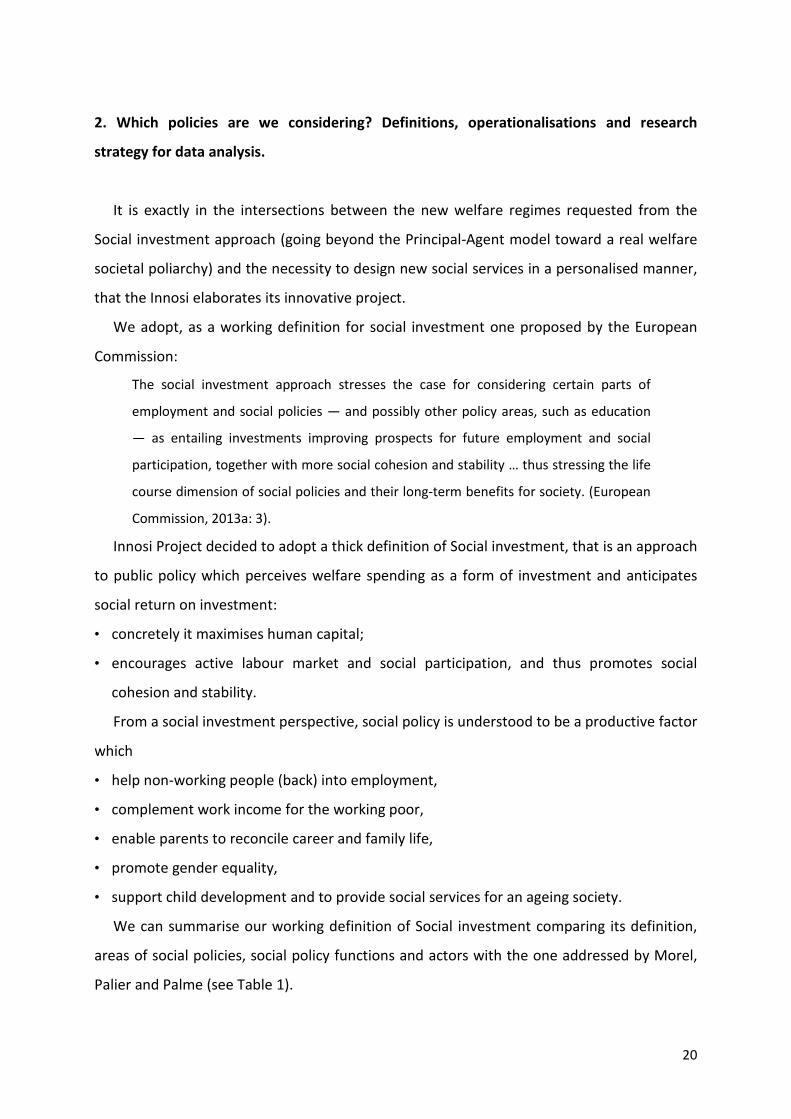
We can summarise our working definition of Social investment comparing its definition,
areas of social policies, social policy functions and actors with the one addressed by Morel,
Palier and Palme (see Table 1).
21
Table 1 - Working definitions of Social investment
Innosi Project Morel, Palier and Palme
Definition SI is an approach to public policy which perceives welfare spending as a form of investment and anticipates social return on investment: a) Concretely maximizing human capital; b) Encouraging active labour market and social participation thus promoting social cohesion and stability.
The SI approach stresses the case for considering certain parts of employment and social policies — and possibly other policy areas, such as education — as entailing investments improving prospects for future employment and social participation, together with more social cohesion and stability, thus stressing the life course dimension of social policies and their long-term benefits for society. (European Commission ,2013a: 3)
SI is an emerging policy paradigm that is rising to the same level as the Keynesian and neo-liberal paradigms. Social policy is a pre-condition for economic growth and job creation. Social policies have a positive economic role: they invest in human capital to increase employability and employment level, to support labour market fluidity (flex-security), to prepare for the “knowledge-based economy. (Morel, Palier and Palme, 2011: 12-13)
Areas of
Social Policy
SI concerns social policies about: 1) Support for early childhood development + Early childhood education and care; 2) Family benefits + Parenting services + Support for parents’ labour market participation + Childcare + Long-term care + Maternal, paternal, parental leave schemes. 3) Policy measures to address social and labour market exclusion + Unemployment benefits + Minimum income + Active labour market policies + Social Services 4) Other social investment area.
SI rests on policies that both invest: 1) in human capital development (early childhood education and care, education and lifelong learning); 2) and that help to make efficient use of human capital (through policies supporting women’s and lone parents’ employment, through active labour market policies, but also through specific forms of labour market regulation and social protection institutions that promote flexible security), 3) while fostering greater social inclusion (notably by facilitating access to the labour market for groups that have traditionally been excluded).
Services vs
benefit
Distinction between: - “service-oriented” capacitating welfare provisions; - “benefit-transfer” compensating social spending categories.
Social Policy
functions
From a SI perspective, social policy is understood to be a productive factor, a) help non-working people (back) into employment, b) complement work income for the working poor, c) enable parents to reconcile career and family life, d) promote gender equality, e) support child development and to provide social services for an ageing society.
1) easing the «flow» of contemporary labour market transitions; 2) raising the quality of human capital «stock»; 3) upkeeping strong minimum-income universal safety nets as social protection and economic stabilization «buffers» in ageing societies” (Hemerijck, 2014: 18).
Actors Private and third sector resources to complement public efforts; relevant role for social economy (societal poliarchy).
SI mainstream is focused on the role of the State and the market (welfare capitalism).
Governance
Level
Social Innovation linked with SI National
22
2.1. Four different ways to operationalise the social investment definitions.
The next step is to “operationalise” the working definitions for elaborating the data and
to explain our research strategy.
In the literature, there are different ways to operationalise the definition of social
investment. The common reference point is Hemerijck’s seminal work. In his view, three
areas of public policy stand out in the social investment perspective: human capital
improvement, family’s relation to the economy, and activation policies for employment.
«Most studies do not offer a clear-cut definition of social investment, however, commonly,
they refer to public investment aiming at increasing human capital and employability of the
potential and future workforce. Irrespective of the fact that many policies could fall under
this description, education, life-long learning, active labour market policies (ALMP) and early
childhood education and care (ECEC) are at the core of social investment» (Dräbing,
Hemerijck and Eichhorst, 2013: 4).
From this minimal definition, various authors have tried to map the development of social
investment from the statistical point of view. We have chosen to focus on four main
perspective.
The first perspective is the total social expenditure: previous work on this topic have
taken into account all the social spending data to analyse the trade-off between economic
efficiency and welfare protection (Hemerijck et alia, 2013) or the hypothesis of a welfare
retreat (Nikolai, 2012). This first approach is very important for research in the topic as it
considers if there is a new path to public investment (Streeck and Mertens, 2011). We
further consider whether public investments have a decreasing link with the level of GDP.
We also consider whether we can speak meaningfully about a convergence of European
welfare state spending.
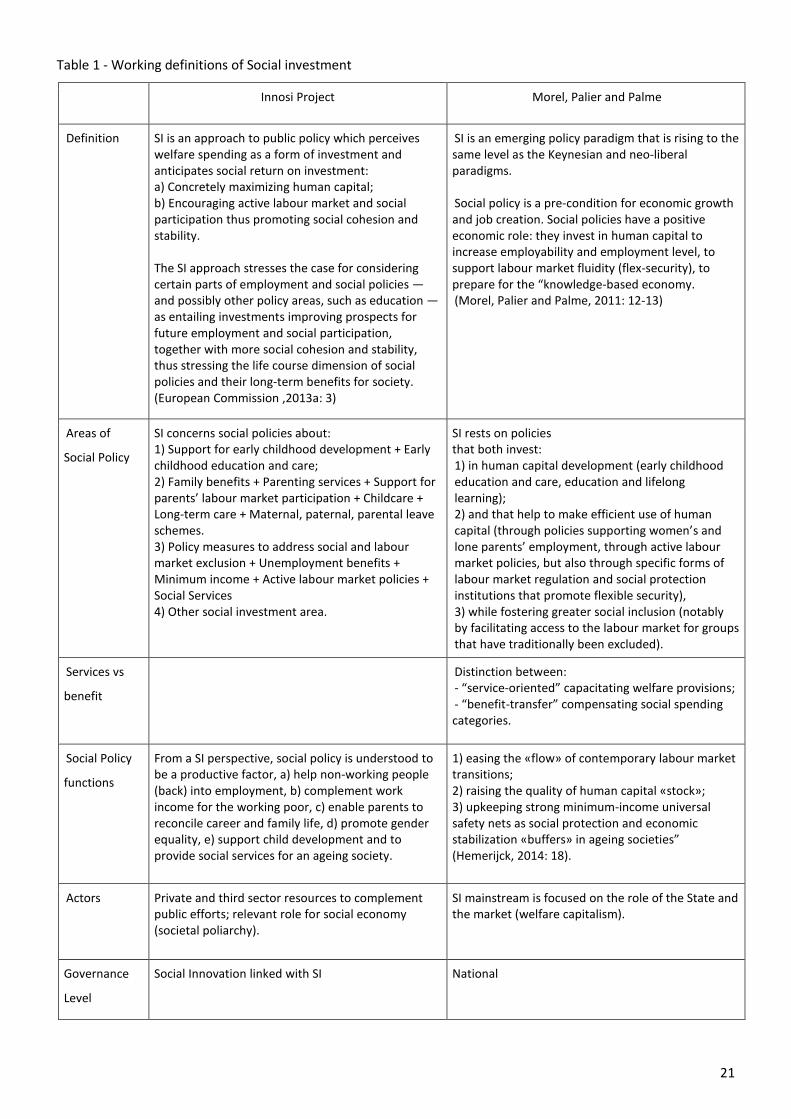
The second perspective is related to the distribution of spending across policies. The most
important distinction is between “service-oriented” capacitating welfare provisions and
“benefit-transfer” compensating social spending categories. Hemerijck uses the terms:
• ‘capacitating service-oriented spending’ to refer to expenditures on active labour market
23
programmes, childcare, education, research, and the rehabilitation of the disabled. (See
Table 2 for a comparison with Nikolai’s work (2012)).
• compensating spending encompasses spending on old age, survivors, disability pensions
(excluding the rehabilitation expenses), and unemployment, thus excluding expenses on
active labour market programmes (Hemerijck, 2013: 264).
Table 2 - Capacitating and compensating spending for Hemerijck and Nikolai
Capacitating Compensating
Hemerijck Nikolai Hemerijck Nikolai
Active labour market programs
Active labour market policy
Old Age Old Age
Childcare Family Survivors Survivors
Education Education Unemployment Passive labour market policy
Research Disability pension
Rehabilitation of disabled
This first differentiation can give us two pictures: one portrays social policies against risk
such as unemployment and old age, as consistent with the goal of maintaining the status
differences and with the financing of social security contribution; the other depicts
investment-related social policies «oriented towards provision for the future and the needs
of the younger generations» (Nikolai, 2012: 92).
This insight could be very useful to understand whether, when and in which policies there
is (or was) a point at which European social expenditure changed and switched resources
from old to new social policies.
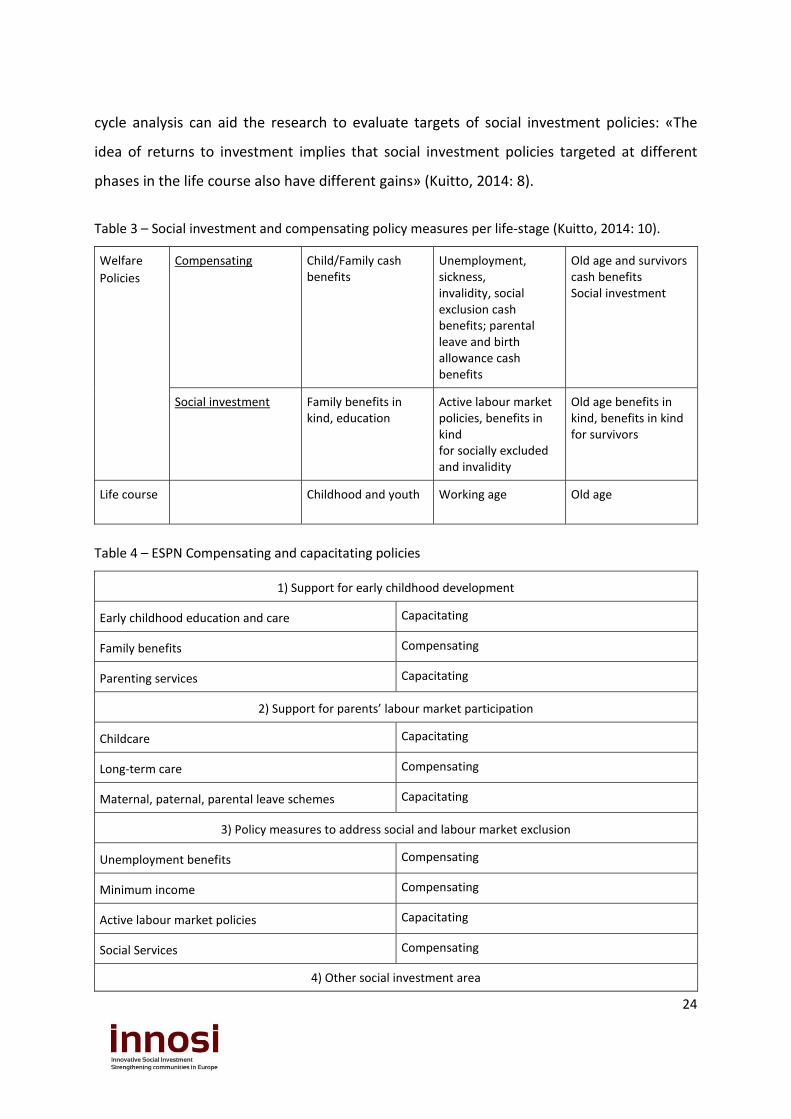
The third perspective is linked to Kuitto’s work on social investment and life cycle. Kuitto
has investigated a second trade-off of welfare policy recalibration: after those between
compensating and investment social policies, she highlighted the trade-off between policies
targeted at the childhood and youth, at the working age and for elderly (Table 3). The life
24
cycle analysis can aid the research to evaluate targets of social investment policies: «The
idea of returns to investment implies that social investment policies targeted at different
phases in the life course also have different gains» (Kuitto, 2014: 8).
Table 3 – Social investment and compensating policy measures per life-stage (Kuitto, 2014: 10).
Welfare
Policies Compensating Child/Family cash
benefits Unemployment, sickness, invalidity, social exclusion cash benefits; parental leave and birth allowance cash benefits
Old age and survivors cash benefits Social investment
Social investment Family benefits in kind, education
Active labour market policies, benefits in kind for socially excluded and invalidity
Old age benefits in kind, benefits in kind for survivors
Life course Childhood and youth Working age Old age
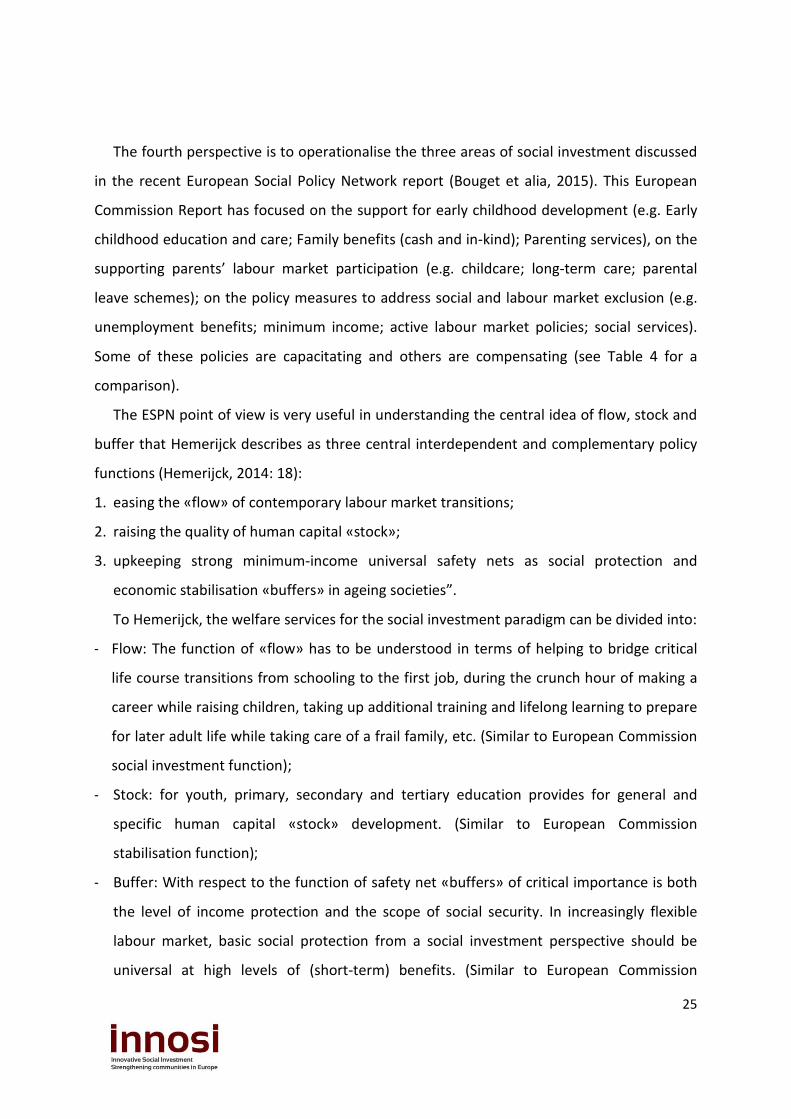
Table 4 – ESPN Compensating and capacitating policies
1) Support for early childhood development
Early childhood education and care Capacitating
Family benefits Compensating
Parenting services Capacitating
2) Support for parents’ labour market participation
Childcare Capacitating
Long-term care Compensating
Maternal, paternal, parental leave schemes Capacitating
3) Policy measures to address social and labour market exclusion
Unemployment benefits Compensating
Minimum income Compensating
Active labour market policies Capacitating
Social Services Compensating
4) Other social investment area
25
The fourth perspective is to operationalise the three areas of social investment discussed
in the recent European Social Policy Network report (Bouget et alia, 2015). This European
Commission Report has focused on the support for early childhood development (e.g. Early
childhood education and care; Family benefits (cash and in-kind); Parenting services), on the
supporting parents’ labour market participation (e.g. childcare; long-term care; parental
leave schemes); on the policy measures to address social and labour market exclusion (e.g.
unemployment benefits; minimum income; active labour market policies; social services).
Some of these policies are capacitating and others are compensating (see Table 4 for a
comparison).
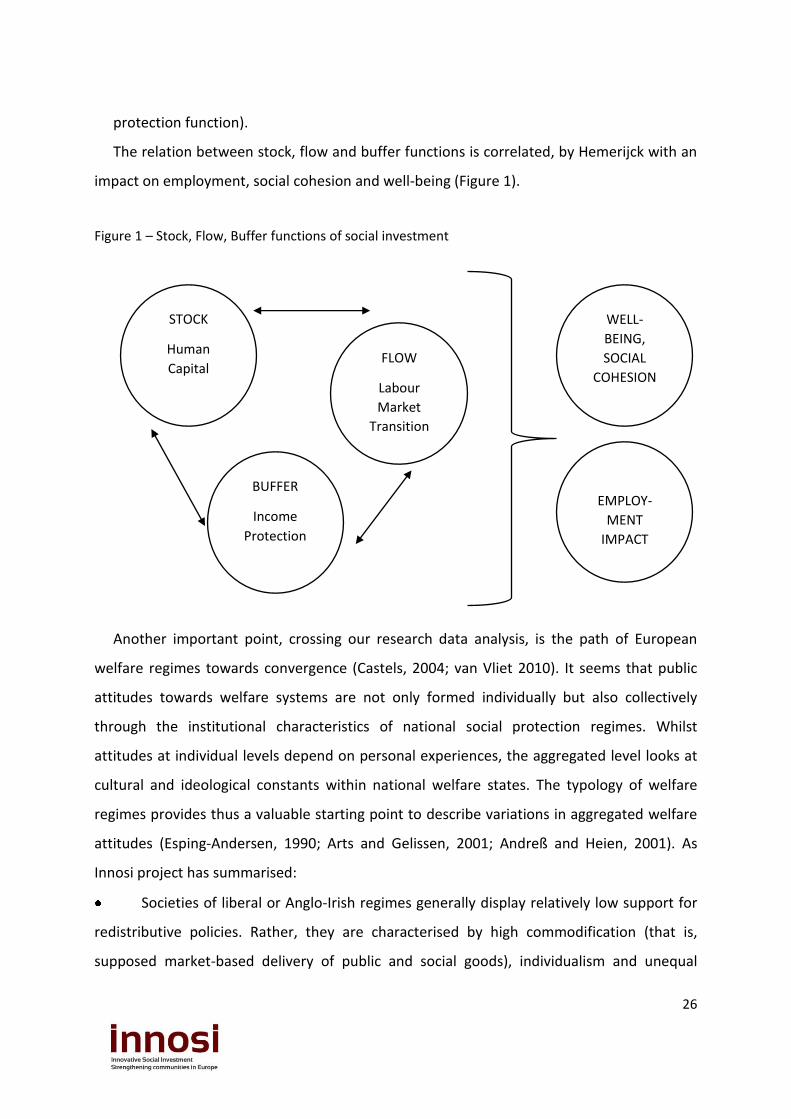
The ESPN point of view is very useful in understanding the central idea of flow, stock and
buffer that Hemerijck describes as three central interdependent and complementary policy
functions (Hemerijck, 2014: 18):
1. easing the «flow» of contemporary labour market transitions;
2. raising the quality of human capital «stock»;
3. upkeeping strong minimum-income universal safety nets as social protection and
economic stabilisation «buffers» in ageing societies”.
To Hemerijck, the welfare services for the social investment paradigm can be divided into:
- Flow: The function of «flow» has to be understood in terms of helping to bridge critical
life course transitions from schooling to the first job, during the crunch hour of making a
career while raising children, taking up additional training and lifelong learning to prepare
for later adult life while taking care of a frail family, etc. (Similar to European Commission
social investment function);
- Stock: for youth, primary, secondary and tertiary education provides for general and
specific human capital «stock» development. (Similar to European Commission
stabilisation function);
- Buffer: With respect to the function of safety net «buffers» of critical importance is both
the level of income protection and the scope of social security. In increasingly flexible
labour market, basic social protection from a social investment perspective should be
universal at high levels of (short-term) benefits. (Similar to European Commission
26
protection function).
The relation between stock, flow and buffer functions is correlated, by Hemerijck with an
impact on employment, social cohesion and well-being (Figure 1).
Figure 1 – Stock, Flow, Buffer functions of social investment
Another important point, crossing our research data analysis, is the path of European
welfare regimes towards convergence (Castels, 2004; van Vliet 2010). It seems that public
attitudes towards welfare systems are not only formed individually but also collectively
through the institutional characteristics of national social protection regimes. Whilst
attitudes at individual levels depend on personal experiences, the aggregated level looks at
cultural and ideological constants within national welfare states. The typology of welfare
regimes provides thus a valuable starting point to describe variations in aggregated welfare
attitudes (Esping-Andersen, 1990; Arts and Gelissen, 2001; Andreß and Heien, 2001). As
Innosi project has summarised:
Societies of liberal or Anglo-Irish regimes generally display relatively low support for
redistributive policies. Rather, they are characterised by high commodification (that is,
supposed market-based delivery of public and social goods), individualism and unequal
STOCK
Human
Capital FLOW
Labour
Market
Transition
BUFFER
Income
Protection
WELL-
BEING,
SOCIAL
COHESION
EMPLOY-
MENT
IMPACT
27
income distribution. There is a distinction and disconnection between those citizens
rewarded for their entrepreneurial self-reliance and those who are stigmatised for reliance
on social assistance. This is justified by the need to ‘incentivise’ self-reliance.
Conservative or Continental regimes combine a strong support for welfare policies
with modest commodification and regressive attitudes towards income differences. Thus,
they are characterised by a strict hierarchical segmentation based on income (mostly of the
male bread-winner). This creates conflicts between the successful – the productive
workforce (insiders) – which supports the unproductive outsiders of the labour market.
Citizens in the social-democratic or Scandinavian countries are assumed to support
comprehensive governmental intervention to ensure social equality and solidarity, and thus
independence from the vagaries of the market. High de-commodification (state provision of
public and social goods) and universal entitlements prevent the social dualism or
segmentation which is an unintentional by-product of other policy regimes. Social conflicts
tend to occur, however, on the basis of gender and sectors – for example, between women
in the public and men in the private sector.
Although Southern European welfare regimes show high commodification, some
forms of social assistance are generous and universal and familial solidarity plays an
essential role for welfare provisions. Citizens of Southern European states have a strong
commitment to institutionalised solidarity, and equality is preferred over equity.
Like the Nordic countries, the Central and Eastern European states have strong
egalitarian traditions without social dualism. For example, in Poland and the Czech Republic
there is a very strong familial solidarity and institutionalized solidarity, as there is in the
Southern European Countries. However, the wider social awareness of citizens is at a
relatively low level and civil society is relatively weak.
2.2. A strategy of social investment and compensatory-related expenditure research
We have to be very careful to use social expenditure data to equate social spending with
welfare state effort, as suggested by Hemerijck and De Deken. The first reason is
methodological: traditionally the measures of social expenditure have been taken as a
28
percentage of GDP, but such measures «do not reflect changes in economic output, policy
change, and spending reallocation, and changes in the size of target populations»
(Hemerijck, 2013: 228). The second reason is linked with preferences of politicians: they act
to protect groups against social risks and not with the level of spending. Third, expenditures
cannot indicate institutional characteristics of welfare states programmes: for instance
«expenditures give an indication of the financial efforts dedicated to labour-market training
and public employment services, but not of benefit sanctions» (van Vliet and Wang 2015,
617). Four, the taxation of social benefits are not taken into account (Adema, Fron and
Ladaique 2011).
In this report, we have decided to work with the Eurostat database to analyse data for 28
member states (Social Expenditure Database (SOCX) – OECD accounts only for 17 EU
nations). The choice of the measure to analyse the total social expenditure and the
distribution of total expenditure across social policies poses challenging but interesting
issues. In the current literature, scholars have predominately used the percentage of GDP as
a measure for social expenditure (see, for example, the studies by Kuitto, 2014, and Nikolai,
2011). However, these studies analyse data until 2007, and do not cover the period 2008-
2013 in which the economic crisis has substantially affected the GDP of the European
Member States. For our analysis that consider the 2008-2013 period, the question that
arises is the following: is it still appropriate to use the percentage of GDP as the unique
measure for social expenditure, even in periods of economic crises? As intuition would
suggest, the answer is that the percentage of GDP becomes a misleading measure for social
expenditures in countries where the percentage variation in GDP during the economic crisis
has been substantially greater than the percentage variation in social expenditures. In our
data, this seems to happen for UK, Ireland and Greece. For similar reasons, the measure of
Euro per inhabitant could become a misleading measure both for social expenditures in
countries where population has substantially changed across periods (e.g. Germany,
Romania and Poland have experienced a decreasing trend in population) and for the
countries that have fluctuations in currency exchange rates.
In our analysis, we have used data at constant prices. This deserves a brief discussion. The
calculation of the annual growth rate of GDP at constant prices, in other words the change
29
of GDP in volume terms, is intended to allow comparisons of the dynamics of economic
development both over time and between economies of different sizes, irrespective of price
levels. It is worth noting that «cross-country comparisons should be made with caution as
notably exchange rate fluctuations may significantly influence the development of nominal
GDP figures when converted into a common currency»2. To evaluate standards of living, it is
more appropriate to use GDP per capita in purchasing power standards (PPS), in other
words, adjusted for the size of an economy in terms of population and also for differences in
price levels across countries. However, PPS figures are in principle suggested to be used for
cross-country comparisons in a single year rather than over time.
In our report we decided to use three measures, the percentage as GDP, euro per
inhabitants and PPS per capita. Even though these measures present some critical points of
interpretation (that, in our opinion, deserve a specific and more detailed investigation) the
former remains the most frequently used measure for the overall size of an economy, and
the second is widely used for a comparison of living standards, or to monitor the process of
convergence across the European Union (EU). By analyzing these measures, we are able to
compare our results with the related literature, and to show some interesting insights from
the analysis of the crisis period.
We decided to highlight three periods of the social investment turn: the milestone is the
Lisbon European Council (March 2000) that set a new strategic goal and rhetoric for
European Union linked with the concept of social investment (Vandenbroucke and Velmickx,
2011). «Employment creation, investing in people and developing an active and dynamic
welfare state will be crucial both to Europe’s place in the knowledge economy and for
ensuring that the emergence of this new economy does not compound the existing
problems of unemployment, social exclusion and poverty» (European Commission, 2000: 8).
The other focal point is the 2008 economic crisis: welfare systems tend to adjust to the crisis
with a first Keynesian reaction and a second neo-liberal retrenchment (Hemerijck, 2013).
Therefore, we present our data in three periods: the period before Lisbon (pre-2000), the
Lisbon era (2001-2007) and after crisis (post-2008).
2 For more details on Eurostat statistics, please see the report at the following link: http://ec.europa.eu/eurostat/statistics-
explained/index.php/National_accounts_and_GDP. For the use of PPS both for Eurostat and OECD see the manual: http://ec.europa.eu/eurostat/en/web/products-manuals-and-guidelines/-/KS-RA-12-023

30
Another important goal is to analyse some specific trends for Innosi countries: UK, Italy,
Spain, Greece, Germany, the Netherlands, Hungary, Poland, Sweden, Finland. We have tried
to suggest some social investment national characteristic in order to give concrete
indications to the case studies research, which will be conducted in the next phase of the
Innosi Project (see Work Package 4).
31
3. Data Analysis. Social spending: different analytical strategies and different results
3.1 Total Social Expenditure: the European countries dualisation.
Public social expenditure is one of the most important and debated indicator for social
investment. Hemerijck outlines that, despite economic changes and policy reforms, social
expenditure levels «as a percentage of GDP have remained relatively stable if not increased
over the last two decades» (2013, 229). He takes into account the public and private social
spending from 1990 to 2007 in the OECD database. Other two observations are useful to a
first data analysis:
• Hemerijck has highlighted that countries with a higher GDP per capita spend more on
social protection: social democratic and continental regimes have a range of spending
between 20% and 30%, while (so-called) liberal countries reach levels below 20% of GDP;
but where the former decreased their spending since 1997, the latter (and Mediterranean
countries) increased their expenditure between 1997 and 2007 (Ibidem, 231; Hemerijck et
alia, 2013: 18).
• At the same time «social spending is not necessarily cyclical» (Hemerijck at alia, 2013: 19):
it is stable in countries with high levels of expenditure, but it is increasing in times of
economic growth for countries with low levels.
Even Nikolai, in her seminal work on social expenditure data, shows that «on an
aggregate level the welfare state is not in retreat (Pierson, 2001) and the data do not display
a “race to the bottom” (Obinger and Starke, 2008) scenario» (Nikolai, 2012: 95). A very
important point in Nikolai’s review is the use of statistical measures of dispersion: in OECD
countries she has found a strong convergence indicated by the declining measures of
variation coefficient (from 0,30 in 1980 to 0,18 in 2007). Furthermore, another indicator
(beta-convergence) explains this increase in similarity with a catch-up process by welfare
policy laggards.
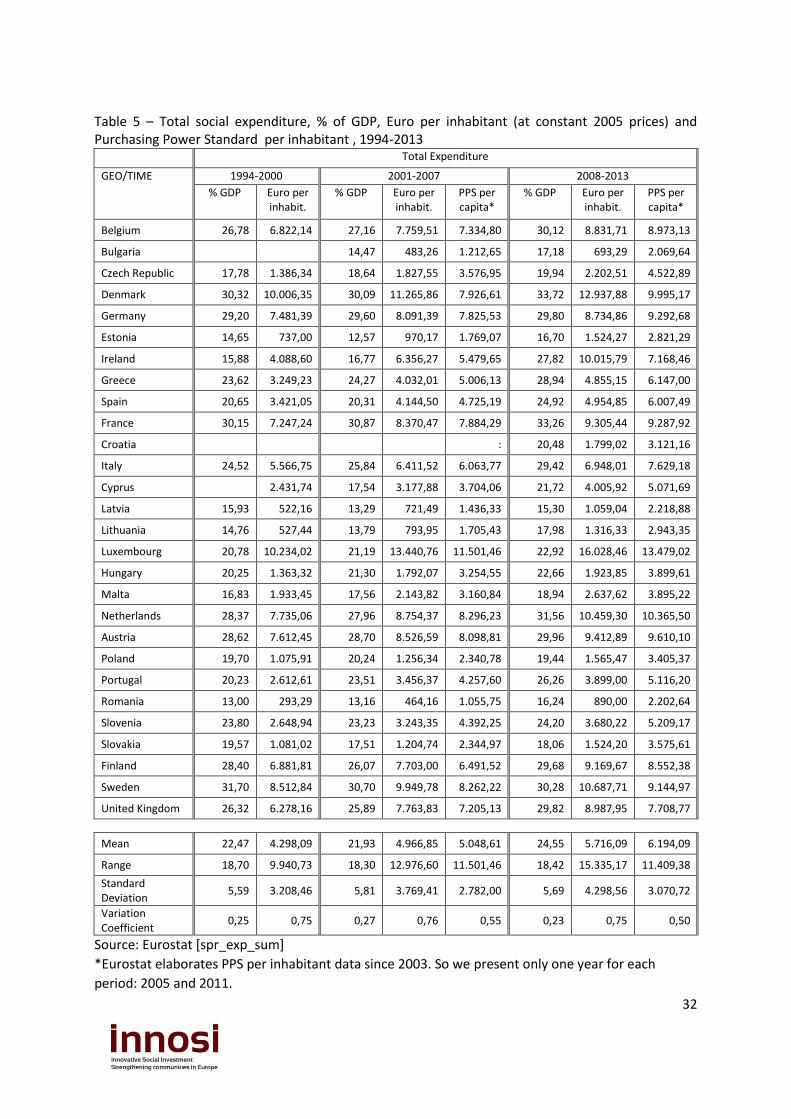
On average, in the period 2008-2013 European member states have spent more than
5.000 euro per inhabitant for welfare policies.
32
Table 5 – Total social expenditure, % of GDP, Euro per inhabitant (at constant 2005 prices) and Purchasing Power Standard per inhabitant , 1994-2013
Total Expenditure
GEO/TIME 1994-2000 2001-2007 2008-2013
% GDP Euro per inhabit.
% GDP Euro per inhabit.
PPS per capita*
% GDP Euro per inhabit.
PPS per capita*
Belgium 26,78 6.822,14 27,16 7.759,51 7.334,80 30,12 8.831,71 8.973,13
Bulgaria 14,47 483,26 1.212,65 17,18 693,29 2.069,64
Czech Republic 17,78 1.386,34 18,64 1.827,55 3.576,95 19,94 2.202,51 4.522,89
Denmark 30,32 10.006,35 30,09 11.265,86 7.926,61 33,72 12.937,88 9.995,17
Germany 29,20 7.481,39 29,60 8.091,39 7.825,53 29,80 8.734,86 9.292,68
Estonia 14,65 737,00 12,57 970,17 1.769,07 16,70 1.524,27 2.821,29
Ireland 15,88 4.088,60 16,77 6.356,27 5.479,65 27,82 10.015,79 7.168,46
Greece 23,62 3.249,23 24,27 4.032,01 5.006,13 28,94 4.855,15 6.147,00
Spain 20,65 3.421,05 20,31 4.144,50 4.725,19 24,92 4.954,85 6.007,49
France 30,15 7.247,24 30,87 8.370,47 7.884,29 33,26 9.305,44 9.287,92
Croatia : 20,48 1.799,02 3.121,16
Italy 24,52 5.566,75 25,84 6.411,52 6.063,77 29,42 6.948,01 7.629,18
Cyprus 2.431,74 17,54 3.177,88 3.704,06 21,72 4.005,92 5.071,69
Latvia 15,93 522,16 13,29 721,49 1.436,33 15,30 1.059,04 2.218,88
Lithuania 14,76 527,44 13,79 793,95 1.705,43 17,98 1.316,33 2.943,35
Luxembourg 20,78 10.234,02 21,19 13.440,76 11.501,46 22,92 16.028,46 13.479,02
Hungary 20,25 1.363,32 21,30 1.792,07 3.254,55 22,66 1.923,85 3.899,61
Malta 16,83 1.933,45 17,56 2.143,82 3.160,84 18,94 2.637,62 3.895,22
Netherlands 28,37 7.735,06 27,96 8.754,37 8.296,23 31,56 10.459,30 10.365,50
Austria 28,62 7.612,45 28,70 8.526,59 8.098,81 29,96 9.412,89 9.610,10
Poland 19,70 1.075,91 20,24 1.256,34 2.340,78 19,44 1.565,47 3.405,37
Portugal 20,23 2.612,61 23,51 3.456,37 4.257,60 26,26 3.899,00 5.116,20
Romania 13,00 293,29 13,16 464,16 1.055,75 16,24 890,00 2.202,64
Slovenia 23,80 2.648,94 23,23 3.243,35 4.392,25 24,20 3.680,22 5.209,17
Slovakia 19,57 1.081,02 17,51 1.204,74 2.344,97 18,06 1.524,20 3.575,61
Finland 28,40 6.881,81 26,07 7.703,00 6.491,52 29,68 9.169,67 8.552,38
Sweden 31,70 8.512,84 30,70 9.949,78 8.262,22 30,28 10.687,71 9.144,97
United Kingdom 26,32 6.278,16 25,89 7.763,83 7.205,13 29,82 8.987,95 7.708,77
Mean 22,47 4.298,09 21,93 4.966,85 5.048,61 24,55 5.716,09 6.194,09
Range 18,70 9.940,73 18,30 12.976,60 11.501,46 18,42 15.335,17 11.409,38
Standard Deviation
5,59 3.208,46 5,81 3.769,41 2.782,00 5,69 4.298,56 3.070,72
Variation Coefficient
0,25 0,75 0,27 0,76 0,55 0,23 0,75 0,50
Source: Eurostat [spr_exp_sum]
*Eurostat elaborates PPS per inhabitant data since 2003. So we present only one year for each
period: 2005 and 2011.
33
We can identify three clusters: countries above 8.000 PPS per capita (e.g. Luxembourg
and Netherlands have spent more than 10.000 PPS) belong to two different welfare regimes
(Scandinavian and Continental); a middle cluster composed of Mediterranean and Liberal
countries with a social spending range between 4.000 and 7.000 PPS per inhabitant (e.g. UK,
Ireland and Italy have spent more than 7.000); central and eastern nations with low levels of
expenditure but relevant variation over the period (e.g. Romania, Estonia, Lithuania, Bulgaria
and Latvia have a percentage variation greater than 50% comparing absolute social
expenditure between the last two periods).
For each measures, the data show an up-ward trend for all countries: greater for new
member states than the old ones. This is coherent with Hemerijck’s findings. However, the
variation coefficient does not change significantly through the three periods: differently
from the argumentation by Nikolai about OECD data trends, the rise of social expenditure
doesn’t go hand in hand with a convergence until the crisis, but after 2008 the convergence
begin thanks to the ECC’s upswing.
On one side, countries in the middle cluster have the same percentage increase than the
ones at the top (between 10% and 30%), whereas countries in the third cluster have a high
percentage increase (between 35% and 88%) but remain at low level of expenditure in
absolute term (their initial level was very low).
It seems that European states social expenditure is fractured in two groups: the first and
the second. The first group increases with slow but steady pace; the second group for a low
levels of spending increases in a faster way but remains below the average.
It is possible to observe common trends among the ten Innosi countries considering the
difference between the total expenditure and GDP percentage variation (see the green line
in figure 1). In the first period, before Lisbon agenda, on average all the countries show a
negative percentage variation on total expenditure. The period after Lisbon (2001-2007) is
characterised by a negative but improved trend, except for Germany and Poland. In the crisis
period (2008-2013) data show a peak: in 2008-2009 there was a significant increase (plus
6,5%, on average), with exception of Hungary that shows a small variation. After 2010 all
countries decrease their percentage variations and stabilise their trend around 0%. These
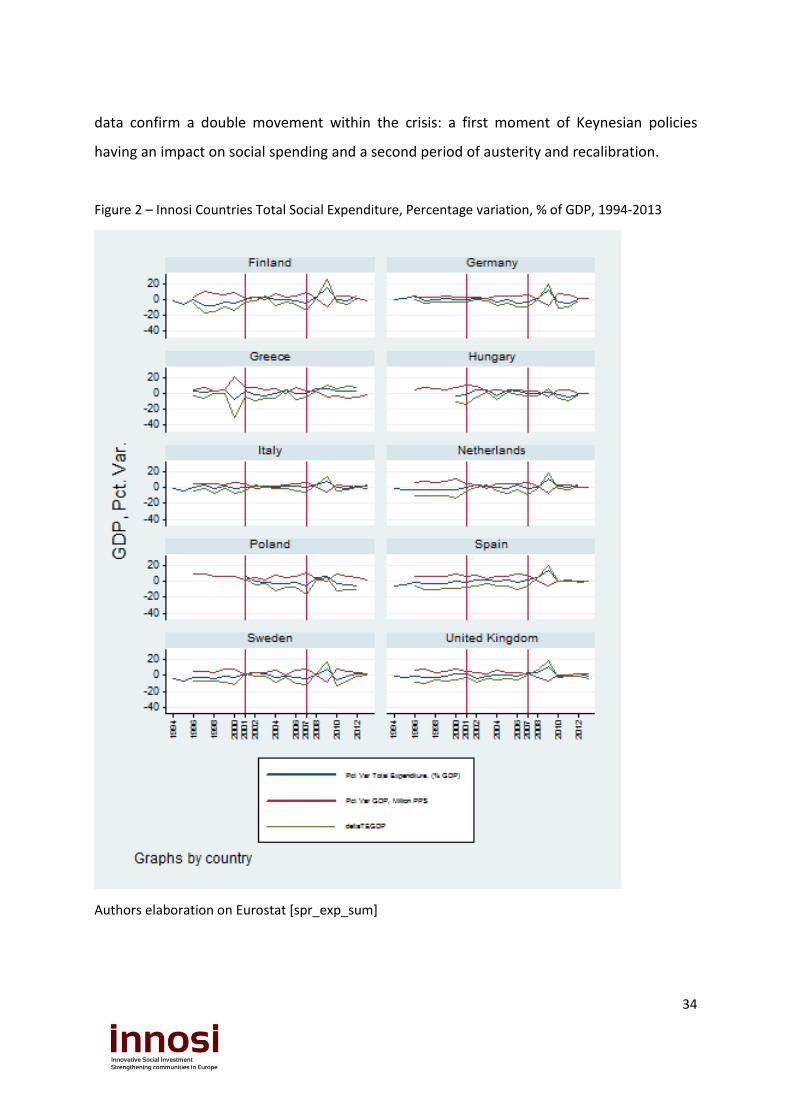
34
data confirm a double movement within the crisis: a first moment of Keynesian policies
having an impact on social spending and a second period of austerity and recalibration.
Figure 2 – Innosi Countries Total Social Expenditure, Percentage variation, % of GDP, 1994-2013
Authors elaboration on Eurostat [spr_exp_sum]
35
3.2. Three areas and cluster of Social Investment: a comparison between quantitative and
qualitative research.
The European Social Policy Network (ESPN), established in 2014 to provide the
Commission with independent information, analysis and expertise on social policies, has
focused its first work on social investment. They have decided to operationalise three
dimensions of Hemerijck’s approach: stock, flow and buffer. To European experts the social
investment rests on social policies to raise human capital (stock and flows dimensions) and
to protect people during risky transitions (buffer). Three main types of activation policies
emerge:
1. Support for early childhood development: those policies underpinning childhood
education and care; they measure this type through the social expenditure on child day
care and family benefits (cash and in-kind).
2. Support for parents’ labour market participation: policies supporting female and single-
parent employment, especially long-term care, child care, maternal, paternal and parental
leave.
3. Policy measure to address social and labour market exclusion: this area looks into both
compensatory policies, like unemployment benefits and minimum income support
schemes, that have a buffer goal, and investment-related programmes, holding a stock
and flow functions (e.g. active labour market policies and enabling social services).
On this basis, Bouget, Frazer, Marlier, Sabato and Vanhercke evaluate the main policy-
making trends in European countries, adding two perspective: the life course and the
integration between the three typologies. ESPN work was focused on qualitative research of
a political topic: to what extent social policies have included a social investment orientation
in last years.
In the following, our aim is to verify whether the ESPN qualitative results will be
confirmed by quantitative data. So we present the ESPN outcomes and then compare them
with Eurostat data. ESPN experts’ reports identify three cluster: The first cluster includes 13
countries (AT, BE, CH, DE, DK, FI, FR, IS, LI, NL, NO, SE, SI) with an already (often historically)
«well-established social investment approach, which maintain this approach and continue to
36
foster good institutional linkages between different policy areas». The second cluster
contains nine countries (CY, ES, HU, IE, LU, MT, PL, PT, UK) «which show some increasing
awareness of social investment and begin to apply a social investment approach in a few
specific policy areas but still lack an overall social investment approach». The third cluster
involves thirteen countries (BG, CZ, EE, EL, HR, IT, LT, LV, MK, RO, RS, SK, TR) «where a social
investment approach has not so far made many significant inroads into the overall policy
agenda though some seem to have started moving slightly in a social investment direction in
a few policy areas (e.g. EE, HR, LT, LV, RO)» (Bouget et alia, 2015: 5-8).
To make the comparison, we have built three measures with Eurostat data in euro per
inhabitant (Table 6):
- “Support for childhood development” with data from Social Expenditure Protection
Family/Children function (in particular: Family or child allowance; Other periodic cash
benefits; Other lump sum cash benefits; Accommodation; Child day care; Home help;
Other benefits in kind).
- “Support for parents’ labour market participation” with data from Social Expenditure
Protection Family/Children and Old age function (in particular: Child day care; Income
maintenance benefit in the event of childbirth; Periodic parental leave benefit; Birth
grant; Parental leave benefits lump sum; from Old age function: Periodic care allowance;
Accommodation; Assistance in carrying daily tasks; Other benefits in kind).
- “Policy measure to address social and labour market exclusion” with data from Labour
Market Policy (Total LMP, 1_9 categories) and Social Expenditure Protection Social
exclusion function.
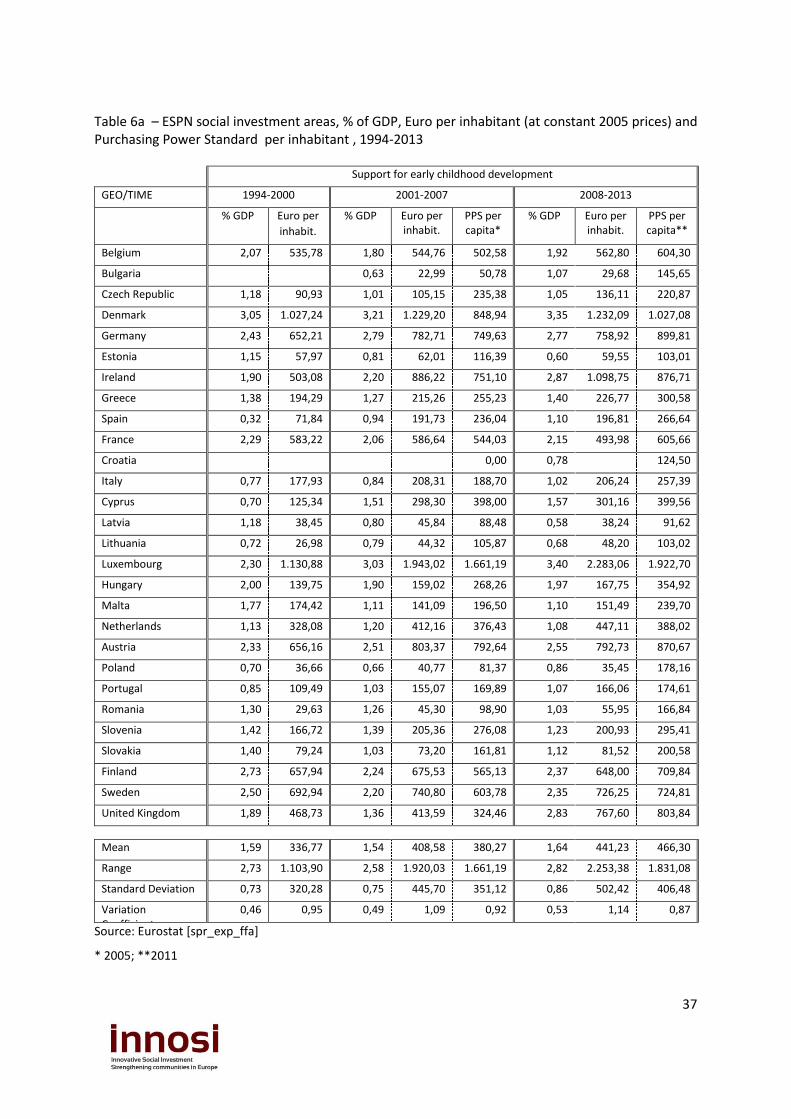
37
Table 6a – ESPN social investment areas, % of GDP, Euro per inhabitant (at constant 2005 prices) and Purchasing Power Standard per inhabitant , 1994-2013
Support for early childhood development
GEO/TIME 1994-2000 2001-2007 2008-2013
% GDP Euro per
inhabit.
% GDP Euro per inhabit.
PPS per capita*
% GDP Euro per inhabit.
PPS per capita**
Belgium 2,07 535,78 1,80 544,76 502,58 1,92 562,80 604,30
Bulgaria 0,63 22,99 50,78 1,07 29,68 145,65
Czech Republic 1,18 90,93 1,01 105,15 235,38 1,05 136,11 220,87
Denmark 3,05 1.027,24 3,21 1.229,20 848,94 3,35 1.232,09 1.027,08
Germany 2,43 652,21 2,79 782,71 749,63 2,77 758,92 899,81
Estonia 1,15 57,97 0,81 62,01 116,39 0,60 59,55 103,01
Ireland 1,90 503,08 2,20 886,22 751,10 2,87 1.098,75 876,71
Greece 1,38 194,29 1,27 215,26 255,23 1,40 226,77 300,58
Spain 0,32 71,84 0,94 191,73 236,04 1,10 196,81 266,64
France 2,29 583,22 2,06 586,64 544,03 2,15 493,98 605,66
Croatia 0,00 0,78 124,50
Italy 0,77 177,93 0,84 208,31 188,70 1,02 206,24 257,39
Cyprus 0,70 125,34 1,51 298,30 398,00 1,57 301,16 399,56
Latvia 1,18 38,45 0,80 45,84 88,48 0,58 38,24 91,62
Lithuania 0,72 26,98 0,79 44,32 105,87 0,68 48,20 103,02
Luxembourg 2,30 1.130,88 3,03 1.943,02 1.661,19 3,40 2.283,06 1.922,70
Hungary 2,00 139,75 1,90 159,02 268,26 1,97 167,75 354,92
Malta 1,77 174,42 1,11 141,09 196,50 1,10 151,49 239,70
Netherlands 1,13 328,08 1,20 412,16 376,43 1,08 447,11 388,02
Austria 2,33 656,16 2,51 803,37 792,64 2,55 792,73 870,67
Poland 0,70 36,66 0,66 40,77 81,37 0,86 35,45 178,16
Portugal 0,85 109,49 1,03 155,07 169,89 1,07 166,06 174,61
Romania 1,30 29,63 1,26 45,30 98,90 1,03 55,95 166,84
Slovenia 1,42 166,72 1,39 205,36 276,08 1,23 200,93 295,41
Slovakia 1,40 79,24 1,03 73,20 161,81 1,12 81,52 200,58
Finland 2,73 657,94 2,24 675,53 565,13 2,37 648,00 709,84
Sweden 2,50 692,94 2,20 740,80 603,78 2,35 726,25 724,81
United Kingdom 1,89 468,73 1,36 413,59 324,46 2,83 767,60 803,84
Mean 1,59 336,77 1,54 408,58 380,27 1,64 441,23 466,30
Range 2,73 1.103,90 2,58 1.920,03 1.661,19 2,82 2.253,38 1.831,08
Standard Deviation 0,73 320,28 0,75 445,70 351,12 0,86 502,42 406,48
Variation Coefficient
0,46 0,95 0,49 1,09 0,92 0,53 1,14 0,87
Source: Eurostat [spr_exp_ffa]
* 2005; **2011
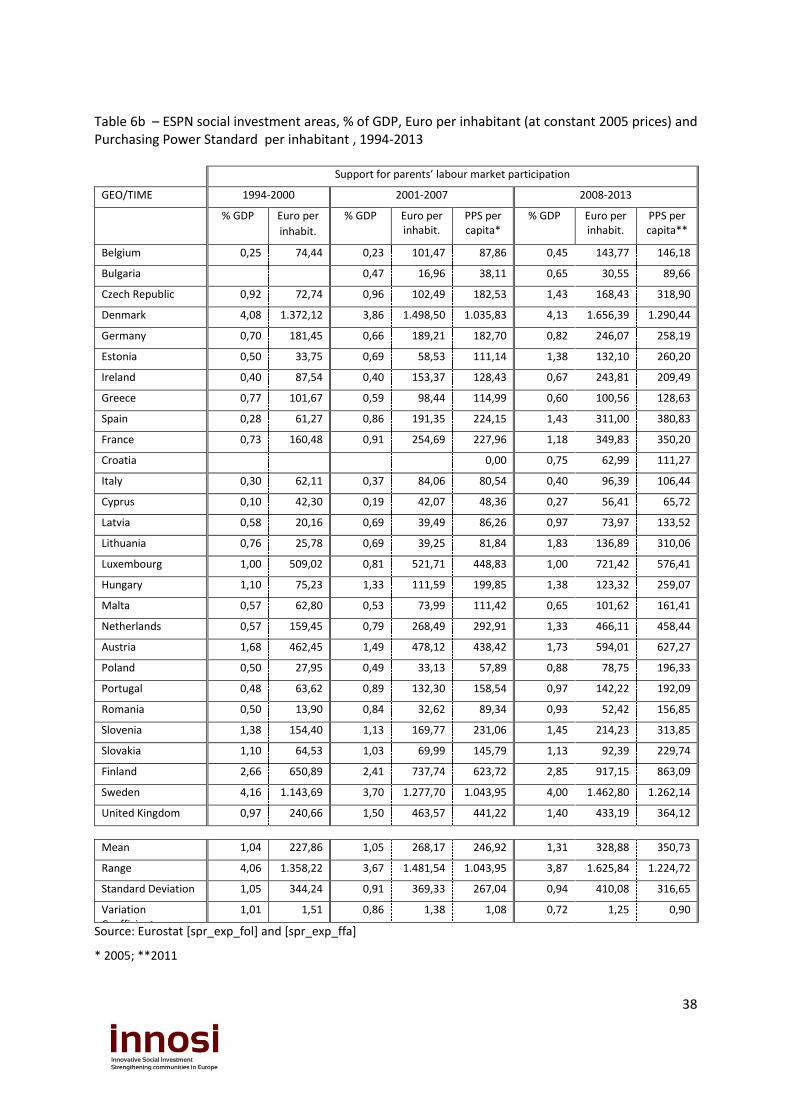
38
Table 6b – ESPN social investment areas, % of GDP, Euro per inhabitant (at constant 2005 prices) and Purchasing Power Standard per inhabitant , 1994-2013
Support for parents’ labour market participation
GEO/TIME 1994-2000 2001-2007 2008-2013
% GDP Euro per
inhabit.
% GDP Euro per inhabit.
PPS per capita*
% GDP Euro per inhabit.
PPS per capita**
Belgium 0,25 74,44 0,23 101,47 87,86 0,45 143,77 146,18
Bulgaria 0,47 16,96 38,11 0,65 30,55 89,66
Czech Republic 0,92 72,74 0,96 102,49 182,53 1,43 168,43 318,90
Denmark 4,08 1.372,12 3,86 1.498,50 1.035,83 4,13 1.656,39 1.290,44
Germany 0,70 181,45 0,66 189,21 182,70 0,82 246,07 258,19
Estonia 0,50 33,75 0,69 58,53 111,14 1,38 132,10 260,20
Ireland 0,40 87,54 0,40 153,37 128,43 0,67 243,81 209,49
Greece 0,77 101,67 0,59 98,44 114,99 0,60 100,56 128,63
Spain 0,28 61,27 0,86 191,35 224,15 1,43 311,00 380,83
France 0,73 160,48 0,91 254,69 227,96 1,18 349,83 350,20
Croatia
0,00 0,75 62,99 111,27
Italy 0,30 62,11 0,37 84,06 80,54 0,40 96,39 106,44
Cyprus 0,10 42,30 0,19 42,07 48,36 0,27 56,41 65,72
Latvia 0,58 20,16 0,69 39,49 86,26 0,97 73,97 133,52
Lithuania 0,76 25,78 0,69 39,25 81,84 1,83 136,89 310,06
Luxembourg 1,00 509,02 0,81 521,71 448,83 1,00 721,42 576,41
Hungary 1,10 75,23 1,33 111,59 199,85 1,38 123,32 259,07
Malta 0,57 62,80 0,53 73,99 111,42 0,65 101,62 161,41
Netherlands 0,57 159,45 0,79 268,49 292,91 1,33 466,11 458,44
Austria 1,68 462,45 1,49 478,12 438,42 1,73 594,01 627,27
Poland 0,50 27,95 0,49 33,13 57,89 0,88 78,75 196,33
Portugal 0,48 63,62 0,89 132,30 158,54 0,97 142,22 192,09
Romania 0,50 13,90 0,84 32,62 89,34 0,93 52,42 156,85
Slovenia 1,38 154,40 1,13 169,77 231,06 1,45 214,23 313,85
Slovakia 1,10 64,53 1,03 69,99 145,79 1,13 92,39 229,74
Finland 2,66 650,89 2,41 737,74 623,72 2,85 917,15 863,09
Sweden 4,16 1.143,69 3,70 1.277,70 1.043,95 4,00 1.462,80 1.262,14
United Kingdom 0,97 240,66 1,50 463,57 441,22 1,40 433,19 364,12
Mean 1,04 227,86 1,05 268,17 246,92 1,31 328,88 350,73
Range 4,06 1.358,22 3,67 1.481,54 1.043,95 3,87 1.625,84 1.224,72
Standard Deviation 1,05 344,24 0,91 369,33 267,04 0,94 410,08 316,65
Variation Coefficient
1,01 1,51 0,86 1,38 1,08 0,72 1,25 0,90
Source: Eurostat [spr_exp_fol] and [spr_exp_ffa]
* 2005; **2011
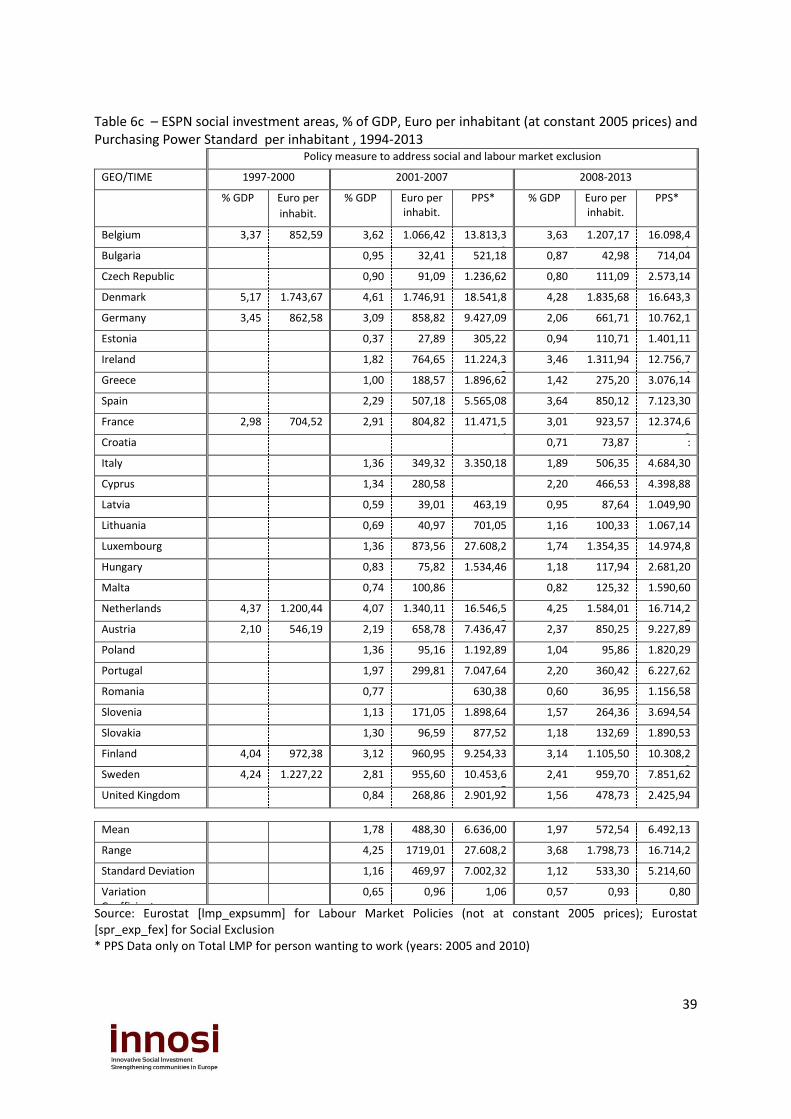
39
Table 6c – ESPN social investment areas, % of GDP, Euro per inhabitant (at constant 2005 prices) and Purchasing Power Standard per inhabitant , 1994-2013
Policy measure to address social and labour market exclusion
GEO/TIME 1997-2000 2001-2007 2008-2013
% GDP Euro per
inhabit.
% GDP Euro per inhabit.
PPS* % GDP Euro per inhabit.
PPS*
Belgium 3,37
852,59 3,62 1.066,42 13.813,3
2
3,63 1.207,17 16.098,4
3 Bulgaria 0,95 32,41 521,18 0,87 42,98 714,04
Czech Republic 0,90 91,09 1.236,62 0,80 111,09 2.573,14
Denmark 5,17 1.743,67 4,61 1.746,91 18.541,8
9
4,28 1.835,68 16.643,3
6 Germany 3,45 862,58 3,09 858,82 9.427,09 2,06 661,71 10.762,1
4 Estonia 0,37 27,89 305,22 0,94 110,71 1.401,11
Ireland 1,82 764,65 11.224,3
8
3,46 1.311,94 12.756,7
4 Greece 1,00 188,57 1.896,62 1,42 275,20 3.076,14
Spain 2,29 507,18 5.565,08 3,64 850,12 7.123,30
France 2,98 704,52 2,91 804,82 11.471,5
4
3,01 923,57 12.374,6
8 Croatia
0,71 73,87 :
Italy 1,36 349,32 3.350,18 1,89 506,35 4.684,30
Cyprus 1,34 280,58 2,20 466,53 4.398,88
Latvia 0,59 39,01 463,19 0,95 87,64 1.049,90
Lithuania 0,69 40,97 701,05 1,16 100,33 1.067,14
Luxembourg 1,36 873,56 27.608,2
5
1,74 1.354,35 14.974,8
1 Hungary 0,83 75,82 1.534,46 1,18 117,94 2.681,20
Malta 0,74 100,86 0,82 125,32 1.590,60
Netherlands 4,37 1.200,44 4,07 1.340,11 16.546,5
2
4,25 1.584,01 16.714,2
7 Austria 2,10 546,19 2,19 658,78 7.436,47 2,37 850,25 9.227,89
Poland 1,36 95,16 1.192,89 1,04 95,86 1.820,29
Portugal 1,97 299,81 7.047,64 2,20 360,42 6.227,62
Romania 0,77 630,38 0,60 36,95 1.156,58
Slovenia 1,13 171,05 1.898,64 1,57 264,36 3.694,54
Slovakia 1,30 96,59 877,52 1,18 132,69 1.890,53
Finland 4,04 972,38 3,12 960,95 9.254,33 3,14 1.105,50 10.308,2
8 Sweden 4,24 1.227,22 2,81 955,60 10.453,6
5
2,41 959,70 7.851,62
United Kingdom 0,84 268,86 2.901,92 1,56 478,73 2.425,94
Mean 1,78 488,30 6.636,00 1,97 572,54 6.492,13
Range 4,25 1719,01 27.608,2
5
3,68 1.798,73 16.714,2
7 Standard Deviation 1,16 469,97 7.002,32 1,12 533,30 5.214,60
Variation Coefficient
0,65 0,96 1,06 0,57 0,93 0,80
Source: Eurostat [lmp_expsumm] for Labour Market Policies (not at constant 2005 prices); Eurostat [spr_exp_fex] for Social Exclusion * PPS Data only on Total LMP for person wanting to work (years: 2005 and 2010)
40
The ESPN insight of a reduction in spending on families and children function is not
confirmed: only twelve countries have decreased their spending from 1994-2000 to 2008-
2013 as a % of GDP. We observe four movement. The first group has a double activity:
countries like Belgium, France and UK have an important decrease (from 1997-2000 to 2001-
2007) and then a little swelling (2008-2013 in comparison with 2001-2007) in the early
childhood development area. In the second cluster this social expenditure has a constant
rise: Denmark, Italy, Spain and other five countries increase their aid to children and
families. On the contrary, Malta, Estonia, Latvia, Romania and Slovenia are experiencing a
steady retrenchment. The forth group (Germany, Netherlands and Lithuania) has a stable
but wigwag movement: a short growth and then a reduction.
Support for parents’ labour market participation is the new real emerging policies field: in
the last period (2011) fifteen European members spend more than 250 PPS per capita versus
only seven countries in the previous cycle (2005). At the top of percentage growth, data
confirm nations as Spain, Cyprus, Ireland and UK. The statistical measure of convergence
(variation coefficient) for this area indicates a trend towards a more similar social
expenditure pattern.
The ESPN third area is a mix of compensatory and social investment-related policies:
active labour market schemes are conceived together with passive labour programmes and
social exclusion spending. Data show a moderate growth, due in particular to social
exclusion measures. In 2011, people wanting to work from Scandinavian, Continental and
Anglo-Saxon countries have available more than 10.000 PPS per capita, except for Swedish,
English and Austrian. Mediterranean countries have a halfway result, between 3.000
(Greece) and 7.000 (Spain). Last European members spend around 1.500 PPS for person
wanting to work, both for passive and active policies.
Looking at the social expenditure typologies (Table 6), we have found three clusters: the
first group includes Scandinavian countries (Denmark with 11,76 % of GDP after the crisis;
Sweden 8,76%; Finland 8,35) with high but decreasing expenditure on social investment
areas. Within a range of expenditure between 5,64 (Germany) and 6,99 % of GDP (Ireland),
the second cluster includes Continental, Anglo-Saxon countries and Spain: the most
substantial increase in social expenditure pertains to UK, Ireland and Spain (more than 2 %
41
of GDP). The other European members, the third group, spend between 2,24 (Croatia) and
4,53 % of GDP (Hungary).
Compared to ESPN clusters we notice three relevant difference: Scandinavian countries
dominate any ranking; Spain, Ireland and UK now have an expenditure regime very similar to
Continental countries; Mediterranean and Eastern European members have a similar social
expenditure profile.
3.3. Compensation and investment policies: is the shifting from compensating policies to
social investment really happening?
Rita Nikolai has analysed the “programme-related spending categories” focusing on the
«dynamic of social expenditure driven by the restructuring of social spending patterns»
(Nikolai, 2012: 97). She defined the “compensatory expenditure” as old age insurance and
passive labour market policies and the “investment-related expenditure” as ALMPs, family
policy and education (Table 2). We use the same label and the same measure (% of GDP),
but different database (Eurostat instead of SOCX).
In a comparison between Nikolai’s data and Innosi update, we are able to underline some
preliminary results (Table 7 and 8).
Since the 1980s the main expenditure trend is on old age function: Austria, Greece,
Germany, France, Poland and Italy «spend a large bulk of their financial resources» on this
topic. With our data, we confirm this first finding. Whereas Nikolai affirmed that many
countries have increased their spending in the 1990s and 2000s and have restrained
expenditure after 2000, we could add that after 2008 there is an upswing for almost all
European countries (except Germany, Greece, Latvia, Poland and Slovakia). Another
important point to underline is the large variation across countries: for example Italy and
Denmark are above 12%, whereas Ireland and Croatia are under 5%.
Between the 1980s and 2007 Nikolai observed increased levels of spending for family
function. For European countries the social expenditure on this area is very different from
OECD countries: between 1997 and 2007 we note a huge “retrenchment” (e.g. in Finland,
United Kingdom, France and Belgium); a stagnation within core countries of Scandinavian
42
and Continental regimes (for example, Sweden, Germany, Denmark and Austria) and a
relevant increase in countries with a low starting social spending (e.g. Spain, Italy, Portugal
and Cyprus). These trends change after the outbreak of 2008 crisis: all countries augment
their investments on family function. Only four countries are subjected to a retrenchment
(Netherlands, Germany, Austria and Romania) whereas Anglo-Saxon nations lead the group
of investing nations. Differently from Nikolai who notices «that the social investment turn in
the 2000s is not reflected in growing expenses for family policies», we find that in the crisis
period family function expenditure shows the most relevant growth together with
education. It is worth to say that this expansion concerns especially family or children
allowances, (that the majority of authors do not consider an investment-related social
policies).
Active labour market policies show a modest variation trough time: this core social
investment area doesn’t present any significant change before and after the 2008 crisis.
Passive measures for labour market participation confirm their stability and predominance
in the employment sector. The highest expenditure for unemployment cash benefits is to be
found in the 2008-2012 period in Belgium, Spain and Ireland (near or more than 3%).
The main cuts regard the leading countries of core European welfare regimes: Denmark,
Sweden, Finland, Germany, United Kingdom and France.
The Eurostat data underestimate the previous policies if compared to SOCX database, but
they overrate expenditure on education. To our purpose, it is important to discuss data
trend and possible convergence: Denmark, Sweden and Finland (with Cyprus) have the
highest percentage of public investment in education. Not surprisingly, Germany, Greece,
Italy and Spain show a share of the GDP below average, much behind some Eastern and
Central European countries. European countries show a reduced growth in public expenses
for education, but not a trend towards convergence: European countries spend more now
than in 1997-2000 and 2001-2007, but the laggards don’t have recovered yet.
Another approach used by Nikolai was to compare expenditure for investment-related
and compensatory social policies, in different regime typologies and period of time (mid-
1980s, 1990, 2000 and 2007).
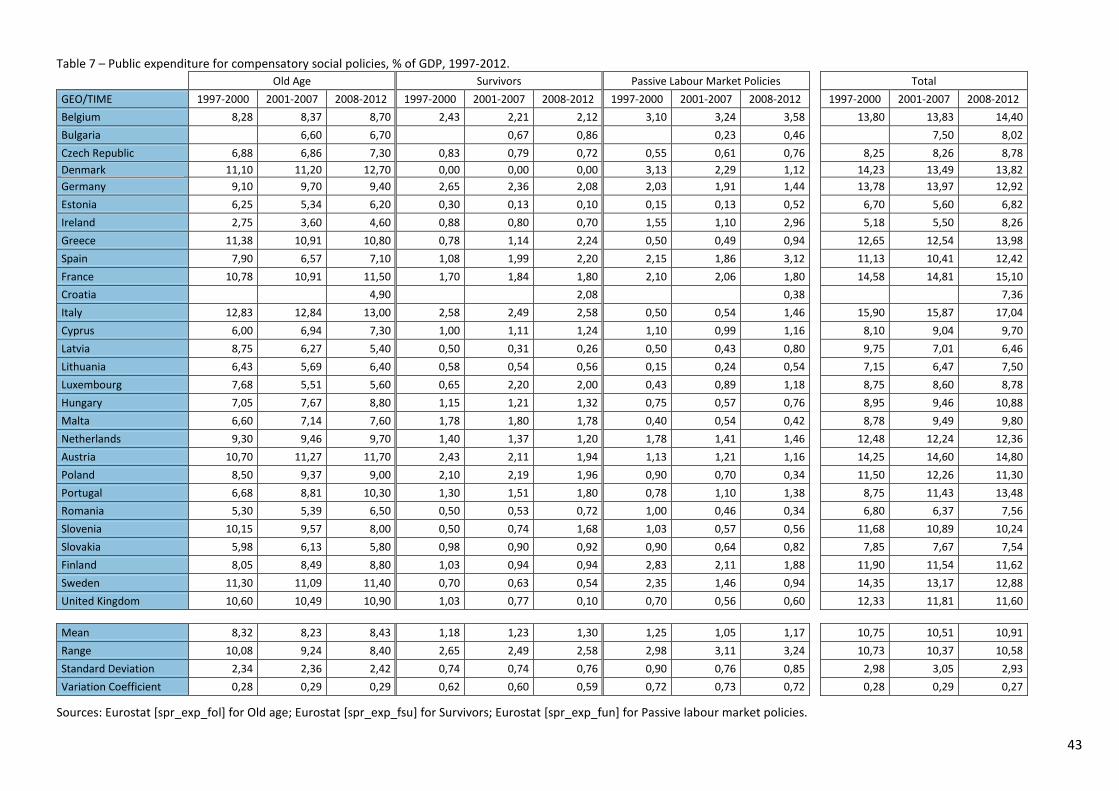
43
Table 7 – Public expenditure for compensatory social policies, % of GDP, 1997-2012.
Old Age Survivors Passive Labour Market Policies Total
GEO/TIME 1997-2000 2001-2007 2008-2012 1997-2000 2001-2007 2008-2012 1997-2000 2001-2007 2008-2012 1997-2000 2001-2007 2008-2012
Belgium 8,28 8,37 8,70 2,43 2,21 2,12 3,10 3,24 3,58 13,80 13,83 14,40
Bulgaria 6,60 6,70 0,67 0,86 0,23 0,46 7,50 8,02
Czech Republic 6,88 6,86 7,30 0,83 0,79 0,72 0,55 0,61 0,76 8,25 8,26 8,78
Denmark 11,10 11,20 12,70 0,00 0,00 0,00 3,13 2,29 1,12 14,23 13,49 13,82
Germany 9,10 9,70 9,40 2,65 2,36 2,08 2,03 1,91 1,44 13,78 13,97 12,92
Estonia 6,25 5,34 6,20 0,30 0,13 0,10 0,15 0,13 0,52 6,70 5,60 6,82
Ireland 2,75 3,60 4,60 0,88 0,80 0,70 1,55 1,10 2,96 5,18 5,50 8,26
Greece 11,38 10,91 10,80 0,78 1,14 2,24 0,50 0,49 0,94 12,65 12,54 13,98
Spain 7,90 6,57 7,10 1,08 1,99 2,20 2,15 1,86 3,12 11,13 10,41 12,42
France 10,78 10,91 11,50 1,70 1,84 1,80 2,10 2,06 1,80 14,58 14,81 15,10
Croatia 4,90 2,08 0,38 7,36
Italy 12,83 12,84 13,00 2,58 2,49 2,58 0,50 0,54 1,46 15,90 15,87 17,04
Cyprus 6,00 6,94 7,30 1,00 1,11 1,24 1,10 0,99 1,16 8,10 9,04 9,70
Latvia 8,75 6,27 5,40 0,50 0,31 0,26 0,50 0,43 0,80 9,75 7,01 6,46
Lithuania 6,43 5,69 6,40 0,58 0,54 0,56 0,15 0,24 0,54 7,15 6,47 7,50
Luxembourg 7,68 5,51 5,60 0,65 2,20 2,00 0,43 0,89 1,18 8,75 8,60 8,78
Hungary 7,05 7,67 8,80 1,15 1,21 1,32 0,75 0,57 0,76 8,95 9,46 10,88
Malta 6,60 7,14 7,60 1,78 1,80 1,78 0,40 0,54 0,42 8,78 9,49 9,80
Netherlands 9,30 9,46 9,70 1,40 1,37 1,20 1,78 1,41 1,46 12,48 12,24 12,36
Austria 10,70 11,27 11,70 2,43 2,11 1,94 1,13 1,21 1,16 14,25 14,60 14,80
Poland 8,50 9,37 9,00 2,10 2,19 1,96 0,90 0,70 0,34 11,50 12,26 11,30
Portugal 6,68 8,81 10,30 1,30 1,51 1,80 0,78 1,10 1,38 8,75 11,43 13,48
Romania 5,30 5,39 6,50 0,50 0,53 0,72 1,00 0,46 0,34 6,80 6,37 7,56
Slovenia 10,15 9,57 8,00 0,50 0,74 1,68 1,03 0,57 0,56 11,68 10,89 10,24
Slovakia 5,98 6,13 5,80 0,98 0,90 0,92 0,90 0,64 0,82 7,85 7,67 7,54
Finland 8,05 8,49 8,80 1,03 0,94 0,94 2,83 2,11 1,88 11,90 11,54 11,62
Sweden 11,30 11,09 11,40 0,70 0,63 0,54 2,35 1,46 0,94 14,35 13,17 12,88
United Kingdom 10,60 10,49 10,90 1,03 0,77 0,10 0,70 0,56 0,60 12,33 11,81 11,60
Mean 8,32 8,23 8,43 1,18 1,23 1,30 1,25 1,05 1,17 10,75 10,51 10,91
Range 10,08 9,24 8,40 2,65 2,49 2,58 2,98 3,11 3,24 10,73 10,37 10,58
Standard Deviation 2,34 2,36 2,42 0,74 0,74 0,76 0,90 0,76 0,85 2,98 3,05 2,93
Variation Coefficient 0,28 0,29 0,29 0,62 0,60 0,59 0,72 0,73 0,72 0,28 0,29 0,27
Sources: Eurostat [spr_exp_fol] for Old age; Eurostat [spr_exp_fsu] for Survivors; Eurostat [spr_exp_fun] for Passive labour market policies.
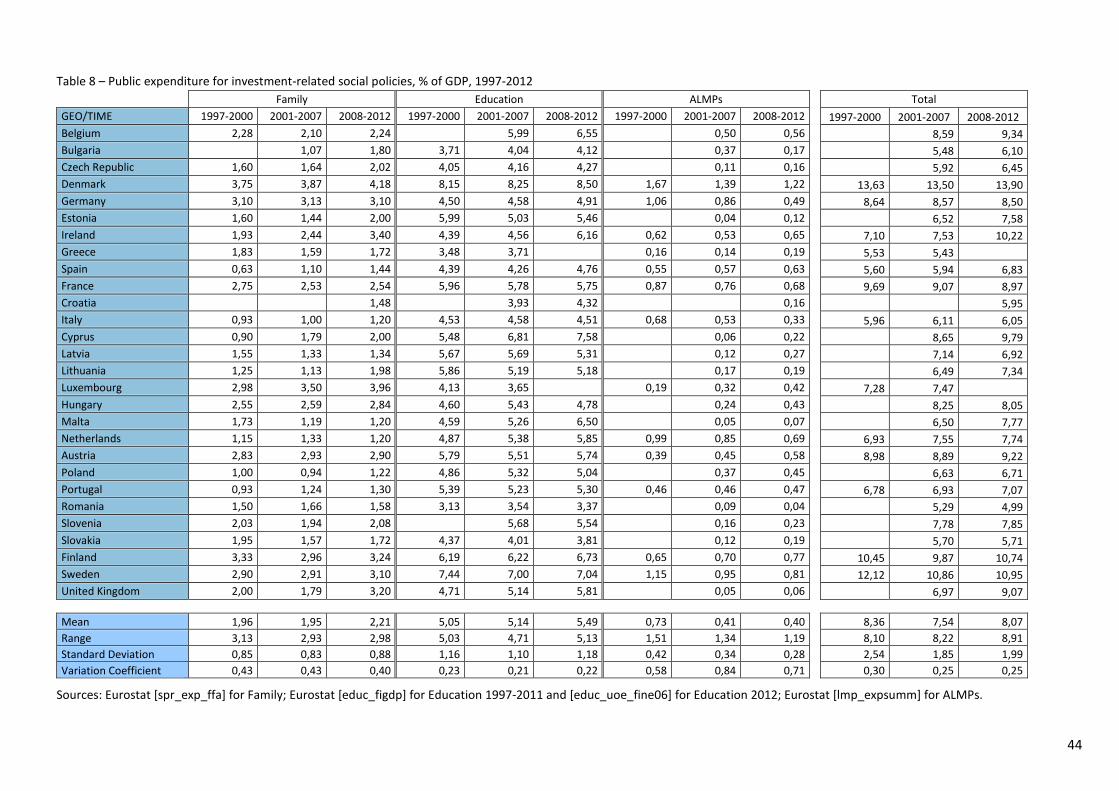
44
Table 8 – Public expenditure for investment-related social policies, % of GDP, 1997-2012
Family Education ALMPs Total
GEO/TIME 1997-2000 2001-2007 2008-2012 1997-2000 2001-2007 2008-2012 1997-2000 2001-2007 2008-2012 1997-2000 2001-2007 2008-2012
Belgium 2,28 2,10 2,24 5,99 6,55 0,50 0,56 8,59 9,34
Bulgaria 1,07 1,80 3,71 4,04 4,12 0,37 0,17 5,48 6,10
Czech Republic 1,60 1,64 2,02 4,05 4,16 4,27 0,11 0,16 5,92 6,45
Denmark 3,75 3,87 4,18 8,15 8,25 8,50 1,67 1,39 1,22 13,63 13,50 13,90
Germany 3,10 3,13 3,10 4,50 4,58 4,91 1,06 0,86 0,49 8,64 8,57 8,50
Estonia 1,60 1,44 2,00 5,99 5,03 5,46 0,04 0,12 6,52 7,58
Ireland 1,93 2,44 3,40 4,39 4,56 6,16 0,62 0,53 0,65 7,10 7,53 10,22
Greece 1,83 1,59 1,72 3,48 3,71 0,16 0,14 0,19 5,53 5,43
Spain 0,63 1,10 1,44 4,39 4,26 4,76 0,55 0,57 0,63 5,60 5,94 6,83
France 2,75 2,53 2,54 5,96 5,78 5,75 0,87 0,76 0,68 9,69 9,07 8,97
Croatia 1,48 3,93 4,32 0,16 5,95
Italy 0,93 1,00 1,20 4,53 4,58 4,51 0,68 0,53 0,33 5,96 6,11 6,05
Cyprus 0,90 1,79 2,00 5,48 6,81 7,58 0,06 0,22 8,65 9,79
Latvia 1,55 1,33 1,34 5,67 5,69 5,31 0,12 0,27 7,14 6,92
Lithuania 1,25 1,13 1,98 5,86 5,19 5,18 0,17 0,19 6,49 7,34
Luxembourg 2,98 3,50 3,96 4,13 3,65 0,19 0,32 0,42 7,28 7,47
Hungary 2,55 2,59 2,84 4,60 5,43 4,78 0,24 0,43 8,25 8,05
Malta 1,73 1,19 1,20 4,59 5,26 6,50 0,05 0,07 6,50 7,77
Netherlands 1,15 1,33 1,20 4,87 5,38 5,85 0,99 0,85 0,69 6,93 7,55 7,74
Austria 2,83 2,93 2,90 5,79 5,51 5,74 0,39 0,45 0,58 8,98 8,89 9,22
Poland 1,00 0,94 1,22 4,86 5,32 5,04 0,37 0,45 6,63 6,71
Portugal 0,93 1,24 1,30 5,39 5,23 5,30 0,46 0,46 0,47 6,78 6,93 7,07
Romania 1,50 1,66 1,58 3,13 3,54 3,37 0,09 0,04 5,29 4,99
Slovenia 2,03 1,94 2,08 5,68 5,54 0,16 0,23 7,78 7,85
Slovakia 1,95 1,57 1,72 4,37 4,01 3,81 0,12 0,19 5,70 5,71
Finland 3,33 2,96 3,24 6,19 6,22 6,73 0,65 0,70 0,77 10,45 9,87 10,74
Sweden 2,90 2,91 3,10 7,44 7,00 7,04 1,15 0,95 0,81 12,12 10,86 10,95
United Kingdom 2,00 1,79 3,20 4,71 5,14 5,81 0,05 0,06 6,97 9,07
Mean 1,96 1,95 2,21 5,05 5,14 5,49 0,73 0,41 0,40 8,36 7,54 8,07
Range 3,13 2,93 2,98 5,03 4,71 5,13 1,51 1,34 1,19 8,10 8,22 8,91
Standard Deviation 0,85 0,83 0,88 1,16 1,10 1,18 0,42 0,34 0,28 2,54 1,85 1,99
Variation Coefficient 0,43 0,43 0,40 0,23 0,21 0,22 0,58 0,84 0,71 0,30 0,25 0,25
Sources: Eurostat [spr_exp_ffa] for Family; Eurostat [educ_figdp] for Education 1997-2011 and [educ_uoe_fine06] for Education 2012; Eurostat [lmp_expsumm] for ALMPs.
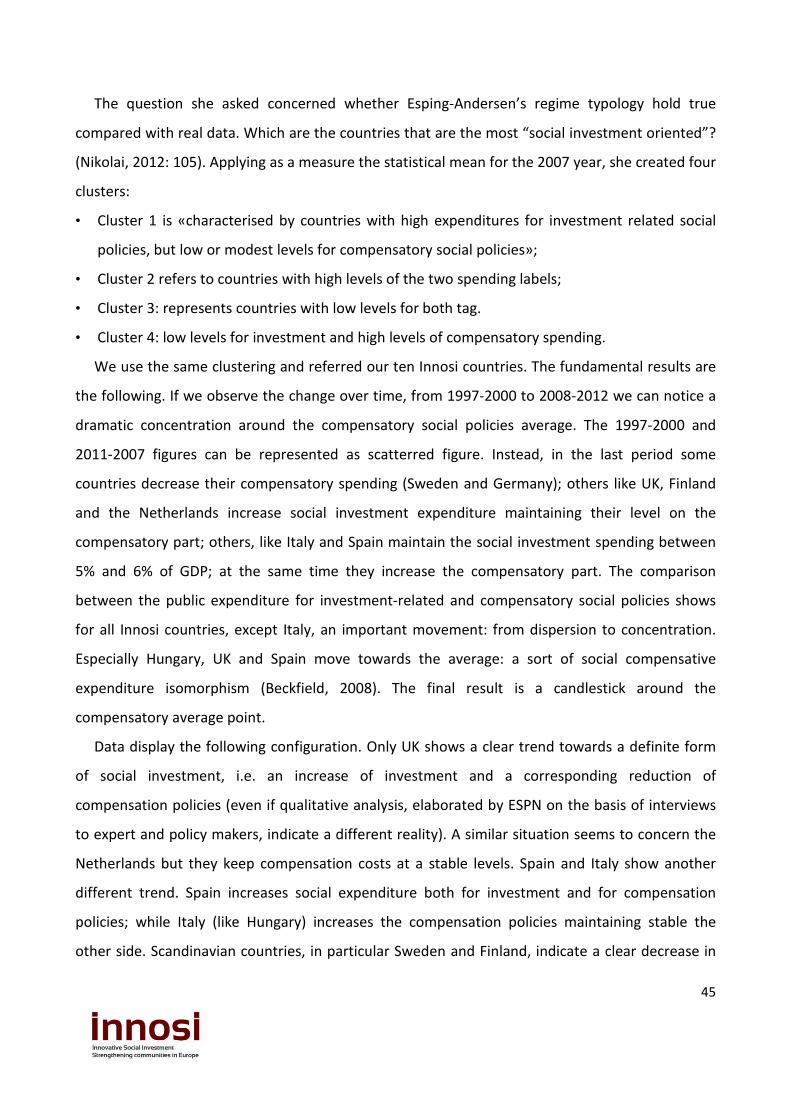
45
The question she asked concerned whether Esping-Andersen’s regime typology hold true
compared with real data. Which are the countries that are the most “social investment oriented”?
(Nikolai, 2012: 105). Applying as a measure the statistical mean for the 2007 year, she created four
clusters:
• Cluster 1 is «characterised by countries with high expenditures for investment related social
policies, but low or modest levels for compensatory social policies»;
• Cluster 2 refers to countries with high levels of the two spending labels;
• Cluster 3: represents countries with low levels for both tag.
• Cluster 4: low levels for investment and high levels of compensatory spending.
We use the same clustering and referred our ten Innosi countries. The fundamental results are
the following. If we observe the change over time, from 1997-2000 to 2008-2012 we can notice a
dramatic concentration around the compensatory social policies average. The 1997-2000 and
2011-2007 figures can be represented as scatterred figure. Instead, in the last period some
countries decrease their compensatory spending (Sweden and Germany); others like UK, Finland
and the Netherlands increase social investment expenditure maintaining their level on the
compensatory part; others, like Italy and Spain maintain the social investment spending between
5% and 6% of GDP; at the same time they increase the compensatory part. The comparison
between the public expenditure for investment-related and compensatory social policies shows
for all Innosi countries, except Italy, an important movement: from dispersion to concentration.
Especially Hungary, UK and Spain move towards the average: a sort of social compensative
expenditure isomorphism (Beckfield, 2008). The final result is a candlestick around the
compensatory average point.
Data display the following configuration. Only UK shows a clear trend towards a definite form
of social investment, i.e. an increase of investment and a corresponding reduction of
compensation policies (even if qualitative analysis, elaborated by ESPN on the basis of interviews
to expert and policy makers, indicate a different reality). A similar situation seems to concern the
Netherlands but they keep compensation costs at a stable levels. Spain and Italy show another
different trend. Spain increases social expenditure both for investment and for compensation
policies; while Italy (like Hungary) increases the compensation policies maintaining stable the
other side. Scandinavian countries, in particular Sweden and Finland, indicate a clear decrease in
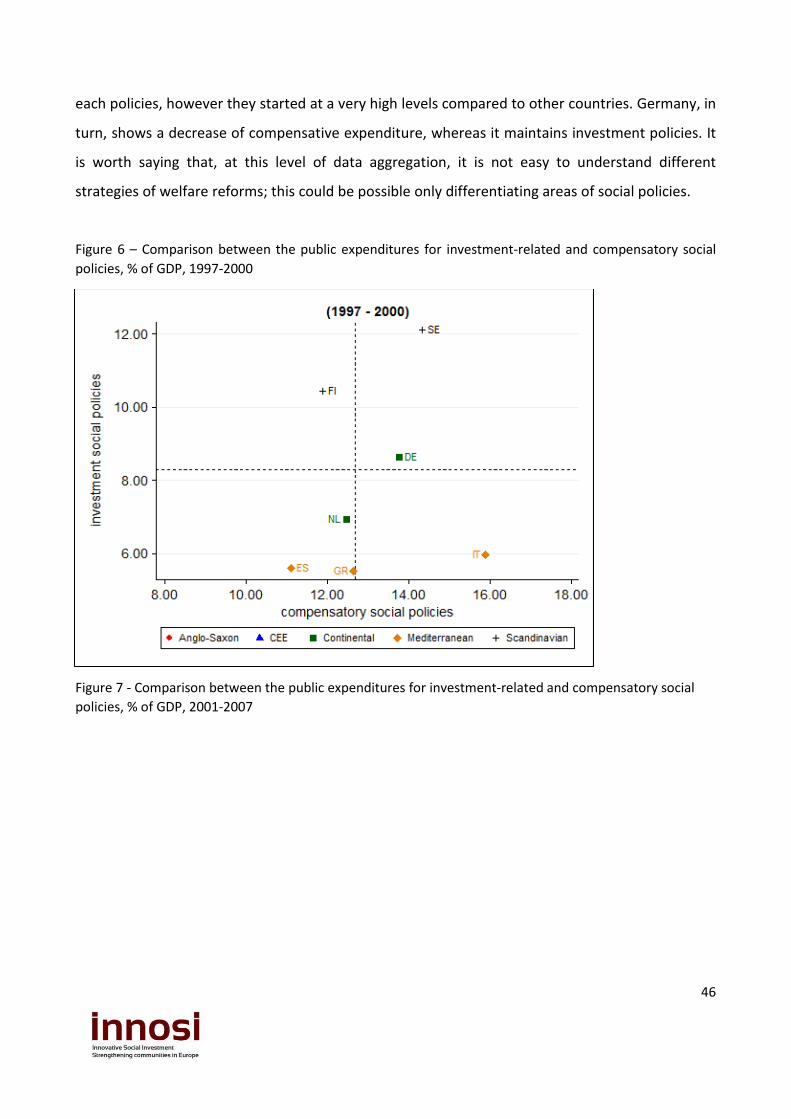
46
each policies, however they started at a very high levels compared to other countries. Germany, in
turn, shows a decrease of compensative expenditure, whereas it maintains investment policies. It
is worth saying that, at this level of data aggregation, it is not easy to understand different
strategies of welfare reforms; this could be possible only differentiating areas of social policies.
Figure 6 – Comparison between the public expenditures for investment-related and compensatory social
policies, % of GDP, 1997-2000
Figure 7 - Comparison between the public expenditures for investment-related and compensatory social
policies, % of GDP, 2001-2007
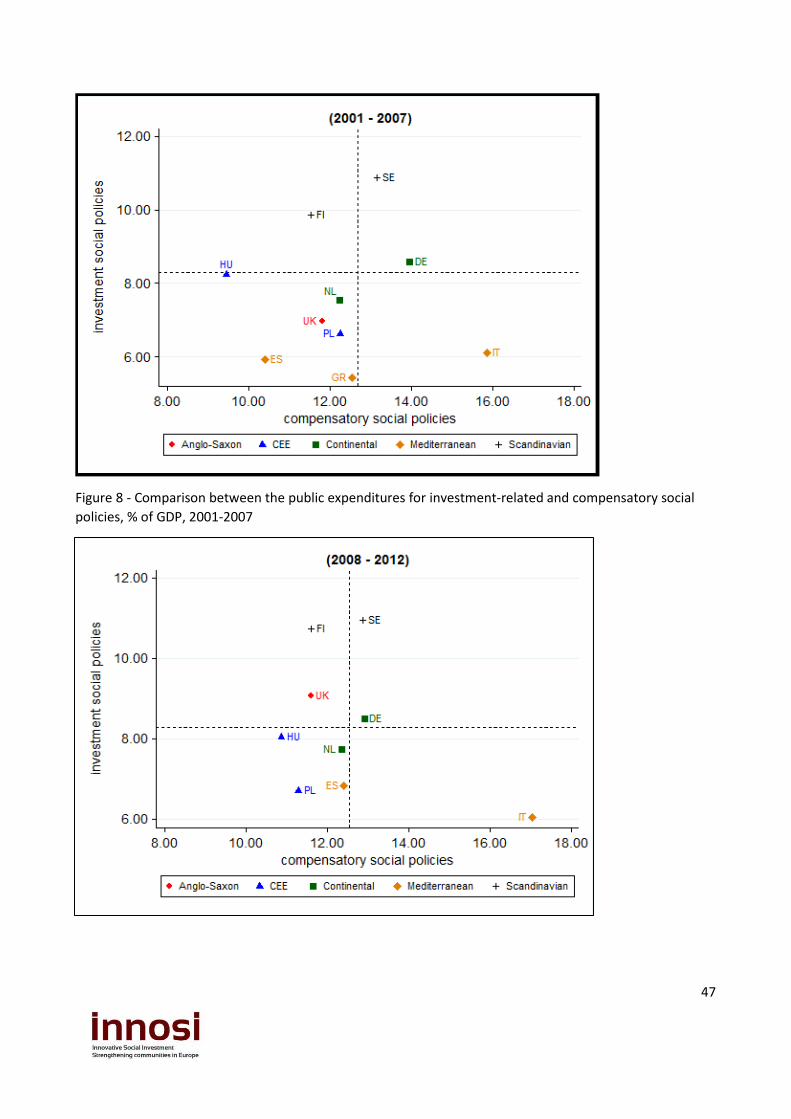
47
Figure 8 - Comparison between the public expenditures for investment-related and compensatory social
policies, % of GDP, 2001-2007
48
This findings are in line with Hudson and Kuhner (2009) and van Vliet and Wang (2015):
descriptive statistics show that only few countries have increased capacitating or new welfare
state programmes at the expense of compensatory or old welfare state policies.
The overall picture that we derive from data analysis is threefold:
1) First, it appears quite clearly that there is a trend towards the so-called social investment,
but only in social policies concerning saving time from care to work. The child care and services for
elderly are developed in all European countries, except the CEE. Anyway it seems that the
investment strategy is not actually related on human capital creation but rather it is directed to
the increasing of new employment, especially for women. In this sense, the social investment
paradigm would be weakened: these policies would be directed mainly at the present time (i.e. to
give more jobs) rather than at the future. This could be interpreted as a "consuming" political
strategy rather than a "instrumental" one, which is in contradiction with the investment
philosophy. In any case, we find that child care, LTC and maternal/paternal/parental leaves are
truly the new emerging field of European social policy system. This European development could
be better interpreted as a strategy of welfare capitalism, where the goal is to include new workers
into the market area.
2) With respect to adult worker policies - i.e. activation policies and support to people losing
their job - it seems that we are not witnessing a real social investment strategy. Actually we can
observe a growing in total expenditure, mainly fuelled by compensative policies, i.e.
unemployment benefits. This is a common trend both in liberal regimes (where this expenditure
were very low) and in southern countries (which, basically, remain occupational welfare regime),
while in Scandinavian regime compensation is decreasing (but it started at a very high level).
3) With respect to welfare regimes, research data show an ambivalent logic. First of all we can
observe a peculiar development which splits Europe in two cluster. On one hand Nordic and
Anglo-Saxon countries converge on social investment policies. Continental countries seem to
recalibrate their traditional male breadwinner welfare system in terms of female employment,
and so they seem to approach the nordic countries. On the other, the South European countries
seem to maintain their strong compensatory tradition: especially in the crisis period they were
subjected to policy trends that went against austerity philosophy and towards attempts to
transform their welfare systems in terms of productivity (the ESPN report from expert and even
49
our WP2 indicate these trends). At the same time the CEE countries, starting from very low levels
of social support and expenditure, have increased compensative policies more than those
concerning investment.
Secondly and given the previous developmental differences, the welfare regimes and their path
dependency, maintain their capacity to explain the absolute amount of social expenditure: Nordic
countries maintain higher investment expenditure; occupational welfare systems (continental and
southern) show very high compensation expenses; liberal countries stressed out cash benefits
instead of in-kind ones.
3.4. Life-course: working age recalibration, childhood and old age reinforcement.
We may also observe social investment in the context of the life-course perspective: in fact to
generate and to facilitate the accumulation of human capital throughout all the individual life-
course is one of the most important goal of social investment approach (Kvist, 2013; Kuitto, 2014).
Moreover, the early stages of life and related educational policies are expected «to pay off in the
future in form of better labour market chances at individual, and higher employment rates and
economic growth at the macro level (Kuitto, 2014: 8). But it is of great relevance the life-long
learning approach to and the so-called active ageing.
Kati Kuitto has prompt a very useful analysis of this topic: she highlighted that in times of
permanent austerity, social expenditure expansion «would rest in a double trade-off of welfare
policy recalibration» (Ibidem: 5): compensating versus investment-related social policies and
young versus elderly target policies. She identified three main life stages: childhood and youth,
working age, old age.
• Childcare, pre-school education, day care and education have the goal to enable children to
qualify them. Compensatory social policies for this stage are child benefits and family
allowances.
• In working age, «social investment policies consist first and foremost of active labour market
tools such as training and employment services, aiming at facilitating human capital and
(re)integration to the labour market. But also services for disabled and socially excluded can be
considered as capacitating policies in this life stage» (Ibidem: 9). On the compensation side,
50
Kuitto considered cash transfers (sick pay, unemployment benefits and parental leave
schemes), aiming at income-replacing.
• For elderly, olg age and survivors function are divided into cash transfers, that are
compensatory, and in-kind services, like care facilities, home help, social assistance,
capacitating and enabling independent living.
Kuitto selected the decade of social investment turn, 2000-2010. Our decision was to expand
the time horizon and to analyse it in three steps: before Lisbon agenda (pre-investment European
strategy), the Lisbon period (a first European social investment plan of action), the 2008 crisis and
its aftermath.
In Kuitto’s findings all regimes spend more at the end of the social investment decade than at
its beginning. Our periodization shows a different configuration: expenditure trends of welfare
regimes are very different. Only the old age function indicate a common movement between
regimes: European states spend now more than pre-2000 for both investment and compensation
policies.
Regarding the spending policies for children and youth, we observe an upswing of Anglo-Saxon
and Continental countries compared to the Nordic nations, but this run-up is concentrated on
compensation expenditure for UK and Ireland. The same trade-off describes the trajectory of
countries included in Southern regime, i.e. a growth more than proportional of compensation
policies. Finally, CEE nations decreased social spending on children and youth topic. On average,
investment amounted to 5,95% of GDP in 1997-2000 and 6,03 in 2008-2012, with an increase of
10,32%.
On working age, the convergence trend between Continental, Anglo-Saxon and Nordic
countries, detected by Kuitto (2014: 13), is not fully confirmed. Despite the recovery after 2008,
social expenditure is lower especially in the more recent period than in the former one. Uk and
Ireland confirm their focus on compensation policies. Only Southern and CEE countries try to
catch-up from their previously low levels, for both measures. On average, European social
investment expenditure for working age shift from 1,19 to 1,22% of GDP, with a very little growth.
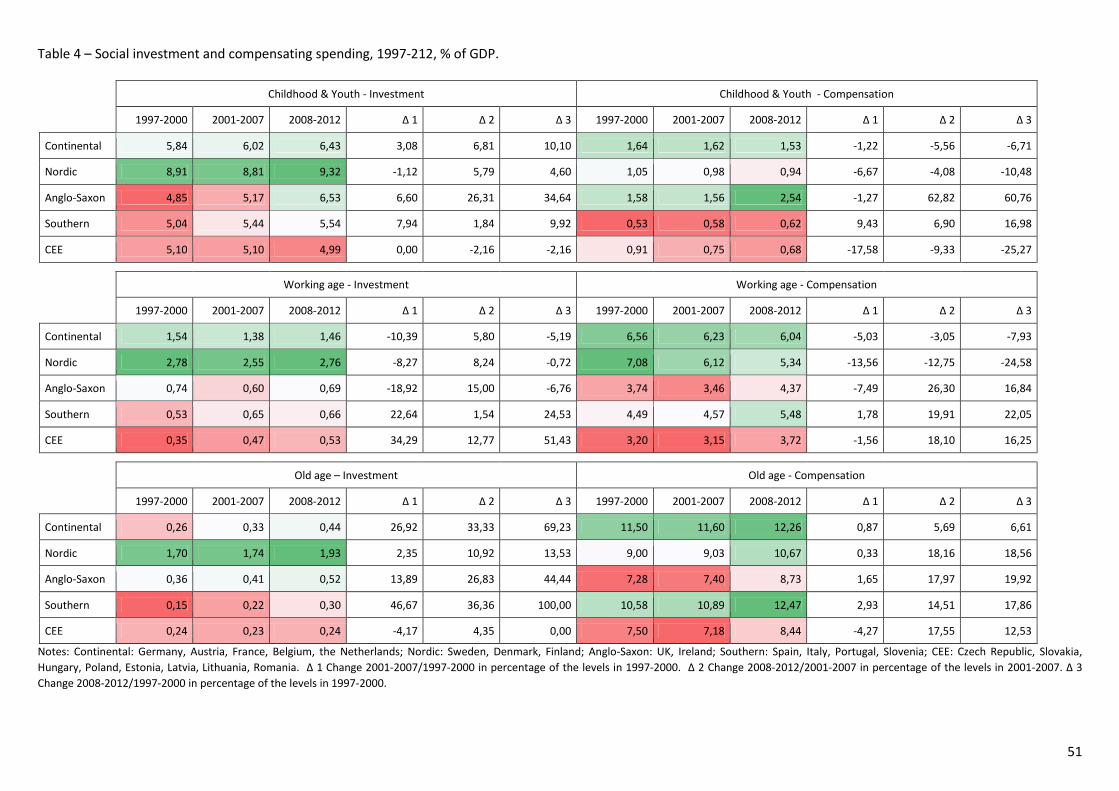
51
Table 4 – Social investment and compensating spending, 1997-212, % of GDP.
Notes: Continental: Germany, Austria, France, Belgium, the Netherlands; Nordic: Sweden, Denmark, Finland; Anglo-Saxon: UK, Ireland; Southern: Spain, Italy, Portugal, Slovenia; CEE: Czech Republic, Slovakia,
Hungary, Poland, Estonia, Latvia, Lithuania, Romania. Δ 1 Change 2001-2007/1997-2000 in percentage of the levels in 1997-2000. Δ 2 Change 2008-2012/2001-2007 in percentage of the levels in 2001-2007. Δ 3
Change 2008-2012/1997-2000 in percentage of the levels in 1997-2000.
Childhood & Youth - Investment Childhood & Youth - Compensation
1997-2000 2001-2007 2008-2012 Δ 1 Δ 2 Δ 3 1997-2000 2001-2007 2008-2012 Δ 1 Δ 2 Δ 3
Continental 5,84 6,02 6,43 3,08 6,81 10,10 1,64 1,62 1,53 -1,22 -5,56 -6,71
Nordic 8,91 8,81 9,32 -1,12 5,79 4,60 1,05 0,98 0,94 -6,67 -4,08 -10,48
Anglo-Saxon 4,85 5,17 6,53 6,60 26,31 34,64 1,58 1,56 2,54 -1,27 62,82 60,76
Southern 5,04 5,44 5,54 7,94 1,84 9,92 0,53 0,58 0,62 9,43 6,90 16,98
CEE 5,10 5,10 4,99 0,00 -2,16 -2,16 0,91 0,75 0,68 -17,58 -9,33 -25,27
Working age - Investment Working age - Compensation
1997-2000 2001-2007 2008-2012 Δ 1 Δ 2 Δ 3 1997-2000 2001-2007 2008-2012 Δ 1 Δ 2 Δ 3
Continental 1,54 1,38 1,46 -10,39 5,80 -5,19 6,56 6,23 6,04 -5,03 -3,05 -7,93
Nordic 2,78 2,55 2,76 -8,27 8,24 -0,72 7,08 6,12 5,34 -13,56 -12,75 -24,58
Anglo-Saxon 0,74 0,60 0,69 -18,92 15,00 -6,76 3,74 3,46 4,37 -7,49 26,30 16,84
Southern 0,53 0,65 0,66 22,64 1,54 24,53 4,49 4,57 5,48 1,78 19,91 22,05
CEE 0,35 0,47 0,53 34,29 12,77 51,43 3,20 3,15 3,72 -1,56 18,10 16,25
Old age – Investment Old age - Compensation
1997-2000 2001-2007 2008-2012 Δ 1 Δ 2 Δ 3 1997-2000 2001-2007 2008-2012 Δ 1 Δ 2 Δ 3
Continental 0,26 0,33 0,44 26,92 33,33 69,23 11,50 11,60 12,26 0,87 5,69 6,61
Nordic 1,70 1,74 1,93 2,35 10,92 13,53 9,00 9,03 10,67 0,33 18,16 18,56
Anglo-Saxon 0,36 0,41 0,52 13,89 26,83 44,44 7,28 7,40 8,73 1,65 17,97 19,92
Southern 0,15 0,22 0,30 46,67 36,36 100,00 10,58 10,89 12,47 2,93 14,51 17,86
CEE 0,24 0,23 0,24 -4,17 4,35 0,00 7,50 7,18 8,44 -4,27 17,55 12,53
52
The difference between Nordic welfare states and the others especially regards old age
investment policies. as Kuitto showed, we find Nordic countries to triple the second best
(1,93% versus 0,52). In other words: «The remarkable service-orientation of old-age targeted
policies thus remains the trade-mark of the Nordic regime» (Kuitto, 2014: 139). Even if the
Scandinavian countries are investing on old age policies our data confirm that all the other
regimes too reinforce their financial old-age effort. We have to underline that whereas
European nations spend 10,51% of GDP on cash pensions, they invest in social services for
the elderly only the 0,69 % of GDP.
We agree with Kuitto’s conclusion: there is no clear trends towards more social
investment spending, in particular there isn’t a clear trade-off between compensatory and
social investment spending. Even the life course hypothesis isn’t corroborate: the social
spending for elderly is growing more than those for childhood and youth. Another important
notice: “working age” is the only social spending target that is subject to a recalibration.
4. Conclusion. A social investment convergence in Europe or a quiet and uneven
revolution?
In a recent essay on the development of the social investment paradigm, Hemerijck
(2015) states that, contrary to the critics, at European level a revolution acts out, although a
quiet and somewhat paradoxical revolution. On one hand, it is a paradox because there is
not a real political support structure for social investment: the problem lies in the temporal
discrepancy between the short-term electoral rewards and the long-term (e.g. early
childhood) investment. On the other side, it is quiet because this approach requires long
cycle of policy changes: «the multidimensional and multilayered infrastructure of the
welfare state almost inevitably requires transformative policy change to take effect over a
long cycle of sequentially layered and interconnected parametric policy changes, driven by
lateral spillover effects, unintended consequence and trial-and-error correction, rather than
through an episodic, highly politicised meta-policy paradigm revolution» (Ibidem: 253).
Data from our research confirms to some extent this interpretation and for others and
fundamental extent challenge it.
53
Compared to the total social expenditure the thesis of a stable European welfare system
proceeding in a slow but progressive way is confirmed: by considering % of GDP, data show
an up-ward trend for almost all countries from 1995-2000 to 2008-2013.
The situation is different if we analyse the three policy areas typical of social investment:
1. The ESPN issue about a reduction in spending on families and children function is not
confirmed: we find that in the crisis period family function expenditure has the most
important growth together with education. It is worth to say that this expansion
concerns especially family or children allowances.
2. Support for parents’ labour market participation is the new real emerging policies field.
Childcare, long term care and maternal/paternal/parental leave schemes have an
important growth both in life-course and ESPN areas analysis. This means that in the EU
there is a tendency at least to maintain, if not to invest, the expenditure for younger age
groups and for care responsibilities. This policy area focuses, linked to human capital
development and to women employability, seems to go far quiet.
3. ALMPS are the weakest link: they decreased from 0,73 (1997-2000) to 0,40 % of GDP
(2008-2012). ALMPs have a double movement structure: an important decrease (from
1997-2000 to 2001-2007) and then a stabilisation (2008-2013 in comparison with 2001-
2007), due especially to new Central and Eastern Europe countries. Also, passive
measures for labour market participation confirm their stability and predominance in the
employment sector.
Another important social investment indicator is the education expenditure: European
states show a small growth in public expenses for education, but not a trend towards
convergence: European countries spend more now than in 1997-2000 and 2001-2007, but
the laggards don’t have regained yet.
Moreover, the life-course analysis shows the importance of old age expenditure. Since
the 1980s the main expenditure trend concerns this function: whereas Nikolai affirmed that
many countries have increased their spending in the 1990s and 2000s and have restrained
expenditure after 2000, we could add that after 2008 there is an upswing for almost all
European nation.
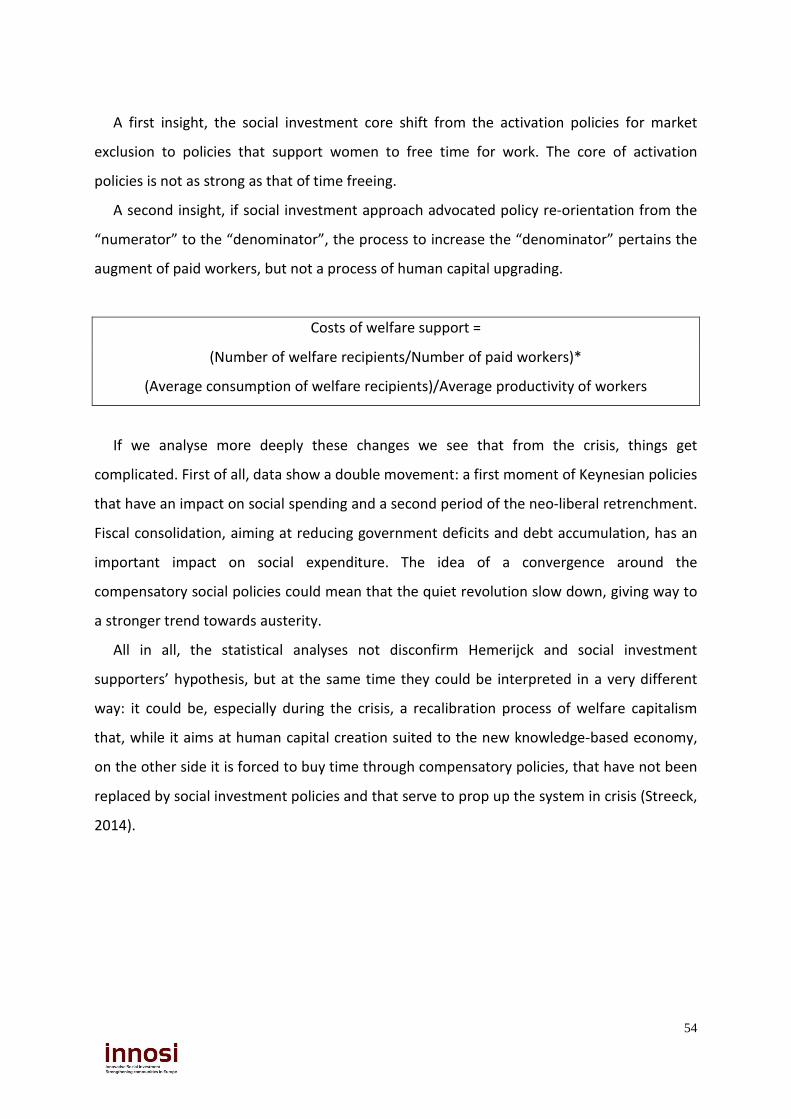
54
A first insight, the social investment core shift from the activation policies for market
exclusion to policies that support women to free time for work. The core of activation
policies is not as strong as that of time freeing.
A second insight, if social investment approach advocated policy re-orientation from the
“numerator” to the “denominator”, the process to increase the “denominator” pertains the
augment of paid workers, but not a process of human capital upgrading.
Costs of welfare support =
(Number of welfare recipients/Number of paid workers)*
(Average consumption of welfare recipients)/Average productivity of workers
If we analyse more deeply these changes we see that from the crisis, things get
complicated. First of all, data show a double movement: a first moment of Keynesian policies
that have an impact on social spending and a second period of the neo-liberal retrenchment.
Fiscal consolidation, aiming at reducing government deficits and debt accumulation, has an
important impact on social expenditure. The idea of a convergence around the
compensatory social policies could mean that the quiet revolution slow down, giving way to
a stronger trend towards austerity.
All in all, the statistical analyses not disconfirm Hemerijck and social investment
supporters’ hypothesis, but at the same time they could be interpreted in a very different
way: it could be, especially during the crisis, a recalibration process of welfare capitalism
that, while it aims at human capital creation suited to the new knowledge-based economy,
on the other side it is forced to buy time through compensatory policies, that have not been
replaced by social investment policies and that serve to prop up the system in crisis (Streeck,
2014).
55
REFERENCES
Acemoglu, 2005 Institutions as a fundamental cause of long-run growth, in P. Aghion and S. N. Durlauf
(eds.), Handbook of Economic Growth, Amsterdam, North Holland, pp. 385-472. Adema, W., Fron P. and Ladaique, M. 2011 “Is the European Welfare State Really More Expensive?: Indicators on Social
Spending, 1980-2012; and a Manual to the OECD Social Expenditure Database (SOCX), OECD Social, Employment and Migration Working Papers, No. 124, OECD Publishing.
Andreß, H.-J. and Heien, T. 2001 Four Worlds of Welfare State Attitudes? A Comparison of Germany, Norway, and the
United States, European Sociological Review, 17 (4), pp. 337-56. Arts, W. and Gelissen, J. 2001 Welfare States, Solidarity and Justice Principles: Does the Type Really Matters?, Acta
Sociologica, 44(4), pp. 283-299. Beckfield, J. 2008 Integration and Isomorphism among Welfare States in the European Union. Panel on
“Sociological Theory and European Integration,” European Consortium for Political Research Pan-European Conference on EU Politics, Riga, Latvia.
Bonoli, G. 2005 The politics of the new social policies. Providing coverage against new social risks in
mature welfare states, Policy and Politics, 33 (3), pp. 431-449. Bouget, D., Frazer, H., Marlier, E., Sabato, S. and Vanhercke, B. 2015 Social investment in Europe. A study of national policies, European Social Policy
Network. Cantillon, B. 2011 The paradox of the social investment state: growth, employment and poverty in the
Lisbon era. Journal of European Social Policy, 21(5), pp. 432-449. Castels, F. G. 2004 The Future of the Welfare State: Crisis Myths and Crisis Realities, Oxford: Oxford
University Press. De Deken, J. 2014 “Identifying the skeleton of the social investment state: defining and measuring
patterns of social policy change on the basis of expenditure data”, in B. Cantillon and F. Vandenbroucke (eds.), Reconciling work and poverty reduction: how successful are European welfare states?, Oxford, Oxford University Press, pp. 260-285.
Dräbing, V., Hemerijck, A. and Eichhorst, W. 2013. Beyond the Service Sector Trilemma: Towards a Better Understanding of Social
Investment Policy Synergies. DRAFT. Esping-Andersen, G. 1990 The three worlds of welfare capitalism. Cambridge: Polity Press.
56
2002 Towards the Good Society, Once Again?, in G. Esping-Andersen, D. Gallie, A., Hemerijck, and J. Myles, Why We Need a New Welfare State, Oxford, Oxford University Press.
Esping-Andersen, G., Gallie, D., Hemerijck, A. and Myles, J. 2002 Why We Need a New Welfare State, Oxford, Oxford University Press. European Commission 2013a Evidence on Demographic and Social Trends, Social Policies' Contribution to Inclusion,
Employment and the Economy. SWD(2013). 2013b Towards Social Investment for Growth and Cohesion – including implementing the
European Social Fund 2014-2020. COM(2013). 2013c Social Investment Package. Key facts and figures Ferrera, M. 2013 Neowelfarismo liberale: nuove prospettive per lo stato sociale in Europa, Stato e
mercato, 1, pp. 3-36. Friedman, M. 1962 Capitalism and freedom. University of Chicago press. Hall, P. 1993 Polcy Paradigm, Social Learning and the State, Comparative Politics, 25 (3), pp. 275-
296. Hemerijck, A. 2013 Changing Welfare States. Oxford: Oxford University Press. 2014 Social investment «stocks», «flows» and «buffers», Politiche sociali, 1, pp. 9-26. 2015 The Quiet Paradigm Revolution of Social Investment, Social Politics: International
Studies in Gender, State and Society, 22 (2), pp. 242-256 Hemerijck, A., Dräbing, V., Vis, B., Nelson, M. and Soentken, M. 2013 European welfare states in motion, Neujobs Working paper, 5.2. Hodgson, G. 2011 The Evolution of Capitalism from the Perspective of Institutional and Evolutionary
Economics, in G. Hodgson, Itoh, M. and Yokokawa, N. (eds) (2001) Capitalism in Evolution: Global Contentions – East and West, Cheltenham: Edward Elgar, pp. 63-82.
Hudson. J. , S. 2009 Towards productive welfare? A comparative analysis of 23 OECD countries. Journal of
European Social Policy, 19 (1), pp. 34-46. Kuitto , K. 2014 Trends of social investment and compensating welfare policies in Europe: A life
course perspective, Greifswald Comparative Politics, Working Paper 8. Kvist, J. 2013 The Post-Crisis European Social Model: Developing or Dismantling Social
Investments?, Journal of International and Comparative Social Policy, 29 (1), pp. 91-107.
Jenson, J. 2009 Lost in translation: the social investment perspective and gender equality, Social
Politics: International studies in Gender, State & Society, 16 (4).
57
2012 Redesigning citizenship regimes after neoliberalism: moving towards social investment, in Morel, N., Palier, B. and Palme, J. (eds) Towards a Social Investment State? Ideas, Policies and Challenges. Bristol: Policy Press, 61-87.
Mahon, R. 2012 Social Investment according to the OECD/DELSA: A Discourse in the Making, Welfare
Societies Working Papers, 3. Mandin, L. and Palier, B. 2004 L’Europe et les politique sociales. Vers une harmonisation congnitive des réponses
nationales, in Y. Surel and C. Lequesne (eds.), L’Intégration Européenne. Entre Emergence Institutionnelle et Recomposition de l’Etat, Paris: Presses de Science Po.
Morel, N., Palier, B. and Palme, J. 2012 Beyond the Welfare State as we knew it? in N. Morel, B. Palier and J. Palme, Towards
a Social Investment Welfare State? Ideas, Policies and Challenge, Bristol: Policy Press, pp. 1-30.
Morgan, K. J. 2009 Child Care and the Social Investment Model: Political Conditions for Reform, in Morel
N., Palier B. and Palme J. (eds.), What Future for Social Investment?. Stockholm: Institute for Futures Stdies Research Report, pp. 45-54.
Needham C. and Carr, S. 2012 Co-production: an emerging evidence base for adult social care transformation,
London: SCIE research briefing. Nikolai, R. 2011 Towards Social Investment? Patterns of Public Policy in the OECD World, in N. Morel,
B. Palier and J. Palme, Towards a Social investment Welfare state? Ideas, policies and challenges, Bristol: Policy Press.
Painter, A. and Thoung, C. 2015 Creative Citizen, Creative State: The principled and pragmatic case for a Universal
Basic Income, London: RSA. Available at https://www.thersa.org/discover/publications-and-articles/reports/basic-income/
Polanyi, K. 1944 The Great Transformation, New York: Farrar & Rinehart. Prandini, R. and Sabel, C. F. 2013 Personalizzare il welfare, Sociologia e Politiche sociali, 16 (3). Sabel, C. F. 2004 Beyond Principal-Agent Governance: Experimentalist Organizations, Learning and
Accountability in E. Engelen and M.S. Dhian Ho (eds.), De Staat van de Democratie. Democratie voorbij de Staat. WRR Verkenning 3 Amsterdam: Amsterdam University Press, pp. 173-195.
2005 Globalisation, New Public Services, Local Democracy: What's the Connection?, presented at Local Governance and Production conference in Trento, June 2005; published by OECD December (2005).
2011 Individualized Service Provision as the key to the New Welfare State: Lessons from Special Education in Finland, with AnnaLee Saxenian, Reijo Miettinen, Peer Hull Kristensen, and Jarkko Hautamäki, December 2011.
Sen, A.
58
1999 Development as freedom, Oxford University Press. Story, M. 2015 Free Market Welfare: The case for a Negative Income Tax. Adam Smith Institute.
Available at http://www.adamsmith.org/wp-content/uploads/2015/10/NIT_WEB.pdf Streeck, W. 2014 Taking Crisis Seriously: Capitalism on Its Way Out, Stato e mercato, 1, pp. 45-68. Streeck, W. and Mertens, D. 2011 Fiscal Austerity and Public Investment. Is the Possible the Enemy of the Necessary?,
MPIfG Discussion Paper 11/12, Cologne: Max Planck Institute for the Study of Societies.
Taylor-Gooby, P. 2004 New Risks, New Welfare: The Transformation of the European Welfare State. Oxford:
University Press. Taylor-Gooby P. , Gumy J.M. and Otto A. 2015 Can ‘New Welfare’ Address Poverty through More and Better Jobs?, Journal of Social
Policy, 44(1), pp. 83-104. Van Lancker W. and Ghysels J. 2012 Who benefits? The social distribution of subsidized childcare in Sweden and Flanders,
Acta Sociologica, Vol. 55(2), pp. 125-142. van Vliet, O. 2010 Divergence within Convergence: Europeanization of Social and Labour Market
Policies. European Integration, 32(3), pp. 269-290. van Vliet, O. and Wang, C. 2015 Social Investment and Poverty Reduction: A Comparative Analysis across Fifteen
European Countries. Journal of Social Policy, 44(03), pp. 611-638. Vandenbroucke, F., Hemerijck, A. and Palier, B. 2011 The EU Needs a Social Investment Pact. OSE opinion paper 5. Vandenbroucke, F. and Vleminckx, K. 2011 Disappointing Poverty Trends: Is the Social Investment State to Blame?, Journal of
European Social Policy, 21(5), pp. 450-471. Wilthagen, T. & R. Rogowski 2002 Legal Regulation of Transitional Labour Markets in Schmid and B. Gazier, eds. , The
Dynamics of Full Employment: Social Integration through Transitional Labour Markets. Cheltenham: Edward Elgar, pp. 233-273.