Embed Size (px)
Citation preview

1
78184
South–South migration and the labor market:
Evidence from South Africa
Giovanni Facchini∗, Anna Maria Mayda†, Mariapia Mendola‡
June 3, 2011
Abstract
Using census data for 1996, 2001 and 2007 we study the labor
market effect of immigration in South Africa. In this period the share
of foreign born over the total population has grown by almost fifty
percent, and both the characteristics and geographical distribution of
immigrants show substantial variation over time. We exploit these
features of the data to carry out an analysis that combines both the
“spatial correlation” approach pioneered by Card (1990) and the vari-
ation across schooling and experience groups used by Borjas (2003).
We estimate that increased immigration has a negative effect on na-
tives’ employment outcomes, but not on total income. Furthermore,
we find that skilled South Africans appear to be the most negatively
affected subgroup of the population.
JEL classification numbers: F22, J61
Keywords: Immigration, Labor market effects, South Africa.
∗Erasmus University Rotterdam, Universita degli Studi di Milano, Centro Studi Luca
d’Agliano, CEPR and CES–Ifo; email: [email protected]. †Georgetown University, Centro Studi Luca d’Agliano, CEPR and IZA; email:
[email protected]. ‡Universita degli Studi di Milano Bicocca and Centro Studi Luca d’Agliano; email:
Pub
lic D
iscl
osur
e A
utho
rized
Pub
lic D
iscl
osur
e A
utho
rized
Pub
lic D
iscl
osur
e A
utho
rized
Pub
lic D
iscl
osur
e A
utho
rized
Pub
lic D
iscl
osur
e A
utho
rized
Pub
lic D
iscl
osur
e A
utho
rized
Pub
lic D
iscl
osur
e A
utho
rized
Pub
lic D
iscl
osur
e A
utho
rized
1
“...They come from all over, and they are of all sorts, the new
African migrants. There are the professionals – the doctors and
academics, highly educated and hoping that in this country their
skills can at last earn them a living wage. There are the traders,
buying up what the shopping malls have to offer, and traveling
home twice a month with bulging suitcases... There are the hawk-
ers and the hustlers, who travel south out of desperation... And
then there are the criminals; the drug dealers, the pimps and
fraudsters.” (Phillips 2002)
1 Introduction
Following the demise of the Apartheid regime, important political changes
have swept South Africa, leading to the 1994 democratic election of a ma-
jority government. At the same time, the country’s position as a regional
economic superpower has made it a very attractive destination for migrant
workers from the surrounding areas in search of new job opportunities. Until
2002, migration was disciplined by the “Aliens Control Act” of 1991, a piece
of legislation which was rooted in the “control and expulsion” mentality of
the Apartheid era, inspired by a fundamentally racist and anti–semitic per-
spective (Peberdy and Crush 1998). After 2002, with the introduction of the
new Immigration Act (Act 13), and its subsequent amendment in 2004, the
policy stance changed substantially. Today South Africa sees the inflow of
foreign workers (and especially of skilled ones) as a tool of economic growth,
and this is a significant break from the control–oriented framework of the
past.
Still, xenophobic episodes against immigrants are common place (McDon-
ald 2000 and Friebel, Gallego, and Mendola 2010) and suggest that natives
often perceive immigrants as a threat. While several studies have provided

2
a qualitative assessment of recent migration to South Africa, remarkably lit-
tle evidence exists on the labor market effect of foreign immigration to the
country. The purpose of this paper is to help fill this gap and to provide
what is – to the best of our knowledge – the first systematic study of the
labor market effects of immigration to this country.
In carrying out our analysis, we use three large datasets provided by
Statistics South Africa and covering 1996, 2001 and 2007. We start by doc-
umenting the patterns of immigration to South Africa. First, we find that
the inflow of immigrants has increased substantially over the period we are
considering. In 1996, about 2 percent of the population (or 4.7 percent of the
male labor force) was made up by foreigners, and that share had increased to
almost 3 percent of the population (or 6.1 percent of the male labor foce) in
2007. Second, and contrary to widespread beliefs in the country (Crush and
Williams 2010), foreign male workers in South Africa are relatively highly
educated. In particular, as of 2007, they are approximately two times more
likely than native workers to have attained a college degree. The importance
of foreign workers is even higher when we look at individuals at the very top of
our skill classification, i.e. individuals who are not only highly educated, but
also have a long labor market experience. Third, we find that other African
countries are becoming an increasingly important source of immigrants (note
that we are able to observe this information only for the first two years of
our sample). Thus, the overall picture that emerges is one in which South
Africa has been able to turn itself into a very attractive destination for highly
skilled workers coming mostly from the surrounding regions.
We turn then to the analysis of natives’ labor market outcomes. We
exploit the variation both in the distribution of immigrants across districts
within the country and over the three years of our sample. Our rich dataset
allows us to identify 56 districts. We follow Borjas (2003) to define a skill
level as being characterized by both educational achievement and labor mar-

3
ket experience, thus identifying 32 skill levels. We find that immigration had
on average a large and negative impact on natives employment status. In
our benchmark specification, a ten percent increase in the labor supply of a
skill group brought about by immigration leads to a 6.7 percent decrease in
natives’ total employment. At the same time, we do not find a significant
effect of immigration on our monetary compensation measure. One impor-
tant caveat in interpreting the latter finding is that our data only provides
information on individual total income and, as a result, it is not possible
for us to disentangle changes in wages from changes in the number of hours
worked. One possible explanation of the two above results is labor market
rigidities, which are widespread in South Africa where unemployment rates
have exceeded 25 percent for most of the last decade.
As immigration to South Africa is very heterogeneous, we repeat our anal-
ysis focusing on four separate education groups (less than primary completed,
less than secondary completed, secondary completed plus some college and,
finally, college graduates)1 Interestingly, we find that the negative average
employment effect we have documented is higher for the medium and highly
skilled.
The remainder of the paper is organized as follows. Section 2 provides
an overview of the related literature, whereas section 3 discusses the South
African migration history. Section 4 introduces the data, whereas section 5
contains our empirical analysis. Section 6 concludes the paper.
1 The definition of educational categories by the South African census is slightly different
from the U.S.. In particular, “secondary completed” and “some college” are combined into
one category. Therefore, caution is needed in comparing our numbers with figures from
other studies, for example Borjas (2006).

4
2 Related literature
Our paper is related to two strands of the literature. First, it is a contribution
to the distinguished body of work which has studied the labor market effect
of immigration. Second, it represents one of the first systematic studies of the
effect of South-South migration and, thus, of the challenges and opportunities
of developing and medium-income countries which are local attractors of
international labor flows.
Two approaches have been traditionally followed to understand the labor
market effect of immigration. The first, which is known as the “spatial corre-
lation” methodology, exploits the variation in the distribution of immigrants
across different geographic areas in the destination country. Among the early
contributions to this literature, Card (1990) studied the effect of the 1982
Mariel boatlift on the Miami labor market. Notwithstanding the large im-
migration shock – the inflow of Cuban immigrants led to an increase in the
labor force in the Miami metropolitan area of approximately 7% – he found
very little effect in terms of natives labor market outcomes. Studies follow-
ing a similar strategy have been carried out on a variety of other destination
countries. They include the analysis of the effect of the forced repatriation
of “pieds noirs” from the North African colonies to France (Hunt 1992), the
analysis of the impact of Russian immigration to Israel in the 1990’s (Fried-
berg 2001), the study of the effect of recent immigration to Germany by
Pischke and Velling (1997), etc. Similarly to Card (1990), all these stud-
ies have found only a very limited impact of immigration on the local labor
market.2
A second approach has been instead pioneered by Borjas (2003), and has
focused on a national–level analysis. The main idea behind this method-
ology is that the findings of spatial correlation studies might be biased for
2 See Friedberg and Hunt (1995) for an excellent review of this literature.

5
two main reasons. First, immigrants do not distribute themselves randomly
across geographical regions in the destination country: they tend to cluster
in areas in which the economy is stronger and where the demand for the ser-
vices they can provide in the labor market is more sustained. In addition, the
inflow of immigrants in a certain area of the country might lead to a reaction
by natives, who could decide to relocate elsewhere, where the labor-market
pressure is lower. Both these potential sources of bias lead to underestimate
the true labor market effect of immigration in spatial correlation studies. For
this reason, Borjas (2003) argues that a more appropriate setup to carry out
the analysis is the national one. By focusing on this framework, the analysis
picks up average national labor market effects and, under the assumption
that migration out of the destination country’s labor market is limited, this
strategy will minimize the bias brought about by natives’ reaction to mi-
gration. Borjas (2003) exploits the variation in the distribution of migrants
across 32 different skill levels, each characterized by a given educational at-
tainment and extent of labor market experience. Differently from the studies
based on the spatial correlation approach, he finds a substantial negative
impact of immigration on the wages of native workers. Aydemir and Borjas
(2007) use the same methodology to compare the experience of two desti-
nation countries, i.e. Canada and the United States, with that of Mexico,
an important source of migrants, and find that the changes in the supply
of workers brought about by migration do have the expected impact on the
labor market outcomes of individuals who have not moved.3 A more recent
study by Ottaviano and Peri (2011) has called into question some of the re-
sults by Borjas (2003), arguing that even within the same skill cell, migrants
and native workers are not perfect substitutes. Under this assumption, the
authors find a much smaller effect of immigration on native workers wages,
which is actually positive on average.
3 Mishra (2007) has obtained similar results for the case of Mexico.

6
The two approaches we have discussed can be linked, as has been sug-
gested by Borjas (2006) in a recent study which uses US census data covering
the period 1960–2000. Interestingly, he finds that inflows of foreign workers
in a US subnational geographic unit (state or metropolitan area) are associ-
ated with lower in-migration rates, higher out-migration rates, and a decline
in the growth rate of the native workforce. Importantly, he also finds that
the native migration response attenuates the measured impact of immigra-
tion on wages in the local labor market, suggesting that taking into account
this dimension is important to estimate the true effect of immigration.
The analysis we carry out in this paper is related to both strands of the
literature. We exploit the variation in the distribution of migrants across
geographical areas in South Africa as in the “spatial correlation approach”.
In addition, we define skill as in national labor-market studies. In addition,
as in Borjas (2006), we control for the lagged dependent variable to address
the endogeneity of the migration decision, i.e. the non–random allocation of
migrants across space.
This paper is also related to the small literature which has analyzed labor
flows to South Africa. Several contributions in this tradition have investi-
gated the main features of migration to this country. Crush and Williams
(2010) and Landau and Segatti (2009) contain a broad overview of the phe-
nomenon, with some interesting insights on the evolution of the recent mi-
gration policy. McDonald (2000) is instead a collection of essays looking at
the evolution of the phenomenon in the early post–Apartheid era, drawing
on a series of original individual level surveys. Bhorat, Meyer, and Mlatsheni
(2002) focuses instead on the emigration of skilled workers from the Southern
African region. To the best of our knowledge, to this date there has been
no systematic study of the effect of labor migration on natives’ labor market
outcomes. The purpose of this paper is to fill this important gap in our
understanding of the phenomenon.
7
3 Migration to South Africa
South Africa has been the destination of large cross border labor flows at least
since the mid of the nineteenth century, when migrants from Lesotho, Malawi,
Mozambique and Zimbabwe came to work in the sugar cane fields of Natal
and the recently opened diamond mines in Kimberly (Crush 2000). Ever
since, migration and the debate around migration have been a mainstay of the
public policy arena in the country. Systematic, reliable data on the size of the
immigrant population for the pre-Apartheid period are difficult to obtain, but
we can distinguish four main channels through which workers have entered
the country: as contract laborers, especially in the mining sector; as informal
migrants, to work mainly in the construction, service and agricultural sectors;
as refugees, following the eruption of civil conflicts in neighbouring states and,
finally, as the result of a “white flight”, brought about by the creation of new
post–colonial governments in neighbouring countries starting in the sixties.
Public policies towards immigrants and immigration have greatly varied
over time. Contract migration in the mining sector has been introduced
right after the discovery of the gold fields in the Witwaterstrand area in the
1880s, and has long been perceived as a critical input in the industry. Fierce
competition among employers has prevailed up until the 1920s, when a central
recruiting agency (the Mine Labour Organisation) became the only gate into
the mining industry for migrants. Recruitment offices were established in
the countries surrounding South Africa, and modern transportation networks
were also introduced to ferry migrant workers to the mining regions. This
type of migration was mainly temporary, and agreements were reached with
the neighbouring nations to insure that workers will return home.
As a result of these efforts, the number of contract workers employed
in the sector rose quickly. By the 1920s, approximately 100 thousand for-
eign workers were employed in the South African gold mines (Crush 2000).

8
By 1940, the figure had reached 170 thousand and, by 1960, 233 thousand.
Immigrant contract employment peaked in 1970 at approximately 265 thou-
sand workers. Similarly, informal immigrants employed in the construction,
service and agricultural sectors have also been welcomed throughout this
period.
In the last two decades of the Apartheid regime, growing racial tensions,
coupled with a more active role played by labor unions in the domestic labor
market, led the South African government to perceive black migration as the
source of political threat. As a result, starting from the early seventies, im-
migration – both legal and illegal – decreased substantially, thanks both to a
reduction in the demand for foreign workers by domestic businesses and also
to the stricter border enforcement policies, which were put in place by the
government (Crush 2000). At the same time, up until the end of Apartheid,
white immigrants have been welcomed to the country, and policies have even
been put in place to facilitate their arrival (free passage was offered to Eu-
ropean immigrants during the sixties and seventies). Finally, the general
stance towards refugees has been one of limited tolerance, especially in the
case of the Mozambicans, who fled their country in large numbers following
the civil conflict which saw South Africa as one of the main players.
In the post 1994 period, census data show that migration to South Africa
has been characterized by a steady increase in the number of foreigners re-
siding in the country. Interestingly, the flow of foreign workers has been
remarkably less volatile than in other parts of the continent (Lucas 2006),
even though in many cases it has remained temporary in nature. Over the
period 1996-2007 the overall number of foreign born in South Africa has
grown from approximately seven hundred thousand to one million two hun-
dred thousand,4 i.e. an increase of approximately 74 percent. As a result,
4 These figures suggest that the South African census, as it is true also for the US census,
includes information not only on “legal” migrants, but also on individuals who are in the
country illegally. In fact, recent estimates by Crush and Williams (2010) suggest that,

9
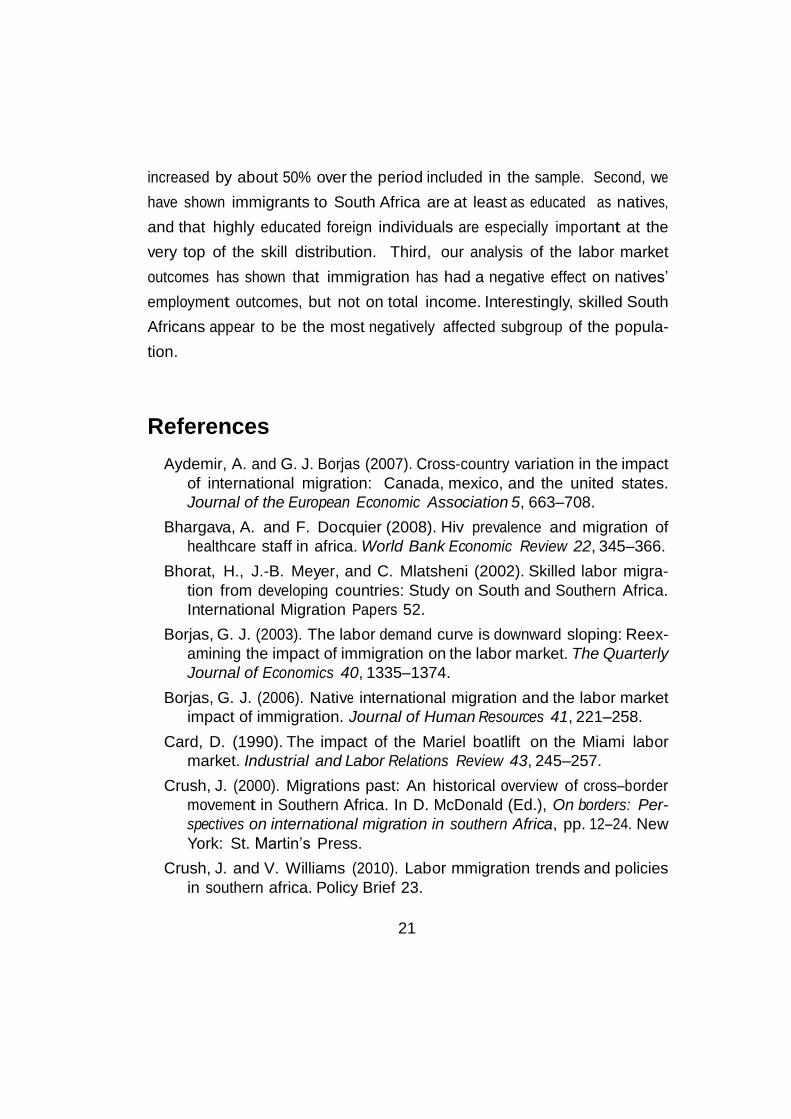
in 1996 migrants represented 2.1 percent of the total population, whereas in
2007 they made up 2.94 percent of the total (see Figure 1). The importance
of foreign workers is even greater. If we focus on males in the labor force (i.e.
those who are either working or seeking work), the share of immigrants over
the period grew from 4.6 percent in 1996 to 6.1 percent in 2007 (see Figure
2).
Notwithstanding this sizable favorable dynamics, many observers have ar-
gued that even in the aftermath of Apartheid’s demise, the South African mi-
gration policy stance has remained overall rather restrictive (Peberdy 2001).
This stance was reflected in the 1991 Aliens Control Act, which has been
nicknamed ‘Apartheid’s last act’ (Landau and Segatti 2009), and which was
the cornerstone of South African immigration policy in the nineties. Drafted
to simplify all the previous immigration laws enacted after 1937, it gener-
ated fundamental tensions after the transition to the democratic regime and
was ultimately declared unconstitutional. Following this decision, a lengthy
process was started to substantially reform the existing immigration policy
framework, which culminated in the Immigration Act of 2002 and in the
subsequent Immigration Amendment Act of 2004. The two pieces of legisla-
tion are oriented towards favoring highly skilled immigration and investors.
In particular, four different categories of work permit (quota, general, ex-
ceptional skills and intra-company transfer) have been introduced, together
with a business permits and a wide variety of other entry categories, which
in general do not allow to work. The initial quota allocation, as presented
in February 2003, allowed for approximately 740000 yearly permits. Since
then, there has been a dramatic revision of the system, and in 2011 only
35000 work permits could be attributed trough the quota system, covering
53 occupations (skills) deemed ‘scarce and critical’. An explicit goal of the
between 1990 and 2004, only approximately 110 thousand legal immigrants have arrived
in South Africa, i.e. a much smaller figure than the one reported in our data.

10
Immigration Act of 2002 and its amendment of 2004 was also the uprooting
of the widespread xenophobic feelings (see for instance Klotz 2000), even
though as some observers have pointed out, no specific tools to this end have
been discussed in the legislation.
Besides this important reform, which had mainly a multilateral character,
another important recent development in migration policy has been the result
of the active role played by South Africa in the new South African Devel-
opment Community protocol. Even if the agreement has been substantially
watered down in comparison to the original proposal made by the SADC
secretariat in 1995, it still contains important provisions calling for the facil-
itation of trans–border movement of people among member countries. As a
result, new bilateral agreements have been signed with Mozambique (2004)
and Lesotho (2007), that are aimed at progressively lifting border controls
with these countries.
Table 1 uses information on country of birth of migrants, which was col-
lected in the 1996 and 2001 censuses (unfortunately the same information is
not available for 2007), to produce a picture of the evolution of the sources
of South African migrants. What is immediately apparent is the growing im-
portance of Africa. Between 1996 and 2001 the share of foreigners originating
in the continent increased by 3.1 percentage points, from 67.6 to 70.7 percent
of the total. Particularly significant is the role played by Mozambique: by
2001, well over a quarter of the total stock of migrants to South Africa came
from that country, the result of years of civil wars and persisting economic
difficulties which the transition to democracy did not completely solve. The
second most important country of origin is Zimbabwe and, in the five years
included in our sample, the number of migrants originating from this country
has increased by over twenty five percent. Restricting our sample to males
in the labor force, the importance of Africa as the main origin further in-
creases. In fact, by 2001 almost four out of five migrant males in the labor

11
force originated from other African countries.
The second element which emerges from Table 1 is the slight decline in
the importance of Europe as a source of migrants. In 1996, individuals born
in the continent represented approximately 23 percent of the total migrants,
whereas by 2001 that share had declined to 22.3 percent. Looking at the male
labor force, the importance of European migrants declines even more, and by
2001 they represented only 15% of foreign workers. Interestingly, there has
been a significant decline in the relative importance of the UK as a source
country. This trend, and the sustained outflow of skilled workers from South
Africa, has been the subject of much concern both in the academic debate (see
Bhorat, Meyer, and Mlatsheni 2002 and Waller 2006) and among the public.
However, even if skill shortages have been important in some sectors of the
economy (in particular in healthcare, see Bhargava and Docquier 2008), the
brain drain problem in the case of South Africa is likely to have been blown
out of proportion. In fact, as of 2000, only 7.5% of the tertiary educated
South Africans were living outside their country of origin (Docquier and
Marfouk 2006). This figure is very low by middle income country standards
and it is just “average” in relation to advanced economies.5
4 Data
For our analysis we use three surveys carried out by the Statistical Office of
the Republic of South Africa, which have been made available through the In-
ternational IPUMS website (https://international.ipums.org/international/).
The 1996 and 2001 data are a ten percent sample from the population cen-
sus, and cover approximately 3.6 and 3.7 million individuals, respectively.
The 2007 data are instead taken from the South African Community Survey,
5 The corresponding figure for Italy in 2000 is 10%, for the Netherlands 9.6%, for Ger-
many 5.2% etc.
12
and cover approximately 2.2 percent of the population or 1.1 million indi-
viduals.6 A wealth of information is collected, including both labor market
outcomes and important individual level-characteristics. Our analysis will be
restricted to men in the 16-65 age group, who participate in the civilian labor
force (i.e., are either working or seeking work).7 Furthermore, the large size
of the samples allows us to fully exploit the spatial dimension of migration,
taking advantage of the heterogeneity in the distribution of foreign workers
across localities. In particular, we will be able to use information at the dis-
trict level (there are 56 districts in South Africa). An individual is defined
to be an immigrant if he is foreign born.
As for measures of labor market outcomes, we have information on each
individual’s employment status (i.e., whether he is working or seeking work),
type of employment (i.e., whether a person is self-employed, or works for
someone else, either for pay or as an unpaid family worker) and total income.
The latter is defined as the total personal income in local currency (rand)
from all sources in the previous twelve months, and in all three samples the
data are recoded to the midpoints of the broad intervals given in the original
data. The data suffer from the standard “top coding” problem, as the top
interval is coded to its lowest possible value (e.g, code 360,001 for 360,001+).
Unfortunately the data does not allow us to measure labor income (separately
from other sources of income) nor wages (separately from the number of hours
worked).
One of the individual level characteristics we consider is educational at-
tainment, which is measured according to the following four categories: less
than primary (the individual has completed less than 5 years of primary edu-
6 The 1996 and 2001 census data undercount the total population by, respectively, 10.7
percent and 18 percent. 7 One reason we exclude women from the sample is that there is more uncertainty for
women on the time they enter and exit the labor market, thus our measure of labor-market
experience -see below- would be very noisy.

13
cation), less than secondary completed (the individual has between 5 and 11
years of education), secondary completed plus some college (the individual
has at least 12 years of education, but has not completed college) and college
completed (the individual has at least completed 16 years of education).8
Figure 3 reports histograms for the three years in our sample, where we
compare native and immigrant men in the labor force. Several interesting
patterns emerge. First, the share of individuals who have not completed a
primary education has fallen for both groups: for natives, from 26.8 percent
in 1996 to 15.4 percent in 2007, whereas for immigrants the decline has been
from 31.7 percent in 1996 to 19.2 percent in 2007. Second, highly skilled
workers are becoming more common both among foreign born and natives.
Among natives, between 1996 and 2007 the share of males in the labor force
with a college degree has increased from 2.8 percent to 5.3 percent. Among
the foreign born, the increase has been even more substantial: from 6.5
percent to 11.1 percent. In other words, in 2007 more than one out of ten
foreign born males in the labor force had a college education, compared to
one out of twenty natives. Considering also the intermediate categories, the
pattern that emerges from the data is one in which on average today’s South
African immigrants are at least as educated as their domestic counterparts,
and their presence is particularly strong at the very top of the educational
attainment scale.
As has been forcefully argued by Borjas (2003) and Borjas (2006), skills
are acquired both before and after an individual enters the labor market
and, as a result, workers who have the same level of education, but different
levels of experience, are imperfect substitutes in production.9 For this reason,
to be able to assess the impact of foreign workers on natives labor market
opportunities, we need not only to take into account the formal schooling
8 Notice that, in the data, high school graduates are lumped together with individuals
with some college and, as a result, we cannot distinguish the two categories. 9 See also Ottaviano and Peri (2011) for an even finer distinction.

14
received by them, but also how long these workers have been active in the
labor market.
To do this, we follow Borjas (2003) and define a skill group in terms
of both schooling and labor market experience. The latter is identified as
the number of years that have elapsed since the individual has completed
school. So, we assume that the age of entry into the labor force is 16 for a
worker in the “less than primary completed” category and 17 for a worker
in the “less than secondary completed” category. We assume instead that
the typical individual with a high school education or some college enters
the labor force at 21, whereas the typical college graduate enters the labor
force at 23. This definition reflects the assumption that individuals enter the
South African labor force at the legal working age of 15 years old and there
is possibly a one year lag between the end of school and the entry into the
labor force. Our measure is necessarily rough, though, as individuals might
take for instance longer than the statutory number of years (we use four)
to complete a college education or might decide not to immediately enter
the labor market. Furthermore, this measure is particularly problematic for
immigrants as it does not distinguish between experience which has been
acquired working in the destination country, and experience which has been
acquired elsewhere.
To carry out our analysis, we assume that the maximum number of years
of labor market experience is 40, and we follow the literature and create eight
broad categories of labor market experience, based on five–year intervals.
Table 2 and Table 3 report summary statistics on the distribution of na-
tives and immigrants by skill category. What is immediately apparent is that
in all the three years in our sample, immigrants are particularly numerous
at the very top of the skill distribution. For instance, in 1996, an immigrant
is more than four times as likely as a native to have a college degree and
36-40 years of labor market experience. In 2007, this likelihood has further

15
increased to five times. Immigrants are only slightly more likely than natives
to be at the bottom of the skill distribution, i.e. not to have completed a
primary education and have very limited labor market experience. These
results reinforce our initial findings that today educated immigrants are an
important component of South Africa’s foreign workers population, and that
immigrants play a particularly important role in the supply of the very high
skills.
Our rich dataset also allows us to capture the distribution of immigrants
across different localities within South Africa. Figure 4 illustrates the dy-
namic of immigration in three districts which have been particularly affected
by the phenomenon in the period we are considering: the City of Johan-
nesburg metropolitan municipality in the Gauteng province, the district of
Lejweleputsa in the Free State province, and the district of Ehlanzeni in the
Mpumalanga province. The Johannesburg metropolitan area has seen the
number of foreign born male workers almost treble between 1996 and 2007
from 50 thousand to 136 thousand and, as of 2007, immigrants made up
12.6% of the total population. The immigration dynamic in the Lejweleputsa
district has been instead more volatile, mirroring the fortunes and the de-
mand for foreign workers of the dominant mining sector. In 1996 there were
slightly more than 40 thousand foreign born in the province, representing
about 20% of the total population. The number had decreased to approxi-
mately 12 thousand in 2001, whereas by 2007 it had edged back to approxi-
mately 22 thousand, or 14.6% of the total population. Finally, the Ehlanzeni
district, at the border with Mozambique’s Limpopo province, has seen its
immigrant population peak in 2001 at approximately 25 thousand (13% of
the total), whereas by 2007 it had declined to 19 thousand or 10.5% of the
total population.
We will exploit this rich variation in the data to carry out our empirical
analysis. Our main measure of the impact of immigration on local labor

16
markets is given by pijt, i.e. the share of foreign born in the labor force of a
particular skill group i in district j at time t, which is defined as:
pijt = Mijt/(Mijt + Nijt)
where Mijt is the number of foreign born workers in skill group i in district
j at time t and Nijt represents the corresponding number of natives.
Before proceeding with our regression analysis, in Figure 5 we present two
scatter plots linking the inter-censual change in the immigrant share, and
the changes in native individuals employment rate and (log) income. The
first picture suggests that natives employment rate in a given cell (defined
as a skill profile in a given district) is negatively correlated with changes
in the immigrant share in that cell (the coefficient of the fitted line is -
0.65 and is statistically significant). The second picture, on the other hand,
suggests the lack of a significant correlation between native income and the
immigrant share (the coefficient of the fitted line is 0.12 and is not statistically
significant). However, the figures also show that not all districts characterized
by large inflows of immigrants saw a deterioration of natives’ employment
outcomes, and similarly the income of native workers in several districts was
affected by the inflow of foreign workers. This highlights the importance of
controlling for additional observable and non–observable characteristics, and
we will do so in the analysis carried out in the next section.
5 Empirical specification
To assess the labor market effect of immigration in South Africa, we exploit
both the variation in the distribution of foreign workers across different skill
levels and across local labor markets within South Africa. Following the
literature (Borjas 2006), we estimate the following specification:

17
Lijt = si + rj + qt + (si ∗ rj ) + (si ∗ qt) + (qt ∗ rj ) + βppijt + βxXijt + εijt (1)
where the dependent variable Lijt is a labor market outcome for native
workers in skill group j (32 education by experience groups), district i (56
districts), and Census year t (3 years), and pijt is the main variable of interest.
Controls include a vector of fixed effects si, indicating the group’s skill level;
a vector of fixed effects rj indicating the district of residence, and a vector
of fixed effects qt indicating the time of the observation. These fixed effects
control for differences in labor market outcomes across skill groups, local
labor markets and over time. The interaction terms si ∗ qt and qt ∗ rj control,
respectively, for secular changes in the labor market outcomes of each skill
group and in the district structure of labor market outcomes over the period
we are considering in our sample, i.e. 1996-2007. The interaction si ∗ rj
indicates instead that we are identifying the coefficient of interest, βp from
changes in natives’ labor market outcomes and immigration rates that occur
within a region/skill cell.
We carry out two sets of regressions, focusing on men in the working age
group (16-65) in the labor force. The first focuses on the effects of immi-
gration on native workers’ employment rates, and the results are reported in
Table 4. The second considers instead the effects of immigration on native
workers’ total income, and is reported in Table 5. In all our specifications,
standard errors are clustered at skill-district level.
In the first three columns of Table 4, we consider the effect of immigra-
tion on natives’ employment rates. All specifications suggest that immigra-
tion has a negative impact on total natives’ employment rate, as well as on
the employment rate of native employees and self employed individuals. In
column 1, we present the basic estimates of the adjustment brought about
18
by immigration on total employment rate, defined as the share of employed
natives in the total labor force. The estimated coefficient βp is -0.667, with a
standard error of 0.042. In other words, an increase by 10 percentage points
in labor supply in a skill group, brought about by immigration, leads to a
6.7 percentage points decrease in natives’ total employment rate.
In columns (2) and (3) we look instead at the impact of immigration on
the share of native employees in the labor force10 and on the share of natives
self employed in the labor force. The result suggests that much of the adverse
labor market impact of immigration is due to the negative effect it had on
native employees.
In columns (4) through (6) we repeat the analysis carried out in columns
(1) through (3), controlling for the size of the employment in each cell. The
sign and significance level of our initial findings is unaffected, and the size of
the coefficient of our key explanatory variable is not affected.
In columns 7, 8, and 9 of Table 4 we include the lagged dependent variable,
i.e. the pre–existing employment rate of natives in the area, to address
the endogeneity of the migration decision, i.e. the non–random allocation
of migrants across space. Given that only three censuses are available for
South Africa, to carry out this estimation we need to restrict our analysis to
2001 and 2007, and as a result we lose about one third of our observations.
Notwithstanding this, the size of our estimated coefficients is remarkably
similar to what we have found in the first panel of the table, and also the
overall significance level of our result is unaffected.
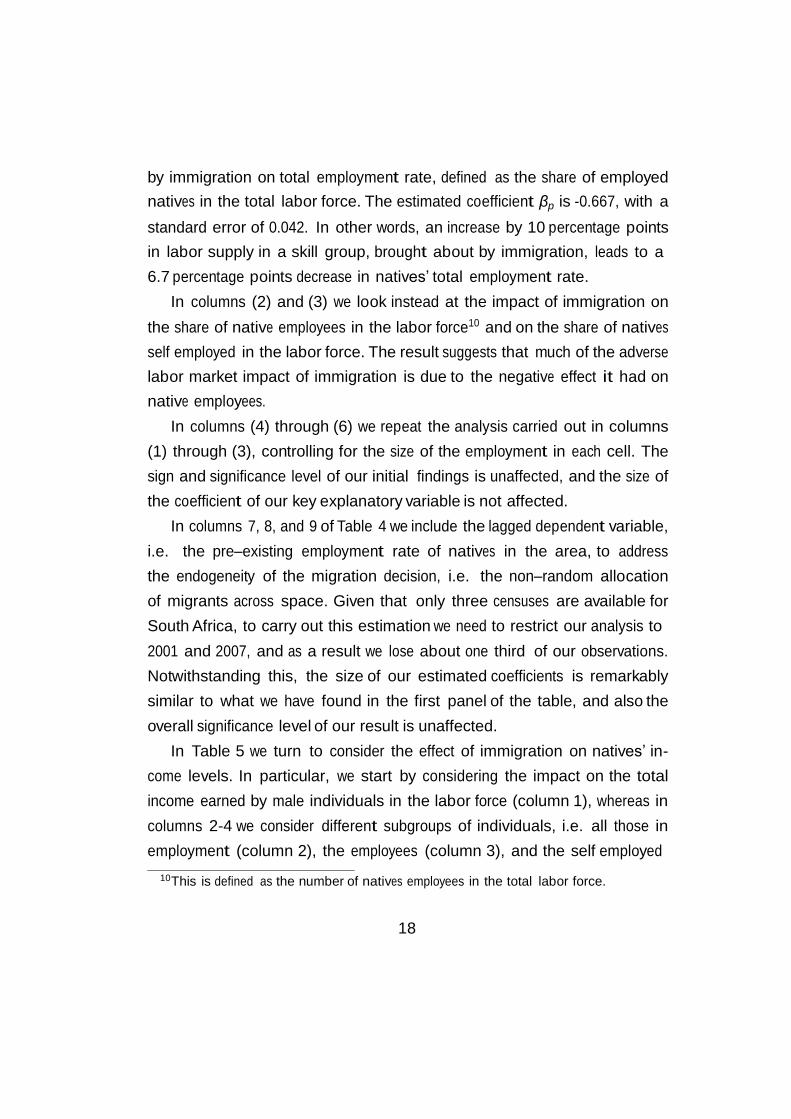
In Table 5 we turn to consider the effect of immigration on natives’ in-
come levels. In particular, we start by considering the impact on the total
income earned by male individuals in the labor force (column 1), whereas in
columns 2-4 we consider different subgroups of individuals, i.e. all those in
employment (column 2), the employees (column 3), and the self employed
10 This is defined as the number of natives employees in the total labor force.

19
(column 4). As it can be seen from columns 1 and 2, the effect of immigra-
tion on the total income of individuals in the labor force and on employed
individuals is negative. The same holds when we consider only the self em-
ployed in column 4, whereas from column 3 we can see that the impact on
the income of the employees is positive. However, none of these coefficients
is statistically significant. In the remaining four columns of the Table (4-8),
as we did in Table 4, we control also for the lagged dependent variable, to
address the endogeneity of the migration decision, i.e. the non–random al-
location of migrants across space. Once again, even though the sample size
decreases substantially in this case, our findings are broadly comparable to
those we obtain without adding this control.
Our analysis thus suggests that the immigration shock in the South
African labor market has been absorbed mainly through an adjustment in
the number of domestic workers employed, rather than through a change in
income earned. These results should be interpreted though with due cau-
tion, as our “price” measure of labor market outcomes is far from ideal, as it
combines both adjustments in unit wages, as well as in the number of hours
worked. Thus, it could well hide a decline in unit wages, which has been
compensated by an increase in the number of hours worked by the native.
Unfortunately, our data do not allow us to disentangle these two effects.
As we have discussed in section 4, there is substantial heterogeneity in the
composition of the immigrant population in South Africa. In particular, the
immigration shock over the period included in our study has been particularly
strong among the highly skilled: in 2007, more than one out of ten foreign
born individuals had a college education, about twice as much as in 1996. At
the same time, also among the natives the share of highly skilled increased
substantially, but it reached only 5.3 percent of the total population in 2007.
For this reason, it is interesting to separately analyze the labor market effect
of immigration, by looking at different skill groups. This is done in the four

20
panels of Table 6, where we consider the impact of immigration on those
individuals with less than primary education (Table 6a), on those which have
less than secondary education (Table 6b), those with a secondary education
plus some college (Table 6c) and those with a college education (Table 6d).
The structure of the analysis is similar to the one carried out for the overall
immigrant population in Tables 4 and 5, i.e. we look both at employment
and income outcomes. For brevity, we do not separately report here the
results including lagged native employment, as they are broadly comparable
to those without this additional control.
The analysis provides some interesting insights. First, the negative sys-
tematic impact of immigration involves all skill levels, the only exception
being low skilled self employed natives, who appear not to have been signifi-
cantly affected by the presence of immigrants. Second, and more importantly,
we find that the negative average results obtained in Table 4 are stronger for
more highly skilled natives, and in particular, for individuals who have com-
pleted a secondary education or have a college education. For instance, the
results in column (1) of Table 6c and 6d suggest that a ten percent increase
in the share of foreign born is correlated with a 6.9 and 8.2 percent decline
in the total employment rate respectively for natives who have completed
a secondary and a college education. Also in the case of the highly skilled
though, there is no evidence of an adverse effect of immigration on native
income levels.
6 Conclusions
In this paper we have carried out what is, to the best of our knowledge, the
first systematic study of the labor market effects of immigration to South
Africa in the post–Apartheid era. We have obtained several interesting re-
sults. First, we have argued that migration as a share of the population has
21
increased by about 50% over the period included in the sample. Second, we
have shown immigrants to South Africa are at least as educated as natives,
and that highly educated foreign individuals are especially important at the
very top of the skill distribution. Third, our analysis of the labor market
outcomes has shown that immigration has had a negative effect on natives’
employment outcomes, but not on total income. Interestingly, skilled South
Africans appear to be the most negatively affected subgroup of the popula-
tion.
References
Aydemir, A. and G. J. Borjas (2007). Cross-country variation in the impact
of international migration: Canada, mexico, and the united states.
Journal of the European Economic Association 5, 663–708.
Bhargava, A. and F. Docquier (2008). Hiv prevalence and migration of
healthcare staff in africa. World Bank Economic Review 22, 345–366.
Bhorat, H., J.-B. Meyer, and C. Mlatsheni (2002). Skilled labor migra-
tion from developing countries: Study on South and Southern Africa.
International Migration Papers 52.
Borjas, G. J. (2003). The labor demand curve is downward sloping: Reex-
amining the impact of immigration on the labor market. The Quarterly
Journal of Economics 40, 1335–1374.
Borjas, G. J. (2006). Native international migration and the labor market
impact of immigration. Journal of Human Resources 41, 221–258.
Card, D. (1990). The impact of the Mariel boatlift on the Miami labor
market. Industrial and Labor Relations Review 43, 245–257.
Crush, J. (2000). Migrations past: An historical overview of cross–border
movement in Southern Africa. In D. McDonald (Ed.), On borders: Per-
spectives on international migration in southern Africa, pp. 12–24. New
York: St. Martin’s Press.
Crush, J. and V. Williams (2010). Labor mmigration trends and policies
in southern africa. Policy Brief 23.

22
Docquier, F. and A. Marfouk (2006). International migration by educa-
tional attainment (1990-2000) - release 1.1. In C. Ozden and M. Schiff
(Eds.), International Migration, Remittances and Development, pp.
151–199. New York: Palgrave Macmillan.
Friebel, G., J. Gallego, and M. Mendola (2010). Xenophobic attacks, mi-
gration intentions and networks: Evidence from the South of Africa.
mimeo.
Friedberg, R. and J. Hunt (1995). The impact of immigrants on host
country wages, employment and growth. Journal of Economic Per-
spectives 9, 23–44.
Friedberg, R. M. (2001). The impact of mass migration on the Israel labor
market. Quarterly Journal of Economics 116, 1373–1408.
Hunt, J. (1992). The impact of the 1962 repatriates from Algeria on the
French labor market. Industrial and Labor Relations Review 45, 556–
572.
Klotz, A. (2000). migration after apartheid: deracializing South African
foreign policy. Thirld World Quarterly 21, 831–847.
Landau, L. B. and A. W. K. Segatti (2009). Humand development impacts
of migration: South Africa case study. Working Paper 2009/05.
Lucas, R. E. B. (2006). Migration and economic development in Africa: A
review of evidence. Journal of African Economies 15, 337–395.
McDonald, D. A. (2000). On borders. New York: St. Martin’s Press.
Mishra, P. (2007). Emigration and wages in source countries: Evidence
from mexico. Journal of Development Economics 82, 180–199.
Ottaviano, G. I. and G. Peri (2011). Rethinking the effects of immigration
on wages. Journal of the European Economic Association . forthcoming.
Peberdy, S. (2001). Imagining immigration: Inclusive identities and exclu-
sive policies in post-1994 South Africa. Africa Today 48, 15–32.
Peberdy, S. and J. Crush (1998). Rooted in racism: The origin of the
Aliens Contriol Act. In J. Crush (Ed.), Beyond control: Immigration
and human rights in a democratic South Africa, pp. 18–36. Cape Town:
Idasa.

23
Phillips, B. (2002). Out of Lagos. In H. Holland and A. Roberts (Eds.),
From Jo’Burg to Jozi, Stories about Africa’s Infamous City, pp. 203–
206. London: Penguin Books.
Pischke, J. S. and J. Velling (1997). Employment effects of immigration
to germany: An analysis based on local labor markets. Review of Eco-
nomics and Statistics 79, 594–604.
Waller, L. (2006). Migration of skilled in south africa: patterns, trends
and challenges. Migration Policy Brief 20.
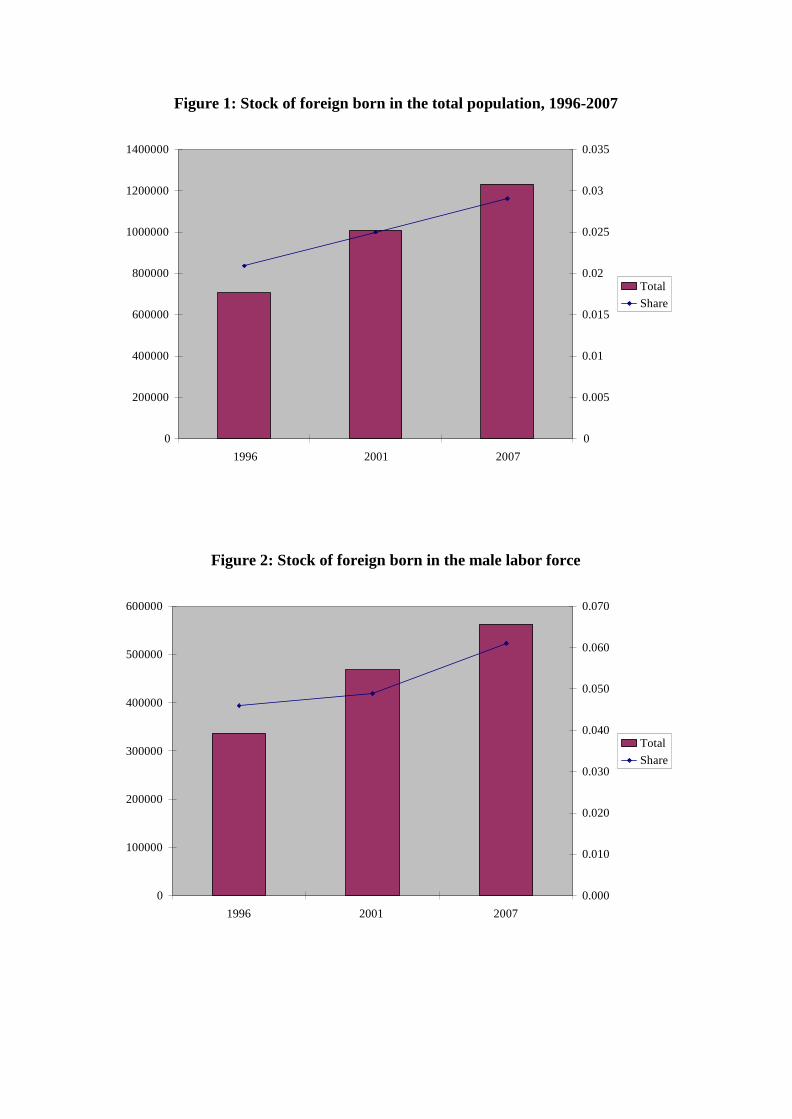
Figure 1: Stock of foreign born in the total population, 1996-2007
1400000 0.035
1200000 0.03
1000000 0.025
800000
600000
0.02
0.015
Total
Share
400000 0.01
200000 0.005
0 0
1996 2001 2007
Figure 2: Stock of foreign born in the male labor force
600000 0.070
500000 0.060
400000
0.050
300000
0.040 0.030
Total
Share
200000 0.020
100000
0.010
0
1996 2001 2007
0.000
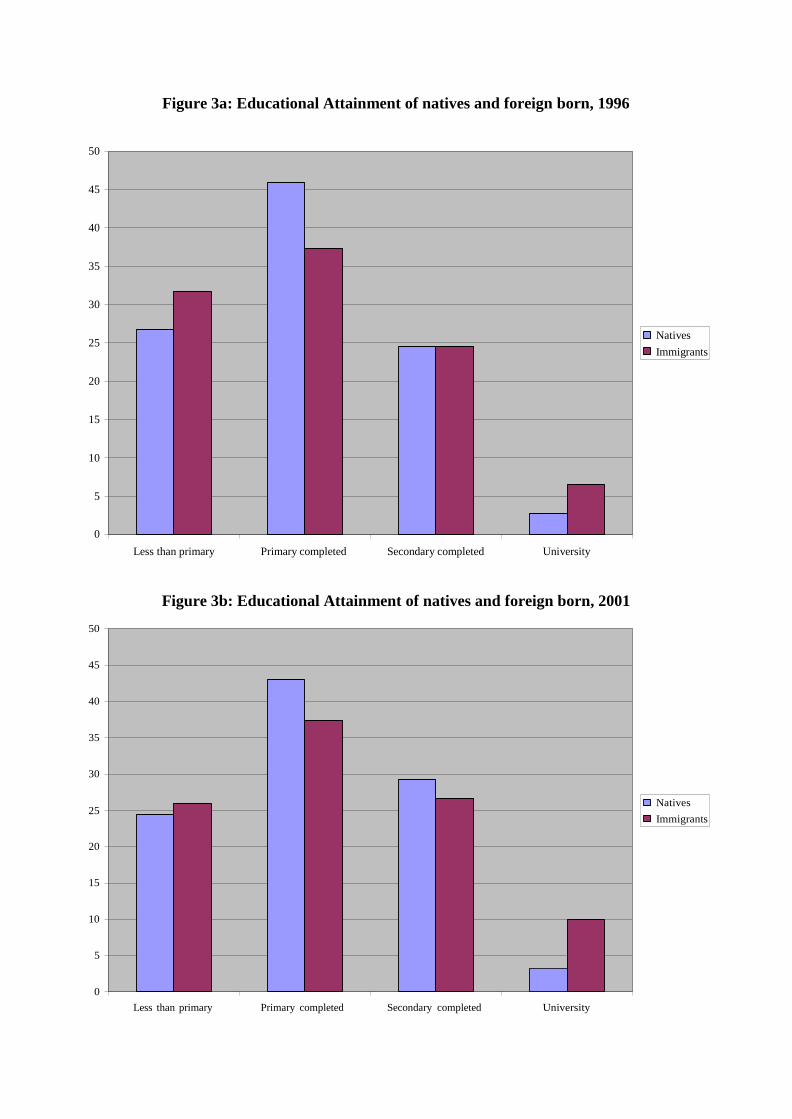
Figure 3a: Educational Attainment of natives and foreign born, 1996
50
45
40
35
30
Natives
25 Immigrants
20
15
10
5
0
Less than primary Primary completed Secondary completed University
Figure 3b: Educational Attainment of natives and foreign born, 2001
50
45
40
35
30
Natives
25 Immigrants
20
15
10
5
0
Less than primary Primary completed Secondary completed University

Figure 3c: Educational Attainment of natives and foreign born, 2007
45
40
35
30
25
Natives
Immigrants 20
15
10
5
0
Less than primary Primary completed Secondary completed University

Men
Share
Men
Share
Figure 4: Main immigrant receiving districts
City of Johannesburg
160000 0.140
140000
0.120
120000
0.100
100000
80000
0.080
60000
0.060
40000 0.040
20000 0.020
0
1996 2001 2007
0.000
Lejweleputswa District
45000 0.250
40000
35000 0.200
30000
25000
0.150
20000
0.100
15000
10000
0.050
5000
0
1996 2001 2007
0.000

Men
Share
Ehlanzeni District
30000 0.160
25000
0.140
0.120
20000
0.100
15000 a
0.080
10000
0.060
0.040
5000
0.020
0
1996 2001 2007
0.000

Chan
ge in
log in
com
e
Chan
ge in
em
plo
ym
ent ra
te
-4
-2
0
2
-1
-.5
0
.5
1
Figure 5: Scatter plots immigration and native’s labor market outcomes
-1 -.5 0 .5 1 Change in immigration share
Fitted values DEmp0796
-1 -.5 0 .5 1 Change in immigration share
Fitted values Dinc0796

1996 2001
All migrants Male 16-65 labor force pop. All migrants Male 16-65 labor force
stock rates stock rates stock rates stock rates
Table 1: Migrants by country of origin
AFRICA
466935
0.676
259162
0.770
713298
0.707
372689
0.797
Eastern Africa 290302 0.411 158558 0.471 466640 0.463 263634 0.564
Malawi 10152 0.014 5089 0.015 26054 0.026 15610 0.033
Mozambique 183597 0.260 110301 0.328 265176 0.263 167953 0.359
Zambia 12990 0.018 4972 0.015 23493 0.023 8345 0.018
Zimbabwe 73042 0.103 34549 0.103 130090 0.129 63196 0.135
Middle Africa 10377 0.015 4139 0.012 23974 0.024 10569 0.023
Nothern Africa 1652 0.002 498 0.001 3853 0.004 1500 0.003
Southern Africa 154692 0.219 91250 0.271 206760 0.205 88913 0.190
Botswana 10480 0.015 6767 0.020 17518 0.017 6705 0.014
Lesotho 95062 0.135 64745 0.192 113020 0.112 53434 0.114
Nambia 28850 0.041 8549 0.025 44798 0.044 14945 0.032
Swaziland 20300 0.029 11189 0.033 31425 0.031 13830 0.030
Western Afrcia 9911 0.014 4717 0.014 12070 0.012 8073 0.017
AMERICA 11606 0.016 3638 0.011 21938 0.022 5622 0.012
ASIA 23807 0.034 7552 0.022 43540 0.043 16441 0.035
EUROPE 173345 0.230 55386 0.165 225223 0.223 71543 0.153
United Kingdom 97290 0.138 30392 0.090 127820 0.127 39778 0.085
Germany 14427 0.020 4424 0.013 24216 0.024 6627 0.014
Portugal 12667 0.018 5451 0.016 19490 0.019 7714 0.016
OCEANIA 3586 0.005 1097 0.003 4393 0.004 1535 0.003
NS/NR 26522 0.038 9756 0.029 10 0.000 10 0.000

Table 2: Migration share by education and experience (skill cell)
(15-65 male lab force pop)
Education Years of
experience
1996
2001
2007
Less than primary 1 - 5 0.0485 0.0517 0.0584
6 - 10 0.0543 0.0781 0.0983
11 - 15 0.0573 0.0717 0.1241
16 - 20 0.052 0.0565 0.1027
21 - 25 0.0584 0.0466 0.0869
26 - 30 0.0615 0.0461 0.0717
31 - 35 0.0589 0.0455 0.0831
36 - 40 0.0484 0.0417 0.0724
Primary completed 1 - 5 0.0461 0.039 0.0384
6 - 10 0.0379 0.0532 0.0568
11 - 15 0.0405 0.0497 0.07
16 - 20 0.0365 0.0445 0.0688
21 - 25 0.0347 0.0392 0.0647
26 - 30 0.0346 0.0356 0.0539
31 - 35 0.0336 0.0311 0.0498
36 - 40 0.0305 0.0342 0.0486
Secondary completed 1 - 5 0.023 0.0226 0.0246
6 - 10 0.0294 0.0319 0.0421
11 - 15 0.0431 0.0403 0.0448
16 - 20 0.0526 0.0535 0.0459
21 - 25 0.0671 0.0623 0.0634
26 - 30 0.096 0.0864 0.069
31 - 35 0.1307 0.1361 0.0953
36 - 40 0.1458 0.1836 0.137
University completed 1 - 5 0.0689 0.0731 0.0977
6 - 10 0.0872 0.0902 0.099
11 - 15 0.0918 0.1238 0.1092
16 - 20 0.1056 0.1358 0.1218
21 - 25 0.1182 0.1629 0.1378
26 - 30 0.1407 0.1852 0.1597
31 - 35 0.1398 0.2413 0.1813
36 - 40 0.176 0.2613 0.2543
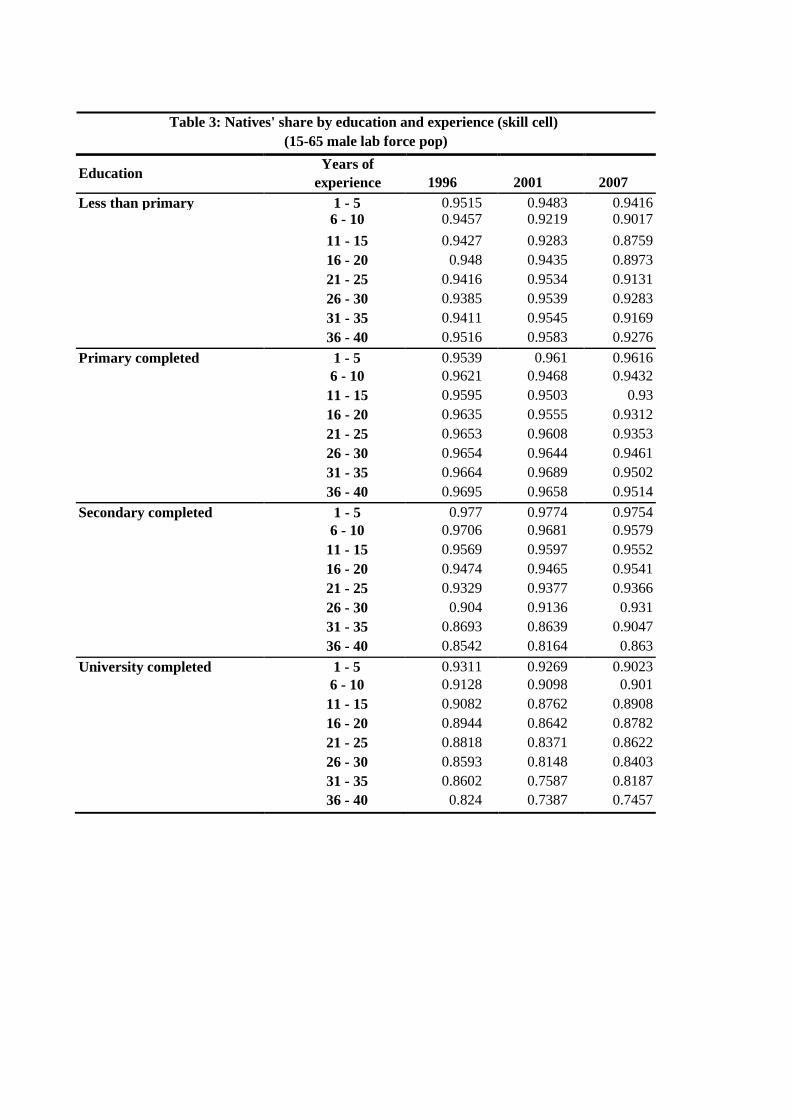
Table 3: Natives' share by education and experience (skill cell)
(15-65 male lab force pop)
Education Years of
experience
1996
2001
2007
Less than primary 1 - 5 0.9515 0.9483 0.9416 6 - 10 0.9457 0.9219 0.9017
11 - 15 0.9427 0.9283 0.8759
16 - 20 0.948 0.9435 0.8973
21 - 25 0.9416 0.9534 0.9131
26 - 30 0.9385 0.9539 0.9283
31 - 35 0.9411 0.9545 0.9169
36 - 40 0.9516 0.9583 0.9276
Primary completed 1 - 5 0.9539 0.961 0.9616
6 - 10 0.9621 0.9468 0.9432
11 - 15 0.9595 0.9503 0.93
16 - 20 0.9635 0.9555 0.9312
21 - 25 0.9653 0.9608 0.9353
26 - 30 0.9654 0.9644 0.9461
31 - 35 0.9664 0.9689 0.9502
36 - 40 0.9695 0.9658 0.9514
Secondary completed 1 - 5 0.977 0.9774 0.9754
6 - 10 0.9706 0.9681 0.9579
11 - 15 0.9569 0.9597 0.9552
16 - 20 0.9474 0.9465 0.9541
21 - 25 0.9329 0.9377 0.9366
26 - 30 0.904 0.9136 0.931
31 - 35 0.8693 0.8639 0.9047
36 - 40 0.8542 0.8164 0.863
University completed 1 - 5 0.9311 0.9269 0.9023
6 - 10 0.9128 0.9098 0.901
11 - 15 0.9082 0.8762 0.8908
16 - 20 0.8944 0.8642 0.8782
21 - 25 0.8818 0.8371 0.8622
26 - 30 0.8593 0.8148 0.8403
31 - 35 0.8602 0.7587 0.8187
36 - 40 0.824 0.7387 0.7457
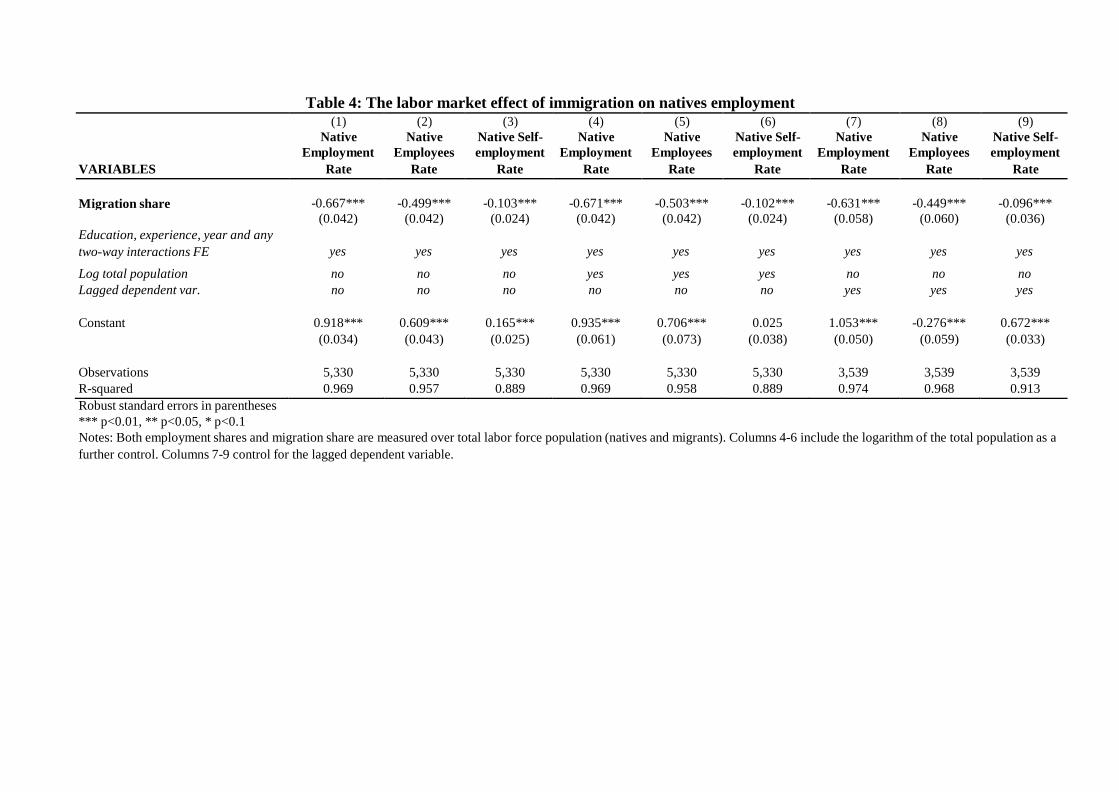
Table 4: The labor market effect of immigration on natives employment
(1)
Native
(2)
Native
(3)
Native Self-
(4)
Native
(5)
Native
(6)
Native Self-
(7)
Native
(8)
Native
(9)
Native Self-
Employment Employees employment Employment Employees employment Employment Employees employment
VARIABLES Rate Rate Rate Rate Rate Rate Rate Rate Rate
Migration share
-0.667***
-0.499***
-0.103***
-0.671***
-0.503***
-0.102***
-0.631***
-0.449***
-0.096***
Education, experience, year and any
(0.042) (0.042) (0.024) (0.042) (0.042) (0.024) (0.058) (0.060) (0.036)
two-way interactions FE yes yes yes yes yes yes yes yes yes
Log total population no no no yes yes yes no no no
Lagged dependent var. no no no no no no yes yes yes
Constant
0.918***
0.609***
0.165***
0.935***
0.706***
0.025
1.053***
-0.276***
0.672***
(0.034) (0.043) (0.025) (0.061) (0.073) (0.038) (0.050) (0.059) (0.033)
Observations
5,330
5,330
5,330
5,330
5,330
5,330
3,539
3,539
3,539
R-squared 0.969 0.957 0.889 0.969 0.958 0.889 0.974 0.968 0.913
Robust standard errors in parentheses
*** p<0.01, ** p<0.05, * p<0.1
Notes: Both employment shares and migration share are measured over total labor force population (natives and migrants). Columns 4-6 include the logarithm of the total population as a
further control. Columns 7-9 control for the lagged dependent variable.

Table 5: labor market effect of immigration on natives income (1) (2) (3) (4) (5) (6) (7) (8)
VARIABLES
Log tot
income (lab
force)
Log tot
income
(employed)
Log tot
income of
employees
Log tot income
of self-
employed
Log tot
income (lab
force)
Log tot
income
(employed)
Log tot
income of
employees
Log tot
income of self
employed
Migration share
-0.123
-0.023
0.143
-0.420
-0.142
-0.034
0.016
-0.010
(0.252) (0.212) (0.229) (0.709) (0.343) (0.297) (0.308) (0.920)
Education, experience, year and any two-way interactions
FE
yes
yes
yes
yes
no
no
no
no
Lagged dependent var. no no no no yes yes yes yes
Constant
13.313***
13.428***
11.603***
13.665***
13.858***
15.557
12.361***
23.387***
(0.283) (0.240) (0.189) (1.000) (0.518) (.) (0.548) (1.092)
Observations
5,322
5,321
5,268
4,805
3,530
3,529
3,472
3,023
R-squared 0.977 0.975 0.973 0.886 0.981 0.978 0.976 0.910
Robust standard errors in parent
*** p<0.01, ** p<0.05, * p<0.1
Notes: Migration share is measured over total labor force population (natives and migrants). Columns 5-8 for the lagged dependent variable.

Table 6a: labor market effect of immigration by skill group – less than primary
(1)
Native
(2)
Native
(3)
Native Self-
(4)
Native
(5)
Native
(6)
Native Self-
(7)
Native
(8)
Native
(9)
Native Self-
Employment Employees employment Employment Employees employment Employment Employees employment
VARIABLES Rate Rate Rate Rate Rate Rate Rate Rate Rate
Migration share
-0.487***
-0.394***
-0.023
-0.489***
-0.395***
-0.023
-0.391***
-0.303**
-0.026
Education, experience,
(0.091) (0.089) (0.034) (0.091) (0.089) (0.034) (0.136) (0.130) (0.053)
year and any two-way yes yes yes yes yes yes yes yes yes
Log total population no no no yes yes yes no no no
Lagged dependent var. no no no no no no yes yes yes
Constant
0.839***
0.813***
0.037
0.748***
0.717***
0.027
0.480***
0.491***
0.010
(0.081) (0.079) (0.037) (0.088) (0.087) (0.041) (0.084) (0.117) (0.031)
Observations
1,343
1,343
1,343
1,343
1,343
1,343
895
895
895
R-squared 0.968 0.962 0.790 0.968 0.962 0.790 0.972 0.968 0.818
Notes: Both employment shares and migration share are measured over total labor force population (natives and migrants). Columns 4-6 include the logarithm of the total
population as a further control. Columns 7-9 control for the lagged dependent variable.
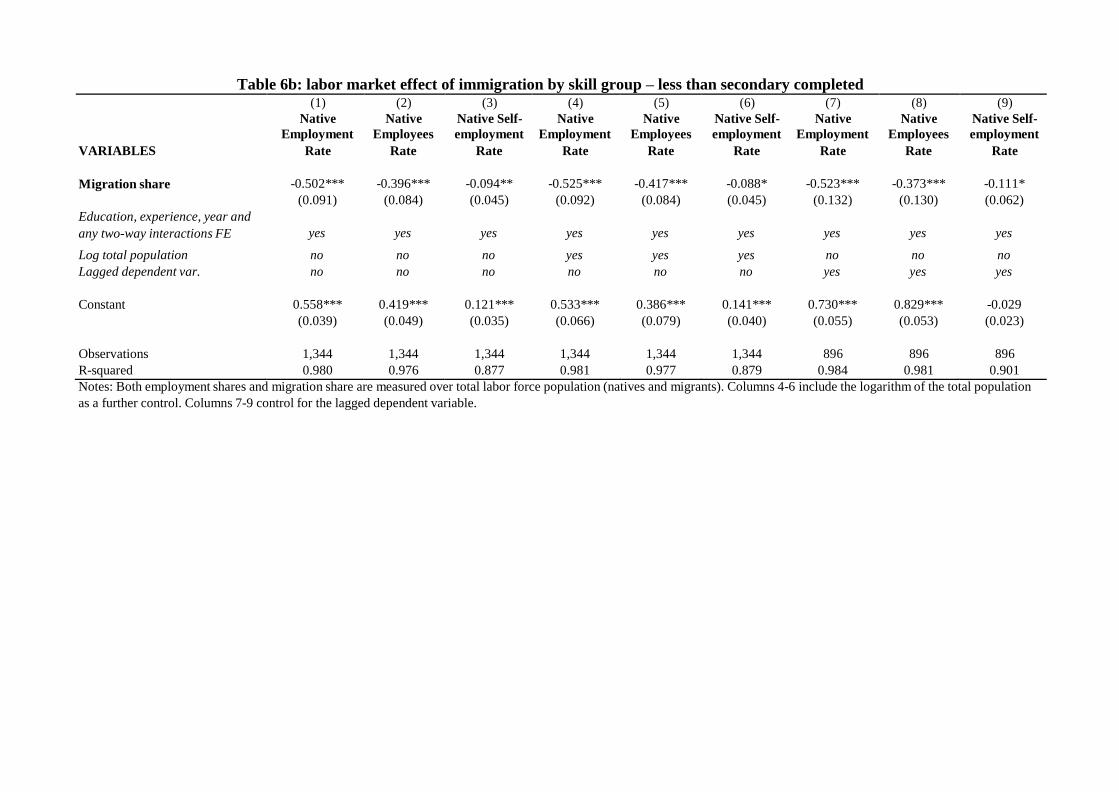
Table 6b: labor market effect of immigration by skill group – less than secondary completed
(1)
Native
(2)
Native
(3)
Native Self-
(4)
Native
(5)
Native
(6)
Native Self-
(7)
Native
(8)
Native
(9)
Native Self-
Employment Employees employment Employment Employees employment Employment Employees employment
VARIABLES Rate Rate Rate Rate Rate Rate Rate Rate Rate
Migration share
-0.502***
-0.396***
-0.094**
-0.525***
-0.417***
-0.088*
-0.523***
-0.373***
-0.111*
Education, experience, year and
(0.091) (0.084) (0.045) (0.092) (0.084) (0.045) (0.132) (0.130) (0.062)
any two-way interactions FE yes yes yes yes yes yes yes yes yes
Log total population no no no yes yes yes no no no
Lagged dependent var. no no no no no no yes yes yes
Constant
0.558***
0.419***
0.121***
0.533***
0.386***
0.141***
0.730***
0.829***
-0.029
(0.039) (0.049) (0.035) (0.066) (0.079) (0.040) (0.055) (0.053) (0.023)
Observations
1,344
1,344
1,344
1,344
1,344
1,344
896
896
896
R-squared 0.980 0.976 0.877 0.981 0.977 0.879 0.984 0.981 0.901
Notes: Both employment shares and migration share are measured over total labor force population (natives and migrants). Columns 4-6 include the logarithm of the total population
as a further control. Columns 7-9 control for the lagged dependent variable.

Table 6c: labor market effect of immigration by skill group – secondary completed
(1)
Native
(2)
Native
(3)
Native Self-
(4)
Native
(5)
Native
(6)
Native Self-
(7)
Native
(8)
Native
(9)
Native Self-
Employment Employees employment Employment Employees employment Employment Employees employment
VARIABLES Rate Rate Rate Rate Rate Rate Rate Rate Rate
Migration share
-0.693***
-0.443***
-0.250***
-0.693***
-0.442***
-0.252***
-0.594***
-0.393**
-0.200*
Education, experience, year
(0.108) (0.124) (0.083) (0.108) (0.124) (0.083) (0.151) (0.175) (0.111)
and any two-way interactions yes yes yes yes yes yes yes yes yes
Log total population no no no yes yes yes no no no
Lagged dependent var. no no no no no no yes yes yes
Constant
1.022***
0.463***
0.478***
1.068***
0.731***
0.344***
1.033***
0.664***
0.364***
(0.093) (0.132) (0.068) (0.093) (0.132) (0.078) (0.081) (0.074) (0.049)
Observations
1,344
1,344
1,344
1,344
1,344
1,344
896
896
896
R-squared 0.968 0.937 0.917 0.968 0.937 0.917 0.973 0.956 0.935
Notes: Both employment shares and migration share are measured over total labor force population (natives and migrants). Columns 4-6 include the logarithm of the total
population as a further control. Columns 7-9 control for the lagged dependent variable.

Table 6d: labor market effect of immigration by skill group – university and above
(1)
Native
(2)
Native
(3)
Native Self-
(4)
Native
(5)
Native
(6)
Native Self-
(7)
Native
(8)
Native
(9)
Native Self-
Employment Employees employment Employment Employees employment Employment Employees employment
VARIABLES Rate Rate Rate Rate Rate Rate Rate Rate Rate
Migration share
-0.817***
-0.636***
-0.151**
-0.816***
-0.634***
-0.152**
-0.711***
-0.532***
-0.109
Education, experience, year
(0.060) (0.084) (0.072) (0.059) (0.083) (0.072) (0.088) (0.123) (0.097)
and any two-way interactions yes yes yes yes yes yes yes yes yes
Log total population no no no yes yes yes no no no
Lagged dependent var. no no no no no no yes yes yes
Constant
0.980***
-0.155
0.924***
1.009***
-0.111
0.902***
1.524***
0.938***
0.811***
(0.107) (0.249) (0.163) (0.111) (0.253) (0.168) (0.187) (0.162) (0.094)
Observations
1,299
1,299
1,299
1,299
1,299
1,299
852
852
852
R-squared 0.890 0.853 0.768 0.890 0.853 0.768 0.908 0.905 0.845
Notes: Both employment shares and migration share are measured over total labor force population (natives and migrants). Columns 4-6 include the logarithm of the total
population as a further control. Columns 7-9 control for the lagged dependent variable.