Embed Size (px)
Citation preview

Science of the Total Environment 472 (2014) 1023–1035
Contents lists available at ScienceDirect
Science of the Total Environment
j ourna l homepage: www.e lsev ie r .com/ locate /sc i totenv
Spatial and temporal distribution of Cryptosporidium and Giardia in adrinking water resource: Implications for monitoring andrisk assessment
Jean-Baptiste Burnet a,b, Christian Penny a, Leslie Ogorzaly a, Henry-Michel Cauchie a,⁎a Centre de Recherche Public - Gabriel Lippmann, Department of Environment and Agro-biotechnologies (EVA), 41, rue du Brill, L-4422 Belvaux, Luxembourgb Université de Liège (ULg), Department of Environmental Sciences and Management, 165 avenue de Longwy, B-6700 Arlon, Belgium
H I G H L I G H T S
• We investigated Cryptosporidium and Giardia distribution trends in a rural watershed.• Their distribution in water was heterogeneous over various spatial temporal scales.• Parasite fluxes (from 103 to 1011 (oo)cysts.day−1) varied with location and time.• Key drivers of parasite fluxes were rainfall, land use and catchment morphology.• Our study provides a methodology for catchment-wide study of parasites distribution.
⁎ Corresponding author. Tel.: +352 47 02 61 420; fax:E-mail addresses: [email protected] (J.-B
(C. Penny), [email protected] (L. Ogorzaly), cauchie@
0048-9697/$ – see front matter © 2013 Elsevier B.V. All rihttp://dx.doi.org/10.1016/j.scitotenv.2013.10.083
a b s t r a c t
a r t i c l e i n f oArticle history:Received 23 May 2013Received in revised form 18 October 2013Accepted 24 October 2013Available online 15 December 2013
Keywords:Hydro-climatologyLand useWaterborne parasitesSurface waterFaecal indicatorsMicrobial risk
Because of their significant public health impact, waterborne Cryptosporidium and Giardia have been monitoredin surfacewater in order to assessmicrobial quality ofwater bodies used for drinkingwater production and/or forrecreational purposes. In this context, sampling strategy is of key importance and should be representativeenough to appropriately assess the related microbial risk. This, however, requires sound knowledge on the be-haviour of both pathogens inwater. In the present study, the spatial and temporal distribution of Cryptosporidiumand Giardiawas explored in the rural Upper-Sûre watershed used for drinking water production in Luxembourg.By subdividing it into three compartments including (i) sub-catchments, (ii) the Sûre River fed by the sub-catchments and (iii) theUpper-Sûre reservoir fed by the SûreRiver, parasite distributionwas assessedusing sam-pling designs adapted to the hydro-dynamic characteristics of the respective compartments. Results highlightedthe high spatial and temporal variability in parasite distribution at watershed scale, as well as the prevalence ofGiardia over Cryptosporidium. Besides land use features and catchment characteristics, hydro-climatologyappeared to be a major driver of parasite behaviour in the watershed. It introduced a seasonal trend in theiroccurrence, highest densities being detected during the wet season. Peaks of contamination triggered out byrainfall-induced runoff were further observed in the three compartments. In the Sûre River, Cryptosporidiumand Giardia fluxes peaked at 109 and 1010 (oo)cysts.d−1, respectively, and were discharged into the drinkingwater reservoir, where they underwent a 2 to 3 log10 removal rate. Despite this, parasite fluxes entering thedrinkingwater treatment plant were still high (106 to 107 (oo)cysts.d−1) and stressed on the need for improvedwatershed management upstream the water treatment barrier. The catchment-wide analysis described hereconstitutes a valuable tool for assessment of catchment microbial dynamics, especially within the frameworkof Water Safety Plans.
© 2013 Elsevier B.V. All rights reserved.
1. Introduction
Safe access to water is recognized nowadays as a fundamentalhuman right (United Nations, 2010). However, still more than onebillion people currently lack access to safe drinking water worldwide
+352 47 02 64.. Burnet), [email protected] (H.-M. Cauchie).
ghts reserved.
and a diversity of pathogens cause waterborne outbreaks in nationsat all levels of economic development (Hunter et al., 2010). The WorldHealth Organization (WHO) recommends the implementation of“Water Safety Plans” (WSP) as one efficient tool to protect public healthby ensuring safe drinking water supply. WSPs encompass the entiredrinking water supply chain and provide a comprehensive risk assess-ment and management framework (WHO, 2009). For supplies relyingon surface water, the watershed constitutes the very upstream partof that provision chain, and this is where most of the microbial

1024 J.-B. Burnet et al. / Science of the Total Environment 472 (2014) 1023–1035
contamination enters the drinking water production process. Amongthe pathogens that contaminate surface water, Cryptosporidium andGiardia are known to be major etiological agents of waterborneoutbreaks worldwide (Baldursson and Karanis, 2011). Both zoonoticparasites cause gastro-intestinal diseases in humans and animals andhave a ubiquitous distribution in surface water. The public health riskassociated with their occurrence in water resources is multiplied bythe high persistence of Cryptosporidium and Giardia in water as well asby their resistance to conventional water treatment (Betancourt andRose, 2004). In addition, although effective drug treatment exists forcryptosporidiosis and giardiasis in immunocompetent children andadults, no such treatment has yet been developed for immunodeficientpatients (Rossignol, 2010).
The occurrence of Cryptosporidium and Giardia in surface waterincurs significant spatial and temporal variability. For instance, parasiteoccurrence can vary substantially between and within catchment areas(Ong et al., 1996; Robinson et al., 2011). Also, seasonal trends in theirdistribution in surface water have been described (Bodley-Tickellet al., 2002; Helmi et al., 2011; Isaac-Renton et al., 1996; Keeley andFaulkner, 2008). In those studies, Cryptosporidium oocysts and Giardiacysts occurred more frequently and in higher densities during the wetseason. Indeed, parasite densities can rise dramatically in water bodiesunder rainfall-induced runoff conditions (Atherholt et al., 1998;Hansen and Ongerth, 1991; Kistemann et al., 2002; Signor et al., 2005).
Both waterborne pathogens are released by a handful of pointand diffuse sources that can vary in time and space. Upon release,Cryptosporidium and Giardia are conveyed from the pollution source toareas where exposure can occur and thereby pass through successivecompartments (from upland areas towards small tributaries, riversand ultimately reservoirs or lakes) (Ferguson et al., 2003). Since eachof those compartments displays contrasting water flow characteristicsand specific environmental processes that variably affect the fate ofboth parasites, it is complex to model their fate and transport (Dorneret al., 2006; Medema and Schijven, 2001; Tang et al., 2011; Walkerand Stedinger, 1999).
Furthermore, methods for the isolation and detection ofCryptosporidium and Giardia in water are expensive and cumbersome,hence limiting the amount of parasite data that can be collected. Conse-quently, physical, hydrological or microbial surrogates are used to pre-dict parasite occurrence in water, but the ability to correctly account forthe presence of Cryptosporidium and/or Giardia is disputable, notablybecause of different survival rates and transport mechanisms betweenparasites and surrogates (Brookes et al., 2005; Horman et al., 2004;Lemarchand and Lebaron, 2003; Nasser et al., 2003; Wu et al., 2011).Therefore, establishment of risk assessment and management strate-gies for the protection of drinking water resources from pathogenicmicroorganisms such as Cryptosporidium or Giardia requires a sufficientpreliminary understanding of their distribution dynamics aswell as thatof their surrogates (Ferguson et al., 2003).
In the present study, we analysed the spatial and temporal dynamicsof both Cryptosporidium and Giardia at the scale of the rural Upper-Sûrewatershed in Luxembourg. The latter harbours a riverine reservoir,which is the main drinking water supply of the country and representsan important recreational area in summer. The reservoir covers 50% ofthe drinking water demand in Luxembourg and reaches nearly 80% ofthe population. In a recent study, Helmi et al. (2011) have reportedthe occurrence of both Cryptosporidium and Giardia in the reservoirand in the raw water collected by the drinking water treatment plant(DWTP).
The main objective of our study was to understand Cryptosporidiumand Giardia distribution dynamics and to identify the factors that medi-ate their occurrence and transport within the Upper-Sûre watershed.To do so, we proposed to conceptually break down the Upper-Sûrewatershed into compartments (small tributaries, main river channeland reservoir) that are interlinked, yet displaying contrasting hydrody-namics. Based on this strategy, we sought to understand the role of each
compartment in the fate and transport of Cryptosporidium and Giardiawithin the Upper-Sûre watershed. We then monitored parasite loadsand fluxes at the confluence of small tributaries with the main riverchannel (Sûre River) or with the drinking water resource (Upper Sûrereservoir), in order to link them with sub-catchment land use. From ahydrological point of view, the Sûre River and the Upper-Sûre reservoirdisplay very different dynamics. In order to determine theway both par-asites are conveyed from the main river channel to the reservoir andultimately to the inlet of the drinking water treatment plant (DWTP),we investigated parasite distribution patterns in the Sûre River and inthe Upper-Sûre reservoir under different hydro-climatological settings.Finally, in order to better appraise the relationships between parasitesand indicators in the watershed, a set of physical and microbial surro-gateswere examined in the different compartments. Besides unravellingparasite and indicator distribution patterns in the Upper-Sûre water-shed, the present study further provides an example for catchment-wide investigation of microbial dynamics prior to the establishment ofa monitoring framework.
2. Material and methods
2.1. Study area
The transboundary Upper-Sûre watershed is located in the north ofLuxembourg, within the Ardennes region (Fig. 1B). The region displayscumulated annual rainfall between 900 and 1000 mm and streams areof pluvial hydrological regimes (Salvia-Castellvi et al., 2005). The SûreRiver is the main tributary of the studied drinking water reservoir anddrains a 428 km2 large rural watershed, 65% of it being located inBelgium (Fig. 1B). The landscape is shaped by agriculture, but comprisesa high percentage of forested area (N40%). Population density averages50 inhabitants per km2.
2.2. Sampling strategy
The watershed has been broken down into three compartments(Fig. 1A) that are conceptually following the water flow and down-stream transport of microbial contaminants. Compartments includesub-catchments (compartment 1), the Sûre River (compartment 2)and the Upper-Sûre reservoir (compartment 3). Sub-catchments aredistributed over the study area and their tributaries flow either intothe Sûre River (SC3 and SC4) or into the reservoir (SC2) and larger trib-utaries of it (SC1). The effluents of a wastewater treatment plant(WWTP) discharge microbial pollution in the upstream part of thestudy area,while rawwater is collected by thedrinkingwater treatmentplant (DWTP) at the downstream end of that area (Fig. 1B). Compart-ments were sampled during the prevalence period of Cryptosporidiumand Giardia (from November to April), which was described in a previ-ous two-yearmonitoring study (Helmi et al., 2011). In parallel, the inletof the DWTPwas sampled over 17 months (thereby encompassing twoprevalence periods), in order to document the contamination enteringthe plant.
2.2.1. Compartment 1Four sub-catchments out of the 11 initially prospected (unpublished
results) were selected based on E. coli contamination load, catchmentsize and land use, in order to cover a variety of representative sub-catchments within the Upper-Sûrewatershed. Land use and other char-acteristics associated with the four sub-catchments (SC1 to SC4) aresummarized in Table 1. Sub-catchment 3 (SC3) displays the largestdrainage area (62 km2), followed by SC2, SC4 and SC1, which all havean area of less than 5 km2. Population and cattle densities are bothhighest in SC4, followed by SC2. Sub-catchment 1 is highly forested(N95%), while SC2, SC3 and SC4 are composed of mixed land use, withvarying proportions of agricultural, forested and artificial land. Accord-ing to the shape and size of the sub-catchment, the “head to outlet”

Fig. 1. The Upper-Sûre watershed. (A) Conceptual subdivision of the watershed into three interlinked compartments. Pollution flow progresses from the sources (distributed within sub-catchments) towards the DWTP, dominantly conveyed by the Sûre River and the Upper-Sûre reservoir; (B) Geographical localization of the Upper-Sûre watershed. The black frame de-limits the study area, which is detailed in (C). Sampling sites on the Sûre River and on theUpper-Sûre reservoir are referred to as R1 to R5 and as L1 to L5, respectively.WWTP, wastewatertreatment plant; DWTP, drinking water treatment plant; SC, sub-catchment.
1025J.-B. Burnet et al. / Science of the Total Environment 472 (2014) 1023–1035
distance (i.e. the distance along themain catchment tributary, fromcatch-ment outlet to the farthest point inside the catchment) varies betweenb1 km and N10 km. Surface water was collected during a 6 month-period on 5 to 7 occasions at the outlet of sub-catchments SC1–SC4(Fig. 1C). One-litre grab samples were taken hourly during 24 h usingportable automated samplers (6712 Full-Size Portable Sampler, ISCO).Upon completion of the sampling cycle, water from the 24 bottleswas pooled and immediately transferred to the laboratory for furtherprocessing.
2.2.2. Compartment 2The studied portion of the Sûre River upstream the reservoir stretches
along 16 km from R1 to R5 and has a mean slope of 2 m.km−1. Water
level recorders measure the level of the Sûre River on an hourly basis atR1 and R5 (Fig. 1C). A wastewater treatment plant (WWTP) dischargestreated sewage effluents (7100 inhabitant-equivalents) into the SûreRiver, 1 km downstream R1. In order to assess the fate of the contami-nation load in the Sûre River, five stations (R1 to R5) aswell as the treat-ed effluents of the WWTP were successively sampled to result in aLagrangian tracking of the water mass over 16 km (Fig. 1C). During afirst campaign inMarch 2008, R1, R4 aswell as treatedWWTP effluentswere collected at a river flow rate of 5.8 m3.s−1. A second campaign inApril 2010 and a third campaign in December 2011 were performedfrom R1 to R5 including treated WWTP effluents, at river flow rates of3.8 m3.s−1 and 5.6 m3.s−1, respectively. On the day before sampling,2, 0.6 and 28 mm of rainfall were recorded in March 2008, April 2010

Table 1Physical and land use characteristics of the selected sub-catchments (compartment 1). Channel length corresponds to the distance along the main tributary, measured from the outlet tothe farthest point inside the catchment. Flow rates were estimated using the neighbour catchment approach (see Section 2.6) and averaged for the sampling period of catchment outlets(November 2009 to April 2010). Population density is expressed in inhabitants.km−2. Cattle density is expressed in heads.km−2, based on the 2009 inventory (ASTA, personal communi-cation). WWTP, wastewater treatment plant.
Sub-catchment
Basin characteristics Land use characteristics Potential inputs of faecalpollution
Size(km2)
Channel length(km)
Average flow rate(L.s−1)
Forest(%)
Pasture(%)
Cropland(%)
Artificial(%)
Populationdensity
Cattledensity
Point sources(n)
Diffuse sources
SC1 1.2 0.9 31 91.4 1.7 4.5 2.4 0 0 – Wildlife
SC2 3.5 3.0 89 50.0 34.4 10.7 4.9 20 118 WWTP (1) Livestock,wildlife
SC3 62.0 11.0 978 47.3 38.0 11.9 2.8 31 28 WWTP (4) Livestock,wildlife
SC4 1.3 0.9 33 28.1 36.9 24.5 10.5 87 292 WWTP (1) Livestock,wildlife
1026 J.-B. Burnet et al. / Science of the Total Environment 472 (2014) 1023–1035
and December 2011, respectively (Fig. 3). In order to carry out theLagrangian tracking of the water, its travel time from R1 to R5 was esti-mated on the basis of river flow velocity. According to the hydrologicalregime of the Sûre River at the day of sampling, this travel time was es-timated to be 8 and 7 h for campaigns 2 and 3, respectively. For the firstcampaign, travel time between R1 and R4 was estimated to be 6.5 h.Using autoclaved carboys, 40 L were collected at each sampling stationand 20 L of treated effluents were sampled at the WWTP.
2.2.3. Compartment 3The Upper-Sûre reservoir is 18-km long, has a mean depth of 17 m
and a mean width of 200 m. The reservoir covers a surface of 3.8 km2,has amaximum capacity of 65.106 m3 and amean theoretical residencetime of 3 months. It is subdivided in three zones. The shallow riverinezone displays hydrodynamics that are mainly controlled by inflows ofthe Sûre River. The transition zone constitutes a buffer between theriverine and lacustrine ones. Here, sedimentation processes are mostimportant and flow velocities decrease. Within the lacustrine zone,the reservoir behaves rather like a lake and hydraulics are driven bywind-induced shear forces (Wetzel, 2001). A total of three campaignswere carried out on the reservoir, each of it following the respectivetransects performed on the Sûre River under three different hydro-climatological settings (Fig. 3). For each campaign, five stations (L1 toL5) were sampled on the reservoir within one day (Fig. 1C). L1 corre-sponds to the inlet of the reservoir, while L2 is located in the transitionzone. L3, L4 and L5 are distributed along the lacustrine zone. This sam-pling strategy was repeated three times at three day-intervals (day 1,day 4 and day 7), except for the first campaign, during which L1 wassampled once at day 0. For sampling on the reservoir, 50 L were collect-ed at the inlet of the reservoir (L1). For L2 to L5, sampling wasperformed by boat using a submersible electric pump (SQ series,Grundfos). Upon positioning of the boat by GPS over the former river-bed, 70 L were collected at a depth of 2 m. Sampling depth was basedon the fact that highest parasite densities were observed 2 m belowthe surface during earlier experiments on the reservoir (data notshown).
2.2.4. Drinking water treatment plantThe drinking water treatment plant (DWTP) is operated by the
SEBES (Syndicat des Eaux du Barrage d'Esch-sur-Sûre) and treats rawwater that is collected through an inlet located near the reservoir damwall. Multi-barrier water treatment is composed of (1) ozonation,which allows an oxidation of organic matter; (2) coagulation, whichinvolves the addition of aluminium sulphate to induce flocculation;(3) slow sand filtration (effective 2 m-high filtration on a surface of7 × 100 m2); (4) pH adjustment with calcite filters; (5) disinfectionby chlorination. Raw water was sampled bimonthly at the DWTP inletbetween November 2009 and April 2011. Except in case of early
clogging of thefilter capsule, aminimumof 100 Lwere collected andfil-tered on-site.
2.3. Sample processing for parasites
Water samples were processed according to the ISO 15553 standardprotocol (ISO, 2006). Filtration was performed with Envirochek HVcapsules (Pall Gelman Biosciences) using a peristaltic pump (Ecoline)at a flow rate between 2 and 3 L.min−1. Capsule filters (pore size of1 μm, filtration area of 1300 cm2) were eluted with standard bufferand the eluate was centrifuged to obtain a packed pellet. Followingimmuno-magnetic separation (IMS), the (oo)cyst-bead complex wasacid-dissociated and the purified suspension transferred to a wellslide. Slides were dried at 37 °C and the preparation fixedwith absolutemethanol. Oocysts and cysts were stained using 4′,6′-diamidino-2-phenylindole (DAPI) and a mixture of anti-Cryptosporidium and anti-Giardiamonoclonal antibodies conjugated to fluorescein isothiocyanate(FITC) that recognize both parasites at the genus level (AquaGlo kit,Waterborne Inc.). Stained slides were screened with an epifluorescencemicroscope (DMRB, Leica). Presumptive (oo)cysts were confirmed byDAPI and Nomarski differential interference contrast (DIC). (Oo)cystcounts were standardized to a volume of 10 L.
During the course of this study, (oo)cyst recovery rate of ISO 15553methodwas assessed usingColorSeed (BTF) by seedingflow cytometry-counted C. parvum and G. duodenalis (oo)cyst preparations into 17 fieldsamples originating from the three compartments. Resulting averagerecovery rates for Cryptosporidium were 35 ± 15% in surface water(regrouping water matrices from tributaries, the Sûre River and theUpper-Sûre reservoir) and 14 ± 19% in WWTP effluents. For Giardia,these recovery rates were 49 ± 23% and 23 ± 20%, respectively.
2.4. Quantification of E. coli
At each sampling site, 100 mLof surfacewaterwere additionally col-lected in sterile recipients and kept on ice until analysis in the laborato-ry. Densities of E. coli were determined with the Colilert-18 method(IDEXX) and expressed as most-probable number (MPN) per 100 mL.
2.5. Physico-chemistry and rainfall
Measurements for electrical conductivity, pH, dissolved oxygen andtemperature were performed with a portable multi-parameter meter(HQ40d, HACH), and turbidity was assessed with a portable turbidime-ter (2100Q, HACH). For quantification of total suspended solids (TSS),between 1 and 2 L surface water were collected and filtered on glassmicrofiber filters (Grade GF/C, 1.2 μm porosity, Whatman) before dry-ing at 105 °C (min. 48 h) and weighing of the filter. Daily rainfalldata of the closest meteorological station were provided by the

Table2
Ave
rage
values
andrang
es(m
inim
um–max
imum
)form
icrobialan
dph
ysicalva
riab
lesob
served
intheUpp
er-Sûrewatersh
ed.A
bbreviations
:DW
TP,d
rink
ingwater
treatm
entp
lant;F
IB,faecalind
icator
bacteria;F
NU;formazin
neph
elom
etricun
its;
MPN
,mostp
roba
blenu
mbe
r;NA,n
otav
ailable;
TSS,totalsus
pend
edsolid
s;W
WTP
,wastewater
treatm
entplan
t.
Parasite
dens
ities
Parasite
flux
esFIBde
nsities
FIBflux
esPh
ysical
variab
les
Cryp
tosporidium
(oocysts.10L-
1)
Giardia
(cysts.10L−
1 )Cryp
tosporidium
(oocysts.d
−1 )
Giardia
(cysts.d
−1)
E.coli
(MPN
.100
mL−
1 )E.coli
(MPN
.d−1)
Turbidity
(FNU)
TSS
(mg.L−
1 )Co
nductiv
ity(μS.cm
−1 )
Sub-catchm
ents
17(0.1–17
7)30
(0.1–15
8)3.110
7(2.2
104 –2.610
8)
4.410
7(4.0
104–2.910
8)
9.810
3(41–
6.110
4 )1.110
12(1.1
108 –8.310
12)
18(3–12
1)15
(1–11
7)20
6(79–
585)
Sûre
Rive
r52
(0.5–31
3)61
4(0.8–2.710
3 )1.910
9(4.4
107 –8.910
9)
2.710
10(1.6
108 –1.310
11)
5.110
3(310
–1.710
4 )1.610
13(3.6
1012–4.610
13)
67(5–24
3)56
(5–15
4)15
3(124
–20
5)W
WTP
efflue
nts
1(0.5–1.1)
304(1.6–61
5)1.510
5(1.4
105 –2.910
5 )7.110
7(4.3
105 –1.610
8 )1.410
4(1
103 –2.710
4)
3.210
9(2.7
108 –7.310
9 )16
(9–20
)10
(8–11
)41
7(294
–55
5)Upp
er–Sû
rereservoir
4(0.1–94
)42
(0.3–96
7)NA
NA
746(1–9.610
3 )NA
9(1–73
)5(1–21
)16
0(142
–23
5)DW
TPinlet
0.4(0.1–3.4)
4.4(0.1–18
.5)
3.010
6(9.5
105 –2.210
7)
3.110
7(9.5
105–1.210
8)
50(1–72
7)3.510
10(1.4
109 –4.910
11)
2(0.4–12
)NA
142(136
–16
1)
1027J.-B. Burnet et al. / Science of the Total Environment 472 (2014) 1023–1035
Administration des Services Techniques de l'Agriculture (ASTA) (www.agrimeteo.lu).
2.6. Calculation of fluxes
Parasite fluxes were estimated using the following equation:F = C × Rwhere F is theflux, expressed in (oo)cysts.d−1,C is the parasiteconcentration, expressed in (oo)cysts.m−3 and R corresponds to the flowrate, expressed inm3.d−1. Since the four sub-catchments of compartment1 were ungauged, the flow rate was estimated using data series fromgauged neighbour catchments of similar size and rainfall inputs and ofidentical geological settings (Andreassian et al., 2012). Flow rates ofgauged catchments were obtained at the Hydro-Climatological Observa-tory of Luxembourg (www.hydroclimato.lu). For compartment 2, fluxesof the Sûre River were calculated using flow rates provided by automaticrecorders at R1 and R5. Fluxes of parasites released by WWTP effluentswere estimated based on the volume of sewage discharged over 48 h(SIDEN, personal communication). Finally, fluxes at the inlet of the DWTPwere extrapolated based on the daily extraction volumes (m3.d−1) pro-vided by the SEBES (I. Kolber, personal communication).
2.7. Statistical analyses
Nonparametric Kruskal–Wallis one-way analysis of variance (ANOVA1)followed by Dunn's post hoc test was performed to question significant dif-ferences in (oo)cyst densities (and fluxes when applicable). Differenceswere reported to be statistically significant for p-values b 0.05. Potential re-lationships between parasites and surrogates were examined using thenonparametric Spearman rank correlation test. All statistical analyseswere performed with SigmaStat 2.03 (Systat Software Inc.).
3. Results
3.1. Prevalence of Cryptosporidium and Giardia in the Upper-Sûrewatershed
A total of 121 samples were collected within the Upper-Sûre water-shed. Giardia was more prevalent than Cryptosporidium; it was detectedin 97% of the samples compared to 77% for Cryptosporidium. In the sub-catchments (compartment 1) and in the Sûre River (compartment 2),water samples were all positive for Giardia. In the Upper-Sûre reservoir(compartment 3), 91% (39/43) of the samples contained Giardia cysts.Concerning Cryptosporidium, 92% (23/25), 95% (18/19) and 67% (29/43)positive samples were reported from compartments 1, 2 and 3, respec-tively. At the inlet of the DWTP, Giardia and Cryptosporidium werefound in 100% (34/34) and 68% (23/34) of the samples, respectively.Giardia generally occurred in higher densities than Cryptosporidium,peaking in the Sûre River at 2.7 103 cysts.10 L−1 compared to 3.1 102
oocysts.10 L−1, respectively. Values (average, minimum and maximum)of relevant microbial and physical variables are provided in Table 2.
3.2. Compartment 1: parasite loads at sub-catchment outlet
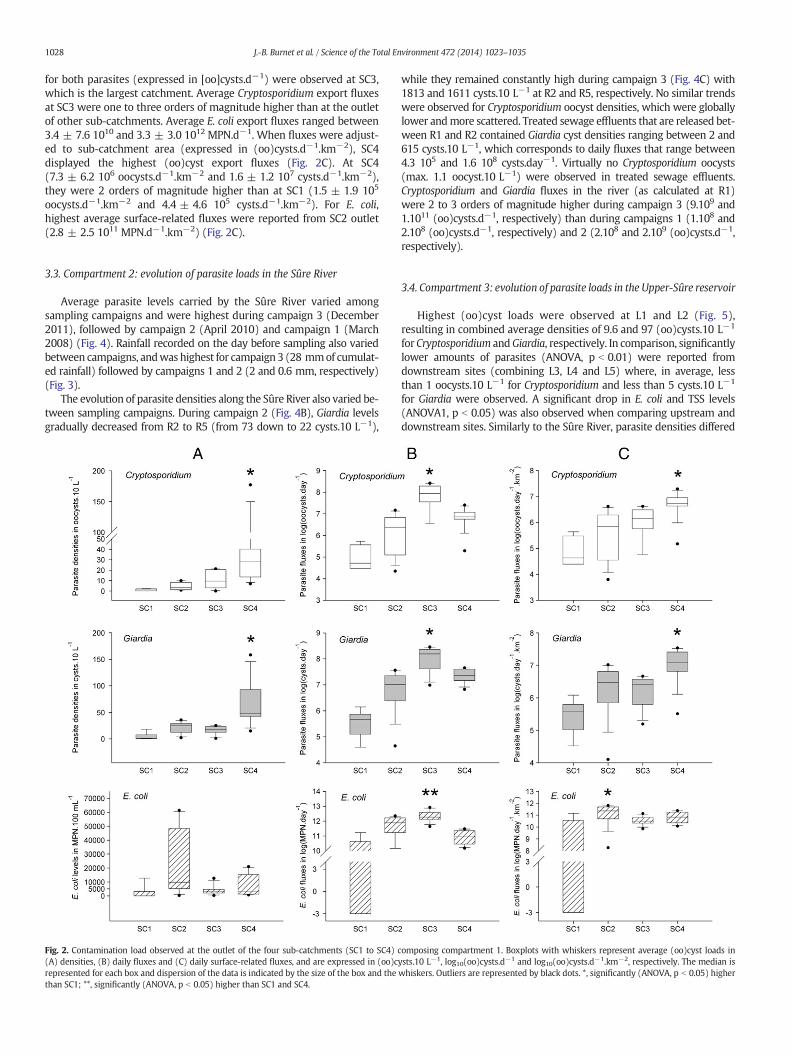
Parasite densities varied between sub-catchments and intra-site var-iabilitywas high, especially at SC4 (Fig. 2A). For bothCryptosporidium andGiardia, (oo)cyst densitieswere significantly higher (ANOVA, p b 0.05) atthe outlet of SC4 (45.2 ± 59.5 and 69.1 ± 47.7 (oo)cysts.10 L−1, respec-tively) than at the outlet of the forested sub-catchment SC1 (1.1 ± 1.1and 4.9 ± 7.4 (oo)cysts.10 L−1, respectively), which was the leastcontaminated. Highest E. coli levels were observed at SC2 (average of2.3 104 ± 2.6 104 MPN.100 mL−1) (Fig. 2A).
According to the extrapolation of the specific water flow rates fromneighbour gauged catchments, mean discharge rates (at the day ofsampling) were 30 ± 22 L.s−1, 66 ± 64 L.s−1, 1077 ± 481 L.s−1 and32 ± 21 L.s−1 at the outlet of SC1, SC2, SC3 and SC4, respectively.Resulting mean parasite fluxes are illustrated in Fig. 2B. Highest fluxes
1028 J.-B. Burnet et al. / Science of the Total Environment 472 (2014) 1023–1035
for both parasites (expressed in [oo]cysts.d−1) were observed at SC3,which is the largest catchment. Average Cryptosporidium export fluxesat SC3 were one to three orders of magnitude higher than at the outletof other sub-catchments. Average E. coli export fluxes ranged between3.4 ± 7.6 1010 and 3.3 ± 3.0 1012 MPN.d−1. When fluxes were adjust-ed to sub-catchment area (expressed in (oo)cysts.d−1.km−2), SC4displayed the highest (oo)cyst export fluxes (Fig. 2C). At SC4(7.3 ± 6.2 106 oocysts.d−1.km−2 and 1.6 ± 1.2 107 cysts.d−1.km−2),they were 2 orders of magnitude higher than at SC1 (1.5 ± 1.9 105
oocysts.d−1.km−2 and 4.4 ± 4.6 105 cysts.d−1.km−2). For E. coli,highest average surface-related fluxes were reported from SC2 outlet(2.8 ± 2.5 1011 MPN.d−1.km−2) (Fig. 2C).
3.3. Compartment 2: evolution of parasite loads in the Sûre River
Average parasite levels carried by the Sûre River varied amongsampling campaigns and were highest during campaign 3 (December2011), followed by campaign 2 (April 2010) and campaign 1 (March2008) (Fig. 4). Rainfall recorded on the day before sampling also variedbetween campaigns, andwas highest for campaign 3 (28 mmof cumulat-ed rainfall) followed by campaigns 1 and 2 (2 and 0.6 mm, respectively)(Fig. 3).
The evolution of parasite densities along the Sûre River also varied be-tween sampling campaigns. During campaign 2 (Fig. 4B), Giardia levelsgradually decreased from R2 to R5 (from 73 down to 22 cysts.10 L−1),
Fig. 2. Contamination load observed at the outlet of the four sub-catchments (SC1 to SC4) c(A) densities, (B) daily fluxes and (C) daily surface-related fluxes, and are expressed in (oo)crepresented for each box and dispersion of the data is indicated by the size of the box and thethan SC1; **, significantly (ANOVA, p b 0.05) higher than SC1 and SC4.
while they remained constantly high during campaign 3 (Fig. 4C) with1813 and 1611 cysts.10 L−1 at R2 and R5, respectively. No similar trendswere observed for Cryptosporidium oocyst densities, which were globallylower andmore scattered. Treated sewage effluents that are released bet-ween R1 and R2 contained Giardia cyst densities ranging between 2 and615 cysts.10 L−1, which corresponds to daily fluxes that range between4.3 105 and 1.6 108 cysts.day−1. Virtually no Cryptosporidium oocysts(max. 1.1 oocyst.10 L−1) were observed in treated sewage effluents.Cryptosporidium and Giardia fluxes in the river (as calculated at R1)were 2 to 3 orders of magnitude higher during campaign 3 (9.109 and1.1011 (oo)cysts.d−1, respectively) than during campaigns 1 (1.108 and2.108 (oo)cysts.d−1, respectively) and 2 (2.108 and 2.109 (oo)cysts.d−1,respectively).
3.4. Compartment 3: evolution of parasite loads in the Upper-Sûre reservoir
Highest (oo)cyst loads were observed at L1 and L2 (Fig. 5),resulting in combined average densities of 9.6 and 97 (oo)cysts.10 L−1
for Cryptosporidium andGiardia, respectively. In comparison, significantlylower amounts of parasites (ANOVA, p b 0.01) were reported fromdownstream sites (combining L3, L4 and L5) where, in average, lessthan 1 oocysts.10 L−1 for Cryptosporidium and less than 5 cysts.10 L−1
for Giardia were observed. A significant drop in E. coli and TSS levels(ANOVA1, p b 0.05) was also observed when comparing upstream anddownstream sites. Similarly to the Sûre River, parasite densities differed
omposing compartment 1. Boxplots with whiskers represent average (oo)cyst loads inysts.10 L−1, log10(oo)cysts.d−1 and log10(oo)cysts.d−1.km−2, respectively. The median iswhiskers. Outliers are represented by black dots. *, significantly (ANOVA, p b 0.05) higher

1029J.-B. Burnet et al. / Science of the Total Environment 472 (2014) 1023–1035
between sampling campaigns and were highest during campaign 3(Fig. 5). Cryptosporidium and Giardia (oo)cyst levels also fluctuatedbetween sampling days of a given campaign. At L1 for instance,Cryptosporidium and Giardia densities dropped respectively from 94 to10 and from 967 to 168 (oo)cysts.10 L−1 between day 1 and day 7 ofthe third campaign (Fig. 5C). Fluxes were not measured for the reservoirsince no flow rate data were available.
3.5. Monitoring of parasite loads at the DWTP inlet
During the 17 month-long survey of Cryptosporidium and Giardiaoccurrence at the DWTP inlet, sample volumes varied between 46 and239 L (mean of 115 ± 45 L), depending on the load with suspendedmaterial. In positive samples, Giardia levels ranged from 0.1 to 18.5cysts.10 L−1 and Cryptosporidium levels from 0.1 to 3.4 oocysts.10 L−1
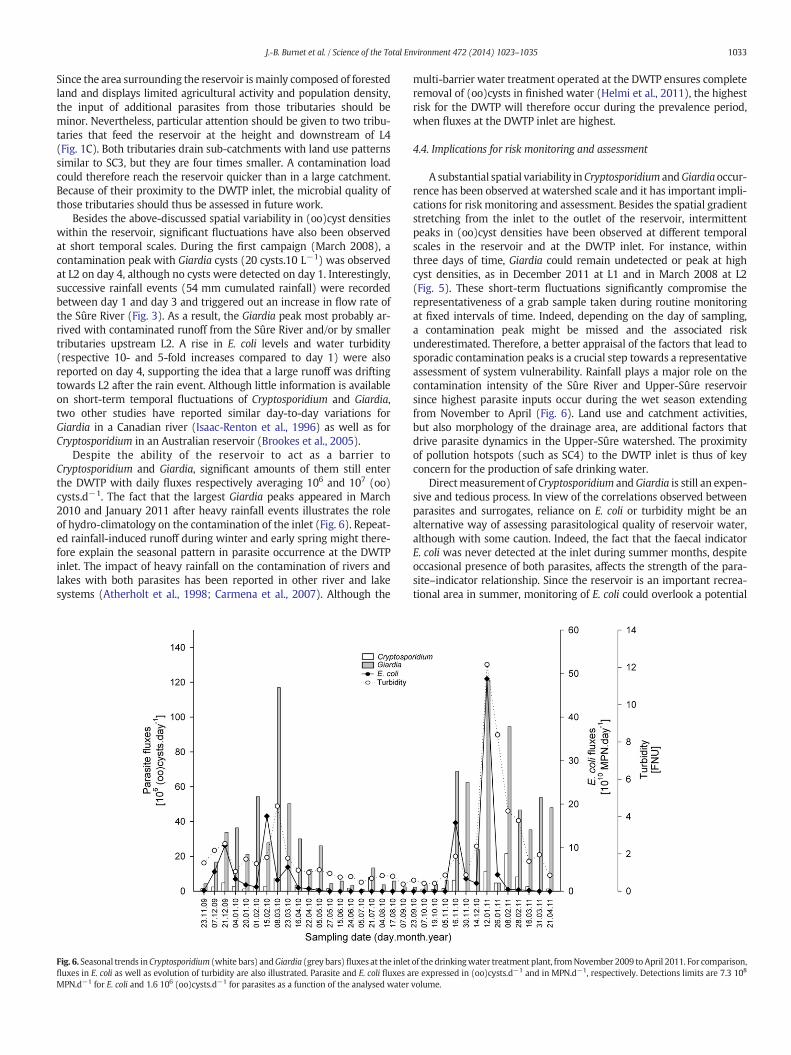
(Table 2). The (oo)cyst load entering the DWTP varied seasonally(Fig. 6). Significantly higher densities of Cryptosporidium oocysts(ANOVA, p b 0.05) andGiardia cysts (ANOVA, p b 0.05)weremeasuredbetween November and April than between May and October. Averagedaily extraction volumes of the DWTP were 73,220 ± 6164 m3.d−1).Resulting Cryptosporidium and Giardia fluxes entering the DWTP aver-aged respectively 3.0 ± 4.4 106 and 3.1 ± 3.2 107 (oo)cysts.10 d−1.Giardia fluxes peaked at N108 cysts.d−1 in March 2010, 1 to 2 weeksafter a large and prolonged rain event (67 mm cumulated rain over1 week, Fig. 3). Another Giardia peak (N108 cysts.d−1) was recordedin January 2011 following snowmelt combined to another large rainepisode (57 mm cumulated rain over 3.5 days).
3.6. Correlations between parasites and indicator variables
In the three compartments as well as at the DWTP inlet,Cryptosporidium and Giardia were significantly correlated to eachother (Table 3). Significant relationships were further observed betweenE. coli and both parasites in the reservoir (compartment 3) and at theDWTP inlet. In the river (compartment 2), only Giardiawas significantlycorrelated to the bacterial indicator (Table 3). Further correlationsbetween parasites and physical surrogates such as turbidity and TSSwere observed in the river, in the reservoir and at the DWTP inlet, butnot in the sub-catchments. The only significant correlation betweenparasites and conductivity was reported from the DWTP inlet for Giardia.
4. Discussion
The present study focused on the upstream part of the drinkingwater supply chain and investigated the spatial and temporal distribu-tion of Cryptosporidium and Giardia in a rural watershed containing amajor drinking water resource. Understanding those dynamics aims atidentifying hazardous events linked to the occurrence of both patho-gens in the watershed and at recommending downstream monitoringand management strategies. We decided to break down the Upper-Sûre watershed into interlinked compartments and to apply an adaptedsampling strategy to each compartment in order to explore the distribu-tion patterns of Cryptosporidium and Giardia and to identify the factorsthat govern those patterns in the Upper-Sûre watershed.
4.1. Land use and catchment size determine parasite loads atsub-catchment outlet
Early studies have reported the impact of catchment activities andmanagement practices (notably cattle ranching) on the contaminationof surface water by Cryptosporidium and Giardia (Bodley-Tickell et al.,2002; Hansen andOngerth, 1991; Ong et al., 1996; Ongerth et al., 1995).
In the present study, the selected sub-catchments displayed contrast-ing land use and a varying degree of anthropic pressure (human and live-stock densities, presence of treated sewage effluents) (Table 1). AlthoughCryptosporidium and Giardia were detected in the four sub-catchments,
the small forested sub-catchment SC1 was the least contaminated one.In comparison, SC3 exported 1 to 3 orders of magnitude higherCryptosporidium and Giardia fluxes than other sub-catchments (Fig. 2).This can be directly linked to its larger drainage area that results intoelevated flow rates at catchment outlet. Interestingly, when exportfluxes are balanced with the total area of the respective sub-catchment, highest surface-related (oo)cyst fluxes were those reportedfrom the outlet of SC4, the sub-catchment with the highest human andcattle density. Although SC1 and SC4 have the same catchment area,land use differs markedly and anthropic pressure is indeed highest inSC4, thereby accounting for the observed (oo)cyst fluxes. Similarly,Hansen and Ongerth (1991) reported higher (oo)cyst export fluxes inwatersheds impacted by human activity and cattle ranching.
When comparing SC3 and SC4, it can be seen that land use is verysimilar. However, because of the smaller drainage area of SC4, (oo)cyst loads that are generated in upland areas of the catchment mightreach the outlet more rapidly than in SC3. Here, some downstream at-tenuation of the initial (oo)cyst load can occur through sedimentation,dilution by less-contaminated tributaries or inactivation processes thattake place during the transfer of the (oo)cysts from the more human-impacted catchment head towards its outlet (Ongerth et al., 1995;Robinson et al., 2011; Ruecker et al., 2007). Previous investigations onthe fate of nutrients in SC3 tend to support this hypothesis, as themain tributary of SC3was shown toharbour several portions of high nu-trient retention capacity (J.F. Iffly, CRP-GL,personal communication). As aresult, the potential of compartment 1 to introduce Cryptosporidium andGiardia into downstream compartments of the Upper-Sûre watershednot only depends on land use composition and indicators of anthropicpressure (human and cattle densities), but also on physical and mor-phological features of the drainage area.
The source of Cryptosporidium andGiardia is expected to differ amongthe four sub-catchments. In SC1, which is almost devoid of anthropicpressure, both pathogens most probably originate from infected wildlife(game, small rodents andbirds), as it has been reported by others for sim-ilar sub-catchments (Feng et al., 2007; Hansen and Ongerth, 1991; Jianget al., 2005). In contrast, in sub-catchments of mixed land use such asSC2, SC3 and SC4, livestock and/or human-infecting species might alsobe detected (Robinson et al., 2011; Yang et al., 2008). Therefore, identify-ing the origin of both parasites through their molecular characterizationshould ultimately provide valuable information on the potential sourcesof contamination in the different sub-catchments (Burnet et al., 2013;Ruecker et al., 2007). Detection of C. parvum, C. hominis or otherhuman-infecting species would for instance have significant implicationsfor the associated public health risk in the Upper-Sûre watershed.
4.2. The Sûre River carries significant parasite loads following heavy rainfall
Over the 16-km long studied portion, the Sûre River is fed by tribu-taries similar to SC3 and SC4, which have the potential to continuouslydeliver large amounts of Cryptosporidium oocysts and Giardia cysts. Theresults from field campaigns highlighted the potential of the Sûre Riverto vehicle substantial amounts of parasites, with almost no breakdownof the (oo)cyst load along the 16-km long portion of the river. This is es-pecially visible during large runoff events such as in December 2011.The latter campaign was preceded by heavy rainfall, following aprolonged 2 month-period, during which cumulated rainfall was morethan 4 times lower (44 mm) than the 1971–2000 normal (184 mm).As a result, faecal material deposited in upland areas might have beenwashed off and carried by the large runoff event, resulting in a transferof significant amounts of parasites from R1 to R5.
Interestingly, despite a very similar river flow rate in December 2011and March 2008, (oo)cyst densities were N2 log10 units higher inDecember 2011. This difference most probably arises from the factthat the latter sampling caught the first flush of the runoff. In contrast,samples from the campaign of March 2008 were collected in the de-creasing phase of a larger runoff event (N10 m3.s−1) that had occurred

1030 J.-B. Burnet et al. / Science of the Total Environment 472 (2014) 1023–1035
one week earlier, thereby missing a potential contamination peak(Fig. 3). Additionally to the absence of recent runoff, (oo)cysts weremore diluted than under base flow (April 2010), which can explainthe particularly low (oo)cyst densities observed in March 2008. Underbase flow (April 2010), a gradual decrease in Giardia cysts densitieswas observed after R2. This could arise from sedimentation of thecysts as they progress downstream. Settling of both parasites but alsoof E. coli was shown to occur in rivers and streams, especially under
Fig. 3. Hydro-climatological settings of the Upper-Sûre watershed for three different periods. S2010 andDecember 2011. For each campaign, daily rainfall (mm, black bars) aswell asflow ratein the Sûre River (R) and in the Upper-Sûre reservoir (L) (see text for sampling methodology)
regular flow (Jamieson et al., 2005; Medema et al., 1998), and positivecorrelations betweenGiardia, E. coli, turbidity and total suspended solids(Table 3) argue for common dynamics of those variables in the SûreRiver.
According to our observations, the contamination of the Sûre River ismainly originating from the catchment area upstream R1, which repre-sents 65% of the Upper-Sûre watershed. The elevated (oo)cyst densitiesobserved at R1 in December 2011 reflect the contribution from this part
ampling of the Sûre River and Upper-Sûre reservoir was performed in March 2008, Aprilof the Sûre River (m3.s−1, white area) are provided. Arrows indicate theday(s) of sampling.

1031J.-B. Burnet et al. / Science of the Total Environment 472 (2014) 1023–1035
of the watershed to the overall (oo)cyst load of the Sûre River. Cattleraising (N27,000 heads) and land application of manure are dominantfeatures of this area besides its high percentage of forest (between 30%and 50%) harbouring potential (oo)cyst reservoirs among wildlife.Those features have been linked to the existence of diffuse sources offaecal pollution known to contribute to the release of Cryptosporidiumand Giardia in rivers, especially after elevated precipitation rates (Duriset al., 2013; Feng et al., 2007; Moulin et al., 2010; Ono et al., 2001;Thurston-Enriquez et al., 2005). The globally lower and more scatteredoocyst densities as well as their virtual absence from effluents ofthe wastewater treatment plant (WWTP) argue for a diffuse origin ofCryptosporidium in the Sûre River. In addition to diffuse pollution,Giardia
Fig. 4. Evolution of Cryptosporidium (white bars) and Giardia (grey bars) densities (expressed inthe water over 16 km, from R1 to R5. A total of three campaigns were performed: (A) March 2wastewater treatment plant (WWTP) are discharged between R1 and R2 (indicated by an arro
is released through reclaimed effluents of theWWTP, as already reportedby others (Castro-Hermida et al., 2008; Kistemann et al., 2012; Robertsonet al., 2006;Wicki et al., 2009). However, the contribution of those efflu-ents to the total Giardia load of the Sûre River appears to vary with riverflow. In December 2011 for instance, Giardia densities did not increasedownstream the WWTP effluents, because cyst fluxes were almost 3log10 units higher than those released by the WWTP. Due to the lowerriver flow in April 2010, the slight increase in Giardia cyst densitiesbetween R1 and R2 could however be attributable to the input ofWWTP effluents. Similarly, Moulin et al. (2010) found the contributionof a major WWTP to the total (oo)cyst load of the Seine River to varywith river flow and estimated it to 1% in winter and 12% in summer.
Log10(oo)cysts.10 L−1) in the Sûre River (compartment 2) during Lagrangian tracking of008, (B) April 2010 and (C) December 2011. Treated sewage effluents (noted as “E”) of aw).

1032 J.-B. Burnet et al. / Science of the Total Environment 472 (2014) 1023–1035
4.3. The Upper-Sûre reservoir is a major barrier to the transport ofCryptosporidium and Giardia
Pre-dams can act as a first barrier to the intrusion of pathogens intoreservoirs (Brookes et al., 2004). The Misère pre-dam appears to playthis role, especially under runoff conditions as in December 2011.After the pre-dam, water enters the Upper-Sûre reservoir, which issub-divided into three zones (Wetzel, 2001). Results showed thathighest parasite densities occur between the reservoir inlet (L1) andthe transition zone (L2), thereby highlighting a spatial heterogeneityin Cryptosporidium and Giardia distribution within the entire Upper-Sûre reservoir (Fig. 5). The latter distribution gradient suggests that asignificant breakdown of the (oo)cyst load discharged by the SûreRiver occurs within the reservoir. Even when large amounts of Giardia(N103cysts.10 L−1) enter into the reservoir through the Sûre River,the cyst load already decreases by passing the riverine zone and is notfurther transported downstream, resulting in a removal rate between2 and 3 log10 units. Similar removal rates have been reported from astudy in a Dutch reservoir, ranging between 1.7 and 3.1 log10 units forCryptosporidium and Giardia, respectively (Van Breemen et al., 1998).
Fig. 5. Evolution of the Cryptosporidium (white bars) and Giardia (grey bars) densities (expressall stations were sampled within one day and this scheme repeated three times, at three day-i
Removal of (oo)cysts by reservoirs can occur through variousenvironmental processes, such as dilution, inactivation and sedimenta-tion. While temperature, UV or grazing are also important drivers of(oo)cyst inactivation, especially during summer months (Brookes etal., 2004; Connelly et al., 2007; Nowosad et al., 2007), those factors didmost probably not affect Cryptosporidium and Giardia in our studysince sampling was performed in winter and early spring. Instead, thesharp decrease in (oo)cyst densities downstream L1 and L2might rath-er be caused by sedimentation within the first kilometres of the reser-voir. Preliminary results on sediments collected during the presentstudy indicate that both protozoans settle in the reservoir and that(oo)cyst densities are higher in sediments of the riverine and transitionzones, compared to the lacustrine zone. Also, the reduction in TSS levelswith increasing distance to the riverine zone calls for the existence ofsedimentation processes in the reservoir.
Another explanation for the lower (oo)cyst densities of the lacus-trine zone could be the progressive dilution of the Sûre River inflow(Antenucci et al., 2005). Yet, dilution of the parasite load introduced inthe reservoir can occur if additional inputs from side-arms and smallerreservoir tributaries are less contaminated than the river inflow itself.
ed in (oo)cysts.10 L−1) in the Upper-Sûre reservoir (compartment 3). For each campaign,ntervals each (day 1, day 4 and day 7). ND, not determined.
1033J.-B. Burnet et al. / Science of the Total Environment 472 (2014) 1023–1035
Since the area surrounding the reservoir ismainly composed of forestedland and displays limited agricultural activity and population density,the input of additional parasites from those tributaries should beminor. Nevertheless, particular attention should be given to two tribu-taries that feed the reservoir at the height and downstream of L4(Fig. 1C). Both tributaries drain sub-catchments with land use patternssimilar to SC3, but they are four times smaller. A contamination loadcould therefore reach the reservoir quicker than in a large catchment.Because of their proximity to the DWTP inlet, the microbial quality ofthose tributaries should thus be assessed in future work.
Besides the above-discussed spatial variability in (oo)cyst densitieswithin the reservoir, significant fluctuations have also been observedat short temporal scales. During the first campaign (March 2008), acontamination peak with Giardia cysts (20 cysts.10 L−1) was observedat L2 on day 4, although no cysts were detected on day 1. Interestingly,successive rainfall events (54 mm cumulated rainfall) were recordedbetween day 1 and day 3 and triggered out an increase in flow rate ofthe Sûre River (Fig. 3). As a result, the Giardia peak most probably ar-rived with contaminated runoff from the Sûre River and/or by smallertributaries upstream L2. A rise in E. coli levels and water turbidity(respective 10- and 5-fold increases compared to day 1) were alsoreported on day 4, supporting the idea that a large runoff was driftingtowards L2 after the rain event. Although little information is availableon short-term temporal fluctuations of Cryptosporidium and Giardia,two other studies have reported similar day-to-day variations forGiardia in a Canadian river (Isaac-Renton et al., 1996) as well as forCryptosporidium in an Australian reservoir (Brookes et al., 2005).
Despite the ability of the reservoir to act as a barrier toCryptosporidium and Giardia, significant amounts of them still enterthe DWTP with daily fluxes respectively averaging 106 and 107 (oo)cysts.d−1. The fact that the largest Giardia peaks appeared in March2010 and January 2011 after heavy rainfall events illustrates the roleof hydro-climatology on the contamination of the inlet (Fig. 6). Repeat-ed rainfall-induced runoff during winter and early spring might there-fore explain the seasonal pattern in parasite occurrence at the DWTPinlet. The impact of heavy rainfall on the contamination of rivers andlakes with both parasites has been reported in other river and lakesystems (Atherholt et al., 1998; Carmena et al., 2007). Although the
Fig. 6. Seasonal trends inCryptosporidium (white bars) andGiardia (grey bars) fluxes at the inletfluxes in E. coli as well as evolution of turbidity are also illustrated. Parasite and E. coli fluxes aMPN.d−1 for E. coli and 1.6 106 (oo)cysts.d−1 for parasites as a function of the analysed water
multi-barrier water treatment operated at the DWTP ensures completeremoval of (oo)cysts in finished water (Helmi et al., 2011), the highestrisk for the DWTP will therefore occur during the prevalence period,when fluxes at the DWTP inlet are highest.
4.4. Implications for risk monitoring and assessment
A substantial spatial variability in Cryptosporidium andGiardiaoccur-rence has been observed at watershed scale and it has important impli-cations for risk monitoring and assessment. Besides the spatial gradientstretching from the inlet to the outlet of the reservoir, intermittentpeaks in (oo)cyst densities have been observed at different temporalscales in the reservoir and at the DWTP inlet. For instance, withinthree days of time, Giardia could remain undetected or peak at highcyst densities, as in December 2011 at L1 and in March 2008 at L2(Fig. 5). These short-term fluctuations significantly compromise therepresentativeness of a grab sample taken during routine monitoringat fixed intervals of time. Indeed, depending on the day of sampling,a contamination peak might be missed and the associated riskunderestimated. Therefore, a better appraisal of the factors that lead tosporadic contamination peaks is a crucial step towards a representativeassessment of system vulnerability. Rainfall plays a major role on thecontamination intensity of the Sûre River and Upper-Sûre reservoirsince highest parasite inputs occur during the wet season extendingfrom November to April (Fig. 6). Land use and catchment activities,but also morphology of the drainage area, are additional factors thatdrive parasite dynamics in the Upper-Sûre watershed. The proximityof pollution hotspots (such as SC4) to the DWTP inlet is thus of keyconcern for the production of safe drinking water.
Directmeasurement of Cryptosporidium andGiardia is still an expen-sive and tedious process. In view of the correlations observed betweenparasites and surrogates, reliance on E. coli or turbidity might be analternative way of assessing parasitological quality of reservoir water,although with some caution. Indeed, the fact that the faecal indicatorE. coli was never detected at the inlet during summer months, despiteoccasional presence of both parasites, affects the strength of the para-site–indicator relationship. Since the reservoir is an important recrea-tional area in summer, monitoring of E. coli could overlook a potential
of the drinkingwater treatment plant, fromNovember 2009 to April 2011. For comparison,re expressed in (oo)cysts.d−1 and in MPN.d−1, respectively. Detections limits are 7.3 108
volume.

Table 3Spearman r and p-values for Giardia and Cryptosporidium tested for rank correlation withindicator variables including E. coli, turbidity, TSS and conductivity in (A) sub-catchments,(B), Sûre River, (C), Upper-Sûre reservoir and (D) at the DWTP inlet. Significant values(p b 0.05) are shown in bold. DWTP, drinkingwater treatment plant; TSS, total suspendedsolids; ND, not determined.
Correlation to Giardia densities
Variables Cryptosporidium E. coli Turbidity TSS Conductivity
A) Sub-catchmentsNumber of xy pairs 25 25 24 25 24Spearman r 0.640 0.390 −0.137 −0.054 0.281p-Value b0.001 0.0535 0.502 0.792 0.181
B) Sûre RiverNumber of xy pairs 19 19 18 14 19Spearman r 0.684 0.772 0.554 0.697 0.156p-Value 0.001 b0.001 0.017 0.005 0.517
C) Upper-Sûre reservoirNumber of xy pairs 43 40 41 24 39Spearman r 0.399 0.450 0.632 0.175 0.097p-Value 0.008 0.004 b0.001 0.407 0.913
D) DWTP inletNumber of xy pairs 34 34 34 ND 34Spearman r 0.511 0.594 0.694 0.546p-Value 0.002 b0.001 b0.001 b0.001
Correlation to Cryptosporidium densities
Variables Cryptosporidium E. coli Turbidity TSS Conductivity
A) Sub-catchmentsNumber of xy pairs 25 24 25 24Spearman r – 0.304 −0.143 0.142 0.201p-Value 0.138 0.502 0.493 0.342
B) Sûre RiverNumber of xy pairs 19 18 14 19Spearman r – 0.317 0.406 0.516 −0.098p-Value 0.181 0.092 0.056 0.683
C) Upper-Sûre reservoirNumber of xy pairs – 40 41 24 39Spearman r 0.582 0.692 0.574 0.018p-Value b0.001 b0.001 0.003 0.913
D) DWTP inletNumber of xy pairs – 34 34 ND 34Spearman r 0.586 0.589 0.224p-Value b0.001 b0.001 0.201
1034 J.-B. Burnet et al. / Science of the Total Environment 472 (2014) 1023–1035
risk of waterborne infection with protozoan pathogens during bathing.Because no universal surrogate currently enables an accurate predictionof Cryptosporidium and/orGiardia occurrence inwater, it is recommend-ed to assess a series of surrogate variables when sampling for parasites(Harwood et al., 2005). We therefore also looked for relationshipsbetween parasites and other common surrogates of faecal pollution.Most of the significant correlations were reported from the river andfrom the reservoir, where for instance Giardia was positively linkedwith Cryptosporidium, E. coli and turbidity. At the DWTP inlet, a weak,yet significant correlation was further reported between Giardiaand conductivity, similarly to previous findings (Helmi et al., 2011).Although some correlations were stronger than others, they suggestthat the distribution dynamics of parasites (especially Giardia) andthose of indicators of faecal pollution are governed by similar factors,among which rainfall appears to be determinant.
In view of the parasite fluxes in the Sûre River, implementationof best management practices in strategic areas of the watershedwould likely contribute to reduction in parasite loads produced inupland areas (Goss and Richards, 2008). A significant drop in parasiteexport from such critical areas could hence limit the contaminationload reaching the DWTP inlet. In a next step, genotyping of thedetected (oo)cysts should help elucidating the pollution sources and,
together with an understanding of the spatial and temporal variabilityin Cryptosporidium and Giardia distribution within the watershed, itwill enhance the protection of the water supply upstream the drinkingwater treatment chain.
The methodology used in the present study can be applied to otherdrinking water supply systems in view of a better understanding ofcatchment microbial dynamics by breaking down a complex systeminto separate compartments. It further drives the collection of fielddata to be used as inputs in fate and transport models predicting theoccurrence of Cryptosporidium and Giardia in surface water.
Conflict of interest
The authors state that there is no conflict of interest concerning thisstudy.
Acknowledgments
The authors want to thank Dr. I. Kolber as well as C. Letsch andT. Gaudron for providing water quality data of the DWTP inlet, and thedirector of the SEBES, G. Kraus, for the access to the DWTP. We alsoacknowledge C. Walczak, D. Collard, A. Cours and N. Bonjean (CRP-GL)for excellent technical support as well as Dr L. Hoffmann for finalreading of the manuscript. We would also like to thank J. Bormann(Administration des Services de l'Agriculture), L. Giustarini, S. Heitz,JF. Iffly, Dr P. Matgen and C. Tailliez (CRP-GL) as well as N. Mayon(Parc Naturel Haute-Sûre). The present work was carried out in theframework of the PATHOS project co-funded by the National ResearchFund of Luxembourg (FNR) (contract number C08/SR/08). Jean-BaptisteBurnet received an AFR grant from the FNR (reference TR-PHDBFR08-097).
References
Andreassian V, Lerat J, Le Moine N, Perrin C. Neighbors: nature's own hydrological models.J Hydrol 2012;414–415:49–58.
Antenucci JP, Brookes JD, Hipsey MR. A simple model for quantifying Cryptosporidiumtransport, dilution, and potential risk in reservoirs. J Am Water Works Assoc2005;97:86–93.
Atherholt TB, LeChevallier MW, Norton WD, Rosen JS. Effect of rainfall on Giardia andCrypto. J Am Water Works Assoc 1998;90:66–80.
Baldursson S, Karanis P. Waterborne transmission of protozoan parasites: review ofworldwide outbreaks — n update 2004–2010. Water Res 2011;45:6603–14.
Betancourt WQ, Rose JB. Drinking water treatment processes for removal of Cryptosporid-ium and Giardia. Vet Parasitol 2004;126:219–34.
Bodley-Tickell AT, Kitchen SE, Sturdee AP. Occurrence of Cryptosporidium in agriculturalsurface waters during an annual farming cycle in lowland UK. Water Res 2002;36:1880–6.
Brookes JD, Antenucci J, Hipsey M, Burch MD, Ashbolt NJ, Ferguson C. Fate and transportof pathogens in lakes and reservoirs. Environ Int 2004;30:741–59.
Brookes JD, Hipsey MR, Burch MD, Regel RH, Linden LG, Ferguson CM, et al. Relative valueof surrogate indicators for detecting pathogens in lakes and reservoirs. Environ SciTechnol 2005;39:8614–21.
Burnet JB, Ogorzaly L, Tissier A, Penny C, Cauchie HM. Novel quantitative TaqMan real-timePCRassays for detection of Cryptosporidiumat thegenus level andgenotyping ofmajorhuman and cattle-infecting species. J Appl Microbiol 2013;114:1211–22.
Carmena D, Aguinagalde X, Zigorraga C, Fernández-Crespo JC, Ocio JA. Presence of Giardiacysts and Cryptosporidium oocysts in drinking water supplies in northern Spain. JAppl Microbiol 2007;102:619–29.
Castro-Hermida JA, Garcia-Presedo I, Almeida A, Gonzalez-Warleta M, Da Costa JMC,Mezo M. Contribution of treated wastewater to the contamination of recreationalriver areas with Cryptosporidium spp. and Giardia duodenalis. Water Res 2008;42:3528–38.
Connelly SJ, Wolyniak EA, Dieter KL, Williamson CE, Jellison KL. Impact of zooplanktongrazing on the excystation, viability, and infectivity of the protozoan pathogens Cryp-tosporidium parvum and Giardia lamblia. Appl Environ Microbiol 2007;73:7277–82.
Dorner SM, Anderson WB, Slawson RM, Kouwen N, Huck PM. Hydrologic modeling ofpathogen fate and transport. Environ Sci Technol 2006;40:4746–53.
Duris JW, Reif AG, Krouse DA, Isaacs NM. Factors related to occurrence and distribution ofselected bacterial and protozoan pathogens in Pennsylvania streams. Water Res2013;47:300–14.
Feng Y, Alderisio KA, Yang W, Blancero LA, Kuhne WG, Nadareski CA, et al. Cryptosporid-ium genotypes in wildlife from a New York watershed. Appl Environ Microbiol2007;73:6475–83.
Ferguson C, Husman AM, Altavilla N, Deere D, Ashbolt N. Fate and transport of surfacewater pathogens in watersheds. Crit Rev Environ Sci Technol 2003;33:299–361.
1035J.-B. Burnet et al. / Science of the Total Environment 472 (2014) 1023–1035
Goss M, Richards C. Development of a risk-based index for source water protection plan-ning, which supports the reduction of pathogens from agricultural activity enteringwater resources. J Environ Manage 2008;87:623–32.
Hansen JS, Ongerth JE. Effects of time and watershed characteristics on the concentra-tion of Cryptosporidium oocysts in river water. Appl Environ Microbiol 1991;57:2790–5.
Harwood VJ, Levine AD, Scott TM, Chivukula V, Lukasik J, Farrah SR, et al. Validity of theindicator organism paradigm for pathogen reduction in reclaimed water and publichealth protection. Appl Environ Microbiol 2005;71:3163–70.
Helmi K, Skraber S, Burnet JB, Leblanc L, Hoffmann L, Cauchie HM. Two-year monitoringof Cryptosporidium parvum and Giardia lamblia occurrence in a recreational anddrinking water reservoir using standard microscopic and molecular biology tech-niques. Environ Monit Assess 2011;179:163–75.
Horman A, Rimhanen-Finne R, Maunula L, von Bonsdorff CH, Torvela N, Heikinheimo A,et al. Campylobacter spp., Giardia spp., Cryptosporidium spp., noroviruses, and indica-tor organisms in surface water in southwestern Finland, 2000–2001. Appl EnvironMicrobiol 2004;70:87–95.
Hunter PR, MacDonald AM, Carter RC. Water supply and health. PLoS Med 2010;7:e1000361.
Isaac-Renton J, Moorehead W, Ross A. Longitudinal studies of Giardia contamination intwo community drinking water supplies: cyst levels, parasite viability, and health im-pact. Appl Environ Microbiol 1996;62:47–54.
ISO. ISO 15553: Water quality — isolation and identification of Cryptosporidium oocystsand Giardia cysts from water. Geneva, Switzerland: International Organization forStandardization; 2006.
Jamieson R, Joy DM, Lee H, Kostaschuk R, Gordon R. Transport and deposition ofsediment-associated Escherichia coli in natural streams. Water Res 2005;39:2665–75.
Jiang J, Alderisio KA, Xiao L. Distribution of Cryptosporidium genotypes in storm eventwater samples from three watersheds in New York. Appl Environ Microbiol2005;71:4446–54.
Keeley A, Faulkner BR. Influence of land use and watershed characteristics on protozoacontamination in a potential drinking water resources reservoir. Water Res2008;42:2803–13.
Kistemann T, Classen T, Koch C, Dangendorf F, Fischeder R, Gebel J, et al. Microbial load ofdrinking water reservoir tributaries during extreme rainfall and runoff. Appl EnvironMicrobiol 2002;68:2188–97.
Kistemann T, Rind E, Koch C, Claßen T, Lengen C, Exner M, et al. Effect of sewage treat-ment plants and diffuse pollution on the occurrence of protozoal parasites in thecourse of a small river. Int J Hyg Environ Health 2012;215:577–83.
Lemarchand K, Lebaron P. Occurrence of Salmonella spp. and Cryptosporidium spp. in aFrench coastal watershed: relationship with fecal indicators. FEMS Microbiol Lett2003;218:203–9.
MedemaGJ, Schijven JF.Modelling the sewage discharge anddispersionof Cryptosporidiumand Giardia in surface water. Water Res 2001;35:4307–16.
Medema GJ, Schets FM, Teunis PF, Havelaar AH. Sedimentation of free and attachedCryptosporidium oocysts and Giardia cysts in water. Appl Environ Microbiol1998;64:4460–6.
Moulin L, Richard F, Stefania S, Goulet M, Gosselin S, Gonçalves A, et al. Contribution oftreated wastewater to the microbiological quality of Seine River in Paris. Water Res2010;44:5222–31.
Nasser AM, Zaruk N, Tenenbaum L, Netzan Y. Comparative survival of Cryptosporidium,coxsackievirus A9 and Escherichia coli in stream, brackish and sea waters. WaterSci Technol 2003;47:91–6.
Nowosad P. Kuczynska-Kippen, Sodkowicz-Kowalska, Majewska AC, Graczyk TK. The useof rotifers in detecting protozoan parasite infections in recreational lakes. Aquat Ecol2007;41:47–54.
Ong C, Moorehead W, Ross A, Isaac-Renton J. Studies of Giardia spp. and Cryptosporidiumspp. in two adjacent watersheds. Appl Environ Microbiol 1996;62:2798–805.
Ongerth JE, Hunter GD, DeWalle FB. Watershed use and Giardia cyst presence. Water Res1995;29:1295–9.
Ono K, Tsuji H, Rai SK, Yamamoto A,Masuda K, Endo T, et al. Contamination of river waterby Cryptosporidium parvum oocysts in western Japan. Appl Environ Microbiol2001;67:3832–6.
Robertson LJ, Hermansen L, Gjerde BK. Occurrence of Cryptosporidium oocysts and Giardiacysts in sewage in Norway. Appl Environ Microbiol 2006;72:5297–303.
Robinson G, Chalmers RM, Stapleton C, Palmer SR, Watkins J, Francis C, et al. A wholewater catchment approach to investigating the origin and distribution of Cryptospo-ridium species. J Appl Microbiol 2011;111:717–30.
Rossignol JF. Cryptosporidium and Giardia: treatment options and prospects for newdrugs. Exp Parasitol 2010;124:45–53.
Ruecker NJ, Braithwaite SL, Topp E, Edge T, Lapen DR, Wilkes G, et al. Tracking hostsources of Cryptosporidium spp. in raw water for improved health risk assessment.Appl Environ Microbiol 2007;73:3945–57.
Salvia-Castellvi M, Iffly JF, Borght PV, Hoffmann L. Dissolved and particulate nutrient ex-port from rural catchments: a case study from Luxembourg. Sci Total Environ2005;344:51–65.
Signor RS, Roser DJ, Ashbolt NJ, Ball JE. Quantifying the impact of runoff events on micro-biological contaminant concentrations entering surface drinking source waters. JWater Health 2005;3:453–68.
Tang J, McDonald S, Peng X, Samadder SR, Murphy TM, Holden NM. Modelling Cryptospo-ridium oocysts transport in small ungauged agricultural catchments. Water Res2011;45:3665–80.
Thurston-Enriquez JA, Gilley JE, Eghball B. Microbial quality of runoff following land appli-cation of cattle manure and swine slurry. J Water Health 2005;3:157–71.
United Nations. The human right to water and sanitation. Resolution A/RES/64/292; 2010.Van Breemen LWCA, Ketelaars H, Hoogenboezem W, Medema G. Storage reservoirs — a
first barrier for pathogenic micro-organisms in the Netherlands. Water Sci Technol1998;37:253–60.
Walker FR, Stedinger JR. Fate and transport model of Cryptosporidium. J Environ Eng1999;125:325–33.
Wetzel R. Limnology: lake and river ecosystems. San Diego, CA: Academic Press; 2001.WHO. Water safety plan manual (WSP manual): step-by-step risk management for
drinking-water suppliers. How to develop and implement a Water Safety Plan — astep-by-step approach using 11 learning modules. Geneva, Switzerland: WHO;IWA; 2009.
Wicki M, Svoboda P, Tanner M. Occurrence of Giardia lamblia in recreational streams inBasel-Landschaft, Switzerland. Environ Res 2009;109:524–7.
Wu J, Long SC, Das D, Dorner SM. Are microbial indicators and pathogens correlated? Astatistical analysis of 40 years of research. J Water Health 2011;9:265–78.
YangW, Chen P, Villegas EN, Landy RB, Kanetsky C, Cama V, et al. Cryptosporidium sourcetracking in the potomac river watershed. Appl Environ Microbiol 2008;74:6495–504.