Embed Size (px)
Citation preview


Spectrometer

Physics UCAS Visit
Building a SpectrometerG. Spencer, S. Atherton – 2020-05-14
IntroductionA spectrometer is a powerful tool used in many dif-ferent fields to determine the atomic make-up of anobject. Despite it being such a simple device, thespectrometer has a long history spanning hundredsof years.
In 1666 Issac Newton was playing around with glassprisms when he made the observation that colour wasan intrinsic property of light and that white light wasmade by combining these base colours. While we maythink this to be a trivial observation today, it was metwith much controversy and opposition. A year later,Scottish mathematician and astronomer James Gre-gory discovered the first diffraction grating by observ-ing the passage of light through the feathers from abird. He made a small circular hole which let sun lightinto an otherwise dark room. Over the hole he placeda delicate, white feather and observed “a number ofsmall circles and ovals... whereof one is somewhatwhite... and the rest severally coloured.” [?]
It is thought that David Rittenhouse was perhaps thefirst person to manufacture a diffraction grating [?] in1785, over 100 years after Newton’s and Gregory’sdiscoveries. To make the half-inch square diffractiongrating, David Rittenhouse got a watchmaker to cuta very fine screw thread onto two brass wires (abouthalf an inch long). To these he attached between 50and 60 hairs, hanging them as parallel and equidistantapart as possible. Nearly 40 years later Joseph vonFraunhofer invented the modern spectrometer [?]. Hefirst did this around 1814 with a prism and then in 1820he developed his own diffraction grating in a very simi-lar way to David Rittenhouse except he used fine wiresinstead of hairs. Fraunhofer’s spectrometer was con-structed from a narrow slit, a prism/diffraction-gratingand a telescope. He used it to observe characteris-tic black lines in the spectra from the sun, stars andother astral bodies but was unable to explain them. Inthe 1850s, Gustav Kirchoff and Robert Bunsen usedspectroscopes to analyse different chemicals. Theyfound that each chemical element had a series of well-defined bands in its spectrum [?]. By comparing thesechemical finger prints to the astronomical spectra weare able to find out which elements are in the stars!.
Following on from the lecture you had earlier and inthe footsteps of these historic physicists you will bebuilding your own diffraction grating spectrometer andthen using it to identify some unknown spectra ofsome atomic elements. Your spectrometer will bearsome resemblance to the design of Fraunhofer, how-ever we will be replacing the telescope with the cam-
era from a phone.
How it Works
Light from a source such as a bulb passes through thenarrow slit on one side of the spectrometer. This cre-ates a narrow beam of light which falls on the diffrac-tion grating opposite to the slit. The diffraction grat-ing will split the light into different directions depend-ing upon the wavelength. This spreading out of thelight according to wavelength can be recorded using aphone’s camera pressed up against the grating.
Spectrometer
Figure 1: Schematic showing the function of the spectrom-eter
ExperimentWARNING: If viewing with the naked eye, do notpoint the spectrometer at lasers or the sun orother sources that may damage your eyesight!
Building the Spectrometer
1. Cut along the outer edge and cut a single line forthe slit.
2. For all the dotted lines labelled as ”fold-up”, foldthese up towards you. For the rest of the dot-ted lines fold these down. The shaped shouldbe such that the black side is on the inside andthe text is on the outside.
3. Use double sided tape to stick the spectrometertogether
4. Fix the diffraction grating to the folded up edgeson the open side of the spectrometer. Take carein orientating the diffraction grating. With thespectrometer orientated so the university logois on top. The arrows on the diffraction gratingshould point to the ceiling.
Copyright © 2020 Loughborough University. All rights reserved.All teaching materials provided by Loughborough University during the course of your study are made available for your individual use
and must not be shared with others or uploaded onto external websites.

Physics UCAS Visit Department of Physics 2 of ??
You may find that some light gets inside the spectrom-eter through gaps in the corners and along the joins.You can reduce this by fixing strips of black electricaltape over the gaps.
Collecting Data
In the lab you will find a set of spectral lamps. Spec-tral lamps contain vapours of particular elements ormolecules. When a voltage is applied between twoseparated electrodes inside the vapour cloud, it stripsthe electrons from some of the atoms creating an ion-ized gas (known as a plasma). When the ions collidewith neutral atoms they can gain an energetic electron.The electron then relaxed back to its lowest energystate emitting a photon. The photons have a char-
acteristic frequency and wavelength corresponding tothe transition energy, resulting in a series of discretespectral lines.
To collect the spectra of these lamps, the spectrome-ter can be held up close to the camera on your phone.Pointing the slit towards the source and focusing yourcamera should produce distinct spectral lines.
Compare the spectra captured from the lamps to thegraphs below in Figure ??. Can you identify thesources which created these spectra?
If you have a compact fluorescent light (CFL) bulbat home, then you should be able to observe twoclear spectral bands due to the mercury in the bulbat 438 nm (indigo) and 546 nm (green).
Figure 2: See if you can identify the above spectra from the lamps available in the laboratory. Spectra plotted using Spectrav1.0 [?]
Followup Work
Calibration
To calibrate your spectrometer you need a source withknown wavelengths. A fluorescent lightbulb such asthe one shown in figure 3 is a good example. Thesmall amount of mercury vapour in the bulb will emit atrecognisable wavelengths, seen as the bright blue andgreen emissions in the spectrum in figure 3. We willuse the Lboro spectrometer and your camera to imagethe bulb and then the program Spectral Workbench toanalyse it (you will need to create an account on Pub-lic Lab to use the software https://publiclab.org/).
Using your camera take a picture of the bulb. Youshould see a spectrum similar to that shown in figure3. Experiment with you distance to the bulb, imagingthe light directly or indirectly and camera settings suchas exposure time until you are happy with your image.
Go to https://spectralworkbench.org/dashboard andlog in (you do this on your smartphone or on your com-puter). Clicking on the drop down arrow next to cap-ture spectra will give the option to upload and image.Click this option, then in the choose and image to up-load section choose your bulb spectrum. Make surethe orientation of the image is correct and then clickupload and calibrate later. The program will displayyour image and a graph showing the pixel intensity asa function of pixel number along the x axis. You shouldsee peaks that correspond to the bright blue and greenlines in your image. Click the blue Calibrate button andthe program will attempt to identify those two peaks asthe B2 and G2 mercury emission lines. Once you arehappy that the peaks have been identified click applyin the Wavelength Calibration box. The x axis shouldnow display wavelength instead of pixel number.
With the calibration saved you will be able to use it toidentify the wavelengths of emission and absorptionlines you other images you take.
Copyright © 2020 Loughborough University. All rights reserved.All teaching materials provided by Loughborough University during the course of your study are made available for your individual use
and must not be shared with others or uploaded onto external websites.

Physics UCAS Visit Department of Physics 3 of ??
NB. If you think that your spectrometer has changedposition you should redo the calibration.
Figure 3: Fluorescent light bulb and associated spectrum
Investigating Other Light Bulbs
Now we have calibrated our spectrometer using thefluorescent light bulb we can investigate the wave-length given off by other types of artificial lights.
Start by identify several types of light sources youhave access to. These could include LEDs, incandes-cent lights, fluorescent lights of different colour tem-peratures, neon lights, sodium street lights etc.
With your spectrometer attached to your camera, takeimages of each of the light sources you have found.Remember to keep the spectrometer fixed in place onyour camera otherwise the calibration will need to beredone.
Following the procedure above, upload each imagein turn to Spectral Workbench. This time, instead ofclicking the calibrate button you will need to click the”copy calibration” button. In the search box that ap-pears type in the name of your calibraton image andclick search. Find your calibration image in the list ofresults and click the ”apply button”. The x axis on yournew image should now be calibrated to show wave-lengths.
For each of your images look for clear emission linesand measure their wavelength. Think about the rangeof wavelengths the spectrum covers and the relativebrightness of different parts of the spectrum.
Investigating The Fraunhofer Lines Of TheSun
WARNING: Do not point the spectrometer directlyat the Sun for this exercise!
This exercise will require good quality images takenwith your spectrometer. We will be looking for absorp-tion lines in the spectrum of the Sun. The sources youhave been investigating so far have shown emissionlines, photons emitted by elements in an excited state.The Sun gives of a broad spectrum of light, some ofwhich gets absorbed by the outer layers of the Sun’satmosphere. So we will be searching for dark lines inyour spectrum that correspond to these elements.
It is not necessary to point the spectrometer directly atthe Sun for this. The Earth’s atmosphere scatters thelight from the Sun and so pointing the spectrometerat any patch of sky (even when cloudy) will give thedesired result.
Start by choosing the patch of sky you wish to study.With your spectrometer attached to your camera, pointit at your chosen patch of sky and take an image of thespectrum produce. You may need to experiment withyour camera settings, such as exposure time to getthe best image you can.
Upload your images to Spectral Workbench and copythe calibration from the fluorescent light bulb (redo thecalibration if needed). Now study your image and lookfor dark lines in the spectrum. These are the Fraun-hofer absorption lines in the Sun’s spectrum. Recordtheir wavelengths and see how your results compareto the other experimental values for the Fraunhoferlines.
Investigating The Sodium Content of Salt
WARNING: Care should be taken with the candlesin this experiment!
This exercise requires a candle and some salt. Thisworks best with a candle that has been used previ-ously so there is a small depression around the wick.A tealight or other small yet wide candle works best. Itis also best to perform this experiment in a dark roomor at night, to reduce any contamination from the Sun’slight.
Start by pouring a small amount of salt around thewick of the candle, a pinch is a good place to begin.Prepare your spectrometer by attaching it to your cam-era (remember to calibrate if needed). Light candleand use the spectrometer to image the spectrum be-ing given off by the flame. You are looking for a clear
Copyright © 2020 Loughborough University. All rights reserved.All teaching materials provided by Loughborough University during the course of your study are made available for your individual use
and must not be shared with others or uploaded onto external websites.

Physics UCAS Visit Department of Physics 4 of ??
orange line in your spectrum, this is the light beinggiven off by the sodium atoms in the salt.
Upload your images to Spectral Workbench and applythe fluorescent bulb calibration as before. Measurethe wavelength of your sodium emission. How doesthis compare to other experimental values for sodiumemissions?
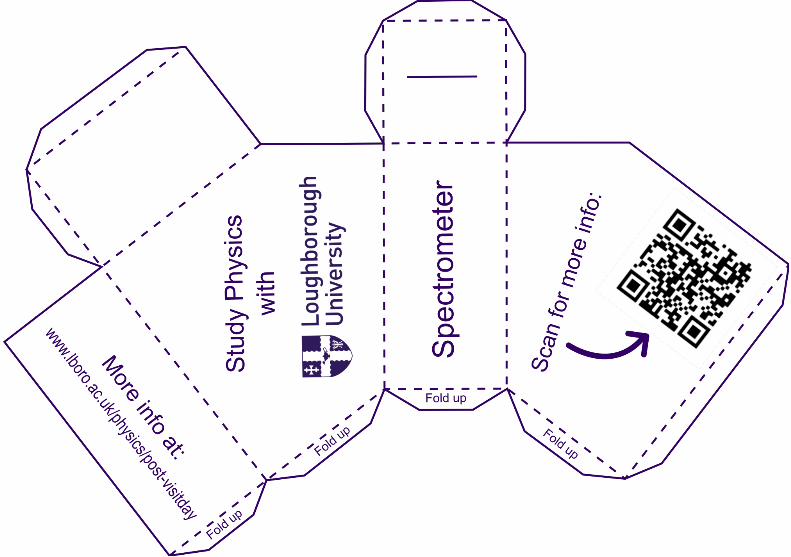
Figure 4: Loughborough Cutout Spectrometer
Making Your Own SpectrometerIf you have not visited one our Open Days then you arestill able to conduct experiments into spectroscopy. Allyou will need is the cutout Loughborough Spectrome-ter and either an unwanted CD or DVD.
Take your cutout spectrometer, like the one in fig. 4,and cut along the solid outer lines. Before going anyfurther it is best to cut the light slit, which is the short,
solid line on the square section of the spectrometer.You will need a sharp knife, like a craft knife, or pair ofscissors. Just cutting along the line will create a gaplarge enough for light to come through. Now fold alongthe dotted lines to form a box. The four tabs marked”Fold up” should fold outwards, these surround theviewing window and will be used to attach your diffrac-tion grating later. The rest of the tabs should fold in-wards but remain on the outside of your spectrometer.Use glue or tape to secure the tabs in place, we finddouble side tape works well.
Once you have body of the spectrometer prepared itis time to make your diffraction grating. This is wherethe CD or DVD comes in. DVDs and CDs consist ofclosely space grooves on the solid plastic part and areflective layer, which often has the title of the movieon it. This is why you can see a rainbow pattern re-flecting off of your CD or DVD. Carefully remove the re-flective layer from the disc, leaving just the clear plas-tic. Next cut a square section out of the disc, largeenough to fit over the viewing window in your spec-trometer. It is important that the orientation of the grat-ing is correct. If you hold the grating up to the light youwill see a rainbow through the plastic. You must at-tach your grating to the spectrometer so this rainbowwill be perpendicular to the slit at the other end of thespectrometer. Once you have the orientation correct,stick the grating to the inside of the viewing window ofyour spectrometer.
Your spectrometer is now ready to use. You can ei-ther look directly through the viewing window (Do notpoint the spectrometer directly at the Sun or anytype of laser if viewing directly) or attach it to a cam-era (necessary for the exercises above).
References
[1] Gregory, James (1673). Letter from James Gregory to John Collins, Reprinted in: Correspondence of Sci-entific Men of the Seventeenth Century...., ed. Stephen Jordan Rigaud (Oxford, England: Oxford UniversityPress, 1841), 2: 251255.
[2] Rittenhouse, David (1786). An optical problem, proposed by Mr. Hopkinson, and solved by Mr. Rittenhouse.Transactions of the American Philosophical Society. 2: 201206.
[3] Brand, John C. D. (1995). Lines of Light: The Sources of Dispersive Spectroscopy, 18001930. Gordon andBreach Publishers. pp. 3742
[4] Weeks, Mary Elvira (1932). The discovery of the elements. XIII. Some spectroscopic discoveries. Journalof Chemical Education. 9 (8): 14131434
[5] Neill Tucker (2020). Spectra V1.0 (https://www.mathworks.com/matlabcentral/fileexchange/27796-spectra-v1-0), MATLAB Central File Exchange.Retrieved February 14, 2020.
Copyright © 2020 Loughborough University. All rights reserved.All teaching materials provided by Loughborough University during the course of your study are made available for your individual use
and must not be shared with others or uploaded onto external websites.