Embed Size (px)
Citation preview
GEM TN-92-184
SSCintCal Hadronic Calorimeter Photomultiplier Readout System Stability and Calibration Issues
N. Akchurin & Y. Onel University of Iowa
September 21, 1992
Abstract:
The ZEUS collaboration adds to the already numerous experiments which successfully deal with the issues of stability, monitoring and calibration in photomultiplier based calorimeters systems. They can maintain 1 % tower-to-tower and module-to-module energy calibration with 0.2% overall stability. The entire calorimetry system of ZEUS consists of - 13000 PTMs. A CDF study reports that the difference of the calibration results done five weeks apart on four modules (ten towers each) shows an RMS of 0.2 ± 0.7%. An 241Am a-source was used to monitor - 1000 channels of Pb-glass
electromagnetic calorimeter at FNAL E704. In 50 days, with 241Am a-source only, a stability of< 1.0% was achieved. JETSET with 324 PMTs is a very stable system based on calibration and monitoring over two-week periods. Relative gain normalization was measured at 0 .5 Hz by using a nitrogen laser dispersed with a prism to the front of - 100 fibers. The gains were normalized to 0.5%. For absolute calibration (again at the 0.5% level), JETSET used two methods; first, they calibrated coarsely with mip muons and single punchthroughs, and second, they improved the calibration by finely tuning with respect to the 1to peak. Even before the 1to correction, a calibration of less than 1 % was accomplished. A similar laser system was employed for a 600-PMT system at Bugey reactor for relative calibrations. The short term stability of 0.5% (days) and a long term stability of 1.4% (2 to 3 years) were measured. FNAL experiment T840 shows that - 2.3% global calibration with a mechanically driven radioactive source is easily achieved for a scintillating fiber calorimeter prototype of 60 individual channels. The same technique with longitudinal and transverse source scans is exploited for attenuation length, local radiation damage, uniformity of response and calibration monitoring by T840.
Hamamatsu R2490-05 (baseline choice) 2" mesh dynode proximity focusing photomultiplier is stable beyond - 1 Tesla of magnetic field with a gain of - 2 X 10⁵ and with a rise time of< 3ns. The fine mesh dynode structure extends the current range up to lA with 0.1 % deviation and it still remains linear within 2% at 2A. The typical temperature dependence of the gain, times the quantum efficiency product, is in the range of 0.25 - 0.5%/0C for the PMTs used in ZEUS and CDF. It is clear that from the extensive studies and results of the aforementioned experiments, the stability ( < 1 % ), monitoring and calibration ( - 1 % ) issues can be satisfactorily addressed for the GEM scintillating fiber hadronic calorimeter.
GEM TN 92-184
SSCintCAL
Hadronic Calorimeter Photomultiplier Readout System Stability and Calibration Issues
N. AKCHURIN ANDY. 0NEL
University of Iowa
for the SSCintCAL Collaboration
ABSTRACT
The ZEUS collaboration adds to the already numerous experiments which
successfully deal with the issues of stability, monitoring and calibration in pho
tomultiplier based calorimeter systems. They can maintain 13 tower-to-tower
and module-to-module energy calibration with 0.2% overall stability. The entire
calorimetry system of ZEUS consists of ..., 13000 PTMs. A CDF study reports that
the difference of the calibration results done five weeks apart on four modules (ten
towers each) shows an RMS of 0.2 ± O. 7%. An 241 Am er-source was used to mon
itor ..., 1000 channels of Pb-glass electromagnetic calorimeter at FNAL E704. In
50 days, with 241 Am er-source only, a stability of < 1.0% was achieved. JETSET
with 324 PMTs is a very stable system based on calibration and monitoring over
two-week periods. Relative gain normalization was measured at 0.5Hz by using a
nitrogen laser dispersed with a prism to the front of..., 100 fibers. The gains were
normalized to 0.5%. For absolute calibration (again at the 0.5% level), JETSET
used two methods; first, they calibrated coarsely with mip muons and single punch
throughs, and second, they improved the calibration by finely tuning with respect
to the ?ro peak. Even before the ?ro correction, a calibration of less than 1 % was
accomplished. A similar laser system was emplQYed for a 600-PMT system at Bugey
reactor for relative calibrations. The short term stability of 0.5% (days) and a long
term stability of 1.4% (2 to 3 years) were measured. FNAL experiment T840 shows
that ...., 2.3% global calibration with a mechanically driven radioactive source is eas
ily achieved for a scintillating fiber calorimeter prototype of 60 individual channels.
The same technique with longitudinal and transverse source scans is exploited for
attenuation length, local radiation damage, uniformity of response and calibration
monitoring by T840.
Hamamatsu R2490-05 (baseline choice) 2'' mesh dynode proximity focusing
photomultiplier is stable beyond ...., 1 Tesla of magnetic field with a gain of...., 2 x 10⁵
and with a rise time of < 3 ns. The fine mesh dynode structure extends the current
range up to 1 A with 0.1 % deviation and it still remains linear within 2% at 2 A. The
typical temperature dependence of the gain, times the quantum efficiency product,
is in the range of 0.25-0.5%/°C for the PMTs used in ZEUS and CDF. It is clear
that from the extensive studies and results of the aforementioned experiments, the
stability ( < 1 % ), monitoring and calibration (- 1 % ) issues can be satisfactorily
addressed for the GEM scintillating fiber hadronic calorimeter.
2
I. Introduction
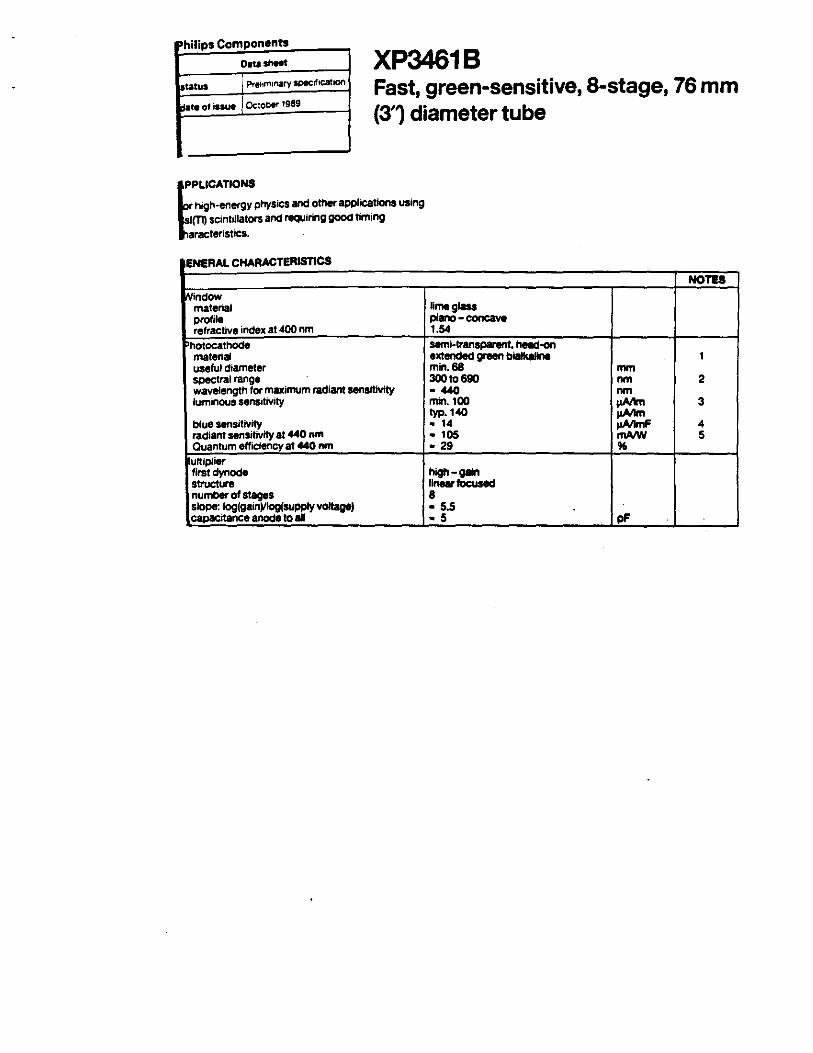
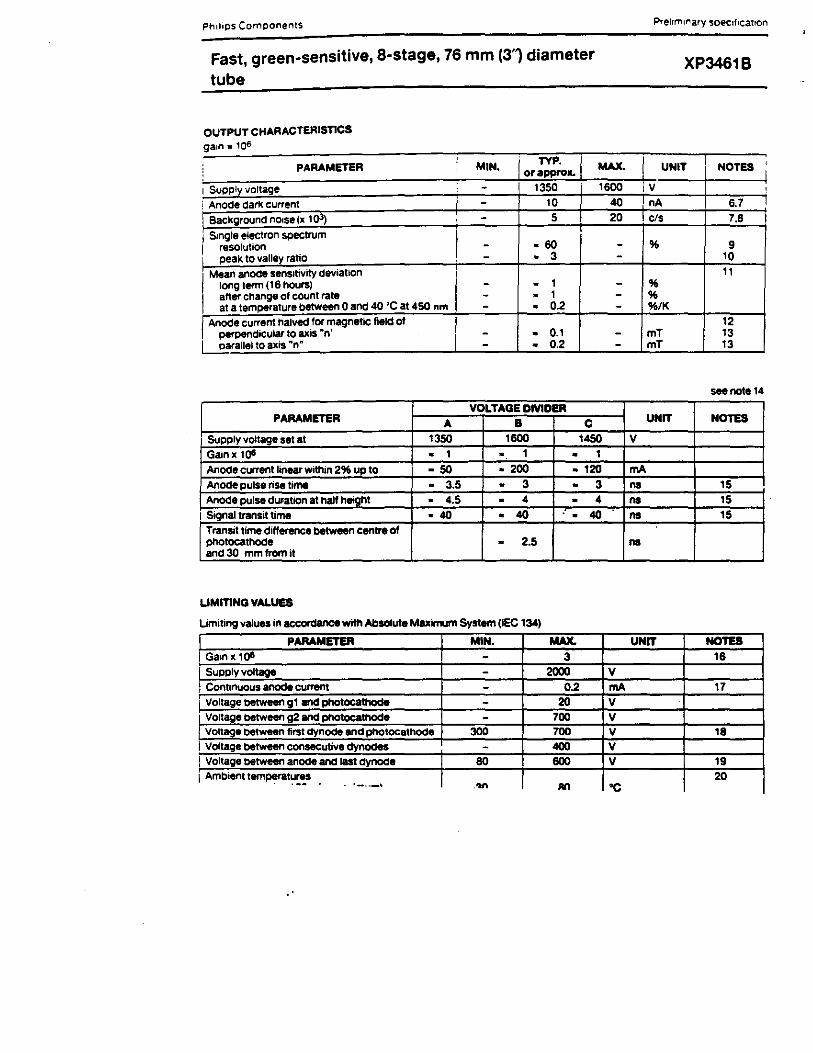
We used 3" diameter, 8-stage, Philips XP3461B photomultiplier tubes for the
Cu/scintillating fiber hadronic calorimeter prototypes at the BNL A3 test beamline.
Philips XP3461B is a green extended PMT with a gain of 1.0 x 10° at - 1500 V. The
details of design characteristics and properties of this PMT are given in Appendix I.
The commonly used PMTs for the calorimeter systems by some of the major
experiments are:
CDF Ha.mamatsu R.580 1.5",
ZEUS Hamama.tsu R580-15 (~een ext.) 1.5",
Philips XP2021B (green ext.) 2",
OPAL, VENUS Harna.matsu R1840 (high B) 2".
The baseline PMT for the GEM scintillating fiber hadron calorimeter is chosen
to be the Hamamatsu model R2490-5. It is a high-gain, 2" diameter, proximity
photocathode and mesh dynode photomultiplier tube with stable operation beyond
- 1 Tesla of magnetic field with a gain of ,..., 2 x 10⁵ (see Appendix II for the
characteristics of R2490 PMT). The development of an optimal photomultiplier
tube with its associated components for the purposes of GEM scintillator fiber
hadronic calorimeter will require investigation in collaboration with industry.
II. Stability Issues
II.a. Stability of Scintillator Material
There are limited but extensive studies on the stability of the scintillating
materials used in the calorimeters. A study on scintillator SCSN38 and some others
is reported by a subset of ZEUS collaboration (Hase92]. The study was carried out
in - 1500 days. The light yield change was -4.3 ± 1.3% per 1000 days and the
change in the attenuation length was found to be -8.0 ± 3.1% for the same time
span. The other types of scintillators that were simultaneously tested varied from
-2.7% to -13.1% in light yield and the range in the attenuation length varied
from -2.4% to -15.6%. One must note that in these tests a green wavelength
shifter was used between the scintillator and the photomultiplier tube. Therefore
the conclusions drawn for the attenuation lengths need to be put in a different light
3
in the case of scintillating fiber calorimeters. In the test case, it is essentially the
transmission of blue light that is measured but in the case of fiber calorimeters it
is the green light that we need to consider and it is less susceptible to the possible
coloring of the base material. One should note that SCSN38 is also succesfully used
in CDF central electromagnetic calorimeter for eight .years.
The above results indicate that with the proper choice of materials and proper
fabrication techniques, the scintillator based calorimeters are stable from the stand
point of scintillator material.
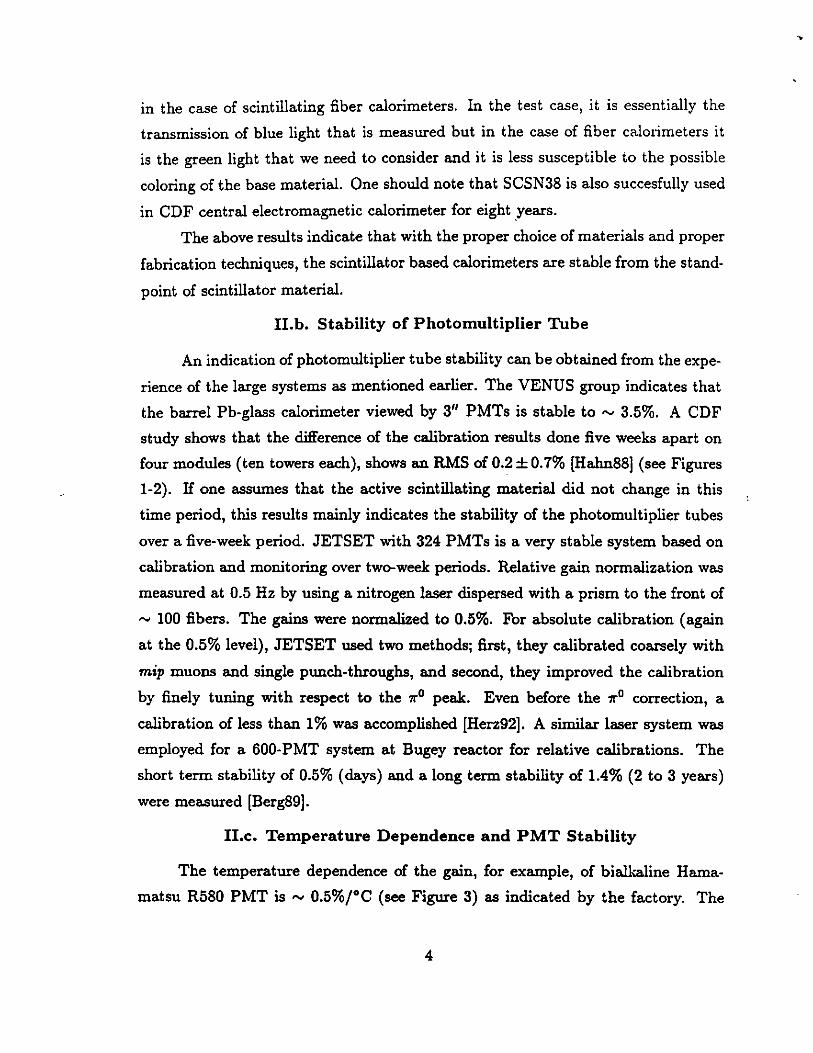
II.b. Stability of Photomultiplier Tube
An indication of photomultiplier tube stability can be obtained from the expe
rience of the large systems as mentioned earlier. The VENUS group indicates that
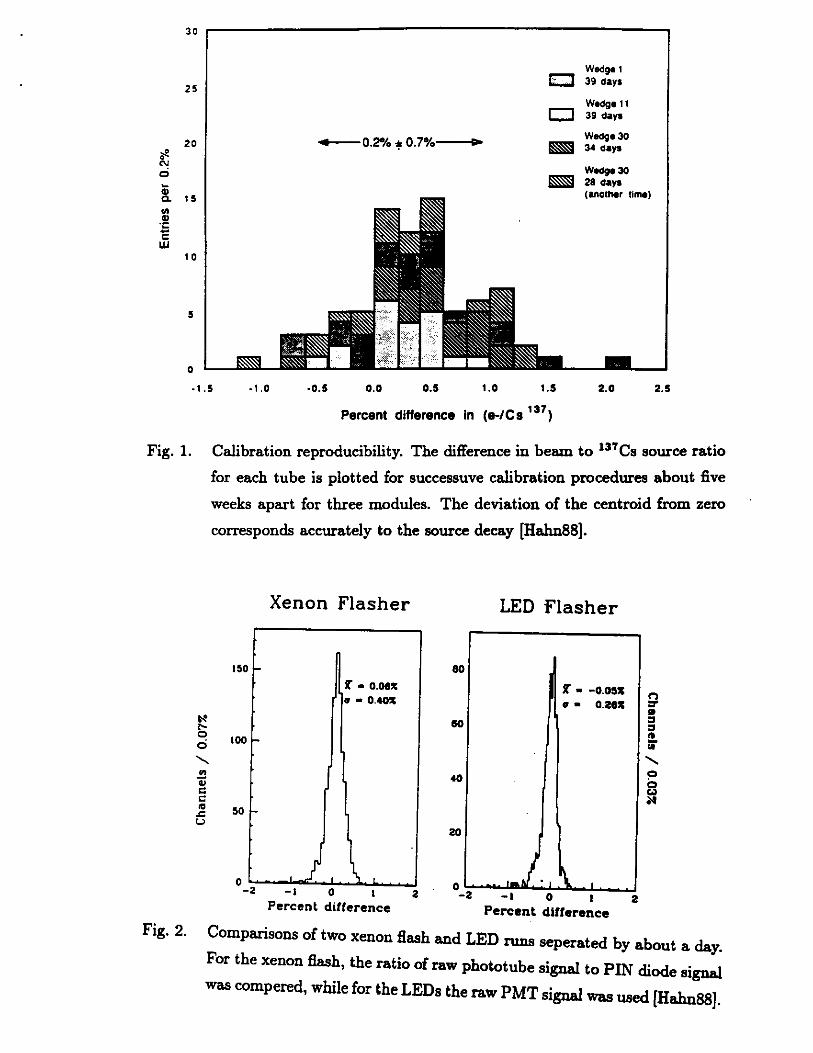
the barrel Pb-glass calorimeter viewed by 3" PMTs is stable to - 3.5%. A CDF
study shows that the difference of the calibration results done five weeks apart on
four modules (ten towers each), shows an RMS of 0.2 ± 0. 7% (Hahn88] (see Figures
1-2). If one assumes that the active scintillating material did not change in this
time period, this results mainly indicates the stability of the photomultiplier tubes
over a five-week period. JETSET with 324 PMTs is a very stable system based on
calibration and monitoring over two-week periods. Relative gain normalization was
measured at 0.5 Hz by using a nitrogen laser dispersed with a prism to the front of
~ 100 fibers. The gains were normalized to 0.5%. For absolute calibration (again
at the 0.5% level), JETSET used two methods; first, they calibrated coarsely with
mip muons and single punch-throughs, and second, they improved the calibration
by finely tuning with respect to the 71'0 peak. Even before the 71'0 correction, a
calibration of less than 1% was accomplished [Herz92]. A similar laser system was
employed for a 600-PMT system at Bugey reactor for relative calibrations. The
short term stability of 0.5% (days) and a long term stability of 1.4% (2 to 3 years)
were measured (Berg89].
II.c. Temperature Dependence and PMT Stability
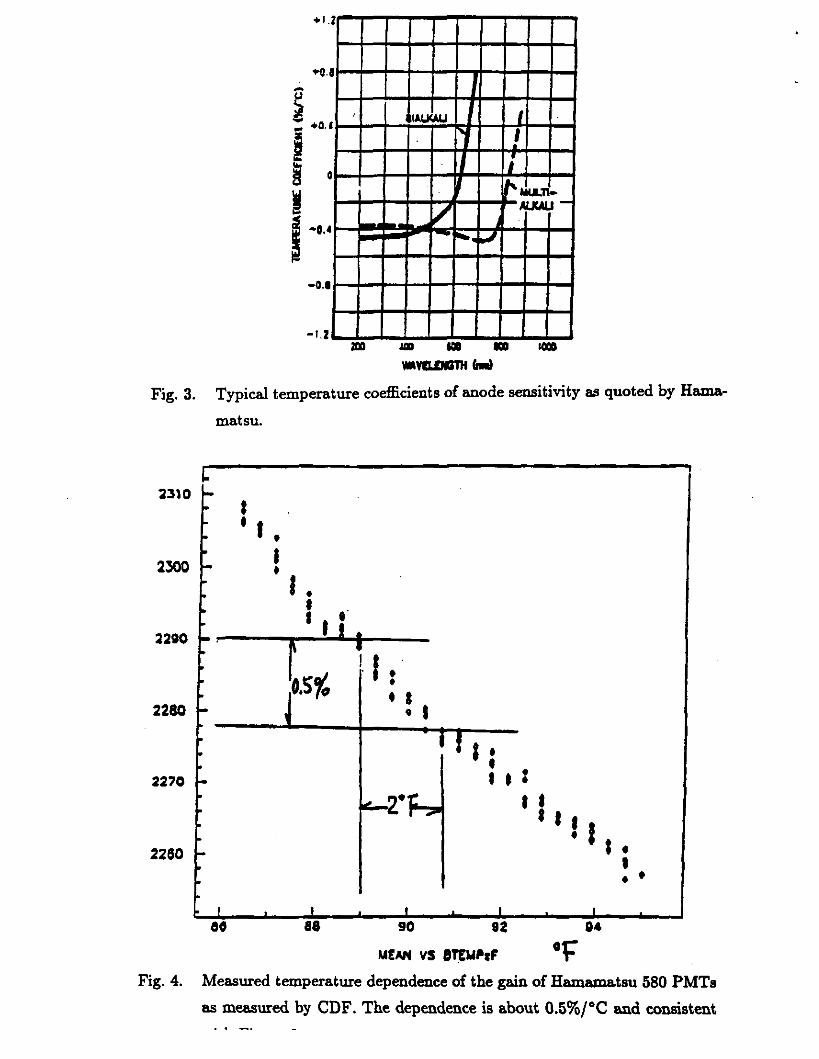
The temperature dependence of the gain, for example, of bialkaline Hama
matsu R580 PMT is - 0.5%/°C (see Figure 3) as indicated by the factory. The
4
measurement performed by the CDF group confirms this as well (Figure 4). For
both the bialkaline and multialkaline photocathode materials, as can be seen in the
figures, the temperature dependence is - -0.45%/°C in the relevant region ( < 600
nm) for the scintillating fiber calorimeter applications.
In the case of ZEUS, the typical temperature dependence of the gain times
quantum efficiency product is +0.25%/°C and -0.05%/°C for XP1911 and R580
PMTs, respectively [Andr91).
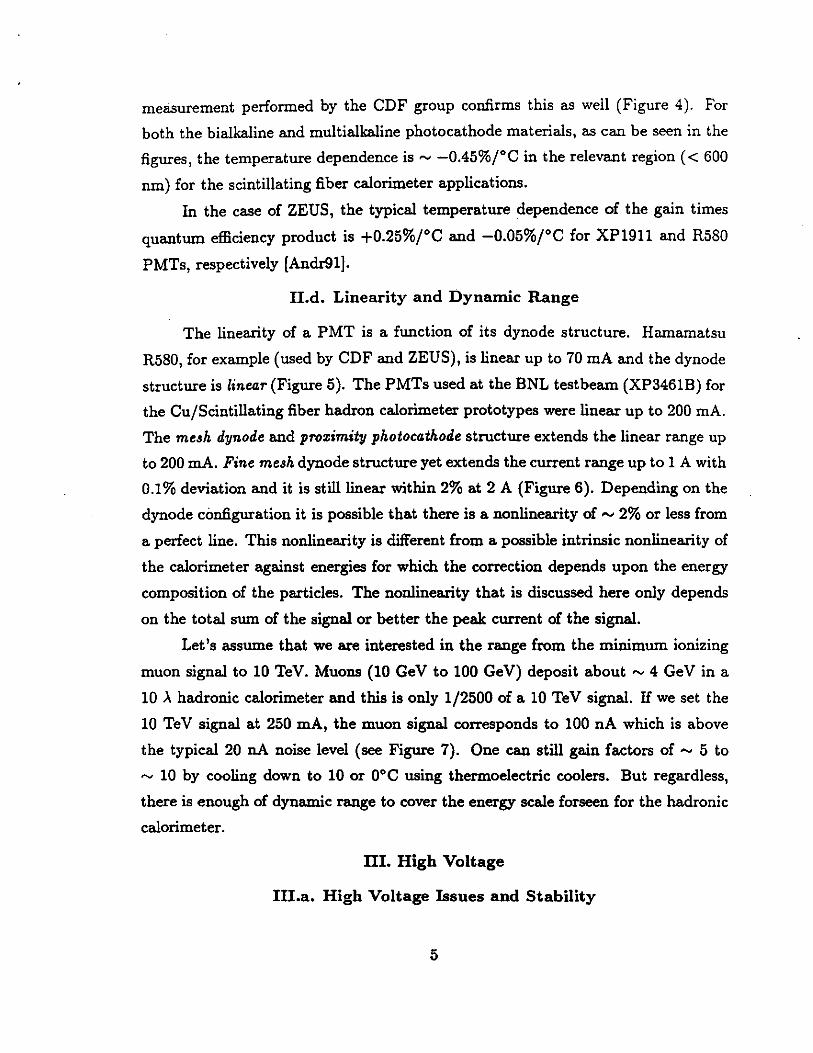
II.d. Linearity and Dynamic Range
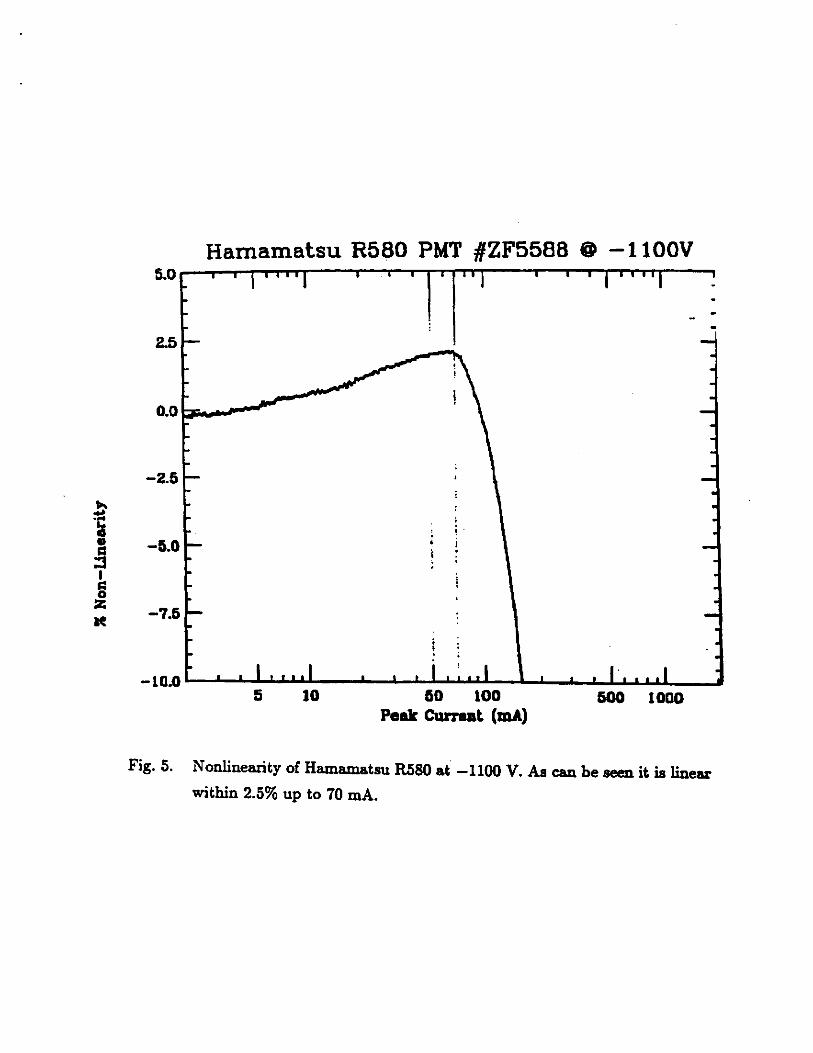
The linearity of a PMT is a function of its dynode structure. Hamamatsu
R580, for example (used by CDF and ZEUS), is linear up to 70 mA and the dynode
structure is linear (Figure 5). The PMTs used at the BNL testbeam (XP3461B) for
the Cu/Scintillating fiber hadron calorimeter prototypes were linear up to 200 mA.
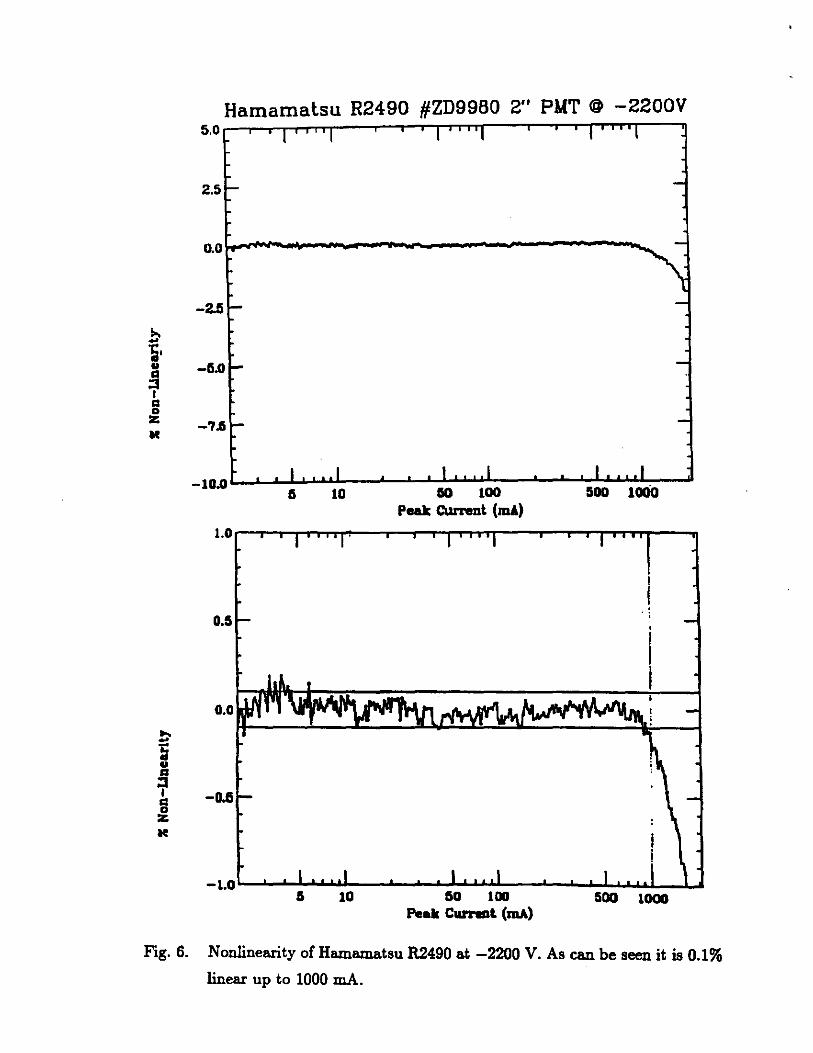
The me8h dynode and prozimity photocathode structure extends the linear range up
to 200 mA. Fine me8h dynode structure yet extends the current range up to 1 A with
0.1% deviation and it is still linear within 2% at 2 A (Figure 6). Depending on the
dynode configuration it is possible that there is a nonlinearity of ~ 2% or less from
a perfect line. This nonlinearity is different from a possible intrinsic nonlinearity of
the calorimeter against energies for which the correction depends upon the energy
composition of the particles. The nonlinearity that is discussed here only depends
on the total sum of the signal or better the peak current of the signal.
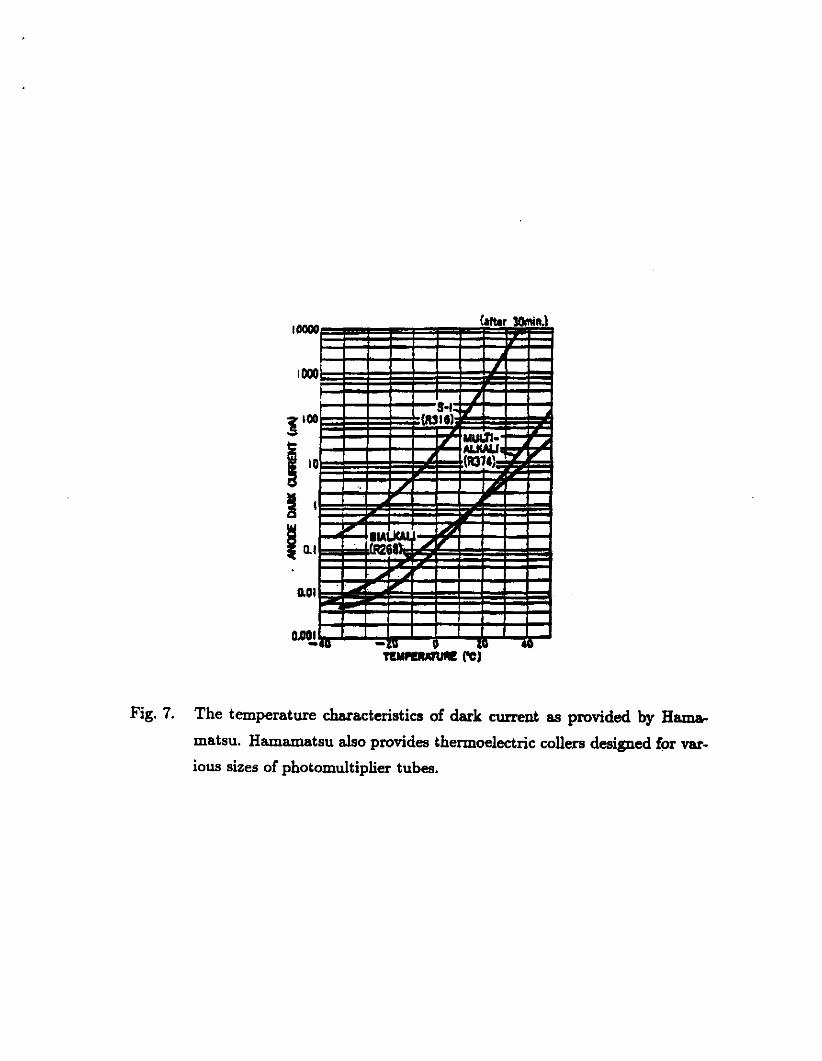
Let's assume that we are interested in the range from the minimum ionizing
muon signal to 10 TeV. Muons (10 GeV to 100 GeV) deposit about - 4 GeV in a
10 >. hadronic calorimeter and this is only 1/2500 of a 10 TeV signal. If we set the
10 TeV signal at 250 mA, the muon signal corresponds to 100 nA which is above
the typical 20 nA noise level (see Figure 7). One can still gain factors of - 5 to
- 10 by cooling down to 10 or 0°C using thermoelectric coolers. But regardless,
there is enough of dynamic range to cover the energy scale forseen for the hadronic
calorimeter.
III. High Voltage
III.a. High Voltage Issues and Stability
5
If we look at the present high voltage systems from various manufacturers
we find the following characteristics. LeCroy's high voltage systems, depending on
the model, specifies voltage regulation of ±0.053 line ±0.5V load. If the required
voltage is 1000 V for a PMT, this specification is ±0.5V line ±0.5V load. Since the
load does not change in a stable state experiment, the latter does not mean fluctu
ation of voltage with time. The temperature coefficients for these types of units are
small, e.g. typically 0.0053/°C and at +45°C ambient temperature it is less than
0.01%f°C. The accuracy of the absolute value is :J;0.1% and the long time drift is
less than 2V per week. The temperature of the CDF collision hall, for example, is
regulated to ±0.5°C which makes extremely stable high voltage operation possible.
The underground intersection regions at SSC should be temperature regulated at
least to the same level as CDF and particular attention should be give to this point.
CAEN is another manufacturer of computer controlled high voltage systems
and CAEN power supplies are used extensively at CDF but detailed measurements
on the performence of these devices are not available at this time. The factory
claims for 64 channel high voltage system (Model SY 403) the voltage set and
monitor resolutions are about 250 mV and the current monitor resolution is 500
nA. The ripple is less than 30mVpp· Such units (up to 6400 channels) can be
controlled and monitored from a single point.
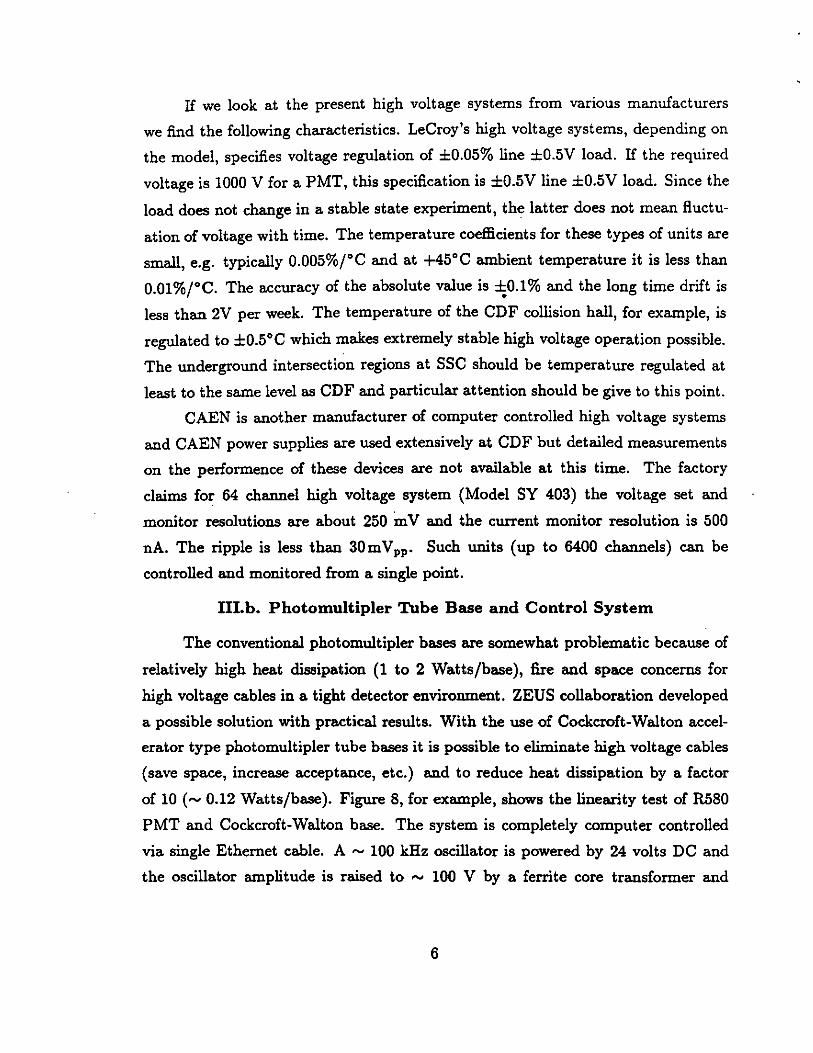
111.b. Photomultipler Tube Base and Control System
The conventional photomultipler bases are somewhat problematic because of
relatively high heat dissipation (1 to 2 Watts/base), fire and space concerns for
high voltage cables in a tight detector environment. ZEUS collaboration developed
a possible solution with practical results. With the use of Cockcroft-Walton accel
erator type photomultipler tube bases it is possible to eliminate high voltage cables
(save space, increase acceptance, etc.) and to reduce heat dissipation by a factor
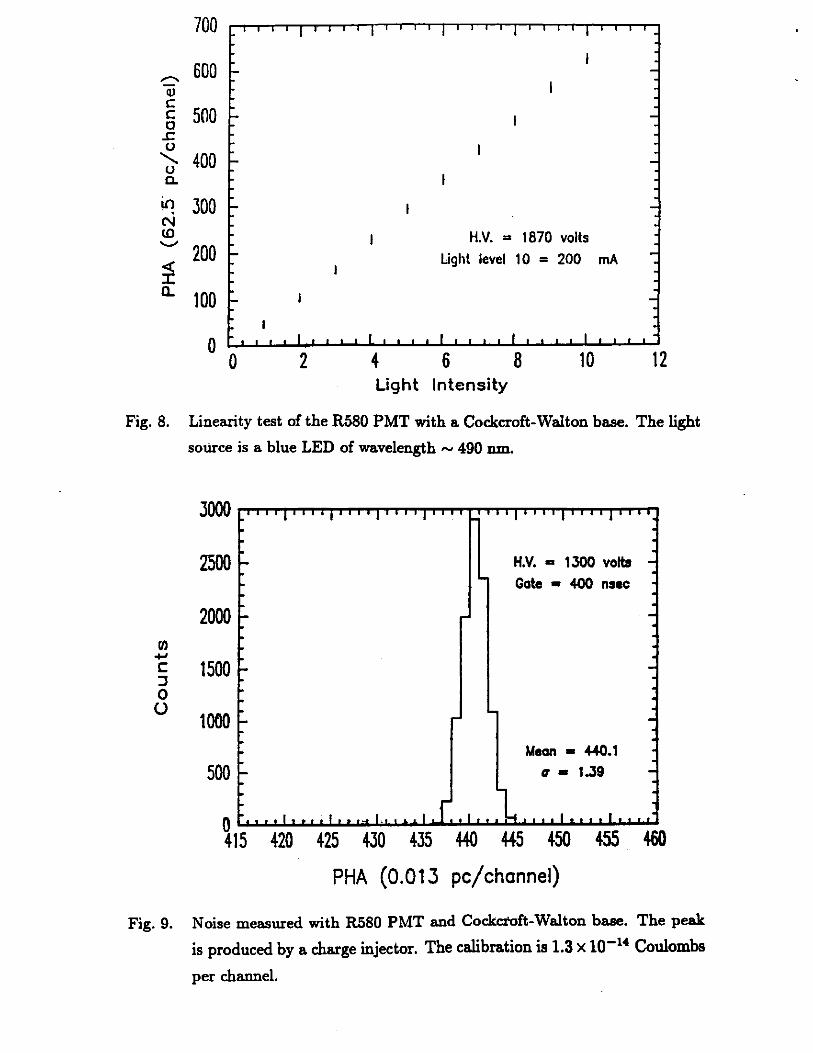
of 10 ( ~ 0.12 Watts/base). Figure 8, for example, shows the linearity test of R.580
PMT and Cockcroft-Walton base. The system is completely computer controlled
via single Ethernet cable. A ~ 100 kHz oscillator is powered by 24 volts DC and
the oscillator amplitude is raised to ~ 100 V by a ferrite core transformer and
6

a Cackcroft-Walton accelerator chain is energized to produce the high voltage re
quired. The noise level is comperable to conventional bases (see Figure 9). The high
frequency noise can be eliminated by proper shielding and grounding and the low
frequency noise is eliminated by by dynamic suppression with a negative feedback.
The observed noise level is u R:: 0.010 pC for a 100 ns gate.
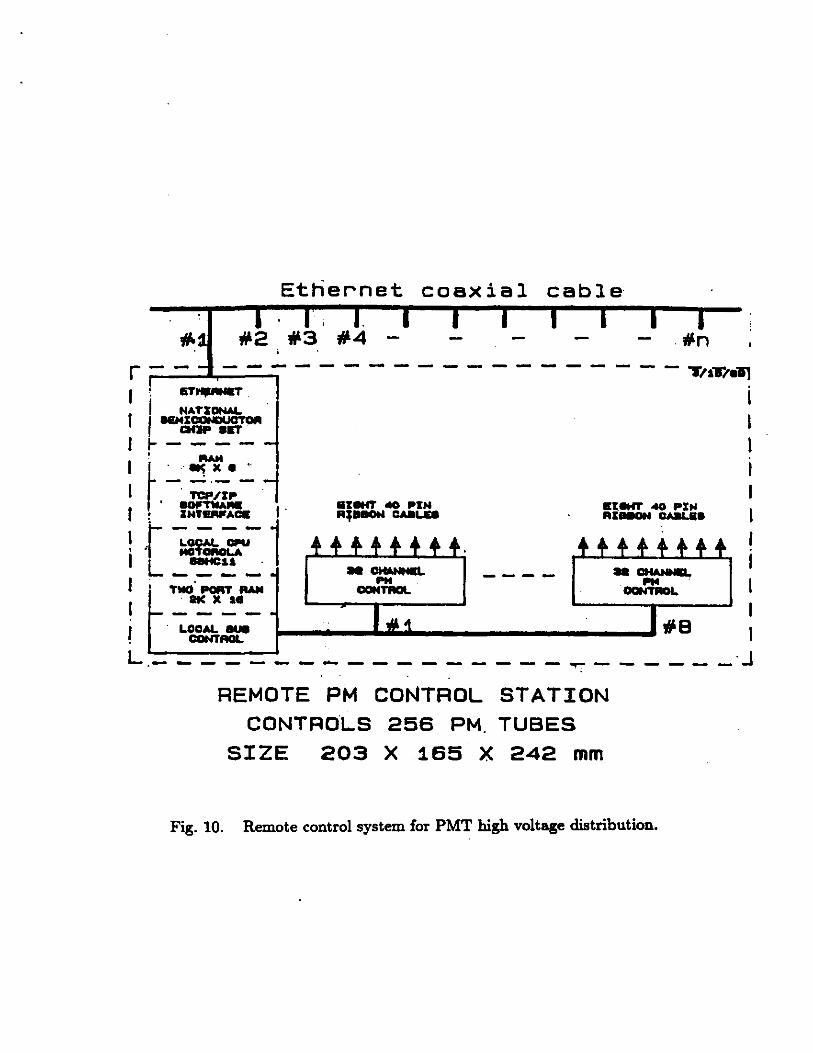
The system uses local microprocessors for control and Ethernet TCP /IP pro
tocol for communications. Database is downloaded into controller stations by stan
dard FTP commands. The database maps contain PMT numbers, high voltage
settings and global tolerances. The software for local CPUs are stored in onboard
EPROMs (see Figure 10). To date, this type of a system is implemented for 8575
and R580 PMTs. Nanometric Systems makes these systems commercially available
as of May 1992.
If these types of bases are used for the GEM scintillating fiber hadron calori
meter, the total power dissipation for 4990 PMTs will be about ....., 600 Watts total
whereas the conventional bases will dissipate power by more than a factor of 10.
IV. System Monitoring and Calibration
The monitoring in general is realized in two basic ways with a variety of
components. One is to use a radioactive source and the other is to use a light
flasher with optical :fibers and other associated optical equipment.
The radioactive source provides an absolute calibration of overall response of
the PMT+scintillator system. CDF uses 3 mCi 137Cs source and drive hardware
permanently attached to a drive system and an individual calorimeter module (i.e.,
the source is the tip of a "sword" within a "sheath"). Simultaneous calibration
of 48 modules requires less than an hour, with a data rate of 5Hz (DC current
measurement) (Halm88].
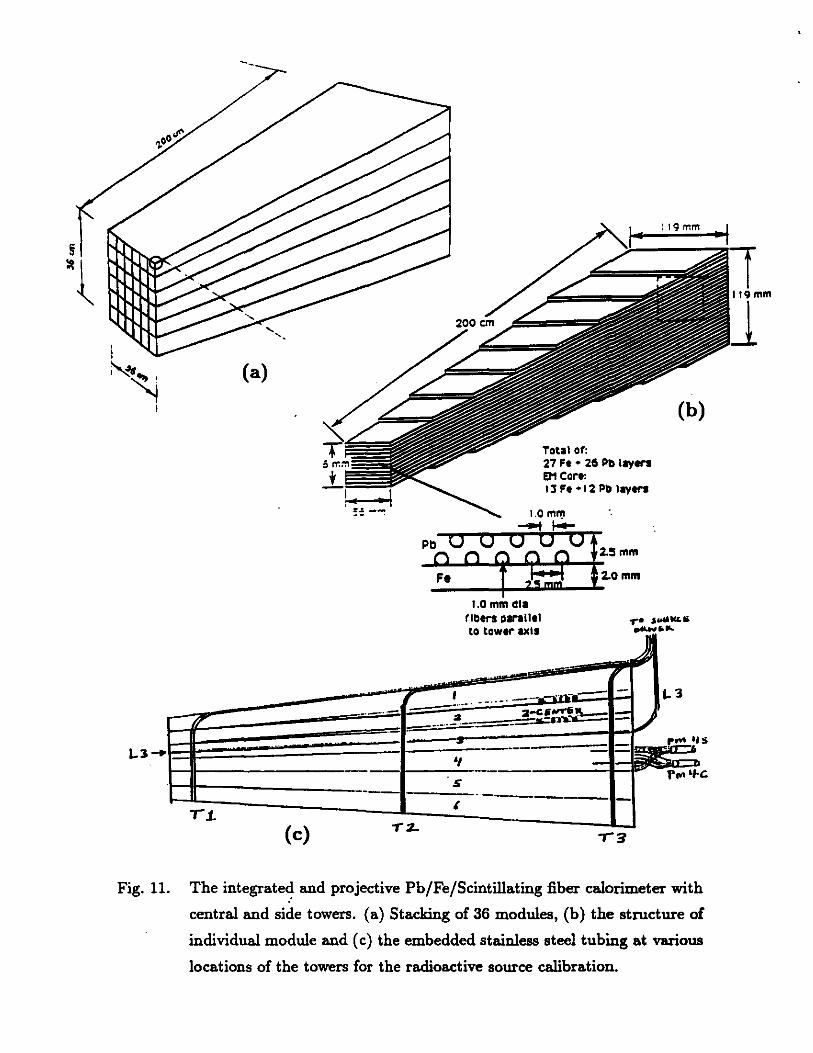
For a Pb/Fe/Scintillating fiber calorimeter prototype (FNAL T840 collabo
ration) of 30 projective towers (Figure 11) we built and used a remotely activated
mechanical source driver for calibration and monitoring purposes [Akch92, Barn90].
45 0.71 mm OD hypodermic tubes were installed longitudinally and transversely in
side the calorimeter towers as shown in Figure 11.c. The radioactive source was 8.8
7
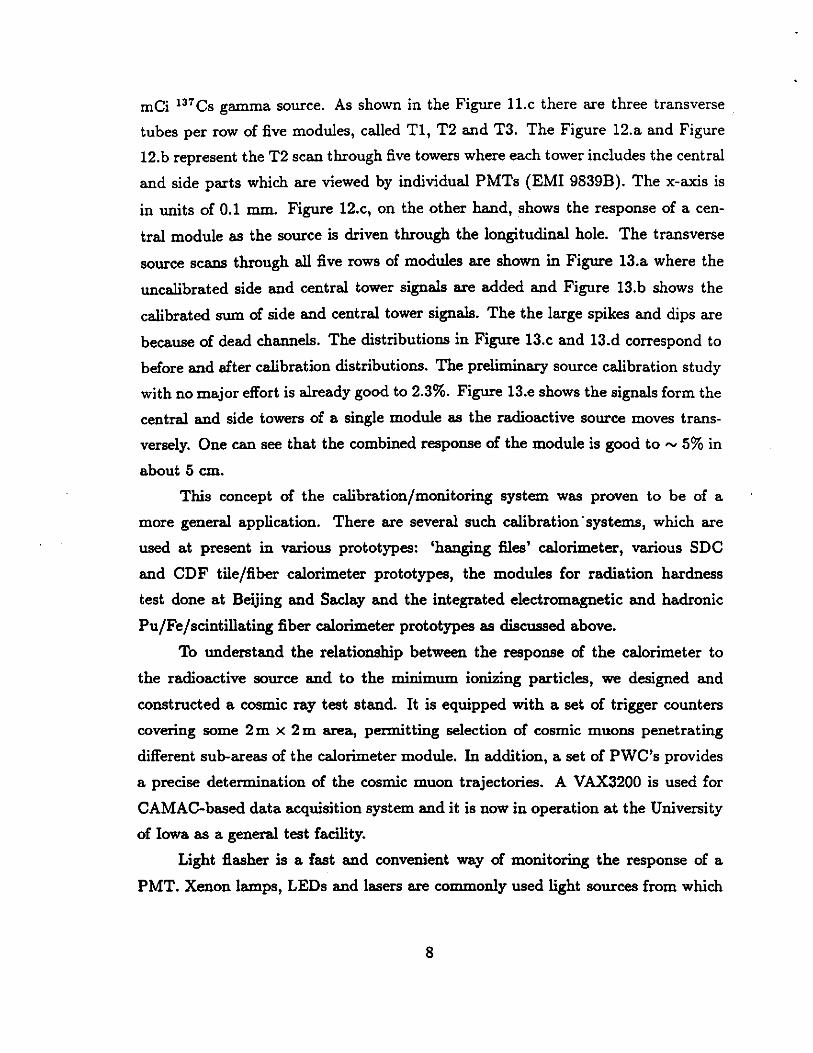
mCi 137 Cs gamma source. As shown in the Figure 11.c there are three transverse
tubes per row of five modules, called Tl, T2 and T3. The Figure 12.a and Figure
12.b represent the T2 scan through five towers where each tower includes the central
and side parts which are viewed by individual PMTs (EM! 9839B). The x-axis is
in units of 0.1 mm. Figure 12.c, on the other hand, shows the response of a cen
tral module as the source is driven through the longitudinal hole. The transverse
source scans through all five rows of modules are shown in Figure 13.a where the
uncalibrated side and central tower signals are added and Figure 13.b shows the
calibrated sum of side and central tower signals. The the large spikes and dips are
because of dead channels. The distributions in Figure 13.c and 13.d correspond to
before and after calibration distributions. The preliminary source calibration study
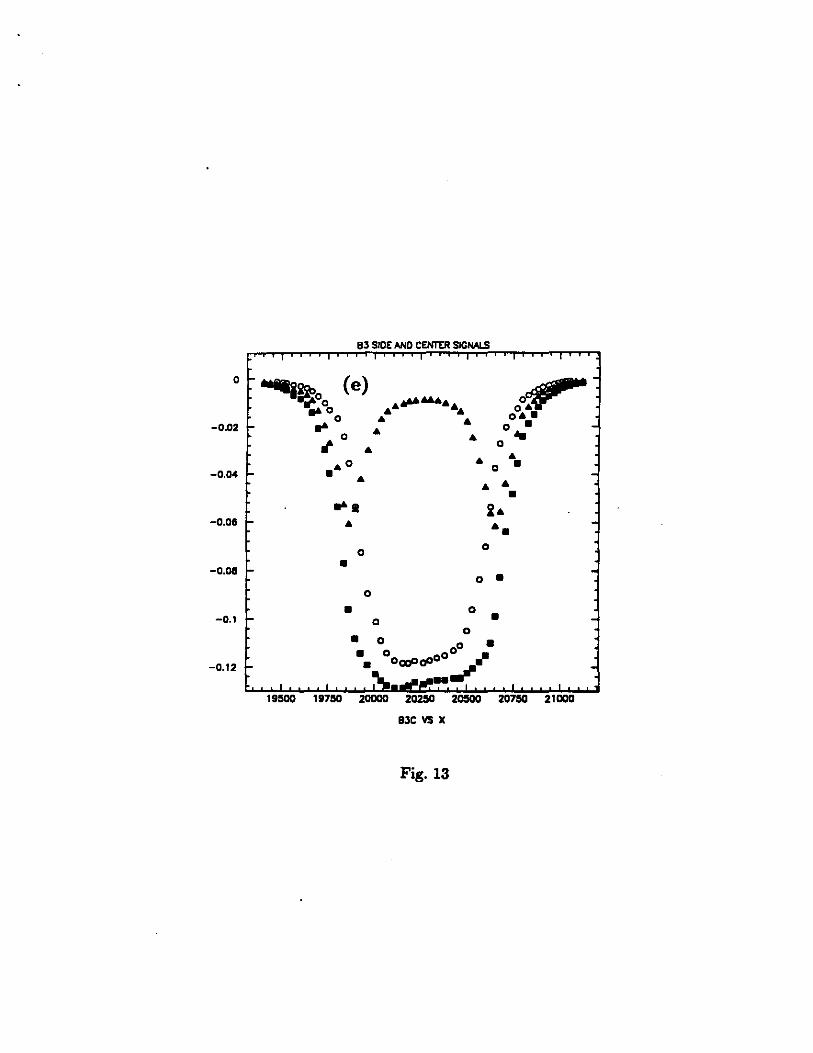
with no major effort is already good to 2.3%. Figure 13.e shows the signals form the
central and side towers of a single module as the radioactive source moves trans
versely. One can see that the combined response of the module is good to - 5% in
about 5 cm.
This concept of the calibration/monitoring system was proven to be of a
more general application. There are several such calibration· systems, which are
used at present in various prototypes: 'hanging files' calorimeter, various SDC
and CDF tile/fiber calorimeter prototypes, the modules for radiation hardness
test done at Beijing and Saclay and the integrated electromagnetic and hadronic
Pu/Fe/scintillating fiber calorimeter prototypes as discussed above.
To understand the relationship between the response of the calorimeter to
the radioactive source and to the minimum ionizing particles, we designed and
constructed a cosmic ray test stand. It is equipped with a set of trigger counters
covering some 2 m x 2 m area, permitting selection of cosmic muons penetrating
different sub-areas of the calorimeter module. In addition, a set of PWC's provides
a precise determination of the cosmic muon trajectories. A VAX3200 is used for
CAMAC-based data acquisition system and it is now in operation at the University
of Iowa as a general test facility.
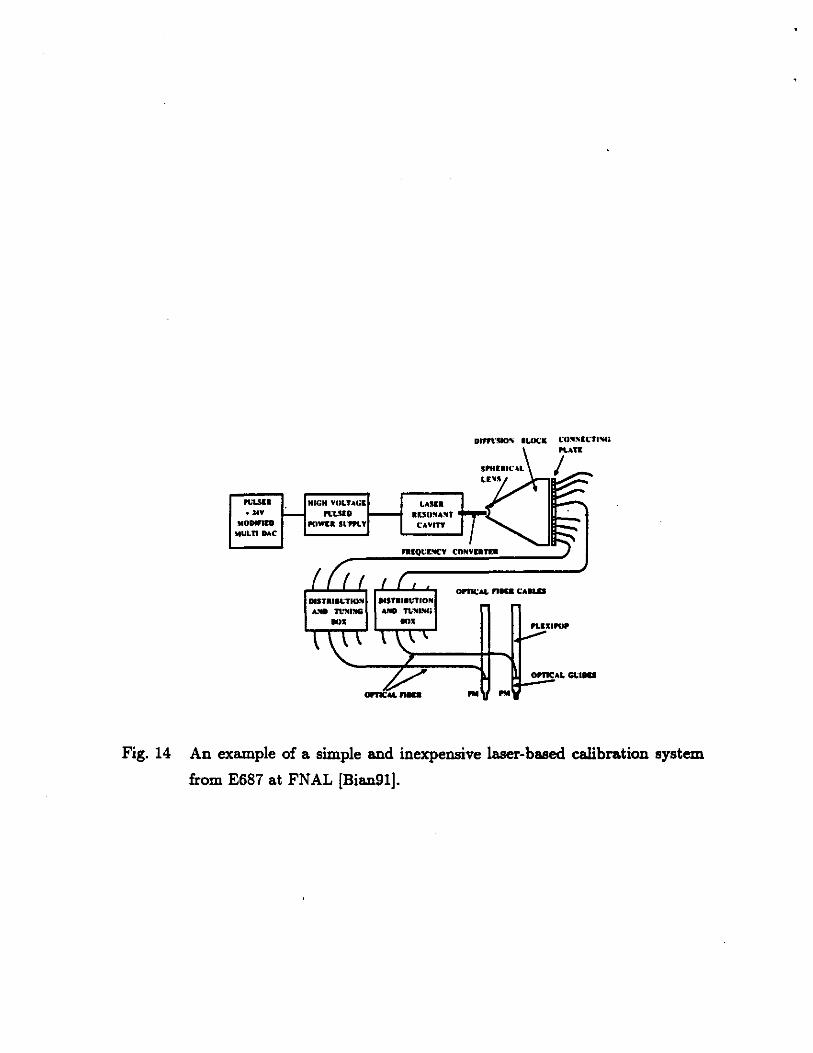
Light flasher is a fast and convenient way of monitoring the response of a
PMT. Xenon lamps, LEDs and lasers are commonly used light sources from which
8
the light can be transported to each PMT via quartz fibers with proper diffusers
to homogenize the light intensity into individual fibers. The results from CDF and
FNAL E687 show that a calibration with a precision of - 1% is possible [Hahn88,
Kubo89, Berg89, Bian91]. In the case of light flashers (Figs 14-15) it is imperative
that the light source itself is monitored. CDF collaboration incorporates a number
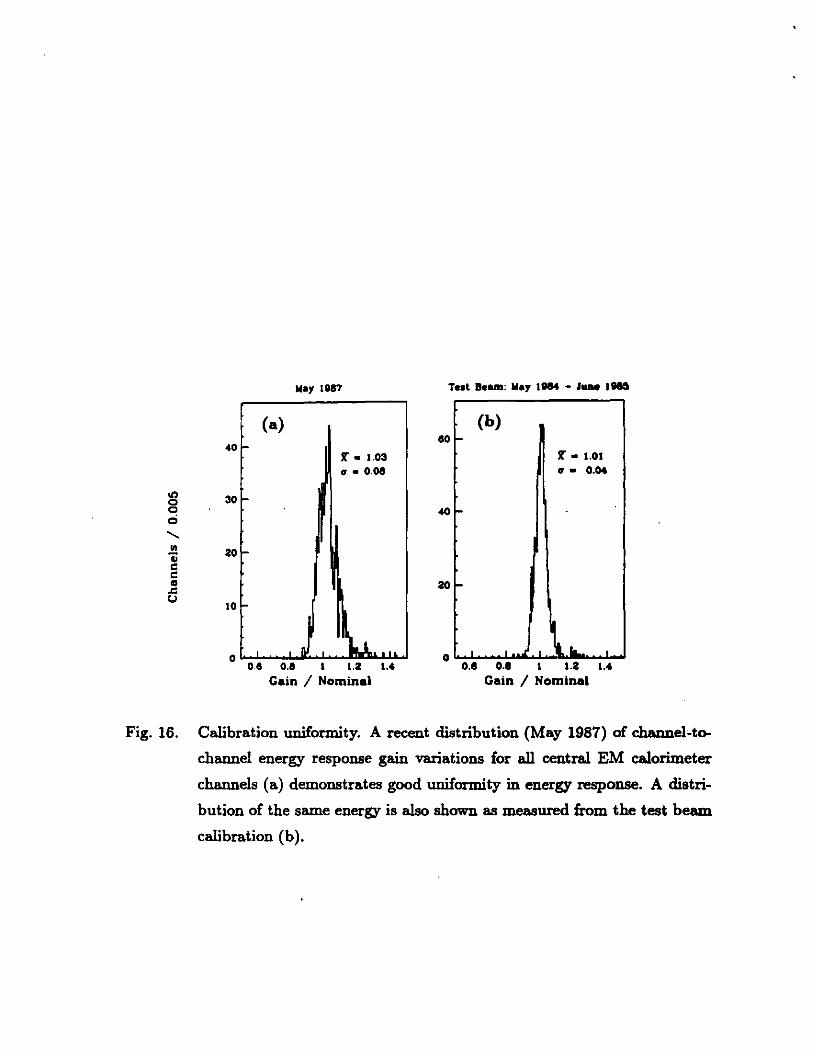
of PIN diodes to monitor the light source. Figure 16 shows the attained calibration
uniformity in energy response.
It is known ·that the LED as a light source is rather dependent on the ambient
temperature and the drift with temperature should be closely monitored. A suc
cessful test result is reported with regard to LED stabilization using a PIN diode
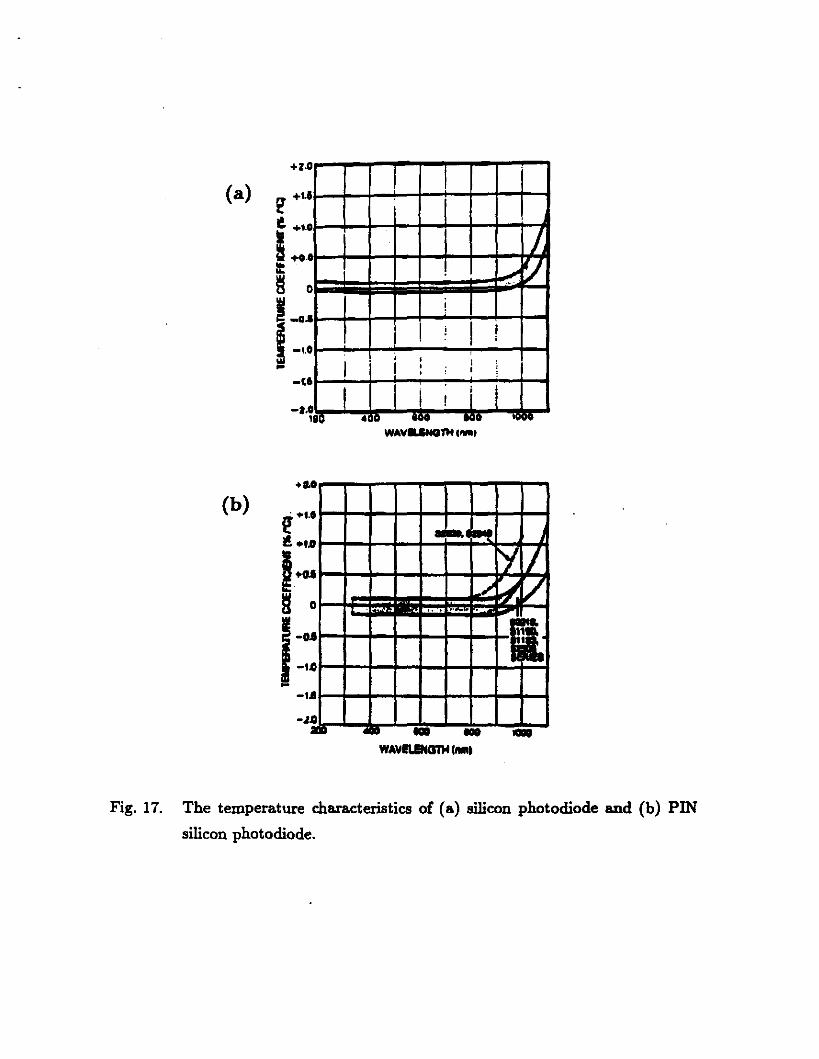
[Reit89]. Silicon photodiode and PIN silicon photodiode are known to be very sta
ble for long time periods and the temperature coefficient is very small (±0.2%) in
the wavelength range of 400- 800 nm (see Figure 17). Using a feedback system it
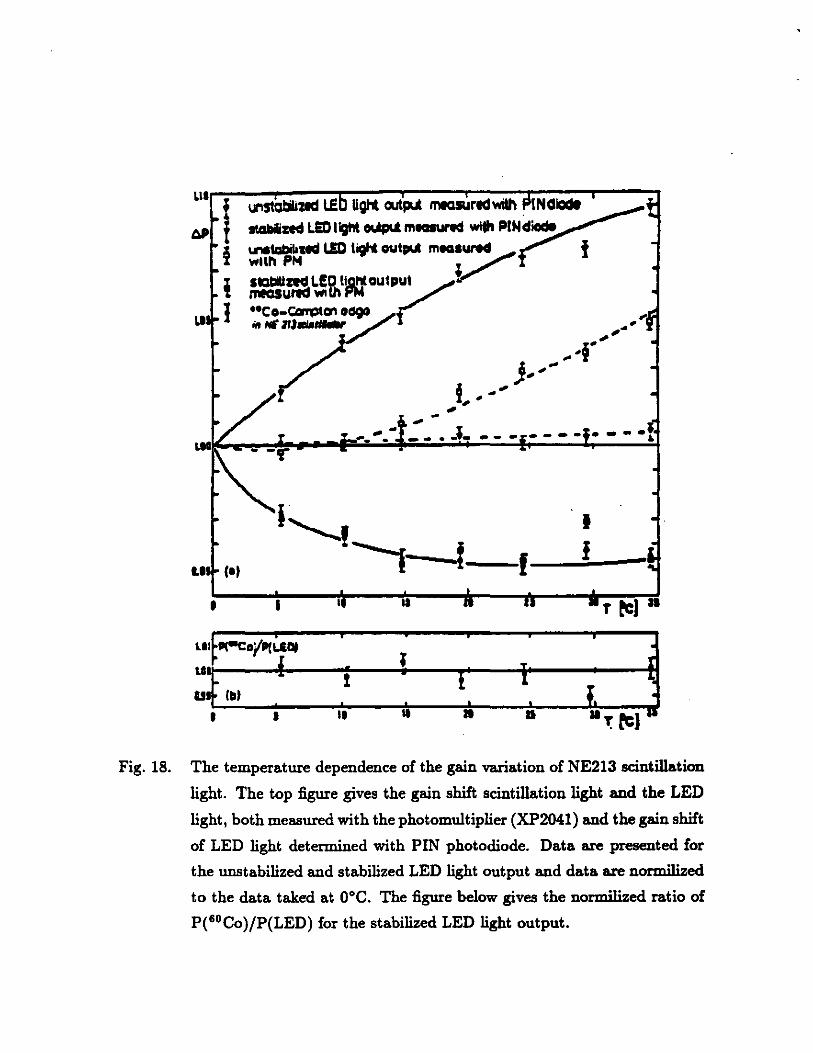
is reported that the temperature coefficient of a blue light emitting silicon carbide
LED (peak at 476 nm) was reduced to 1.0 ± 0.5 x 10⁻⁴ f°C in the range of 0 to
35°C (Figures 18-19). One should note that these kinds of LEDs are well-suited for
our purposes since the emission spectra peak at 470 nm which is close to the peak
of bia!lca1ine photocathode sensitivity (420 run) and it is slightly shifted towards
green.
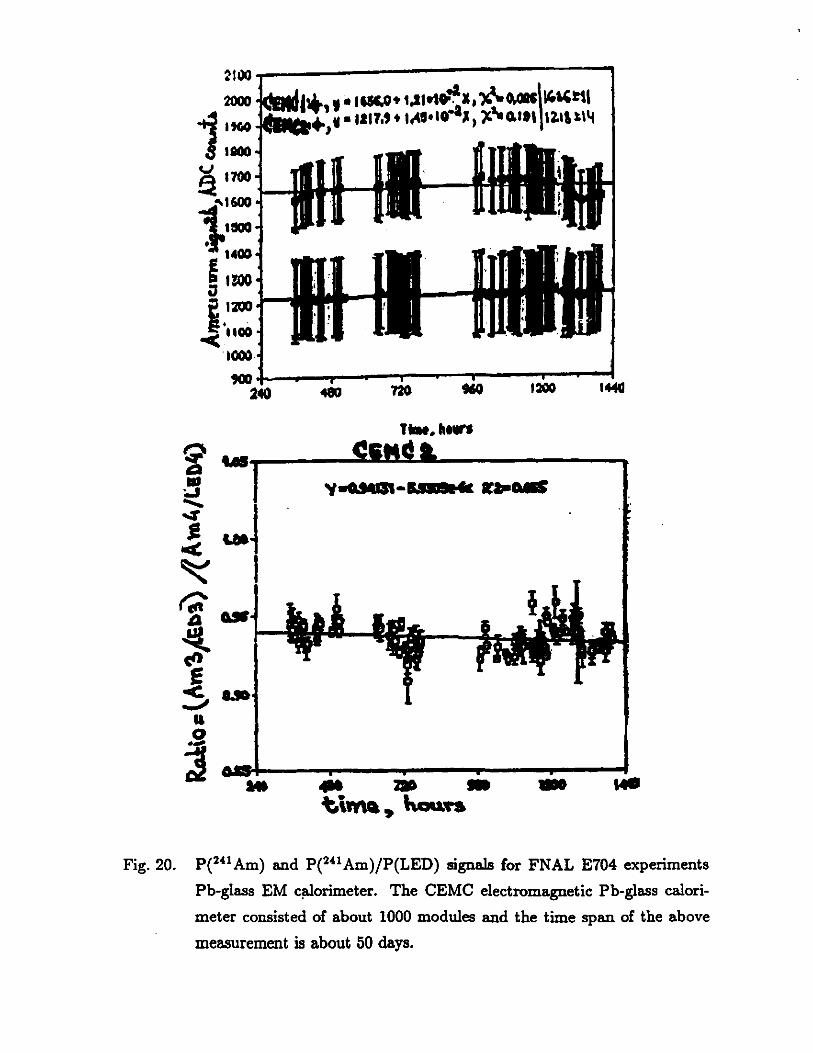
A combination of LED and 241 Am a source. was used to monitor - 1000
channels of Pb-glass electromagnetic calorimeter at FNAL E704. In 50 days, with 241 Am a source only, a stability of < 1.0% and with the combination of LED + 241 Am a source (thus correlating the two) a stability can be monitored within
- 0.6% (see Figure 20).
For short-term calibration and monitoring, our baseline design employs ni
trogen lasers coupled through UV-transmitting quartz fibers to diffusing splitters,
and then to the front and back of individual calorimeter towers. While in the front
it monitors attenuation through an entire calorimeter, at the back it monitors the
response and linearity. of the photoconverter and data acquisition electronics. The
intrinsic laser pulse-to-pulse stability is about 10%, and by monitoring the laser
light yield with a reference photodiode one can reduce this further and monitor
9
long-term laser drift (a few percent per month). This system tests the performance
of all the optical components in the readout chain, including PMT gains, light
transmission, and time offsets. The optical stability required has been achieved in
other large experiments, so that with proper care the systematic error requirements
are manageable. Given 300 laser pulses per data point, and a maximum 1 Hz laser
trigger rate, we could monitor the system response every 10 minutes.
Because the hadron calorimeter does not see electron pairs form zo decay,
beam muon's energy will be measured by the bearoline spectrometer, and energy
deposit in the calorimeter will be recorded and analyzed to study the potential of
using them for an in-situ energy calibration during data ta.king at the SSC. The very
accurate Landau distributions measured by the SPACAL collaboration encourage
us to use this technique; they show a clear effect in dE / dx from muon energies over
the range of 50-250GeV.
The absolute calibration requirements for the hadron calorimeter are not as
stringent as for an EM calorimeter. We plan to calibrate some of the modules in
a test beam and to cross-calibrate the remainder by Er balance and energy flow
uniformity. The calibration will be fixed with respect to the EM section by using
QCD events with a single photon recoiling against a hadronic jet. This technique
has been demonstrated to be effective by CDF. In addition, one might use hadronic
signals from well-tracked single pions, and from isolated muons and cosmic rays
to provide a redundant check on hadron calorimeter calibration and uniformity of
response.
V. Conclusions
We investigated several types of PMTs for the SSCintCAL hadronic towers.
One of the candidates is Hamamatsu R2490-05 2" mesh dynode proximity focusing
photomultiplier (see Appendix II). These PMTs are resistant to the strong magnetic
fields (up to 1 T). A dynamic range of> 104 is readily available for high magnetic
field insensitive mesh dynode PMTs. Currently available mesh dynode PMTs, as
mentioned above, give a gain of more than 104 in a 1 Tesla field, with a rise time of
10
< 3ns. Until such devices are constructed, studied and optimized, the Hamamatsu
2490-5 2" tubes is quite satisfactory device for GEM hadronic calorimetry.
It is clear that the development of the optimum PMT will require time and
effort. SSCintCAL PMT group can collaborate with the industry in the R&D
efforts to to develop the suitable PMT to mutual satisfaction. It is desirable to
reduce the cost of PMTs by having them, for example, produced abroad - Philips
recently has acquired a Czech PMT factory and is planning to update this facility
and train their personnel; this is an excellent opportunity for the production of
designed PMTs both mutually beneficially and cost effectively if an agreement is
reached-.
From the extensive studies and the results of the earlier large scale experi
ments it is clear that the stability, monitoring and the calibration issues can be
satisfactorily implemeted for the GEM scintilating fiber hadronic calorimeter.
V. Acknowledgement
We have benefited from discussion with D. Herzog, U. Mallik, M. Mishina, A.
Para, D. Patalakha and many others whose work appears in the plots and numbers.
We thank them all.
11
List of Appendix
Appendix I. Specifications for Philips XP3461B.
Appendix II. Specifications for the baseline Hamamatsu R2490-05.
12
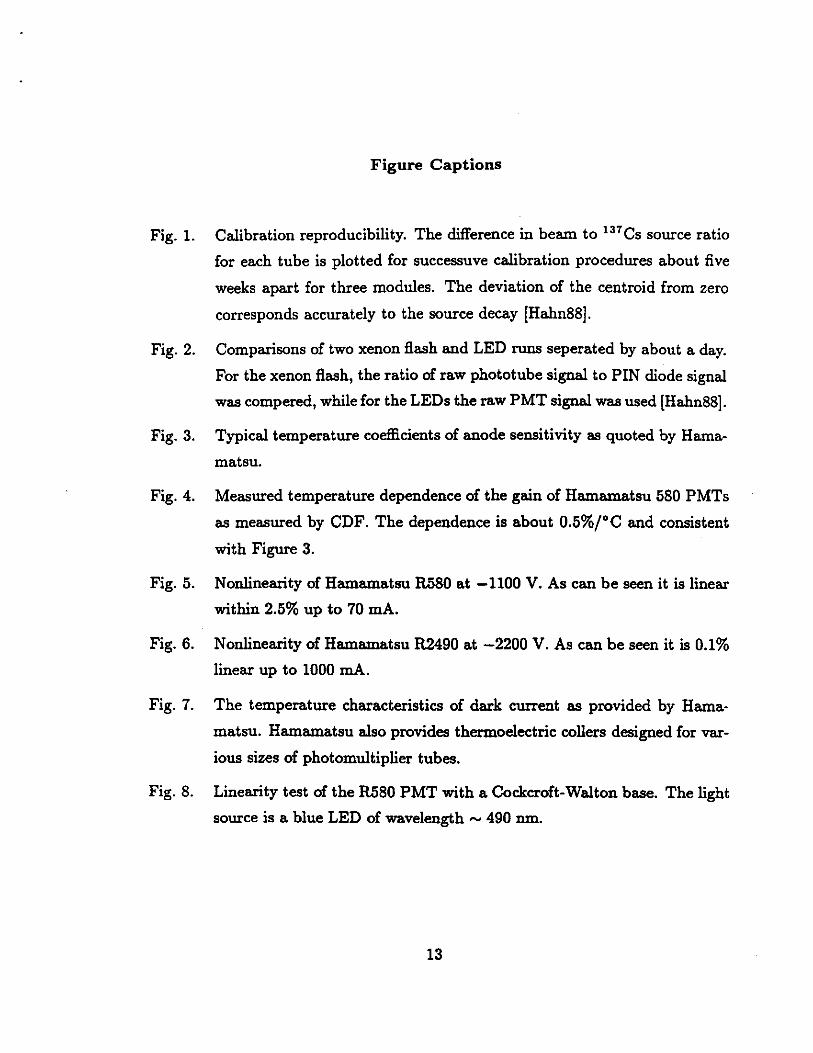
Figure Captions
Fig. 1. Calibration reproducibility. The difference in beam to 137Cs source ratio
for each tube is plotted for successuve calibration procedures about five
weeks apart for three modules. The deviation of the centroid from zero
corresponds accurately to the source decay [Hahn88].
Fig. 2. Comparisons of two xenon flash and LED runs seperated by about a day.
For the xenon flash, the ratio of raw phototube signal to PIN diode signal
was compered, while for the LEDs the raw PMT signal was used [Hahn88].
Fig. 3. Typical temperature coefficients of anode sensitivity as quoted by Harna
matsu.
Fig. 4. Measured temperature dependence of the gain of Hamamatsu 580 PMTs
as measured by CDF. The dependence is about 0.5%/°C and consistent
with Figure 3.
Fig. 5. Nonlinearity of Hamamatsu R.580 at -1100 V. As can be seen it is linear
within 2.5% up to 70 mA.
Fig. 6. Nonlinearity of Hamamatsu R2490 at -2200 V. As can be seen it is 0.1%
linear up to 1000 mA.
Fig. 7. The temperature characteristics of dark current as provided by Hama
matsu. Hamamatsu also provides thermoelectric collers designed for var
ious sizes of photomultiplier tubes.
Fig. 8. Linearity test of the R.580 PMT with a Cockcroft-Walton base. The light
source is a blue LED of wavelength - 490 nm.
13
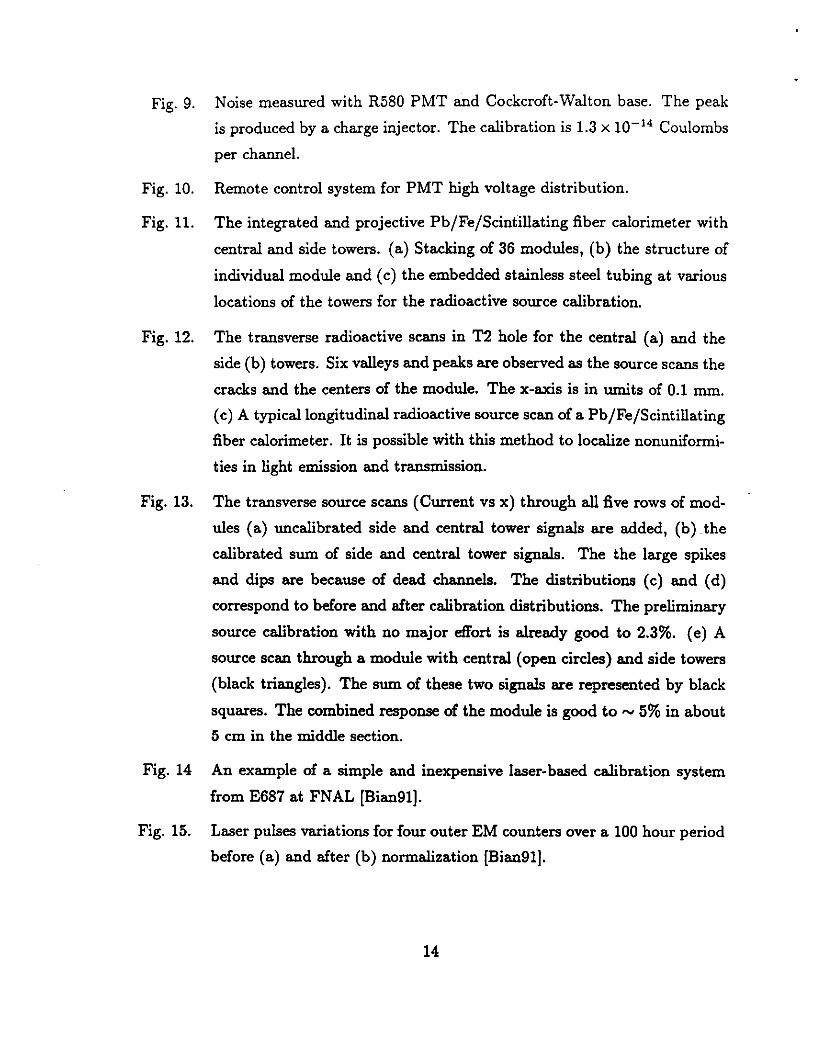
Fig. 9. Noise measured with R580 PMT and Cockcroft-Walton base. The peak
is produced by a charge injector. The calibration is 1.3 x 10⁻¹⁴ Coulombs
per channel.
Fig. 10. Remote control system for PMT high voltage distribution.
Fig. 11. The integrated and projective Pb/Fe/Scintillating fiber calorimeter with
central and side towers. (a) Stacking of 36 modules, (b) the structure of
individual module and ( c) the embedded stainless steel tubing at various
locations of the towers for the radioactive source calibration.
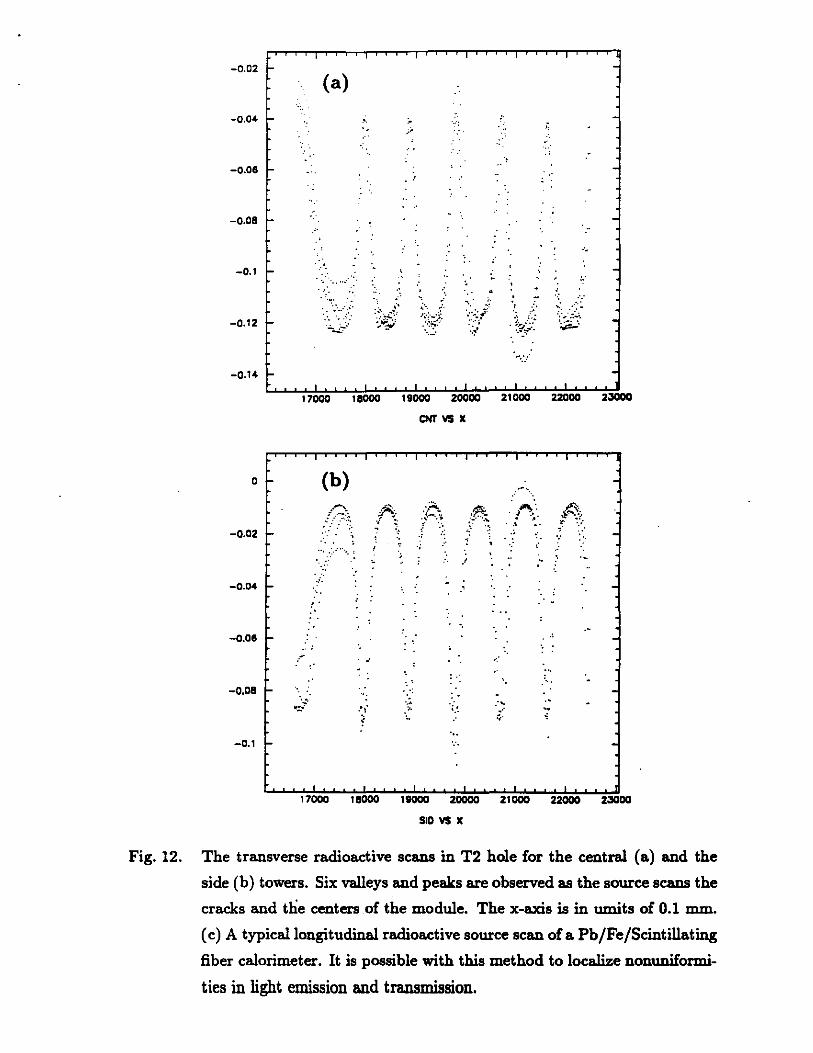
Fig. 12. The transverse radioactive scans in T2 hole for the central (a) and the
side (b) towers. Six valleys and pea.ks are observed as the source scans the
cracks and the centers of the module. The x-axis is in umits of 0.1 mm.
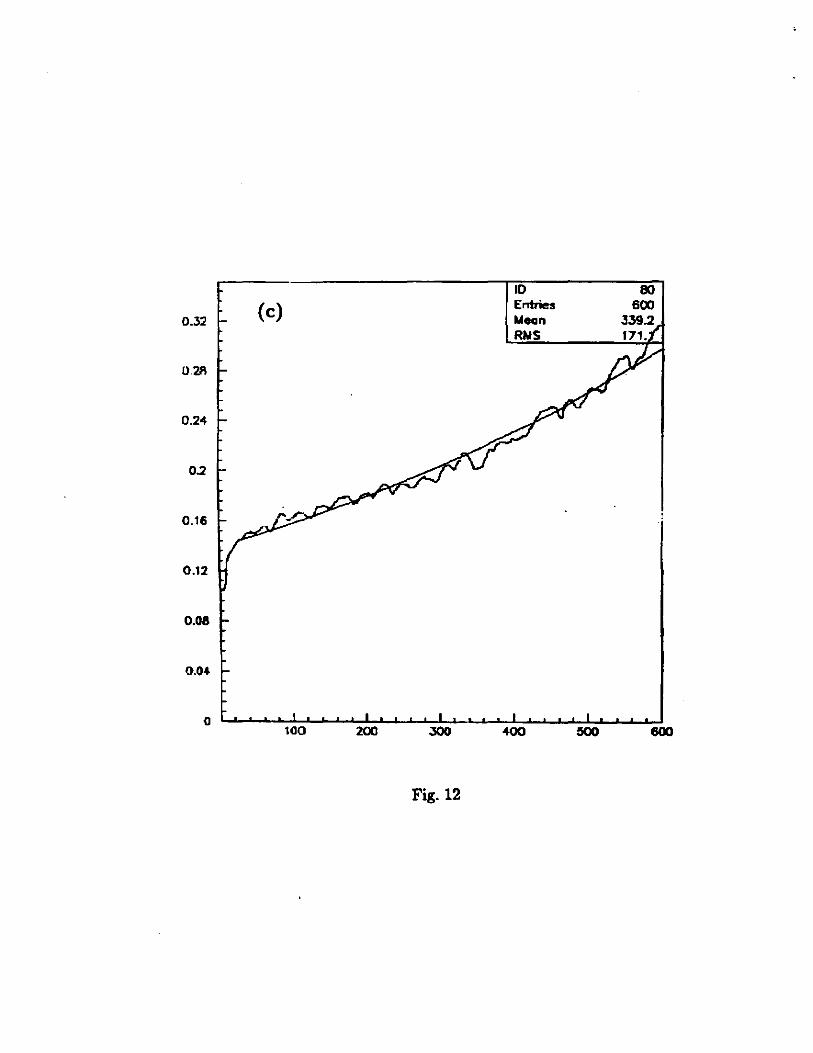
( c) A typical longitudinal radioactive source scan of a Pb /Fe /Scintillating
fiber calorimeter. It is possible with this method to localize nonuniformi
ties in light emission and transmission.
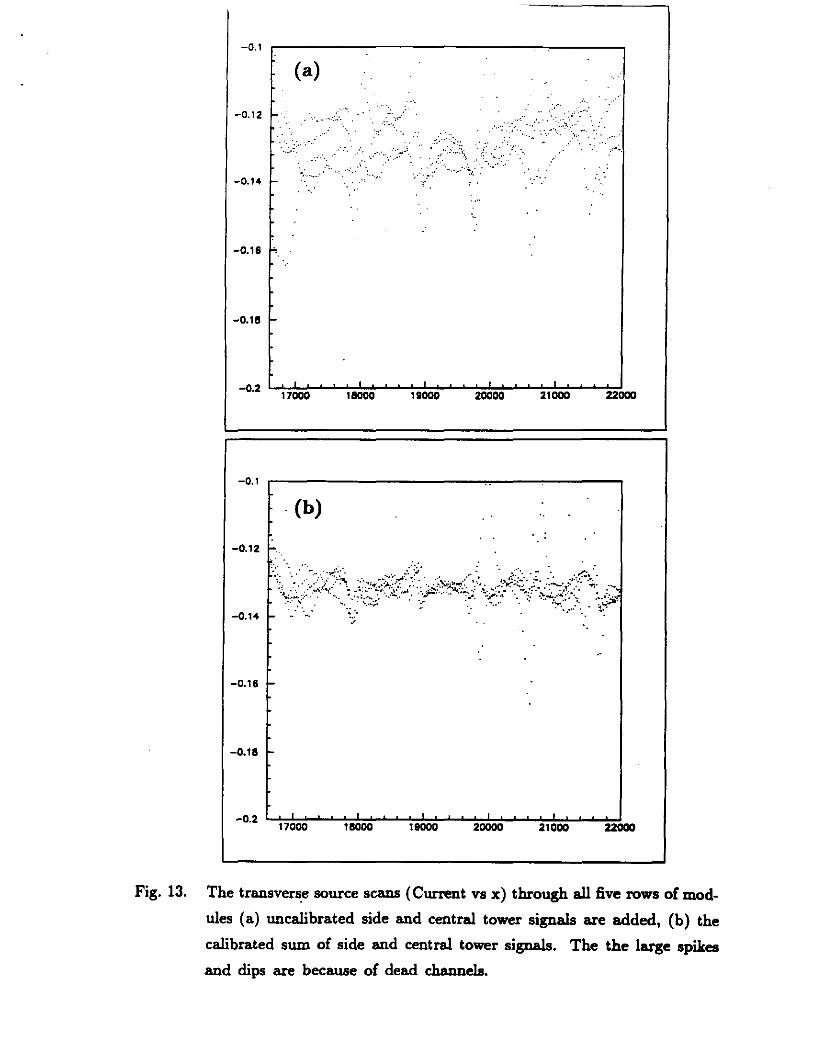
Fig. 13. The transverse source scans (Current vs x) through all five rows of mod
ules (a) uncalibrated side and central tower signals are added, (b) .the
calibrated sum of side and central tower signals. The the large spikes
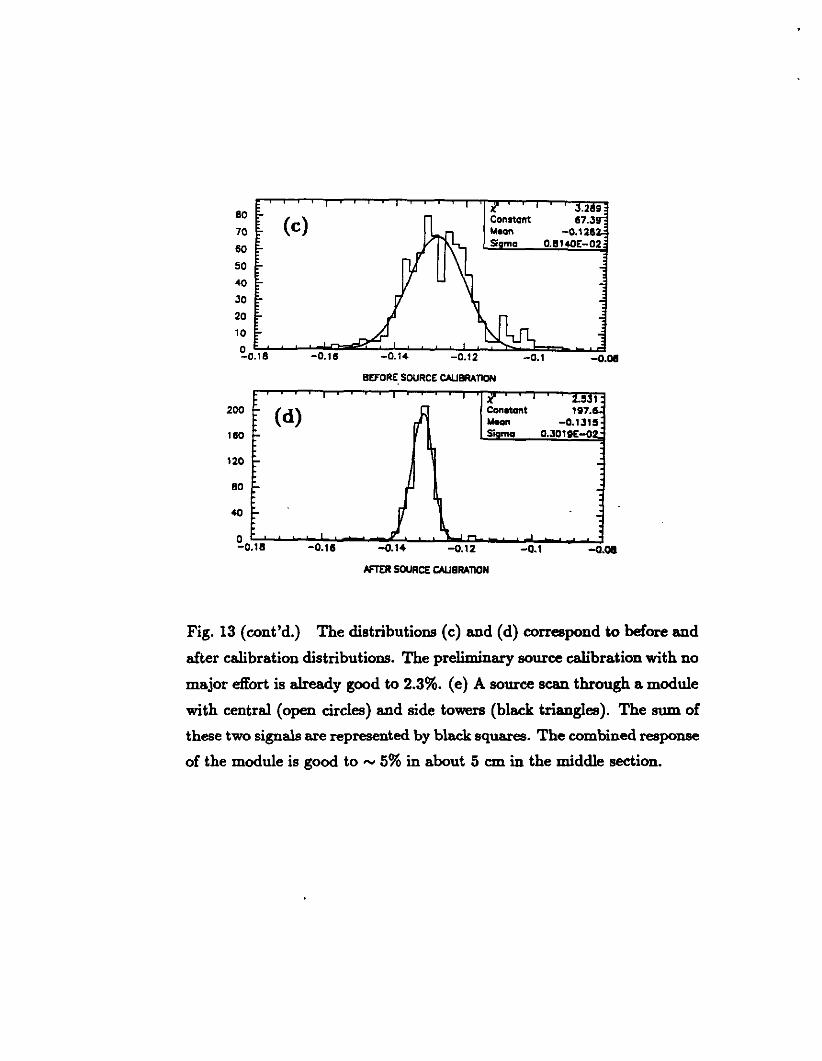
and dips are because of dead channels. The distributions (c) and (d)
correspond to before and after calibration distributions. The preliminary
source calibration with no major effort is already good to 2.3%. (e) A
source scan through a module with central (open circles) and side towers
(black triangles). The sum of these two signals are represented by black
squares. The combined response of the module is good to ,.,, 5% in about
5 cm in the middle section.
Fig. 14 An example of a simple and inexpensive laser-based calibration system
from E687 at FNAL [Bian91).
Fig. 15. Laser pulses variations for four outer EM counters over a 100 hour period
before (a) and after (b) normalization (Bian91).
14
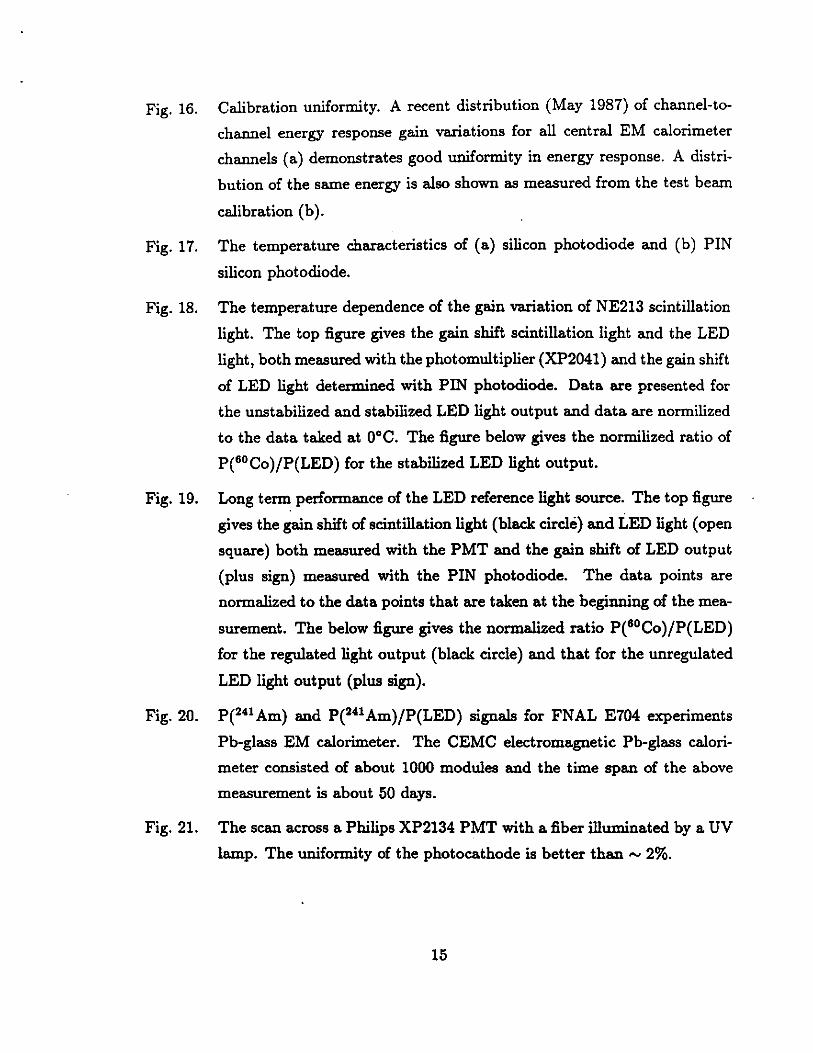
Fig. 16. Calibration uniformity. A recent distribution (May 1987) of channel-to
channel energy response gain variations for all central EM calorimeter
channels (a) demonstrates good uniformity in energy response. A distri
bution of the same energy is also shown as measured from the test beam
calibration (b).
Fig. 17. The temperature characteristics of (a) silicon photodiode and (b) PIN
silicon photodiode.
Fig. 18. The temperature dependence of the gain variation of NE213 scintillation
light. The top figure gives the gain shift scintillation light and the LED
light, both measured with the photomultiplier (XP2041) and the gain shift
of LED light determined with PIN photodiode. Data. are presented for
the unstabilized and stabilized LED light output and data are normilized
to the data taked at 0°C. The figure below gives the normilized ratio of
P(6°Co)/P(LED) for the stabilized LED light output.
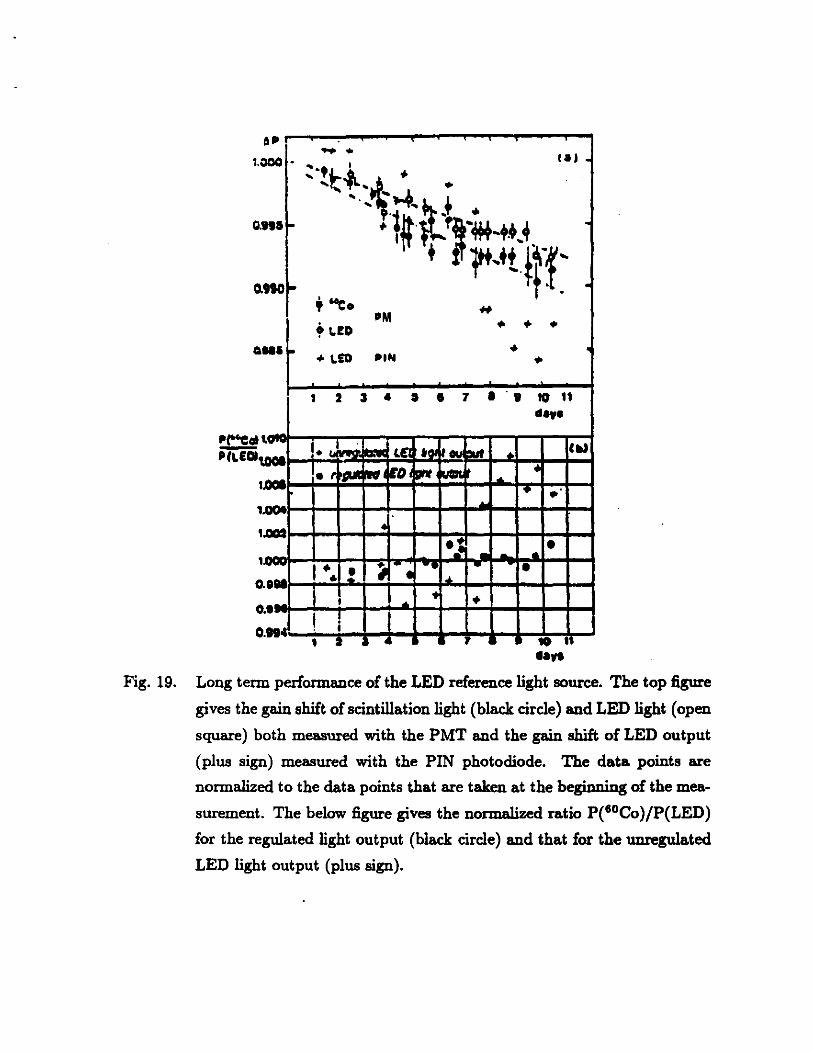
Fig. 19. Long term performance of the LED reference light source. The top figure
gives the gain shift of scintillation light (black circle) and LED light (open
square) both measured with the PMT and the gain shift of LED output
(plus sign) measured with the PIN photodiode. The data points are
normalized to the data. points that are taken at the beginning of the mea
surement. The below figure gives the normalized ratio P(6°Co)/P(LED)
for the regulated light output (black circle) and that for the unregulated
LED light output (plus sign).
Fig. 20. P(241 Am) and P(241 Am)/P(LED) signals for FNAL E704 experiments
Pb-glass EM calorimeter. The CEMC electromagnetic Pb-glass calori
meter consisted of about 1000 modules and the time span of the above
measurement is about 50 days.
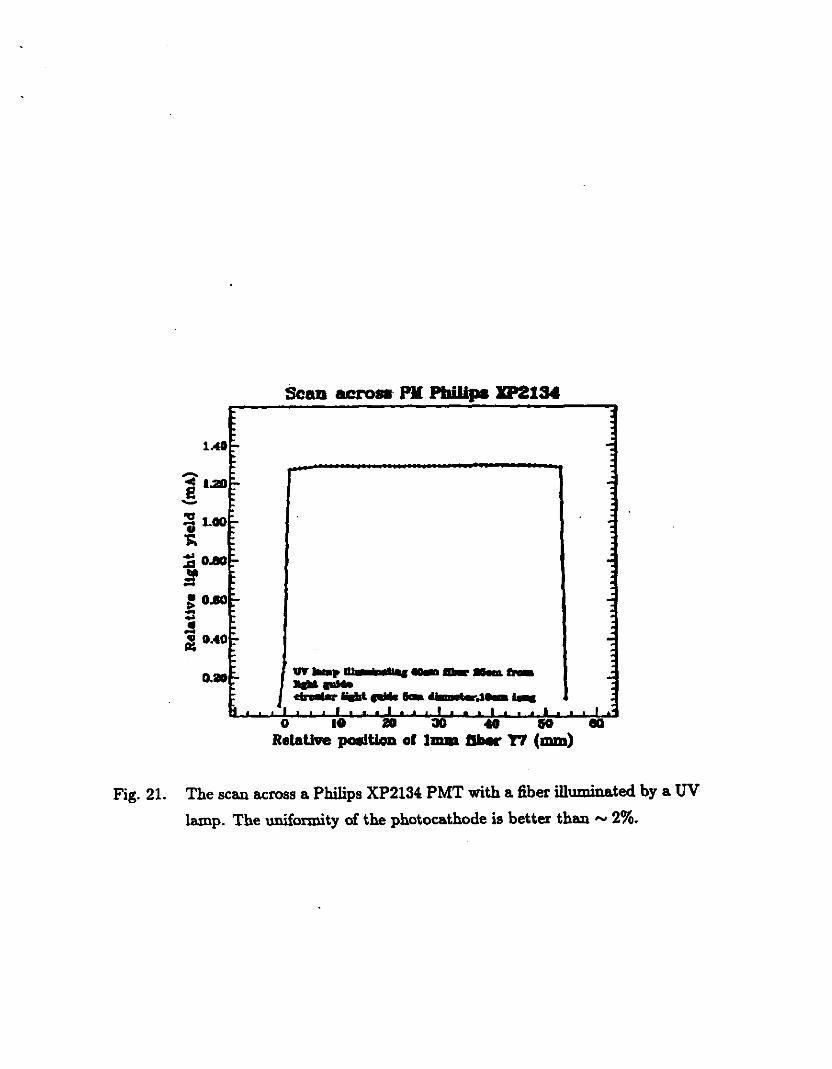
Fig. 21. The scan across a. Philips XP2134 PMT with a fiber illuminated by a UV
lamp. The uniformity of the photocathode is better than ~ 2%.
15
List of References
[Akch92) N. Akchurin et al., submitted to III Int'l Cii.J.. Conf. Corpus Christi, TX,
1992.
[Andr91] A. Andresen et al., DESY 91-026.
[Bam90] V. Barnes and A. Laasanen, Symp. Detec. R&D for the SSC, Fort Worth,
TX 1990.
(Berg89] J. Berger et al., NIM A279(1989)343.
[Bian91] S. Bianco et al., NIM A305(1991)48.
[Hahn88] S. R. Hahn et al., NIM A267(1988)351.
[Ha.se92] T. Hasegawa et al., NIM A311(1992)498.
[Herz92] D. Herzog, (private communication).
[Kubo89] Y. Kubota and C. O'Grady, NIM A279(1989)73.
[Reit81] W. L. Reiter and G. Stengl, NIM 180(1981)105.
16
30
CJ Wedge 1
25 39 days
CJ Wedge 11 39 dav•
20 0.2%?0.7% Wedge30
~ ~ 34 days N ci
~ Wedge 30
a; 28 days
Q. 15 (another time) .. ., "::: c w
10
5
0
• 1 . 5 ·1.0 ·0.5 a.a a.5 1 .a 1.5 2.a 2.5
Percent difference in (e-/Cs 137)
Fig. 1. Calibration reproducibility. The difference in beam to 137Cs source ratio
for each tube is plotted for successuve calibration procedures about :6.ve
weeks apart for three modules. The deviation of the centroid from zero
corresponds accurately to the source decay [Hahn88).
Fig. 2.
Xenon Flasher LED Flasher
150 - 80
lf • o.oeii: lf • -0.051' ,, • o.~ t'l " . 0.28" =-
~ .. " r- " 0
100 .... !!.. ci .. " " ..
40 0 <i 0 c .., c ~ .. 50 .... .s:: u
·-.I .. \. . °-~2~ ..... _~,..._~al-.lL..~,'-...~~2 Percent difference
0 ~~.-J.':""":.....~·~\.J.....i....•~-1 2 -I 0 I 2
Percent difference
Comparisons of two xenon flash and LED runs seperated by about a day.
For the xenon flash, the ratio of raw phototube signal to PIN diode signal
was compered, while for the LEDs the raw PMT signal was used [Hahn88].
+I .z
+o. I
I IAUWJ ' !
; ,.. IM.L.TI-
I/ AUCAU -.
~ --0.1
-1.Z
- 11111 ...
llllYIL!NllTH ""'
Fig. 3. Typical temperature coefficients of anode sensitivity as quoted by Hama-
matsu.
2310 t • I •
2~ • • ' • • • t •
:1200 I
r. o.scto 2280
2270
2280
00 ••
I '· I . •
• a •• ' . • . . :
90 92
M£Al'I VS 8TtM~cF
• • 8 t • • I i •
' • •
Fig. 4. Measured temperature dependence of the gain of Hamamatsu 580 PMTs
as measured by CDF. The dependence is about 0.5%/°C and consistent
!' ·s u
:3 I i::: 0 ~
~
Hamamatsu R580 PMT /IZF5588 @ -1 lOOV
2.5
-2.5
;
'. -5.0
-7.5
-lQ~L--'--L....L..1....L.L.U...~--'-~"'-........................ ..__.__,___.__._,_.L-0. ........ .__~~ 5 10 60 100 500 1000
Peak CWTUt (m.A)
Fig. 5. Nonlinearity of Hamamatsu R580 at -1100 V. As can be seen it is linear
within 2.5% up to 70 mA.
Hamamalsu R2490 #ZD99BO 2" PMT @ -2200V 5.0
2.5
o.o i.......~ ........ --.._.._..,_,...__.......-_,. _________ .......
-2.5
!-li· u -15.0 :3 I a D z -?Ji H
-10.0 10 liO 100 500 1000
Peak CWTenl (mA)
1.0
0.5
-0.tl
-1.0'--..._..._1...&........_...__...__.__._....._.....u...u....--'---''--'-'-.u....u.-...l..,.j 10 50 100 500 1000
Peak CIU'nllt (mA)
Fig. 6. Nonlinearity of Hamamatsu R2490 at -2200 V. As can be seen it is 0.1%
linear up to 1000 mA.
10000 (after lO!mn I
1000 I
I I I
(R3~t~ Im
II MU&.TI•
~ ~f I 0
.. ,I
I I I
t•OO -
- ?4 I ..... - llA ... I
I ... ,,I
~ I r
I
o.a
D.IJO I I I -•• -"' ••
Fig. 7. The temperature characteristics of dark current as provided by Ham&
matsu. Hamamatsu also provides thermoelectric callers designed fpr var
ious sizes of photomultiplier tubes.
700
,,..... 600 Q)
c 500 c
a .s:: u
......... 400 u a. in 300 . N tO .........
200 ~ a.. 100
0 0 2 4
H.V. = 1870 volts
Light level 10 = 200 mA
6 8 10 Light Intensity
12
Fig. 8. Linearity test of the R580 PMT with a Cockcroft-Walton base. The light
sotirce is a blue LED of wavelength - 490 nm.
en +' c :J 0 u
3000 ,........,....,..,...,....,..,... ........................................................................... -----
2500
2000
1500
1000
500
i15 420 425 430 435 440
H.V. • 1300 volts
Gate • 400 nsec
445
Mean • 440.1
IT • 1.39
450 455
PHA (0.013 pc/channel)
460
Fig. 9. Noise measured with R580 PMT and Cockctoft-Walton base. The peak
is produced by a charge injector. The calibration is 1.3 x 10⁻¹⁴ Coulombs
per channel.
Et~ernet coaxial cable
#n
-------------------~m~ I . liT,._.r
l NATIONAL I I MNICOMIUCITOlll - . .,. i-----
t. . .· ~"": . .. --·--
. n:P.1%1" .
. -'""'· . • INT-Actl I
,f ~~-1 L -u . ----
LOOM.. -CONTAOL
----
I I I I I I I I l I I
L.-----------------~------·J REMOTE PM CONTROL STATION
CONTROLS 256 PM. TUBES SIZE 203 X 165 X 242 mm
Fig. 10. Remote control system for PMT high voltage distribution.
(a)
.,.
Ti (c)
-·-·-
Tot1I or: 27 Ft • 25 Pll laytnl EM Cort: 13 Ft• 12 Pll laytnl
I.Om~
..... i--
Pllr;uQ Q~nunu f ~s mm Fe t~i~omm
1.0 mm Gia
: 19mm
(b)
rlOtMI Darllltl .,-. •"""'" to tower a>et1 • ...., •""'
-
I .. - I- 3 ····-. --··-· -·--"
:a-c:•Nri!'.--- -:---.··-·-··- --::::::s:n--= ~
- r,.,, •1 - -- ---~ .,
s c. -- ·----
' -..,.. :z...
Fig. 11. The integrate~ and projective Pb/Fe/Scintillating fiber calorimeter with
central and side towers. (a) Stacking of 36 modules, (b) the structure of
individual module and (c) the embedded stainless steel tubing at various
locations of the towers for the radioactive source calibration.
-0.02
-0.04
-0.08
-0.08
-0.1
-0.12
-0.14
0
-0.02
-0.04
-0.08
-0.08
-0.1
(a)
·' ,.
.,
.·•
·. · ..... ·. ·.· .. ' ·.: .·.·
~: ;.
~.. . · ... ;-~~· .... ·.•
·, -·t?~i~~
· .. · ... •· --~~~::
11000 19000 19000 20000 21 ooo 22000 2;iaoo
.. .. ~·
··.:. ""'
(b) _,...,__
/.-··~:.:~. :. ;' : ·;.
. . . ~
.. , .:.· ·-.. '
·. "· ! .
• ,
·'l
?
CNf 115 x
. t~; .. ··~
,. ,. ., ': ·i
• ' ..• ~-.
'
.. /
·.
'
' .. · .. ..
. ,,,,., ... .. ·,.· . ' •.
,.
.. · .
.·:
.. :• .. · ~
:;.- ;
11000 19000 1 tooo 20000 21 ooo 22000 z;iaoa
SID 115 X
Fig. 12. The transverse radioactive scans in T2 hole for the central (a) and the
side (b) towers. Six valleys and peaks are observed as the source scans the
cracks and tlie centers of the module. The x-axis is in umits of 0.1 mm.
( c) A typical longitudinal radioactive source scan of a Pb/Fe/Scintillating
fiber calorimeter. It is possible with this method to localize nonuniformi
ties in light emission and transmission.
0.32
0.2fl
0.2<1
0.2
0.16
0.12
0.08
O.O•
0
(c)
100 200 JOO
Fig. 12
ID Entries Mean RMS
600
-0.1
(a)
·.~·
-0.12 .~. · .. · .
... ,.•-:.
· .. ·· ...... .- • ..... :
-, ·····' -0.14
-0.16
-0.18
- 0·2 '-'1~1.1.oo_o._._.__.1_8000;._.._._.__.1_9.1.ooo_.._.._._.2_00.1.oo_.._.._._.2_1.1.ooo......_.._._.2,.,,.2000
-0.1
• • . (b) •
-0.12 - .. ~: ·. .
-0.14
\.~;;~· ... >{:7\ _ :;;;~:{f~·<::\1:~~f..t;~;:·\:;::l'.;~~;/\~7~;-~f'\f; ·: ·. - ...... ..
-0.16 -• • •
-0.18 ... • •
-0.2 . ' . ' . . ' 17000 18000 19000
. . - . .
20000 21000 22000
Fig. 13. The transverse source scans (Current vs x) through all five rows of mod
ules (a) uncalibrated side and central tower signals are added, (b) the
calibrated sum of side and central tower signals. The the large spikes
and dips are because of dead channels.
80
70
60
50
•o 30
20
10
(c) Constant Moon Si ma
~o·~.1~8~ ........ ~-~o~.1~a"""a!::::::~-~o~.i~ .......... _._......_,L,....::::;::::::i:,;;.,:.b::==.._....._a~ -a.-
200 (d) 180
120
80
BEFORE. SOURCE CALIBRATION
Conatant Moon s; ma
N'TEll SOURCE CALIBRATION
Fig. 13 (cont'd.) The distributions (c) and (d) correspond to before and
after calibration distributions. The preliminary source calibration with no
major effort is already good to 2.3%. (e) A source scan through a module
with central (open circles) and side towers (black triangles). The sum of
these two signals are represented by black squares. The combined response
of the module is good to "' 5% in about 5 cm in the middle section.
a
-D.D2
-D.0<4
-D.D&
-o.oa
-0.1
-D.12
BJ SIDE AND CENTER SIGNALS
Mifli*oo (e) pO 0 ...
0 rt ..
.. o . ..
.... .. 0
•
19500 11750
0
• • • •
0°, ....... MA .... .. .. o• • .. .. .. 0 • .. ... 0 .. .. 0 • .. .. •
i• ... 0
0 •
0 0 •
0
20500 20750 21000
BJC 115 X
Fig. 13
Pl.UH .... MODlnlD
MULn D4C
fflGll YCJLlAGI
n:ur:o POWIEa Sl"nt.Y
LASla aF.5CJ~A~T
CAVITY
DIStalll:TION INSTall\lTION 4.'ID n:,... 4ND 11;!111.•0
IUI 90'1:
ornc:u n•r:• CAILll
PLIJ:IPllP
OPl'ICAL G\:llU ... ...
Fig. 14 An example of a simple and inexpensive laser-based calibration system
from E687 at FNAL (Bian91].
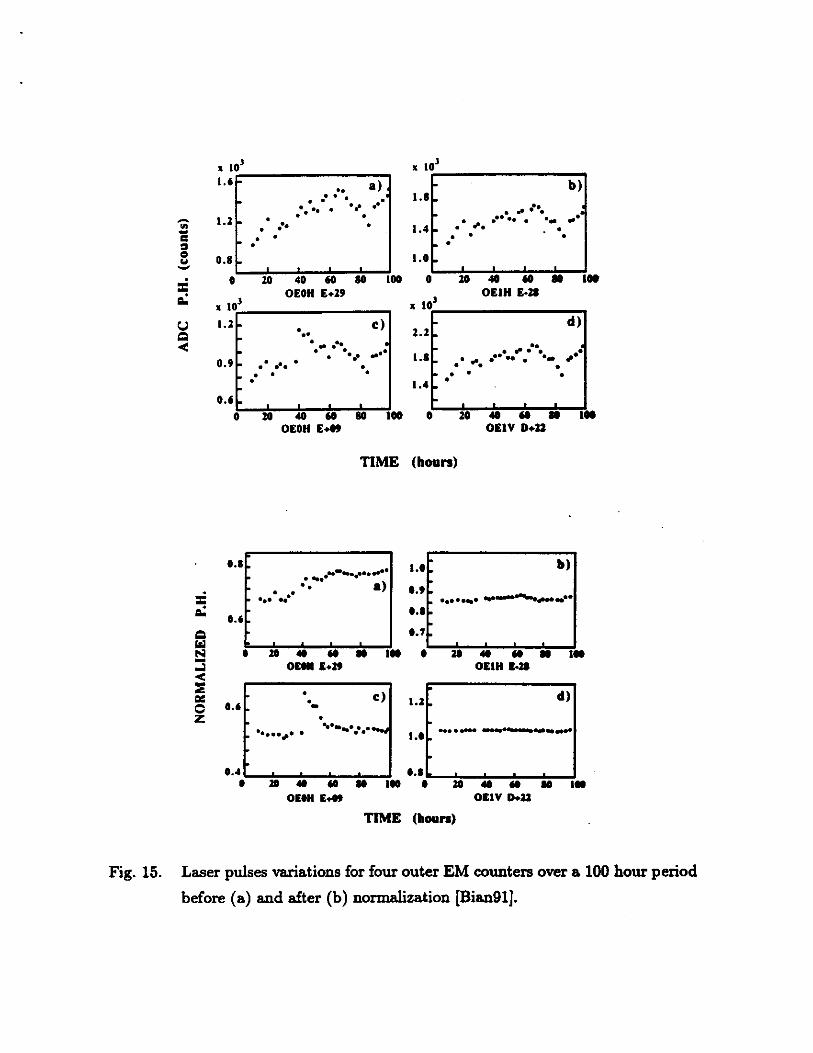
Fig. 15.
~ .. -.. .. " .. -:: ~
i:.J Q
<
• IOJ 1.6. a) ••
• • .· . . ' • •• • ... ••
1.2. •• • ... • • • • •
0.8 • . . . 0 20 40 60 80 100
• 103 OEOH E+2'
1.2. • c) .. • • .. ... • • • • .. .. 0.9. . • • ...
• ••• • • • • • • •
0.6. . . . . 0 20 40 60 80 100
OEOH E+19
TIME
..... .. . ...... -.......... . .. •• a) .. ... . .. ·· . ••• • •
•••
- . - -20 .. ... , .
OllH 1•29
• ·-..... , .. • ........... C)
x. 101
- b) I.I" . .. ··· . - ••• •• • .. . ..... . .. 1.4 - • • • • • 1.0 - . . . .
0 20 40 60 .. , .. • 103
OEIH E·ZI
- d) 2.2 •
. .. .. ..... • • •
1.4 • . . .
0 20
(hours)
• 1.0"
•
•• . .... .·· .. . ·- .. • •
- - -40 60 ..
OEIV D+U
b) •. , . .............................. ••• • . 1.1.
-
• • •
"'
. ....... ,. OEIH loll
l.J d)
• •• .. ...... --~·--·--·---t.4 ...... .....,.,..........,_....,_~--- •.• ....___, _ _._ ...... _ ...... _ ....
• 20406010ltot 2040tellll0 OEIH 1+09 Oil Y D+U
TIME (hours)
Laser pulses variations for four outer EM counters over a 100 hour period
before (a) and after (b) normalization [Bian91].
.., 0 0 c:i ...... .. ;; c: c: " ..c: u
... ,. 1987
(a) 40 ,...
r. 1.03 ,, • 0.08
30 ,...
20 -
10 -
0 I I ft I l...l. I IL
oa o.a 1 u 1.4
Gain I Nominal
Te•t Beam: May 1984 - lune 1111
(b) eo -
lf - 1.01
,, - 0.04
40 -
20 -
I I I ll I. I O"-'--~L.Ll<L.-...,...,.. ......... _..
a.a a.a 1 1.2 1.4
Gain I Nominal
Fig. 16. Calibration uniformity. A recent distribution (May 1987) of c:bannel"to
channel energy response gain variations for all central EM calorimeter
channels (a) demonstrates good uniformity in energy response. A distri
bution of the same energy is also shown as measured from the test beam
calibration (b ).
+z.o
(a) ~ +t.t
(b)
: +1.0
:s +ol It ~ 0
I: .. -u
-1.0 , to
I
•
.
I ' ' I ' '
I w -
I I
~ ./ !
! I I I I
i '
! I ..... ......
+t.O,...."""-...~r--"'l'"""""l"__,r--"'l"""-r--,
~+t.•
j::t-+--+---1~+-+-.;.+~:.....if--iR
~ ol--+'F=
I=~~ WAllll.EHCITM 1111111
Fig. 17. The temperature characteristics of (a) silicon photodiode and (b) PIN
silicon photodiode.
t, - ,., ., -J
.... -t .... _,
... "' ,-
i:............._f I ~__.,_,_~f-·!1
Lii l•I
• I T ~) n
lll lll"'C11j/lllL1Dt
Uli-~~"""'~~-!!--~-i~~ ....... ~~ ..... ~~--~~-tt UI (II}
I I •• II
Fig. 18. The temperature dependence of the gain variation of NE213 scintillation
light. The top figure gives the gain shift scintillation light and the LED
light, both measured with the photomultiplier (XP2041) and the gain shift
of LED light determined with PIN photodiode. Data are presented for
the unstabilized and stabilized LED light output and data are normilized
to the data talced at 0°C. The figure below gives the normilized ratio of
P(6°Co)/P(LED) for the stabilized LED light output.
.. i a 1.000 .
Ci.ff ... a.no -Qll I •
l'("Cot\
;;.Tci\DOI
UIOI
1.GOt ,,. 1.000
o. ... o . • 0. ""
'
' . -. ta J -
~-·t~ ~.
'•.: ·~~~-*+-++.4. .
+ % -,++,+t.tf"1~ . +"Co H
O \.ED "M • • •
• • • \.£0 ..... • .
' 2 3 • I • 1 I I 10 " ..... !· lllfl *"
_.J... .. • ,.,
o. ~, !'O '" WI. • 6
• • ~
• •J • •
I •. .! ' - - • • ....
I 1 • 6
! ! I I
' • • 1 10 I .. ,. Fig. 19. Long term performance of the LED reference light source. The top figure
gives the gain shift of scintillation light (black circle) and LED light (open
square) both measured with the PMT and the gain shift of LED output
(plus sign) measured with the PIN photodiode. The data points are
normalized to the data points that are taken at the beginning of the mea
surement. The below figure gives the normalized ratio P(6°Co)/P{LED)
for the regulated light output (black circle) and that for the unregulated
LED light output (plus sign).
~11)J ..----------------....,
, .........
.. Fig. 20. P{241 Am) and P(241 Am)/P(LED) signals for FNAL E704 experiments
Pb-glass EM c!llorimeter. The CEMC electromagnetic Pb-glass calori
meter consisted of about 1000 modules and the time span of the above
measurement is about 50 days.
1AO
....... .! l.ZO
i 1.00
:ii o..ao ;r : O.IO :: ;i cuo
O.at
Scan acroa· PK Philtpa D'ZUM
VY-pa• 7 !t·---:1115» ...... di 7• liP& .... - I' "'*o2- ._
o 10 11111 30 .a 10 10 Relallve paaltioD of Imm !lbw Y"1 (mm)
Fig. 21. The scan across a Philips XP2134 PMT with a fiber illuminated by a UV
lamp. The uniformity of the photocathode is better than .., 2%.
Appendix I
Specifications for Philips XP3461B
~hilips Components
Data_, XP3461B status i Pre1tm1nary spec:rt'•cation
d•te of iuue J October 1989
Fast, green-sensitive, 8-stage, 76 mm (3'1 diameter tube
~PLICATIONS
r high-energy physics and other applications using l(TI) scintillators and requ1nng good t1m1ng aracteristiCs. .
ENERAL CHARACTERISTICS
rJindow material pn>file refractive index at 400 nm
hotocathode material useful diameter spectral range wavelength for maximum radiant sensitivity luminous sen~tivity
blue sensitiv;ty radiant sensitivity at 440 nm Quantum efficiency at 440 nm urtipUer first dynode structure number of stages slope: log(gain)llog(supply vonag.) capacitance anode to Ill
NOTES
fimeglass piano - concave 1.54 semi-lransparent. hod-on extended green biall<ellne 1 min. 68 mm 300to690 nm 2 • 440 nm min.100 µMm 3 typ.140 jlAl1m • 14 jlA/lmF 4 • 105 mA/W 5 • 29 " high-gain linear foc:usec:I 8 • 5.5 • 5 pF
Phillps Components
Fast, green-sensitive, 8-stage, 76 mm (3'1 diameter tube
OUTPUT CHARACTERISTICS gain= 106
PARAMETER i MIN. TYP I MAX. I [ orap~a., 1 Supply voltage ' - 1350 1600
! Anode dark current - 10 40
I Background noise (x 103) - 5 20
! Single electron spectrum • 60 I resolution - -
i peak to valley ratio - . 3 -I Mean anode sens1t1v1ty deviation i
long term (16 hours) - - 1 -after change of count rate - . 1 -at a temperature between 0 and 40 'Cat 450 nm - . 0.2 -
/ Anode current halved for magnetic field of perpendicular to axis "n' - . 0.1 -
~rallel to axis "n" - . 0.2 -
VOLTAGEDMDER PARAMETER A B c
Supply voltage se1 at 1350 1600 1450
Gain x 106 . 1 . 1 . 1
Anode current linear within 2% up to • 50 - 200 • 120
Anode pulse rise time • 3.5 - 3 - 3
Anode pulse dUFation at hall height . 4.5 . 4 - 4
I Stgnal transit time • 40 - 40 .. . 40 Transit time difference t>etween centre of photoca1hod• . 2.5 and 30 mm from it
UMmNG VALUES
Limiting values in accordance with Absolute Maximum System (IEC 134)
I PARAMETER MIN. MAX. i Gain x 11)8 - 3
Supply voltage - 2000 v Continuous anode current - 0.2 mA
' Voltage oetween g1 and photocathode - 20 v Voltage oetween g2 and photoca1hod• - 700 v Voltage between first dynode and photocathode 300 700 v
I Voltage between consecutive dynocles - 400 v ! Voltage between anode and laSt dynode 80 600 v I Ambient tem~t~~!' ·---· I ·"" All •c
Prelrm1nary soec1ftcatron
XP3461B
I UNIT NOTES ' I rV '
nA 6.7
els 7.8
% 9 10
11 % % %/K
12 mT 13 mT 13
seenote 14
UNIT NOTES
v
mA ns 15
ns 15
ns 15
ns
UNIT NOTES 16
17
18
19
20
Philips Components
I I !
: I
Fast, green-sensitive, 8-stage, 76 mm (3'1 diameter tube
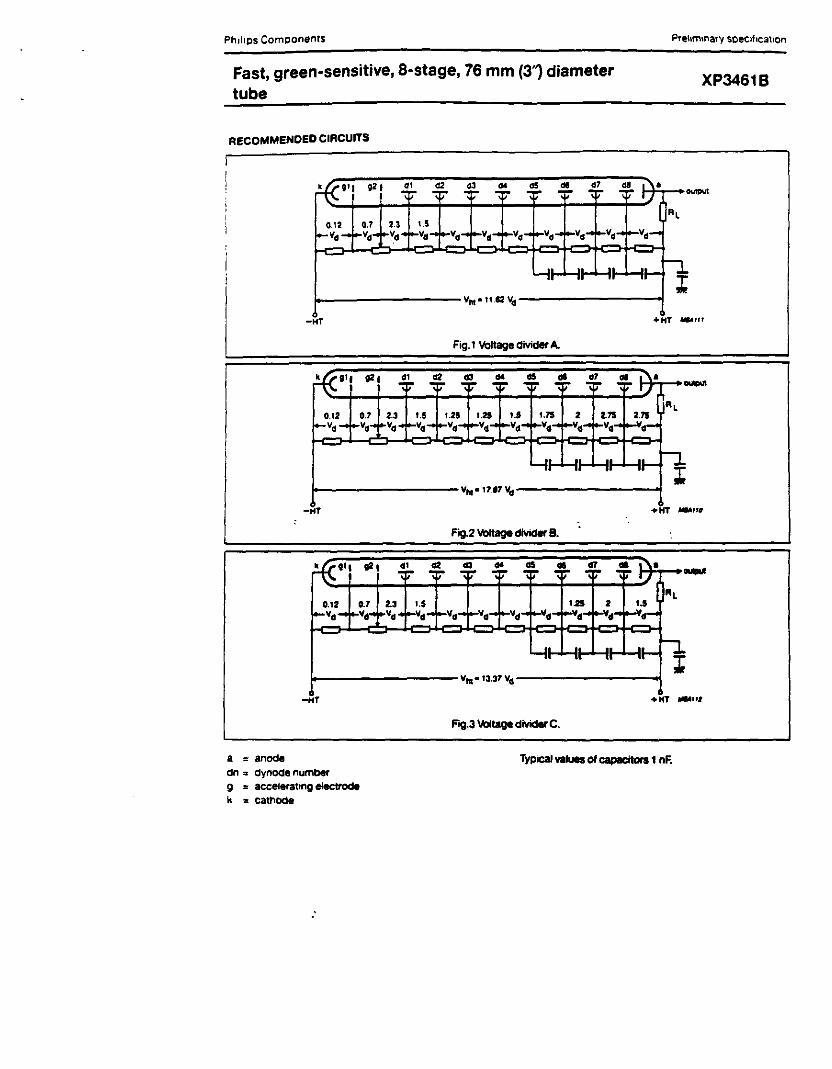
RECOMMENDED CIRCUITS
rt<'': •• 1 .. ~ -~ .. .. ~·!.
_.._ ,·~ I '; -;;
0.12 G.7 u 1.5
dtl I,. - ":' • J
l -vd-t ~Vd-t ~vd .. ~vd ... ~vd .... -vd ... le-Yo"'"' l-t-Yd-4 -vo"" -vd .... ..... vd-
I I
I .. .. .. . . i .. .. .. ..
Yl'll• 11.12 Vo
XP34618
...... .,
~ I •HT +HT _.,,,
!
Fig.1 Voltage divider A.
!{('11 ... . 01~ -~ ·Cl3~ _ .. _
_llS_ ·"'~ -d~- di • , • -I ' • ';' I J
0.12 0.7 ... ••• t.25 .... ••• 1.75 2 .,
2.75 2.75 i.-vd-t ... vd-ti ~vd~ -Ya-4 ... vd-. i.t-Vd-4 -yd...., ~Ye1• ~yd .... ... vd .... -"•-
.. .. .. .. 1 .. .. .. .. Yt1t• 17.17 Vo
·HT +HT _,.,,.
' rog.2 Voltage divider B. :
!..('.(•'• ... •• Cl2 .. .. 115 . .. _ _.,_ -~ , , . -. - ,; -;; -;; ''7' •J
AL 0.12 0.7 ... ... .... 2 ...
-"a- lo-•.- l"""a"' -"•"' -vd .... ....... ...vd-4 ,......,d .... ..... .... .. ..... -"•-
-T
a = anode dn = dynOde number g : accelerating electrode k = catnOde
:
.. .. .. . . 1 .. .. .. .. Ye.• 13.37 Yes
+HT MUHi
Fig.3 Voltage divider C.
Typical values of capacitors 1 nF.
Philips Components
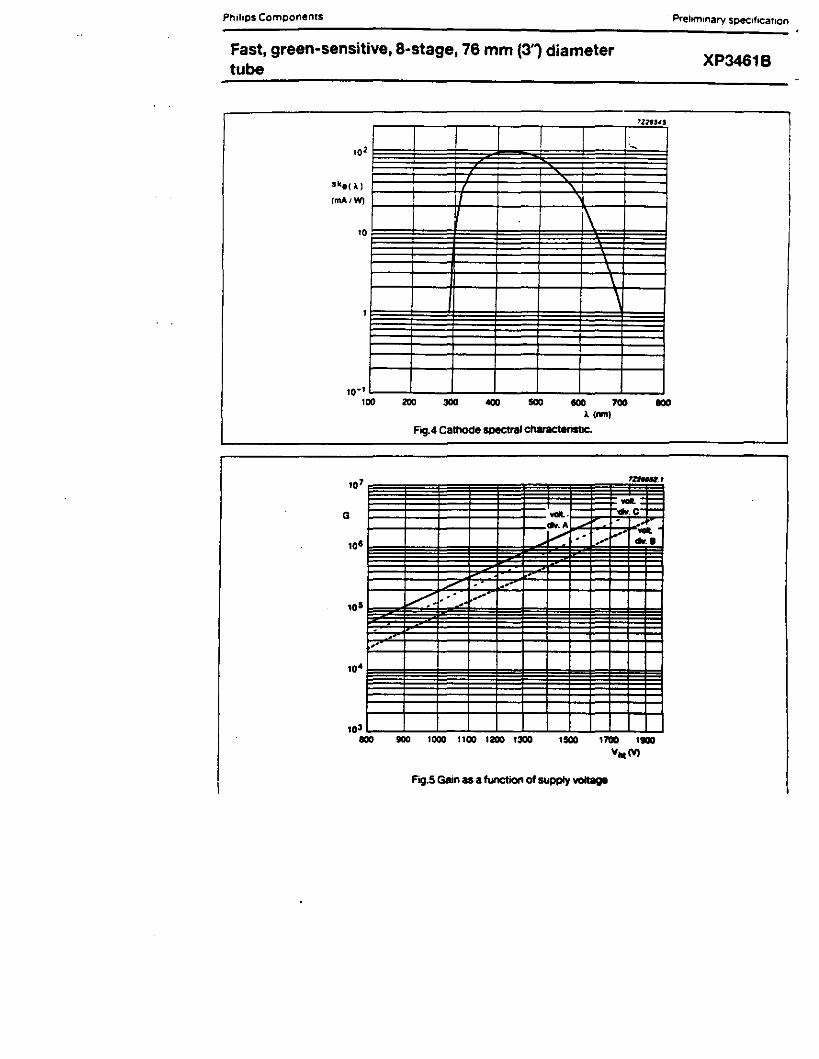
Fast, green-sensitive, 8-stage, 76 mm (3'1 diameter tube
Ske( A,)
fmAIW)
10
10-1 100
' ' , '
I
\
' ' \
200 300 500 IOO l (nm)
Fog.4 Cathode spectral ctwactenstic.
'
700
·- = -
-
-
IOO
to•L-~...J..~--''--~'--~'----'~...J..~'---'---''--.L......L....J 100 900 1000 1100 1200 1300 1500 1100 1900
v,.M
Fig.S Gain as a function of supply"""-
Preltmrnary spec1f1cat1on
XP3461B
Philips Components Prehmrnary specifrcat1on
Fast, green-sensitive, 8-stage, 76 mm (3'1 diameter
tube XP3461B
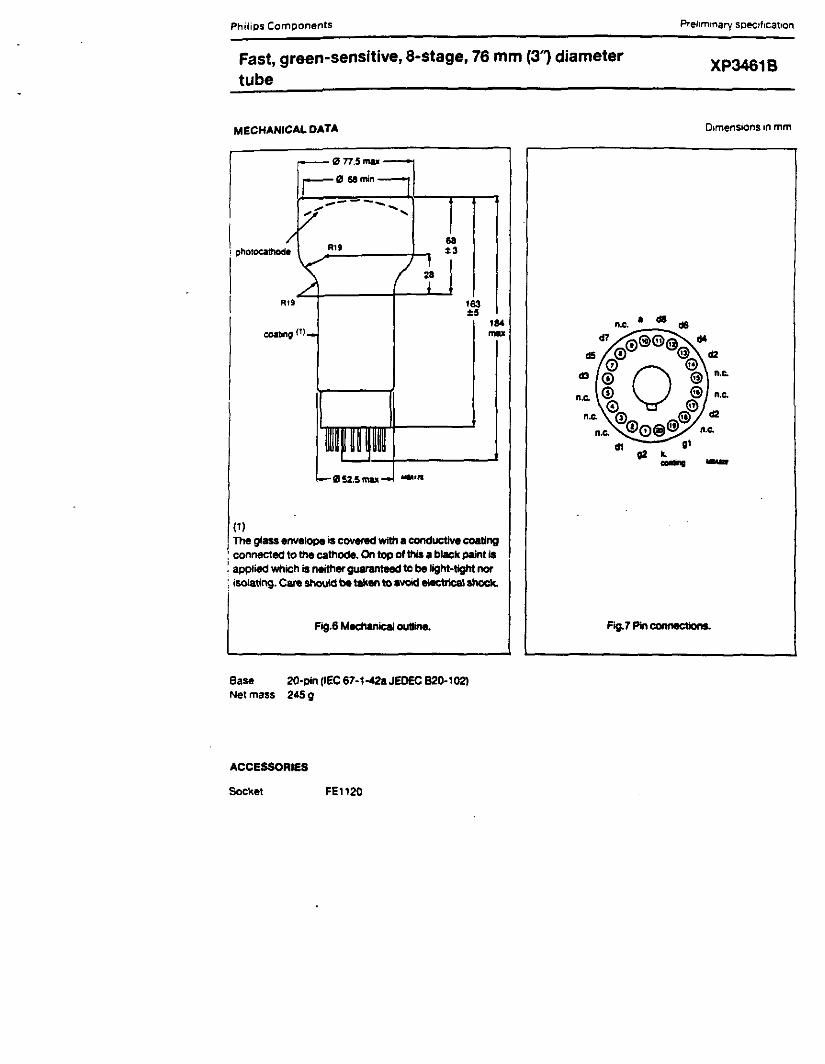
MECHANICAL DATA
(1)
E 0 77.5 max ---i CZIUmin jj
------ -,. ....
coatinO (T)
Ql52,5mu. MMUI
163 :s
18'
"'""
The glass envelope is covered with a conductive coating I connected to the cathode. On top of this a black paint iS : applied which is neither guaranteed 10 be lighl-tight-: isolating. Care should be taken 10 avoic:I eleclriCal shock.
Fig.6 Mechanical outline.
Base 20·pin (IEC 67-1-42a JEDEC 820-102) Net mass 245 g
ACCESSORIES
Socket FE1120
Dimensions in mm
n.c. I di d6
d7 @®®® dO d5 ® @ d2
0 e cl3 @ 0 @) n.c. n.c. © ® n.c.
© ® n.c. @ ® d2
@0ic.® n.c. n.c. 'Cl' d1 gt
g2 ~ - --
Fig. 7 Pin car• M1ctious.
Philips Components Prelrm1nary spec1ficat1on
Fast, green-sensitive, 8-stage, 76 mm (3'1 diameter
tube XP3461B
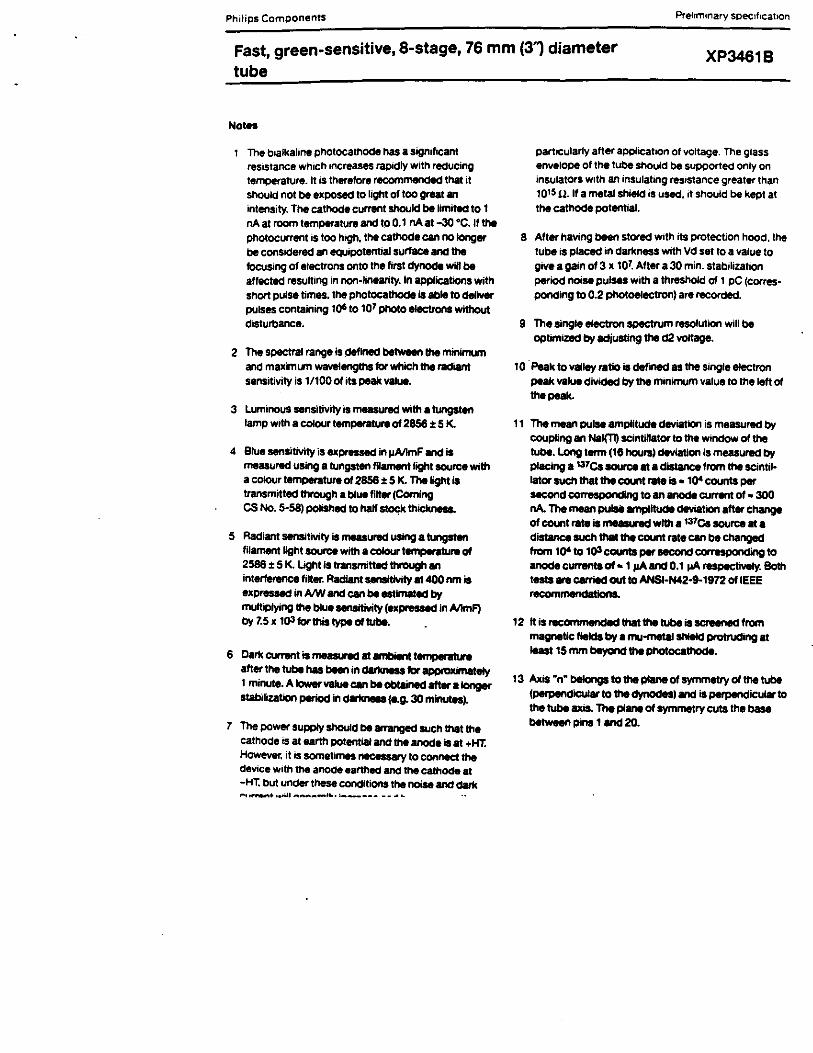
Notes
The bialkaline photocathode has a stgnifieant resistance which increases rapidly with reducing temperature. It is therefore recommended that it should not be expased to light of too great an intensity. The cathode current should be llmil9d to 1 nA at room temperature and to 0.1 nA at -30 •c. II the photocurrent is too high, the cathode can no longot be considered an equipotential surface and the focusing of electrons onto the first dynode wiH be affected resulting in non-linearity. In applications with short pulse times. the pholocalhocle iS able to deliver pulses containing 10' to 101 photo electrons without
disturbance.
2 The spectral range is defined between the minimum and maximum wavetengthslorwhichtheradiant sensitivity is 1/100 of its peak Vllue.
3 Luminous sensittvity ts measured with• tungsten lamp with a COiour temperature of 2856 :1: 5 K.
4 Blue sensi!Mty is expressed in µAllmF and iS measured using a tungsten filament light source with a colour temperature of 2856 :1: 5 K. The light iS transmitted through a blue filtlt (Coming cs No. 5·58) PQliShed to hall~ thiclcnesa.
5 Radiant sensitivity is measured USing a tungsten filament light source with a colour temperatura of 2586 :1: 5 K. Ught is transmill9d through an interference filter. Radiant sensitivity at 400 nm iS exprassed in IVW and can be estimated by multiplying the blue sensitivity (expressed In Mmf') by 7.5 x 10³ tor lhiS type of tube.
6 Dari< c:unwnt is measurad at ..-it temperature alter the tube has _,in dlllcnns tor --ely t minute. A lower Vllue can be _nod alter a longer stabilization period ind-.... (e.g. 30 minutes).
7 The pawer supply should be arranged such that the cathode is at earth potential and the anode is at +HT. However, 1t is sometimes necessary to connect the device with the anode earthed anct the cathOde at -HT. but under these conditions the noise and darK .............. 11 ........... -11 •• :----- __ .....
parttcularly after application of voltage. The glass envelope of the tube Should be supported only on insulators with an insulating resistance greater than 1015 il. If a meral shietd is used. it should be kept at the cathode patential.
8 After having been stored with its protection hood. the tube is pJaced m darkness with Vd set to a value to
give a gain ol 3 x 10~ Alter a 30 min. stabilization period noise pulses with a threshold of 1 pC (corm· ponding to 0.2 pllotoetectron) are racorded.
9 The single electron spectrum resolution will be optimiZed by edjusting the d2 voltage.
10 ·Peak to Vllley retio iS defined as the single electron
peak Vllue dividec:t by the minimum value to the left of the peak.
11 The mean pulse amplitude deviation is measured by coupling an Nel{Tt) scintlffator to the window of the tube. l.ong totm (18 hours) -tion is measured by placing a •37Cs source at a dislance from the scintil· later suc:ll lhet Ille count rate is• 104 counts per second corresponding to en - current of • 300 nA. The mean pulse amplitude -lion alter change
of count rate Is me8llnd with a '"'Cs source at a distance such that Ille count rate can be changed
from 104 to 103 c-per second corresponding to -currentsol • 1 pAand 0.1 pA-tivety. Both tests .. carried out to ANSl·N42·9-1972 of IEEE recomrnendallona.
12 II is rac°"'""" ldecl lhat the lube Is SC'8erled from magnetic fields by a mu-metal SNeld ptDlrUding at least 15 mm beyond the photocalhocle.
13 AxiS "n" belongs to the plane of symmetry of the tube
(_.iicular to the dynodes) and is _.ilcularto the tube axis. The pl- of symmetry cuts the base between pins 1and20.
Phrlips Components Prehmrnary spec1f1cat1on
Fast, green-sensitive, 8-stage, 76 mm (3'1 diameter tube
XP3461B
14 To obtain a peak pulse current greater than that obtainable with d1v1der w A". 1t will be necessary to increase the 1nter-ctynode voltage progressively. Divider circuits "8" and "C· are examples of a progressive dividers. each giving a compromise
between gain. speed and linearity. Other dividers can be conceived to achieve other compromises. It is generally recommended that the voltage ratio between
successive stages 1s less than 2.
15 Measured with a pulse light source W1th a pulse duration (FWHM) below 1 µs with the cathOde completely 1llum1nated. The rise time iS determined belween 10% and 90% of the anode pulse amplitude. The signal transit time is measured between the instant at whieh the illuminating pulse of the cathode becomes maximum and the instant at which the anode pulse reaches its maximum. The rise time, pulse duration and transit time will vary wtth respect to the high tension suppjy voltage V"" aproxtmatety as
vh1 '2
.
16 The voltage corresponding to this maximum anode blue sens1t1v1ty ts equal to 1.2 times the voltage indicated on the test ticket of the tube.
17 A value less than 10 J.tA is recommended for applica
tions requiring good stability.
18 Minimum vaJue to obtain good collection 1n the input
optics.
19 When calculating the anocte voltage. the voltage drop across the load resistor should be taken into account.
20 For types with a plastic base. !his range of tempefllture is limited principally by stresses in !he sealing layer of the base to the glass bulb.
Appendix II
Specifications for the baseline Hamamatsu R2490-05
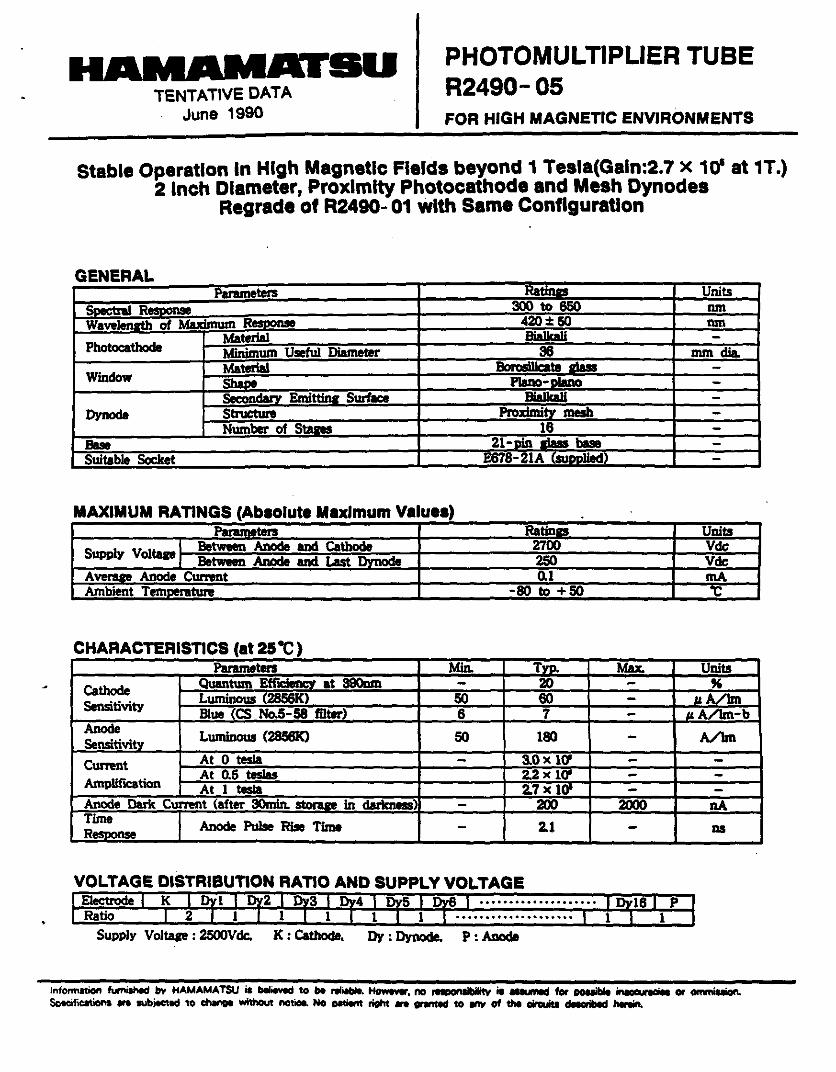
PHOTOMULTIPLIER TUBE R2490-05 FOR HIGH MAGNETIC ENVIRONMENTS
Stable Operation In High Magnetic Fields beyond 1Tesla(Galn:2.7x10' at 1T.) 2 Inch Diameter, Proximity Photocathode and Mesh Dynodes
Regrade of R2490- 01 with Same Configuration
GENERAL Parameters Ra+ln- Units
R 300 to 650 nm Wave,..,..,,. of Maximum R 420 :I: 50 nm
Material Bialkall -Photocathode Minimum Usetul Diameter 36 mm dia.
Material Borosillcatll ...... -Window Sha- Plano--- -Secon"•"' Emitttn• Sw1ace Bialkall -
Dynode Stnletutt Proximity mesh -Number of S••- 18 -
Bue 21-nln """"' base -Suitable Socket 8-21A 1--lied)
MAXIMUM RATINGS (Absolute Maximum Values) Parameters Ra tin- Uni ta
Supply Voltaae : Between Anode and Cathode 2700 Vdc:: Bei- Anode and Last ., 250 Vele
A-- Anode Current 0.1 mA Ambient Tent"""'~ -80 to +50 L:
CHARACTERISTICS (at 25 °C) Parameters Min. Tvn, Max. Unita
Cathode Quantum Effs--v at 390nm - 20 - " Sensitivity L (2856K) 50 60 - u.A/lm
Blue ccs No.5-58 mter> 6 7 - ,, A/lm-b Anode Luminous (2856K) 50 180 A/Im Sensitivitv -Current At 0 tesla - 3.0x 10' - -Ampllf'ication
At 0.5 teslas 2.2 )( 10' - -At 1 tesla 2.7 )( 10' - -
Anode Dark Current (after 30min. in darkness) - 200 2000 nA Time Anode Pulse Rise Time 2.1 R~nse - - ns
VOLTAGE DISTRIBUTION RATIO AND SUPPLY VOLTAGE I ~ I K I j1 I jz I js I j"' I js I I I ..... · ..... · ·....... I 51s I P Ratio I 2 1 1 1 1 1 .. .. .. • • • • • . •••• .• .. I 1 1
Supply Voltap: 2500Vdc, K: Cathode, Dy: l)ynode. p: Anode
lnfonnation furnilhld bY HA.MAMA.TSU is bllNved to be rtliable. Howww. no r8IDOMibilitY it auurNd for oouible ir'IOIM r1 '11 or °'''' illion. Scocificatieno .,. aubioclod to ""- without notioo. No - riOht .. onmod to .,,, of tho oinouitl d - -.
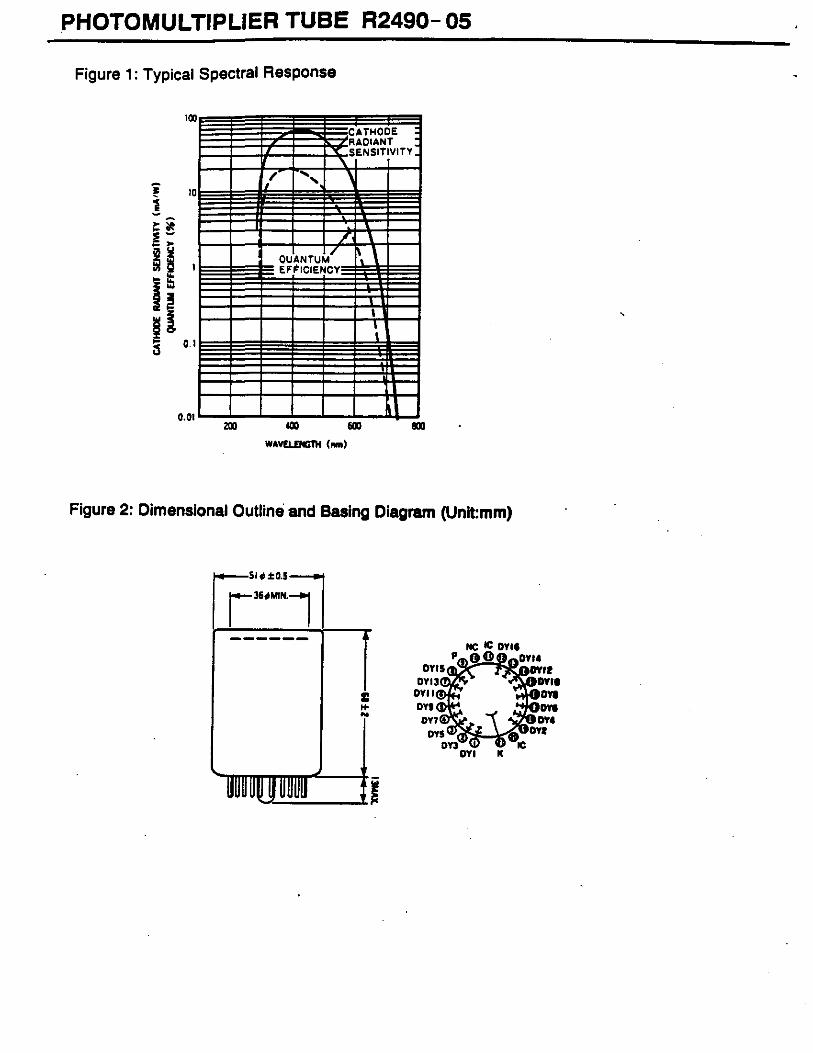
PHOTOMULTIPLIER TUBE R2490- 05
Figure 1: Typical Spectral Response
100 CATHOOE : RADIANT ..
I SENSITIVITY.
" / ..... , 1 10
• , \
OU AN TUM/ '. \ EFFICIENCY
• I
~
0.01 600 800
WAV£LDGTH (n111)
Figure 2: Dimensional Outline and Basing Diagram (Unlt:mm)
I: ... .. DYil
DYii DY9
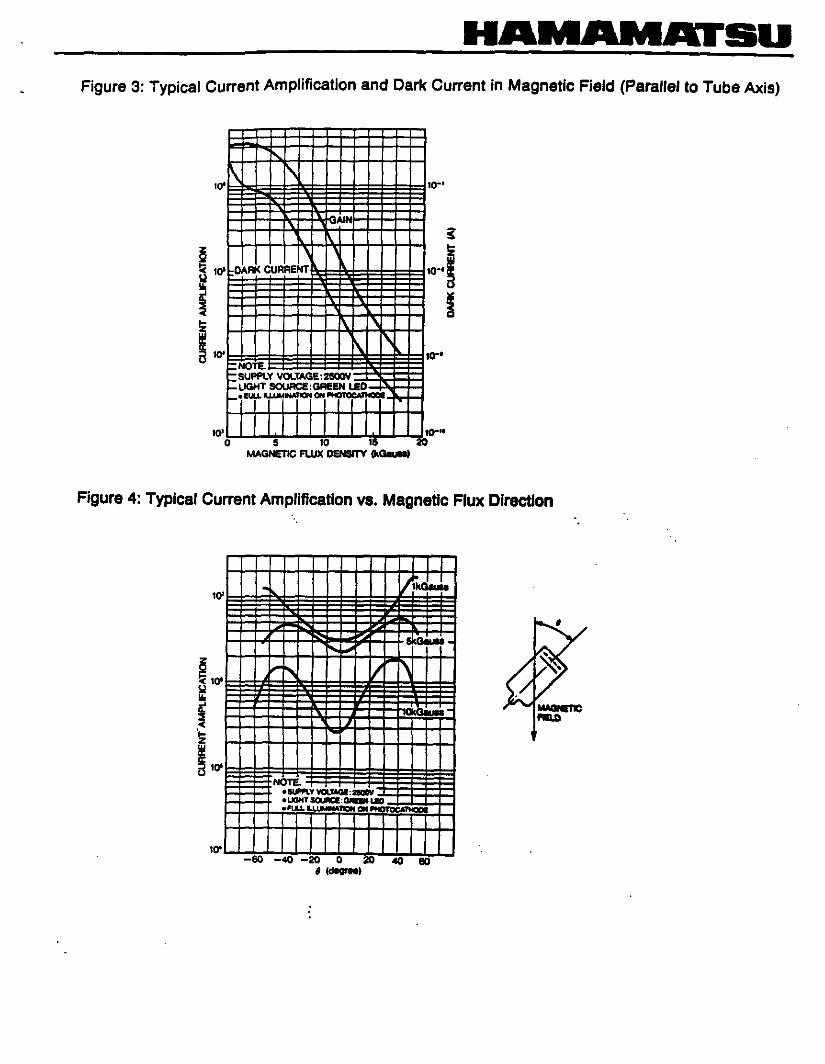
HAM"MAISU Figure 3: Typical Current Amplification and Dark Current in Magnetic Field (Parallel to Tube Axis)
. i
I ~·riDARKBCUiRRENT·-~~1 ... ' " ~ ·~ i.=NO 'E.
I\
~SUf'f»t..Y VO\..TAG£:25fXN .._LIGHT SOUACE:GAEEN LED 1-•EUU.11.U.MWATICWON~.""' t-
101 . 10'"" 0 5 w ~ ~
MAGNETIC FLUX DENSITY ~
Figure 4: Typical Current Amplification vs. Magnetic Flux Direction
I I
. /li.cW. ' i ' 10
. ' 5ko0uu • ... ~
i..- .... / " , .
•
' NOTE. • ...,,,.,,y VOU'AGl:2eaaV-
•LIGHT SCIURCI: C111111H LaD ' •l'l.U. LWtiMA1'ION ON~
·~ -60 -40 -~ 0 w 40 80
HAMAMAISU PRODUCT BULLETIW
PHOTOMULTIPLIER TUBE
R2490 •od~~~ed POil HIGH IWDl&TIC PIILD
HIGHER IIOIUJllTY TO NAGRTIC FllLD TRAii COllVlllTIOIAL 82490 2 llfal DIA., READ-Oii, SUPlll PIOlIKITY 111811 Dl!IODK
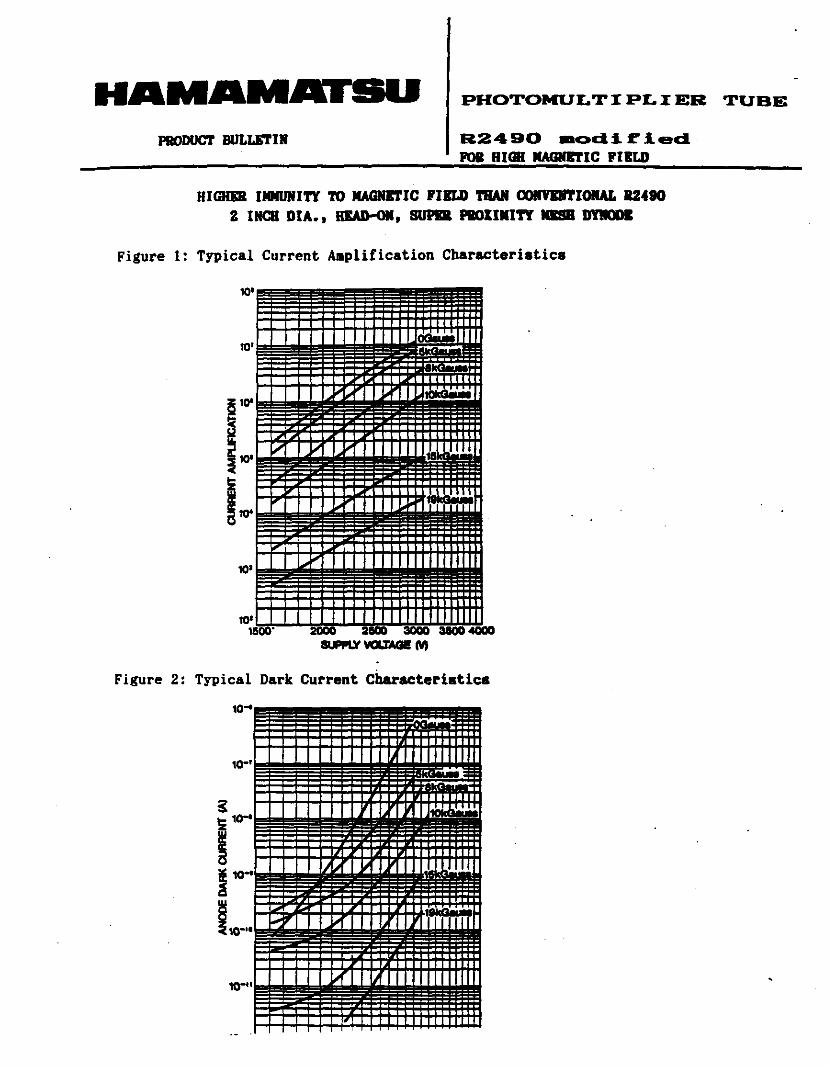
Figure 1: Typical Current Amplification Characteristics
Figure 2: Typical Dark Current Characteristics
PHOTOMULTIPLIER TUBE R2490 modified
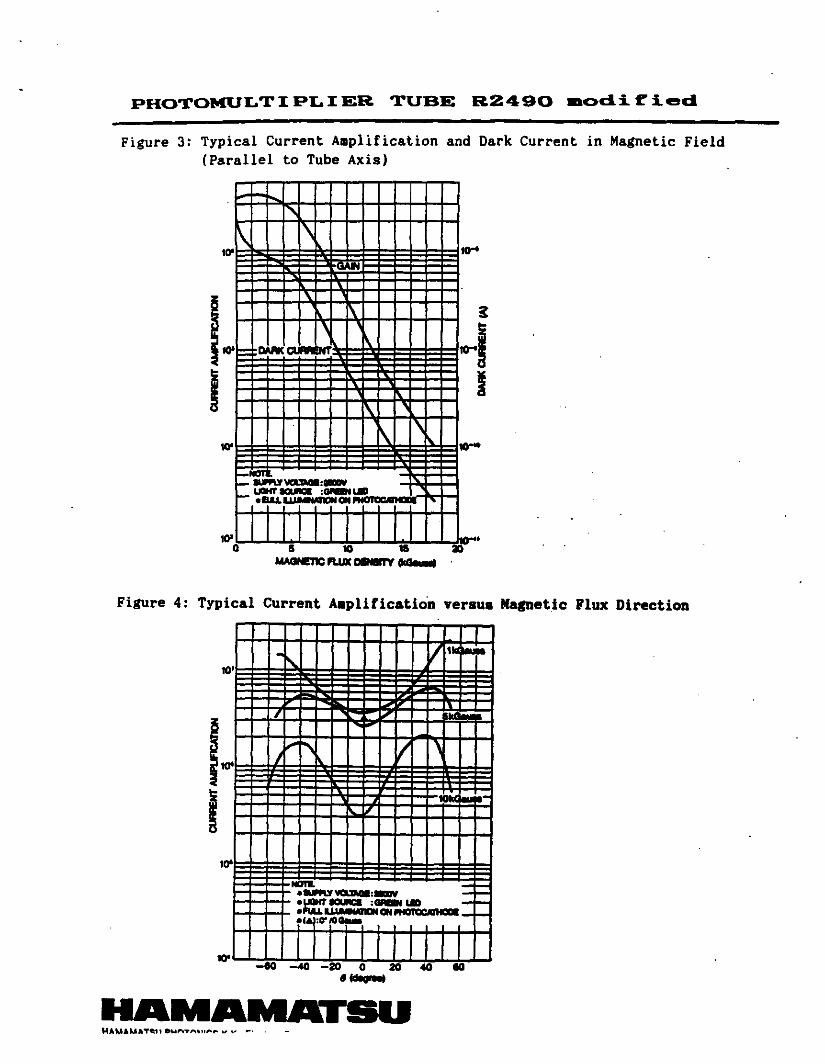
Figure 3: Typical Current Amplification and Dark Current in Magnetic Field (Parallel to Tube Axis)
....
,\ ' 10'
' • '\
' :::: DAMCl-1'
\
•
\
\ " -~ ~'VCl.lam:- • UCIHI'- ,_ .. ~ •81.L W'1NJ Ll'OI Cll .
10' Q
' '
.,... 2D
Figure 4: Typical Current Amplification versus Magnetic Flux Direction
~ I I• .. • ' 10 •
I
..... "'I / ' J l
IQ I
10'
....... - -•a.111.YWIJMll:-.V - -·~- ,__ --• .......... Cll~ 1'(.A. :D°fO°r*I I I I I 1- -
-eo - -20 Q 20 40 IO ...... HAMAMAIBU