Embed Size (px)
Citation preview
Össur hf.
Consolidated Financial Statements
31 December 2017
Össur hf.
Grjóthálsi 5
110 Reykjavík
Id-no. 560271-0189
Össur hf.
Consolidated Financial Statements
31 December 2017
Table of ContentsStatement by the Board of Directors and President and CEO 1
Independent Auditor’s Report 3
Consolidated Income Statement 6
Consolidated Statement of Comprehensive Income 7
Consolidated Balance Sheet 8
Consolidated Statements of Cash Flow 10
Consolidated Statement of Changes in Equity 11
Notes to the Consolidated Financial Statement 12
Statement by the Board of Directors and President and CEO
It is the opinion of the Board of Directors and the President and CEO of Össur hf. (the Company), that these ConsolidatedFinancial Statements present the necessary information to evaluate the financial position of the Company at year end, theoperating results for the year and financial developments during the year 2017. Össur Consolidated Financial Statements areprepared in accordance with International Financial Reporting Standards (IFRS) as adopted by the European Union and additionalDanish disclosure requirements for listed companies and additional requirements in the Icelandic Financial Statement Act no.3/2006.
Össur hf. designs, manufactures and sells orthopedic products specializing in prosthetics and bracing and supports solutions. TheCompany is headquartered in Iceland and the Company owns and operates subsidiaries in multiple countries around the world.The Company sells its products worldwide, but the principal market areas are North America and Europe.
A requirement to conclude on non-financial information has been made part of Icelandic law from 2016 as part of theimplementation of EU directive 2013/34/EU that became effective for Member States in 2017. It is the Board of Directors opinionthat necessary information to analyze the environmental, social and employee aspects of the business can be obtained byreviewing information in the Annual report to help provide fundamental understanding of the Company’s development,performance and position on non-financial matters. Össur joined the UN Global Compact in 2011 and signed the UN Women’sEmpowerment Principles in 2014. Annually Össur publishes a progress report, reporting on the progress of key projects in thefour categories set forth by the Global Compact; environmental concerns, labor practices, human rights and anti-corruption.Further information about Össur’s corporate social responsibilities (CSR) activities can be found in the Annual report and 2017progress report, available on the Company’s website: www.ossur.com/CSR.
The total sales of the Company amounted to USD 568.6 million (2016: USD 520.8 million) and increased by 9% from thepreceding year. Organic local currency sales growth was 5%. Net profit amounted to USD 57.7 million (2016: USD 51.0 million).Diluted Earnings per Share amounted to US cents 13.3 (2016: US cents 11.6). Earnings before interest, taxes, depreciation andamortization (EBITDA) amounted to USD 97.4 million (2016: USD 93.9 million).
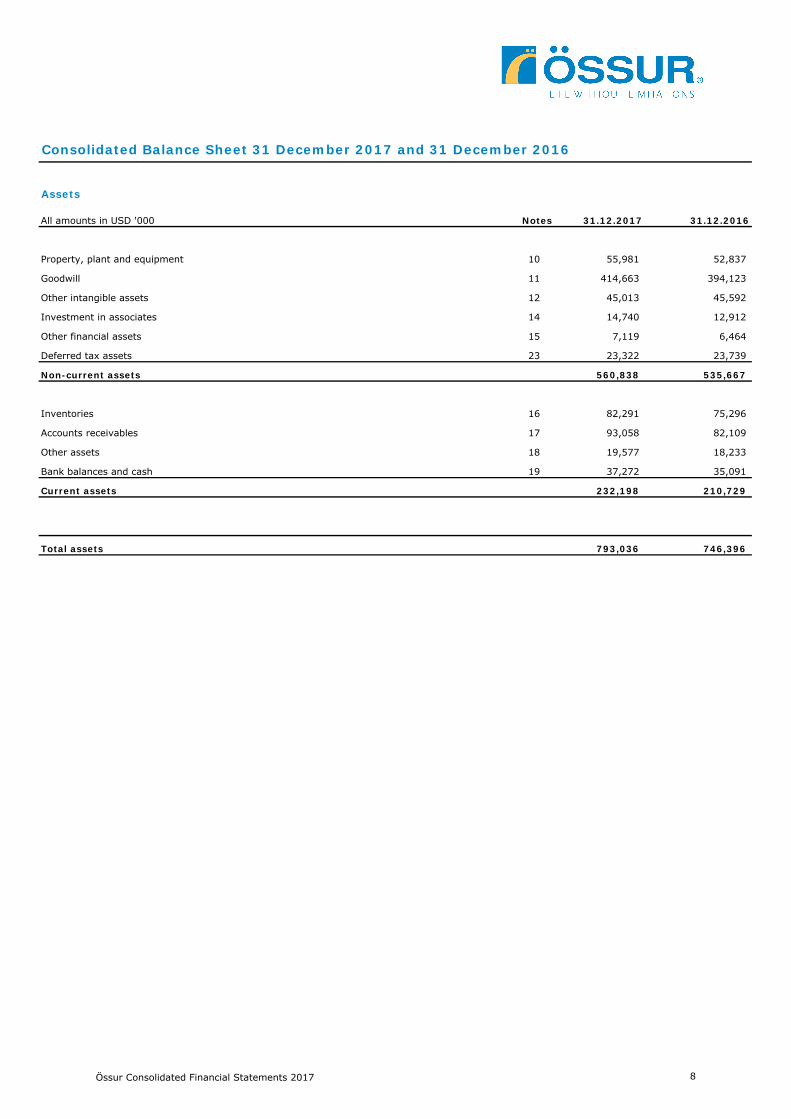
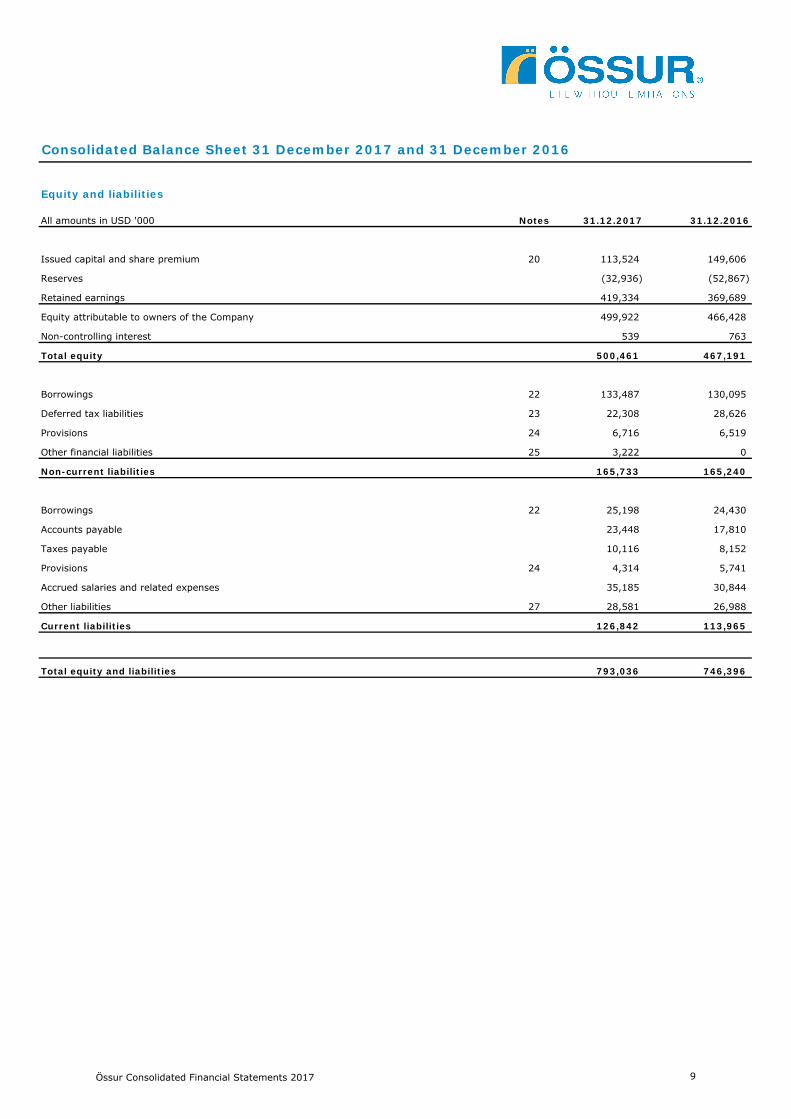
The total assets of the Company amounted to USD 793 million at year end, liabilities were USD 292.6 million and equity was USD500.4 million. The equity ratio at year end was 63%, same as in the preceding year.
The Company employed on average 2,948 employees in 2017 (2016: 2,710) and 2,990 at year end (2016: 2,799).
Össur is listed on the NASDAQ Copenhagen Stock Exchange. The market value of the Company at year end was USD 1,871million and the share price in DKK increased by 6% during the year. At year end, shareholders in Össur numbered 2,550compared to 4,014 at the beginning of the year. The decrease is due to the concentration of trading in Nasdaq Copenhagen whenabout 1,600 shareholders that held shares listed in Iceland were consolidated in the nominee account Clear Stream Banking. Theten largest shareholders and their ownership percentage are: William Demant Invest A/S - 47.6%, Clear Stream Banking -23.8%, JP Morgan Chase Bank - 5.6%, Arbejdsmarkedets Tillægspension (ATP) - 5.0%, Arion Bank - 3.3%, Landsbankinn Bank -3.1%, SEB Stockholm - 2.4%, Össur hf. - 2.1%, BNP Paritabs Securities Services - 0.7% and Deutsche Bank - 0.5%. WilliamDemant Invest A/S (WDI) ownership in Össur exceeded 50% in January 2018. According to WDI's announcement, their currentintention is to hold 50-60% of Össur’s shares going forward and WDI has no intention of taking over Össur or delisting Össur’sshares from Nasdaq Copenhagen. Furthermore, WDI has no intention of making changes to Össur’s strategy, management, oroperations.
A “Safe Harbor” share buyback program initiated on Nasdaq Copenhagen on 1 December 2016 ended on 14 August 2017. Össuracquired in total 2,159,883 shares under the program at the average price of DKK 29.26. On 15 August 2017 Össur initiated anew share buy-back program. The program is managed by Nordea, which make its trading decisions independently and withoutinfluence by the Company regarding the timing of the purchases. Transactions do not require clearance from the complianceofficer and can be made at any time. The Company’s purchases under the program are announced every Monday for the previousweek. At yearend Össur had acquired 963,054 shares under the program. The purpose of the program is to reduce theCompany’s share capital and adjust the capital structure by distributing capital to shareholders in line with the Company's CapitalStructure and Dividend Policy in addition to being able to meet the Company's share option obligations. There were no shareoptions contracts exercised during the year.
Össur Consolidated Financial Statements 2017 1
Statement by the Board of Directors and President and CEO
Reykjavík, 5 February 2018
Board of Directors
Niels JacobsenChairman of the Board
Arne Boye Nielsen Kristján T. Ragnarsson
Guðbjörg Edda Eggertsdóttir Svafa Grönfeldt
President and CEO
Jón Sigurðsson
In its procedures, the Board of Directors complies with the Articles of Association of the Company, the Board of Directors' Rules ofProcedure and follows the Danish Recommendations for Corporate Governance issued by the Danish Committee on CorporateGovernance. The Rules of Procedure address issues such as allocation of responsibilities and power of decision within the Board,independency issues, confidentiality etc. An Audit Committee is present within the Board. The Board of Directors is composed offive members elected at each Annual General Meeting for a term of one year. The Board of Directors consists of two women andthree men and therefore complies with Icelandic law on gender ratio which came in effect on the 1st of September 2013. NoÖssur employee sits on the Board of Directors.
The Board of Directors will propose to the Annual General Meeting in 2018 that the Company pays a cash dividend of DKK 0.13per share for 2017, corresponding to approx. USD 9.1 million or 16% of net profit in 2017. Regarding changes in the equity of theCompany, the Board refers to the Notes attached to the Consolidated Financial Statements. The Board of Directors will propose tothe Annual General Meeting in 2018 to reduce the share capital by ISK 6,354,662 by way of cancelling 6,354,662 of Össur’s ownshares of ISK 1 nominal value each. If the Annual General Meeting approves the motion, the number of outstanding shares willbe 430,808,063.
The Board of Directors and President and CEO of Össur hf. hereby confirm the Consolidated Financial Statements of Össur for theyear 2017 with their signatures.
Össur Consolidated Financial Statements 2017 2
Independent Auditor‘s Report
To the Shareholders of Össur hf.
OpinionWe have audited the Consolidated Financial Statements of Össur hf. and its subsidiaries (the Company), which comprise theConsolidated Balance Sheet as at December 31, 2017, the Consolidated Income Statement, the Consolidated Statement ofComprehensive Income, the Consolidated Statement of Cash Flow, the Consolidated Statement of Changes in Equity for the year thenended, and the Notes to the Consolidated Financial Statements, including a summary of significant accounting policies.
In our opinion, the accompanying Consolidated Financial Statements give a true and fair view of the Company's financial position atDecember 31, 2017, and its consolidated financial performance and its consolidated cash flows for the year then ended in accordancewith International Financial Reporting Standards (IFRSs) as adopted by the European Union, additional Danish disclosurerequirements for listed companies and additional requirements in the Icelandic Financial Statement act no. 3/2006.
Basis for Opinion We conducted our audit in accordance with International Standards on Auditing (ISAs). Our responsibilities under those standards arefurther described in the Auditor’s Responsibilities for the Audit of the Consolidated Financial Statements section of our report. We areindependent of the Group in accordance with the International Ethics Standards Board for Accountants’ Code of Ethics for ProfessionalAccountants (IESBA Code) and Icelandic Institute of State Authorized Public Accountants, Code of Ethics (FLE) and we have fulfilledour other ethical responsibilities in accordance with the IESBA and the FLE Code. We believe that the audit evidence we haveobtained is sufficient and appropriate to provide a basis for our opinion.
Key Audit Matters Key audit matters are those matters that, in our professional judgment, were of most significance in our audit of the ConsolidatedFinancial Statements of the current period. These matters were addressed in the context of our audit of the Consolidated FinancialStatements as a whole, and in forming our opinion thereon, and we do not provide a separate opinion on these matters.
Impairment of goodwill and other indefinite useful life intangible assetsBook value of goodwill and other indefinite useful life intangible assets at year end amounted to USD 414.7 million. The current yearincrease in the goodwill balance is USD 20.5 million, primarily due to change in purchase price allocation that was provisionallyfinalized in 2016 and net exchange rate difference.
The management consider that each geographical segment constitutes its own cash generating unit (‘CGU’).
The key assumptions applied by the managements in the impairment reviews are: segment specific discount rates; — future revenuegrowth; and — expected future margins. Determining whether the carrying value of goodwill and intangible assets is recoverablerequires management to make significant estimates regarding the future cash flows, discount rates and long-term growth rates basedon management’s view of future business prospects. Determining whether the carrying value of goodwill and intangible assets isrecoverable requires management to make significant estimates regarding the future cash flows, discount rates and long-term growthrates based on management’s view of future business prospects.
Due to the relative sensitivity of certain inputs to the impairment testing process, in particular the future cash flows of the CGUsnoted above, the valuation of goodwill and other indefinite intangible assets is considered a key audit matter.
In order to address this key audit, matter we audited the assumptions used in the impairment model for goodwill and other indefiniteuseful life intangible assets. As part of our work, we engaged our internal specialists to assist with:
• Critically evaluating whether the model used by management to calculate the value in use of the individual Cash Generating Units(CGU’s) complies with the requirements of IAS 36 Impairment of Assets;• Validating the assumptions used to calculate the discount rates and recalculating these rates;• Considering the projected future cash flows, understood variances between the forecast and actual results for the year ended 31December 2017 and compared the forecast growth trends to historic trends;• Comparing the long-term growth rates for each CGU to external market data;• Access the appropriateness of the sensitivities applied by management to the impairment testing model including consideringwhether the scenarios represented reasonably possible changes in key assumptions. Performed further sensitivities based on recenttrading activity and our understanding of the future prospects to identify whether these scenarios could give rise to furtherimpairment; and• Analysing the future projected cash flows used in the models to determine whether they are reasonable and supportable given thecurrent macroeconomic climate and expected future performance of the CGU’s.
We also reviewed the disclosures presented in note 11 to the Consolidated Financial Statements to confirm compliance with therequirements within IAS 36.
Össur Consolidated Financial Statements 2017 3
Independent Auditor‘s Report
Other informationManagement is responsible for other information. Other information comprises the Company announcement for Q4 and full year result2017 as well as Statement by the Board of Directors and President and CEO. Our opinion on the Consolidated Financial Statementsdoes not cover the other information and we do not express any form of assurance conclusion thereon except the confirmationregarding Statement of Board of Director and President and CEO as stated below.
In connection with our audit of the Consolidated Financial Statements, our responsibility is to read the other information and, in doingso, consider whether the other information is materially inconsistent with the Consolidated Financial Statements or our knowledgeobtained in the audit or otherwise appears to be materially misstated. If, based on the work we have performed, we conclude thatthere is a material misstatement of this other information, we are required to report that fact. We have nothing to report in thisregard.
In accordance with Paragraph 2 article 104 of the Icelandic Financial Statement act no. 3/2006, we confirm to the best of ourknowledge that the accompanying report of the Board of Directors and President and CEO includes all information required by theIcelandic Financial Statement Act that is not disclosed elsewhere in the Consolidated Financial Statements.
Responsibilities of management and those charged with governance for the Consolidated Financial Statements Management is responsible for the preparation and fair presentation of the Consolidated Financial Statements in accordance with IFRSas adopted by the European Union, additional Danish disclosure requirements for listed companies and additional requirements in theIcelandic Financial Statement act no. 3/2006, and for such internal control as management determines is necessary to enable thepreparation of Consolidated Financial Statements that are free from material misstatement, whether due to fraud or error.
In preparing the Consolidated Financial Statements, management is responsible for assessing the Group’s ability to continue as agoing concern, disclosing, as applicable, matters related to going concern and using the going concern basis of accounting unlessmanagement either intends to liquidate the Group or to cease operations, or has no realistic alternative but to do so.
Those charged with governance are responsible for overseeing the Group’s financial reporting process.
Auditor’s responsibilities for the audit of the Consolidated Financial Statements Our objectives are to obtain reasonable assurance about whether the Consolidated Financial Statements as a whole are free frommaterial misstatement, whether due to fraud or error, and to issue an auditor’s report that includes our opinion. Reasonableassurance is a high level of assurance, but is not a guarantee that an audit conducted in accordance with ISAs will always detect amaterial misstatement when it exists. Misstatements can arise from fraud or error and are considered material if, individually or inthe aggregate, they could reasonably be expected to influence the economic decisions of users taken on the basis of theseConsolidated Financial Statements.
As part of an audit in accordance with ISAs, we exercise professional judgment and maintain professional scepticism throughout theaudit. We also:
• Identify and assess the risks of material misstatement of the Consolidated Financial Statements, whether due to fraud or error,design and perform audit procedures responsive to those risks, and obtain audit evidence that is sufficient and appropriate to providea basis for our opinion. The risk of not detecting a material misstatement resulting from fraud is higher than for one resulting fromerror, as fraud may involve collusion, forgery, intentional omissions, misrepresentations, or the override of internal control.• Obtain an understanding of internal control relevant to the audit in order to design audit procedures that are appropriate in thecircumstances, but not for the purpose of expressing an opinion on the effectiveness of the Company’s internal control.• Evaluate the appropriateness of accounting policies used and the reasonableness of accounting estimates and related disclosuresmade by management.• Conclude on the appropriateness of management’s use of the going concern basis of accounting and, based on the audit evidenceobtained, whether a material uncertainty exists related to events or conditions that may cast significant doubt on the Company’sability to continue as a going concern. If we conclude that a material uncertainty exists, we are required to draw attention in ourauditor’s report to the related disclosures in the Consolidated Financial Statements or, if such disclosures are inadequate, to modifyour opinion. Our conclusions are based on the audit evidence obtained up to the date of our auditor’s report. However, future eventsor conditions may cause the Company to cease to continue as a going concern.• Evaluate the overall presentation, structure and content of the Consolidated Financial Statements, including the disclosures, andwhether the Consolidated Financial Statements represent the underlying transactions and events in a manner that achieves fairpresentation.• Obtain sufficient appropriate audit evidence regarding the financial information of the entities or business activities within theCompany to express an opinion on the Consolidated Financial Statements. We are responsible for the direction, supervision andperformance of the Company audit. We remain solely responsible for our audit opinion.
Össur Consolidated Financial Statements 2017 4
Independent Auditor‘s Report
Deloitte ehf.
Þorsteinn Pétur Guðjónsson Signý Magnúsdóttir
State Authorized Public Accountant State Authorized Public Accountant
We communicate with those charged with governance regarding, among other matters, the planned scope and timing of the audit andsignificant audit findings, including any significant deficiencies in internal control that we identify during our audit.
We also provide those charged with governance with a statement that we have complied with relevant ethical requirements regardingindependence, and to communicate with them all relationships and other matters that may reasonably be thought to bear on ourindependence, and where applicable, related safeguards.
From the matters communicated with those charged with governance, we determine those matters that were of most significance inthe audit of the Consolidated Financial Statements of the current period and are therefore the key audit matters. We describe thesematters in our auditor’s report unless law or regulation precludes public disclosure about the matter or when, in extremely rarecircumstances, we determine that a matter should not be communicated in our report because the adverse consequences of doing sowould reasonably be expected to outweigh the public interest benefits of such communication.
Kópavogur, 5 February 2018
Össur Consolidated Financial Statements 2017 5
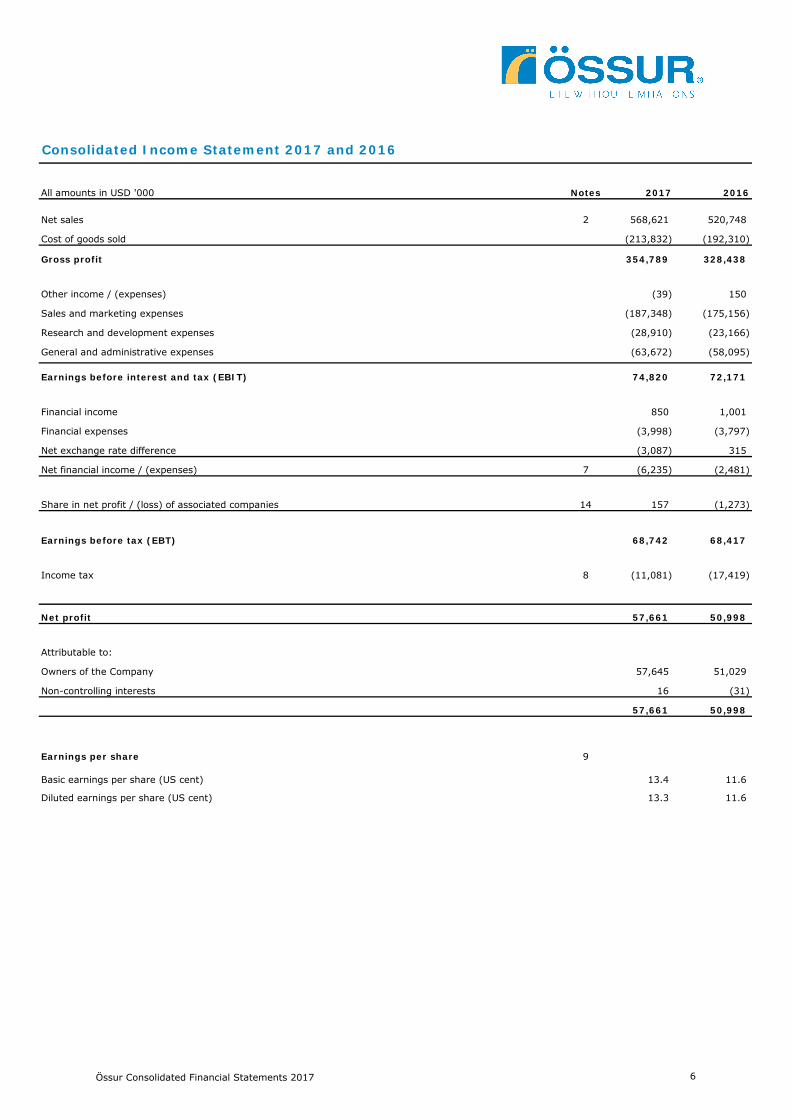
All amounts in USD '000 Notes 2017 2016
2 568,621 520,748
(213,832) (192,310)
Gross profit 354,789 328,438
(39) 150
(187,348) (175,156)
(28,910) (23,166)
(63,672) (58,095)
Earnings before interest and tax (EBIT) 74,820 72,171
850 1,001
(3,998) (3,797)
(3,087) 315
7 (6,235) (2,481)
14 157 (1,273)
Earnings before tax (EBT) 68,742 68,417
8 (11,081) (17,419)
Net profit 57,661 50,998
Attributable to:
57,645 51,029
16 (31)
57,661 50,998
Earnings per share 9
13.4 11.6
13.3 11.6
Net sales
Consolidated Income Statement 2017 and 2016
Owners of the Company
Non-controlling interests
Basic earnings per share (US cent)
Share in net profit / (loss) of associated companies
Net financial income / (expenses)
Diluted earnings per share (US cent)
Income tax
Cost of goods sold
Other income / (expenses)
Sales and marketing expenses
Research and development expenses
General and administrative expenses
Financial income
Financial expenses
Net exchange rate difference
Össur Consolidated Financial Statements 2017 6

All amounts in USD '000 Notes 2017 2016
Net profit 57,661 50,998
Items that may be reclassified subsequently to profit or loss:
(801) 44
18,470 (12,028)
847 314
18,516 (11,670)
Total comprehensive income 76,177 39,328
Attributable to:
76,161 39,359
16 (31)
76,177 39,328
Consolidated Statement of Comprehensive Income 2017 and 2016
Exchange differences on translating foreign operations
Change in cash flow hedges
of other comprehensive income
Other comprehensive income, net of income tax
Owners of the Company
Non-controlling interests
Income tax relating to components
Össur Consolidated Financial Statements 2017 7
Consolidated Balance Sheet 31 December 2017 and 31 December 2016
Assets
All amounts in USD '000 Notes 31.12.2017 31.12.2016
10 55,981 52,837
11 414,663 394,123
12 45,013 45,592
Investment in associates 14 14,740 12,912
15 7,119 6,464
23 23,322 23,739
Non-current assets 560,838 535,667
16 82,291 75,296
17 93,058 82,109
18 19,577 18,233
19 37,272 35,091
Current assets 232,198 210,729
Total assets 793,036 746,396
Property, plant and equipment
Goodwill
Other intangible assets
Other financial assets
Deferred tax assets
Inventories
Accounts receivables
Other assets
Bank balances and cash
Össur Consolidated Financial Statements 2017 8
Consolidated Balance Sheet 31 December 2017 and 31 December 2016
Equity and liabilities
All amounts in USD '000 Notes 31.12.2017 31.12.2016
20 113,524 149,606
(32,936) (52,867)
419,334 369,689
Equity attributable to owners of the Company 499,922 466,428
539 763
Total equity 500,461 467,191
22 133,487 130,095
23 22,308 28,626
24 6,716 6,519
25 3,222 0
Non-current liabilities 165,733 165,240
22 25,198 24,430
23,448 17,810
10,116 8,152
24 4,314 5,741
35,185 30,844
27 28,581 26,988
Current liabilities 126,842 113,965
Total equity and liabilities 793,036 746,396
Other liabilities
Retained earnings
Non-controlling interest
Borrowings
Deferred tax liabilities
Provisions
Other financial liabilities
Borrowings
Accounts payable
Taxes payable
Provisions
Accrued salaries and related expenses
Reserves
Issued capital and share premium
Össur Consolidated Financial Statements 2017 9
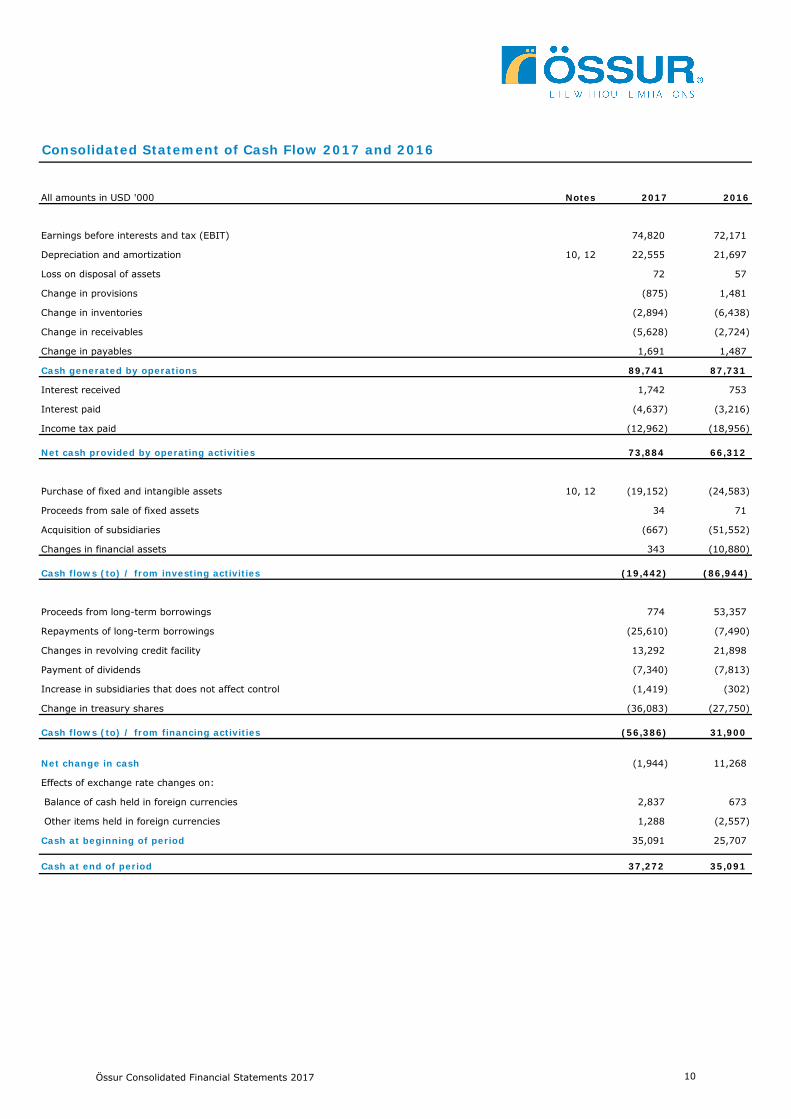
All amounts in USD '000 Notes 2017 2016
74,820 72,171
10, 12 22,555 21,697
72 57
(875) 1,481
(2,894) (6,438)
(5,628) (2,724)
1,691 1,487
Cash generated by operations 89,741 87,731
1,742 753
(4,637) (3,216)
(12,962) (18,956)
Net cash provided by operating activities 73,884 66,312
10, 12 (19,152) (24,583)
34 71
(667) (51,552)
343 (10,880)
Cash flows (to) / from investing activities (19,442) (86,944)
774 53,357
(25,610) (7,490)
13,292 21,898
(7,340) (7,813)
Increase in subsidiaries that does not affect control (1,419) (302)
(36,083) (27,750)
Cash flows (to) / from financing activities (56,386) 31,900
(1,944) 11,268
2,837 673
1,288 (2,557)
35,091 25,707
Cash at end of period 37,272 35,091
Consolidated Statement of Cash Flow 2017 and 2016
Changes in revolving credit facility
Changes in financial assets
Interest paid
Income tax paid
Purchase of fixed and intangible assets
Proceeds from sale of fixed assets
Acquisition of subsidiaries
Interest received
Earnings before interests and tax (EBIT)
Depreciation and amortization
Loss on disposal of assets
Change in provisions
Change in payables
Change in inventories
Change in receivables
Effects of exchange rate changes on:
Balance of cash held in foreign currencies
Proceeds from long-term borrowings
Repayments of long-term borrowings
Payment of dividends
Change in treasury shares
Other items held in foreign currencies
Cash at beginning of period
Net change in cash
Össur Consolidated Financial Statements 2017 10
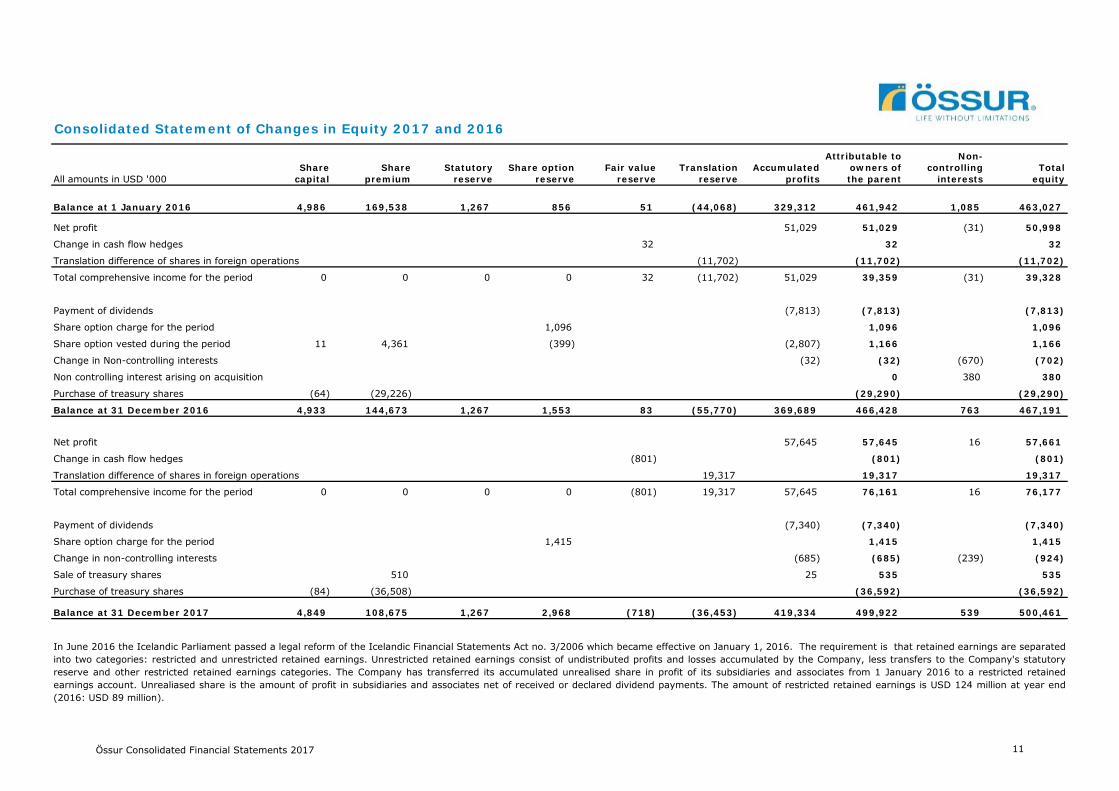
Consolidated Statement of Changes in Equity 2017 and 2016
Attributable to Non-Share Share Statutory Share option Fair value Translation Accumulated owners of controlling Total
All amounts in USD '000 capital premium reserve reserve reserve reserve profits the parent interests equity
Balance at 1 January 2016 4,986 169,538 1,267 856 51 (44,068) 329,312 461,942 1,085 463,027
Net profit 51,029 51,029 (31) 50,998
Change in cash flow hedges 32 32 32
Translation difference of shares in foreign operations (11,702) (11,702) (11,702)
Total comprehensive income for the period 0 0 0 0 32 (11,702) 51,029 39,359 (31) 39,328
Payment of dividends (7,813) (7,813) (0) (7,813)
Share option charge for the period 1,096 1,096 1,096
Share option vested during the period 11 4,361 (399) (2,807) 1,166 1,166
Change in Non-controlling interests (32) (32) (670) (702)
Non controlling interest arising on acquisition 0 380 380
Purchase of treasury shares (64) (29,226) (29,290) (29,290)
Balance at 31 December 2016 4,933 144,673 1,267 1,553 83 (55,770) 369,689 466,428 763 467,191
Net profit 57,645 57,645 16 57,661
Change in cash flow hedges (801) (801) (801)
Translation difference of shares in foreign operations 19,317 19,317 19,317
Total comprehensive income for the period 0 0 0 0 (801) 19,317 57,645 76,161 16 76,177
Payment of dividends (7,340) (7,340) 0 (7,340)
Share option charge for the period 1,415 1,415 1,415
Change in non-controlling interests (685) (685) (239) (924)
Sale of treasury shares 510 25 535 535
Purchase of treasury shares (84) (36,508) (36,592) (36,592)
Balance at 31 December 2017 4,849 108,675 1,267 2,968 (718) (36,453) 419,334 499,922 539 500,461
In June 2016 the Icelandic Parliament passed a legal reform of the Icelandic Financial Statements Act no. 3/2006 which became effective on January 1, 2016. The requirement is that retained earnings are separatedinto two categories: restricted and unrestricted retained earnings. Unrestricted retained earnings consist of undistributed profits and losses accumulated by the Company, less transfers to the Company's statutoryreserve and other restricted retained earnings categories. The Company has transferred its accumulated unrealised share in profit of its subsidiaries and associates from 1 January 2016 to a restricted retainedearnings account. Unrealiased share is the amount of profit in subsidiaries and associates net of received or declared dividend payments. The amount of restricted retained earnings is USD 124 million at year end(2016: USD 89 million).
Össur Consolidated Financial Statements 2017 11
Notes to the Consolidated Financial Statements
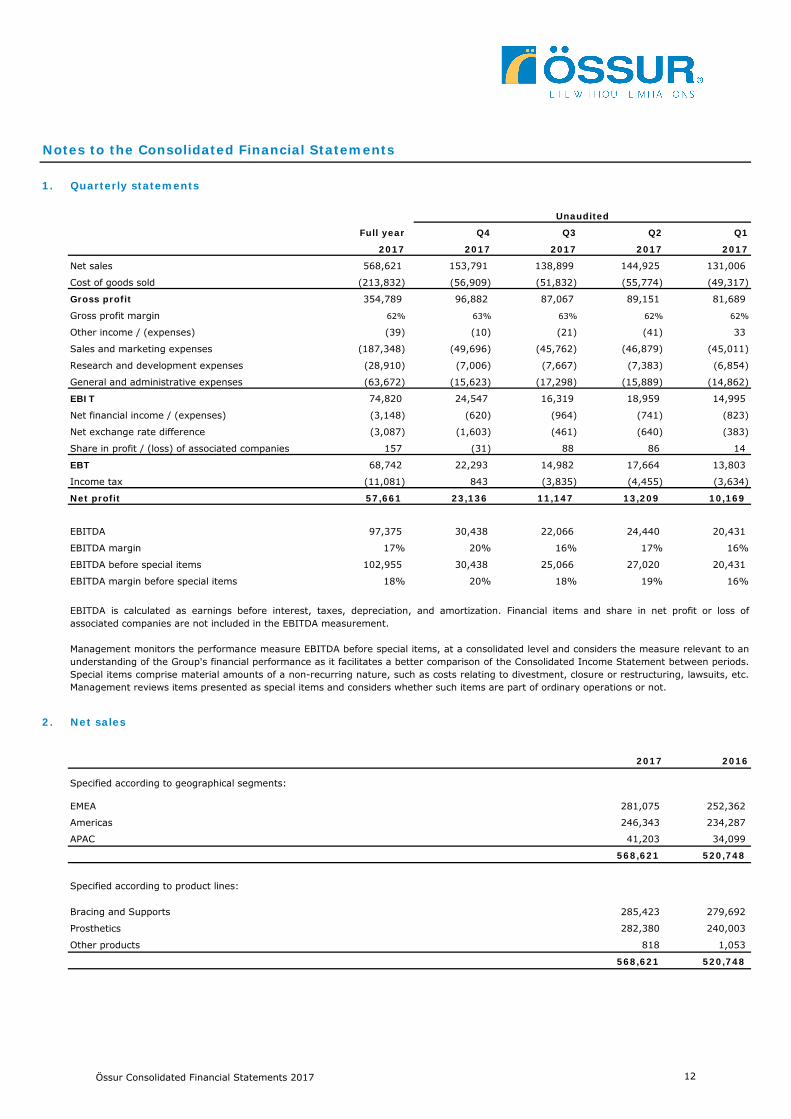
1. Quarterly statements
Unaudited
Full year Q4 Q3 Q2 Q1
2017 2017 2017 2017 2017
Net sales 568,621 153,791 138,899 144,925 131,006
Cost of goods sold (213,832) (56,909) (51,832) (55,774) (49,317)
Gross profit 354,789 96,882 87,067 89,151 81,689
Gross profit margin 62% 63% 63% 62% 62%
Other income / (expenses) (39) (10) (21) (41) 33
Sales and marketing expenses (187,348) (49,696) (45,762) (46,879) (45,011)
Research and development expenses (28,910) (7,006) (7,667) (7,383) (6,854)
General and administrative expenses (63,672) (15,623) (17,298) (15,889) (14,862)
EBIT 74,820 24,547 16,319 18,959 14,995
Net financial income / (expenses) (3,148) (620) (964) (741) (823)
Net exchange rate difference (3,087) (1,603) (461) (640) (383)
Share in profit / (loss) of associated companies 157 (31) 88 86 14
EBT 68,742 22,293 14,982 17,664 13,803
Income tax (11,081) 843 (3,835) (4,455) (3,634)
Net profit 57,661 23,136 11,147 13,209 10,169
EBITDA 97,375 30,438 22,066 24,440 20,431
EBITDA margin 17% 20% 16% 17% 16%
EBITDA before special items 102,955 30,438 25,066 27,020 20,431
EBITDA margin before special items 18% 20% 18% 19% 16%
2. Net sales
2017 2016
EMEA 281,075 252,362
Americas 246,343 234,287
APAC 41,203 34,099
568,621 520,748
Bracing and Supports 285,423 279,692
Prosthetics 282,380 240,003
Other products 818 1,053
568,621 520,748
Specified according to product lines:
Specified according to geographical segments:
EBITDA is calculated as earnings before interest, taxes, depreciation, and amortization. Financial items and share in net profit or loss ofassociated companies are not included in the EBITDA measurement.
Management monitors the performance measure EBITDA before special items, at a consolidated level and considers the measure relevant to anunderstanding of the Group's financial performance as it facilitates a better comparison of the Consolidated Income Statement between periods.Special items comprise material amounts of a non-recurring nature, such as costs relating to divestment, closure or restructuring, lawsuits, etc.Management reviews items presented as special items and considers whether such items are part of ordinary operations or not.
Össur Consolidated Financial Statements 2017 12
Notes to the Consolidated Financial Statements
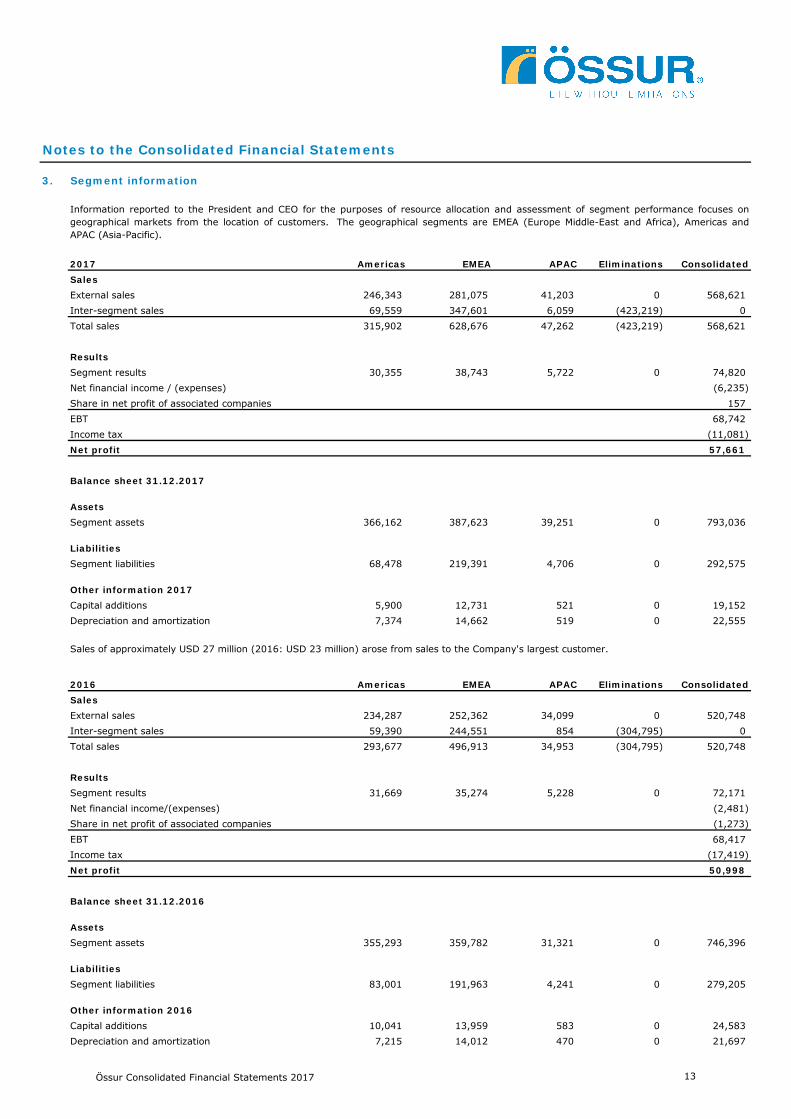
3. Segment information
2017 Americas EMEA APAC Eliminations ConsolidatedSalesExternal sales 246,343 281,075 41,203 0 568,621 Inter-segment sales 69,559 347,601 6,059 (423,219) 0 Total sales 315,902 628,676 47,262 (423,219) 568,621
ResultsSegment results 30,355 38,743 5,722 0 74,820 Net financial income / (expenses) (6,235)Share in net profit of associated companies 157 EBT 68,742 Income tax (11,081)Net profit 57,661
Balance sheet 31.12.2017
AssetsSegment assets 366,162 387,623 39,251 0 793,036
LiabilitiesSegment liabilities 68,478 219,391 4,706 0 292,575
Other information 2017Capital additions 5,900 12,731 521 0 19,152 Depreciation and amortization 7,374 14,662 519 0 22,555
2016 Americas EMEA APAC Eliminations ConsolidatedSales
234,287 252,362 34,099 0 520,748 59,390 244,551 854 (304,795) 0
293,677 496,913 34,953 (304,795) 520,748
Results31,669 35,274 5,228 0 72,171
(2,481)(1,273)68,417
(17,419)50,998
Balance sheet 31.12.2016
Assets355,293 359,782 31,321 0 746,396
Liabilities83,001 191,963 4,241 0 279,205
Other information 201610,041 13,959 583 0 24,583 7,215 14,012 470 0 21,697
Net profit
Segment liabilities
Capital additionsDepreciation and amortization
Segment assets
Information reported to the President and CEO for the purposes of resource allocation and assessment of segment performance focuses ongeographical markets from the location of customers. The geographical segments are EMEA (Europe Middle-East and Africa), Americas andAPAC (Asia-Pacific).
External salesInter-segment salesTotal sales
Segment resultsNet financial income/(expenses)
Sales of approximately USD 27 million (2016: USD 23 million) arose from sales to the Company's largest customer.
Share in net profit of associated companiesEBTIncome tax
Össur Consolidated Financial Statements 2017 13
Notes to the Consolidated Financial Statements
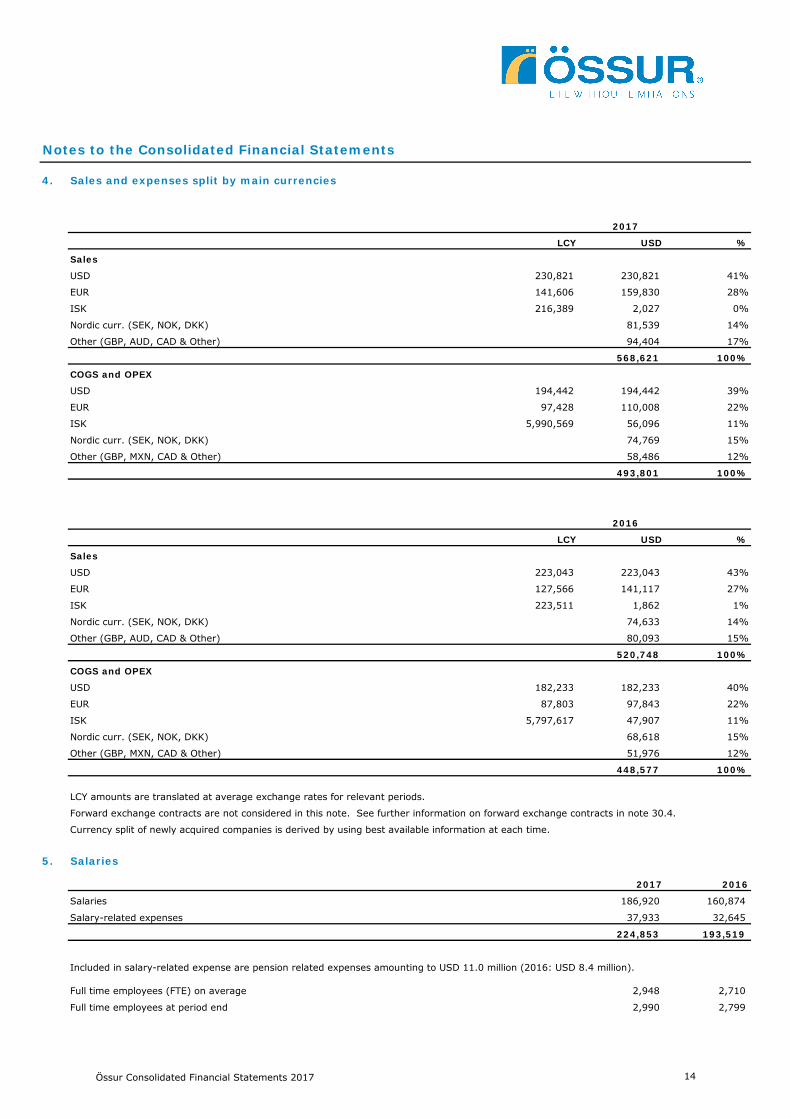
4. Sales and expenses split by main currencies
LCY USD %
Sales
USD 230,821 230,821 41%
EUR 141,606 159,830 28%
ISK 216,389 2,027 0%
Nordic curr. (SEK, NOK, DKK) 81,539 14%
Other (GBP, AUD, CAD & Other) 94,404 17%
568,621 100%
COGS and OPEX
USD 194,442 194,442 39%
EUR 97,428 110,008 22%
ISK 5,990,569 56,096 11%
Nordic curr. (SEK, NOK, DKK) 74,769 15%
Other (GBP, MXN, CAD & Other) 58,486 12%
493,801 100%
LCY USD %
Sales
USD 223,043 223,043 43%
EUR 127,566 141,117 27%
ISK 223,511 1,862 1%
Nordic curr. (SEK, NOK, DKK) 74,633 14%
Other (GBP, AUD, CAD & Other) 80,093 15%
520,748 100%
COGS and OPEX
USD 182,233 182,233 40%
EUR 87,803 97,843 22%
ISK 5,797,617 47,907 11%
Nordic curr. (SEK, NOK, DKK) 68,618 15%
Other (GBP, MXN, CAD & Other) 51,976 12%
448,577 100%
LCY amounts are translated at average exchange rates for relevant periods.
Forward exchange contracts are not considered in this note. See further information on forward exchange contracts in note 30.4.
Currency split of newly acquired companies is derived by using best available information at each time.
5. Salaries
2017 2016
Salaries 186,920 160,874
Salary-related expenses 37,933 32,645
224,853 193,519
Included in salary-related expense are pension related expenses amounting to USD 11.0 million (2016: USD 8.4 million).
Full time employees (FTE) on average 2,948 2,710
Full time employees at period end 2,990 2,799
2017
2016
Össur Consolidated Financial Statements 2017 14
Notes to the Consolidated Financial Statements
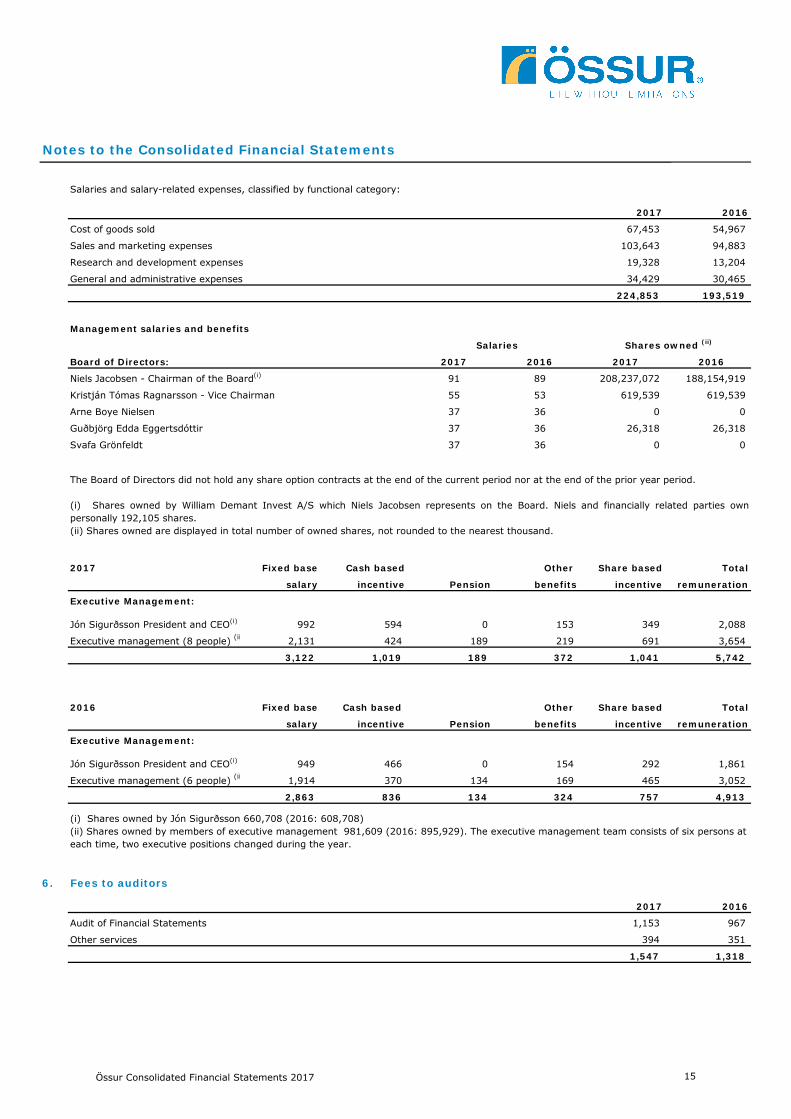
Salaries and salary-related expenses, classified by functional category:
2017 2016
Cost of goods sold 67,453 54,967
Sales and marketing expenses 103,643 94,883
Research and development expenses 19,328 13,204
General and administrative expenses 34,429 30,465
224,853 193,519
Management salaries and benefits
Board of Directors: 2017 2016 2017 2016
Niels Jacobsen - Chairman of the Board(i) 91 89 208,237,072 188,154,919
Kristján Tómas Ragnarsson - Vice Chairman 55 53 619,539 619,539
Arne Boye Nielsen 37 36 0 0
Guðbjörg Edda Eggertsdóttir 37 36 26,318 26,318
Svafa Grönfeldt 37 36 0 0
2017 Fixed base Cash based Other Share based Total
salary incentive Pension benefits incentive remuneration
Executive Management:
Jón Sigurðsson President and CEO(i) 992 594 0 153 349 2,088
Executive management (8 people) (ii 2,131 424 189 219 691 3,654
3,122 1,019 189 372 1,041 5,742
2016 Fixed base Cash based Other Share based Total
salary incentive Pension benefits incentive remuneration
Executive Management:
Jón Sigurðsson President and CEO(i) 949 466 0 154 292 1,861
Executive management (6 people) (ii 1,914 370 134 169 465 3,052
2,863 836 134 324 757 4,913
6. Fees to auditors
2017 2016
Audit of Financial Statements 1,153 967
Other services 394 351
1,547 1,318
The Board of Directors did not hold any share option contracts at the end of the current period nor at the end of the prior year period.
(i) Shares owned by William Demant Invest A/S which Niels Jacobsen represents on the Board. Niels and financially related parties ownpersonally 192,105 shares.(ii) Shares owned are displayed in total number of owned shares, not rounded to the nearest thousand.
(i) Shares owned by Jón Sigurðsson 660,708 (2016: 608,708)(ii) Shares owned by members of executive management 981,609 (2016: 895,929). The executive management team consists of six persons at each time, two executive positions changed during the year.
Salaries Shares owned (ii)
Össur Consolidated Financial Statements 2017 15
Notes to the Consolidated Financial Statements
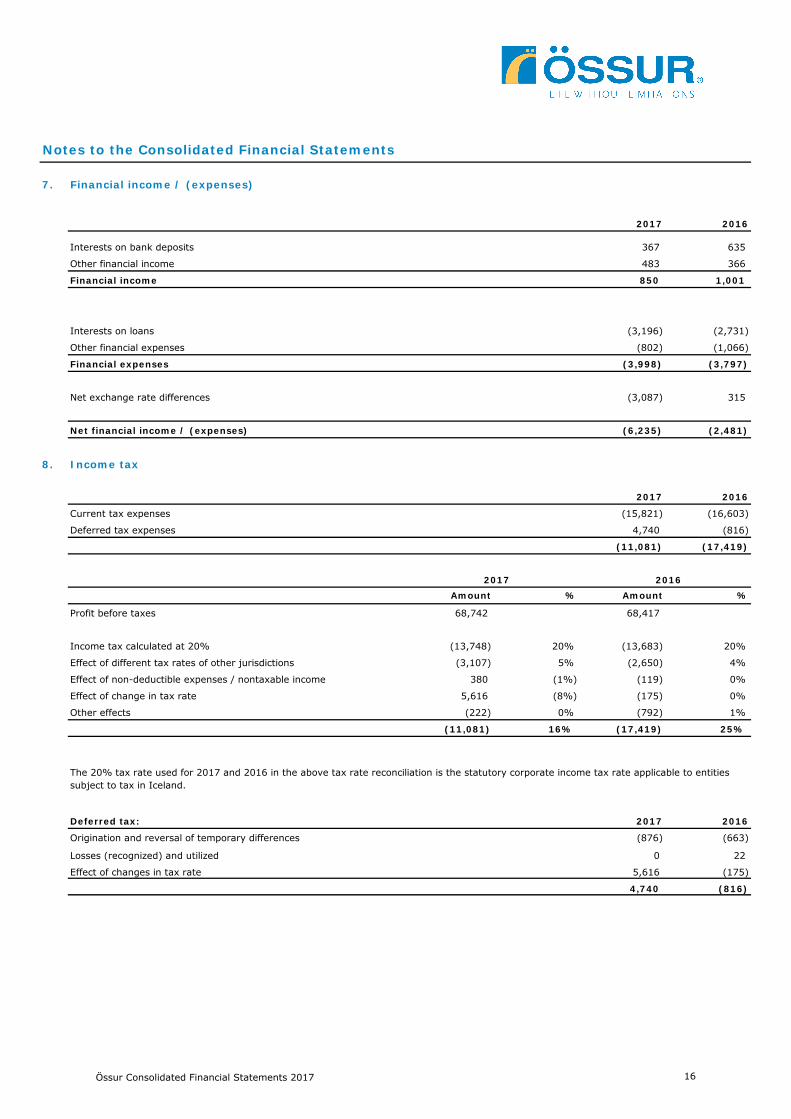
7. Financial income / (expenses)
2017 2016
367 635
483 366
Financial income 850 1,001
(3,196) (2,731)
(802) (1,066)
Financial expenses (3,998) (3,797)
(3,087) 315
Net financial income / (expenses) (6,235) (2,481)
8. Income tax
2017 2016
Current tax expenses (15,821) (16,603)
Deferred tax expenses 4,740 (816)
(11,081) (17,419)
2017 2016Amount % Amount %
Profit before taxes 68,742 68,417
Income tax calculated at 20% (13,748) 20% (13,683) 20%
Effect of different tax rates of other jurisdictions (3,107) 5% (2,650) 4%
Effect of non-deductible expenses / nontaxable income 380 (1%) (119) 0%
Effect of change in tax rate 5,616 (8%) (175) 0%
Other effects (222) 0% (792) 1%
(11,081) 16% (17,419) 25%
Deferred tax: 2017 2016
Origination and reversal of temporary differences (876) (663)
Losses (recognized) and utilized 0 22
Effect of changes in tax rate 5,616 (175)
4,740 (816)
Net exchange rate differences
The 20% tax rate used for 2017 and 2016 in the above tax rate reconciliation is the statutory corporate income tax rate applicable to entities subject to tax in Iceland.
Interests on bank deposits
Other financial income
Interests on loans
Other financial expenses
Össur Consolidated Financial Statements 2017 16
Notes to the Consolidated Financial Statements
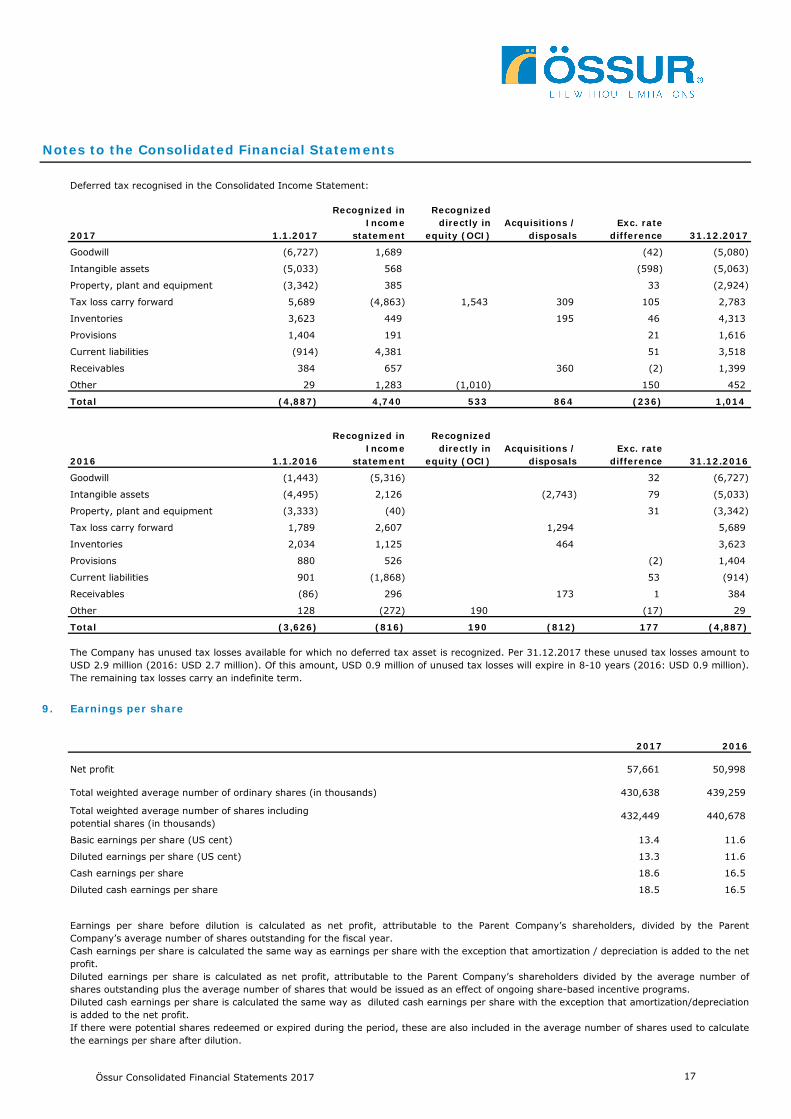
2017 1.1.2017
Recognized in Income
statement
Recognized directly in
equity (OCI)Acquisitions /
disposalsExc. rate
difference 31.12.2017
Goodwill (6,727) 1,689 (42) (5,080)
Intangible assets (5,033) 568 (598) (5,063)
Property, plant and equipment (3,342) 385 33 (2,924)
Tax loss carry forward 5,689 (4,863) 1,543 309 105 2,783
Inventories 3,623 449 195 46 4,313
Provisions 1,404 191 21 1,616
Current liabilities (914) 4,381 51 3,518
Receivables 384 657 360 (2) 1,399
Other 29 1,283 (1,010) 150 452
Total (4,887) 4,740 533 864 (236) 1,014
2016 1.1.2016
Recognized in Income
statement
Recognized directly in
equity (OCI)Acquisitions /
disposalsExc. rate
difference 31.12.2016
Goodwill (1,443) (5,316) 32 (6,727)
Intangible assets (4,495) 2,126 (2,743) 79 (5,033)
Property, plant and equipment (3,333) (40) 31 (3,342)
Tax loss carry forward 1,789 2,607 1,294 5,689
Inventories 2,034 1,125 464 3,623
Provisions 880 526 (2) 1,404
Current liabilities 901 (1,868) 53 (914)
Receivables (86) 296 173 1 384
Other 128 (272) 190 (17) 29
Total (3,626) (816) 190 (812) 177 (4,887)
9. Earnings per share
2017 2016
57,661 50,998
Total weighted average number of ordinary shares (in thousands) 430,638 439,259
432,449 440,678
13.4 11.6
13.3 11.6
18.6 16.5
18.5 16.5
Earnings per share before dilution is calculated as net profit, attributable to the Parent Company’s shareholders, divided by the ParentCompany’s average number of shares outstanding for the fiscal year.Cash earnings per share is calculated the same way as earnings per share with the exception that amortization / depreciation is added to the netprofit.Diluted earnings per share is calculated as net profit, attributable to the Parent Company’s shareholders divided by the average number ofshares outstanding plus the average number of shares that would be issued as an effect of ongoing share-based incentive programs.Diluted cash earnings per share is calculated the same way as diluted cash earnings per share with the exception that amortization/depreciationis added to the net profit.If there were potential shares redeemed or expired during the period, these are also included in the average number of shares used to calculatethe earnings per share after dilution.
Total weighted average number of shares including potential shares (in thousands)
The Company has unused tax losses available for which no deferred tax asset is recognized. Per 31.12.2017 these unused tax losses amount toUSD 2.9 million (2016: USD 2.7 million). Of this amount, USD 0.9 million of unused tax losses will expire in 8-10 years (2016: USD 0.9 million).The remaining tax losses carry an indefinite term.
Basic earnings per share (US cent)
Diluted earnings per share (US cent)
Deferred tax recognised in the Consolidated Income Statement:
Cash earnings per share
Diluted cash earnings per share
Net profit
Össur Consolidated Financial Statements 2017 17
Notes to the Consolidated Financial Statements
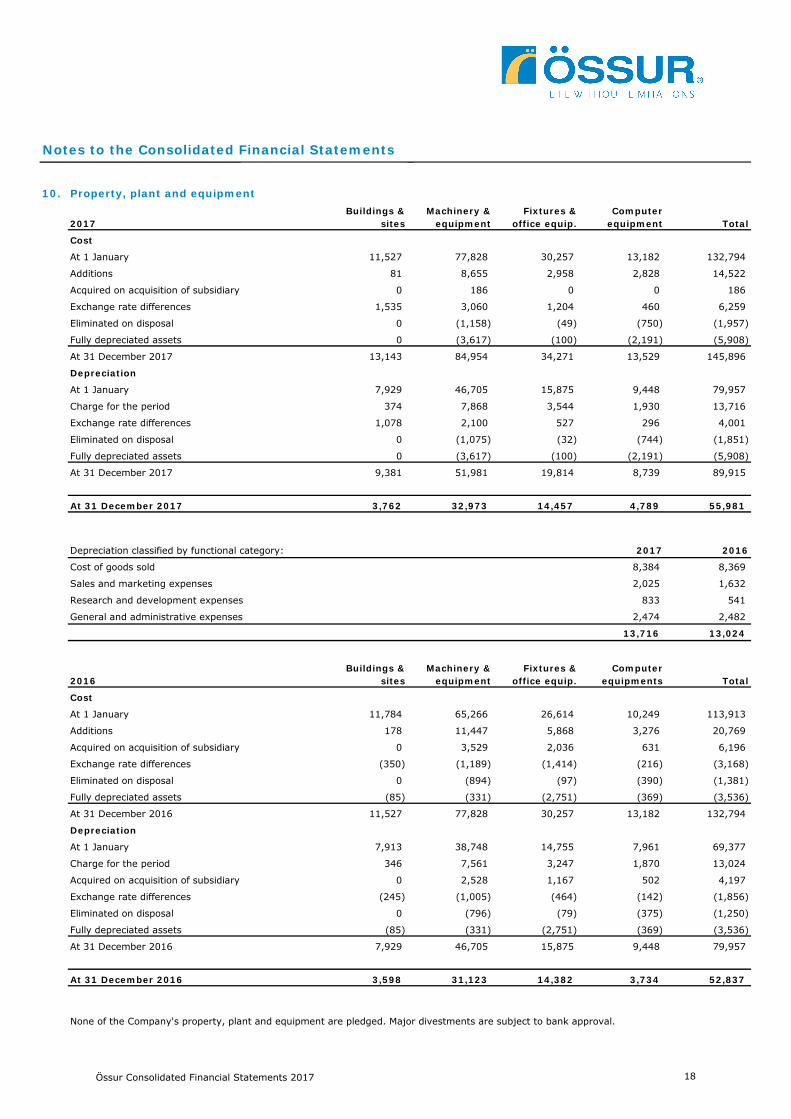
10. Property, plant and equipment
2017Buildings &
sitesMachinery &
equipmentFixtures &
office equip.Computer
equipment Total
Cost
At 1 January 11,527 77,828 30,257 13,182 132,794
Additions 81 8,655 2,958 2,828 14,522
Acquired on acquisition of subsidiary 0 186 0 0 186
Exchange rate differences 1,535 3,060 1,204 460 6,259
Eliminated on disposal 0 (1,158) (49) (750) (1,957)
Fully depreciated assets 0 (3,617) (100) (2,191) (5,908)
At 31 December 2017 13,143 84,954 34,271 13,529 145,896
Depreciation
At 1 January 7,929 46,705 15,875 9,448 79,957
Charge for the period 374 7,868 3,544 1,930 13,716
Exchange rate differences 1,078 2,100 527 296 4,001
Eliminated on disposal 0 (1,075) (32) (744) (1,851)
Fully depreciated assets 0 (3,617) (100) (2,191) (5,908)
At 31 December 2017 9,381 51,981 19,814 8,739 89,915
At 31 December 2017 3,762 32,973 14,457 4,789 55,981
Depreciation classified by functional category: 2017 2016
Cost of goods sold 8,384 8,369
Sales and marketing expenses 2,025 1,632
Research and development expenses 833 541
General and administrative expenses 2,474 2,482
13,716 13,024
2016Buildings &
sitesMachinery &
equipmentFixtures &
office equip.Computer
equipments Total
Cost
At 1 January 11,784 65,266 26,614 10,249 113,913
Additions 178 11,447 5,868 3,276 20,769
Acquired on acquisition of subsidiary 0 3,529 2,036 631 6,196
Exchange rate differences (350) (1,189) (1,414) (216) (3,168)
Eliminated on disposal 0 (894) (97) (390) (1,381)
Fully depreciated assets (85) (331) (2,751) (369) (3,536)
At 31 December 2016 11,527 77,828 30,257 13,182 132,794
Depreciation
At 1 January 7,913 38,748 14,755 7,961 69,377
Charge for the period 346 7,561 3,247 1,870 13,024
Acquired on acquisition of subsidiary 0 2,528 1,167 502 4,197
Exchange rate differences (245) (1,005) (464) (142) (1,856)
Eliminated on disposal 0 (796) (79) (375) (1,250)
Fully depreciated assets (85) (331) (2,751) (369) (3,536)
At 31 December 2016 7,929 46,705 15,875 9,448 79,957
At 31 December 2016 3,598 31,123 14,382 3,734 52,837
None of the Company's property, plant and equipment are pledged. Major divestments are subject to bank approval.
Össur Consolidated Financial Statements 2017 18
Notes to the Consolidated Financial Statements
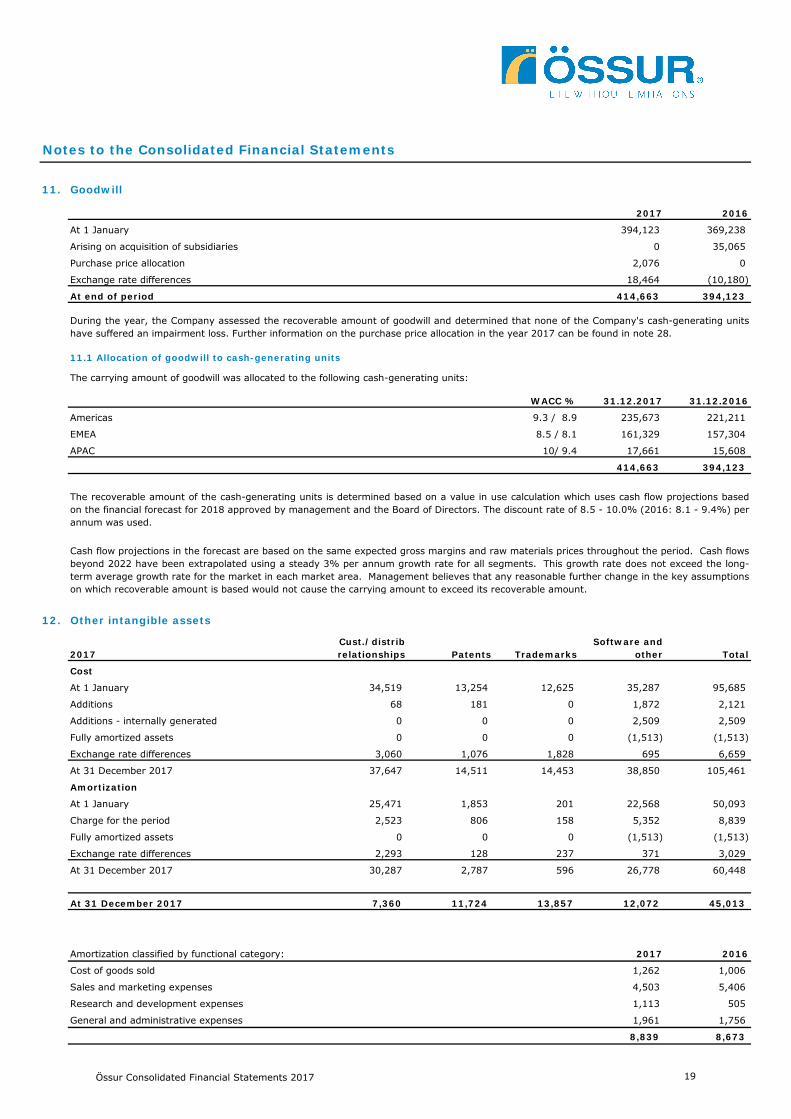
11. Goodwill
2017 2016
At 1 January 394,123 369,238
Arising on acquisition of subsidiaries 0 35,065
Purchase price allocation 2,076 0
Exchange rate differences 18,464 (10,180)
At end of period 414,663 394,123
11.1 Allocation of goodwill to cash-generating units
The carrying amount of goodwill was allocated to the following cash-generating units:
WACC % 31.12.2017 31.12.2016
Americas 9.3 / 8.9 235,673 221,211
EMEA 8.5 / 8.1 161,329 157,304
APAC 10/ 9.4 17,661 15,608
414,663 394,123
12. Other intangible assets
2017Cust./distrib relationships Patents Trademarks
Software and other Total
Cost
At 1 January 34,519 13,254 12,625 35,287 95,685
Additions 68 181 0 1,872 2,121
Additions - internally generated 0 0 0 2,509 2,509
Fully amortized assets 0 0 0 (1,513) (1,513)
Exchange rate differences 3,060 1,076 1,828 695 6,659
At 31 December 2017 37,647 14,511 14,453 38,850 105,461
Amortization
At 1 January 25,471 1,853 201 22,568 50,093
Charge for the period 2,523 806 158 5,352 8,839
Fully amortized assets 0 0 0 (1,513) (1,513)
Exchange rate differences 2,293 128 237 371 3,029
At 31 December 2017 30,287 2,787 596 26,778 60,448
At 31 December 2017 7,360 11,724 13,857 12,072 45,013
Amortization classified by functional category: 2017 2016
Cost of goods sold 1,262 1,006
Sales and marketing expenses 4,503 5,406
Research and development expenses 1,113 505
General and administrative expenses 1,961 1,756
8,839 8,673
The recoverable amount of the cash-generating units is determined based on a value in use calculation which uses cash flow projections basedon the financial forecast for 2018 approved by management and the Board of Directors. The discount rate of 8.5 - 10.0% (2016: 8.1 - 9.4%) perannum was used.
During the year, the Company assessed the recoverable amount of goodwill and determined that none of the Company's cash-generating unitshave suffered an impairment loss. Further information on the purchase price allocation in the year 2017 can be found in note 28.
Cash flow projections in the forecast are based on the same expected gross margins and raw materials prices throughout the period. Cash flowsbeyond 2022 have been extrapolated using a steady 3% per annum growth rate for all segments. This growth rate does not exceed the long-term average growth rate for the market in each market area. Management believes that any reasonable further change in the key assumptionson which recoverable amount is based would not cause the carrying amount to exceed its recoverable amount.
Össur Consolidated Financial Statements 2017 19
Notes to the Consolidated Financial Statements
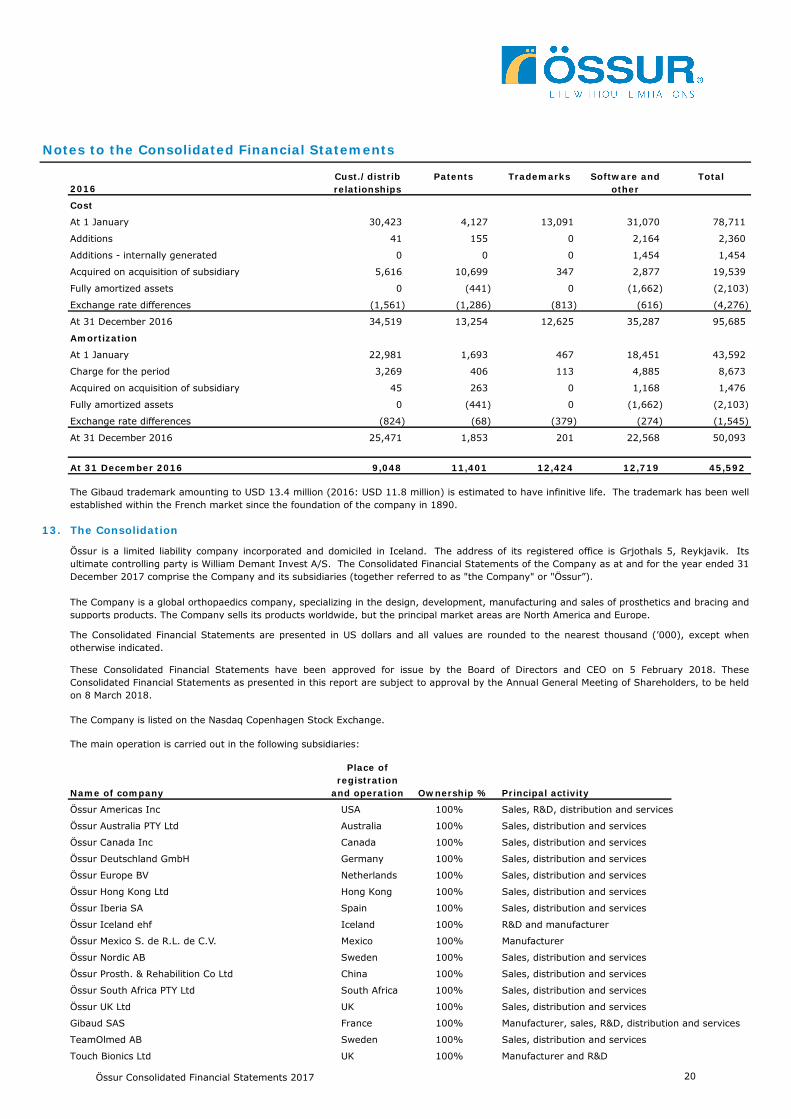
2016Cust./distrib relationships
Patents Trademarks Software and other
Total
Cost
At 1 January 30,423 4,127 13,091 31,070 78,711
Additions 41 155 0 2,164 2,360
Additions - internally generated 0 0 0 1,454 1,454
Acquired on acquisition of subsidiary 5,616 10,699 347 2,877 19,539
Fully amortized assets 0 (441) 0 (1,662) (2,103)
Exchange rate differences (1,561) (1,286) (813) (616) (4,276)
At 31 December 2016 34,519 13,254 12,625 35,287 95,685
Amortization
At 1 January 22,981 1,693 467 18,451 43,592
Charge for the period 3,269 406 113 4,885 8,673
Acquired on acquisition of subsidiary 45 263 0 1,168 1,476
Fully amortized assets 0 (441) 0 (1,662) (2,103)
Exchange rate differences (824) (68) (379) (274) (1,545)
At 31 December 2016 25,471 1,853 201 22,568 50,093
At 31 December 2016 9,048 11,401 12,424 12,719 45,592
13. The Consolidation
Name of company
Place of registration
and operation Ownership % Principal activity
Össur Americas Inc USA 100% Sales, R&D, distribution and services
Össur Australia PTY Ltd Australia 100% Sales, distribution and services
Össur Canada Inc Canada 100% Sales, distribution and services
Össur Deutschland GmbH Germany 100% Sales, distribution and services
Össur Europe BV Netherlands 100% Sales, distribution and services
Össur Hong Kong Ltd Hong Kong 100% Sales, distribution and services
Össur Iberia SA Spain 100% Sales, distribution and services
Össur Iceland ehf Iceland 100% R&D and manufacturer
Össur Mexico S. de R.L. de C.V. Mexico 100% Manufacturer
Össur Nordic AB Sweden 100% Sales, distribution and services
Össur Prosth. & Rehabilition Co Ltd China 100% Sales, distribution and services
Össur South Africa PTY Ltd South Africa 100% Sales, distribution and services
Össur UK Ltd UK 100% Sales, distribution and services
Gibaud SAS France 100% Manufacturer, sales, R&D, distribution and services
TeamOlmed AB Sweden 100% Sales, distribution and services
Touch Bionics Ltd UK 100% Manufacturer and R&D
The main operation is carried out in the following subsidiaries:
The Consolidated Financial Statements are presented in US dollars and all values are rounded to the nearest thousand (’000), except whenotherwise indicated.
The Gibaud trademark amounting to USD 13.4 million (2016: USD 11.8 million) is estimated to have infinitive life. The trademark has been wellestablished within the French market since the foundation of the company in 1890.
Össur is a limited liability company incorporated and domiciled in Iceland. The address of its registered office is Grjothals 5, Reykjavik. Itsultimate controlling party is William Demant Invest A/S. The Consolidated Financial Statements of the Company as at and for the year ended 31December 2017 comprise the Company and its subsidiaries (together referred to as "the Company" or "Össur”).
The Company is a global orthopaedics company, specializing in the design, development, manufacturing and sales of prosthetics and bracing andsupports products. The Company sells its products worldwide, but the principal market areas are North America and Europe.
These Consolidated Financial Statements have been approved for issue by the Board of Directors and CEO on 5 February 2018. TheseConsolidated Financial Statements as presented in this report are subject to approval by the Annual General Meeting of Shareholders, to be heldon 8 March 2018.
The Company is listed on the Nasdaq Copenhagen Stock Exchange.
Össur Consolidated Financial Statements 2017 20
Notes to the Consolidated Financial Statements
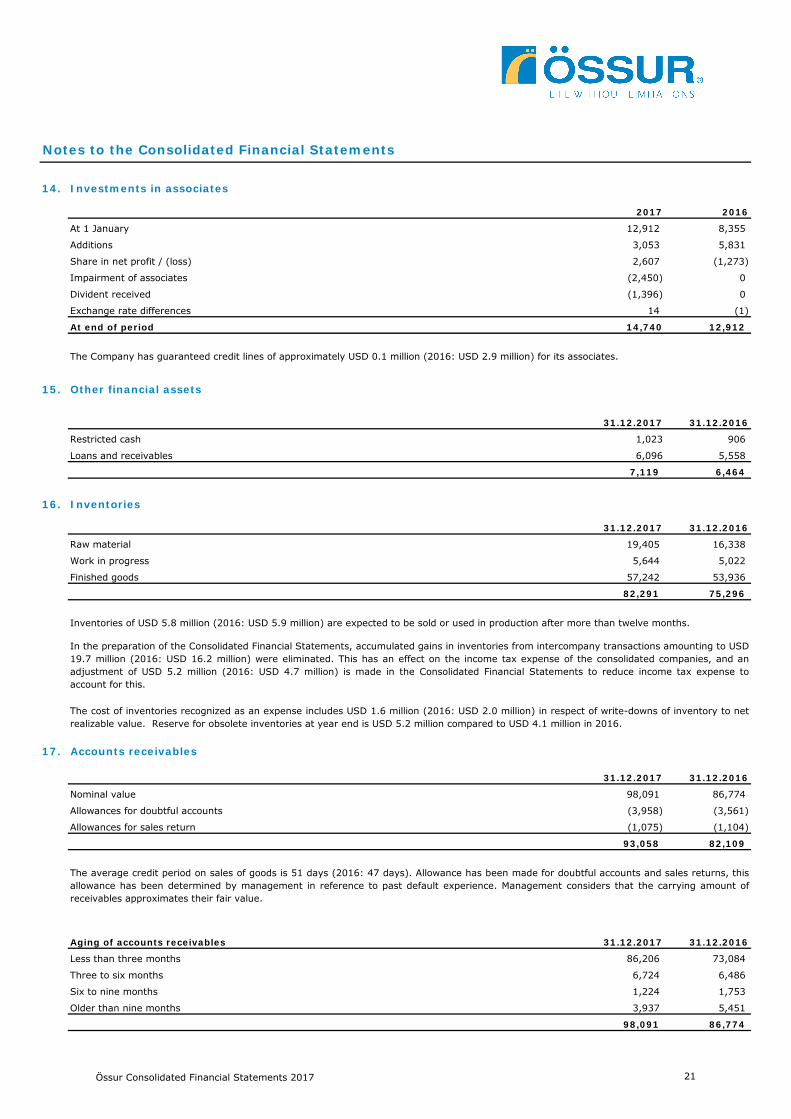
14. Investments in associates
2017 2016
12,912 8,355
3,053 5,831
2,607 (1,273)
Impairment of associates (2,450) 0
Divident received (1,396) 0
14 (1)
14,740 12,912
15. Other financial assets
31.12.2017 31.12.2016
1,023 906
6,096 5,558
7,119 6,464
16. Inventories
31.12.2017 31.12.2016
Raw material 19,405 16,338
Work in progress 5,644 5,022
Finished goods 57,242 53,936
82,291 75,296
17. Accounts receivables
31.12.2017 31.12.2016
Nominal value 98,091 86,774
Allowances for doubtful accounts (3,958) (3,561)
Allowances for sales return (1,075) (1,104)
93,058 82,109
Aging of accounts receivables 31.12.2017 31.12.2016
86,206 73,084
6,724 6,486
1,224 1,753
3,937 5,451
98,091 86,774
The Company has guaranteed credit lines of approximately USD 0.1 million (2016: USD 2.9 million) for its associates.
The average credit period on sales of goods is 51 days (2016: 47 days). Allowance has been made for doubtful accounts and sales returns, thisallowance has been determined by management in reference to past default experience. Management considers that the carrying amount ofreceivables approximates their fair value.
Less than three months
Three to six months
Older than nine months
Additions
The cost of inventories recognized as an expense includes USD 1.6 million (2016: USD 2.0 million) in respect of write-downs of inventory to netrealizable value. Reserve for obsolete inventories at year end is USD 5.2 million compared to USD 4.1 million in 2016.
At 1 January
Six to nine months
Restricted cash
Loans and receivables
Share in net profit / (loss)
Exchange rate differences
At end of period
Inventories of USD 5.8 million (2016: USD 5.9 million) are expected to be sold or used in production after more than twelve months.
In the preparation of the Consolidated Financial Statements, accumulated gains in inventories from intercompany transactions amounting to USD19.7 million (2016: USD 16.2 million) were eliminated. This has an effect on the income tax expense of the consolidated companies, and anadjustment of USD 5.2 million (2016: USD 4.7 million) is made in the Consolidated Financial Statements to reduce income tax expense toaccount for this.
Össur Consolidated Financial Statements 2017 21
Notes to the Consolidated Financial Statements
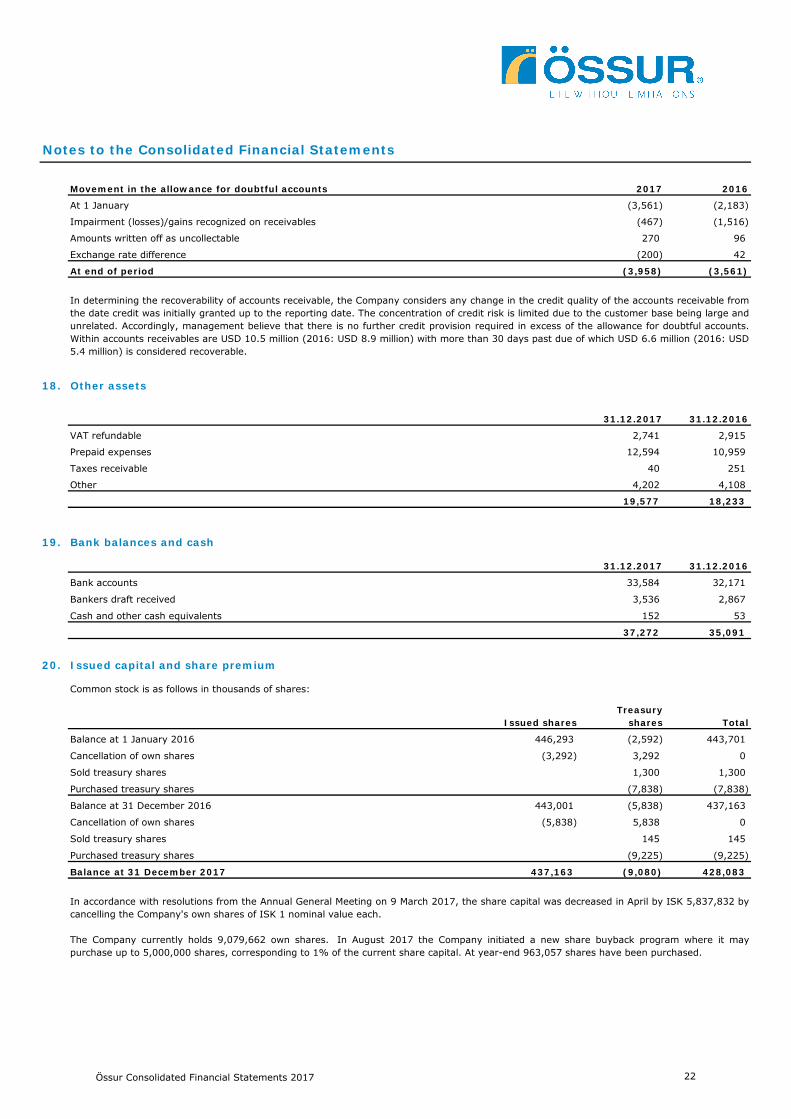
Movement in the allowance for doubtful accounts 2017 2016
(3,561) (2,183)
(467) (1,516)
270 96
(200) 42
At end of period (3,958) (3,561)
18. Other assets
31.12.2017 31.12.2016
VAT refundable 2,741 2,915
Prepaid expenses 12,594 10,959
Taxes receivable 40 251
Other 4,202 4,108
19,577 18,233
19. Bank balances and cash
31.12.2017 31.12.2016
Bank accounts 33,584 32,171
Bankers draft received 3,536 2,867
Cash and other cash equivalents 152 53
37,272 35,091
20. Issued capital and share premium
Common stock is as follows in thousands of shares:
Issued sharesTreasury
shares Total
Balance at 1 January 2016 446,293 (2,592) 443,701
(3,292) 3,292 0
1,300 1,300
Purchased treasury shares (7,838) (7,838)
443,001 (5,838) 437,163
(5,838) 5,838 0
145 145
(9,225) (9,225)
437,163 (9,080) 428,083
In determining the recoverability of accounts receivable, the Company considers any change in the credit quality of the accounts receivable fromthe date credit was initially granted up to the reporting date. The concentration of credit risk is limited due to the customer base being large andunrelated. Accordingly, management believe that there is no further credit provision required in excess of the allowance for doubtful accounts.Within accounts receivables are USD 10.5 million (2016: USD 8.9 million) with more than 30 days past due of which USD 6.6 million (2016: USD5.4 million) is considered recoverable.
At 1 January
Impairment (losses)/gains recognized on receivables
Amounts written off as uncollectable
Exchange rate difference
In accordance with resolutions from the Annual General Meeting on 9 March 2017, the share capital was decreased in April by ISK 5,837,832 bycancelling the Company's own shares of ISK 1 nominal value each.
The Company currently holds 9,079,662 own shares. In August 2017 the Company initiated a new share buyback program where it maypurchase up to 5,000,000 shares, corresponding to 1% of the current share capital. At year-end 963,057 shares have been purchased.
Cancellation of own shares
Sold treasury shares
Balance at 31 December 2016
Cancellation of own shares
Purchased treasury shares
Sold treasury shares
Balance at 31 December 2017
Össur Consolidated Financial Statements 2017 22
Notes to the Consolidated Financial Statements
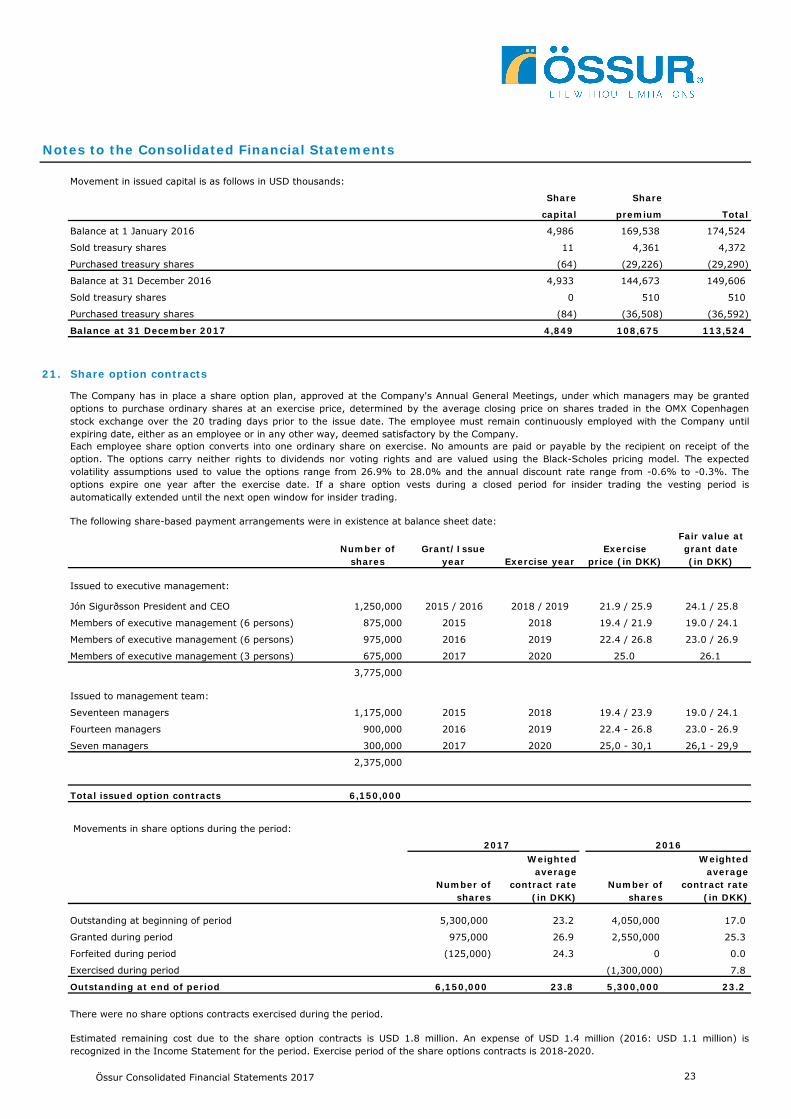
Movement in issued capital is as follows in USD thousands:
Share Share
capital premium Total
Balance at 1 January 2016 4,986 169,538 174,524
11 4,361 4,372
(64) (29,226) (29,290)
4,933 144,673 149,606
0 510 510
(84) (36,508) (36,592)
4,849 108,675 113,524
21. Share option contracts
The following share-based payment arrangements were in existence at balance sheet date:
Number of shares
Grant/Issue year Exercise year
Exercise price (in DKK)
Fair value at grant date (in DKK)
Issued to executive management:
Jón Sigurðsson President and CEO 1,250,000 2015 / 2016 2018 / 2019 21.9 / 25.9 24.1 / 25.8
Members of executive management (6 persons) 875,000 2015 2018 19.4 / 21.9 19.0 / 24.1
Members of executive management (6 persons) 975,000 2016 2019 22.4 / 26.8 23.0 / 26.9
Members of executive management (3 persons) 675,000 2017 2020 25.0 26.1
3,775,000
Issued to management team:
Seventeen managers 1,175,000 2015 2018 19.4 / 23.9 19.0 / 24.1
Fourteen managers 900,000 2016 2019 22.4 - 26.8 23.0 - 26.9
Seven managers 300,000 2017 2020 25,0 - 30,1 26,1 - 29,9
2,375,000
Total issued option contracts 6,150,000
Movements in share options during the period:
Number of shares
Weighted average
contract rate (in DKK)
Number of shares
Weighted average
contract rate (in DKK)
5,300,000 23.2 4,050,000 17.0
975,000 26.9 2,550,000 25.3
(125,000) 24.3 0 0.0
(1,300,000) 7.8
6,150,000 23.8 5,300,000 23.2
There were no share options contracts exercised during the period.
Each employee share option converts into one ordinary share on exercise. No amounts are paid or payable by the recipient on receipt of theoption. The options carry neither rights to dividends nor voting rights and are valued using the Black-Scholes pricing model. The expectedvolatility assumptions used to value the options range from 26.9% to 28.0% and the annual discount rate range from -0.6% to -0.3%. Theoptions expire one year after the exercise date. If a share option vests during a closed period for insider trading the vesting period isautomatically extended until the next open window for insider trading.
The Company has in place a share option plan, approved at the Company's Annual General Meetings, under which managers may be grantedoptions to purchase ordinary shares at an exercise price, determined by the average closing price on shares traded in the OMX Copenhagenstock exchange over the 20 trading days prior to the issue date. The employee must remain continuously employed with the Company untilexpiring date, either as an employee or in any other way, deemed satisfactory by the Company.
Estimated remaining cost due to the share option contracts is USD 1.8 million. An expense of USD 1.4 million (2016: USD 1.1 million) isrecognized in the Income Statement for the period. Exercise period of the share options contracts is 2018-2020.
2017
Exercised during period
2016
Outstanding at beginning of period
Outstanding at end of period
Granted during period
Forfeited during period
Purchased treasury shares
Balance at 31 December 2016
Purchased treasury shares
Sold treasury shares
Balance at 31 December 2017
Sold treasury shares
Össur Consolidated Financial Statements 2017 23
Notes to the Consolidated Financial Statements
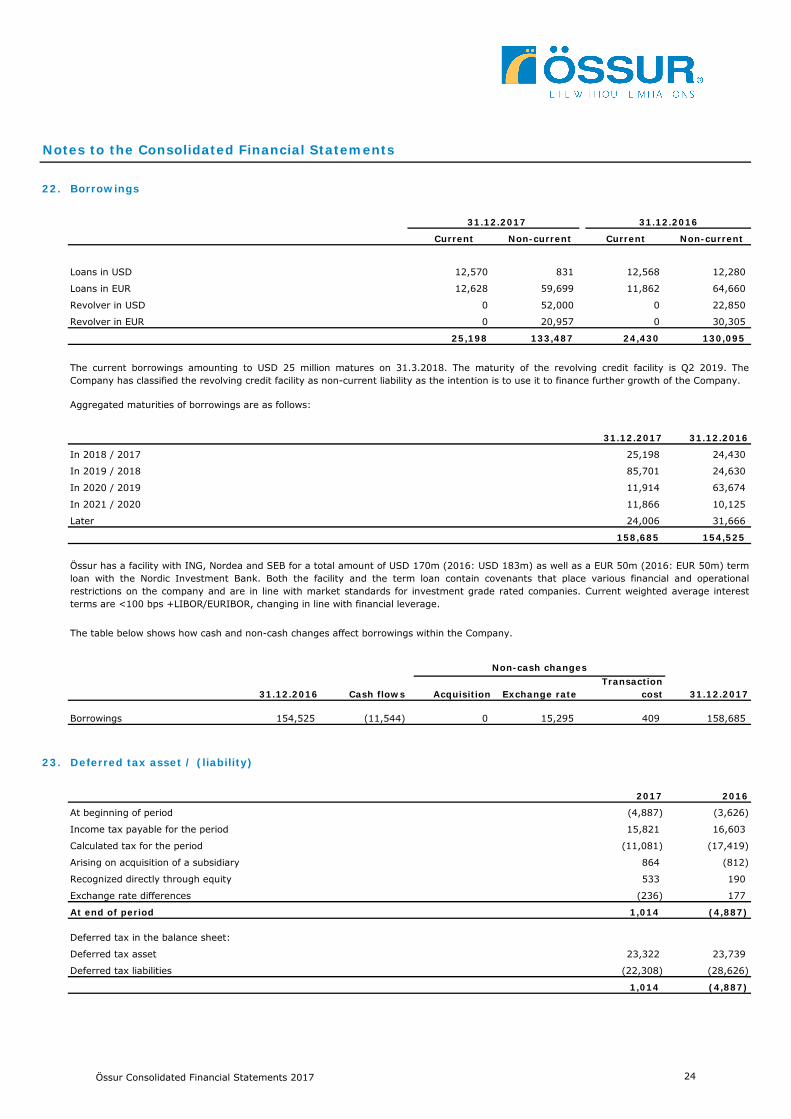
22. Borrowings
Current Non-current Current Non-current
Loans in USD 12,570 831 12,568 12,280
Loans in EUR 12,628 59,699 11,862 64,660
Revolver in USD 0 52,000 0 22,850
Revolver in EUR 0 20,957 0 30,305
25,198 133,487 24,430 130,095
Aggregated maturities of borrowings are as follows:
31.12.2017 31.12.2016
In 2018 / 2017 25,198 24,430
In 2019 / 2018 85,701 24,630
In 2020 / 2019 11,914 63,674
In 2021 / 2020 11,866 10,125
Later 24,006 31,666
158,685 154,525
31.12.2016 Cash flows Acquisition Exchange rateTransaction
cost 31.12.2017
Borrowings 154,525 (11,544) 0 15,295 409 158,685
23. Deferred tax asset / (liability)
2017 2016
At beginning of period (4,887) (3,626)
Income tax payable for the period 15,821 16,603
Calculated tax for the period (11,081) (17,419)
Arising on acquisition of a subsidiary 864 (812)
Recognized directly through equity 533 190
Exchange rate differences (236) 177
At end of period 1,014 (4,887)
Deferred tax in the balance sheet:
Deferred tax asset 23,322 23,739
Deferred tax liabilities (22,308) (28,626)
1,014 (4,887)
31.12.2017 31.12.2016
Össur has a facility with ING, Nordea and SEB for a total amount of USD 170m (2016: USD 183m) as well as a EUR 50m (2016: EUR 50m) termloan with the Nordic Investment Bank. Both the facility and the term loan contain covenants that place various financial and operationalrestrictions on the company and are in line with market standards for investment grade rated companies. Current weighted average interestterms are <100 bps +LIBOR/EURIBOR, changing in line with financial leverage.
The current borrowings amounting to USD 25 million matures on 31.3.2018. The maturity of the revolving credit facility is Q2 2019. TheCompany has classified the revolving credit facility as non-current liability as the intention is to use it to finance further growth of the Company.
The table below shows how cash and non-cash changes affect borrowings within the Company.
Non-cash changes
Össur Consolidated Financial Statements 2017 24
Notes to the Consolidated Financial Statements
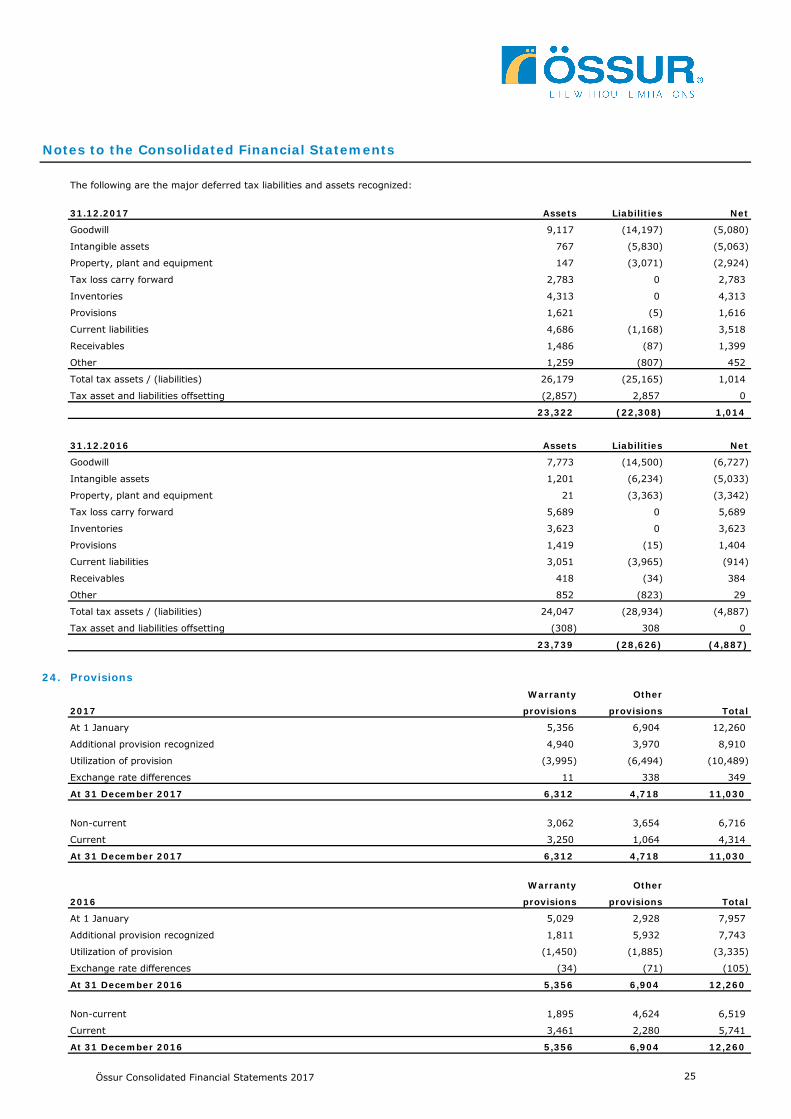
The following are the major deferred tax liabilities and assets recognized:
31.12.2017 Assets Liabilities Net
9,117 (14,197) (5,080)
767 (5,830) (5,063)
147 (3,071) (2,924)
2,783 0 2,783
4,313 0 4,313
1,621 (5) 1,616
4,686 (1,168) 3,518
1,486 (87) 1,399
1,259 (807) 452
26,179 (25,165) 1,014
(2,857) 2,857 0
23,322 (22,308) 1,014
31.12.2016 Assets Liabilities Net
7,773 (14,500) (6,727)
1,201 (6,234) (5,033)
21 (3,363) (3,342)
5,689 0 5,689
3,623 0 3,623
1,419 (15) 1,404
3,051 (3,965) (914)
418 (34) 384
852 (823) 29
24,047 (28,934) (4,887)
(308) 308 0
23,739 (28,626) (4,887)
24. ProvisionsWarranty Other
2017 provisions provisions Total
5,356 6,904 12,260
4,940 3,970 8,910
(3,995) (6,494) (10,489)
11 338 349
6,312 4,718 11,030
3,062 3,654 6,716
3,250 1,064 4,314
6,312 4,718 11,030
Warranty Other
2016 provisions provisions Total
5,029 2,928 7,957
1,811 5,932 7,743
(1,450) (1,885) (3,335)
(34) (71) (105)
5,356 6,904 12,260
1,895 4,624 6,519
3,461 2,280 5,741
5,356 6,904 12,260
Inventories
Inventories
Provisions
Current liabilities
Goodwill
Intangible assets
Receivables
Other
Property, plant and equipment
Tax loss carry forward
Tax asset and liabilities offsetting
Receivables
Other
Total tax assets / (liabilities)
Intangible assets
Property, plant and equipment
Exchange rate differences
At 31 December 2016
Non-current
Current
Tax loss carry forward
Tax asset and liabilities offsetting
Provisions
Current liabilities
Goodwill
At 31 December 2017
At 1 January
Additional provision recognized
Current
Utilization of provision
Total tax assets / (liabilities)
Non-current
At 1 January
Additional provision recognized
Utilization of provision
Exchange rate differences
At 31 December 2017
At 31 December 2016
Össur Consolidated Financial Statements 2017 25
Notes to the Consolidated Financial Statements
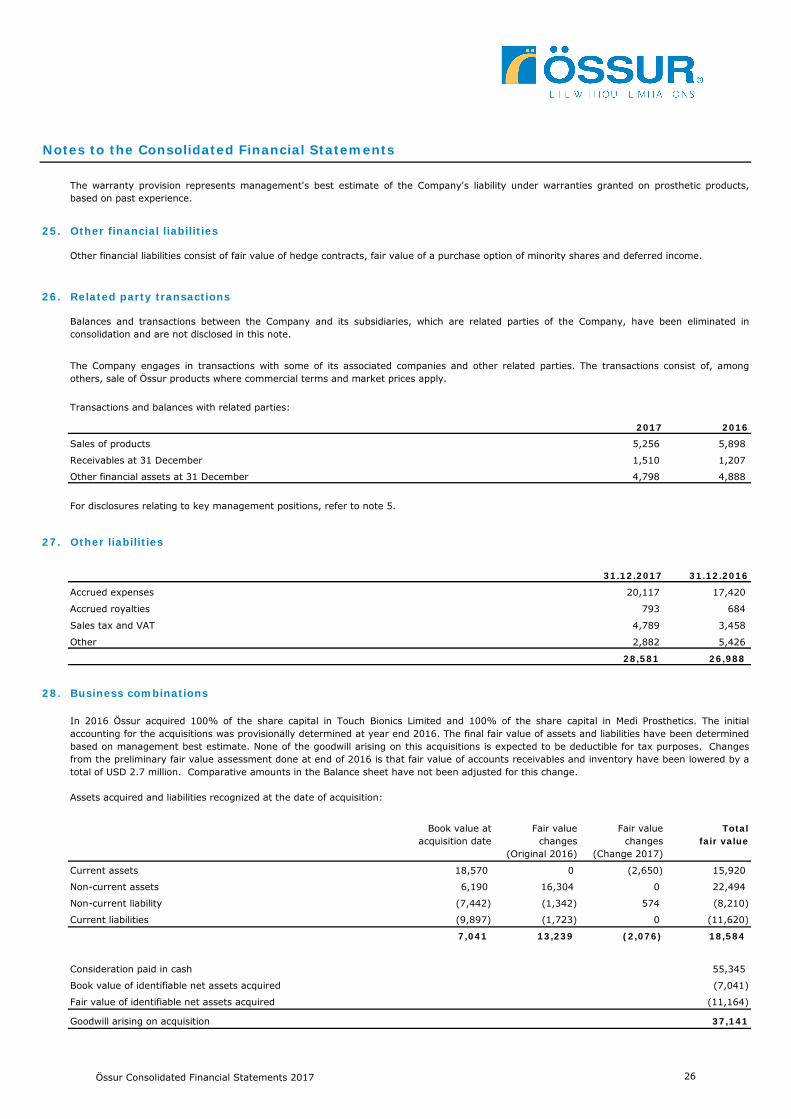
25. Other financial liabilities
26. Related party transactions
2017 2016
5,256 5,898
1,510 1,207
4,798 4,888
27. Other liabilities
31.12.2017 31.12.2016
20,117 17,420
793 684
4,789 3,458
2,882 5,426
28,581 26,988
28. Business combinations
Book value at acquisition date
Fair value changes
(Original 2016)
Fair value changes
(Change 2017)
Totalfair value
Current assets 18,570 0 (2,650) 15,920
Non-current assets 6,190 16,304 0 22,494
Non-current liability (7,442) (1,342) 574 (8,210)
Current liabilities (9,897) (1,723) 0 (11,620)
7,041 13,239 (2,076) 18,584
Consideration paid in cash 55,345
Book value of identifiable net assets acquired (7,041)
Fair value of identifiable net assets acquired (11,164)
Goodwill arising on acquisition 37,141
Sales of products
Receivables at 31 December
Other financial assets at 31 December
The Company engages in transactions with some of its associated companies and other related parties. The transactions consist of, amongothers, sale of Össur products where commercial terms and market prices apply.
Transactions and balances with related parties:
In 2016 Össur acquired 100% of the share capital in Touch Bionics Limited and 100% of the share capital in Medi Prosthetics. The initialaccounting for the acquisitions was provisionally determined at year end 2016. The final fair value of assets and liabilities have been determinedbased on management best estimate. None of the goodwill arising on this acquisitions is expected to be deductible for tax purposes. Changesfrom the preliminary fair value assessment done at end of 2016 is that fair value of accounts receivables and inventory have been lowered by atotal of USD 2.7 million. Comparative amounts in the Balance sheet have not been adjusted for this change.
The warranty provision represents management's best estimate of the Company's liability under warranties granted on prosthetic products,based on past experience.
Other financial liabilities consist of fair value of hedge contracts, fair value of a purchase option of minority shares and deferred income.
Balances and transactions between the Company and its subsidiaries, which are related parties of the Company, have been eliminated inconsolidation and are not disclosed in this note.
Sales tax and VAT
Other
Accrued expenses
For disclosures relating to key management positions, refer to note 5.
Accrued royalties
Assets acquired and liabilities recognized at the date of acquisition:
Össur Consolidated Financial Statements 2017 26
Notes to the Consolidated Financial Statements
29. Events after the reporting period
30. Financial instruments
30.1 Capital risk management
Net debt to EBITDA before special items ratio
The net debt to EBITDA before special items at period end was as follows:
31.12.2017 31.12.2016
Net debt 121,413 119,434
EBITDA before special items 102,955 98,476
Net debt/EBITDA before special items 1.2 1.2
30.2 Significant accounting policies
30.3 Financial risk management objectives
30.4 Foreign currency risk management
William Demant Invest A/S (WDI) has been a shareholder in the Company since 2004. In 2012 WDI made a voluntary public offer for shares inthe Company to ensure flexibility for WDI as a controlling shareholder and so WDI would not become subject to a mandatory public offer later. Atthe time WDI intended to hold an average of 40-50% of the Company’s shares. WDI’s ownership in the Company exceeded 50% in January2018. According to their announcement, WDI’s current intention is to hold 50-60% of the Company’s shares going forward. WDI has nointention of taking over the Company or delisting the Company’s shares from Nasdaq Copenhagen. Furthermore, WDI has no intention of makingchanges to the Company’s strategy, management, or operations.
The Company's Corporate Finance function provides services to the business, co-ordinates access to domestic and international financialmarkets, monitors and manages the financial risks relating to the operations of the Company through internal risk reports which analyzeexposures by degree and magnitude of risks. These risks include liquidity risk, interest rate risk, foreign exchange risk and counterparty creditrisk.
The general policy is to apply natural hedging to the extent possible but Össur has decided to amend its hedging policy and allow for activehedging of currency exposure that is not covered by the natural hedge in sales and costs by currency. The use of financial derivatives isgoverned by the Company's policies approved by the Board of Directors, which provide written principles on foreign exchange risk, interest raterisk, credit risk, the use of financial derivatives and non-derivative financial instruments and the investment of excess liquidity. The Companydoes not enter into or trade financial instruments, including derivative financial instruments, for speculative purposes.
The capital structure of the Company consists of debt, which includes the borrowings disclosed in note 22, cash and cash equivalents and equityattributable to equity holders of the parent, comprising issued capital, reserves and retained earnings as disclosed in the equity overview.
The Company's management continuously reviews the capital structure. As a part of this review, the management considers, amongst other, thecost of capital and net debt to EBITDA before special items.
Details of the significant accounting policies and methods adopted, including the criteria for recognition, the basis of measurement and the basison which income and expenses are recognized, in respect of each class of financial asset, financial liability and equity instrument are disclosed innote 35 to the Consolidated Financial Statements.
The Company manages capital to ensure that affiliates within the consolidation will be able to continue as a going concern while maximizing thereturn to stakeholders through the optimization of the debt and equity balance. The Company's overall strategy remains unchanged from 2016.
The Company operates on a global market, hence exposure to exchange rate fluctuations arises. Exchange rate exposures are managed withinapproved policy parameters. The general policy is to apply natural exchange rate hedging to the extent possible.
In February 2017 Össur started actively hedging part of currency exposure that is not covered by the natural hedge in sales and costs bycurrency. The main exposure in this regard is the ISK, as Össur has very limited sales in ISK, while for 2017 11% of total costs were in ISK (seenote 4). Össur has entered into forward contracts where it sells euros for ISK, covering approximately half of the estimated ISK costs in 2018.At balance sheet date Össur has twelwe forward contracts open, one for each month of 2018. The fair value of the contracts is negative of USD0.8 million at year end 2017.
Össur Consolidated Financial Statements 2017 27
Notes to the Consolidated Financial Statements
31.12.2017 31.12.2016 31.12.2017 31.12.2016
EUR 125,853 131,468 53,556 44,117
USD 87,919 71,683 51,767 6,472
SEK 15,245 12,060 17,522 15,610
GBP 3,449 3,515 6,378 5,456
Other 23,549 19,593 27,803 24,897
256,015 238,319 157,026 96,552
Foreign currency sensitivity analysis
2017 2016 2017 2016
Net profit 3,948 3,063 (4,498) (3,384)
Equity 10,172 5,807 (1,061) (700)
30.5 Interest rate risk management
30.6 Liquidity risk management
(i) 22% (2016: 22%) of the Company's COGS and OPEX is in EUR against 28% (2016: 27%) of its sales causing an increase in profit if the USDdecreases against the EUR.
(ii) 11% (2016: 11%) of the Company's COGS and OPEX is in ISK against 0.4% (2016: 0.5%) of its sales causing a decrease in profits if theUSD decreases against the ISK.
In February 2017 the Company started hedging approximately 50% of its ISK exposure using forward currency contracts. This is not consideredin the above calculations.
The Company is exposed to interest rate risks as funds are borrowed at floating interest rates. Interest rate risk is managed by the CorporateFinance function and the use of interest rate swap contracts may be used to maintain an appropriate mix between fixed and floating rateborrowings. Hedging activities are evaluated regularly to align with interest rate views and defined risk appetite, ensuring optimal hedgingstrategies are applied. Currently, all of the Company´s borrowings bear floating interest rates.
The Company's exposures to interest rates on financial assets and financial liabilities are detailed in the liquidity risk management section of thisnote.
The Company manages liquidity risk by maintaining adequate reserves, banking facilities and reserve borrowing facilities, by monitoring forecastand actual cash flows and matching the maturity profiles of financial assets and liabilities. At period end the Company had undrawn revolvingcredit facilities at its disposal amounting to USD 70.9 million (2016: USD 80.8 million) to further reduce liquidity risk.
The following tables detail the Company's remaining contractual maturity for its non-derivative financial liabilities. The tables have been drawn upbased on the undiscounted cash flows of financial liabilities based on the earliest date on which the Company can be required to pay. The tableincludes both interest and principal cash flows.
The Company is mainly exposed to the fluctuation of the Iceland (ISK) and the Eurozone (EUR) currency.
The following table details the Company's sensitivity to a 10% decrease in USD against the relevant foreign currencies with all other variablesfixed. The sensitivity analysis includes all foreign currency denominated items and adjusts their translation at the period end for a 10% change inforeign currency rates. The table below indicates the effect on profit or loss and other equity where USD weakens 10% against the relevantcurrency. For a 10% strengthening of USD against the relevant currency, there would be an equal and opposite impact on the profit or loss andother equity.
EUR (i) ISK (ii)
Liabilities Assets
The carrying amounts of the Company's foreign currency denominated monetary assets and monetary liabilities at the reporting date are asfollows:
Össur Consolidated Financial Statements 2017 28
Notes to the Consolidated Financial Statements
Weighted average
effective interest
Less than 1 year 1-5 years 5+ years Total
31.12.2017
Borrowings 1.8% 28,324 137,309 0 165,633
Non-interest bearing liabilities - 87,213 4,003 0 91,216
115,537 141,312 0 256,849
31.12.2016
Borrowings 1.9% 27,896 136,691 0 164,587
Non-interest bearing liabilities - 75,637 5 0 75,642
103,533 136,696 0 240,229
30.7 Credit risk management
30.8 Fair value of financial instruments
Carrying amount
Fair valueCarrying amount
Fair value
Financial liabilities:
Borrowings 158,685 159,084 154,525 155,285
31. Operating lease arrangements
2017 2016
Payments recognized as an expense 18,036 14,871
Non-cancellable operating lease commitments: 31.12.2017 31.12.2016
14,489 12,752
29,215 24,591
9,013 10,985
52,717 48,328
32. Litigation
33. Insurance
Insurance Book Insurance Book
value value value value
Fixed assets and inventories 269,320 143,157 248,340 133,018
31.12.2017
Less than 1 year
1 - 5 years
31.12.2016
The litigation with Vincent Systems in Germany, noted in 2016 Consolidated Financial Statements, is expected to be settled in Q1 2018.
5+ years
Operating lease payments represent rentals payable by the Company for certain of its office properties and cars. More than four hundred leaseagreements are in place in multiple countries. The leases expire in the periods 2018-2026.
Except as detailed in the following table, management considers that the carrying amounts of financial assets and financial liabilities recognizedin the Consolidated Financial Statements approximate their fair values.
31.12.2017 31.12.2016
The Company's counterparty credit risks arise mainly from short-term investment of liquid assets.
The Company does not undertake any trading activity in financial instruments.
Accounts receivables consist of a large number of customers spread across geographical areas. Ongoing credit evaluation is performed on thefinancial condition of accounts receivables.
Össur Consolidated Financial Statements 2017 29
Notes to the Consolidated Financial Statements
34. Adoption of new and revised Standards
34.1 Amendments to IFRSs that are mandatorily effective for annual periods beginning on or after 1 January 2017
34.2 New and revised IFRSs that are not mandatorily effective
• Amendments to IFRS 2 Classification and Measurement of Share-based Payment Transactions;
• Amendments to IFRS 10 and IAS 28 Sale or Contribution of Assets between an Investor and its Associate or Joint Venture;
• Amendments to IFRS 12 included in Annual Improvements to IFRS Standards 2014-2016 Cycle.
The following amendments to IFRSs became mandatorily effective in the current year. The application of the below amendments has minor effecton the Consolidated Financial Statements.
• IFRS 9 Financial Instruments;
• IFRS 15 Revenue from Contracts with Customers and the related Clarifications;
• IFRIC 22 Foreign Corrency Transactions and Advance Consideration.
The Company has purchased a business interruption insurance intended to compensate for temporary breakdown of operations. The insuranceamount is USD 481 million (2016: USD 426 million). In addition the Company has a product and professional liability insurance with a USD 30million limit and a product recall insurance with a USD 2 million limit. The deductible amount on the product and professional liability and productrecall insurances is USD 25-50 thousand.
• Amendments to IAS 7 Disclosure Initiative;
• Amendments to IAS 12 Recognition of Deferred Tax Assets for Unrealised Losses; and
In July 2014, the IASB finalised the reform of financial instruments accounting and issued IFRS 9, which contains the requirements for a) theclassification and measurement of financial assets and financial liabilities, b) impairment methodology, and c) general hedge accounting. IFRS 9will supersede IAS 39 Financial Instruments: Recognition and Measurement upon its effective date.
Management believes that IFRS 9 does not have material effect on amounts reported in the Consolidated Financial Statements.
Below is a list of new and revised IFRSs that are not yet mandatorily effective (but allow early application) for the year ending 31 December2017:
IFRS 9 Financial Intruments (as revised in 2014) - Effective for annual periods beginning on or after 1 January 2018
IFRS 15 Revenue from Contracts with Customers - Effective for annual periods beginning on or after 1 January 2018
• Annual Improvements to IFRS Standards 2014-2016 Cycle; and
IFRS 15 establishes a single comprehensive model for entities to use in accounting for revenue arising from contracts with customers. It willsupersede the following revenue Standards Interpretations upon its effective date, IAS 18 Revenue; IAS 11 Contstruction Contracts; IFRIC 13Customer Loyalty Programmes; IFRIC 15 Agreements for the Construction of Real Estate; IFRIC 18 Transfers of Assets from Customers; andSIC 31 Revenue-Barter Transactions Involving Advertising Services.
• IFRS 16 Leases;
• Amendments to IAS 40 Transfers of Investment Property;
Based on Össur assessment of IFRS 15 the impact is non-material and limited to revenue recognition of additional warranties for bionic productsthat are occasionally sold separate from the product. In 2017 the amount sold in relation to additional warranties amounted to USD 0.2 million,that under the new standard would have been deferred.
Management of the Company have made preliminary estimate of the effect of the above changes on the Consolidated Financial Statements.They have concluded that the amendmends of the standards will have immaterial effects, except for IFRS 16. The effects of new standards arefurther discussed below.
Össur Consolidated Financial Statements 2017 30
Notes to the Consolidated Financial Statements
35. Summary of Significant Accounting Policies
35.1 Statement of compliance
35.2 Basis of preparation
35.3 Basis of consolidation
The Consolidated Financial Statements have been prepared in accordance with International Financial Reporting Standards as adopted by theEuropean Union, additional Danish disclosure requirements for listed companies and additional requirements in the Icelandic Financial StatementAct no. 3/2006.
The Consolidated Financial Statements incorporate the financial statements of the Company and entities controlled by the Company and itssubsidiaries. Control is achieved when the Company:
• has power over the investee;• is exposed, or has rights, to variable returns from its involvement with the investee; and • has the ability to use its power to affect its returns.
The Company reassesses whether or not it controls an investee if facts and circumstances indicate that there are changes to one or more of thethree elements of control listed above.
When the Company has less than a majority of the voting rights of an investee, it has power over the investee when the voting rights aresufficient to give it the practical ability to direct the relevant activities of the investee unilaterally. The Company considers all relevant facts andcircumstances in assessing whether or not the Company's voting rights in an investee are sufficient to give it power, including:
• the size of the Company's holding of voting rights relative to the size and dispersion of holdings of the other vote holders; • potential voting rights held by the Company, other vote holders or other parties; • rights arising from other contractual arrangements; and • any additional facts and circumstances that indicate that the Company has, or does not have, the current ability to direct the relevant activitiesat the time that decisions need to be made, including voting patterns at previous shareholders' meetings.
Consolidation of a subsidiary begins when the Company obtains control over the subsidiary and ceases when the Company loses control of thesubsidiary. Specifically, income and expenses of a subsidiary acquired or disposed of during the year are included in the consolidated statementof profit or loss and other comprehensive income from the date the Company gains control until the date when the Company ceases to controlthe subsidiary.
IFRS 16 Leases - Effective for annual periods beginning on or after 1 January 2019
The Consolidated Financial Statements have been prepared under the historical cost basis except for certain financial instruments that aremeasured at fair values. Historical cost is generally based on the fair value of the consideration given in exchange for assets. Fair value is theprice that would be received to sell an asset or paid to transfer a liability in an orderly transaction between market participants at themeasurement date, regardless of whether that price is directly observable or estimated using another valuation technique. In estimating the fairvalue of an asset or a liability, the Group takes into account the characteristics of the asset or liability if market participants would take thosecharacteristics into account when pricing the asset or liability at the measurement date. Fair value for measurement and/or disclosure purposesin these Consolidated Financial Statements is determined on such a basis, except for share-based payment transactions that are within the scopeof IFRS 2, leasing transactions that are within the scope of IAS 17, and measurements that have some similarities to fair value but are not fairvalue, such as net realizable value in IAS 2 or value in use in IAS 36.
Össur has started an assessment of the impacts on its Consolidated Financial Statements and is implementing a new leasing system. Össur willrecognize right to use assets and related liabilities. The nature of expenses related to those leases will change as IFRS 16 replaces the operatinglease expense with a depreciation charge for right-of-use assets and interest expense on lease liabilities reported under financing expenses.Össur will likely use the partial retrospective application which means comparatives do not need to be restated. The partial application methodalso provides optional relief from reassessing whether contracts in place are, or contain, a lease, as well as other reliefs. Deciding which of thesepractical expedients to adopt is important as they are one-off choices.
As can be seen in note 31, Össur paid USD 18 million for lease arrangements and of that USD 15 million for facilities. Note 31 also shows non-cancellable operating lease commitments amounting to USD 53 million of which USD 48 million relates to facilities.
IFRS 16 provides a comprehensive model for the identification of lease arrangements and their treatment in the financial statements of bothlessees and lessors. It will supersede the following lease Standard and Interpretations upon its effective date, IAS 17 Leases; IFRIC 4Determining whether an Arrangement contains a Lease; SIC-15 Operating Leases - Incentives; and SIC-27 Evaluating the Substance ofTransactions involving the Legal Form of a Lease.
IFRS 16 introduces significant changes to lessee accounting: it removes the distinction between operating and finance leases under IAS 17 andrequires a lessee to recognise a right-of-use asset and a lease liability at lease commencement for all leases, except for short-term leases or lowvalue assets.
Össur Consolidated Financial Statements 2017 31
Notes to the Consolidated Financial Statements
35.4 Business combination
• deferred tax assets or liabilities and liabilities or assets related to employee benefit arrangements are recognized and measured in accordancewith IAS 12 Income Taxes and IAS 19 Employee Benefits respectively;• liabilities or equity instruments related to share-based payment arrangements of the acquiree or share-based payment arrangements of theCompany entered into to replace share-based payment arrangements of the acquiree are measured in accordance with IFRS 2 Share-basedPayment at the acquisition date;• assets (or disposal groups) that are classified as held for sale in accordance with IFRS 5 Non-current Assets Held for Sale and DiscontinuedOperations are measured in accordance with that standard.
The measurement period is the period from the date of acquisition to the date the Company obtains complete information about facts andcircumstances that existed as of the acquisition date – and is subject to a maximum of one year.
Profit or loss and each component of other comprehensive income are attributed to the owners of the Company and to the non-controllinginterests. Total comprehensive income of subsidiaries is attributed to the owners of the Company and to the non-controlling interests even if thisresults in the non-controlling interests having a deficit balance.
When necessary, adjustments are made to the financial statements of subsidiaries to bring their accounting policies in line with the Company'saccounting policies.
All intragroup assets and liabilities, equity, income, expenses and cash flows relating to transactions between members of the Group areeliminated in full on consolidation.
Changes in the Company's ownership interests in subsidiaries that do not result in the Group losing control over the subsidiaries are accountedfor as equity transactions. The carrying amounts of the Group's interests and the non-controlling interests are adjusted to reflect the changes intheir relative interests in the subsidiaries. Any difference between the amount by which the non-controlling interests are adjusted and the fairvalue of the consideration paid or received is recognized directly in equity and attributed to owners of the Company.
When a business combination is achieved in stages, the Company's previously held equity interest in the acquire is remeasured to fair value atthe acquisition date (i.e. the date when the Company obtains control) and the resulting gain or loss, if any, is recognized in profit or loss.Amounts arising from interests in the acquire prior to the acquisition date that have previously been recognized in other comprehensive incomeare reclassified to profit or loss where such treatment would be appropriate if that interest were disposed of.
Acquisitions of businesses are accounted for using the acquisition method. The consideration transferred in a business combination is measuredat fair value, which is calculated as the sum of the acquisition-date fair values of the assets transferred by the Company, liabilities incurred bythe Company to the former owners of the acquiree and the equity interests issued by the Company in exchange for control of the acquiree.Acquisition-related costs are generally recognized in profit or loss as incurred.
The acquiree's identifiable assets, liabilities and contingent liabilities that meet the conditions for recognition under IFRS 3 are recognized at theirfair value at the acquisition date, except that:
Goodwill arising on acquisition is recognized as an asset and initially measured at cost, being the excess of the purchase price of the businesscombination over the Company's interest in the net fair value of the identifiable assets, liabilities, contingent liabilities, the amount of any non-controlling interests in the acquiree, and the fair value of the acquirer's previously held equity interest in the acquiree. If, after reassessment,the Company's interest in the net fair value of the acquiree's identifiable assets, liabilities and contingent liabilities exceeds the cost of thebusiness combination, the excess is recognized immediately in profit or loss. Non-controlling interests that are present ownership interests andentitle their holders to a proportionate share of the entity's net assets in the event of liquidation may be initially measured either at fair value orat the non-controlling interests' proportionate share of the recognized amounts of the acquiree's identifiable net assets. The choice ofmeasurement basis is made on a transaction-by-transaction basis. Other types of non-controlling interests are measured at fair value or, whenapplicable, on the basis specified in another IFRS.
When the consideration transferred by the Company in a business combination includes assets or liabilities resulting from a contingentconsideration arrangement, the contingent consideration is measured at its acquisition-date fair value and included as part of the considerationtransferred in a business combination. Changes in the fair value of the contingent consideration that qualify as measurement period adjustmentsare adjusted retrospectively, with corresponding adjustments against goodwill. Measurement period adjustments are adjustments that arise fromadditional information obtained during the ‘measurement period’ about facts and circumstances that existed at the acquisition date.
The subsequent accounting for changes in the fair value of the contingent consideration that do not qualify as measurement period adjustmentsdepends on how the contingent consideration is classified. Contingent consideration that is classified as equity is not remeasured at subsequentreporting dates and its subsequent settlement is accounted for within equity. Contingent consideration that is classified as an asset or a liability isremeasured at subsequent reporting dates in accordance with IAS 39, or IAS 37 Provisions, Contingent Liabilities and Contingent Assets, asappropriate, with the corresponding gain or loss being recognized in profit or loss.
If the initial accounting for a business combination is incomplete by the end of the reporting period in which the combination occurs, theCompany reports provisional amounts for the items for which the accounting is incomplete. Those provisional amounts are adjusted during themeasurement period (see below), or additional assets or liabilities are recognized, to reflect new information obtained about facts andcircumstances that existed at the acquisition date that, if known, would have affected the amounts recognized at that date.
Össur Consolidated Financial Statements 2017 32
Notes to the Consolidated Financial Statements
35.5 Investments in associates
35.6 Goodwill
35.7 Revenue recognition
Sale of goods
An associate is an entity over which the Company has significant influence. Significant influence is the power to participate in the financial andoperating policy decisions of the investee but is not control or joint control over those policies.
The results, assets and liabilities of associates are incorporated in the Consolidated Financial Statements using the equity method of accounting.Under the equity method, investments in associates are initially recognized in the balance sheet and adjusted for post-acquisition changes in theCompany's share of the net assets of the associate, less any impairment in the value of individual investments. Losses of an associate in excessof the Company's interest in that associate are recognized only to the extent that the Company has incurred legal or constructive obligations ormade payments on behalf of the associate.
Any excess of the cost of acquisition over the Company's share of the net fair value of the identifiable assets, liabilities and contingent liabilitiesof the associate recognized at the date of acquisition is recognized as goodwill. The goodwill is included within the carrying amount of theinvestment and is assessed for impairment as part of that investment. Any excess of the Company's share of the net fair value of the identifiableassets, liabilities and contingent liabilities over the cost of acquisition, after reassessment, is recognized immediately in profit or loss.
The requirements of IAS 39 are applied to determine whether it is necessary to recognize any impairment loss with respect to the Company'sinvestment in an associate. When necessary, the entire carrying amount of the investment (including goodwill) is tested for impairment inaccordance with IAS 36 Impairment of Assets as a single asset by comparing its recoverable amount (higher of value in use and fair value lesscosts of disposal) with its carrying amount, Any impairment loss recognized forms part of the carrying amount of the investment. Any reversal ofthat impairment loss is recognized in accordance with IAS 36 to the extent that the recoverable amount of the investment subsequentlyincreases.
The Company discontinues the use of the equity method from the date when the investment ceases to be an associate, or when the investmentis classified as held for sale. When the Company retains an interest in the former associate and the retained interest is a financial asset, theGroup measures the retained interest at fair value at that date and the fair value is regarded as its fair value on initial recognition in accordancewith IAS 39. The difference between the carrying amount of the associate or joint venture at the date the equity method was discontinued, andthe fair value of any retained interest and any proceeds from disposing of a part interest in the associate or joint venture is included in thedetermination of the gain or loss on disposal of the associate or joint venture. In addition, the Company accounts for all amounts previouslyrecognized in other comprehensive income in relation to that associate on the same basis as would be required if that associate had directlydisposed of the related assets or liabilities. Therefore, if a gain or loss previously recognized in other comprehensive income by that associatewould be reclassified to profit or loss on the disposal of the related assets or liabilities, the company reclassifies the gain or loss from equity toprofit or loss (as a reclassification adjustment) when the equity method is discontinued.
Where a group entity transacts with an associate of the Company, profits and losses are eliminated to the extent of the Company's interest inthe relevant associate.
Revenue from the sale of goods is recognized when all the following conditions are satisfied; the Company has transferred to the buyer thesignificant risks and rewards of ownership of the goods, the Company retains neither continuing managerial involvement to the degree usuallyassociated with ownership nor effective control over the goods sold, the amount of revenue can be measured reliably, it is probable that theeconomic benefits associated with the transaction will flow to the entity and the costs incurred or to be incurred in respect of the transaction canbe measured reliably.
Goodwill is initially recognized as an asset at cost and is subsequently measured at cost less any accumulated impairment losses.
Goodwill is not amortized but is reviewed for impairment at least annually. For the purpose of impairment testing, goodwill is allocated to each ofthe Company's cash-generating units expected to benefit from the synergies of the combination. Cash-generating units to which goodwill hasbeen allocated are tested for impairment annually, or more frequently when there is an indication that the unit may be impaired. If therecoverable amount of the cash-generating unit is less than its carrying amount, the impairment loss is allocated first to reduce the carryingamount of any goodwill allocated to the unit and then to the other assets of the unit pro-rata on the basis of the carrying amount of each assetin the unit. Any impairment loss for goodwill is recognized directly in profit or loss in the Consolidated Income Statement. An impairment lossrecognized for goodwill is not reversed in a subsequent period.
On disposal of the relevant cash-generating unit, the attributable amount of goodwill is included in the determination of the profit or loss ondisposal.
The Company's policy for goodwill arising on the acquisition of an associate is described at 35.5 above.
Revenue is measured at the fair value of the consideration received or receivable. Revenue is reduced for estimated customer returns, rebatesand other similar allowances.
Össur Consolidated Financial Statements 2017 33
Notes to the Consolidated Financial Statements
Royalties
Interest revenue and dividend
35.8 Leasing
35.9 Foreign currencies
35.10 Share-based payments
35.11 Taxation
Royalty revenue is recognized on an accrual basis in accordance with the substance of the relevant agreement. Royalties determined on a timebasis are recognized on a straight-line basis over the period of the agreement. Royalty arrangements that are based on production, sales andother measures are recognized by reference to the underlying arrangement (provided that it is probable that the economic benefits will flow tothe Company and the amount of revenue can be measured reliably).
For the purpose of presenting the Consolidated Financial Statements, the assets and liabilities of the Company's foreign operations are expressedin USD using exchange rates prevailing at the balance sheet date. Income and expense items are translated at the average exchange rates foreach month, unless exchange rates fluctuated significantly during that period, in which case the exchange rates at the dates of the transactionsare used. Exchange differences arising, if any, are classified as equity and transferred to the Company's translation reserve (attributed to non-controlling interests as appropriate).
Goodwill and fair value adjustments arising on the acquisition of a foreign operation are treated as assets and liabilities of the foreign operationand translated at the closing rate. Exchange differences arising, if any, are recognized in equity.
On the disposal of a foreign operation (i.e. a disposal of the Company's entire interest in a foreign operation, or a disposal involving loss ofcontrol over a subsidiary that includes a foreign operation or a disposal involving loss of significant influence over an associate that includes aforeign operation) all of the exchange differences accumulated in equity in respect of that operation attributable to the owners of the Companyare reclassified to profit or loss.
In addition, in relation to a partial disposal of a subsidiary that does not result in the Company losing control over the subsidiary, theproportionate share of accumulated exchange differences are re-attributed to non-controlling interests and are not recognized in profit or loss.For all other partial disposals (i.e. partial disposals of associates that do not result in the Company losing significant influence), the proportionateshare of the accumulated exchange differences is reclassified to profit or loss.
Exchange differences are recognized in the Income Statement in the period they occur, except for exchange differences on monetary itemsreceivable from or payable to a foreign operation for which settlement is neither planned nor likely to occur (therefore forming part of the netinvestment in the foreign operation), which are recognized initially in other comprehensive income and reclassified from equity to profit or loss onrepayment of the monetary items.
Equity-settled share-based payments to employees and others providing similar services are measured at the fair value of the equity instrumentsat the grant date. Details regarding the determination of the fair value of equity-settled share-based transactions are set out in note 21.
The fair value determined at the grant date of the equity-settled share-based payments is expensed on a straight-line basis over the vestingperiod, based on the Company's estimate of equity instruments that will eventually vest, with a corresponding increase in equity. At the end ofeach reporting period, the Company revises its estimate of the number of equity instruments expected to vest. The impact of the revision of theoriginal estimates, if any, is recognized in profit or loss such that the cumulative expense reflects the revised estimate, with a correspondingadjustment to the equity-settled employee benefits reserve.
Income tax expense represents the sum of the tax currently payable and deferred tax.
Operating lease payments are recognized as an expense on a straight-line basis over the lease term, except where another systematic basis ismore representative of the time pattern in which economic benefits from the leased assets are consumed. Contingent rentals arising underoperating leases are recognized as an expense in the period in which they are incurred.
In the event that lease incentives are received to enter into operating leases, such incentives are recognized as a liability. The aggregate benefitof incentives is recognized as a reduction of rental expense on a straight-line basis, except where another systematic basis is morerepresentative of the time pattern in which economic benefits from the leased assets are consumed.
Interest income from a financial asset is recognized when it is probable that the economic benefits will flow to the Company and the amount ofincome can be measured reliably. Interest income is accrued on a time basis, by reference to the principal outstanding and at the effectiveinterest rate applicable, which is the rate that exactly discounts estimated future cash receipts through the expected life of the financial asset tothat asset's net carrying amount on initial recognition. Dividend income from investments is recognized when the shareholder's right to receivepayment has been established.
Össur Consolidated Financial Statements 2017 34
Notes to the Consolidated Financial Statements
Current tax
Deferred tax
Current and deferred tax for the year
35.12 Property, plant and equipment
The following useful lives are used in the calculation of depreciation:
Buildings & sites 25 - 50 years
Machinery and equipment 5 - 8 years
Fixtures and office equipment 5 years
Computer equipment 2 - 5 years
Deferred tax is recognized on temporary differences between the carrying amounts of assets and liabilities in the Consolidated FinancialStatements and the corresponding tax bases used in the computation of taxable profit. Deferred tax liabilities are generally recognized for alltaxable temporary differences. Deferred tax assets are generally recognized for all deductible temporary differences to the extent that it isprobable that taxable profits will be available against which those deductible temporary differences can be utilized. Such deferred tax assets andliabilities are not recognized if the temporary difference arises from goodwill or from the initial recognition (other than in a business combination)of other assets and liabilities in a transaction that affects neither the taxable profit nor the accounting profit.
Deferred tax liabilities are recognized for taxable temporary differences associated with investments in subsidiaries and associates, except wherethe Company is able to control the reversal of the temporary difference and it is probable that the temporary difference will not reverse in theforeseeable future. Deferred tax assets arising from deductible temporary differences associated with such investments and interests are onlyrecognized to the extent that it is probable that there will be sufficient taxable profits against which to utilize the benefits of the temporarydifferences and they are expected to reverse in the foreseeable future.
The carrying amount of deferred tax assets is reviewed at each balance sheet date and reduced to the extent that it is no longer probable thatsufficient taxable profits will be available to allow all or part of the asset to be recovered.
Deferred tax assets and liabilities are measured at the tax rates that are expected to apply in the period in which the liability is settled or theasset realized, based on tax rates (and tax laws) that have been enacted or substantively enacted at the balance sheet date. The measurementof deferred tax liabilities and assets reflects the tax consequences that would follow from the manner in which the Company expects, at thereporting date, to recover or settle the carrying amount of its assets and liabilities.
Deferred tax assets and liabilities are offset when there is a legally enforceable right to set off current tax assets against current tax liabilitiesand when they relate to income taxes levied by the same taxation authority and the Company intends to settle its current tax assets andliabilities on a net basis.
In the preparation of the Consolidated Financial Statements, accumulated gains in inventories from intercompany transactions are eliminated.This has an effect on the income tax expenses of the consolidated companies, and an adjustment is included in the deferred tax asset. Incometax expense is calculated in accordance with tax rates in the countries where the inventories are purchased.
Current and deferred tax are recognized in profit or loss, except when they relate to items that are recognized in Other Comprehensive Incomeor directly in equity, in which case, the current and deferred tax are also recognized in other comprehensive income or directly in equityrespectively. Where current tax or deferred tax arises from the initial accounting for a business combination, the tax effect is included in theaccounting for the business combination.
The tax currently payable is based on taxable profit for the period. Taxable profit differs from net profit as reported in the Consolidated IncomeStatement because it excludes items of income or expense that are taxable or deductible in other periods and it further excludes items that arenever taxable or deductible. The Company's current tax is calculated using tax rates that have been enacted or substantively enacted by theend of the reporting period.
Property, plant and equipment are recognized as an asset when it is probable that future economic benefits associated with the asset will flow tothe Company and the cost of the asset can be measured in a reliable manner.
Property, plant and equipment which qualify for recognition as an asset are initially measured at cost.
The cost of a property, plant and equipment comprises its purchase price and any directly attributable cost of bringing the asset to workingcondition for its intended use.
The depreciable amount of the asset is allocated on a straight-line basis over its useful life. The depreciation charge for each period is recognizedas an expense. The estimated useful lives, residual values and depreciation method are reviewed at each balance sheet date, with the effect ofany changes in estimate accounted for on a prospective basis.
In the disposal or retirement of an asset is determined as the difference between the sales proceeds and the carrying amount of the asset and isrecognized in the Consolidated Income Statement.
Össur Consolidated Financial Statements 2017 35
Notes to the Consolidated Financial Statements
35.13 Intangible assets
Intangible assets acquired separately
Customer and distribution relationships 4 - 10 years
Patents 5 - 50 years
Trademarks 3 - infinitive
Software and other 2 - 10 years
Internally-generated intangible assets - research and development expenditure
Intangible assets acquired in a business combination
Derecognition of intangible assets
35.14 Impairment of tangible and intangible assets excluding goodwill
At each balance sheet date, the Company reviews the carrying amounts of its tangible and intangible assets to determine whether there is anyindication that those assets have suffered an impairment loss. If any such indication exists, the recoverable amount of the asset is estimated inorder to determine the extent of the impairment loss (if any). Where it is not possible to estimate the recoverable amount of an individual asset,the Company estimates the recoverable amount of the cash-generating unit to which the asset belongs. Where a reasonable and consistent basisof allocation can be identified, corporate assets are also allocated to individual cash-generating units, or otherwise they are allocated to thesmallest group of cash-generating units for which a reasonable and consistent allocation basis can be identified.
Intangible assets with indefinite useful lives and intangible assets not yet available for use are tested for impairment annually, and wheneverthere is an indication that the asset may be impaired.
Recoverable amount is the higher of fair value less costs to sell and value in use. In assessing value in use, the estimated future cash flows arediscounted to their present value using a pre-tax discount rate that reflects current market assessments of the time value of money and therisks specific to the asset for which the estimates of future cash flows have not been adjusted.
An intangible asset is derecognized on disposal, or when no future economic benefits are expected from use or disposal. Gains or losses arisingfrom derecognition of an intangible asset, measured as the difference between the net disposal proceeds and the carrying amount of the asset,are recognized in profit or loss when the asset is derecognized.
Intangible assets acquired in a business combination are identified and recognized separately from goodwill where they satisfy the definition ofan intangible asset and their fair values can be measured reliably. The cost of such intangible assets is their fair value at the acquisition date.
Subsequent to initial recognition, intangible assets acquired in a business combination are reported at cost less accumulated amortization andaccumulated impairment losses, on the same basis as intangible assets acquired separately.
Intangible assets with finite useful life are reported at cost less accumulated amortization and accumulated impairment losses. Amortization isallocated on a straight-line basis over their estimated useful lives. The estimated useful life and amortization method are reviewed at the end ofeach balance sheet date, with the effect of any changes in estimate being accounted for on a prospective basis. Intangible assets with indefiniteuseful lives are carried at cost less accumulated impairment losses.
Part of the intangible assets included above have finite useful lives, over which the assets are amortized. These intangible assets will beamortized on a straight line basis over their useful lives.
The following useful lives are used in the calculation of amortization:
Expenditure on research activities is recognized as an expense in the period in which it is incurred.
An internally-generated intangible asset arising from the Company's development is recognized only if all of the following conditions are met: thetechnical feasibility of completing the intangible asset so that it will be available for use or sale; the intention to complete the intangible asset anduse or sell it; the ability to use or sell the intangible asset; the intangible asset will generate probable future economic benefits; the availability ofadequate technical, financial and other resources to complete the development and to use or sell the intangible asset and the ability to measurereliably the expenditure attributable to the intangible asset during its development.
The amount initially recognized for internally-generated intangible assets is the sum of the expenditure incurred from the date when theintangible asset first meets the recognition criteria listed above. Where no internally-generated intangible asset can be recognized, developmentexpenditure is charged to profit or loss in the period in which it is incurred.
Subsequent to initial recognition, internally-generated intangible assets are reported at cost less accumulated amortization and accumulatedimpairment losses, on the same basis as intangible assets acquired separately.
Össur Consolidated Financial Statements 2017 36
Notes to the Consolidated Financial Statements
35.15 Inventories
35.16 Provisions
Warranties
35.17 Risk management
35.18 Financial assets
Effective interest method
Financial assets at fair value through profit or loss
Inventories are stated at the lower of cost and net realizable value. Costs, including an appropriate portion of fixed and variable overheadexpenses, are assigned to inventories held by the method most appropriate to the particular class of inventory, with the majority being valued on a standard cost basis. Net realizable value represents the estimated selling price for inventories less all estimated costs of completion and costsnecessary to make the sale.
Provisions are recognized when the Company has a present obligation as a result of a past event, it is probable that the Company will berequired to settle the obligation, and a reliable estimate can be made of the amount of the obligation.
The amount recognized as a provision is the best estimate of the consideration required to settle the present obligation at the balance sheetdate, taking into account the risks and uncertainties surrounding the obligation. Where a provision is measured using the cash flows estimated tosettle the present obligation, its carrying amount is the present value of those cash flows.
When some or all of the economic benefits required to settle a provision are expected to be recovered from a third party, the receivable isrecognized as an asset if it is virtually certain that reimbursement will be received and the amount of the receivable can be measured reliably.
If the recoverable amount of an asset (or cash-generating unit) is estimated to be less than its carrying amount, the carrying amount of theasset (cash-generating unit) is reduced to its recoverable amount. An impairment loss is recognized immediately in profit or loss.
Provisions for expected warranty costs are recognized at the date of sale of the relevant products, at management´s best estimate of theexpenditure required to settle the Company's obligation.
Financial risk management is governed by the Company's Treasury Policy, approved by the Board of Directors. The policy sets limits to theextent of financial risks and guidelines for financial transactions in general. The general policy is to apply natural currency hedging to the extentpossible and prohibit any speculative trading of financial instruments.
Long term financing is managed from the Company's Corporate Finance function and individual subsidiaries do not engage in substantial externalfinancing contracts with banks and/or credit institutions.
The Company is exposed to normal business risk in collecting accounts receivable. Adequate allowance is made for bad debt expenses.
Financial assets are recognized when the Company becomes a party to the contractual provisions of the instrument.
Financial assets are initially measured at fair value. Transaction costs that are directly attributable to the acquisition or issue of financial assets(other than financial assets at fair value through profit or loss) are added to or deducted from the fair value of the financial assets, asappropriate, on initial recognition. Transaction costs directly attributable to the acquisition of financial assets at fair value through profit or lossare recognized immediately in profit or loss.
Financial assets are classified into the following specified categories: financial assets as ‘at fair value through profit or loss’ (FVTPL) and ‘loansand receivables’. The classification depends on the nature and purpose of the financial assets and is determined at the time of initial recognition.
The effective interest method is a method of calculating the amortized cost of a debt instrument and of allocating interest income over therelevant period. The effective interest rate is the rate that exactly discounts estimated future cash receipts (including all fees on points paid orreceived that form an integral part of the effective interest rate, transaction costs and other premiums or discounts) through the expected life ofthe debt instrument or, where appropriate, a shorter period to the net carrying amount on initial recognition.
Income is recognized on an effective interest basis for debt instruments other than those financial assets classified as at fair value through profitor loss.
Financial assets are classified as at fair value through profit or loss where the financial asset is either held for trading or it is designated as at fairvalue through profit or loss.
Financial assets at fair value through profit or loss are stated at fair value, with any resultant gain or loss recognized in profit or loss. The netgain or loss recognized in profit or loss incorporates any dividend or interest earned on the financial asset.
Össur Consolidated Financial Statements 2017 37
Notes to the Consolidated Financial Statements
Loans and receivables
Impairment of financial assets
Derecognition of financial assets
35.19 Financial liabilities
Financial liabilities at fair value through profit or loss
Other financial liabilities
Derecognition of financial liabilities
Other financial liabilities, including borrowings, are initially measured at fair value, net of transaction costs.
Other financial liabilities are subsequently measured at amortized cost using the effective interest method, with interest expense recognized onan effective yield basis.
Financial liabilities are classified at fair value through profit or loss when the financial liability is either held for trading or it is designated as at fairvalue through profit or loss.
Financial liabilities at fair value through profit or loss are stated at fair value, with any gains or losses arising on remeasurement recognized inprofit or loss. The net gain or loss recognized in profit or loss incorporates any interest paid on the financial liability and is included in the ‘othergains and losses’ line item in the Income Statement.
Financial liabilities are recognized when the Company becomes a party to the contractual provisions of the instrument. Financial liabilities areclassified as either financial liabilities at ‘fair value through profit and loss’ or ‘other financial liabilities’.
Financial liabilities are initially measured at fair value. Transaction costs that are directly attributable to the acquisition or issue of financialliabilities (other than financial liabilities at fair value through profit or loss) are added to or deducted from the fair value of the financial liabilities,as appropriate, on initial recognition. Transaction costs directly attributable to the acquisition of financial liabilities at fair value through profit orloss are recognized immediately in profit or loss.
Financial assets, other than those at fair value through profit or loss, are assessed for indicators of impairment at each balance sheet date.Financial assets are impaired where there is objective evidence that, as a result of one or more events that occurred after the initial recognitionof the financial asset, the estimated future cash flows of the investment have been impacted.
For certain categories of financial assets, such as account receivables, assets that are assessed not to be impaired individually are subsequentlyassessed for impairment on a collective basis. Objective evidence of impairment for a portfolio of receivables could include the Company's pastexperience of collecting payments, an increase in the number of delayed payments in the portfolio past the Company's average credit period, aswell as observable changes in national or local economic conditions that correlate with default on receivables.
For financial assets carried at amortized cost, the amount of the impairment is the difference between the asset's carrying amount and thepresent value of estimated future cash flows, discounted at the financial asset's original effective interest rate.
The carrying amount of the financial asset is reduced by the impairment loss directly for all financial assets with the exception of accountsreceivables, where the carrying amount is reduced through the use of an allowance account. When an accounts receivable is considereduncollectible, it is written off against the allowance account. Subsequent recoveries of amounts previously written off are credited against theallowance account. Changes in the carrying amount of the allowance account are recognized in profit or loss.
The Company derecognizes a financial asset only when the contractual rights to the cash flows from the asset expire, or when it transfers thefinancial asset and substantially all the risks and rewards of ownership of the asset to another entity.
On derecognition of a financial asset, the difference between the asset's carrying amount and the sum of the consideration received andreceivable is recognized in profit or loss.
Account receivables, loans and other receivables that have fixed or determinable payments that are not quoted in an active market are classifiedas loans and receivables. Loans and receivables are measured at amortized cost using the effective interest method, less any impairment.Interest income is recognized by applying the effective interest rate, except for short-term receivables when the recognition of interest would beimmaterial.
The Company derecognizes financial liabilities when, and only when, the Company's obligations are discharged, cancelled or they expire.
Össur Consolidated Financial Statements 2017 38
Notes to the Consolidated Financial Statements
35.20 Employee benefits
35.21 Derivative financial instruments
Hedge accounting
Hedges of net investments in foreign operations
Cash flow hedges
The effective portion of changes in the fair value of derivatives, that are designated and qualify as cash flow hedges, is recognized in othercomprehensive income and accumulated under the heading of hedging reserve. The gain or loss relating to the ineffective portion is recognizedimmediately in profit or loss, and is included in the ‘other financial expense / income' line item.
Amounts previously recognized in Other Comprehensive Income and accumulated in equity are reclassified to profit or loss in the periods whenthe hedged item is recognized in profit or loss, in the same line of the Income Statement as the recognized hedged item. However, when thehedged forecast transaction results in the recognition of a non-financial asset or a non-financial liability, the gains and losses previouslyrecognized in Other Comprehensive Income and accumulated in equity are transferred from equity and included in the initial measurement of thecost of the non-financial asset or non-financial liability.
Hedge accounting is discontinued when the Company revokes the hedging relationship, when the hedging instrument expires, is sold,terminated, exercised, or when it no longer qualifies for hedge accounting. Any gain or loss recognized in Other Comprehensive Income andaccumulated in equity at that time remains in equity and is recognized when the forecast transaction is ultimately recognized in profit or loss.When a forecast transaction is no longer expected to occur, the gain or loss accumulated in equity is recognized immediately in the IncomeStatement.
The Company enters into derivative financial instruments to manage its exposure to interest rate and currency risk. Further details of derivativefinancial instruments are disclosed in note 30.
Derivatives are initially recognized at fair value at the date a derivative contract is entered into and are subsequently remeasured to their fairvalue at each balance sheet date. The resulting gain or loss is recognized in profit or loss immediately unless the derivative is designated andeffective as a hedging instrument, in which event the timing of the recognition in profit or loss depends on the nature of the hedge relationship.The Company designates certain derivatives as either hedges of cash flow of recognized liabilities or hedges of net investments in foreignoperations.
A derivative is presented as a non-current asset or a non-current liability if the remaining maturity of the instrument is more than 12 months and it is not expected to be realized or settled within 12 months. Other derivatives are presented as current assets or current liabilities.
Any gain or loss on the hedging instrument relating to the effective portion of the hedge is recognized in equity in the foreign currencytranslation reserve.
Gains and losses deferred in the foreign currency translation reserve are recognized in profit or loss on disposal of the foreign operation.
The Company designates certain hedging instruments, which include derivatives and non-derivatives in respect of foreign currency risk andinterest rate risk, as either cash flow hedges or hedges of net investment in foreign operations.
At the inception of the hedge relationship the entity documents the relationship between the hedging instrument and hedged item, along with itsrisk management objectives and its strategy for undertaking various hedge transactions. Furthermore, at the inception of the hedge and on anongoing basis, the Company documents whether the hedging instrument that is used in a hedging relationship is highly effective in offsettingchanges in fair values or cash flows of the hedged item.
The hedging reserve within equity represents the cumulative portion of gains and losses on hedging instruments deemed effective in cash flowhedges. The cumulative deferred gain or loss on the hedging instrument is reclassified to profit or loss only when the hedged transaction affectsthe profit or loss, or is included as a basis adjustment to the non-financial hedged item, consistent with the relevant accounting policy.
Retirement benefit costs and termination benefits
Payments to defined contribution retirement benefit plans are recognized as an expense when employees have rendered service entitling themto the contributions.
A liability for a termination benefit is recognized at the earlier of when the entity can no longer withdraw the offer of the termination benefit andwhen the entity recognizes any related restructuring costs.
Össur Consolidated Financial Statements 2017 39
Notes to the Consolidated Financial Statements
35.22 Critical accounting judgments and key sources of estimation uncertainty
In the application of the Company's accounting policies, which are described in note 35, management is required to make judgments, estimatesand assumptions about the carrying amounts of assets and liabilities that are not readily apparent from other sources. The estimates andassociated assumptions are based on historical experience and other factors that are considered to be relevant. Actual results may differ fromthese estimates.
The estimates and underlying assumptions are reviewed on an ongoing basis. Revisions to accounting estimates are recognized in the period inwhich the estimate is revised if the revision affects only that period or in the period of the revision and future periods if the revision affects bothcurrent and future periods.
Determining whether goodwill is impaired requires an estimation of the value in use of the cash-generating units to which goodwill has beenallocated. The value in use calculation requires the entity to estimate the future cash flows expected to arise from the cash-generating unit anda suitable discount rate in order to calculate present value. Details of impairment calculations are set out in note 11.
As described at 35.12, the Company reviews the estimated useful lives of property, plant and equipment at the end of each balance sheet date.
Össur Consolidated Financial Statements 2017 40