Embed Size (px)
Citation preview
1
Illinois Board of Higher Education
2014 Underrepresented Groups Report
STATE OF ILLINOIS BOARD OF HIGHER EDUCATION Report to the Governor and General Assembly On Underrepresented Groups In Illinois Higher Education 2014 Annual Report 2015

2
Illinois Board of Higher Education
2014 Underrepresented Groups Report
Introduction
Illinois Public Act (110 ILCS 205/9.16) requires the Illinois
Board of Higher Education (IBHE) to annually report to the
Governor and General Assembly on the status and conditions of
Underrepresented Student Groups (URGs) in higher education.
Illinois statute defines underrepresented citizens or resident
aliens as persons identified as African American, Hispanic,
Asian American, Pacific Islander, American Indian or Alaskan
Native, persons with disabilities, and first-generation students,
defined as persons who are the first in their immediate family to
attend a postsecondary institution of study.
The objective of the Underrepresented Groups Report is to
articulate the status of the state’s underserved college student
populations, including data on enrollment and degree completion
at Illinois’ public community colleges and universities.
Summaries of the programs and strategies and programs utilized
by the public universities to serve URG students are also
included.
The Illinois Public Agenda for College and Career Success, the
State’s plan for assessing Illinois’ educational progress, has
identified college success gaps of underrepresented groups as a
key impediment to achieving the goal of 60 percent of Illinois
residents with a postsecondary degree or credential by 2025. The
Report finds an upward trend in college completion rates for
Illinois’ African American and Hispanic students. While
increased numbers of graduates is good news, the Report
concludes that acceleration not only of enrollment, but also
persistence to college completions for more underrepresented
students is necessary.
Enrollment and Completion Trends
Figures 1-3 (pages 6-8) depict enrollment and completion trends
over the past five years resulting in positive gains for the two
major URG groups, African Americans and Hispanics.
Students with Disabilities
Data collection for students with disabilities was conducted with
self-reported data. Enrollment information is provided by the
community colleges and public universities and shows a slight
increase but consistent student population. The reporting
institutions have identified policies, programs, and support
activities to assist students with disabilities. The IBHE is
working to include better data on these students through the
Illinois Longitudinal Data System (ILDS).
2012 2013 Difference
Public universities 5,311 5,533 +222
Community colleges 12,342 13,551 +1,209
TOTAL: 17,653 19,084 +1,431
(Source: IBHE and ICCB data)
Table 1
Students with Disabilities, Self-reporting Enrollment
3
Illinois Board of Higher Education
2014 Underrepresented Groups Report
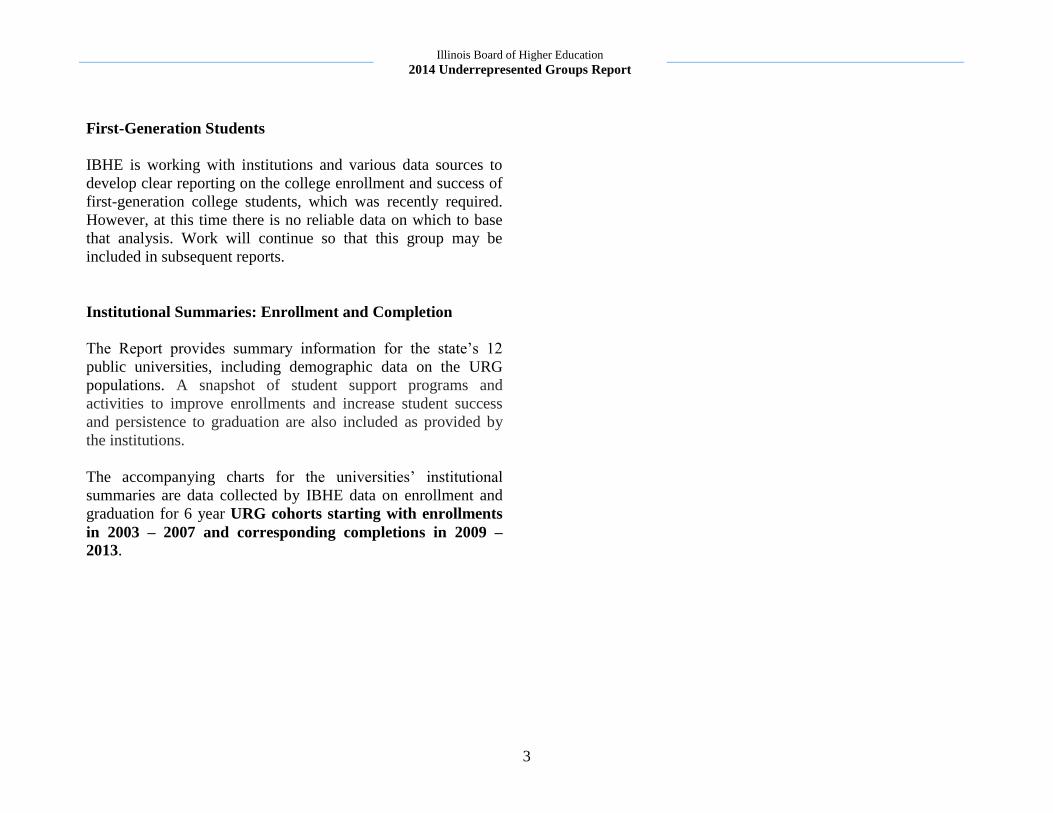
First-Generation Students
IBHE is working with institutions and various data sources to
develop clear reporting on the college enrollment and success of
first-generation college students, which was recently required.
However, at this time there is no reliable data on which to base
that analysis. Work will continue so that this group may be
included in subsequent reports.
Institutional Summaries: Enrollment and Completion
The Report provides summary information for the state’s 12
public universities, including demographic data on the URG
populations. A snapshot of student support programs and
activities to improve enrollments and increase student success
and persistence to graduation are also included as provided by
the institutions.
The accompanying charts for the universities’ institutional
summaries are data collected by IBHE data on enrollment and
graduation for 6 year URG cohorts starting with enrollments
in 2003 – 2007 and corresponding completions in 2009 –
2013.

4
Illinois Board of Higher Education
2014 Underrepresented Groups Report
UNDERREPRESENTED GROUPS ATTAINMENT TRENDS: Enrollment and Completion

5
Illinois Board of Higher Education
2014 Underrepresented Groups Report
Overall URG Enrollment and
Completion
A notable and positive development based
on the enrollment data provided in this
section, is the continued enrollment growth
for Hispanic students. This enrollment
increased over 7,000 students between
academic years 2012 and 2013. African
American student enrollment has
experienced an 8.24% decline during this
period.
Both Hispanic and African American
students’ degrees completed have increased
over the past five academic years.
.
Race and Ethnicity Definitions used for URGs
Alien, Non-resident A person who is not a citizen or national of the United States and who is in this country on a visa or temporary basis and does not have the right to remain indefinitely. Note: Non-resident aliens are to be reported separately in the places provided, rather than in any of the racial/ethnic categories described above.
American Indian or Alaska Native
A person having origins in any of the original peoples of North and South America (including Central America) who maintains cultural identification through tribal affiliation or community attachment.
Asian
A person having origins in any of the original peoples of the Far East, Southeast Asia, or the Indian Subcontinent, including, for example, Cambodia, China, India, Japan, Korea, Malaysia, Pakistan, the Philippine Islands, Thailand, and Vietnam.
Black or African American
A person having origins in any of the black racial groups of Africa. Hispanic or Latino
A person of Cuban, Mexican, Puerto Rican, South or Central American, or other Spanish culture or origin, regardless of race.
Native Hawaiian or Other Pacific Islander
A person having origins in any of the original peoples of Hawaii, Guam, Samoa, or other Pacific Islands.
Race/Ethnicity Unknown
The category used to report students or employees whose race and ethnicity are not known. Two or More Races (No official definition provided, but category is apparent and included with IPEDS listing) White
A person having origins in any of the original peoples of Europe, the Middle East, or North Africa. (Source: IPEDS Definitions for New Race and Ethnicity Categories and IPEDS Changes to Race/Ethnicity Reporting)
6
Illinois Board of Higher Education
2014 Underrepresented Groups Report
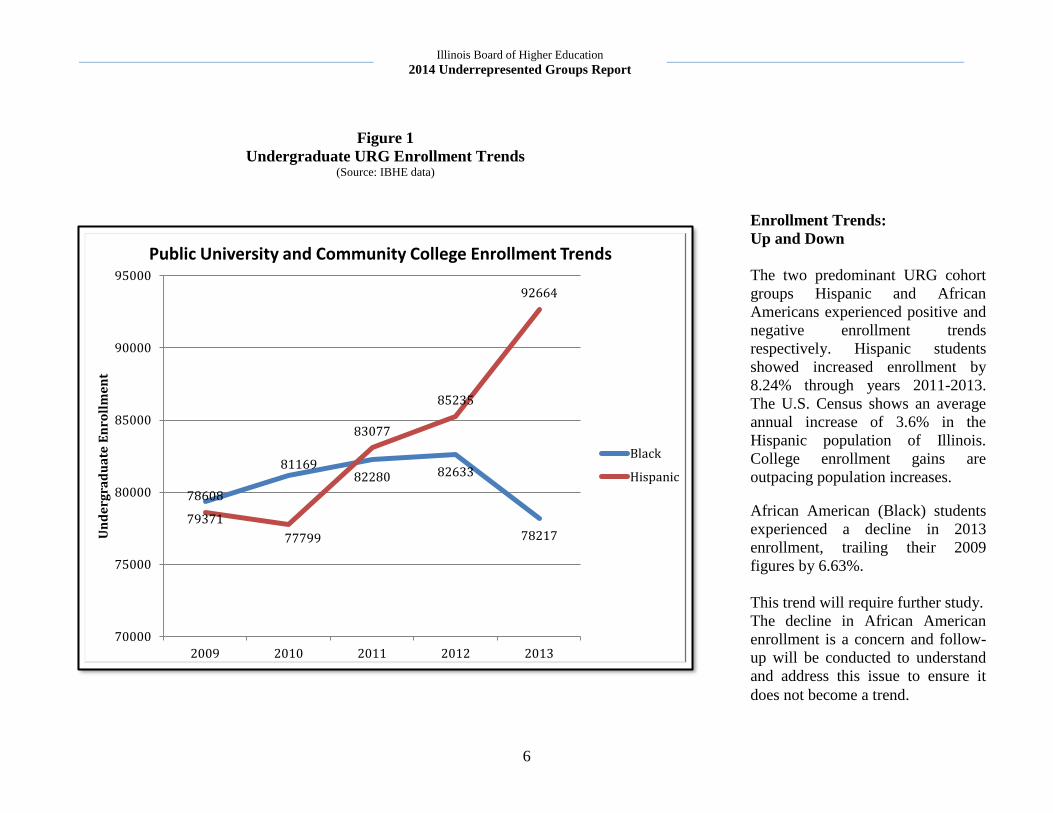
Figure 1
Undergraduate URG Enrollment Trends (Source: IBHE data)
Enrollment Trends:
Up and Down
The two predominant URG cohort
groups Hispanic and African
Americans experienced positive and
negative enrollment trends
respectively. Hispanic students
showed increased enrollment by
8.24% through years 2011-2013.
The U.S. Census shows an average
annual increase of 3.6% in the
Hispanic population of Illinois.
College enrollment gains are
outpacing population increases.
African American (Black) students
experienced a decline in 2013
enrollment, trailing their 2009
figures by 6.63%.
This trend will require further study.
The decline in African American
enrollment is a concern and follow-
up will be conducted to understand
and address this issue to ensure it
does not become a trend.
79371
81169 82280 82633
78217
78608
77799
83077
85235
92664
70000
75000
80000
85000
90000
95000
2009 2010 2011 2012 2013
Un
de
rgra
du
ate
En
roll
me
nt
Public University and Community College Enrollment Trends
Black
Hispanic
7
Illinois Board of Higher Education
2014 Underrepresented Groups Report
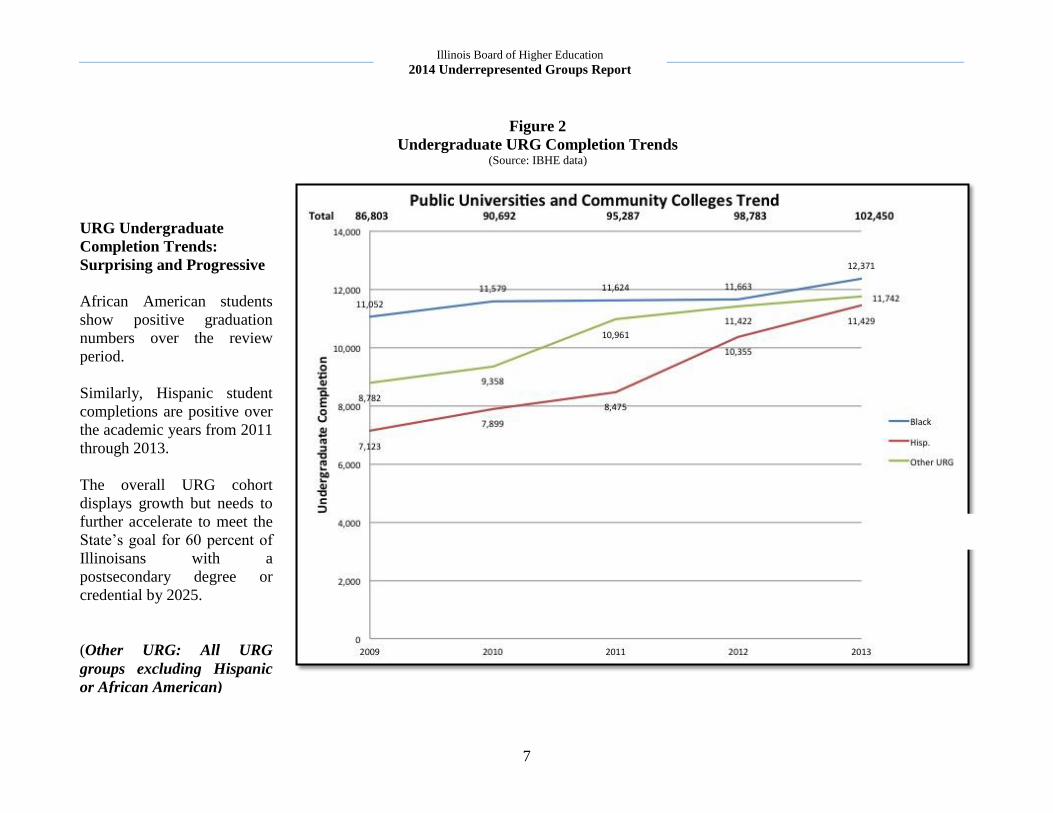
URG Undergraduate
Completion Trends:
Surprising and Progressive
African American students
show positive graduation
numbers over the review
period.
Similarly, Hispanic student
completions are positive over
the academic years from 2011
through 2013.
The overall URG cohort
displays growth but needs to
further accelerate to meet the
State’s goal for 60 percent of
Illinoisans with a
postsecondary degree or
credential by 2025.
(Other URG: All URG
groups excluding Hispanic
or African American)
Figure 2
Undergraduate URG Completion Trends (Source: IBHE data)

8
Illinois Board of Higher Education
2014 Underrepresented Groups Report
0%
10%
20%
30%
40%
50%
60%
70%
80%
90%
UIUC ISU EIU UIC NIU WIU SIUE SIUC UIS CSU NEIU
Total Graduation URG Graduation
The listing of Illinois public universities is
shown in comparison to their URG student
cohort.
The National Center for Educational Statistics
(NCES) provides a 6 year national average
cohort graduation rate of 57%.
(Governors State University is not included in
this cohort group because it did not have
lower division enrollment until 2014.)
Figure 3
Institutional Graduation Comparison NCES data for 2012
9
Illinois Board of Higher Education
2014 Underrepresented Groups Report
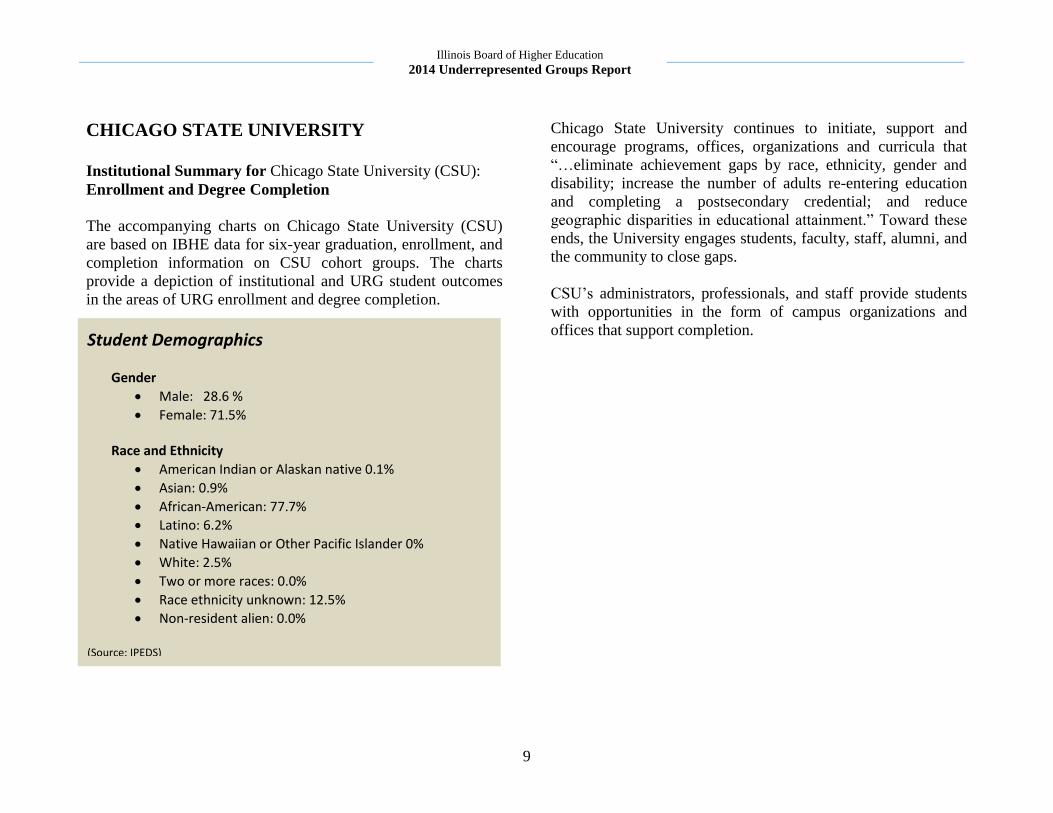
CHICAGO STATE UNIVERSITY
Institutional Summary for Chicago State University (CSU):
Enrollment and Degree Completion
The accompanying charts on Chicago State University (CSU)
are based on IBHE data for six-year graduation, enrollment, and
completion information on CSU cohort groups. The charts
provide a depiction of institutional and URG student outcomes
in the areas of URG enrollment and degree completion.
Chicago State University continues to initiate, support and
encourage programs, offices, organizations and curricula that
“…eliminate achievement gaps by race, ethnicity, gender and
disability; increase the number of adults re-entering education
and completing a postsecondary credential; and reduce
geographic disparities in educational attainment.” Toward these
ends, the University engages students, faculty, staff, alumni, and
the community to close gaps.
CSU’s administrators, professionals, and staff provide students
with opportunities in the form of campus organizations and
offices that support completion. Student Demographics
Gender
Male: 28.6 %
Female: 71.5% Race and Ethnicity
American Indian or Alaskan native 0.1%
Asian: 0.9%
African-American: 77.7%
Latino: 6.2%
Native Hawaiian or Other Pacific Islander 0%
White: 2.5%
Two or more races: 0.0%
Race ethnicity unknown: 12.5%
Non-resident alien: 0.0% (Source: IPEDS)
10
Illinois Board of Higher Education
2014 Underrepresented Groups Report
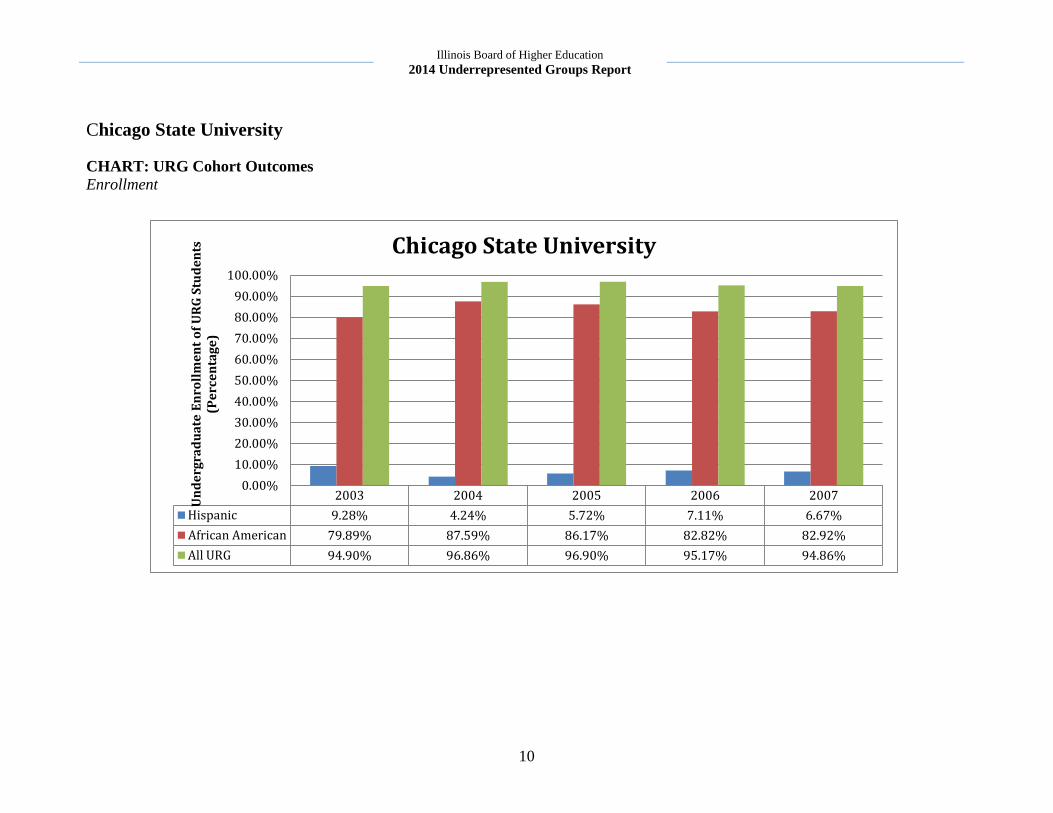
Chicago State University
CHART: URG Cohort Outcomes Enrollment
2003 2004 2005 2006 2007
Hispanic 9.28% 4.24% 5.72% 7.11% 6.67%
African American 79.89% 87.59% 86.17% 82.82% 82.92%
All URG 94.90% 96.86% 96.90% 95.17% 94.86%
0.00%
10.00%
20.00%
30.00%
40.00%
50.00%
60.00%
70.00%
80.00%
90.00%
100.00%
Un
de
rgra
du
ate
En
roll
me
nt
of
UR
G S
tud
en
ts
(Pe
rce
nta
ge
)
Chicago State University
11
Illinois Board of Higher Education
2014 Underrepresented Groups Report
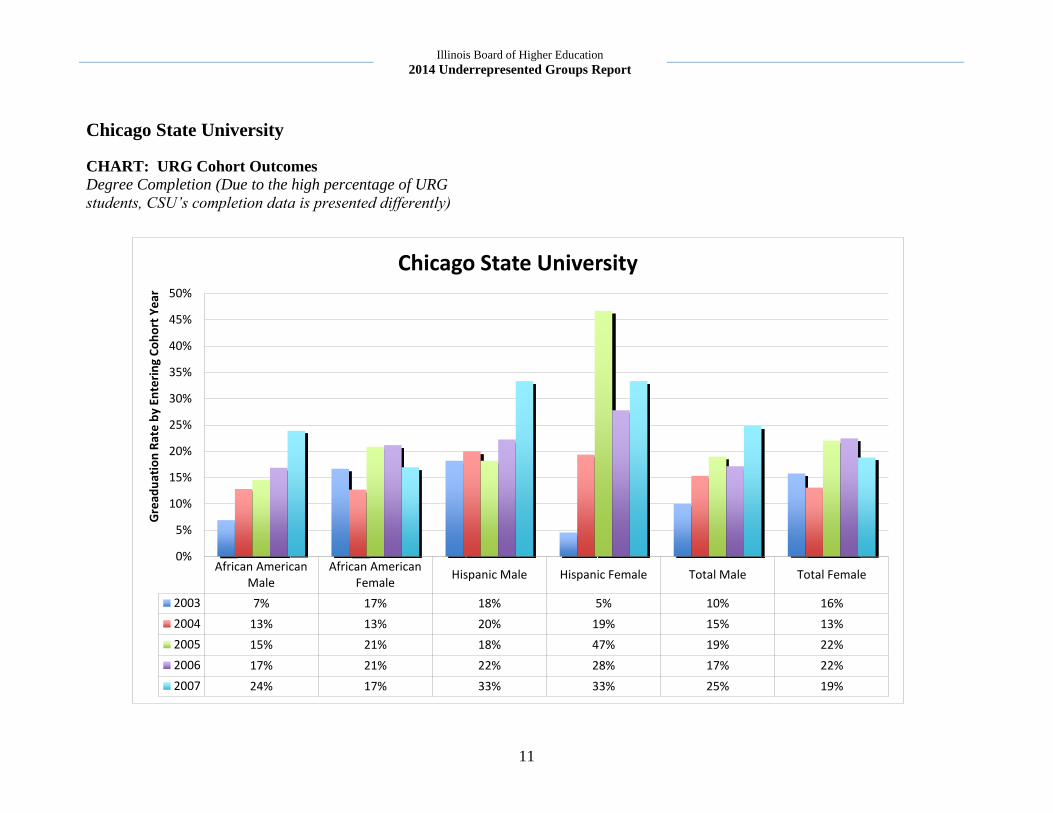
Chicago State University
CHART: URG Cohort Outcomes Degree Completion (Due to the high percentage of URG
students, CSU’s completion data is presented differently)
African American Male
African American Female
Hispanic Male Hispanic Female Total Male Total Female
2003 7% 17% 18% 5% 10% 16%
2004 13% 13% 20% 19% 15% 13%
2005 15% 21% 18% 47% 19% 22%
2006 17% 21% 22% 28% 17% 22%
2007 24% 17% 33% 33% 25% 19%
0%
5%
10%
15%
20%
25%
30%
35%
40%
45%
50%
Gre
adu
atio
n R
ate
by
Ente
rin
g C
oh
ort
Ye
ar
Chicago State University

12
Illinois Board of Higher Education
2014 Underrepresented Groups Report
EASTERN ILLINOIS UNIVERSITY
Institutional Summary for Eastern Illinois University (EIU):
Enrollment and Degree Completion
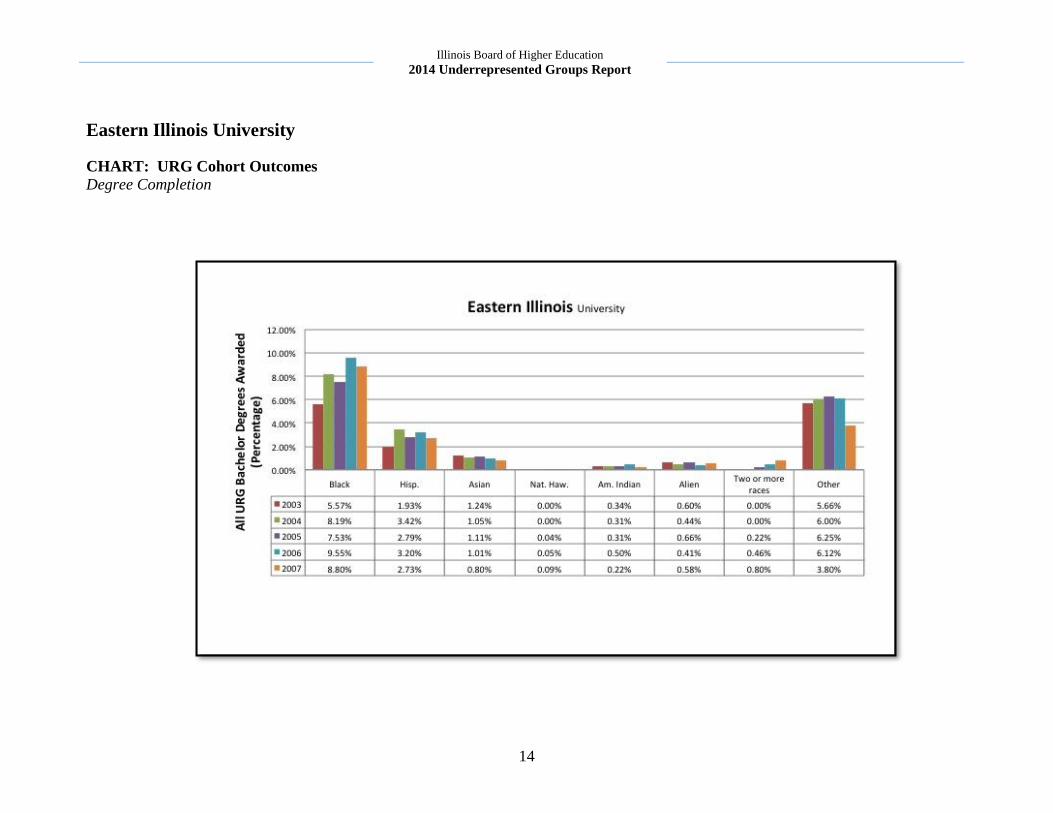
The accompanying charts on Eastern Illinois University (EIU)
are based on IBHE data of six-year graduation, enrollment, and
completion information on EIU cohort groups. The charts
provide a depiction of institutional and URG student outcomes
in the areas of URG enrollment and degree completion.
Eastern Illinois University has identified the Committee on
Retention Efforts (CORE) which is working with faculty and
staff who have a great deal of interaction with new freshmen to
increase ways to use predictor information to help students who
are most at-risk of attrition to succeed. Because new freshmen
all are advised centrally, advisors were asked to determine
strategies that would address their students’ particular at-risk
variables, such as coaching them on the importance of academic
achievement, developing resources to help them find advice with
money matters, and referring them to the Student Success Center
or Career Services for additional guidance on study skills, time
management, and career options suited to students’ strengths.
Financial counseling and planning services are provided by the
Bursar’s office to students with the highest percentage of unmet
need to discuss ways to pay for school .In conjunction with the
Office of Financial Aid, information has been developed to help
students understand their financial statements. Instructors
teaching University Foundations, EIU’s freshman seminar,
augmented their syllabi to include greater emphasis on financial
literacy and provided instruction on how to use EIU’s
scholarship engine to secure college funds.
In an effort on increase Hispanic student engagement, University
Housing and Dining held focus groups with them and
established events such as Latino Family Weekend. University
Foundation instructors encouraged participation in LASO, the
Latin American Student Organization, to get them involved on
campus, with a resulting fall to spring retention rate of 74.3%
for the most at-risk students. Individual attention continues with
at-risk students to encourage them to continue on to graduation.
Student Demographics
Gender
Male: 40.4%
Female: 59.7% Race and Ethnicity
American Indian or Alaskan native: 0.2%
Asian: 0.8%
African-American: 17.9%
Latino: 4.9%
Native Hawaiian or Other Pacific Islander: 0.1%
White: 70.9%
Two or more races: 1.8%
Race ethnicity unknown: 3.0%
Non-resident alien: 0.9% (Source: IPEDS)
13
Illinois Board of Higher Education
2014 Underrepresented Groups Report
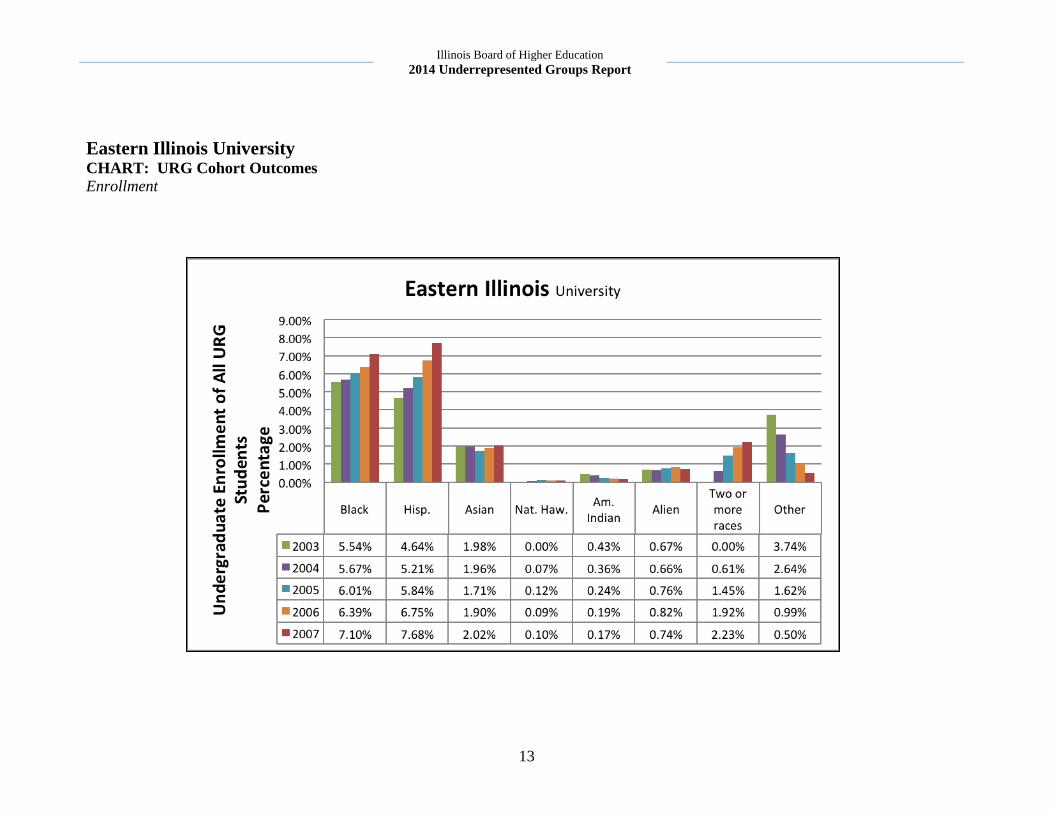
Eastern Illinois University
CHART: URG Cohort Outcomes Enrollment
14
Illinois Board of Higher Education
2014 Underrepresented Groups Report
Eastern Illinois University
CHART: URG Cohort Outcomes Degree Completion

15
Illinois Board of Higher Education
2014 Underrepresented Groups Report
GOVERNORS STATE UNIVERSITY
Institutional Summary for Governors State University (GSU):
Enrollment and Degree Completion
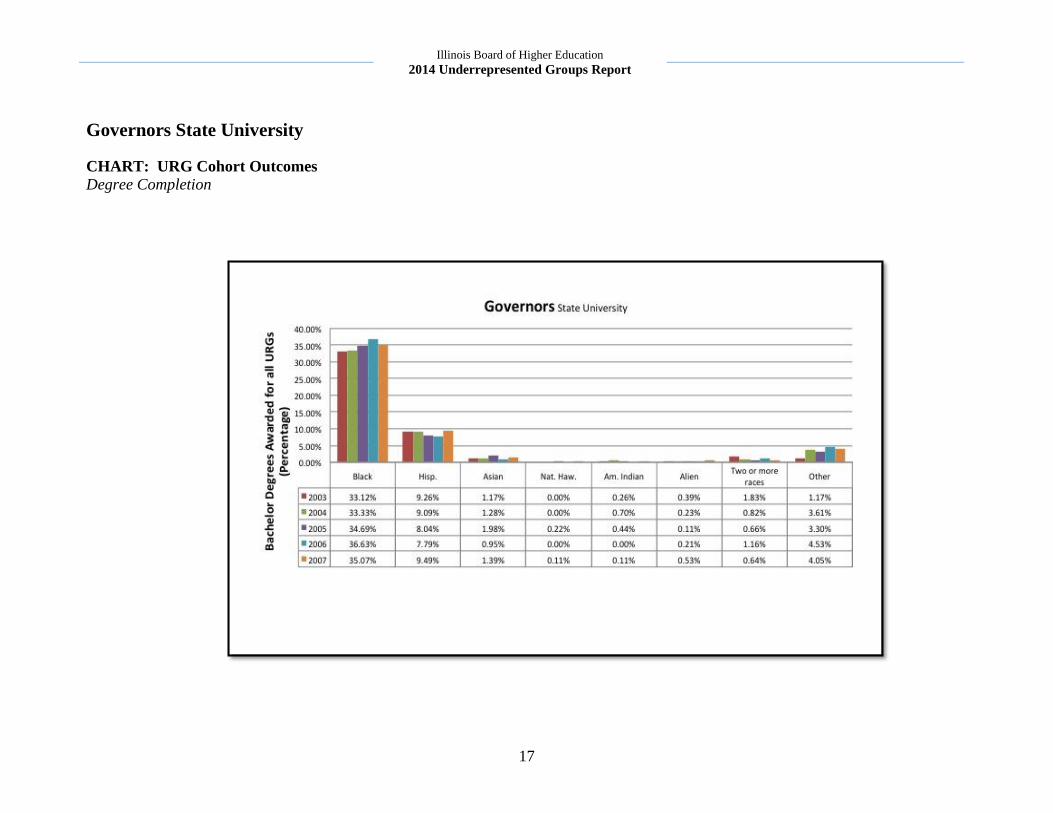
The accompanying charts on Governors State University (GSU)
are based on IBHE data of six-year graduation, enrollment, and
completion information on GSU. The charts provide a depiction
of institutional and URG student outcomes in the areas of
enrollment and degree completion.
Governors State University defines itself as a groundbreaking
center of learning and innovation for four decades, and is
uniquely positioned to play a key role in creating 21st century,
state-of-the art educational programming. GSU has long offered
educational opportunities to underserved, non-traditional
students and remains committed to creating an intellectually
stimulating public square, serving the region and being a model
of diversity. The Student Enrichment Program (SEP) provides
programming, support, and resources that promote academic
excellence, degree completion, self-awareness, socialization, and
professional development to first-generation, income eligible
students, designed to increase graduation and retention rates
among the underrepresented population served at GSU.
GSU’s Academic Resource Center (ARC) promotes the personal
growth of students and to enrich their academic experience
through advising, counseling, access services for students with
disabilities, tutoring, testing, and writing center services. ARC
offers interactive programs, workshops, presentations, and group
discussions to classes, student organizations, and other on-
campus groups, including a variety of outreach programs for
common mental health issues.
The Student Concerns Program is designed to ensure timely
outreach to students that are believed to be in distress or acting
in a manner of concern, and connect them to resources best
suited to serve their needs, with proactive outreach and
assistance.
Student Demographics
Gender
Male: 32.0%
Female: 68.0%
Race and Ethnicity
American Indian or Alaskan native: 0.4%
Asian: 1.5%
African-American: 34.6%
Latino: 10.0%
Native Hawaiian or Other Pacific Islander: 0.2%
White: 42.6%
Two or more races: 1.4%
Race ethnicity unknown: 8.7%
Non-resident alien: 0.6% (Source: IPEDS)

16
Illinois Board of Higher Education
2014 Underrepresented Groups Report
Governors State University
CHART: URG Cohort Outcomes Enrollment
17
Illinois Board of Higher Education
2014 Underrepresented Groups Report
Governors State University
CHART: URG Cohort Outcomes Degree Completion
18
Illinois Board of Higher Education
2014 Underrepresented Groups Report
ILLINOIS STATE UNIVERSITY
Institutional Summary for Illinois State University (ISU):
Enrollment and Degree Completion
The accompanying charts on Illinois State University (ISU) are
based on IBHE data of six-year graduation, enrollment, and
completion information on ISU cohort groups. The charts
provide a depiction of institutional and URG student outcomes
in the areas of enrollment and degree completion.
Illinois State University’s Student Support Services and TRIO
(SSS/TRIO) programs are Federal outreach and student services
programs designed to identify and provide services for
individuals from disadvantaged backgrounds. ISU identified
these services and staff that go above and beyond the traditional
advising roles to meet the holistic needs of program participants
and to build community support as major factors of the
programs’ success. Funding for two full time academic advisors,
program administrative support, and 50% support for a program
coordinator with the other 50% funded from General Revenue
dollars. This staffing model allows for more one-on-one student
contact, intrusive academic advising, and academic success
coaching than traditional advising caseloads at the University.
The SSS/TRIO program goals are to: 1) identify eligible
undergraduate students with a demonstrated academic need and
the potential to graduate within a six-year period; 2) encourage
strong academic performance by improving academic skills,
academic planning, and monitoring class performance; 3) assist
and advocate for participants as they navigate the university
system; 4) assist with career development and
graduate/professional school preparation; 5) assist efforts to
reduce any unmet financial need; 6) provide special support to
transfer students as they transition to the four-year institution;
and 7) work to circumvent any types of obstacles that may
prevent retention and graduation of program participants. The
program provides opportunities for students to enrich their
educational experiences and build community through an array
of co-curricular programming. Examples of recent programs
include: apartment living, stress reduction, financial literacy,
navigating financial aid and the FAFSA, post-graduation
planning, community service activities, and end of the year
Student Demographics
Gender
Male: 45%
Female: 55%
Race and Ethnicity
American Indian or Alaskan native: 0.2%
Asian: 2.0%
African-American: 7.1%
Latino: 7.7%
Native Hawaiian or Other Pacific Islander: 0.1%
White: 79.5%
Two or more races: 2.2%
Race ethnicity unknown: 0.5%
Non-resident alien: 0.7% (Source: IPEDS)
19
Illinois Board of Higher Education
2014 Underrepresented Groups Report
celebrations. These programs also prepare students for life after
graduation.
SSS/TRIO program participants excel at ISU at rates
significantly higher than the overall University averages. Most
recent data from Fall, 2013 identified 88% of TRIO program
participants to be in good academic standing with an average
cumulative GPA of a 2.57/4.0. Data from the 2012-2013
academic year reported that TRIO students had an overall
persistence rate of 87%, 91% maintained good academic
standing, and 59% completed a bachelor’s degree.
20
Illinois Board of Higher Education
2014 Underrepresented Groups Report
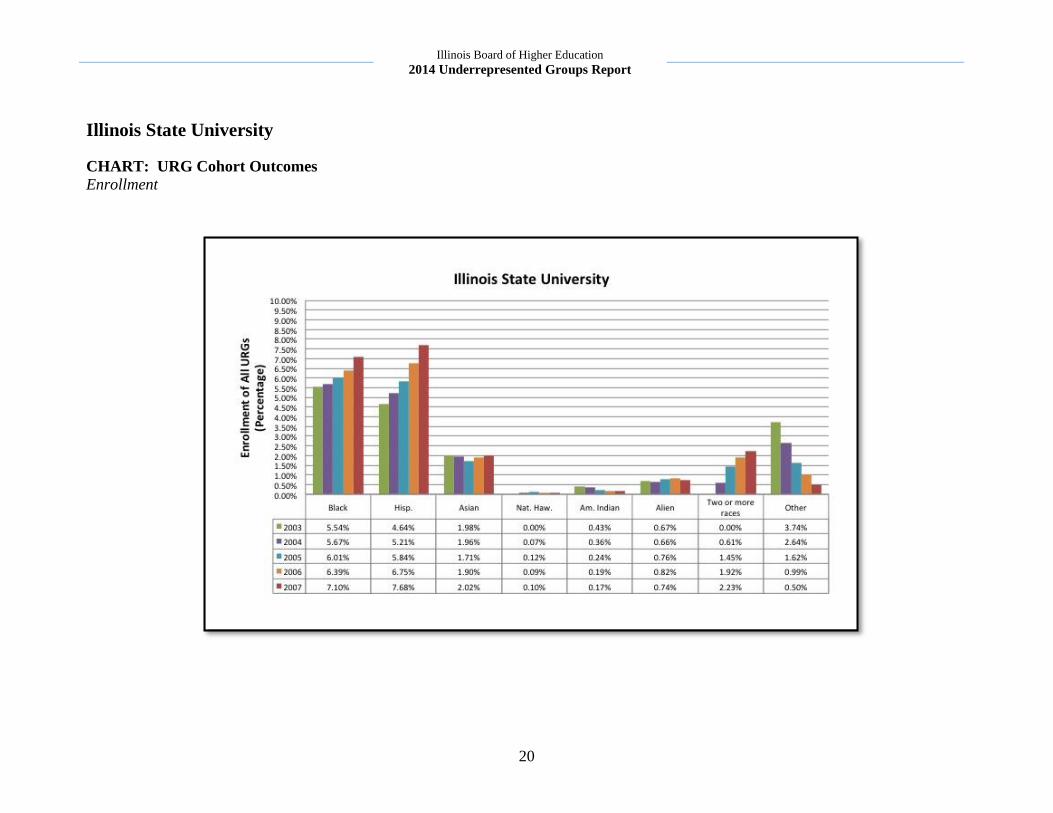
Illinois State University
CHART: URG Cohort Outcomes Enrollment

21
Illinois Board of Higher Education
2014 Underrepresented Groups Report
Illinois State University
CHART: URG Cohort Outcomes Degree Completion
22
Illinois Board of Higher Education
2014 Underrepresented Groups Report
NORTHEASTERN ILLINOIS UNIVERSITY Institutional Summary for Northeastern Illinois University
(NEIU):
Enrollment and Degree Completion
The accompanying charts on Northeastern Illinois University
(NEIU) are based on IBHE data of six-year graduation,
enrollment, and completion information on NEIU cohort groups.
The charts provide a depiction of institutional and URG student
outcomes in the areas of enrollment and degree completion.
Northeastern Illinois University has a significant diversity of
enrolled students, and has identified collaborative efforts
through extensive outreach, admission and various institutional
programs to effectively serve underrepresented student
populations.
Student Demographics
Gender
Male: 44.7%
Female: 55.3%
Race and Ethnicity
American Indian or Alaskan native: 0.2%
Asian: 9.4%
African-American: 10.2%
Latino: 34.9%
Native Hawaiian or Other Pacific Islander: 0.3%
White: 36.9%
Two or more races: 1.7%
Race ethnicity unknown: 2.5%
Non-resident alien: 4.0% (Source: IPEDS)
23
Illinois Board of Higher Education
2014 Underrepresented Groups Report
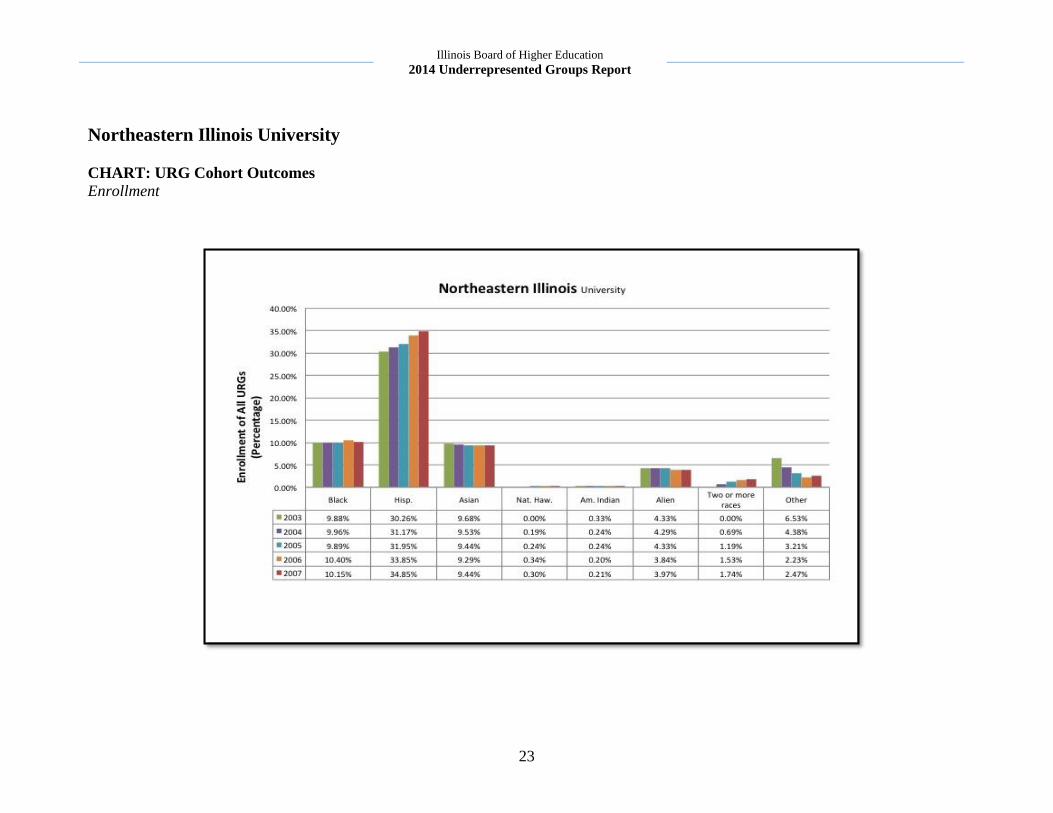
Northeastern Illinois University
CHART: URG Cohort Outcomes Enrollment
24
Illinois Board of Higher Education
2014 Underrepresented Groups Report
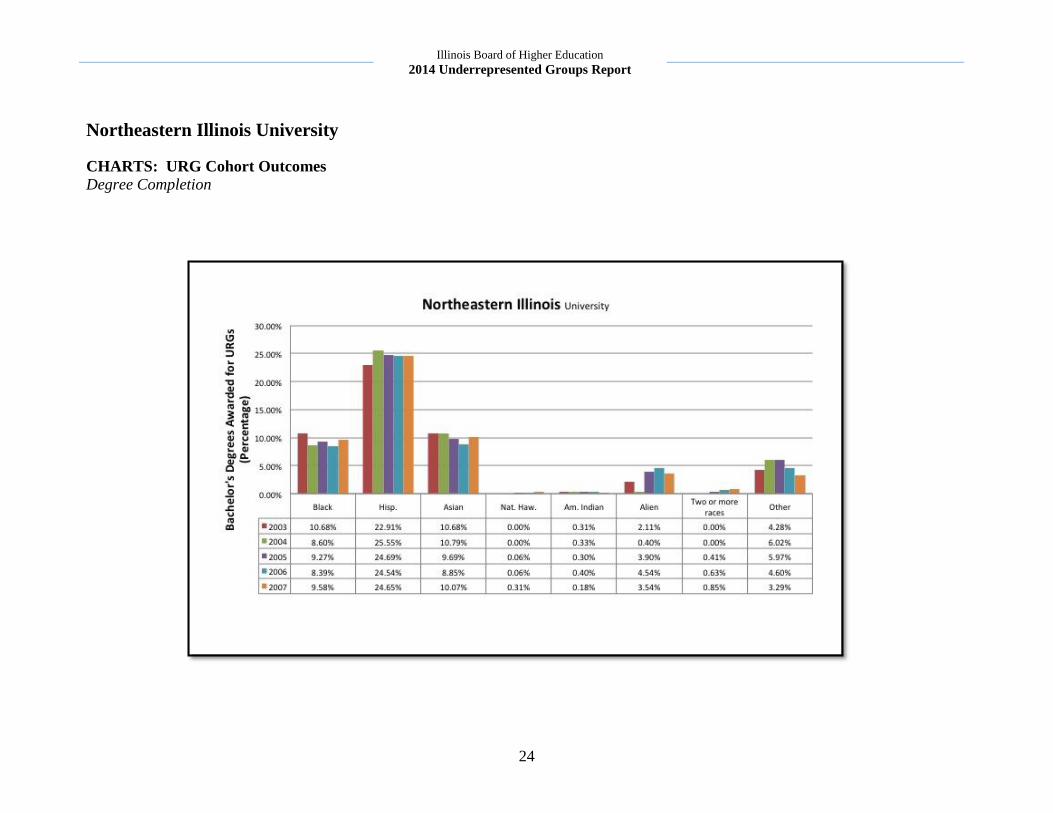
Northeastern Illinois University
CHARTS: URG Cohort Outcomes Degree Completion

25
Illinois Board of Higher Education
2014 Underrepresented Groups Report
NORTHERN ILLINOIS UNIVERSITY
Institutional Summary for Northern Illinois University (NIU):
Enrollment and Degree Completion
The accompanying charts on Northern Illinois University (NIU)
are based on IBHE data of six-year graduation, enrollment, and
completion information on NIU cohort groups. The charts
provide a depiction of institutional and URG student outcomes
in the areas of URG enrollment and degree completion.
Northern Illinois University works to provide services that will
help students persist and graduate from NIU. The institution
works to assist with the transition to employment or
graduate/professional school. The types of services offered
are: individual academic, career, and personal counseling,
involvement with specific student groups, special recognition,
group workshops, a computer lab, courses taught for credit, and
special cultural events and outings.
Student Demographics
Gender
Male: 50.1%
Female: 49.9%
Race and Ethnicity
American Indian or Alaskan native: 0.2%
Asian: 4.9%
African-American: 16.7%
Latino: 13.0%
Native Hawaiian or Other Pacific Islander: 0.1%
White: 59.0%
Two or more races: 2.9%
Race ethnicity unknown: 1.8%
Non-resident alien: 1.4% (Source: IPEDS)

26
Illinois Board of Higher Education
2014 Underrepresented Groups Report
Northern Illinois University
CHART: URG Cohort Outcomes Enrollment

27
Illinois Board of Higher Education
2014 Underrepresented Groups Report
Northern Illinois University
CHART: URG Cohort Outcomes Degree Completion
28
Illinois Board of Higher Education
2014 Underrepresented Groups Report
SOUTHERN ILLINOIS UNIVERSITY
CARBONDALE Institutional Summary for Southern Illinois University
Carbondale (SIUC):
Enrollment and Degree-Completion
The accompanying charts on Southern Illinois University
Carbondale (SIUC) are based on IBHE data of six-year
graduation, enrollment, and completion information on SIUC
cohort groups. The charts provide a depiction of institutional
and URG student outcomes in the areas of URG enrollment and
degree completion.
SIU Carbondale uses a variety of activities to recruit students
such as attending college fairs, visiting high schools, bringing
groups to campus, and reconnecting with alumni who can assist
with recruitment in specific locations. Hispanic recruitment
activities include campus visits from Latino high school groups
such as Benito Juarez, Aspira, and Roberto Clemento Academy.
Admission recruiters also attended a variety of college fairs
around the state. Recruitment focused on African American
students included a campus visit from the Chicago Vocational
Career Academy in spring 2013, and participation in targeted
high school visits/college fairs such as East St. Louis High
School, Inaugural Black Student Leadership Conference College
Fair, Indiana Black Expo, Inc., and York Community High
School. Recruitment for women have included participation at
the Southern Illinois Women’s Teen Conference, providing on-
campus events and outreach to women.
Disability Support Services (DSS) is known nationwide for the
services it provides students with disabilities. For recruitment
purposes, DSS coordinates with Admissions to make
appointments with prospective students with disabilities. DSS
participates in college fairs such as Lincoln-Way District 210
Turning Point; Thornton Special Needs Fair; Directions College
Fair, and Individuals with Disability (IWD) conferences. The
Achieve Program, a unit of DSS, provides comprehensive
academic support services to college students with learning
disabilities. DDS, funded through student fees, has been
successfully assisting students for over 30 years, maintaining
services to an average of 100 students a semester.
Student Demographics
Gender
Male: 54.7%
Female: 45.3%
Race and Ethnicity
American Indian or Alaskan native: 0.3%
Asian: 1.8%
African-American: 20.1%
Latino: 7.1%
Native Hawaiian or Other Pacific Islander: 0.1%
White: 64.1%
Two or more races: 2.8%
Race ethnicity unknown: 0.1%
Non-resident alien: 3.6% (Source: IPEDS)
29
Illinois Board of Higher Education
2014 Underrepresented Groups Report
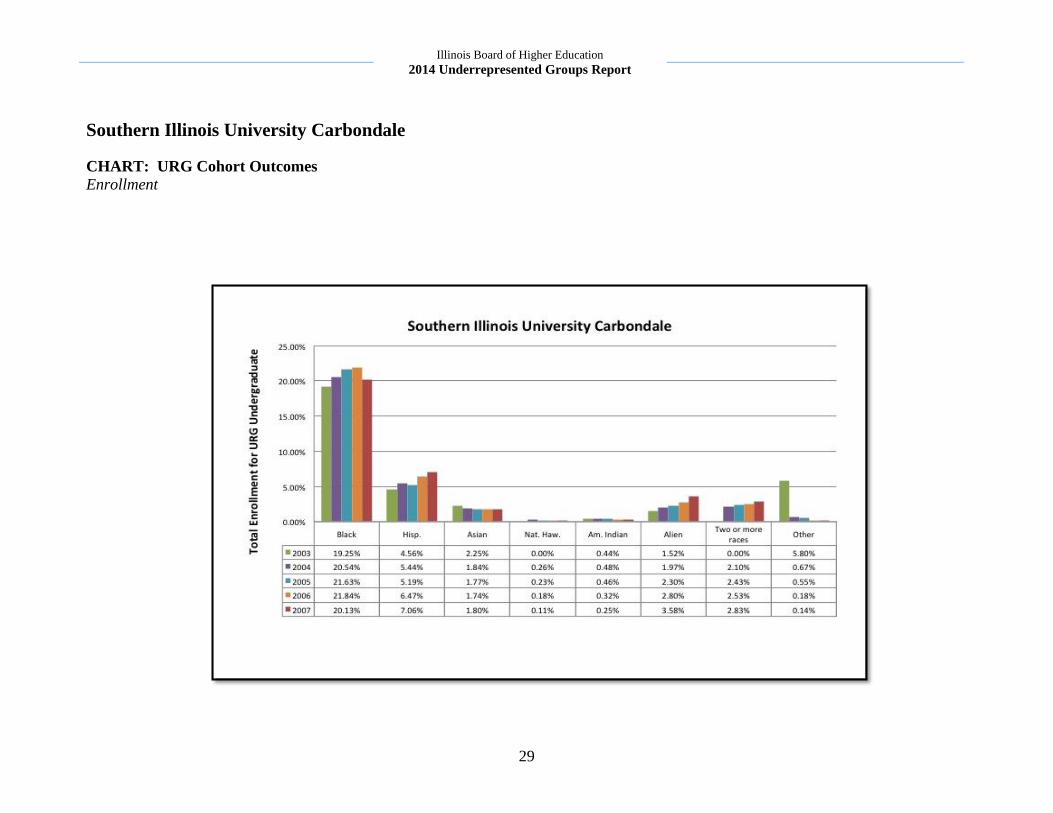
Southern Illinois University Carbondale
CHART: URG Cohort Outcomes Enrollment
30
Illinois Board of Higher Education
2014 Underrepresented Groups Report
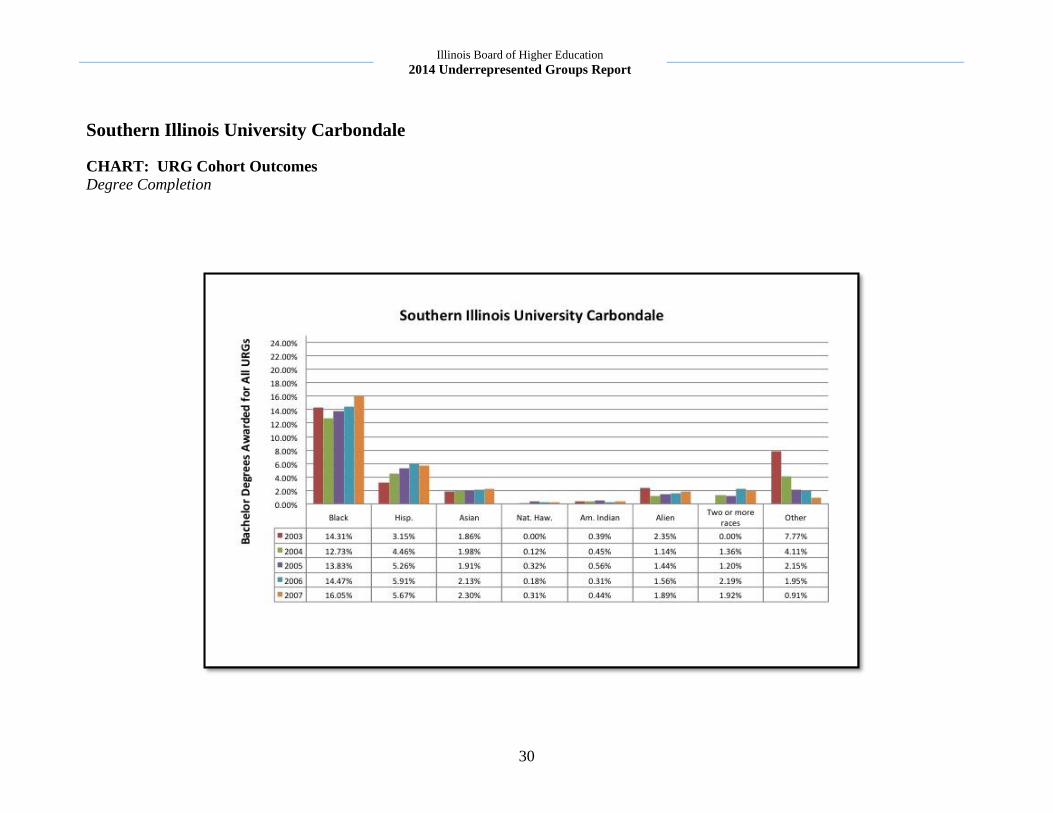
Southern Illinois University Carbondale
CHART: URG Cohort Outcomes Degree Completion

31
Illinois Board of Higher Education
2014 Underrepresented Groups Report
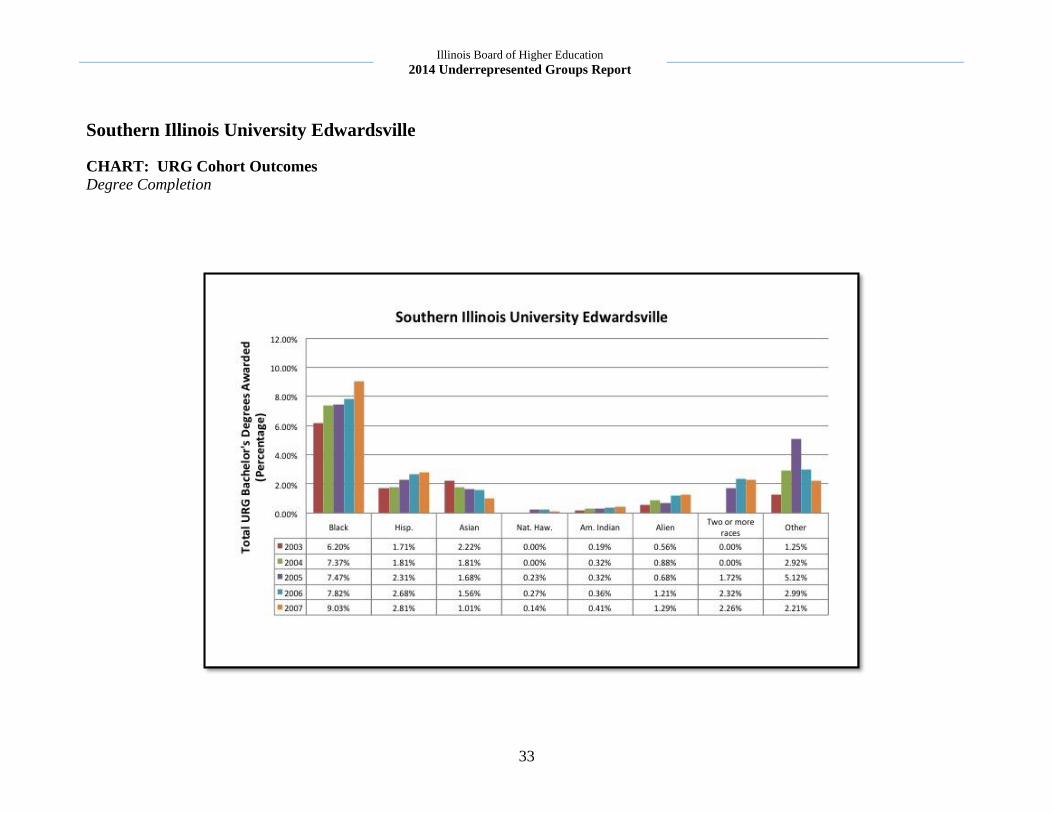
SOUTHERN ILLINOIS UNIVERSITY
EDWARDSVILLE
Institutional Summary for Southern Illinois University
Edwardsville (SIUE):
Enrollment and Degree Completion
The accompanying charts on Southern Illinois University
Edwardsville (SIUE) are based on IBHE data of six-year
graduation, enrollment, and completion information on SIUE
cohort groups. The charts provide a depiction of institutional
and URG student outcomes in the areas of URG enrollment and
degree completion.
SIU Edwardsville’s Office of Retention and Student Success
supports and works with all students at SIUE to successfully
achieve the retention goals of the University. SIUE has
established the SOAR program to proactively deliver
institutional support early in the first year. By utilizing retention
strategies such as peer tutoring and mentoring, small group study
sessions, academic progress reporting, early warning systems,
and comprehensive tracking methods, academic progress and
retention rates of first-year students in SOAR are two percentage
points higher than non-participating students. The number of
SOAR students on the Dean’s List increase, while the number of
program participants on academic probation and those with
suspension status decrease. SOAR students who entered the
University in fall 2012 performed very well academically, with
89 of the 180 participants (49%) earning 3.00 or higher grade
point averages.
Student Demographics
Gender
Male: 47.2%
Female: 52.9%
Race and Ethnicity
American Indian or Alaskan native: 0.2%
Asian: 1.5%
African-American: 14.5%
Latino: 3.6%
Native Hawaiian or Other Pacific Islander: 0.1%
White: 74.6%
Two or more races: 2.9%
Race ethnicity unknown: 1.6%
Non-resident alien: 1.0% (Source: IPEDS)

32
Illinois Board of Higher Education
2014 Underrepresented Groups Report
Southern Illinois University Edwardsville
CHART: URG Cohort Outcomes
Enrollment
33
Illinois Board of Higher Education
2014 Underrepresented Groups Report
Southern Illinois University Edwardsville
CHART: URG Cohort Outcomes Degree Completion
34
Illinois Board of Higher Education
2014 Underrepresented Groups Report
UNIVERSITY OF ILLINOIS CHICAGO Institutional Summary for University of Illinois Chicago
(UIC):
Enrollment and Degree-Completion
The accompanying charts on University of Illinois Chicago
(UIC) are based on IBHE data of six-year graduation,
enrollment, and completion information on UIC cohort groups.
The charts provide a depiction of institutional and URG student
outcomes in the areas of URG enrollment and degree
completion.
University of Illinois Chicago’s urban mission includes a focus
on diversity, including race, ethnicity, as well as social economic
status of students, and is noted for being one of the most diverse
campuses in the United States.
UIC has a number of initiatives that have and continue to be
effective in areas of retention and graduation increases,
including student success planning initiatives, collaborations for
undergraduate success, and a variety of programs on campus to
encourage the further development of students
While the average UIC six-year graduation rate is approximately
57%, the most recent data shows Hispanic students graduate at
approximately 49%, and African-American students graduate at
approximately 44%, showing steady increase over the past three
years.
Student Demographics
Gender
Male: 49.6%
Female: 50.4%
Race and Ethnicity
American Indian or Alaskan native: 0.1%
Asian: 22.4%
African-American: 7.8%
Latino: 24.7%
Native Hawaiian or Other Pacific Islander: 0.4%
White: 37.9%
Two or more races: 2.5%
Race ethnicity unknown: 2.1%
Non-resident alien: 2.1% (Source: IPEDS)
35
Illinois Board of Higher Education
2014 Underrepresented Groups Report
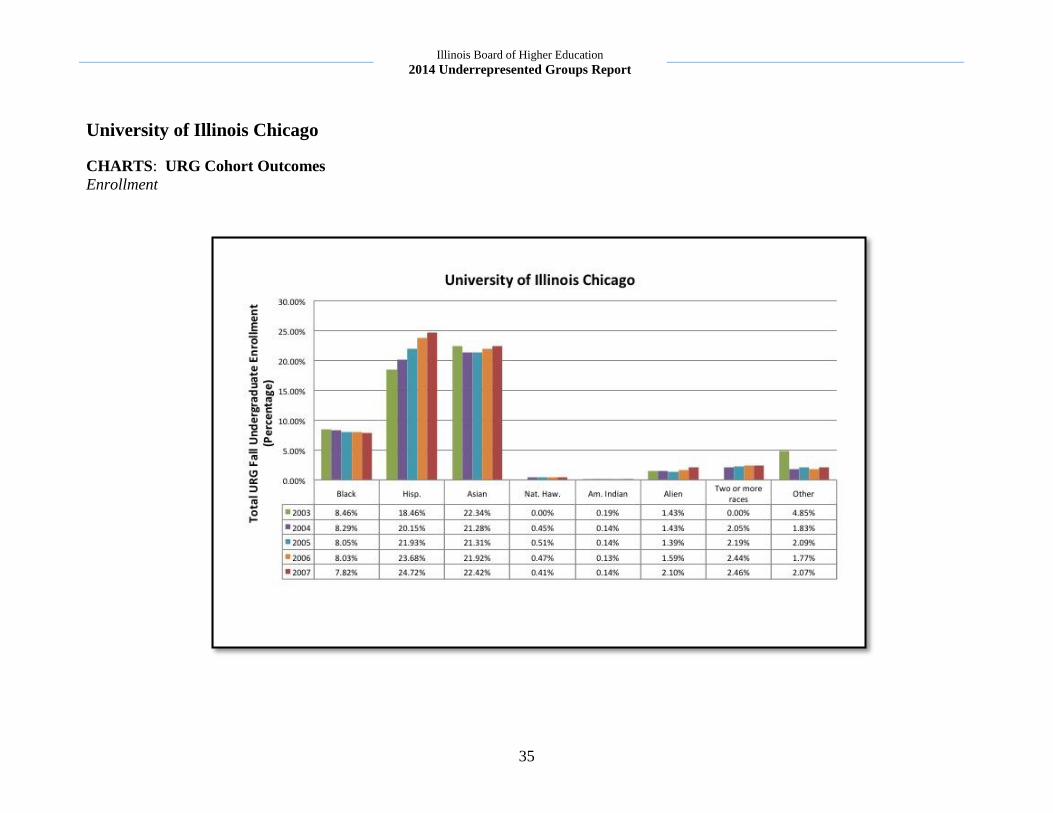
University of Illinois Chicago
CHARTS: URG Cohort Outcomes
Enrollment
36
Illinois Board of Higher Education
2014 Underrepresented Groups Report
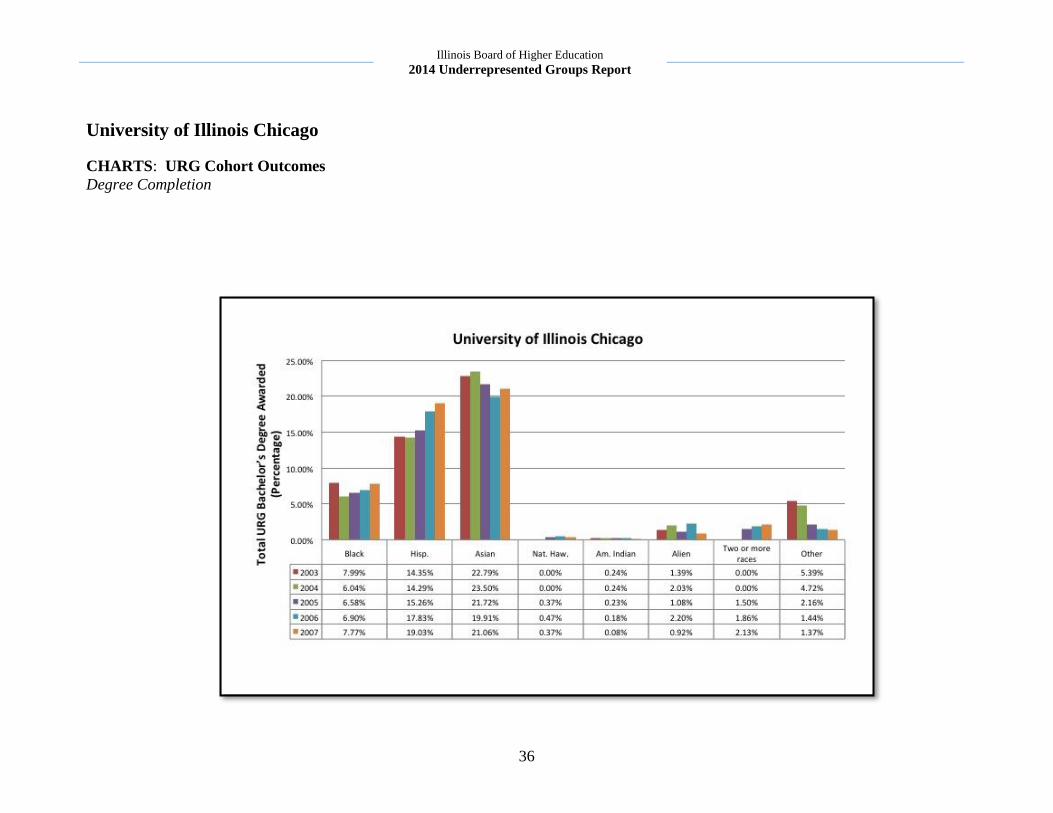
University of Illinois Chicago
CHARTS: URG Cohort Outcomes
Degree Completion

37
Illinois Board of Higher Education
2014 Underrepresented Groups Report
UNIVERSITY OF ILLINOIS SPRINGFIELD
Institutional Summary for University of Illinois Springfield
(UIS):
Enrollment and Degree Completion
The accompanying charts on University of Illinois Springfield
(UIS) are based on IBHE data of six-year graduation,
enrollment, and completion information on UIS cohort groups.
The charts provide a depiction of institutional and URG student
outcomes in the areas of URG enrollment and degree
completion.
University of Illinois Springfield has emphasized unique
potential for learning with living communities that positively
impact student educational success. UIS has identified that
students in these communities not only perform better in class
but demonstrate confidence connected to their peers, faculty and
staff, and the institution. These unique communities bring
academics into the overall campus experience through multi-
curricular activities, advising referral services, tutoring and
special opportunities for students to interact with faculty and
staff outside the classroom.
The Necessary Steps Mentoring program is a campus initiative
to help transition students to university life at UIS. The program
is targeted at first-generation students helping students overcome
problems students in their first year of college often face.
The Students Transitioning for Academic Retention And
Success (STARS) program is a selective volunteer program
offering freshmen, including underrepresented students, a
variety of additional academic supports to help ensure success at
UIS.
Student Demographics
Gender
Male: 49.0%
Female: 51.0%
Race and Ethnicity
American Indian or Alaskan native: 0.1%
Asian: 3.6%
African-American: 13.2%
Latino: 5.9%
Native Hawaiian or Other Pacific Islander: 0.1%
White: 67.6%
Two or more races: 2.5%
Race ethnicity unknown: 3.6%
Non-resident alien: 3.5% (Source: IPEDS)
38
Illinois Board of Higher Education
2014 Underrepresented Groups Report
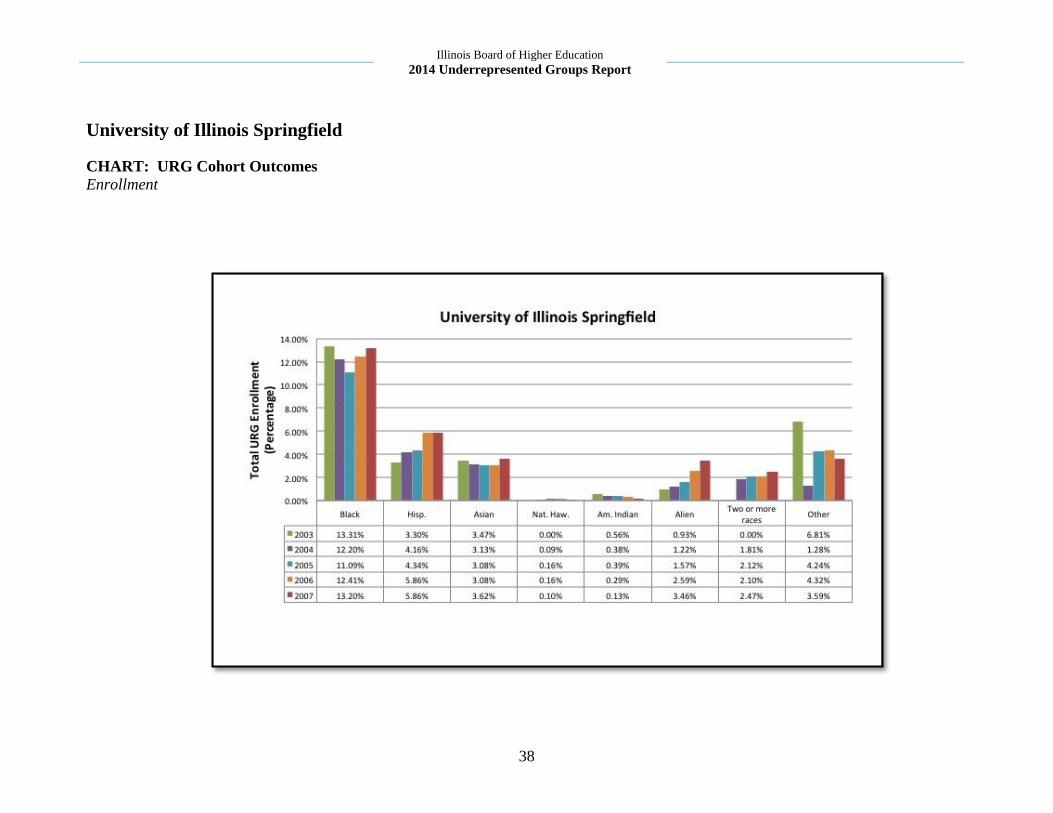
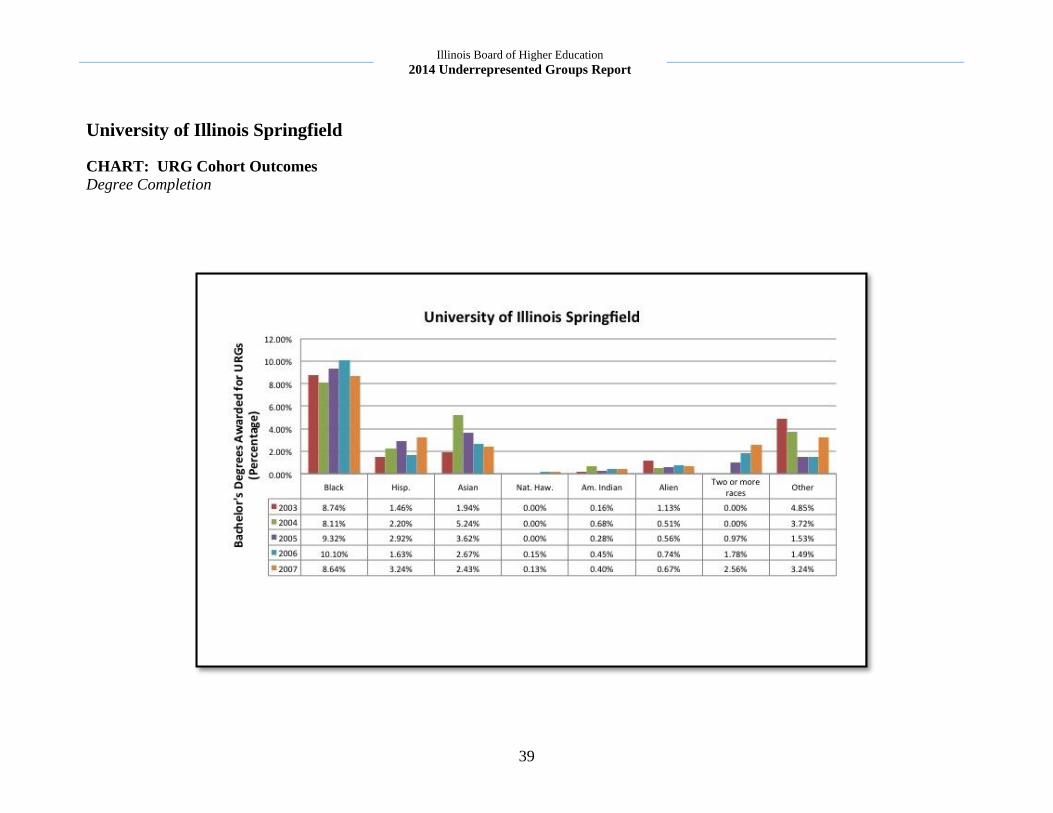
University of Illinois Springfield
CHART: URG Cohort Outcomes Enrollment
39
Illinois Board of Higher Education
2014 Underrepresented Groups Report
University of Illinois Springfield
CHART: URG Cohort Outcomes Degree Completion
40
Illinois Board of Higher Education
2014 Underrepresented Groups Report
UNIVERSITY OF ILLINOIS URBANA-
CHAMPAIGN Institutional Summary for University of Illinois Urbana-
Champaign (UIUC):
Enrollment and Degree Completion
The accompanying charts on University of Illinois Urbana
Champaign (UIUC) are based on IBHE data of six-year
graduation, enrollment, and completion information on UIUC
cohort groups. The charts provide a depiction of institutional
and URG student outcomes in the areas of URG enrollment and
degree completion.
The University of Illinois Urbana –Champaign offers programs
that support the goals of recruitment and completion of
underrepresented students, by providing enrichment
opportunities, skill development, academic support, and
mentoring to promote academic achievement and success on
campus and beyond.
Student Demographics
Gender
Male: 56.5%
Female: 43.6%
Race and Ethnicity
American Indian or Alaskan native: 0.1%
Asian: 15.1%
African-American: 5.5%
Latino: 8.1%
Native Hawaiian or Other Pacific Islander: 0.2%
White: 52.5%
Two or more races: 2.5%
Race ethnicity unknown: 0.7%
Non-resident alien: 15.4% (Source: IPEDS)

41
Illinois Board of Higher Education
2014 Underrepresented Groups Report
University of Illinois Urbana-Champaign
CHART: URG Cohort Outcomes Enrollment
42
Illinois Board of Higher Education
2014 Underrepresented Groups Report
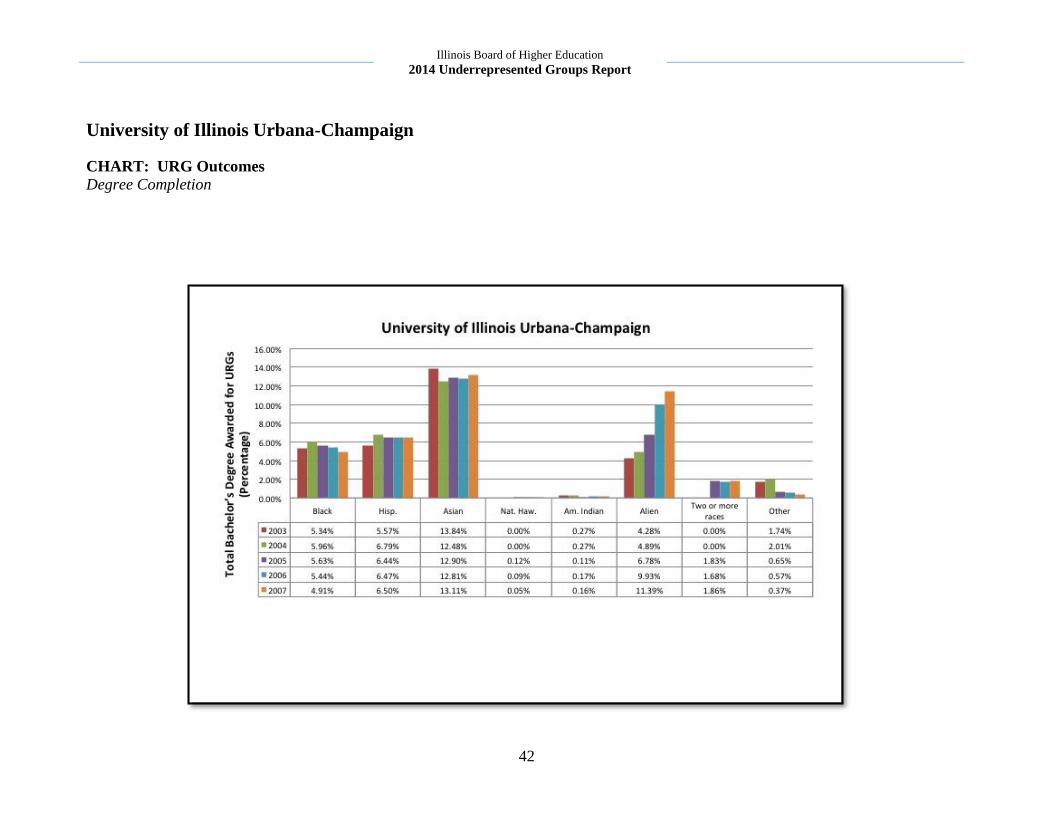
University of Illinois Urbana-Champaign
CHART: URG Outcomes Degree Completion
43
Illinois Board of Higher Education
2014 Underrepresented Groups Report
WESTERN ILLINOIS UNIVERSITY
Institutional Summary for Western Illinois
University (WIU)
Enrollment and Degree Completion
The accompanying charts on University of Western Illinois
University (WIU) are based on IBHE data of six-year
graduation, enrollment, and completion information on WIU
cohort groups. The charts provide a depiction of institutional
and URG student outcomes in the areas of URG enrollment and
degree completion.
Western Illinois University is the only state university not
accessible via the federal interstate system. As a recruitment
tool, WIU created a program through partnership with Amtrak,
which offers accepted high school students two free round-trip
train tickets to visit campus. This program is designed so that
students who may not otherwise have the financial means to visit
campus prior to enrollment, will have the opportunity to visit the
campus, meet with WIU faculty and staff, and provide the
information needed to determine if WIUS is the right choice for
many students. For every two students who participate in the
visit to WIU’s Macomb campus, one will enroll and attend.
Illinois residents represent 86 % of WIU total enrollment. Other
recruitment and retention programs, have contributed to the
increase in overall campus diversity. The percent of total
enrollment identifying as non-white increased from 16.1% in
2009 to 26.3% in 2013. Despite declining total enrollment at
WIU, this change in demographics represents a real increase of
identified underrepresented students from 2,963 in 2009 to 3,409
in 2013, a 15% increase.
Student Demographics
Gender
Male: 51.2%
Female: 48.8%
Race and Ethnicity
American Indian or Alaskan native: 0.2%
Asian: 1.0%
African-American: 16.6%
Latino: 8.0%
Native Hawaiian or Other Pacific Islander: 0.1%
White: 66.6%
Two or more races: 2.1%
Race ethnicity unknown: 4.0%
Non-resident alien: 1.6% (Source: IPEDS)

44
Illinois Board of Higher Education
2014 Underrepresented Groups Report
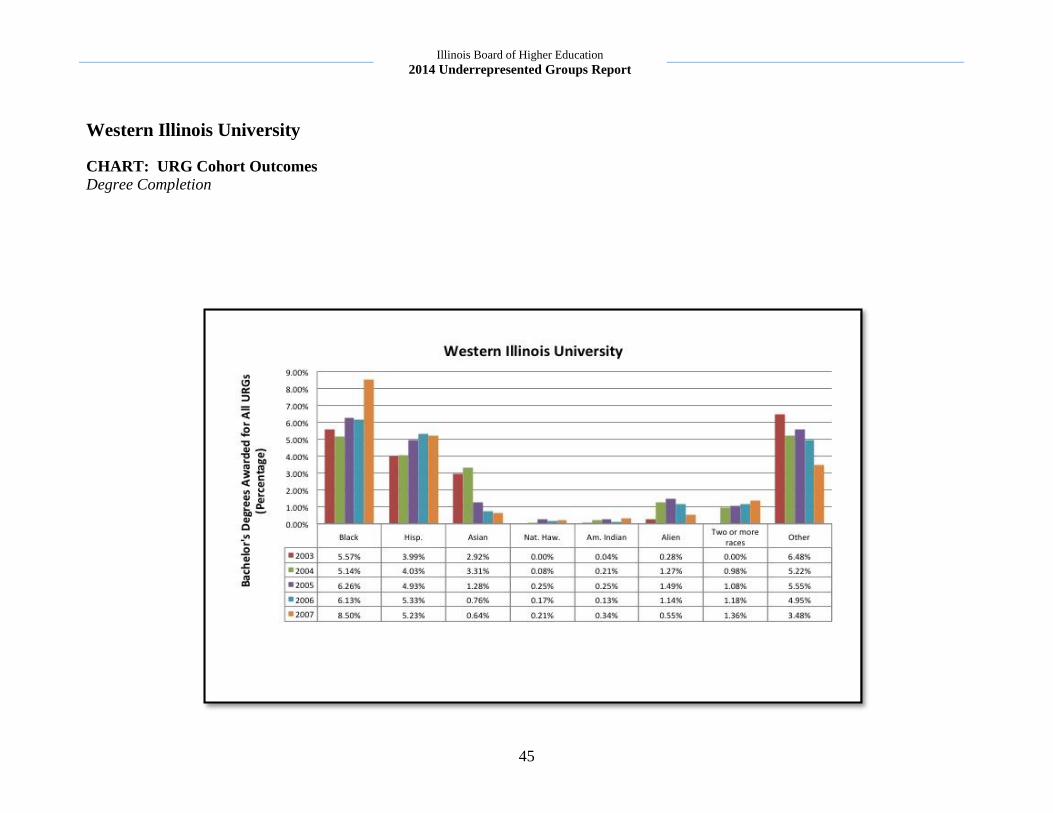
Western Illinois University
CHART: URG Cohort Outcomes Enrollment
45
Illinois Board of Higher Education
2014 Underrepresented Groups Report
Western Illinois University
CHART: URG Cohort Outcomes Degree Completion
46
Illinois Board of Higher Education
2014 Underrepresented Groups Report
AFFORDABILITY: A MAJOR CHALLENGE FOR
UNDERREPRESENTED GROUPS
GROUPS
47
Illinois Board of Higher Education
2014 Underrepresented Groups Report
Affordability needs serious attention
A midpoint report five years into the ten-year plan, the Illinois
Public Agenda for College and Career Success, presented to
the IBHE in April, 2014, clearly showed that the state has fallen
behind in closing college success gaps for underrepresented
groups and affordability for these groups as well. In fact, over
the last five years the cost of an Illinois higher education (two
and four year) had become less affordable faster for middle and
low income families than almost all other states. Focusing on
these affordability issues warrants special attention in this
Report, since the State’s fastest growing and largest populations:
low-income, first-generation, and adult students, as well as
students of color, Illinois underrepresented students, require
financial assistance and support to successfully enroll in and
complete college.
Illinois’ Monetary Award Program (MAP) the state’s primary
program of need-based aid to low-income and underrepresented
students has not kept up with the financial needs of its growing
student population. Illinois Student Assistance Commission
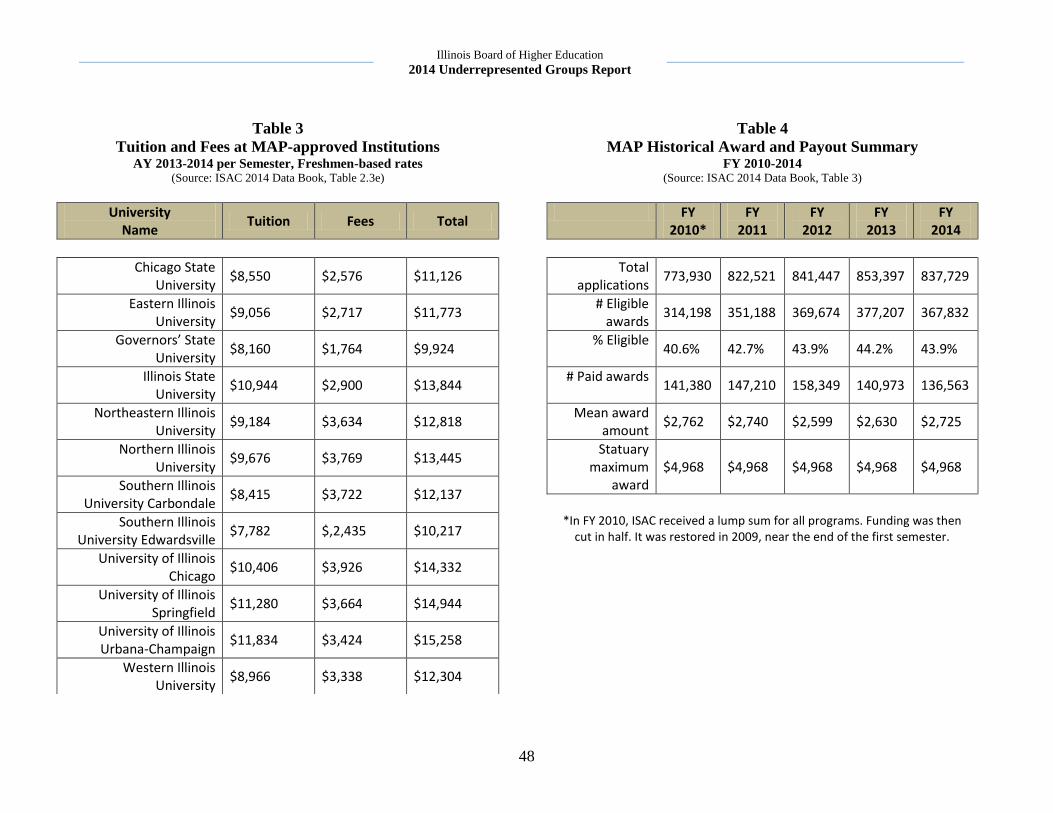
(ISAC) data show that in the last five years, of the total
applications received by MAP, no more than 44% of the eligible
applicants receive an award (See Table 4). Unfortunately, those
receiving MAP funds are not able to cover the tuition and fees
expenses at Illinois’s public universities (See Table 3) which
now far exceed the maximum MAP award.
With the decline in financial assistance available to students,
even those persisting to degree completion often face significant
student loan debt. For those students who “stop out” having to
quit school due lack of funds also can acquire a great deal of
debt. They do not have a college degree to provide a good job to
pay that debt: the worst of all possible situations.
Other college expenses for low income and underrepresented
students also have increased. Textbooks, transportation, and
childcare costs must be factored into affordability, calculations
affecting students’ abilities to pursue or continue postsecondary
education. While universities continue to increase institutional
scholarships and other financial assistance for underrepresented
students, the efforts cannot be expected to offset the reductions
in state financial assistance and general revenue support for
higher education in Illinois.
48
Illinois Board of Higher Education
2014 Underrepresented Groups Report
Table 3
Tuition and Fees at MAP-approved Institutions AY 2013-2014 per Semester, Freshmen-based rates
(Source: ISAC 2014 Data Book, Table 2.3e)
University Name
Tuition Fees Total
Chicago State University
$8,550 $2,576 $11,126
Eastern Illinois University
$9,056 $2,717 $11,773
Governors’ State University
$8,160 $1,764 $9,924
Illinois State University
$10,944 $2,900 $13,844
Northeastern Illinois University
$9,184 $3,634 $12,818
Northern Illinois University
$9,676 $3,769 $13,445
Southern Illinois University Carbondale
$8,415 $3,722 $12,137
Southern Illinois University Edwardsville
$7,782 $,2,435 $10,217
University of Illinois Chicago
$10,406 $3,926 $14,332
University of Illinois Springfield
$11,280 $3,664 $14,944
University of Illinois Urbana-Champaign
$11,834 $3,424 $15,258
Western Illinois University
$8,966 $3,338 $12,304
Table 4
MAP Historical Award and Payout Summary FY 2010-2014
(Source: ISAC 2014 Data Book, Table 3)
FY 2010*
FY 2011
FY 2012
FY 2013
FY 2014
Total applications
773,930 822,521 841,447 853,397 837,729
# Eligible awards
314,198 351,188 369,674 377,207 367,832
% Eligible
40.6% 42.7% 43.9% 44.2% 43.9%
# Paid awards
141,380 147,210 158,349 140,973 136,563
Mean award amount
$2,762 $2,740 $2,599 $2,630 $2,725
Statuary maximum
award $4,968 $4,968 $4,968 $4,968 $4,968
*In FY 2010, ISAC received a lump sum for all programs. Funding was then
cut in half. It was restored in 2009, near the end of the first semester.
49
Illinois Board of Higher Education
2014 Underrepresented Groups Report
Recommendations
The 2014 Underrepresented Groups Report provides a mixed
picture of progress in addressing gaps in college success for
underrepresented groups in Illinois. Dramatic increases in
enrollment numbers for Hispanic students and increased college
completions for URGs generally are good news. However,
substantial gaps remain for their success across our institutions.
Even where gaps are small, the overall completion rates are
unacceptably low.
The institutional summaries provide a beginning baseline for
efforts currently underway to improve college success for
underrepresented groups. The focus going forward must be on
outcome data to determine the most effective practices that
should be scaled across the state. A “thousand points of light”
will not result in the progress we need.
This means a continued focus on state level work also is required
across sectors, agencies and institutions. This collaborative work
includes:
Effective implementation of the new Illinois Learning
Standards and assessments across the K-12 system to
ensure adequate preparation for college, especially for
underrepresented students.
This will require rich partnerships between PreK-12 and
higher education in redesigning teacher preparation and
professional development for teachers in the classrooms, as
well as supporting seamless pathways to college readiness
beginning in early grades. IBHE and the Illinois Community
College Board are working closely in partnership with the
Illinois State Board of Education to better prepare students
for college and career.
Expansion of “game changing” interventions including
“Guided Pathways Systems” at college and university
campuses across Illinois.
Illinois is a member of Complete College America’s
Alliance of States, committed to increasing the number of
students completing college and credentials with marketable
value, closing attainment gaps for underrepresented groups,
and shortening the time to degree not only to make college
more affordable, but also more likely for students to persist
and complete. Illinois community colleges and public
universities, are using interventions including guided
pathways, structured academic maps, co-requisite
remediation programs for college math and English gateway
courses, using predictive analytics for more intense advising
early warning systems to keep students on track, and
encouraging full-time course loads, along with structured
schedules that balance course loads especially for working
students.
Restoration of MAP funding to ensure students with
limited or no family financial support can enroll and
complete college.
Beyond financial assistance, Illinois should explore ways to
redesign its system for supporting Illinois’ low-income
individuals and families across financial aid, human service, and
50
Illinois Board of Higher Education
2014 Underrepresented Groups Report
workforce funding streams so that these families can access all
the support for which they qualify to assist them in pursuit of
education and training. Illinois also must advocate for similar
changes in federal financial aid and loan policy to better support
this population..
Reducing underrepresented students’ vulnerability to “stop-
out” decisions.
Integrated enhanced academic and financial advising services
are needed to help students develop and follow completion plans
as well as gain access to employment opportunities as part of the
higher educational experience.
Focusing on underrepresented members of the adult
population in Illinois.
A significant percentage of the under-educated people in
Illinois’ workforce are in underrepresented groups. Without the
opportunity to obtain a college credential they will be unable to
attain middle class status, ensuring brighter futures for their
families, and contributing to Illinois’ economic recovery.
Implementing the Illinois Longitudinal Data System is
essential.
Improved data systems and data collection that allow tracking
progress and the impact of interventions, from early childhood
programs to job placements and workforce demands are in
development and must be used in state decision-making for
investing in education. Relevant to the Report, college success
data for students with disabilities and first-generation students
must receive special attention.
Conclusion
Scholar, historian, and civil rights activist, W. E. B. Du Bois,
stated, “Education and work are the levers to lift a people. Work
alone will not do it unless inspired by the right ideals and guided
by intelligence. Education must not simply teach work, it must
teach life.”
Our global economy has developed a greater demand for more
educated employees and leaders. Postsecondary education is no
longer optional. It is mandatory for success in 21st century
society. Lines of economic demarcation are being drawn amid
mounting state and national debt, which obligate Illinois to
create a highly educated and skilled citizenry.
Investing in Illinois’ future requires supporting increased college
enrollments and degree completions especially for the growing
number of citizens currently underrepresented in Illinois’
institutions of higher education. Already low income children
represent the majority in Illinois’ public early childhood centers,
elementary, middle and high schools. The goal that 60 percent of
Illinois’ citizens will have a postsecondary credential or college
degree cannot be achieved without dramatic increases in college
readiness, college graduation rates, and increased college
participation for adult students, and underrepresented groups.
None of this will happen without public investment in higher
education as a public good.
51
Illinois Board of Higher Education
2014 Underrepresented Groups Report
This annual Report will continue to present the data and status of
the State’s efforts to provide all residents affordable access to
high quality higher educational opportunities for a prosperous
Illinois.