Embed Size (px)
Citation preview
19Annual Report 2013/2014
Statement by the Board
Statement by the Board of the Info-Communications Development Authority of SingaporeIn our opinion:
(a) the accompanying financial statements of Info-Communications Development Authority of Singapore (the “Authority”) and its subsidiaries (the “Group”) as set out on pages FS1 to FS66 are drawn up in accordance with the provisions of the Info-Communications Development Authority of Singapore Act (Cap. 137A, 2000 Revised Edition) (the “Act”) and Statutory Board Financial Reporting Standards so as to present fairly, in all material respects, the state of affairs of the Group and of the Authority as at 31 March 2014, the results and changes in equity of the Group and of the Authority, and cash flows of the Group for the year ended on the date; and
(b) proper accounting and other records have been kept, including records of all assets of the Authority whether purchased, donated or otherwise; and
(c) the receipts, expenditure, investment of moneys and the acquisition and disposal of assets by the Authority during the year have been in accordance with the provisions of the Act.
The Board of the Info-Communications Development Authority of Singapore has, on the date of this statement, authorised these financial statements for issue.
On behalf of the Board
Yong Ying-IChairman
Steven Robert LeonardExecutive Deputy Chairman
24 June 2014

20 Infocomm Development Authority of Singapore
Independent auditors’ report
Report on the financial statements
We have audited the financial statements of Info-Communications Development Authority of Singapore (the “Authority”) and its subsidiaries (the “Group”), which comprise the statements of financial position of the Group and of the Authority as at 31 March 2014, the statements of income and expenditure, the statements of comprehensive income and statements of changes in equity of the Group and of the Authority and consolidated statement of cash flows of the Group for the year then ended, and a summary of significant accounting policies and other explanatory information, as set out on pages 22 to 77.
Management’s responsibility for the financial statementsManagement is responsible for the preparation and fair presentation of these financial statements in accordance with the provisions of the Info-communications Development Authority of Singapore Act (Cap. 137A, 2000 Revised Edition) (the “Act”) and Statutory Board Financial Reporting Standards (“SB-FRS”), and for such internal control as management determines is necessary to enable the preparation of financial statements that are free from material misstatement, whether due to fraud or error.
Auditors’ responsibilityOur responsibility is to express an opinion on these financial statements based on our audit. We conducted our audit in accordance with Singapore Standards on Auditing. Those standards require that we comply with ethical requirements and plan and perform the audit to obtain reasonable assurance about whether the financial statements are free from material misstatement.
An audit involves performing procedures to obtain audit evidence about the amounts and disclosures in the financial statements. The procedures selected depend on the auditor’s judgement, including the assessment of the risks of material misstatement of the financial statements, whether due to fraud or error. In making those risk assessments, the auditor considers internal control relevant to the entity’s preparation and fair presentation of the financial statements in order to design audit procedures that are appropriate in the circumstances, but not for the purpose of expressing an opinion on the effectiveness of the entity’s internal control. An audit also includes evaluating the appropriateness of accounting policies used and the reasonableness of accounting estimates made by management, as well as evaluating the overall presentation of the financial statements.
We believe that the audit evidence we have obtained is sufficient and appropriate to provide a basis for our audit opinion.
OpinionIn our opinion, the consolidated financial statements of the Group and the statement of financial position, statement of income and expenditure, statement of comprehensive income and statement of changes in equity of the Authority are properly drawn up in accordance with the provisions of the Act and SB-FRS so as to present fairly, in all material respects, the state of affairs of the Group and of the Authority as at 31 March 2014 and the results and changes in equity of the Group and of the Authority and cash flows of the Group for the year ended on that date.
Report on other legal and regulatory requirements
Management’s responsibility for compliance with legal and regulatory requirementsManagement is responsible for ensuring that the receipts, expenditure, investment of moneys and the acquisition and disposal of assets, are in accordance with the provisions of the Act. This responsibility includes implementing accounting and internal controls as management determines are necessary to enable compliance with the provisions of the Act.
Auditors’ responsibilityOur responsibility is to express an opinion on management’s compliance based on our audit of the financial statements. We conducted our audit in accordance with Singapore Standards on Auditing. We planned and performed the compliance audit to obtain reasonable assurance about whether the receipts, expenditure, investment of moneys and the acquisition and disposal of assets, are in accordance with the provisions of the Act.
Independent auditors’ reportMEMBERS OF ThE AuThORITy InFO-COMMunICATIOnS DEvElOpMEnT AuThORITy OF SInGApORE
21Annual Report 2013/2014
Independent auditors’ reportMEMBERS OF ThE AuThORITy InFO-COMMunICATIOnS DEvElOpMEnT AuThORITy OF SInGApORE
Independent auditors’ report
Our compliance audit includes obtaining an understanding of the internal control relevant to the receipts, expenditure, investment of moneys and the acquisition and disposal of assets; and assessing the risks of material misstatement of the financial statements from non-compliance, if any, but not for the purpose of expressing an opinion on the effectiveness of the entity’s internal control. Because of the inherent limitations in any accounting and internal control system, non-compliances may nevertheless occur and not be detected.
We believe that the audit evidence we have obtained is sufficient and appropriate to provide a basis for our opinion on management’s compliance. OpinionIn our opinion: (a) the receipts, expenditure, investment of moneys and acquisition and disposal of assets by the Authority during the
year are, in all material respects, in accordance with the provisions of the Act; and
(b) proper accounting and other records have been kept, including records of all assets of the Authority, whether purchased, donated or otherwise.
(c) the accounting and other records of those subsidiaries incorporated in Singapore of which we are the auditors have seem properly kept in accordance with the Singapore Companies Act, Chapter 50.
KPMG LLPpublic Accountants andChartered Accountants
Singapore24 June 2014
22 Infocomm Development Authority of Singapore
Statements of financial position
Group AuthorityNote 2013/2014 2012/2013 2013/2014 2012/2013
$’000 $’000 $’000 $’000
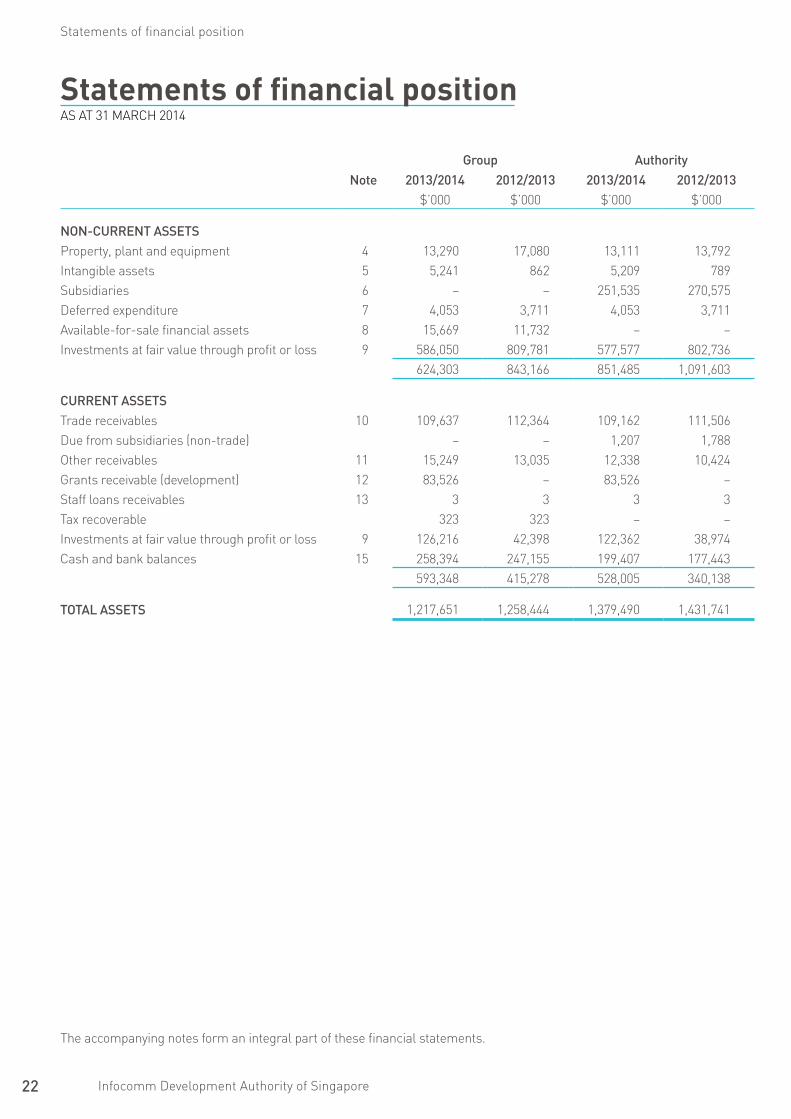
NON-cuRReNt Assetsproperty, plant and equipment 4 13,290 17,080 13,111 13,792Intangible assets 5 5,241 862 5,209 789Subsidiaries 6 – – 251,535 270,575Deferred expenditure 7 4,053 3,711 4,053 3,711Available-for-sale financial assets 8 15,669 11,732 – –Investments at fair value through profit or loss 9 586,050 809,781 577,577 802,736
624,303 843,166 851,485 1,091,603
cuRReNt AssetsTrade receivables 10 109,637 112,364 109,162 111,506Due from subsidiaries (non-trade) – – 1,207 1,788Other receivables 11 15,249 13,035 12,338 10,424Grants receivable (development) 12 83,526 – 83,526 –Staff loans receivables 13 3 3 3 3Tax recoverable 323 323 – –Investments at fair value through profit or loss 9 126,216 42,398 122,362 38,974Cash and bank balances 15 258,394 247,155 199,407 177,443
593,348 415,278 528,005 340,138
tOtAl Assets 1,217,651 1,258,444 1,379,490 1,431,741
Statements of financial positionAS AT 31 MARCh 2014
The accompanying notes form an integral part of these financial statements.
23Annual Report 2013/2014
Statements of financial position
Statements of financial position (continued)AS AT 31 MARCh 2014
Group AuthorityNote 2013/2014 2012/2013 2013/2014 2012/2013
$’000 $’000 $’000 $’000
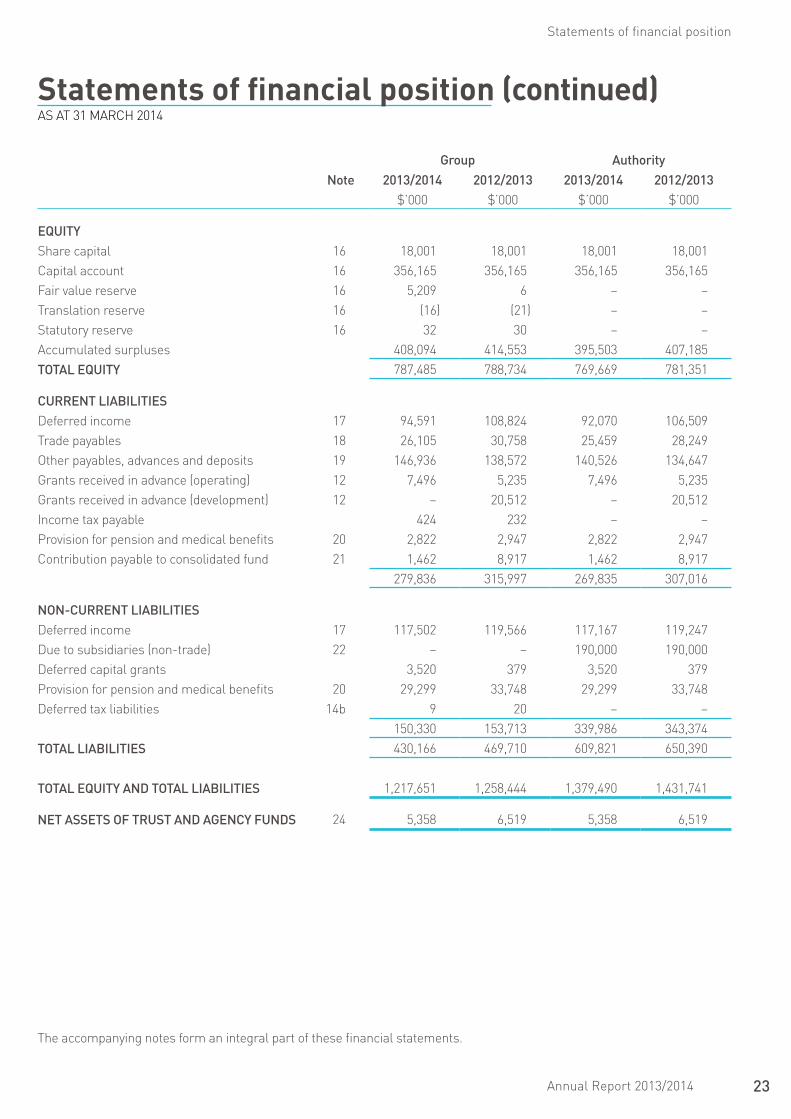
equItyShare capital 16 18,001 18,001 18,001 18,001Capital account 16 356,165 356,165 356,165 356,165Fair value reserve 16 5,209 6 – –Translation reserve 16 (16) (21) – –Statutory reserve 16 32 30 – –Accumulated surpluses 408,094 414,553 395,503 407,185tOtAl equIty 787,485 788,734 769,669 781,351
cuRReNt lIABIlItIesDeferred income 17 94,591 108,824 92,070 106,509Trade payables 18 26,105 30,758 25,459 28,249Other payables, advances and deposits 19 146,936 138,572 140,526 134,647Grants received in advance (operating) 12 7,496 5,235 7,496 5,235Grants received in advance (development) 12 – 20,512 – 20,512Income tax payable 424 232 – –provision for pension and medical benefits 20 2,822 2,947 2,822 2,947Contribution payable to consolidated fund 21 1,462 8,917 1,462 8,917
279,836 315,997 269,835 307,016
NON-cuRReNt lIABIlItIesDeferred income 17 117,502 119,566 117,167 119,247Due to subsidiaries (non-trade) 22 – – 190,000 190,000Deferred capital grants 3,520 379 3,520 379provision for pension and medical benefits 20 29,299 33,748 29,299 33,748Deferred tax liabilities 14b 9 20 – –
150,330 153,713 339,986 343,374tOtAl lIABIlItIes 430,166 469,710 609,821 650,390
tOtAl equIty ANd tOtAl lIABIlItIes 1,217,651 1,258,444 1,379,490 1,431,741
Net Assets Of tRust ANd AGeNcy fuNds 24 5,358 6,519 5,358 6,519
The accompanying notes form an integral part of these financial statements.
24 Infocomm Development Authority of Singapore
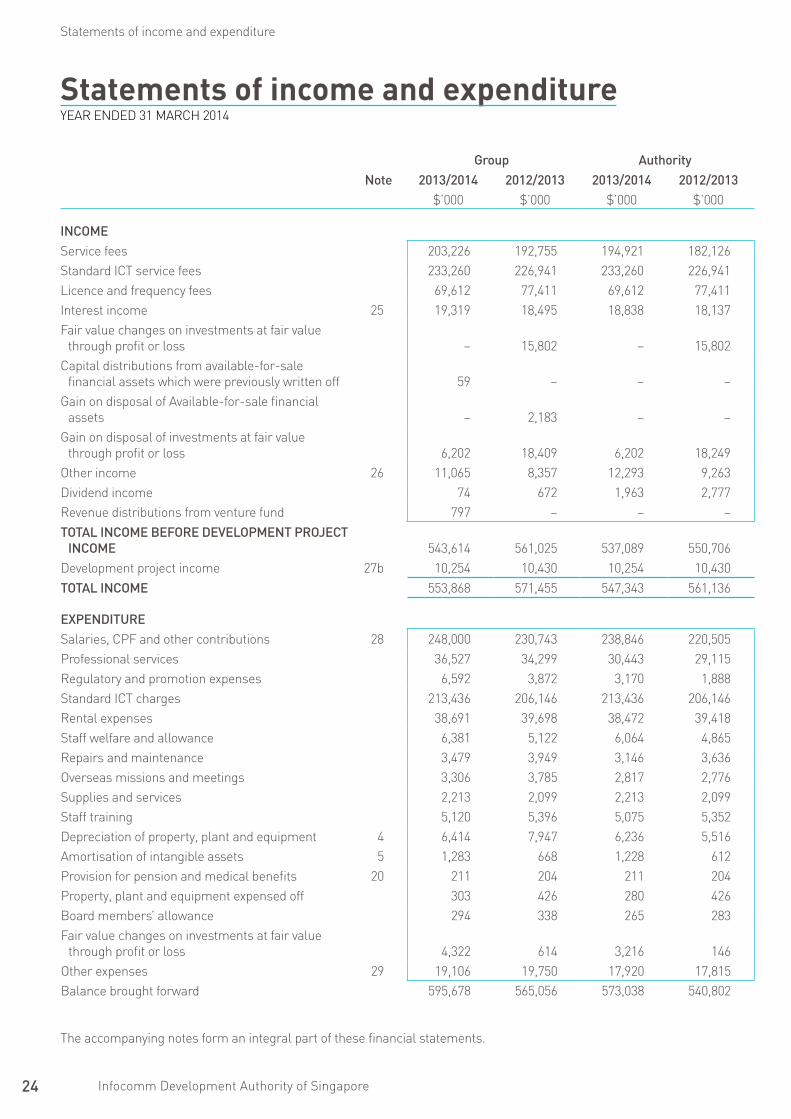
Statements of income and expenditureyEAR EnDED 31 MARCh 2014
Statements of income and expenditure
Group AuthorityNote 2013/2014 2012/2013 2013/2014 2012/2013
$’000 $’000 $’000 $’000
INcOMeService fees 203,226 192,755 194,921 182,126Standard ICT service fees 233,260 226,941 233,260 226,941licence and frequency fees 69,612 77,411 69,612 77,411Interest income 25 19,319 18,495 18,838 18,137Fair value changes on investments at fair value
through profit or loss – 15,802 – 15,802Capital distributions from available-for-sale
financial assets which were previously written off 59 – – –Gain on disposal of Available-for-sale financial
assets – 2,183 – –Gain on disposal of investments at fair value
through profit or loss 6,202 18,409 6,202 18,249Other income 26 11,065 8,357 12,293 9,263Dividend income 74 672 1,963 2,777Revenue distributions from venture fund 797 – – –tOtAl INcOMe BefORe develOpMeNt pROject
INcOMe 543,614 561,025 537,089 550,706Development project income 27b 10,254 10,430 10,254 10,430tOtAl INcOMe 553,868 571,455 547,343 561,136
expeNdItuReSalaries, CpF and other contributions 28 248,000 230,743 238,846 220,505professional services 36,527 34,299 30,443 29,115Regulatory and promotion expenses 6,592 3,872 3,170 1,888Standard ICT charges 213,436 206,146 213,436 206,146Rental expenses 38,691 39,698 38,472 39,418Staff welfare and allowance 6,381 5,122 6,064 4,865Repairs and maintenance 3,479 3,949 3,146 3,636Overseas missions and meetings 3,306 3,785 2,817 2,776Supplies and services 2,213 2,099 2,213 2,099Staff training 5,120 5,396 5,075 5,352Depreciation of property, plant and equipment 4 6,414 7,947 6,236 5,516Amortisation of intangible assets 5 1,283 668 1,228 612provision for pension and medical benefits 20 211 204 211 204property, plant and equipment expensed off 303 426 280 426Board members’ allowance 294 338 265 283Fair value changes on investments at fair value
through profit or loss 4,322 614 3,216 146Other expenses 29 19,106 19,750 17,920 17,815Balance brought forward 595,678 565,056 573,038 540,802
The accompanying notes form an integral part of these financial statements.
25Annual Report 2013/2014
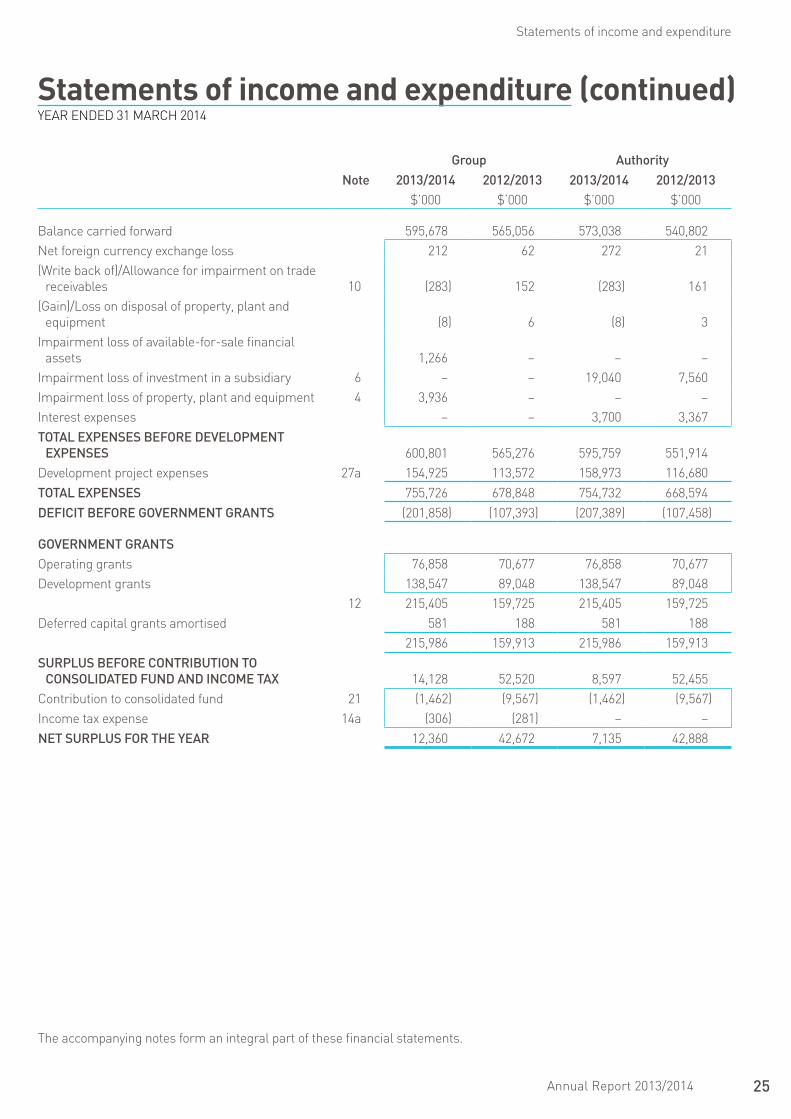
Statements of income and expenditure (continued)yEAR EnDED 31 MARCh 2014
Statements of income and expenditure
Group AuthorityNote 2013/2014 2012/2013 2013/2014 2012/2013
$’000 $’000 $’000 $’000
Balance carried forward 595,678 565,056 573,038 540,802net foreign currency exchange loss 212 62 272 21(Write back of)/Allowance for impairment on trade
receivables 10 (283) 152 (283) 161(Gain)/loss on disposal of property, plant and
equipment (8) 6 (8) 3Impairment loss of available-for-sale financial
assets 1,266 – – –Impairment loss of investment in a subsidiary 6 – – 19,040 7,560Impairment loss of property, plant and equipment 4 3,936 – – –Interest expenses – – 3,700 3,367tOtAl expeNses BefORe develOpMeNt
expeNses 600,801 565,276 595,759 551,914Development project expenses 27a 154,925 113,572 158,973 116,680tOtAl expeNses 755,726 678,848 754,732 668,594defIcIt BefORe GOveRNMeNt GRANts (201,858) (107,393) (207,389) (107,458)
GOveRNMeNt GRANtsOperating grants 76,858 70,677 76,858 70,677Development grants 138,547 89,048 138,547 89,048
12 215,405 159,725 215,405 159,725Deferred capital grants amortised 581 188 581 188
215,986 159,913 215,986 159,913suRplus BefORe cONtRIButION tO
cONsOlIdAted fuNd ANd INcOMe tAx 14,128 52,520 8,597 52,455Contribution to consolidated fund 21 (1,462) (9,567) (1,462) (9,567)Income tax expense 14a (306) (281) – –Net suRplus fOR the yeAR 12,360 42,672 7,135 42,888
The accompanying notes form an integral part of these financial statements.
26 Infocomm Development Authority of Singapore
Statements of comprehensive income
Group AuthorityNote 2013/2014 2012/2013 2013/2014 2012/2013
$’000 $’000 $’000 $’000
GROup
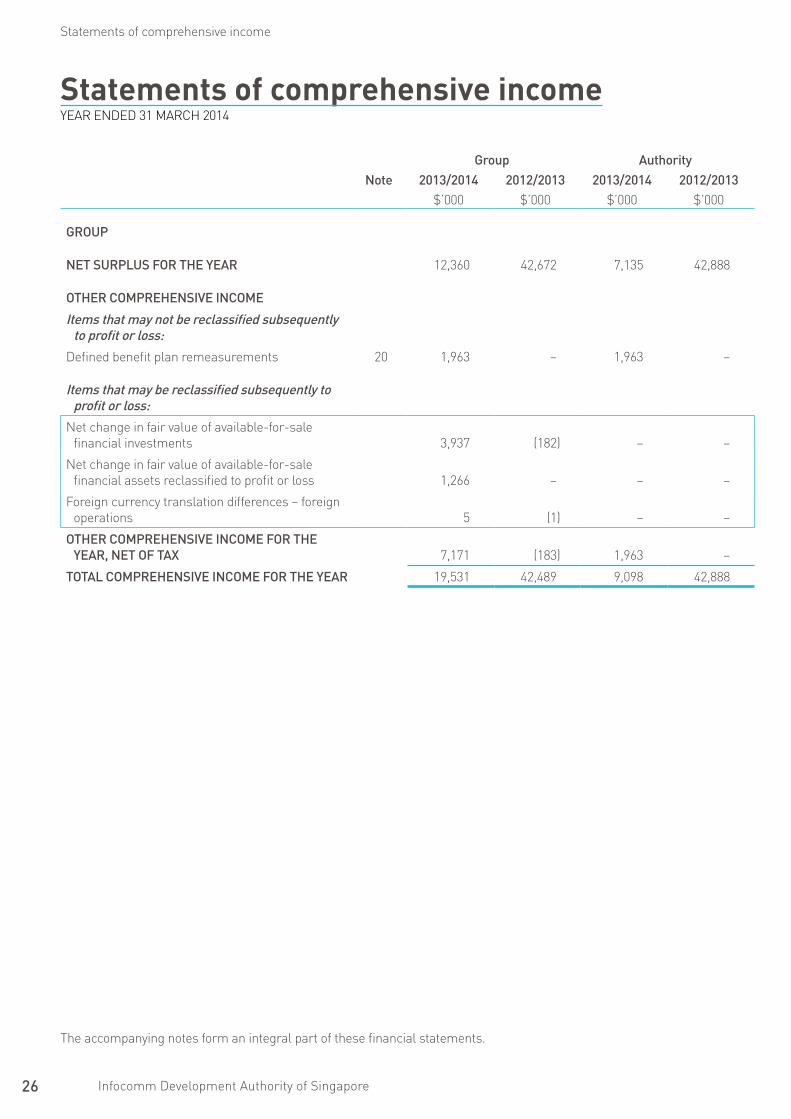
Net suRplus fOR the yeAR 12,360 42,672 7,135 42,888
OtheR cOMpReheNsIve INcOMe
Items that may not be reclassified subsequently to profit or loss:
Defined benefit plan remeasurements 20 1,963 – 1,963 –
Items that may be reclassified subsequently to profit or loss:
net change in fair value of available-for-sale financial investments 3,937 (182) – –
net change in fair value of available-for-sale financial assets reclassified to profit or loss 1,266 – – –
Foreign currency translation differences – foreign operations 5 (1) – –
OtheR cOMpReheNsIve INcOMe fOR the yeAR, Net Of tAx 7,171 (183) 1,963 –
tOtAl cOMpReheNsIve INcOMe fOR the yeAR 19,531 42,489 9,098 42,888
Statements of comprehensive incomeyEAR EnDED 31 MARCh 2014
The accompanying notes form an integral part of these financial statements.
27Annual Report 2013/2014
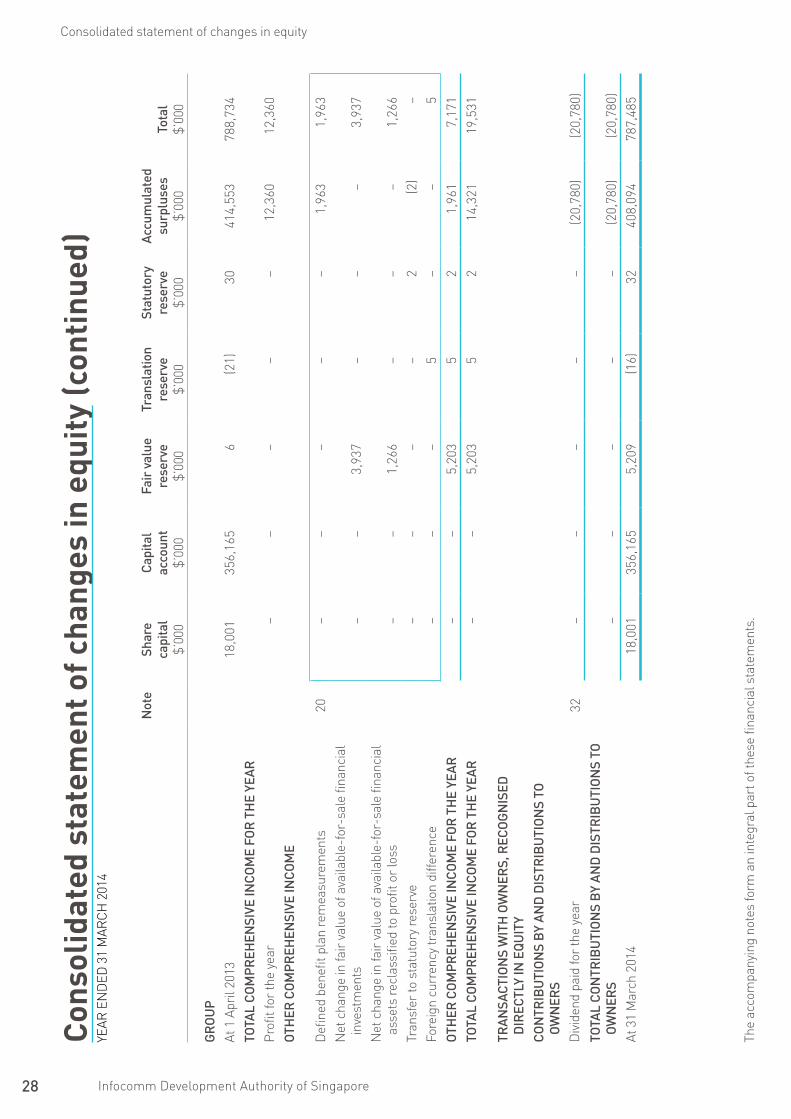
Consolidated statement of changes in equity
Not
esh
are
capi
tal
$’00
0
cap
ital
acco
unt
$’00
0
fair
val
uere
serv
e$’
000
tran
slat
ion
rese
rve
$’00
0
stat
utor
y re
serv
e$’
000
Accu
mul
ated
su
rplu
ses
$’00
0to
tal
$’00
0
GR
Ou
pAt
1 A
pril
2012
11,0
0135
6,16
518
8(2
0)30
379,
414
746,
778
tOtA
l c
OM
pR
eheN
sIve
INc
OM
e fO
R t
he
yeAR
pro
fit fo
r th
e ye
ar–
––
––
42,6
7242
,672
Oth
eR c
OM
pR
eheN
sIve
INc
OM
en
et c
hang
e in
fair
val
ue o
f ava
ilabl
e-fo
r-sa
le fi
nanc
ial
inve
stm
ents
––
(182
)–
––
(182
)Fo
reig
n cu
rren
cy tr
ansl
atio
n di
ffere
nce
––
–(1
)–
–(1
)O
theR
cO
Mp
Reh
eNsI
ve IN
cO
Me
fOR
th
e ye
AR–
–(1
82)
(1)
––
(183
)tO
tAl
cO
Mp
Reh
eNsI
ve IN
cO
Me
fOR
th
e ye
AR–
–(1
82)
(1)
–42
,672
42,4
89
tRAN
sAct
ION
s w
Ith
Ow
NeR
s, R
ecO
GN
Ised
d
IRec
tly
IN e
qu
Ity
cO
NtR
IBu
tIO
Ns
By
ANd
dIs
tRIB
utI
ON
s tO
O
wN
eRs
Issu
e of
sha
re c
apita
l16
7,00
0–
––
––
7,00
0D
ivid
end
paid
for
the
year
32–
––
––
(7,5
33)
(7,5
33)
tOtA
l c
ON
tRIB
utI
ON
s B
y AN
d d
IstR
IBu
tIO
Ns
tO
Ow
NeR
s7,
000
––
––
(7,5
33)
(533
)At
31
Mar
ch 2
013
18,0
0135
6,16
56
(21)
3041
4,55
378
8,73
4
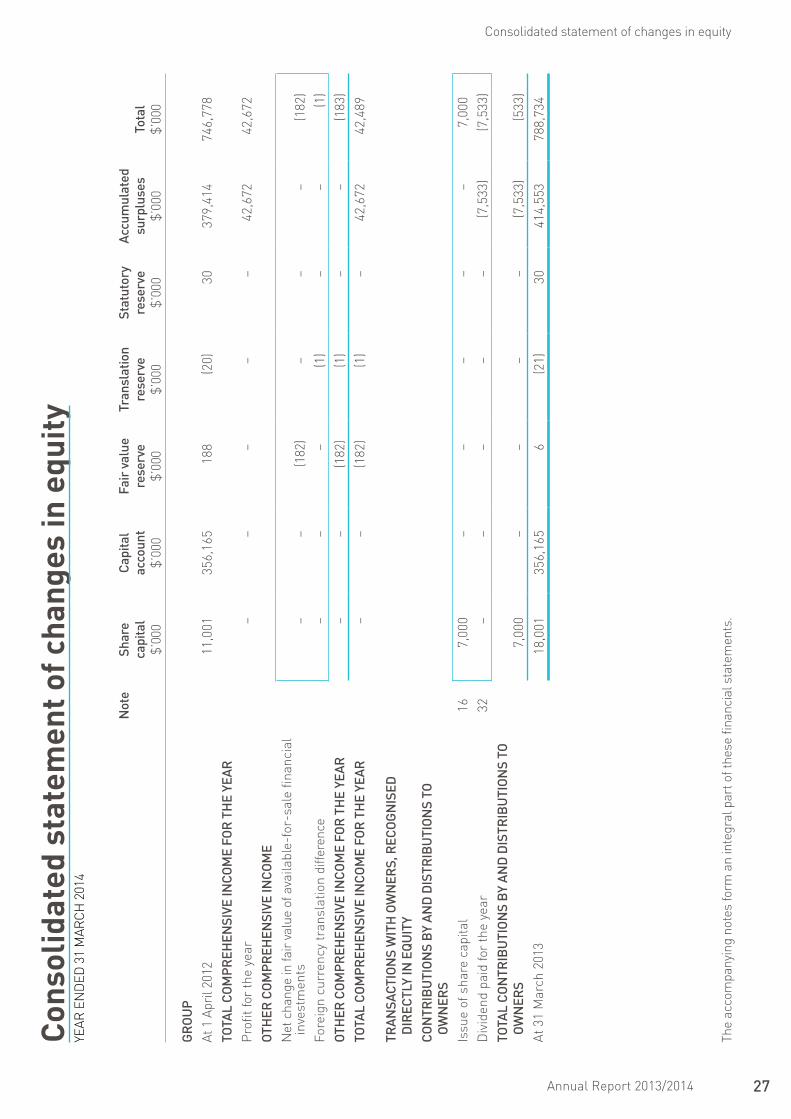
Con
solid
ated
sta
tem
ent o
f cha
nges
in e
quit
yyE
AR E
nD
ED 3
1 M
ARC
h 2
014
The
acco
mpa
nyin
g no
tes
form
an
inte
gral
par
t of t
hese
fina
ncia
l sta
tem
ents
.
28 Infocomm Development Authority of Singapore
Consolidated statement of changes in equity
Not
esh
are
capi
tal
$’00
0
cap
ital
acco
unt
$’00
0
fair
val
uere
serv
e$’
000
tran
slat
ion
rese
rve
$’00
0
stat
utor
y re
serv
e$’
000
Accu
mul
ated
su
rplu
ses
$’00
0to
tal
$’00
0
GR
Ou
pAt
1 A
pril
2013
18,0
0135
6,16
56
(21)
3041
4,55
378
8,73
4tO
tAl
cO
Mp
Reh
eNsI
ve IN
cO
Me
fOR
th
e ye
ARp
rofit
for
the
year
––
––
–12
,360
12,3
60O
theR
cO
Mp
Reh
eNsI
ve IN
cO
Me
Defi
ned
bene
fit p
lan
rem
easu
rem
ents
20
––
––
–1,
963
1,96
3n
et c
hang
e in
fair
val
ue o
f ava
ilabl
e-fo
r-sa
le fi
nanc
ial
inve
stm
ents
––
3,93
7–
––
3,93
7n
et c
hang
e in
fair
val
ue o
f ava
ilabl
e-fo
r-sa
le fi
nanc
ial
asse
ts re
clas
sifie
d to
pro
fit o
r lo
ss
––
1,26
6–
––
1,26
6Tr
ansf
er to
sta
tuto
ry re
serv
e–
––
–2
(2)
–Fo
reig
n cu
rren
cy tr
ansl
atio
n di
ffere
nce
––
–5
––
5O
theR
cO
Mp
Reh
eNsI
ve IN
cO
Me
fOR
th
e ye
AR–
–5,
203
52
1,96
17,
171
tOtA
l c
OM
pR
eheN
sIve
INc
OM
e fO
R t
he
yeAR
––
5,20
35
214
,321
19,5
31
tRAN
sAct
ION
s w
Ith
Ow
NeR
s, R
ecO
GN
Ised
d
IRec
tly
IN e
qu
Ity
cO
NtR
IBu
tIO
Ns
By
ANd
dIs
tRIB
utI
ON
s tO
O
wN
eRs
Div
iden
d pa
id fo
r th
e ye
ar32
––
––
–(2
0,78
0)(2
0,78
0)tO
tAl
cO
NtR
IBu
tIO
Ns
By
ANd
dIs
tRIB
utI
ON
s tO
O
wN
eRs
––
––
–(2
0,78
0)(2
0,78
0)At
31
Mar
ch 2
014
18,0
0135
6,16
55,
209
(16)
3240
8,09
478
7,48
5
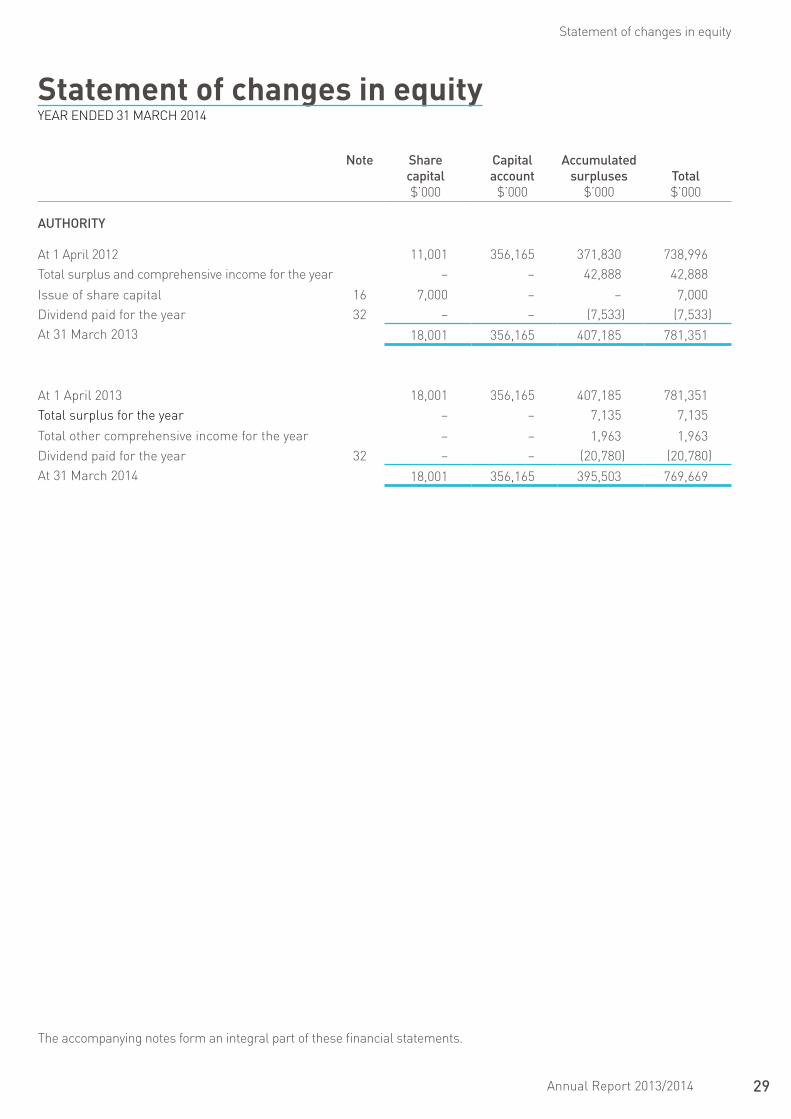
Con
solid
ated
sta
tem
ent o
f cha
nges
in e
quit
y (c
onti
nued
)yE
AR E
nD
ED 3
1 M
ARC
h 2
014
The
acco
mpa
nyin
g no
tes
form
an
inte
gral
par
t of t
hese
fina
ncia
l sta
tem
ents
.
29Annual Report 2013/2014
Statement of changes in equity
Note sharecapital$’000
capitalaccount
$’000
Accumulated surpluses
$’000total$’000
AuthORIty
At 1 April 2012 11,001 356,165 371,830 738,996Total surplus and comprehensive income for the year – – 42,888 42,888
Issue of share capital 16 7,000 – – 7,000Dividend paid for the year 32 – – (7,533) (7,533)At 31 March 2013 18,001 356,165 407,185 781,351
At 1 April 2013 18,001 356,165 407,185 781,351Total surplus for the year – – 7,135 7,135
Total other comprehensive income for the year – – 1,963 1,963Dividend paid for the year 32 – – (20,780) (20,780)At 31 March 2014 18,001 356,165 395,503 769,669
Statement of changes in equityyEAR EnDED 31 MARCh 2014
The accompanying notes form an integral part of these financial statements.
30 Infocomm Development Authority of Singapore
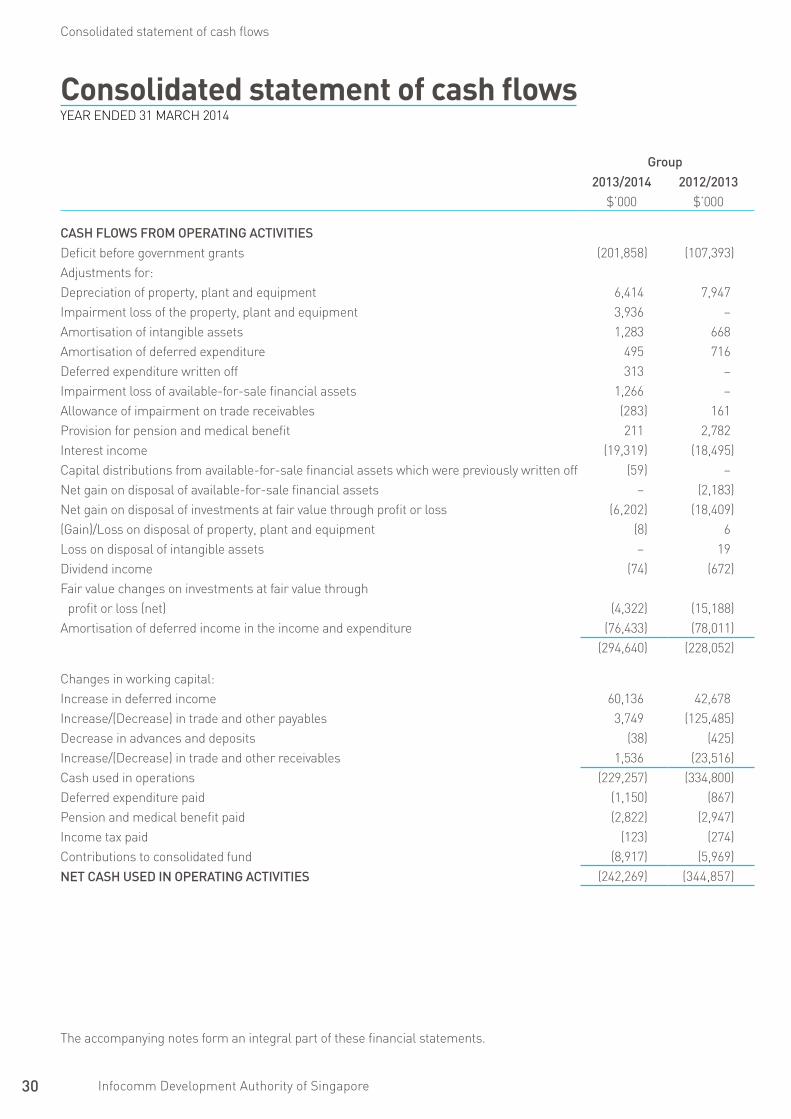
Consolidated statement of cash flows
Group2013/2014 2012/2013
$’000 $’000
cAsh flOws fROM OpeRAtING ActIvItIesDeficit before government grants (201,858) (107,393)Adjustments for:Depreciation of property, plant and equipment 6,414 7,947Impairment loss of the property, plant and equipment 3,936 –Amortisation of intangible assets 1,283 668Amortisation of deferred expenditure 495 716Deferred expenditure written off 313 –Impairment loss of available-for-sale financial assets 1,266 –Allowance of impairment on trade receivables (283) 161provision for pension and medical benefit 211 2,782Interest income (19,319) (18,495)Capital distributions from available-for-sale financial assets which were previously written off (59) –net gain on disposal of available-for-sale financial assets – (2,183)net gain on disposal of investments at fair value through profit or loss (6,202) (18,409)(Gain)/loss on disposal of property, plant and equipment (8) 6loss on disposal of intangible assets – 19Dividend income (74) (672)Fair value changes on investments at fair value through
profit or loss (net) (4,322) (15,188)Amortisation of deferred income in the income and expenditure (76,433) (78,011)
(294,640) (228,052)
Changes in working capital:Increase in deferred income 60,136 42,678Increase/(Decrease) in trade and other payables 3,749 (125,485)Decrease in advances and deposits (38) (425)Increase/(Decrease) in trade and other receivables 1,536 (23,516)Cash used in operations (229,257) (334,800)Deferred expenditure paid (1,150) (867)pension and medical benefit paid (2,822) (2,947)Income tax paid (123) (274)Contributions to consolidated fund (8,917) (5,969)Net cAsh used IN OpeRAtING ActIvItIes (242,269) (344,857)
Consolidated statement of cash flowsyEAR EnDED 31 MARCh 2014
The accompanying notes form an integral part of these financial statements.

31Annual Report 2013/2014
Consolidated statement of cash flows
Group2013/2014 2012/2013
$’000 $’000
cAsh flOws fROM INvestING ActIvItIespurchase of investments at fair value through profit or loss (6,363) (11)proceed from disposal of investments at fair value through profit or loss 156,800 –Interest income received 18,579 18,010Dividend income received 74 949Capital distributions from available-for-sale financial assets which were previously written off 59 –purchase of available-for-sale financial assets – (4,090)proceeds from disposal of available-for-sale financial assets – 2,537proceeds on disposal of property, plant and equipment 29 30purchase of intangible assets (3,807) (657)purchase of property, plant and equipment (8,436) (6,291)Net cAsh fROM INvestING ActIvItIes 156,935 10,477
cAsh flOws fROM fINANcING ActIvItIesOperating and development grants received 117,348 238,317Decrease in cash earmarked for payment of pension and medical benefits 4,574 165(Increase)/Decrease in cash set aside for specific purposes (33,114) 35,597Issue of share capital – 7,000Dividends paid (20,780) (7,533)Net cAsh fROM fINANcING ActIvItIes 68,028 273,546
Net decReAse IN cAsh ANd BANk BAlANces (17,306) (60,834)Cash and cash equivalents at the beginning of year 69,373 130,208Effects of exchange rate changes on the balance of cash held in foreign currencies 5 (1)cAsh ANd BANk BAlANces At the eNd Of yeAR (NOte A) 52,072 69,373
note A
Cash and bank balances:
Cash with Accountant General Department (“AGD”) 211,496 242,976Cash at bank 1,099 1,525Cash with custodians 45,799 2,654
258,394 247,155less: Cash earmarked for payment of pension and medical benefits (note 15) (32,121) (36,695)Cash set aside for specific purposes (note 15) (174,201) (141,087)
52,072 69,373
Consolidated statement of cash flows (continued)yEAR EnDED 31 MARCh 2014
The accompanying notes form an integral part of these financial statements.
32 Infocomm Development Authority of Singapore
Notes to the financial statements
Notes to the financial statementsThESE nOTES FORM An InTEGRAl pART OF ThE FInAnCIAl STATEMEnTS.ThE FInAnCIAl STATEMEnTS WERE AuThORISED FOR ISSuE By ThE BOARD On 24 JunE 2014.
1 domicile and activities
Info-Communications Development Authority of Singapore (the “Authority”) is a statutory board established in Singapore on 1 December 1999 under the Info-communications Development Authority Act of Singapore Act, (Cap. 137A, 2000 Revised Edition).
As a statutory board, the Authority is subjected to the control of its supervisory ministry, Ministry of Communications and Information (“MCI”), and is required to follow the policies and instructions issued from time to time by MCI and other government ministries and departments such as the Ministry of Finance (“MOF”).
The Authority is domiciled in Singapore and has its registered office at 10 pasir panjang Road, #10-01, Mapletree Business City, Singapore 117438.
The principal activities of the Authority are:
(a) to develop and promote the efficiency and international competitiveness of the info-communications industry in Singapore;
(b) to ensure that the telecommunication services are readily accessible and delivered competitively at performance standards that meet the social, industrial and commercial needs of Singapore;
(c) to exercise licensing and regulatory functions in respect of telecommunication systems and services in Singapore;
(d) to promote the use of the internet, broadband and electronic commerce and to establish regulatory frameworks for that purpose;
(e) to plan, promote, develop and implement information and communications technology systems and services for government ministries, departments and agencies;
(f) to provide consultancy and advisory services concerning info-communications technology;
(g) to provide administrative support, including the provision of premises, office supplies and equipment and manpower and premises to the personal Data protection Commission in the performance of its functions under the personal Data protection Act 2012; and
(h) To perform the functions and duties and exercise the powers of the Administration Body under the personal Data protection Act 2012, if so appointed.
The consolidated financial statements of the Group comprise the Authority and its subsidiaries (together referred to as the “Group” and individually as the “Group entities”). The principal activities of the subsidiaries are as stated in note 6.
2 Basis of preparation
2.1 statement of compliance The financial statements have been prepared in accordance with the provision of the Info-communications
Development Authority of Singapore Act (Cap. 137A, 2000 Revised Edition) and Statutory Board Financial Reporting Standards (“SB-FRS”), including Interpretations of SB-FRS (“InT SB-FRS”) and SB-FRS Guidance notes as promulgated by the Accountant-General.
2.2 Basis of measurement The financial statements have been presented on the historical cost basis except for certain financial assets
and liabilities which are measured at fair value as stated in the respective accounting policies detailed below.
33Annual Report 2013/2014
Notes to the financial statements
2.3 functional and presentation currency The financial statements are presented in Singapore dollars, which is the functional currency of the
Authority. All financial information presented in Singapore dollars have been rounded to the nearest thousand, unless otherwise stated.
2.4 use of estimates and judgements The preparation of financial statements in conformity with SB-FRS requires management to make
judgements, estimates and assumptions that affect the application of accounting policies and reported amounts of assets, liabilities, income and expenses. Actual results may differ from these estimates.
Estimates and underlying assumptions are reviewed on an ongoing basis. Revisions to accounting estimates are recognised in the period in which the estimates are revised and in any future periods affected.
Information about critical judgments in applying accounting policies that have the most significant effect on the amounts recognised in the financial statements is as follows:
• Classificationofinvestmentsatfairvaluethroughprofitorlossandavailable-for-salefinancialassets The Group designated investments at fair value through profit or loss in the following circumstances:
- The investments form a part of a group of financial assets or financial instruments or both, which is managed and its performance is evaluated on a fair value basis, in accordance with the Group’s documented risk management or investment strategy, and information about the grouping is provided internally on that basis;
- The designation eliminated or significantly reduced an accounting mismatch, which would otherwise have arisen; or
- The asset contains an embedded derivative that significantly modified the cash flows that would
otherwise have been required to be bifurcated. Where the embedded derivatives are not capable of being measured separately from the host contracts, either at inception or at subsequent reporting periods, the entire contract is designated as investments at fair value through profit or loss.
The Group designated any other investment that is not designated as investments at fair value through profit or loss or loans and receivables as available-for-sale financial assets.
• Servicefees The Group applies judgment and consideration of all relevant facts and circumstances in determining
whether the Group is acting as a principal or as an agent in its contractual arrangements. The Group would be determined to be acting as a principal when the Group assumes risks and rewards associated with the transactions.
• OneKeysecuritydevices In order to achieve pervasive adoption of strong authentication by public facing online services, OneKey
security devices will be distributed free to all Singaporeans and permanent Residents within the first five years of the roll-out of the national Authentication Framework (“nAF”) programme. Management has assessed that these devices will be expensed off upon the Group incurring the present legal obligations as it reflects the underlying economic substance at the current implementation phase of the nAF project.
Information about assumptions and estimation uncertainties that have a significant risk of resulting in a material adjustment within the next financial year are included in the following notes:
Notes to the financial statements
34 Infocomm Development Authority of Singapore
Notes to the financial statements
• Impairmentlossonproperty,plantandequipment The Group assesses the carrying amounts of its property, plant and equipment against their recoverable
amounts at each reporting date to determine whether there is any indication of impairment.
Estimates of recoverable amounts were based on the higher of calculated value-in-use and fair value less cost to sell as determined by an independent professional valuer. The fair value are based on estimated amounts obtainable for the sale of the asset on an arm’s length transaction between knowledgeable, willing parties, less the cost of disposal, utilising an open market value and replacement costs basis for separately identifiable components of the asset.
• Impairmentlossonsubsidiaries Management reviews the carrying amounts of the investment in subsidiaries at each reporting date
to determine whether there is any indication of impairment. If such indication exists, the recoverable amount is estimated.
Estimates of recoverable amounts were based on the higher of calculated value-in-use and fair value less cost to sell. In assessing value-in-use, management need to estimate the future cash flows expected from the cash-generating units and an appropriate discount rate to calculate the present value of future cash flows.
• ImpairmentofAvailable-for-salefinancialassets The Group follows the guidance of SB-FRS 39 in determining when an available-for-sale investment
is impaired as opposed to a temporary aberration. This determination process requires the exercising of significant judgement and the use of estimates by management. The Group evaluates, among other factors, the duration or the extent to which the fair value of an investment falls short of its carrying amount; the financial health and near term business outlook of the investee entity, including factors such as changes in technology, overall industry and sector performance; as well as operational and financial cash flows historically generated and forecasted to be generated by the investee entity.
Management regularly monitors these investments for indicators of impairment, including deteriorating financial performance, disorderly change in top management, key product failure, loss of major customers and other adverse news and reports on the investee entities. Management exercises judgement to determine whether there are indicators of impairment has set in based on all relevant information available, and where accessible, interviews conducted with management team of the investee entities.
• Valuationofinvestments The determination of fair value for financial assets and financial liabilities for which there is no
observable market price requires the use of valuation techniques as described in note 23. For financial instruments that trade infrequently and have little price transparency, fair value is less objective and requires varying degrees of judgement depending on liquidity, concentration, uncertainty of market factors, pricing assumptions and other risks affecting the specific instrument.
The Group’s critical judgement is required in determining accounting policy on fair value measurements and in relation to the designation of financial instruments into the different levels (i.e. level 1 to 3).
• Provisionformedicalandpensionbenefits provision for medical and pension benefits is estimated by management based on the most recent
valuation by professional actuaries. Changes to assumptions and estimates used in the valuation would result in change to the provision for medical and pension benefits amounts estimated.
• Utilisationoftaxlosses Certain subsidiaries of the Company have unused tax losses at the end of the reporting period.
utilisation of such losses is subject to the agreement of the Inland Revenue Authority of Singapore and the retention of majority shareholders as defined. These subsidiaries have not recognised any deferred tax benefits in respect of such tax losses which may be available for offsetting against profits due to the unpredictability of future profit streams.
Notes to the financial statements

35Annual Report 2013/2014
Notes to the financial statements
• Long-termservicecontracts Revenue and profit recognition on long-term service contracts are dependent on estimating the
eventual outcome of the contracts, as well as work done to date. Actual outcome in terms of total costs or revenue may be higher or lower than estimated at the reporting date, which would affect the revenue and profit recognised in future years. As at the reporting date, the management considered that all costs to complete and revenue can be reliably estimated.
Estimates and underlying assumptions are reviewed on an ongoing basis. Revisions to accounting estimates are recognised in the period in which the estimates are revised and in any future periods affected. Differences between the actual results and management’s estimates would affect the results of the period in which such differences are determined.
2.5 changes in accounting policies The Group has adopted all the new and revised SB-FRSs, InT SB-FRSs and Guidance notes which became
effective during the year. Except as disclosed below, the initial adoption of these SB-FRSs, InT SB-FRSs and Guidance notes did not have a material impact on these financial statements.
• Definedbenefitplansandshort-termorotherlong-termemployeebenefitsdefinition From 1 April 2013, as a result of SB-FRS 19 (2011), all actuarial gains and losses are now required to
be recognised immediately in other comprehensive income, it increased the defined benefit expense recognised in profit or loss and correspondingly reduced the defined benefit plan remeasurement loss recognised in other comprehensive income by $1.963 million in 2013/2014. The amendment was not applied retrospectively, as the amount involved is not material.
• Fairvaluemeasurement SB-FRS establishes a single framework for measuring fair value and making disclosures about fair
value measurements, when such measurements are required or permitted by other SB-FRSs. In particular, it unifies the definition of fair value as the price at which an orderly transaction to sell an asset or to transfer a liability would take place between market participants at the measurement date. It also replaces and expands the disclosure requirements about fair value measurements in other SB-FRSs, including SB-FRS 107 Financial Instruments: Disclosures.
From 1 January 2013, in accordance with the transitional provisions of SB-FRS 113, the Group has applied the new fair value measurement guidance prospectively, and has not provided any comparative information for new disclosures. notwithstanding the above, the change had no significant impact on the measurements of the Group’s assets and liabilities. The additional disclosures necessary as a result of the adoption of this standard has been included in notes 23.
• Presentationofitemsofothercomprehensiveincome From 1 April 2013, as a result of the amendments of SB-FRS 1, the Group has modified the
presentation of items of other comprehensive income in its consolidated statement of comprehensive income, to present separately items that would be reclassified to profit or loss in the future from those that would never be. Comparative information has also been re-presented accordingly.
The adoption of the amendment to FRS 1 has no impact on the recognised assets, liabilities and comprehensive income of the Group.
Notes to the financial statements
36 Infocomm Development Authority of Singapore
Notes to the financial statements
3 significant accounting policies
The accounting policies set out below have been applied consistently to all periods presented in these financial statements, and have been applied consistently by Group entities, except as explained in note 2.5, which addresses changes in accounting policies.
3.1 Basis of consolidation(i) Subsidiaries Subsidiaries are entities controlled by the Group. Control exists when the Authority has power to govern
the financial and operating policies of an entity so as to obtain benefits from it activities. The financial statements of subsidiaries are included in the consolidated financial statements from the date that control commences until the date that control ceases. The accounting policies of subsidiaries have been changed when necessary to align them with the policies adopted by the Group.
(ii) Transactionseliminatedonconsolidation Intra-group balances and transactions, and any unrealised income and expense arising from intra-
group transactions, are eliminated in preparing the consolidated financial statements.
(iii) Subsidiariesintheseparatefinancialstatements Investments in subsidiaries are stated in the Authority’s statement of financial position at cost less
accumulated impairment losses.
3.2 foreign currency(i) Foreigncurrencytransactions Transactions in foreign currencies are translated to the respective functional currencies of Group
entities at exchange rates at the dates of the transactions. Monetary assets and liabilities denominated in foreign currencies at the end of the reporting period are retranslated to the functional currency at the exchange rate at that date. The foreign currency gain or loss on monetary items is the difference between amortised cost in the functional currency at the beginning of the year, adjusted for effective interest and payments during the year, and the amortised cost in foreign currency translated at the exchange rate at the end of the year.
non-monetary assets and liabilities denominated in foreign currencies that are measured at fair value are retranslated to the functional currency at the exchange rate at the date that the fair value was determined. non-monetary items in a foreign currency that are measured in terms of historical cost are translated using the exchange rate at the date of the transaction. Foreign currency differences arising on retranslation are recognised in profit or loss, except for the following differences which are recognised in other comprehensive income arising on the retranslation of available-for-sale equity instruments (except on impairment in which case foreign currency differences that have been recognised in other comprehensive income are reclassified to profit or loss).
(ii) Foreignoperations The assets and liabilities of foreign operations are translated to Singapore dollars at exchange rates
at the end of the reporting period. The income and expenses of foreign operations are translated to Singapore dollars at exchange rates at the dates of the transactions.
Foreign currency differences are recognised in other comprehensive income, and presented in the foreign currency translation reserve (translation reserve) in equity. When a foreign operation is disposed of such that control, significant influence or joint control is lost, the cumulative amount in the translation reserve related to that foreign operation is reclassified to profit or loss as part of the gain or loss on disposal. When the Group disposes of only part of its interest in a subsidiary that includes a foreign operation while retaining control, the relevant proportion of the cumulative amount is reattributed to non-controlling interests.
Notes to the financial statements
37Annual Report 2013/2014
Notes to the financial statements
When the settlement of a monetary item receivable from or payable to a foreign operation is neither planned nor likely to occur in the foreseeable future, foreign exchange gains and losses arising from such a monetary item that are considered to form part of a net investment in a foreign operation are recognised in other comprehensive income, and are presented in the translation reserve in equity.
3.3 property, plant and equipment(i) Recognitionandmeasurement Items of property, plant and equipment are measured at cost less accumulated depreciation and any
accumulated impairment losses.
Cost includes expenditure that is directly attributable to the acquisition of the asset. The cost of self-constructed assets includes: the cost of materials and direct labour; any other costs directly attributable to bringing the assets to a working condition for their intended use; when the Group has an obligation to remove the asset or restore the site, an estimate of the costs of dismantling and removing the items and restoring the site on which they are located; and capitalised borrowing costs.
purchased software that is integral to the functionality of the related equipment is capitalised as part of that equipment.
When parts of an item of property, plant and equipment have different useful lives, they are accounted for as separate items (major components) of property, plant and equipment.
The gain or loss on disposal of an item of property, plant and equipment is determined by comparing the proceeds from disposal with the carrying amount of property, plant and equipment, and is recognised net in profit or loss.
(ii) Subsequentcosts The cost of replacing a component of an item of property, plant and equipment is recognised in the
carrying amount of the item if it is probable that the future economic benefits embodied within the component will flow to the Group, and its cost can be measured reliably. The carrying amount of the replaced component is derecognised. The costs of the day-to-day servicing of property, plant and equipment are recognised in profit or loss as incurred.
(iii) Depreciation Depreciation is based on the cost of an asset less its residual value. Significant components of
individual assets are assessed and if a component has a useful life that is different from the remainder of that asset, that component is depreciated separately.
Depreciation is recognised as an expense in profit or loss on a straight-line basis over the estimated useful lives of each component of an item of property, plant and equipment, unless it is included in the carrying amount of another asset.
Depreciation is recognised from the date that the property, plant and equipment are installed and are ready for use, or in respect of internally constructed assets, from the date that the asset is completed and ready for use. Capital-work-in-progress is not depreciated.
The estimated useful lives for the current and comparative years are as follows:
Infrastructure - 3 years Equipment - 3 to 5 years Furniture and fittings - 10 years plant and machinery - 5 to 7 years Buildings - 50 years
Notes to the financial statements
38 Infocomm Development Authority of Singapore
Notes to the financial statements
Depreciation methods, useful lives and residual values are reviewed at the end of each reporting period and adjusted if appropriate.
Assets below $2,000 are expensed off in the year of purchase.
3.4 Intangible assets Intangible assets that are acquired by the Group and have finite useful lives are measured at cost less
accumulated amortisation and accumulated impairment losses.
Subsequent expenditure is capitalised only when it increases the future economic benefits embodied in the specific asset to which it relates. All other expenditure is recognised in profit or loss as incurred.
Amortisation is calculated based on the cost of the asset, less its residual value. Amortisation is recognised in profit or loss on a straight-line basis over the estimated useful lives of intangible assets from the date that they are available for use.
The estimated useful lives for the current and comparative years are as follows:
Application software 3 years
Amortisation methods, useful lives and residual values are reviewed at the end of each reporting period and adjusted if appropriate.
Application software below $10,000 is expensed off in the year of purchase.
3.5 deferred expenditure Expenditure incurred in providing scholarships is capitalised and stated at cost less accumulated
amortisation. Amortisation is calculated on a straight-line basis to write off the cost over the period of the scholarship bond from 4 to 6 years commencing from the year that the scholars commence employment with the Group.
3.6 Government grants and contribution received Government grants and contributions from other organisations are recognised initially at their fair value
where there is reasonable assurance that the grants and contributions will be received and the Group will comply with the conditions associated with the grants and contributions.
(i) Operatinggrants Government grants and contributions from other organisations that compensate the Group for
expenses incurred are recognised in profit or loss on a systematic basis in the same periods in which the expenses are recognised.
(ii) Developmentgrants Government grants and contributions from other organisations for specific development project
expenditure are recognised as grants received in advance on the statement of financial position, upon receipt or grants receivable where accrued and are recognised in profit or loss on a systematic basis in the same periods in which the development expenses are recognised.
(iii) Capitalgrants Capital grants are recognised in profit or loss on a systematic basis over the useful life of the asset.
Government grants and contributions from other organisations utilised for the purchase of depreciable assets are initially recorded as “deferred capital grants” on the statement of financial position of the Group. Deferred capital grants are then recognised in the statement of income and expenditure over the periods necessary to match the depreciation of the assets purchased, with the related grants. upon the disposal of the asset, the balance of the related deferred capital grants is recognised in the statement of income and expenditure to match the net book value of the assets written off.
Notes to the financial statements

39Annual Report 2013/2014
Notes to the financial statements
3.7 financial instruments(i) Non-derivativefinancialassets The Group initially recognises loans and receivables and deposits on the date that they are originated.
All other financial assets (including assets designated at fair value through profit or loss) are recognised initially on the trade date, which is the date that the Group becomes a party to the contractual provisions of the instrument.
The Group derecognises a financial asset when the contractual rights to the cash flows from the asset expire, or it transfers the rights to receive the contractual cash flows on the financial asset in a transaction in which substantially all the risks and rewards of ownership of the financial asset are transferred. Any interest in transferred financial assets that is created or retained by the Group is recognised as a separate asset or liability.
Financial assets and liabilities are offset and the net amount presented in the statement of financial position when, and only when, the Group has a legal right to offset the amounts and intends either to settle on a net basis or to realise the asset and settle the liability simultaneously.
The Group classifies non-derivative financial assets into the following categories: financial assets at fair value through profit or loss, loans and receivables and available-for-sale financial assets.
Financialassetsatfairvaluethroughprofitorloss A financial asset is classified at fair value through profit or loss if it is classified as held for trading or
is designated as such upon initial recognition. Financial assets are designated at fair value through profit or loss if the Group manages and evaluates the performance of the assets on fair value basis in accordance with the Group’s documented risk management or investment strategy. Attributable transaction costs are recognised in profit or loss as incurred. Financial assets at fair value through profit or loss are measured at fair value, and changes therein, which takes into account any dividend income, are recognised in profit or loss.
Financial assets designated at fair value through profit or loss comprise equity and debt securities that otherwise would have been classified as available for sale.
Loansandreceivables loans and receivables are financial assets with fixed or determinable payments that are not quoted
in an active market. Such assets are recognised initially at fair value plus any directly attributable transaction costs. Subsequent to initial recognition, loans and receivables are measured at amortised cost using the effective interest method, less any impairment losses.
loans and receivables comprise cash and bank balances, trade receivables, due from subsidiaries (non-trade), other receivables, grants receivables and staff loans receivables. Cash and bank balances comprised cash held with Accountant General’s Department (“AGD”), cash held with external fund managers, cash on hand and short-term deposits with maturities of three months or less that are subject to an insignificant risk of changes in their fair value. For the purpose of the statement of cash flows, cash and bank balances earmarked for payment of pension and medical benefits to pensioners and set aside for specific purposes as designated by management are excluded.
Available-for-salefinancialassets Available-for-sale financial assets are non-derivative financial assets that are designated as available
for sale or are not classified in any of the above categories of financial assets.
Available-for-sale financial assets are recognised initially at fair value plus any directly attributable transaction costs. Subsequent to initial recognition, they are measured at fair value and changes therein, other than impairment losses and foreign currency differences on available-for-sale debt instruments, are recognised in other comprehensive income and presented in the fair value reserve in equity. When an investment is derecognised, the gain or loss accumulated in equity is reclassified to profit or loss.
Notes to the financial statements
40 Infocomm Development Authority of Singapore
Notes to the financial statements
Investments in equity instruments that do not have a quoted market price in an active market and whose fair value cannot be reliably measured and derivatives that are linked to and must be settled by delivery of such unquoted equity instruments are measured at cost.
Available-for-sale financial assets comprise equity securities and fund investments.
(ii) Non-derivativefinancialliabilities Financial liabilities (including liabilities designated at fair value through profit or loss) are recognised
initially on the trade date, which is the date that the Group becomes a party to the contractual provisions of the instrument.
The Group derecognises a financial liability when its contractual obligations are discharged, cancelled or expire.
Financial assets and liabilities are offset and the net amount presented in the statement of financial position when, and only when, the Group has a legal right to offset the amounts and intends either to settle on a net basis or to realise the asset and settle the liability simultaneously.
The Group classifies non-derivative financial liabilities into the other financial liabilities category. Such financial liabilities are recognised initially at fair value plus any directly attributable transaction costs. Subsequent to initial recognition, these financial liabilities are measured at amortised cost using the effective interest method.
Other financial liabilities comprise trade payables, other payables, amount to subsidiaries (non-trade) and contribution payable to consolidated fund.
(iii) Sharecapital Shares are classified as equity. Incremental costs directly attributable to the issue of shares are
recognised as a deduction from equity, net of tax effects.
(iv) Derivativefinancialinstruments The Group enters into other derivative financial instruments, when deemed necessary, to manage its
exposure to credit risk and other risks.
Embedded derivatives are separate from the host contract and accounted for separately if the economic characteristics and risk of the host contract and the embedded derivative are not closely related, a separate instrument with the same terms as the embedded derivative would meet the definition of a derivative, and the combined instrument is not measured at fair value through profit or loss.
In cases where the embedded derivative cannot be separated from its host contract because the Group is unable to measure the embedded derivate separately either at acquisition or at a subsequent financial reporting date, it shall designate the entire hybrid (combined) contract as at fair value through profit or loss.
Derivatives are recognised initially at fair value; attributable transaction costs are recognised in profit or loss as incurred. Subsequent to initial recognition, derivatives are measured at fair value, and changes therein are accounted for as described below.
Separableembeddedderivatives Changes in the fair value of separated embedded derivatives are recognised immediately in profit or
loss.
Othernon-tradingderivatives When a derivative financial instrument is not designated in a hedge relationship that qualifies for hedge
accounting, all changes in its fair value are recognised immediately in profit or loss.
Notes to the financial statements
41Annual Report 2013/2014
Notes to the financial statements
3.8 Impairment(i) Non-derivativefinancialassets A financial asset not carried at fair value through profit or loss is assessed at the end of each reporting
period to determine whether there is objective evidence that it is impaired. A financial asset is impaired if objective evidence indicates that a loss event has occurred after the initial recognition of the asset, and that the loss event has a negative effect on the estimated future cash flows of that asset that can be estimated reliably.
Objective evidence that financial assets (including equity securities) are impaired can include default or delinquency by a debtor, restructuring of an amount due to the Group on terms that the Group would not consider otherwise, indications that a debtor or issuer will enter bankruptcy, adverse changes in the payment status of borrowers or issuers in the group, economic conditions that correlate with defaults or the disappearance of an active market for a security. In addition, for an investment in an equity security, a significant or prolonged decline in its fair value below its cost is objective evidence of impairment.
Loansandreceivables The Group considers evidence of impairment for loans and receivables at both a specific asset and
collective level. All individually significant loans and receivables are assessed for specific impairment. All individually significant receivables found not to be specifically impaired are then collectively assessed for any impairment that has been incurred but not yet identified. loans and receivables that are not individually significant are collectively assessed for impairment by grouping together loans and receivables with similar risk characteristics.
In assessing collective impairment, the Group uses historical trends of the probability of default, the timing of recoveries and the amount of loss incurred, adjusted for management’s judgement as to whether current economic and credit conditions are such that the actual losses are likely to be greater or less than suggested by historical trends.
An impairment loss in respect of a financial asset measured at amortised cost is calculated as the difference between its carrying amount and the present value of the estimated future cash flows, discounted at the asset’s original effective interest rate. losses are recognised in profit or loss and reflected in an allowance account against loans and receivables. Interest on the impaired asset continues to be recognised. When a subsequent event (e.g. repayment by a debtor) causes the amount of impairment loss to decrease, the decrease in impairment loss is reversed through profit or loss.
Available-for-salefinancialassets Impairment losses on available-for-sale financial assets are recognised by reclassifying the losses
accumulated in the fair value reserve in equity to profit or loss. The cumulative loss that is reclassified from equity to profit or loss is the difference between the acquisition cost, net of any principal repayment and amortisation, and the current fair value, less any impairment loss recognised previously in profit or loss. Changes in cumulative impairment provisions attributable to application of the effective interest method are reflected as a component of interest income. If, in a subsequent period, the fair value of an impaired available-for-sale debt security increases and the increase can be related objectively to an event occurring after the impairment loss was recognised, then the impairment loss is reversed. The amount of the reversal is recognised in profit or loss. however, any subsequent recovery in the fair value of an impaired available-for-sale equity security is recognised in other comprehensive income.
(ii) Non-financialassets The carrying amounts of the Group’s non-financial assets are reviewed at each reporting date to
determine whether there is any indication of impairment. If any such indication exists, then the asset’s recoverable amount is estimated. An impairment loss is recognised if the carrying amount of an asset or its related cash-generating unit (CGu) exceeds its estimated recoverable amount.
The recoverable amount of an asset or CGu is the greater of its value in use and its fair value less costs to sell. In assessing value in use, the estimated future cash flows are discounted to their present value using a pre-tax discount rate that reflects current market assessments of the time value of money and
Notes to the financial statements
42 Infocomm Development Authority of Singapore
Notes to the financial statements
the risks specific to the asset or CGu. For the purpose of impairment testing, assets that cannot be tested individually are grouped together into the smallest group of assets that generates cash inflows from continuing use that are largely independent of the cash inflows of other assets or CGus.
Impairment losses are recognised in profit or loss. Impairment losses recognised in respect of CGus are allocated to reduce the carrying amounts of the other assets in the CGu (group of CGus) on a pro rata basis.
Impairment losses recognised in prior periods are assessed at each reporting date for any indications that the loss has decreased or no longer exists. An impairment loss is reversed if there has been a change in the estimates used to determine the recoverable amount. An impairment loss is reversed only to the extent that the asset’s carrying amount does not exceed the carrying amount that would have been determined, net of depreciation or amortisation, if no impairment loss had been recognised.
3.9 provisions A provision is recognised if, as a result of a past event, the Group has a present legal or constructive
obligation that can be estimated reliably, and it is probable that an outflow of economic benefits will be required to settle the obligation. provisions are determined by discounting the expected future cash flows at a pre-tax rate that reflects current market assessments of the time value of money and the risks specific to the liability. The unwinding of the discount is recognised as interest expense.
A provision for onerous contracts is recognised when the expected benefits to be derived by the Group from a contract are lower than the unavoidable cost of meeting the obligations under the contract. The provision is measured at the present value of the lower of the expected cost of terminating the contract and the expected net cost of continuing with the contract. Before a provision is established, the Group recognises any impairment loss on the assets associated with the contract.
SiteRestoration In accordance with the applicable terms and conditions in the lease agreement governing the Group’s use of
assets under operating leases and a provision for site restoration in respect of the leased premises, and the related expense, was recognised at the date of inception of the lease.
3.10 employee benefits(i) Definedcontributionplans A defined contribution plan is a post-employment benefit plan under which an entity pays fixed contributions
into a separate entity and will have no legal or constructive obligation to pay further amounts. Obligations for contributions to defined contribution pension plans are recognised as an employee benefit expense in profit or loss in the periods during which related services are rendered by employees.
Contributions on the employees’ salaries are made to the Central provident Fund (CpF) as required by law. The CpF contributions are recognised as expenses in the period when the employees rendered their services.
(ii) Definedbenefitplans A defined benefit plan is a post-employment benefit plan other than a defined contribution plan. The
Group’s net obligation in respect of defined benefit pension plans is calculated separately for each plan by estimating future benefit that the employees have earned in return for their service in the current and prior periods; that benefit is discounted to determine its present value. The fair value of any plan assets is deducted. The Group determines the net interest expense (income) on the net defined benefit liability (asset) for the period by applying the discount rate used to measure the defined benefit obligation at the beginning of the annual period to the net defined benefit liability (asset). The discount rate is the yield at the reporting date on government bonds that have maturity dates approximating the terms of the Group’s obligations and that are denominated in the same currency in which the benefits are expected to be paid.
The calculation is performed annually by a qualified actuary using the projected unit credit method. under the method, a “projected accrued benefit” is calculated for each benefit. For all active members
Notes to the financial statements

43Annual Report 2013/2014
Notes to the financial statements
of the scheme, the “projected accrual benefit” is based on the scheme’s accrual formula and upon service as of the valuation date, but using the employee’s scheme salary, projected to the age at which the employee is assumed to leave active service. For inactive members, it is the total benefit. The defined benefit obligation/project benefit obligation/plan liability is the discounted present value of the “projected accrued benefits”. The service cost is the corresponding value of benefits earned by active members over the year as a result of one more year of service.
Re-measurements from defined benefit plans comprise actuarial gains and losses, the return on plan assets (excluding interest) and the effect of the asset ceiling (if any, excluding interest). The Group recognises them immediately in other comprehensive income and all expenses related to defined benefit plans in employee benefits expense in profit or loss.
When the benefits of a plan are changed, or when a plan is curtailed, the portion of the changed benefit related to past service by employees, or the gain or loss on curtailment, is recognised immediately in profit or loss when the plan amendment or curtailment occurs.
The Group recognises gains and losses on the settlement of a defined benefit plan when the settlement occurs. The gain or loss on settlement is the difference between the present value of the defined benefit obligation being settled as determined on the date of settlement and the settlement price, including any plan assets transferred and any payments made directly by the Group in connection with the settlement.
(iii) Terminationbenefits Termination benefits are recognised as an expense when the Group is committed demonstrably, without
realistic possibility of withdrawal, to a formal detailed plan to either terminate employment before the normal retirement date, or to provide termination benefits as a result of an offer made to encourage voluntary redundancy. Termination benefits for voluntary redundancies are recognised as an expense if the Group has made an offer of voluntary redundancy, it is probable that the offer will be accepted, and the number of acceptances can be estimated reliably. If benefits are payable more than 12 months after the reporting date, then they are discounted to their present value.
(iv) Short-termemployeebenefits Short-term employee benefit obligations are measured on an undiscounted basis and are expensed
when the related service is provided. A liability is recognised for the amount expected to be paid under short-term cash bonus if the Group has a present legal or constructive obligation to pay this amount as a result of past service provided by the employee, and the obligation can be estimated reliably.
3.11 trust and agency funds Moneys received from the Government and other organisations where the Authority is not the owner and
beneficiary are accounted for as trust and agency funds. The receipts and expenditure in respect of agency funds are taken directly to the respective funds accounts and the net assets relating to these funds are shown as a separate line item on the statement of financial position. Trust and agency funds are accounted for on an accruals basis.
3.12 Restricted funds These are funds earmarked for specific purposes and for which separate disclosure is necessary as these
funds are material and are subject to restrictions on the ability of the Authority to distribute or otherwise apply its funds. The treatment is in accordance with Guidance note 3 issued by the Accountant General Department (“AGD”). Restricted funds are accounted for on an accruals basis.
3.13 Income Income is measured at the fair value of the consideration received or receivable, net of returns, trade
discounts and volume rebates. Income is recognised when significant risks and rewards of ownership have been transferred to customer, recovery of the consideration is probable, the associated costs and possible return of goods can be estimated reliably, there is no continuity management involvement with goods, and the amount of revenue can be measured reliably.
Notes to the financial statements
44 Infocomm Development Authority of Singapore
Notes to the financial statements
(i) Servicefees Service fees are recognised in the period when the services are rendered to customers, net of goods
and service tax.
(ii) Licenceandfrequencyfees licence and frequency fees are recognised on the accrual basis over the validity period, except for
certain types of fees that are recognised in the year in which they are received, net of goods and services tax.
(iii) Long-termservicecontracts Contract revenue includes the initial amount agreed in the contract plus any variations in contract work,
claims and incentive payments, to the extent that it is probable that they will result in revenue and can be measured reliably. As soon as the outcome can be estimated reliably, contract revenue is recognised in income and expenditure in proportion to the stage of completion of the contract. Contract expenses are recognised as incurred unless they create an asset related to future contract activity.
The stage of completion is measured by the proportion of direct labour costs incurred for work performed to date relative to the estimated total direct labour costs. Where the outcome of a contract cannot be estimated reliably, contract revenue is recognised to the extent of contract costs incurred that is probable will be recoverable. An expected loss on a contract is recognised immediately in profit or loss.
When contract costs incurred to date plus recognised profits less recognised losses exceed gross billings, the surplus representing amounts due from customer is included in other receivables.
(iv) Dividendincome Dividend income is recognised on the date that the Group’s right to receive payment is established,
which in the case of quoted securities is normally the ex-dividend date.
(v) Developmentprojectincome Development income is recognised in the same periods in which the development expense is
recognised.
(vi) Interestincome Interest income is recognised as it accrues, using the effective interest method.
3.14 Interest expenses Borrowing costs that are not directly attributable to the acquisition, construction or production of a qualifying
asset are recognised in statement of income and expenditure using the effective interest method.
3.15 leases
Operatinglease
WhenentitieswithintheGrouparelesseesofanoperatinglease Where the Group has the use of assets under operating leases, payments made under the leases are recognised
in the statement of comprehensive income on a straight-line basis over the term of the lease. lease incentives received are recognised in the statement of comprehensive income as an integral part of the total lease payments made. leased assets are not recognised in the Group’s statement of financial position.
Determiningwhetheranarrangementcontainsalease At inception of an arrangement, the Group determines whether such an arrangement is or contains a lease.
A specific asset is the subject of a lease if fulfilment of the arrangement is dependent on the use of that specified asset. An arrangement conveys the right to use the asset if the arrangement conveys to the Group the right to control the use of the underlying asset. At inception or upon reassessment of the arrangement, the Group separates payments and other consideration required by such an arrangement into those for
Notes to the financial statements
45Annual Report 2013/2014
Notes to the financial statements
the lease and those for other elements on the basis of their relative fair values. If the Group concludes for a finance lease that it is impracticable to separate the payments reliably, then an asset and a liability are recognised at an amount equal to the fair value of the underlying asset. Subsequently, the liability is reduced as payments are made and an imputed finance charge on the liability is recognised using the Group’s incremental borrowing rate.
3.16 tax The Authority is a tax-exempted institution under the provisions of the Income Tax Act (Cap.134, 2004 Revised
Edition). The subsidiaries of the Authority are subject to local income tax regulation.
Tax expense comprises current and deferred tax. Current tax and deferred tax is recognised in statement of income and expenditure except to the extent that it relates to a business combination, or items recognised directly in equity or in other comprehensive income.
Current tax is the expected tax payable or receivable on the taxable income or loss for the year, using tax rates enacted or substantively enacted at the reporting date, and any adjustment to tax payable in respect of previous years.
Deferred tax is recognised in respect of temporary differences between the carrying amounts of assets and liabilities for financial reporting purposes and the amounts used for taxation purposes. Deferred tax is not recognised for: temporary differences on the initial recognition of assets or liabilities in a transaction that is not a business combination and that affects neither accounting nor taxable profit or loss; and temporary differences related to investments in subsidiaries to the extent that the Group is able to control the timing of the reversal of the temporary difference and it is probable that they will not reverse in the foreseeable future.
The measurement of deferred taxes reflects the tax consequences that would follow the manner in which the Group expects, at the end of the reporting period, to recover or settle the carrying amount of its assets and liabilities. Deferred tax is measured at the tax rates that are expected to be applied to temporary differences when they reverse, based on the laws that have been enacted or substantively enacted by the reporting date.
Deferred tax assets and liabilities are offset if there is a legally enforceable right to offset current tax liabilities and assets, and they relate to taxes levied by the same tax authority on the same taxable entity, or on different tax entities, but they intend to settle current tax liabilities and assets on a net basis or their tax assets and liabilities will be realised simultaneously.
A deferred tax asset is recognised for unused tax losses, tax credits and deductible temporary differences, to the extent that it is probable that future taxable profits will be available against which they can be utilised. Deferred tax assets are reviewed at each reporting date and are reduced to the extent that it is no longer probable that the related tax benefit will be realised.
In determining the amount of current and deferred tax, the Group takes into account the impact of uncertain tax positions and whether additional taxes and interest may be due. The Group believes that its accruals for tax liabilities are adequate for all open tax years based on its assessment of many factors, including interpretations of tax law and prior experience. This assessment relies on estimates and assumptions and may involve a series of judgements about future events. new information may become available that causes the Group to change its judgement regarding the adequacy of existing tax liabilities; such changes to tax liabilities will impact tax expense in the period that such a determination is made.
3.17 New standards and interpretations not adopted A number of new standards, amendments to standards and interpretations are effective for annual periods
beginning 1 April 2014, and have not been applied in preparing these financial statements. Those new standards, amendments to standards and interpretations are not expected to have a significant effect on the financial statements of the Group and the Authority in future financial periods and which the Group does not plan to early adopt.
Notes to the financial statements
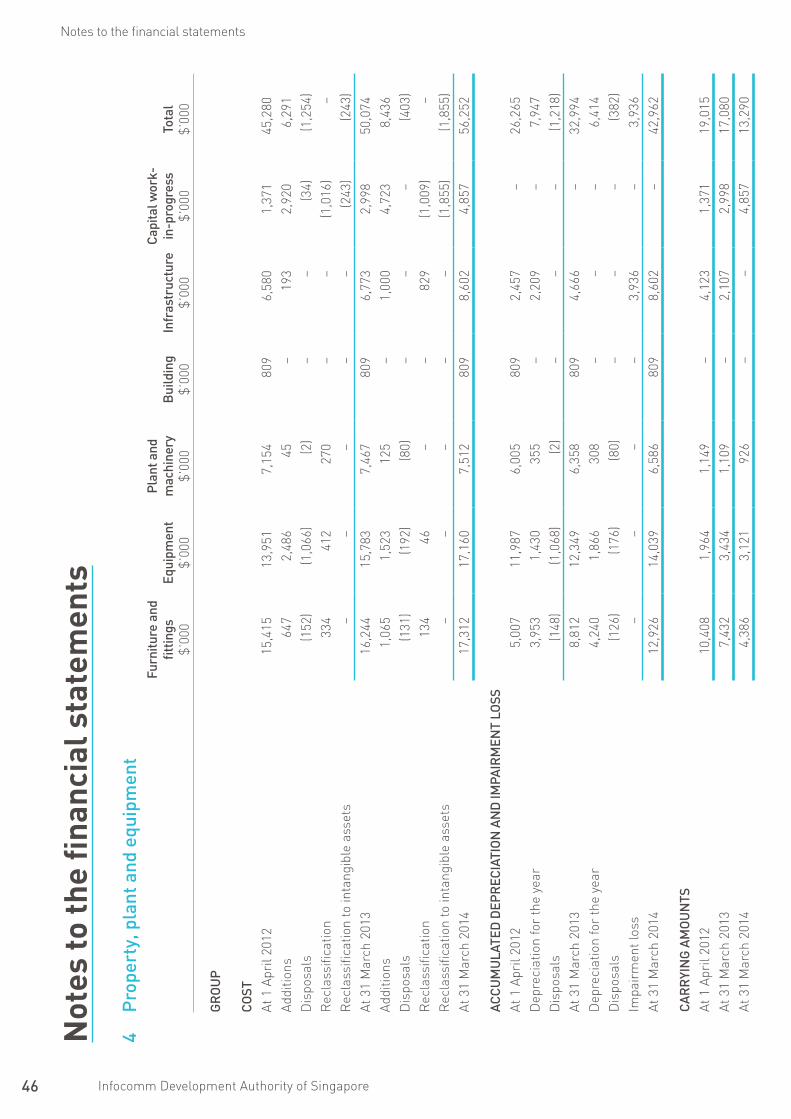
46 Infocomm Development Authority of Singapore
Notes to the financial statements
4 p
rope
rty,
pla
nt a
nd e
quip
men
tfu
rnitu
re a
nd
fittin
gs$’
000
equi
pmen
t$’
000
pla
nt a
nd
mac
hine
ry$’
000
Bui
ldin
g$’
000
Infr
astr
uctu
re$’
000
cap
ital w
ork-
in-p
rogr
ess
$’00
0to
tal
$’00
0
GR
Ou
p
cO
stAt
1 A
pril
2012
15,4
1513
,951
7,15
480
96,
580
1,37
145
,280
Addi
tions
647
2,48
645
–19
32,
920
6,29
1D
ispo
sals
(152
)(1
,066
)(2
)–
–(3
4)(1
,254
)R
ecla
ssifi
catio
n33
441
227
0–
–(1
,016
)–
Rec
lass
ifica
tion
to in
tang
ible
ass
ets
––
––
–(2
43)
(243
)At
31
Mar
ch 2
013
16,2
4415
,783
7,46
780
96,
773
2,99
850
,074
Addi
tions
1,06
51,
523
125
–1,
000
4,72
38,
436
Dis
posa
ls(1
31)
(192
)(8
0)–
––
(403
)R
ecla
ssifi
catio
n13
446
––
829
(1,0
09)
–R
ecla
ssifi
catio
n to
inta
ngib
le a
sset
s–
––
––
(1,8
55)
(1,8
55)
At 3
1 M
arch
201
417
,312
17,1
607,
512
809
8,60
24,
857
56,2
52
Acc
uM
ulA
ted
dep
Rec
IAtI
ON
AN
d IM
pAIR
MeN
t lO
ssAt
1 A
pril
2012
5,00
711
,987
6,00
580
92,
457
–26
,265
Dep
reci
atio
n fo
r th
e ye
ar3,
953
1,43
035
5–
2,20
9–
7,94
7D
ispo
sals
(148
)(1
,068
)(2
)–
––
(1,2
18)
At 3
1 M
arch
201
38,
812
12,3
496,
358
809
4,66
6–
32,9
94D
epre
ciat
ion
for
the
year
4,24
01,
866
308
––
–6,
414
Dis
posa
ls(1
26)
(176
)(8
0)–
––
(382
)Im
pair
men
t los
s–
––
–3,
936
–3,
936
At 3
1 M
arch
201
412
,926
14,0
396,
586
809
8,60
2–
42,9
62
cAR
RyI
NG
AM
Ou
Nts
At 1
Apr
il 20
1210
,408
1,96
41,
149
–4,
123
1,37
119
,015
At 3
1 M
arch
201
37,
432
3,43
41,
109
–2,
107
2,99
817
,080
At 3
1 M
arch
201
44,
386
3,12
192
6–
–4,
857
13,2
90
Not
es to
the
finan
cial
sta
tem
ents
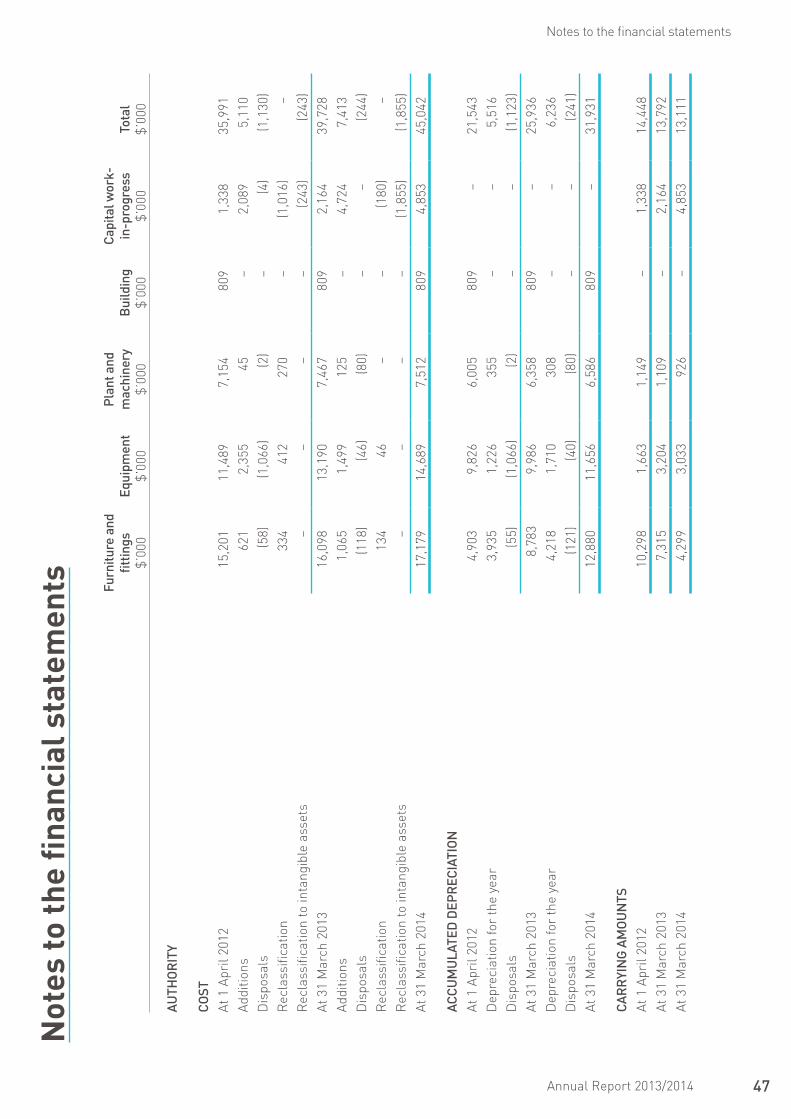
47Annual Report 2013/2014
Notes to the financial statements
4 p
rope
rty,
pla
nt a
nd e
quip
men
tfu
rnitu
re a
nd
fittin
gs$’
000
equi
pmen
t$’
000
pla
nt a
nd
mac
hine
ry$’
000
Bui
ldin
g$’
000
Infr
astr
uctu
re$’
000
cap
ital w
ork-
in-p
rogr
ess
$’00
0to
tal
$’00
0
GR
Ou
p
cO
stAt
1 A
pril
2012
15,4
1513
,951
7,15
480
96,
580
1,37
145
,280
Addi
tions
647
2,48
645
–19
32,
920
6,29
1D
ispo
sals
(152
)(1
,066
)(2
)–
–(3
4)(1
,254
)R
ecla
ssifi
catio
n33
441
227
0–
–(1
,016
)–
Rec
lass
ifica
tion
to in
tang
ible
ass
ets
––
––
–(2
43)
(243
)At
31
Mar
ch 2
013
16,2
4415
,783
7,46
780
96,
773
2,99
850
,074
Addi
tions
1,06
51,
523
125
–1,
000
4,72
38,
436
Dis
posa
ls(1
31)
(192
)(8
0)–
––
(403
)R
ecla
ssifi
catio
n13
446
––
829
(1,0
09)
–R
ecla
ssifi
catio
n to
inta
ngib
le a
sset
s–
––
––
(1,8
55)
(1,8
55)
At 3
1 M
arch
201
417
,312
17,1
607,
512
809
8,60
24,
857
56,2
52
Acc
uM
ulA
ted
dep
Rec
IAtI
ON
AN
d IM
pAIR
MeN
t lO
ssAt
1 A
pril
2012
5,00
711
,987
6,00
580
92,
457
–26
,265
Dep
reci
atio
n fo
r th
e ye
ar3,
953
1,43
035
5–
2,20
9–
7,94
7D
ispo
sals
(148
)(1
,068
)(2
)–
––
(1,2
18)
At 3
1 M
arch
201
38,
812
12,3
496,
358
809
4,66
6–
32,9
94D
epre
ciat
ion
for
the
year
4,24
01,
866
308
––
–6,
414
Dis
posa
ls(1
26)
(176
)(8
0)–
––
(382
)Im
pair
men
t los
s–
––
–3,
936
–3,
936
At 3
1 M
arch
201
412
,926
14,0
396,
586
809
8,60
2–
42,9
62
cAR
RyI
NG
AM
Ou
Nts
At 1
Apr
il 20
1210
,408
1,96
41,
149
–4,
123
1,37
119
,015
At 3
1 M
arch
201
37,
432
3,43
41,
109
–2,
107
2,99
817
,080
At 3
1 M
arch
201
44,
386
3,12
192
6–
–4,
857
13,2
90
furn
iture
and
fit
tings
$’00
0eq
uipm
ent
$’00
0
pla
nt a
nd
mac
hine
ry$’
000
Bui
ldin
g$’
000
cap
ital w
ork-
in-p
rogr
ess
$’00
0 to
tal
$’00
0
Auth
OR
Ity
cO
stAt
1 A
pril
2012
15,2
0111
,489
7,15
480
91,
338
35,9
91Ad
ditio
ns62
12,
355
45–
2,08
95,
110
Dis
posa
ls(5
8)(1
,066
)(2
)–
(4)
(1,1
30)
Rec
lass
ifica
tion
334
412
270
–(1
,016
)–
Rec
lass
ifica
tion
to in
tang
ible
ass
ets
––
––
(243
)(2
43)
At 3
1 M
arch
201
316
,098
13,1
907,
467
809
2,16
439
,728
Addi
tions
1,06
51,
499
125
–4,
724
7,41
3D
ispo
sals
(118
)(4
6)(8
0)–
–(2
44)
Rec
lass
ifica
tion
134
46–
–(1
80)
–R
ecla
ssifi
catio
n to
inta
ngib
le a
sset
s–
––
–(1
,855
)(1
,855
)At
31
Mar
ch 2
014
17,1
7914
,689
7,51
280
94,
853
45,0
42
Acc
uM
ulA
ted
dep
Rec
IAtI
ON
At
1 A
pril
2012
4,90
39,
826
6,00
580
9–
21,5
43D
epre
ciat
ion
for
the
year
3,93
51,
226
355
––
5,51
6D
ispo
sals
(55)
(1,0
66)
(2)
––
(1,1
23)
At 3
1 M
arch
201
38,
783
9,98
66,
358
809
–25
,936
Dep
reci
atio
n fo
r th
e ye
ar4,
218
1,71
030
8–
–6,
236
Dis
posa
ls(1
21)
(40)
(80)
––
(241
)At
31
Mar
ch 2
014
12,8
8011
,656
6,58
680
9–
31,9
31
cAR
RyI
NG
AM
Ou
Nts
At 1
Apr
il 20
1210
,298
1,66
31,
149
–1,
338
14,4
48At
31
Mar
ch 2
013
7,31
53,
204
1,10
9–
2,16
413
,792
At 3
1 M
arch
201
44,
299
3,03
392
6–
4,85
313
,111
Not
es to
the
finan
cial
sta
tem
ents

48 Infocomm Development Authority of Singapore
Notes to the financial statements
The Authority has legal title to the land and building that is presently the Singapore philatelic Museum (“SpM”), with an original cost amounting to $3.179 million (2012/2013: $3.179 million), and carrying amount of $1 (2012/2013: $1) as at 31 March 2014.
Capital work-in-progress represents installation of equipment, furniture and fittings in progress, which upon completion, will be reclassified to the relevant asset categories.
Impairmentloss The Group assessed the carrying amounts of its property, plant and equipment against their recoverable amounts
at each reporting date to determine whether there is any indication of impairment.
Management noted indicators of impairment with respect to the Group’s infrastructure due to changes in the financial circumstances of the infrastructure and the estimated ongoing operating costs to be incurred. As a result, an impairment assessment was performed on the above asset. Management has estimated the recoverable amount based on value-in-use method, to be zero due to estimated negative cash flows to be incurred for the foreseeable future. hence, the carrying amount of the Infrastructure amounting to $3.936 million was fully impaired and this has been recognised in the Group’s income and expenditure statement in the current financial year.
5 Intangible assets
Group Authority2013/2014 2012/2013 2013/2014 2012/2013
$’000 $’000 $’000 $’000
cOstAt 1 April 8,538 8,143 8,375 8,010Additions 3,807 657 3,793 627Disposals (156) (505) (103) (505)Reclassification from capital work-in-progress 1,855 243 1,855 243At 31 March 14,044 8,538 13,920 8,375
AccuMulAted AMORtIsAtIONAt 1 April 7,676 7,494 7,586 7,460Amortisation for the year 1,283 668 1,228 612Disposals (156) (486) (103) (486)At 31 March 8,803 7,676 8,711 7,586
cARRyING AMOuNtsAt 31 March 5,241 862 5,209 789
Notes to the financial statements
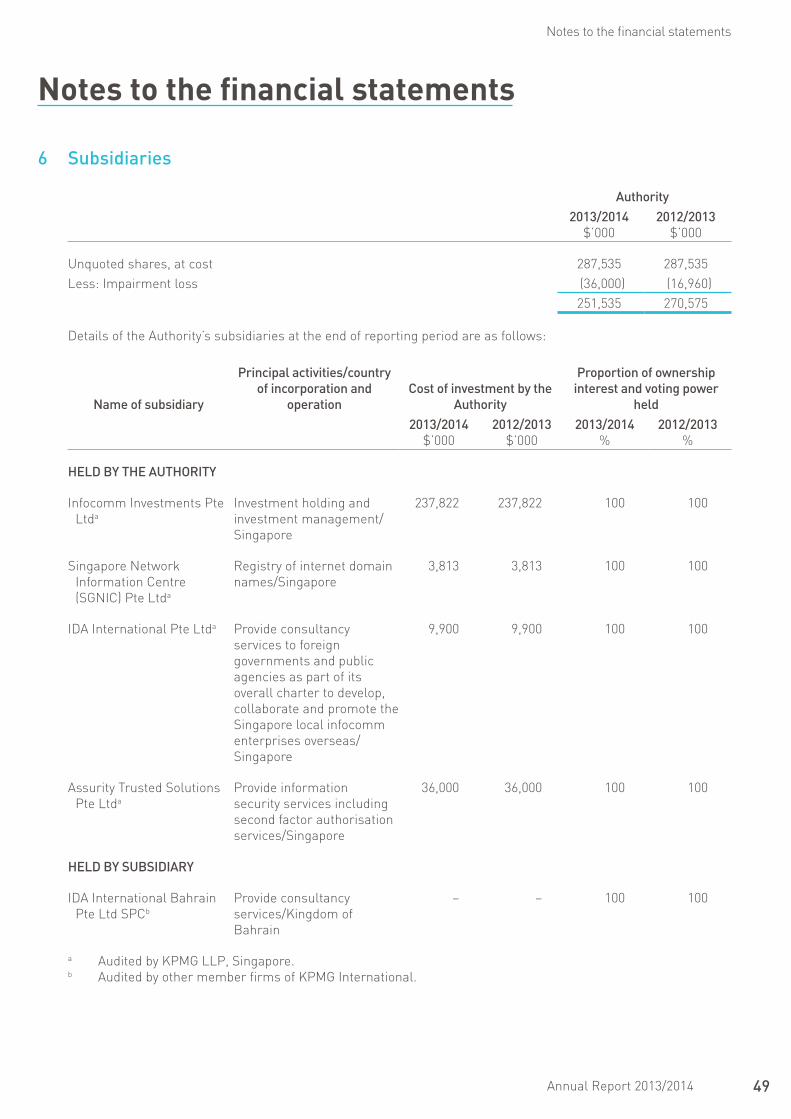
49Annual Report 2013/2014
Notes to the financial statements
6 subsidiaries
Authority2013/2014
$’0002012/2013
$’000
unquoted shares, at cost 287,535 287,535less: Impairment loss (36,000) (16,960)
251,535 270,575
Details of the Authority’s subsidiaries at the end of reporting period are as follows:
Name of subsidiary
principal activities/country of incorporation and
operationcost of investment by the
Authority
proportion of ownership interest and voting power
held2013/2014
$’0002012/2013
$’0002013/2014
%2012/2013
%
held By the AuthORIty
Infocomm Investments pte ltda
Investment holding and investment management/ Singapore
237,822 237,822 100 100
Singapore network Information Centre (SGnIC) pte ltda
Registry of internet domain names/Singapore
3,813 3,813 100 100
IDA International pte ltda provide consultancy services to foreign governments and public agencies as part of its overall charter to develop, collaborate and promote the Singapore local infocomm enterprises overseas/Singapore
9,900 9,900 100 100
Assurity Trusted Solutions pte ltda
provide information security services including second factor authorisation services/Singapore
36,000 36,000 100 100
held By suBsIdIARy
IDA International Bahrain pte ltd SpCb
provide consultancy services/Kingdom of Bahrain
– – 100 100
a Audited by KpMG llp, Singapore.b Audited by other member firms of KpMG International.
Notes to the financial statements

50 Infocomm Development Authority of Singapore
Notes to the financial statements
Impairmentloss At the end of each reporting period, management reviews the carrying amounts of the investment in subsidiaries
to determine whether there are any indications that the investment is impaired.
Management noted indicators of impairment with respect to the Authority’s investment in a subsidiary, a cash-generating unit (“CGu”), due to changes in its financial circumstances and the estimated ongoing operating costs expected to be incurred. As a result, management estimated the recoverable amount based on the value-in-use method, to be zero due to estimated negative cash flows to be incurred for the foreseeable future. hence, an impairment loss of $19.040 million (2012/2013: $7.560 million) was recognised in relation to the investment in that subsidiary and this has been recognised in the Authority’s statement of income and expenditure.
7 deferred expenditure
Group and Authority2013/2014 2012/2013
$’000 $’000
cOstAt 1 April 9,484 8,617Additions 1,150 1,122Written-off (313) (255)At 31 March 10,321 9,484
AccuMulAted AMORtIsAtIONAt 1 April 5,773 5,057Amortisation for the year 495 716At 31 March 6,268 5,773
cARRyING AMOuNtAt 31 March 4,053 3,711
Expenditure incurred in providing scholarships is capitalised and stated at cost less accumulated amortisation. Amortisation is calculated on a straight-line basis to write off the cost over the period of the scholarship bond from 4 to 6 years commencing from the year that the scholars commence employment with the Group.
8 Available-for-sale financial assets
Group AuthorityNote 2013/2014
$’0002012/2013
$’0002013/2014
$’0002012/2013
$’000
unquoted fund investments, at fair value (i) 1,491 1,625 – –unquoted equity securities, at fair value (ii) 18,276 12,939 – –less: impairment loss (4,098) (2,832) – –
14,178 10,107 – –Total 15,669 11,732 – –
(i) unquoted fund investments at fair value include impairment losses amounting to $9.69 million (2012/2013: $9.69 million).
Notes to the financial statements
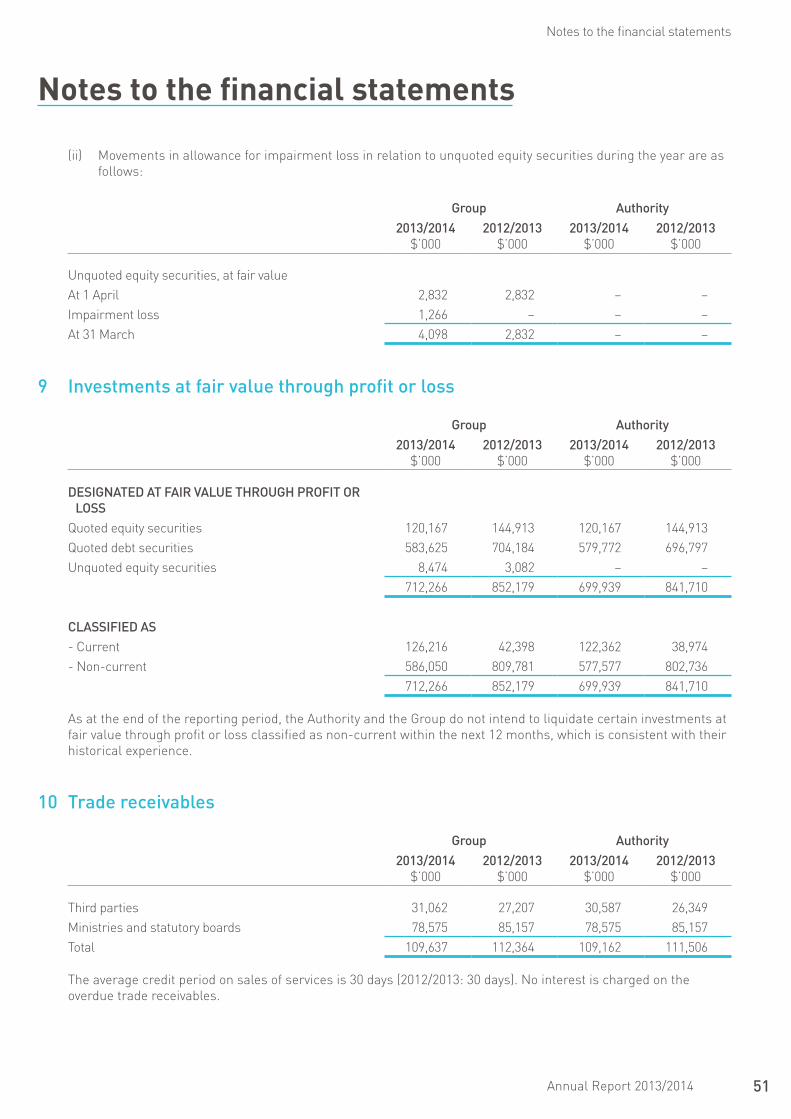
51Annual Report 2013/2014
Notes to the financial statements
(ii) Movements in allowance for impairment loss in relation to unquoted equity securities during the year are as follows:
Group Authority2013/2014
$’0002012/2013
$’0002013/2014
$’0002012/2013
$’000
unquoted equity securities, at fair value At 1 April 2,832 2,832 – –Impairment loss 1,266 – – –At 31 March 4,098 2,832 – –
9 Investments at fair value through profit or loss
Group Authority2013/2014
$’0002012/2013
$’0002013/2014
$’0002012/2013
$’000
desIGNAted At fAIR vAlue thROuGh pROfIt OR lOss
Quoted equity securities 120,167 144,913 120,167 144,913Quoted debt securities 583,625 704,184 579,772 696,797unquoted equity securities 8,474 3,082 – –
712,266 852,179 699,939 841,710
clAssIfIed As- Current 126,216 42,398 122,362 38,974- non-current 586,050 809,781 577,577 802,736
712,266 852,179 699,939 841,710
As at the end of the reporting period, the Authority and the Group do not intend to liquidate certain investments at fair value through profit or loss classified as non-current within the next 12 months, which is consistent with their historical experience.
10 trade receivables
Group Authority2013/2014
$’0002012/2013
$’0002013/2014
$’0002012/2013
$’000
Third parties 31,062 27,207 30,587 26,349Ministries and statutory boards 78,575 85,157 78,575 85,157Total 109,637 112,364 109,162 111,506
The average credit period on sales of services is 30 days (2012/2013: 30 days). no interest is charged on the overdue trade receivables.
Notes to the financial statements

52 Infocomm Development Authority of Singapore
Notes to the financial statements
The table below is an analysis of trade receivables as at the end of the reporting period:
Group Authority2013/2014
$’0002012/2013
$’0002013/2014
$’0002012/2013
$’000
not past due and not impaired 101,415 112,235 100,940 111,377past due but not impaired 8,222 129 8,222 129Impaired receivables – individually assessed 6 289 6 289less : Allowance for impairment (6) (289) (6) (289)Total trade receivables, net 109,637 112,364 109,162 111,506
The Group’s trade receivable balances are predominately from Singapore Government Organisations (“GO”) whose credit risks are assessed to be low. There is no concentration risk at both the Group and Authority levels.
Included in the Group’s trade receivables balance are debtors with a carrying amount of $8.222 million (2012/2013: $0.129 million) which are past due at the end of the reporting period for which no allowance for possible doubtful debts has been provided. This is because more than 80% (2012/2013: 70%) of the balance are due from GO and based on historical payment experience, the risk of default of receivables from GO is low. The Group does not hold any collateral over these balances. The outstanding amounts are unsecured, interest-free and repayable on demand unless otherwise stated. no guarantees have been provided or received in respect of the related party balances. The average age of these receivables are 60 days (2012/2013: 57 days).
These receivables are not secured by any collateral or credit enhancements.
The movement in the allowance for impairment in respect of trade receivables during the year was as follows:
Group and Authority2013/2014
$’0002012/2013
$’000
At 1 April 289 155Amounts recovered during the year (289) (9)Impairment loss recognised 6 161Amount written off – (18)At 31 March 6 289
Notes to the financial statements
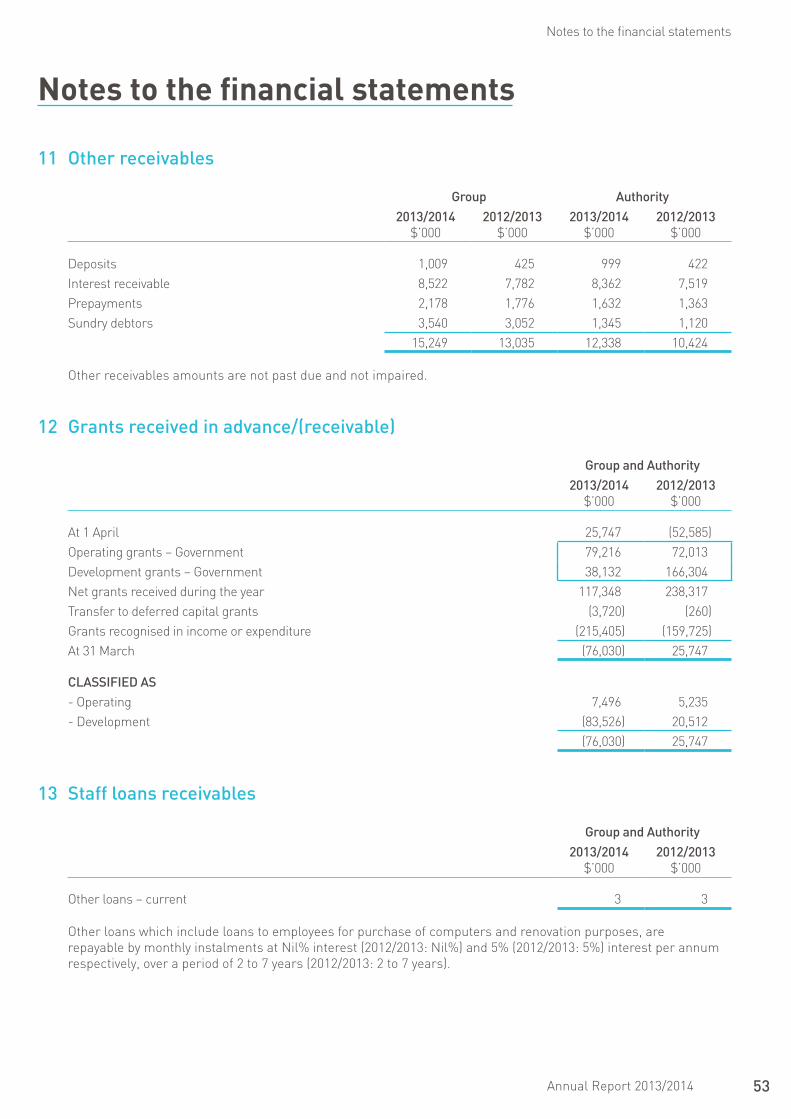
53Annual Report 2013/2014
Notes to the financial statements
11 Other receivables
Group Authority2013/2014
$’0002012/2013
$’0002013/2014
$’0002012/2013
$’000
Deposits 1,009 425 999 422Interest receivable 8,522 7,782 8,362 7,519prepayments 2,178 1,776 1,632 1,363Sundry debtors 3,540 3,052 1,345 1,120
15,249 13,035 12,338 10,424
Other receivables amounts are not past due and not impaired.
12 Grants received in advance/(receivable)
Group and Authority2013/2014
$’0002012/2013
$’000
At 1 April 25,747 (52,585)Operating grants – Government 79,216 72,013Development grants – Government 38,132 166,304net grants received during the year 117,348 238,317Transfer to deferred capital grants (3,720) (260)Grants recognised in income or expenditure (215,405) (159,725) At 31 March (76,030) 25,747
clAssIfIed As- Operating 7,496 5,235- Development (83,526) 20,512
(76,030) 25,747
13 staff loans receivables
Group and Authority2013/2014
$’0002012/2013
$’000
Other loans – current 3 3
Other loans which include loans to employees for purchase of computers and renovation purposes, are repayable by monthly instalments at nil% interest (2012/2013: nil%) and 5% (2012/2013: 5%) interest per annum respectively, over a period of 2 to 7 years (2012/2013: 2 to 7 years).
Notes to the financial statements
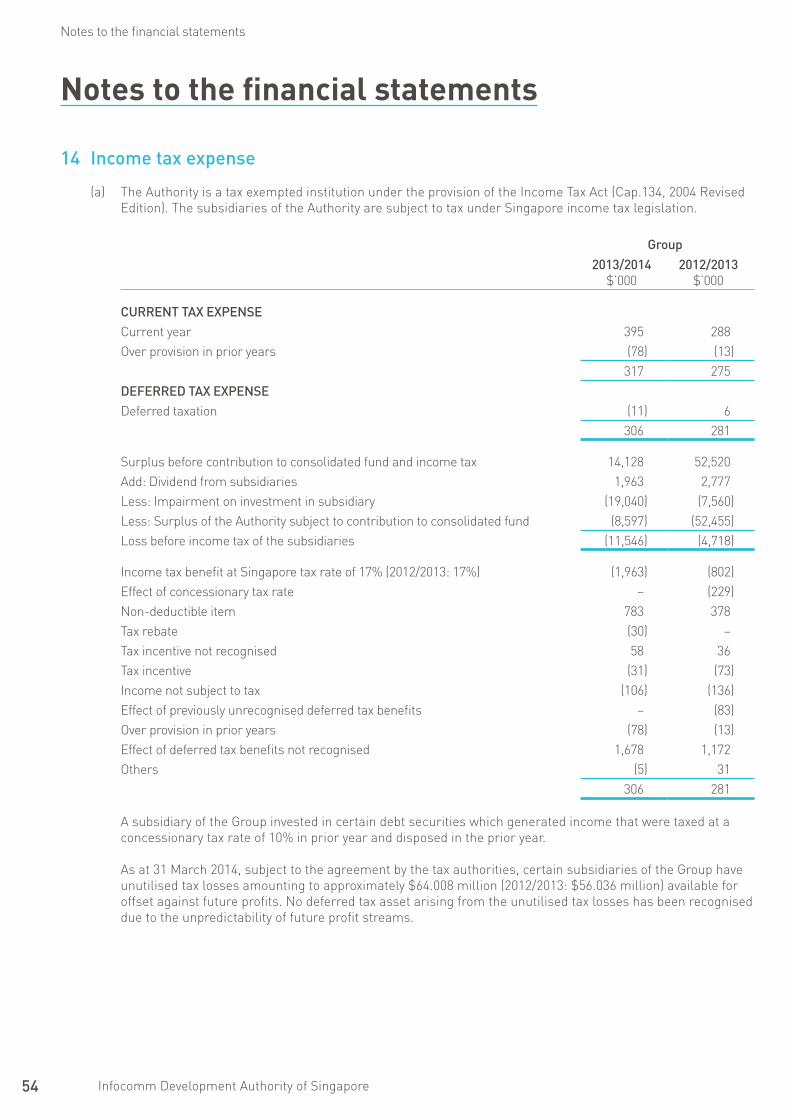
54 Infocomm Development Authority of Singapore
Notes to the financial statements
14 Income tax expense
(a) The Authority is a tax exempted institution under the provision of the Income Tax Act (Cap.134, 2004 Revised Edition). The subsidiaries of the Authority are subject to tax under Singapore income tax legislation.
Group2013/2014
$’0002012/2013
$’000
cuRReNt tAx expeNseCurrent year 395 288Over provision in prior years (78) (13)
317 275defeRRed tAx expeNseDeferred taxation (11) 6
306 281
Surplus before contribution to consolidated fund and income tax 14,128 52,520Add: Dividend from subsidiaries 1,963 2,777less: Impairment on investment in subsidiary (19,040) (7,560)less: Surplus of the Authority subject to contribution to consolidated fund (8,597) (52,455)loss before income tax of the subsidiaries (11,546) (4,718)
Income tax benefit at Singapore tax rate of 17% (2012/2013: 17%) (1,963) (802)Effect of concessionary tax rate – (229)non-deductible item 783 378Tax rebate (30) –Tax incentive not recognised 58 36Tax incentive (31) (73)Income not subject to tax (106) (136)Effect of previously unrecognised deferred tax benefits – (83)Over provision in prior years (78) (13)Effect of deferred tax benefits not recognised 1,678 1,172Others (5) 31
306 281
A subsidiary of the Group invested in certain debt securities which generated income that were taxed at a concessionary tax rate of 10% in prior year and disposed in the prior year.
As at 31 March 2014, subject to the agreement by the tax authorities, certain subsidiaries of the Group have unutilised tax losses amounting to approximately $64.008 million (2012/2013: $56.036 million) available for offset against future profits. no deferred tax asset arising from the unutilised tax losses has been recognised due to the unpredictability of future profit streams.
Notes to the financial statements

55Annual Report 2013/2014
Notes to the financial statements
(b) Movements in deferred taxation
Group2013/2014
$’0002012/2013
$’000
At 1 April 20 14(Credited)/Charged to income or expenditure (11) 6At 31 March 9 20
Deferred tax liabilities are attributable to property, plant and equipment.
15 cash and bank balances
Group Authority2013/2014
$’0002012/2013
$’0002013/2014
$’0002012/2013
$’000
Cash with the AGD 211,496 242,976 153,166 174,622Cash with custodian 45,799 2,654 45,799 2,654Bank and cash balances 1,099 1,525 442 167Total 258,394 247,155 199,407 177,443
The Group participates in the Accountant-General Department’s Centralised liquidity Management Scheme (“ClM”) whereby the Group’s cash is pooled together and managed centrally by Accountant-General Department (“AGD”), a related party, in fixed deposits. This does not affect the daily liquidity of the Group. AGD pays interest on the Group’s cash balances participating in AGD’s ClM. For the year, the effective rate was 0.62% (2012/2013: 0.59%).
Cash and bank balances of the Group and Authority include an amount of approximately $32.121 million (2012/2013: $36.695 million) earmarked for payment of pension and medical benefits to pensioners and $174.201 million (2012/2013: $141.087 million) set aside for specific purposes.
Notes to the financial statements
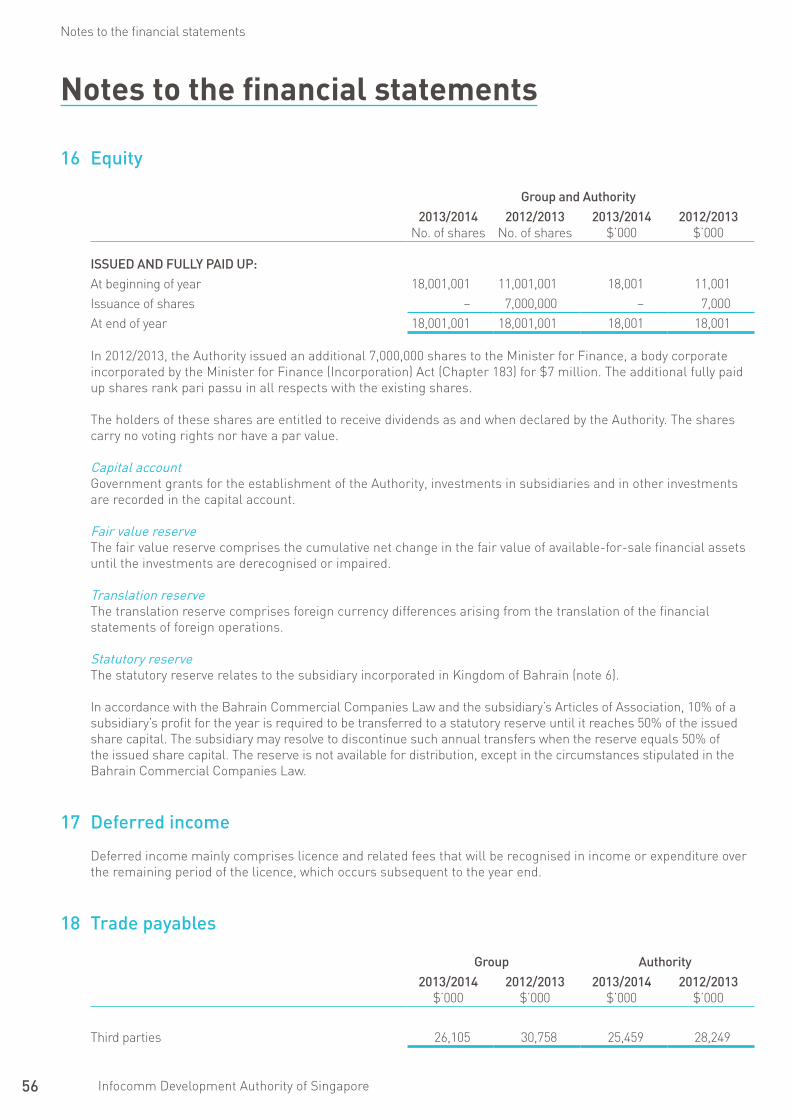
56 Infocomm Development Authority of Singapore
Notes to the financial statements
16 equity
Group and Authority2013/2014
no. of shares2012/2013
no. of shares2013/2014
$’0002012/2013
$’000
Issued ANd fully pAId up:At beginning of year 18,001,001 11,001,001 18,001 11,001Issuance of shares – 7,000,000 – 7,000At end of year 18,001,001 18,001,001 18,001 18,001
In 2012/2013, the Authority issued an additional 7,000,000 shares to the Minister for Finance, a body corporate incorporated by the Minister for Finance (Incorporation) Act (Chapter 183) for $7 million. The additional fully paid up shares rank pari passu in all respects with the existing shares.
The holders of these shares are entitled to receive dividends as and when declared by the Authority. The shares carry no voting rights nor have a par value.
Capitalaccount Government grants for the establishment of the Authority, investments in subsidiaries and in other investments
are recorded in the capital account.
Fairvaluereserve The fair value reserve comprises the cumulative net change in the fair value of available-for-sale financial assets
until the investments are derecognised or impaired.
Translationreserve The translation reserve comprises foreign currency differences arising from the translation of the financial
statements of foreign operations.
Statutoryreserve The statutory reserve relates to the subsidiary incorporated in Kingdom of Bahrain (note 6).
In accordance with the Bahrain Commercial Companies law and the subsidiary’s Articles of Association, 10% of a subsidiary’s profit for the year is required to be transferred to a statutory reserve until it reaches 50% of the issued share capital. The subsidiary may resolve to discontinue such annual transfers when the reserve equals 50% of the issued share capital. The reserve is not available for distribution, except in the circumstances stipulated in the Bahrain Commercial Companies law.
17 deferred income
Deferred income mainly comprises licence and related fees that will be recognised in income or expenditure over the remaining period of the licence, which occurs subsequent to the year end.
18 trade payables
Group Authority2013/2014
$’0002012/2013
$’0002013/2014
$’0002012/2013
$’000
Third parties 26,105 30,758 25,459 28,249
Notes to the financial statements
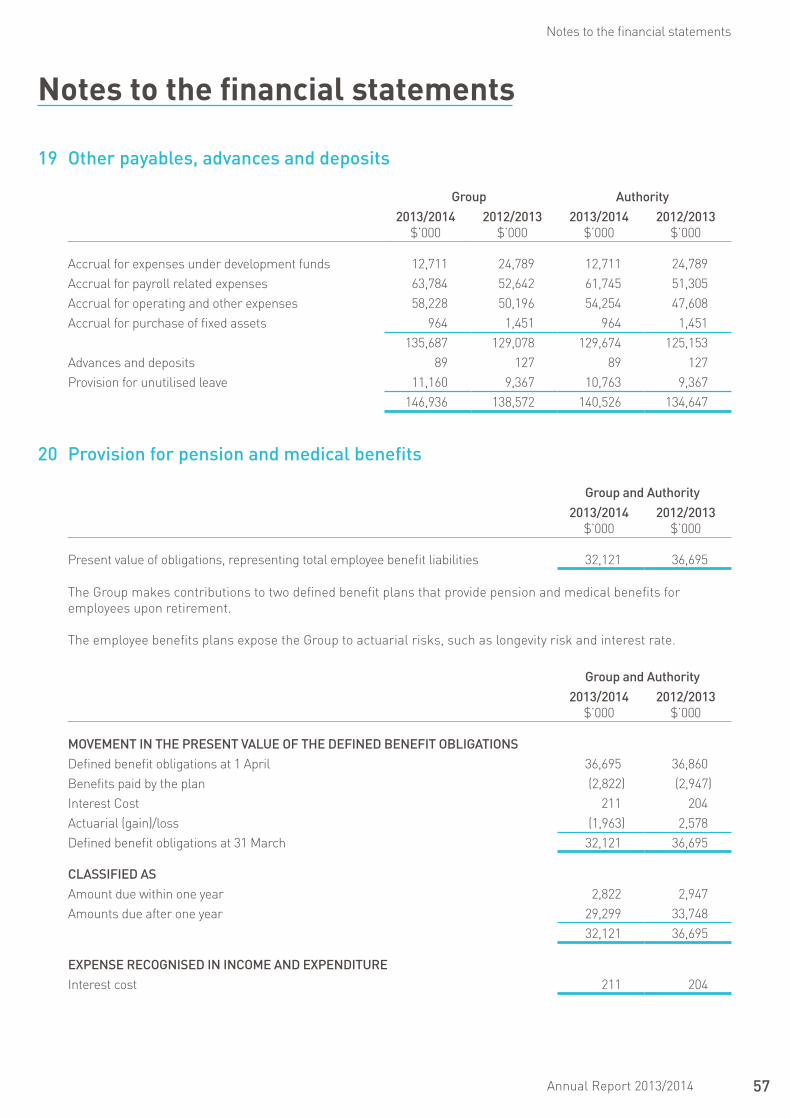
57Annual Report 2013/2014
Notes to the financial statements
19 Other payables, advances and deposits
Group Authority2013/2014
$’0002012/2013
$’0002013/2014
$’0002012/2013
$’000
Accrual for expenses under development funds 12,711 24,789 12,711 24,789Accrual for payroll related expenses 63,784 52,642 61,745 51,305Accrual for operating and other expenses 58,228 50,196 54,254 47,608Accrual for purchase of fixed assets 964 1,451 964 1,451
135,687 129,078 129,674 125,153Advances and deposits 89 127 89 127provision for unutilised leave 11,160 9,367 10,763 9,367
146,936 138,572 140,526 134,647
20 provision for pension and medical benefits
Group and Authority2013/2014
$’0002012/2013
$’000
present value of obligations, representing total employee benefit liabilities 32,121 36,695
The Group makes contributions to two defined benefit plans that provide pension and medical benefits for employees upon retirement.
The employee benefits plans expose the Group to actuarial risks, such as longevity risk and interest rate.
Group and Authority2013/2014
$’0002012/2013
$’000
MOveMeNt IN the pReseNt vAlue Of the defINed BeNefIt OBlIGAtIONsDefined benefit obligations at 1 April 36,695 36,860Benefits paid by the plan (2,822) (2,947)Interest Cost 211 204Actuarial (gain)/loss (1,963) 2,578Defined benefit obligations at 31 March 32,121 36,695
clAssIfIed AsAmount due within one year 2,822 2,947Amounts due after one year 29,299 33,748
32,121 36,695
expeNse RecOGNIsed IN INcOMe ANd expeNdItuReInterest cost 211 204
Notes to the financial statements
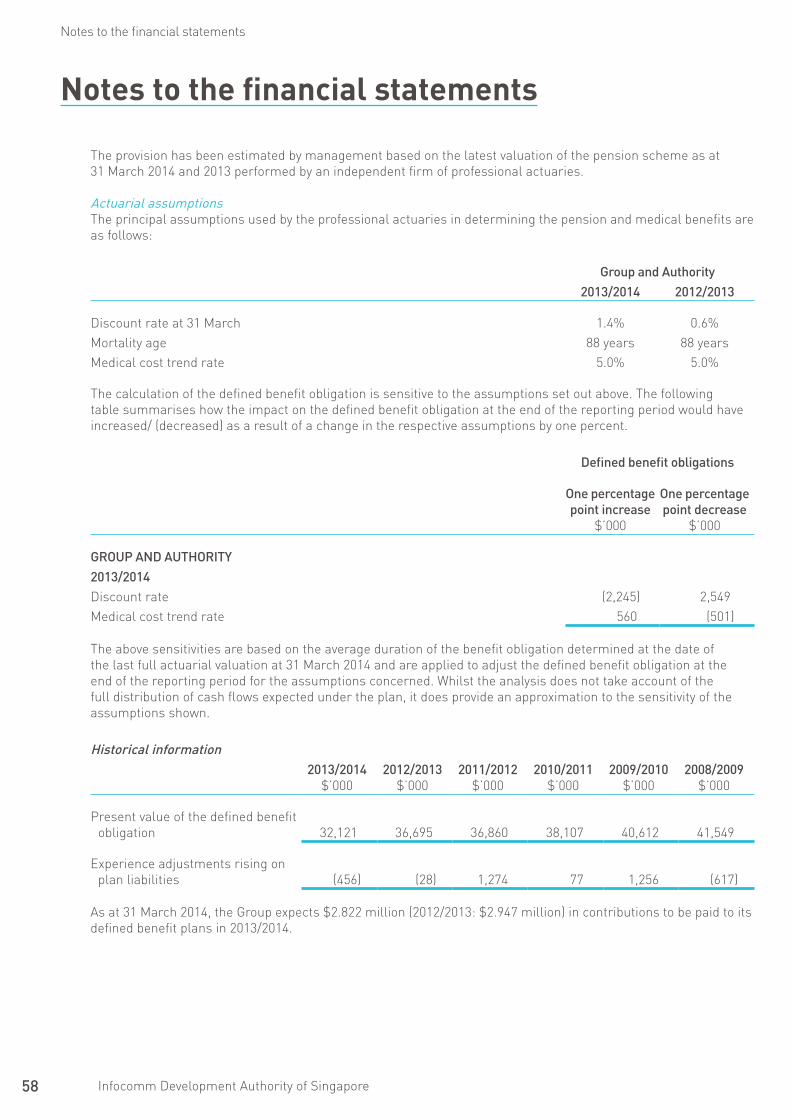
58 Infocomm Development Authority of Singapore
Notes to the financial statements
The provision has been estimated by management based on the latest valuation of the pension scheme as at 31 March 2014 and 2013 performed by an independent firm of professional actuaries.
Actuarialassumptions The principal assumptions used by the professional actuaries in determining the pension and medical benefits are
as follows:
Group and Authority2013/2014 2012/2013
Discount rate at 31 March 1.4% 0.6%Mortality age 88 years 88 yearsMedical cost trend rate 5.0% 5.0%
The calculation of the defined benefit obligation is sensitive to the assumptions set out above. The following table summarises how the impact on the defined benefit obligation at the end of the reporting period would have increased/ (decreased) as a result of a change in the respective assumptions by one percent.
defined benefit obligations
One percentage point increase
$’000
One percentage point decrease
$’000
GROup ANd AuthORIty2013/2014Discount rate (2,245) 2,549Medical cost trend rate 560 (501)
The above sensitivities are based on the average duration of the benefit obligation determined at the date of the last full actuarial valuation at 31 March 2014 and are applied to adjust the defined benefit obligation at the end of the reporting period for the assumptions concerned. Whilst the analysis does not take account of the full distribution of cash flows expected under the plan, it does provide an approximation to the sensitivity of the assumptions shown.
historical information2013/2014
$’0002012/2013
$’0002011/2012
$’0002010/2011
$’0002009/2010
$’0002008/2009
$’000
present value of the defined benefit obligation 32,121 36,695 36,860 38,107 40,612 41,549
Experience adjustments rising on plan liabilities (456) (28) 1,274 77 1,256 (617)
As at 31 March 2014, the Group expects $2.822 million (2012/2013: $2.947 million) in contributions to be paid to its defined benefit plans in 2013/2014.
Notes to the financial statements
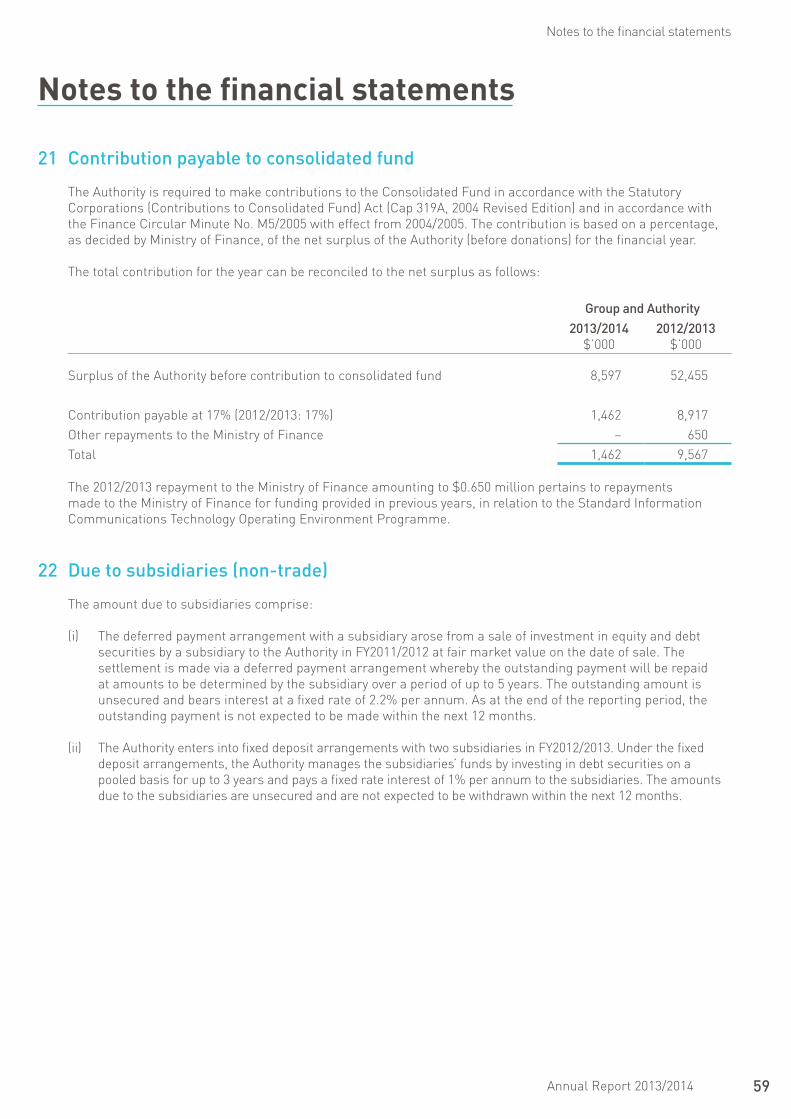
59Annual Report 2013/2014
Notes to the financial statements
21 contribution payable to consolidated fund
The Authority is required to make contributions to the Consolidated Fund in accordance with the Statutory Corporations (Contributions to Consolidated Fund) Act (Cap 319A, 2004 Revised Edition) and in accordance with the Finance Circular Minute no. M5/2005 with effect from 2004/2005. The contribution is based on a percentage, as decided by Ministry of Finance, of the net surplus of the Authority (before donations) for the financial year.
The total contribution for the year can be reconciled to the net surplus as follows:
Group and Authority2013/2014
$’0002012/2013
$’000
Surplus of the Authority before contribution to consolidated fund 8,597 52,455
Contribution payable at 17% (2012/2013: 17%) 1,462 8,917Other repayments to the Ministry of Finance – 650Total 1,462 9,567
The 2012/2013 repayment to the Ministry of Finance amounting to $0.650 million pertains to repayments made to the Ministry of Finance for funding provided in previous years, in relation to the Standard Information Communications Technology Operating Environment programme.
22 due to subsidiaries (non-trade)
The amount due to subsidiaries comprise:
(i) The deferred payment arrangement with a subsidiary arose from a sale of investment in equity and debt securities by a subsidiary to the Authority in Fy2011/2012 at fair market value on the date of sale. The settlement is made via a deferred payment arrangement whereby the outstanding payment will be repaid at amounts to be determined by the subsidiary over a period of up to 5 years. The outstanding amount is unsecured and bears interest at a fixed rate of 2.2% per annum. As at the end of the reporting period, the outstanding payment is not expected to be made within the next 12 months.
(ii) The Authority enters into fixed deposit arrangements with two subsidiaries in Fy2012/2013. under the fixed deposit arrangements, the Authority manages the subsidiaries’ funds by investing in debt securities on a pooled basis for up to 3 years and pays a fixed rate interest of 1% per annum to the subsidiaries. The amounts due to the subsidiaries are unsecured and are not expected to be withdrawn within the next 12 months.
Notes to the financial statements
60 Infocomm Development Authority of Singapore
Notes to the financial statements
23 financial instruments
(a) financial risk management
Overview The Group has exposure to the following risks from its use of financial instruments:
• market risk• credit risk• liquidity risk
This note presents information about the Group’s exposure to each of the above risks, the Group’s objectives, policies and processes for measuring and managing risk, and the Group’s management of capital.
Riskmanagementframework The Group has documented financial risk management policies. These policies set out the Group’s overall
business strategies and its risk management philosophy. The Group’s overall financial risk management objective seeks to minimise potential adverse effects on its financial performance. It is the Group’s policy not to hold derivative financial instruments for speculative purposes although such instruments may be used for hedging exposure. The Board provides written principles for overall financial risk management, which covers specifically on market risk (including price risk, foreign exchange risk, and interest rate risk), credit risk and liquidity risk. Such written policies are reviewed periodically by the Board and periodic reviews are undertaken to ensure that the Group’s policy are relevant and complied with.
The Group monitors its risk exposure regularly. There has been no change to the Group’s exposure to these financial risks or the manner in which it manages and measures the risk.
The Authority has established a governance, risk and compliance framework which sets out, amongst other things, the governance oversight, risk measurement and monitoring processes, to enhance its overall risk management for the investments at fair value through profit or loss. As part of the risk management process, the management of the Group also conducts ongoing review of its financial assets held in the investment portfolio.
(b) Market risk Market risk refers to the risk arising from uncertainty in the future values of the financial instruments,
resulting from movements in factors such as equity prices, foreign exchange rates and market interest rates. The Group and the Authority’s exposure to each of these factors are presented in the following paragraphs.
(i) Pricerisk
Riskmanagementpolicy price risk is the risk that the fair value or future cash flows of a financial instrument will fluctuate
arising from changes in market prices (other than those arising from interest rate risk or currency risk, which are further discussed below), whether those changes are caused by factors specific to the individual financial instrument or its issuer, or factors affecting similar financial instruments traded in the market.
The Group is exposed to price risk arising from its investments in equity and debt securities, and fund investments categorised as either available-for-sale financial assets or investments at fair value through profit or loss. The Group’s equity securities comprise both quoted and unquoted equity securities and fund investments. The Group’s debt securities comprise unquoted debt securities that are exposed to price risk. The management monitors the price fluctuations of the investments and assessed the valuation regularly.
The Authority is exposed to price risk arising from its investments in quoted equity debt securities categorised as investments at fair value through profit or loss. The management monitors the price
Notes to the financial statements
61Annual Report 2013/2014
Notes to the financial statements
fluctuations of the investments and assessed the valuation on a daily basis. In accordance with its governance, risk and compliance framework, the management will report significant price movements to the Investment Committee.
Sensitivityanalysis Available-for-sale financial assets If the prices of equity securities and fund investments (excluding the unquoted equity securities at cost less
impairment) had been 10% higher with all other variables held constant, the increase in the fair value of these investments and the corresponding increase in fair value change reserves for the year ended 31 March 2014 would have been $1.090 million (2012/2013: $1.000 million). Correspondingly, if the prices of equity securities and fund investments (excluding the unquoted equity securities at cost less impairment) had been 10% lower with all other variables held constant, the fair value of these investments and the fair value changes reserves would have decreased by an equal amount.
The Authority does not hold any Available-for-sale financial assets.
Investments at fair value through profit or loss
Group If the prices of equity and debt securities (excluding the unquoted equity securities at cost less impairment)
had been 10% higher with all other variables held constant, the Group’s fair value of these financial instruments for the year ended 31 March 2014 would have been higher by $13.090 million (2012/2013: $14.751 million) and $58.363 million (2012/2013: $0.097 million) respectively. Correspondingly, the Group’s surplus for the year would have been higher by $71.453 million (2012/2013: $14.848 million).
Conversely, if the prices of equity and debt securities (excluding the unquoted equity securities at cost less
impairment) had been 10% lower with all other variables held constant, the Group’s fair value of the financial instruments would have been lower by $12.600 million (2012/2013: $14.751 million) and $58.363 million (2012/2013: $0.097 million) respectively. Correspondingly, the Group’s surplus for the year would have been lower by $70.963 million (2012/2013: $14.848 million).
Authority If the prices of quoted equity securities had been 10% higher with all other variables held constant, the
Authority’s fair value of these financial instruments for the year ended 31 March 2014 would have been higher by $12.530 million (2012/2013: $14.660 million). Correspondingly, the increase in the Authority’s surplus for the year would have been $12.020 million (2012/2013: $14.660 million).
Conversely, if the prices of equity had been 10% lower with all other variables held constant, the Authority’s fair value of the financial instruments would have been lower by $12.040 million (2012/2013: $14.660 million). Correspondingly, the decrease in the Authority’s surplus for the year would have been $12.020 million (2012/2013: $14.660 million).
The 10% represents management’s assessment of the possible change in market prices. The sensitivity analysis is for illustrative purposes only. In practice, prices rarely change in isolation and are likely to be interdependent with other market variables.
(ii) Foreigncurrencyrisk
Riskmanagementpolicy Foreign currency risk is the risk that the fair value or future cash flows of a financial instrument will
fluctuate arising from changes in the exchange rate between the foreign currencies and the Singapore dollar.
The foreign currency risk of the Group and the Authority predominantly arise from its investments in equity and debt securities which are denominated in currencies other than Singapore dollar. As a result, these investments expose the Group and the Authority to foreign currency fluctuations.
Notes to the financial statements

62 Infocomm Development Authority of Singapore
Notes to the financial statements
Exposuretoforeigncurrencyrisk As at 31 March 2014, the major foreign currencies to which the Group and the Authority are exposed to
are the united States dollar (“uSD”), Euro (“EuR”) and Japanese yen (“Jpy”). The quantitative exposure to these foreign currency risks of the Group and the Authority are presented below:
2013/2014 2012/2013usd$’000
euR$’000
jpy$’000
usd$’000
euR$’000
jpy$’000
GROupAvailable-for-sale financial assets 14,983 – – 10,948 – –Investments at fair value through profit
or loss 113,984 3,863 1,154 69,552 469 395Trade and other receivables 1,314 – – 1,574 – –Cash and bank balances 305 – – 887 – –Other payables (52) – – (121) – –
130,534 3,863 1,154 82,840 469 395
AuthORItyInvestments at fair value through profit
or loss 108,599 3,863 1,154 67,441 469 395Cash and bank balances 282 – – 64 – –
108,881 3,863 1,154 67,505 469 395
The Group and the Authority do not hedge its foreign currency exposure using derivative financial instruments. They manage these foreign exchange risks by close monitoring of the timing of inception and settlement of the transactions.
Sensitivityanalysis A 5% strengthening of the above foreign currencies against the Singapore dollar at 31 March would
have increased other comprehensive income and surplus for the year as shown below. Conversely, a 5% weakening of foreign currencies against the Singapore dollar as at 31 March would result in an equal but opposite effect on other comprehensive income and surplus for the year.
5% represents management’s assessment of the possible change in foreign currency exchange rates. The analysis assumes that all other variables remain constant. In reality, foreign currency exchange rates rarely change in isolation and are likely to be interdependent.
Group Authoritysurplus for the
yearOther
comprehensive income
surplus for the year
Other comprehensive
income
2013/2014uSD 5,778 749 5,444 –EuR 193 – 193 –Jpy 58 – 58 –
2012/2013uSD 3,595 547 3,375 –EuR 23 – 23 –Jpy 20 – 20 –
Notes to the financial statements
63Annual Report 2013/2014
Notes to the financial statements
(iii) Interestraterisk Interest rate risk is the risk that the fair value or future cash flows of a financial instrument will
fluctuate arising from changes in interest rates.
The Group and the Authority have exposure to interest rate risks arising from investments in debt securities as well as cash deposits, including the cash participation in AGD’s ClM. The Group deploys duration positioning, where appropriate, to mitigate interest rate risk on debt securities. In addition, management monitors the fair value of the investments daily. In accordance with its governance, risk and compliance framework, management will report significant fair value movements to the Investment Committee. Interest rate risks on cash deposits are managed through AGD’s cash scheme.
Sensitivityanalysis The sensitivity analysis has been determined based on the exposure to interest rates for debt securities
and cash and bank balances at the end of the reporting period. A 100 basis points for debt securities and 25 basis points increase or decrease for cash and bank balances represent management’s assessment of the possible change in interest rates.
Cash and bank balances If interest rates had been 25 basis points higher or lower and all other variables were held constant,
the Group’s surplus for the year ended 31 March 2014 would increase or decrease by $0.645 million (2012/2013: $0.618 million).
If interest rates had been 25 basis points higher or lower and all other variables were held constant, the Authority’s surplus for the year ended 31 March 2014 would increase or decrease by $0.499 million (2012/2013: $0.444 million).
Investment at fair value through profit or loss If interest rates had been 100 basis points higher and all other variables were held constant, the
Group’s fair value of the investments at fair value through profit or loss and surplus for the year ended 31 March 2014 would decrease by $21.380 million (2012/2013: $28.260 million). Conversely, a reduction in interest rates by 100 basis points would increase the Group’s fair value of the investments at fair value through profit or loss and surplus for the year by $23.250 million (2012/2013: $30.400 million).
If interest rates had been 100 basis points higher and all other variables were held constant, the Authority’s fair value of the investments at fair value through profit or loss and surplus for the year ended 31 March 2014 would decrease by $21.570 million (2012/2013: $27.630 million). Conversely, a reduction in interest rates by 100 basis points would increase the Authority’s fair value of the investments at fair value through profit or loss and surplus for the year by $23.420 million (2012/2013: $29.750 million).
(c) credit risk Credit risk is the risk of default of counterparties which will affect the fair value or future cash flows of a
financial instrument.
The Group and the Authority’s exposure to credit risk arise from its financial assets. The carrying amounts of financial assets in the statement of financial position represent the maximum exposure to credit risk, before taking into account any collateral held. As at the end of reporting period, the Group and the Authority do not hold any collateral in respect of its financial assets.
Cash and fixed deposits are placed with banks and financial institutions which are regulated.
The Group and the Authority mitigate credit risk exposure through regular monitoring of the recoverability of the financial assets. In respect of its investments in debt securities, it is the policy of the Group and the Authority to invest only in securities which meet the credit criteria approved by its Investment Committee. As at the end of the reporting period, the Group’s and the Authority’s investments in debt securities are not impaired.
Notes to the financial statements

64 Infocomm Development Authority of Singapore
Notes to the financial statements
(d) liquidity risk liquidity risk is the risk of not being able to meet financial obligations arising from fluctuations in cashflow
of financial assets.
The Group and the Authority are not subject to regulatory requirement to maintain minimum cash level. It is the policy of the Group and the Authority to maintain a level of cash deemed adequate by the management to finance its operations and mitigate the effects of fluctuations in cash flows.
The financial liabilities of the Group and the Authority are presented in the statement of financial position. The current liabilities are non-interest bearing and repayable within one year from the end of the reporting period. The financial assets of the Group and the Authority are able to meet these financial obligations.
The undiscounted cash flow of the Group’s and Authority’s financial liabilities (including trade payables, other payables and contribution payable to consolidated fund) at the reporting date approximate their carrying amounts and are expected to be settled within the next 12 months and are classified as other financial liabilities.
The following is the contractual maturities of the Authority’s non-trade amount due to subsidiaries, including estimated interest payments and excluding the impact of netting agreements:
carrying amount$’000
contractual cash flows
$’000
within 1 year
$’000
within 2 to 5 years$’000
AuthORIty2013/2014Due to subsidiaries (non-trade) 190,000 200,630 3,700 196,930
2012/2013Due to subsidiaries (non-trade) 190,000 196,974 3,600 193,374
The maturity analyses show the contractual undiscounted cash flows of the Authority’s financial liabilities on the basis of their earliest possible contractual maturity.
(e) capital management The Group and the Authority manage its capital to ensure that the Group and the Authority will continue as
going concern.
The capital structure of the Group and the Authority comprise only equity as reflected in the statement of changes in equity. The Group and the Authority are not subject to regulatory capital requirement.
The Group and the Authority review its capital structure periodically. As part of this review, the cost of capital and associated risks are considered. There have been no changes to the Group’s overall capital policy as compared to 2012/2013. The Authority is not subject to any regulatory capital requirements.
Notes to the financial statements
65Annual Report 2013/2014
Notes to the financial statements
(f) Accounting classifications and fair values Fairvaluesversuscarryingamounts The fair values of financial assets and liabilities, together with the carrying amounts shown in the statement
of financial position, are as follows:
Note
designated at fair value
$’000
loan and receivables
$’000
Available for sale$’000
Other financial liabilities
$’000
total carrying amount$’000
fair value$’000
GROup31 MARch 2014
fINANcIAl AssetsInvestments at fair value
through profit or loss, at fair value 9 712,266 – – – 712,266 712,266
Available-for-sale financial assets, at fair value 8 – – 15,669 – 15,669 15,669
Trade receivables 10 – 109,637 – – 109,637 109,637Other receivables 11 – 13,071 – – 13,071 13,071Grants receivables 12 – 83,526 – – 83,526 83,526Staff loans receivables 13 – 3 – – 3 3Cash and cash equivalents 15 – 258,394 – – 258,394 258,394
712,266 464,631 15,669 – 1,192,566 1,192,566
fINANcIAl lIABIlItIesTrade payables 18 – – – 26,105 26,105 26,105Other payables, advances and
deposits 19 – – – 135,687 135,687 135,687Contribution payable to
consolidated fund 21 – – – 1,462 1,462 1,462– – – 163,254 163,254 163,254
31 MARch 2013
fINANcIAl AssetsInvestments at fair value
through profit or loss, at fair value 9 852,179 – – – 852,179 852,179
Available-for-sale financial assets, at fair value 8 – – 11,732 – 11,732 11,732
Trade receivables 10 – 112,364 – – 112,364 112,364Other receivables 11 – 11,259 – – 11,259 11,259Staff loans receivables 13 – 3 – – 3 3Cash and cash equivalents 15 – 247,155 – – 247,155 247,155
852,179 370,781 11,732 – 1,234,692 1,234,692
Notes to the financial statements
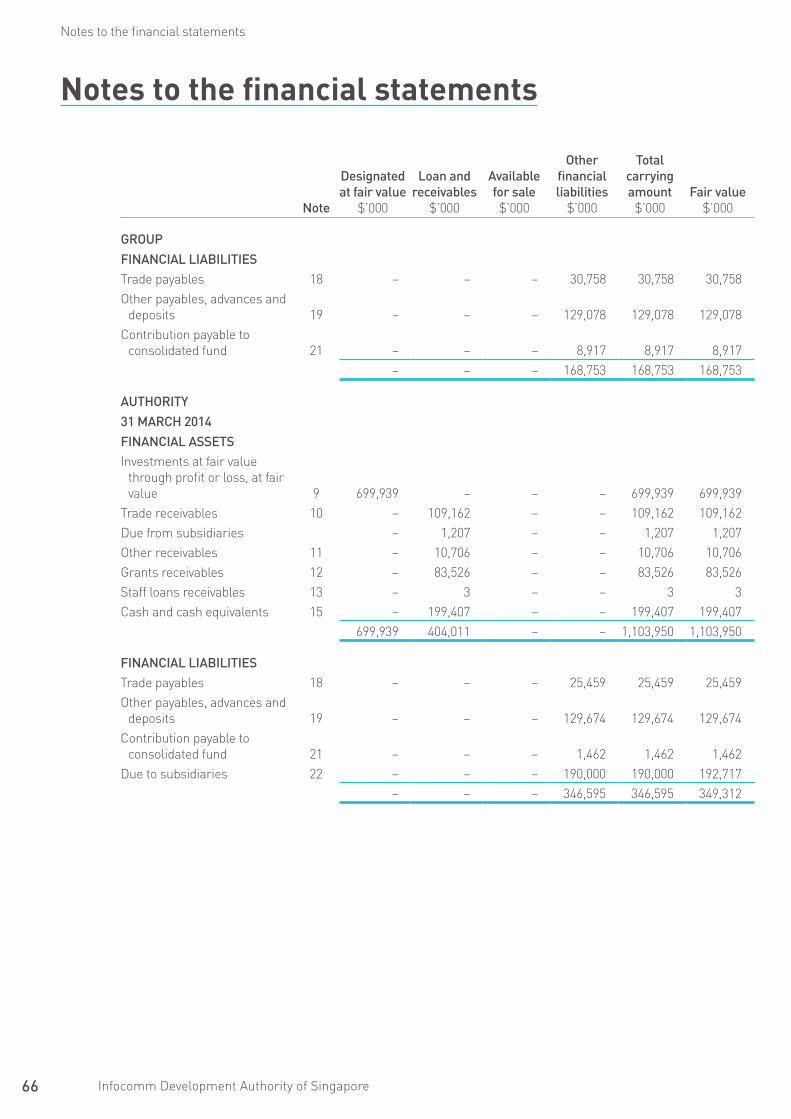
66 Infocomm Development Authority of Singapore
Notes to the financial statements
Notes to the financial statements
Note
designated at fair value
$’000
loan and receivables
$’000
Available for sale$’000
Other financial liabilities
$’000
total carrying amount$’000
fair value$’000
GROupfINANcIAl lIABIlItIesTrade payables 18 – – – 30,758 30,758 30,758Other payables, advances and
deposits 19 – – – 129,078 129,078 129,078Contribution payable to
consolidated fund 21 – – – 8,917 8,917 8,917– – – 168,753 168,753 168,753
AuthORIty31 MARch 2014fINANcIAl AssetsInvestments at fair value
through profit or loss, at fair value 9 699,939 – – – 699,939 699,939
Trade receivables 10 – 109,162 – – 109,162 109,162Due from subsidiaries – 1,207 – – 1,207 1,207Other receivables 11 – 10,706 – – 10,706 10,706Grants receivables 12 – 83,526 – – 83,526 83,526Staff loans receivables 13 – 3 – – 3 3Cash and cash equivalents 15 – 199,407 – – 199,407 199,407
699,939 404,011 – – 1,103,950 1,103,950
fINANcIAl lIABIlItIesTrade payables 18 – – – 25,459 25,459 25,459Other payables, advances and
deposits 19 – – – 129,674 129,674 129,674Contribution payable to
consolidated fund 21 – – – 1,462 1,462 1,462Due to subsidiaries 22 – – – 190,000 190,000 192,717
– – – 346,595 346,595 349,312
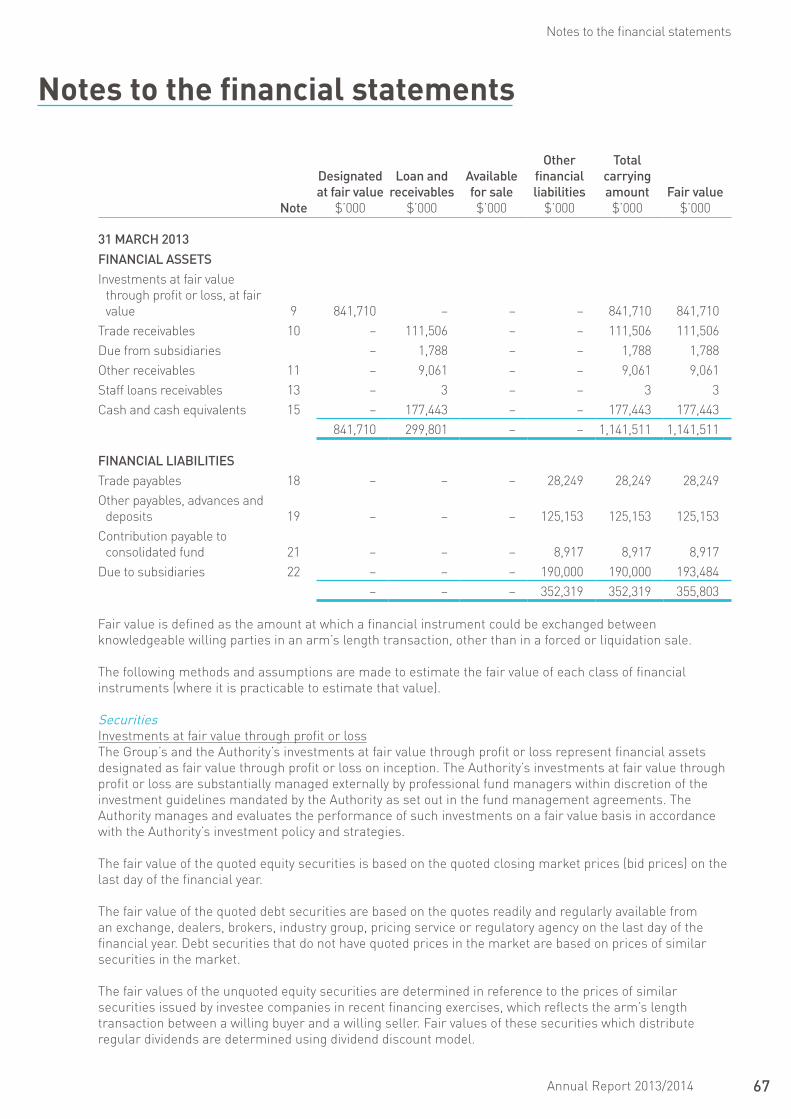
67Annual Report 2013/2014
Notes to the financial statements
Notes to the financial statements
Note
designated at fair value
$’000
loan and receivables
$’000
Available for sale$’000
Other financial liabilities
$’000
total carrying amount$’000
fair value$’000
31 MARch 2013fINANcIAl AssetsInvestments at fair value
through profit or loss, at fair value 9 841,710 – – – 841,710 841,710
Trade receivables 10 – 111,506 – – 111,506 111,506Due from subsidiaries – 1,788 – – 1,788 1,788Other receivables 11 – 9,061 – – 9,061 9,061Staff loans receivables 13 – 3 – – 3 3Cash and cash equivalents 15 – 177,443 – – 177,443 177,443
841,710 299,801 – – 1,141,511 1,141,511
fINANcIAl lIABIlItIesTrade payables 18 – – – 28,249 28,249 28,249Other payables, advances and
deposits 19 – – – 125,153 125,153 125,153Contribution payable to
consolidated fund 21 – – – 8,917 8,917 8,917Due to subsidiaries 22 – – – 190,000 190,000 193,484
– – – 352,319 352,319 355,803
Fair value is defined as the amount at which a financial instrument could be exchanged between knowledgeable willing parties in an arm’s length transaction, other than in a forced or liquidation sale.
The following methods and assumptions are made to estimate the fair value of each class of financial instruments (where it is practicable to estimate that value).
Securities Investments at fair value through profit or loss The Group’s and the Authority’s investments at fair value through profit or loss represent financial assets
designated as fair value through profit or loss on inception. The Authority’s investments at fair value through profit or loss are substantially managed externally by professional fund managers within discretion of the investment guidelines mandated by the Authority as set out in the fund management agreements. The Authority manages and evaluates the performance of such investments on a fair value basis in accordance with the Authority’s investment policy and strategies.
The fair value of the quoted equity securities is based on the quoted closing market prices (bid prices) on the last day of the financial year.
The fair value of the quoted debt securities are based on the quotes readily and regularly available from an exchange, dealers, brokers, industry group, pricing service or regulatory agency on the last day of the financial year. Debt securities that do not have quoted prices in the market are based on prices of similar securities in the market.
The fair values of the unquoted equity securities are determined in reference to the prices of similar securities issued by investee companies in recent financing exercises, which reflects the arm’s length transaction between a willing buyer and a willing seller. Fair values of these securities which distribute regular dividends are determined using dividend discount model.
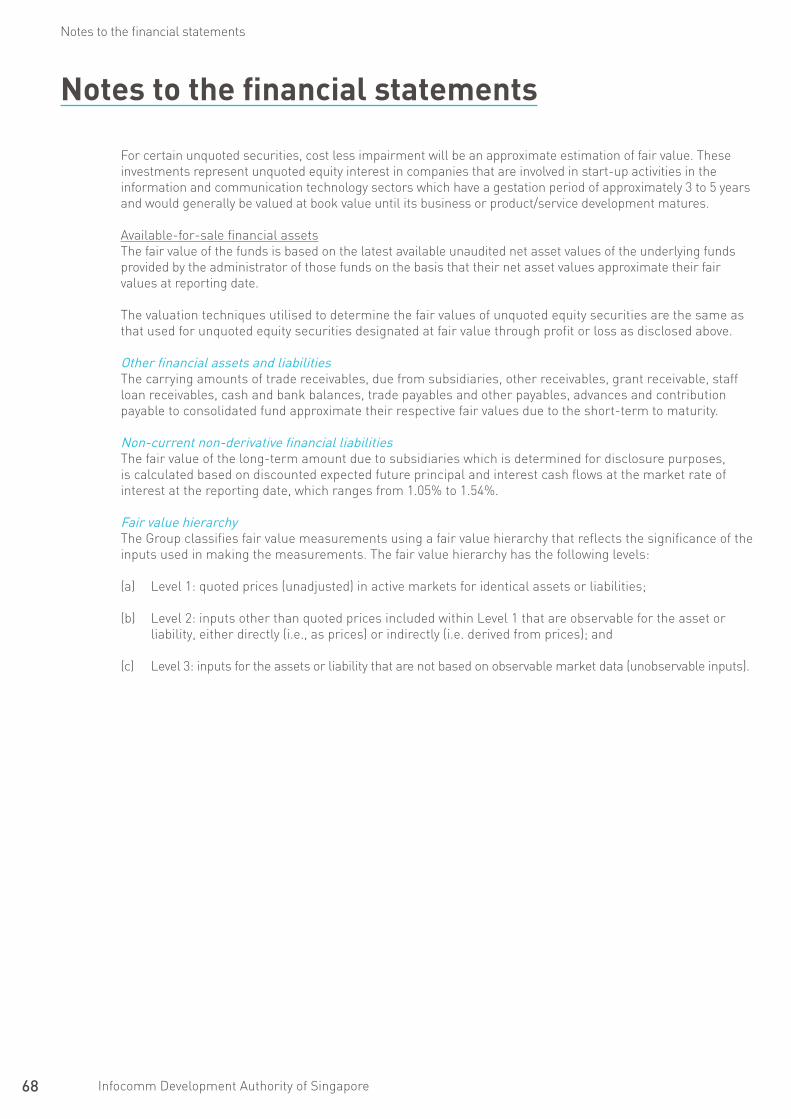
68 Infocomm Development Authority of Singapore
Notes to the financial statements
Notes to the financial statements
For certain unquoted securities, cost less impairment will be an approximate estimation of fair value. These investments represent unquoted equity interest in companies that are involved in start-up activities in the information and communication technology sectors which have a gestation period of approximately 3 to 5 years and would generally be valued at book value until its business or product/service development matures.
Available-for-sale financial assets The fair value of the funds is based on the latest available unaudited net asset values of the underlying funds
provided by the administrator of those funds on the basis that their net asset values approximate their fair values at reporting date.
The valuation techniques utilised to determine the fair values of unquoted equity securities are the same as that used for unquoted equity securities designated at fair value through profit or loss as disclosed above.
Otherfinancialassetsandliabilities The carrying amounts of trade receivables, due from subsidiaries, other receivables, grant receivable, staff
loan receivables, cash and bank balances, trade payables and other payables, advances and contribution payable to consolidated fund approximate their respective fair values due to the short-term to maturity.
Non-currentnon-derivativefinancialliabilities The fair value of the long-term amount due to subsidiaries which is determined for disclosure purposes,
is calculated based on discounted expected future principal and interest cash flows at the market rate of interest at the reporting date, which ranges from 1.05% to 1.54%.
Fairvaluehierarchy The Group classifies fair value measurements using a fair value hierarchy that reflects the significance of the
inputs used in making the measurements. The fair value hierarchy has the following levels:
(a) level 1: quoted prices (unadjusted) in active markets for identical assets or liabilities;
(b) level 2: inputs other than quoted prices included within level 1 that are observable for the asset or liability, either directly (i.e., as prices) or indirectly (i.e. derived from prices); and
(c) level 3: inputs for the assets or liability that are not based on observable market data (unobservable inputs).
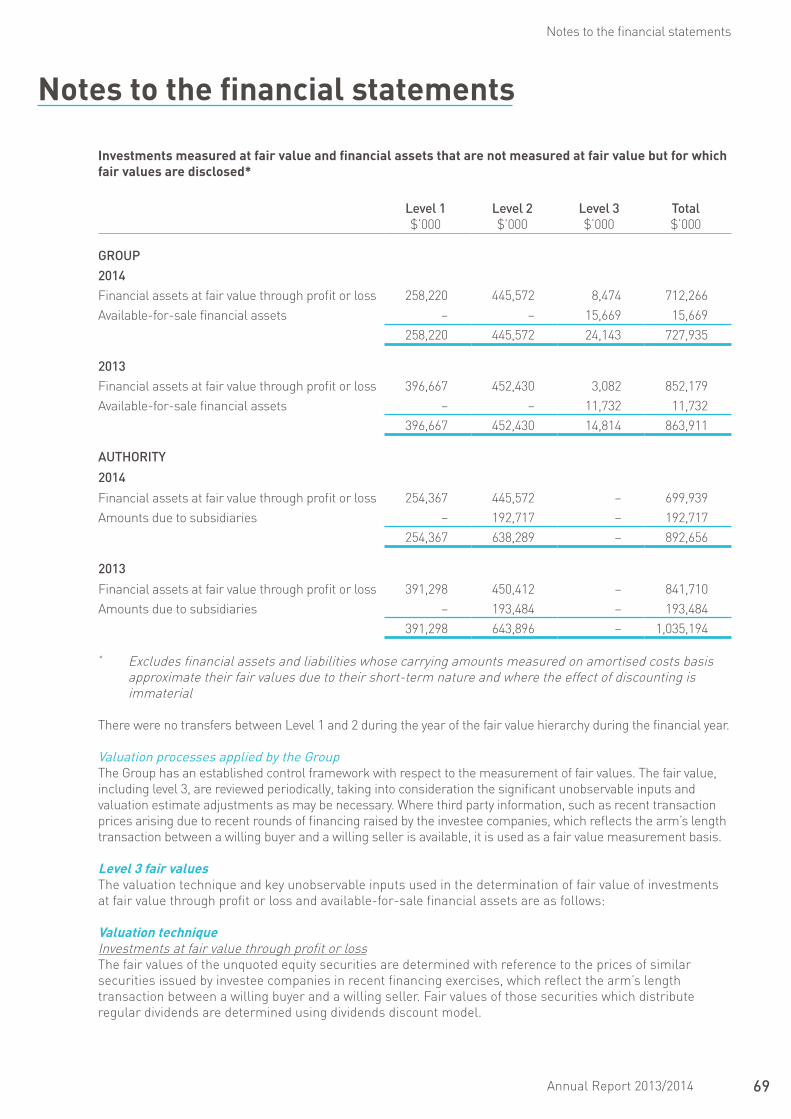
69Annual Report 2013/2014
Notes to the financial statements
Notes to the financial statements
Investments measured at fair value and financial assets that are not measured at fair value but for which fair values are disclosed*
level 1$’000
level 2$’000
level 3$’000
total$’000
GROup2014Financial assets at fair value through profit or loss 258,220 445,572 8,474 712,266Available-for-sale financial assets – – 15,669 15,669
258,220 445,572 24,143 727,935
2013Financial assets at fair value through profit or loss 396,667 452,430 3,082 852,179Available-for-sale financial assets – – 11,732 11,732
396,667 452,430 14,814 863,911
AuthORIty
2014
Financial assets at fair value through profit or loss 254,367 445,572 – 699,939Amounts due to subsidiaries – 192,717 – 192,717
254,367 638,289 – 892,656
2013
Financial assets at fair value through profit or loss 391,298 450,412 – 841,710Amounts due to subsidiaries – 193,484 – 193,484
391,298 643,896 – 1,035,194
* Excludes financial assets and liabilities whose carrying amounts measured on amortised costs basis approximate their fair values due to their short-term nature and where the effect of discounting is immaterial
There were no transfers between level 1 and 2 during the year of the fair value hierarchy during the financial year.
ValuationprocessesappliedbytheGroup The Group has an established control framework with respect to the measurement of fair values. The fair value,
including level 3, are reviewed periodically, taking into consideration the significant unobservable inputs and valuation estimate adjustments as may be necessary. Where third party information, such as recent transaction prices arising due to recent rounds of financing raised by the investee companies, which reflects the arm’s length transaction between a willing buyer and a willing seller is available, it is used as a fair value measurement basis.
Level 3 fair values The valuation technique and key unobservable inputs used in the determination of fair value of investments
at fair value through profit or loss and available-for-sale financial assets are as follows:
Valuation technique Investments at fair value through profit or loss The fair values of the unquoted equity securities are determined with reference to the prices of similar
securities issued by investee companies in recent financing exercises, which reflect the arm’s length transaction between a willing buyer and a willing seller. Fair values of those securities which distribute regular dividends are determined using dividends discount model.
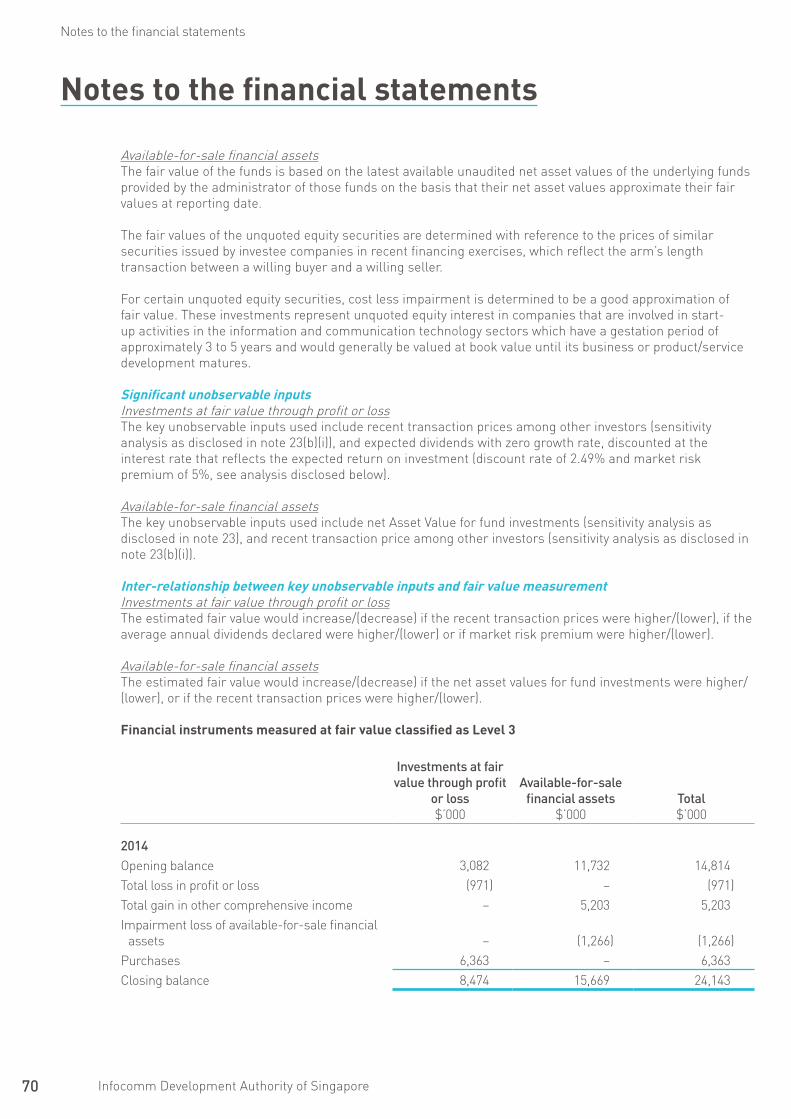
70 Infocomm Development Authority of Singapore
Notes to the financial statements
Notes to the financial statements
Available-for-sale financial assets The fair value of the funds is based on the latest available unaudited net asset values of the underlying funds
provided by the administrator of those funds on the basis that their net asset values approximate their fair values at reporting date.
The fair values of the unquoted equity securities are determined with reference to the prices of similar securities issued by investee companies in recent financing exercises, which reflect the arm’s length transaction between a willing buyer and a willing seller.
For certain unquoted equity securities, cost less impairment is determined to be a good approximation of fair value. These investments represent unquoted equity interest in companies that are involved in start-up activities in the information and communication technology sectors which have a gestation period of approximately 3 to 5 years and would generally be valued at book value until its business or product/service development matures.
Significant unobservable inputs Investments at fair value through profit or loss The key unobservable inputs used include recent transaction prices among other investors (sensitivity
analysis as disclosed in note 23(b)(i)), and expected dividends with zero growth rate, discounted at the interest rate that reflects the expected return on investment (discount rate of 2.49% and market risk premium of 5%, see analysis disclosed below).
Available-for-sale financial assets The key unobservable inputs used include net Asset value for fund investments (sensitivity analysis as
disclosed in note 23), and recent transaction price among other investors (sensitivity analysis as disclosed in note 23(b)(i)).
Inter-relationship between key unobservable inputs and fair value measurement Investments at fair value through profit or loss The estimated fair value would increase/(decrease) if the recent transaction prices were higher/(lower), if the
average annual dividends declared were higher/(lower) or if market risk premium were higher/(lower).
Available-for-sale financial assets The estimated fair value would increase/(decrease) if the net asset values for fund investments were higher/
(lower), or if the recent transaction prices were higher/(lower).
Financial instruments measured at fair value classified as Level 3
Investments at fair value through profit
or loss$’000
Available-for-sale financial assets
$’000total $’000
2014Opening balance 3,082 11,732 14,814Total loss in profit or loss (971) – (971)Total gain in other comprehensive income – 5,203 5,203Impairment loss of available-for-sale financial
assets – (1,266) (1,266)purchases 6,363 – 6,363Closing balance 8,474 15,669 24,143

71Annual Report 2013/2014
Notes to the financial statements
Notes to the financial statements
Investments at fair value through profit
or loss$’000
Available-for-sale financial assets
$’000total $’000
2013Opening balance 2,367 8,789 11,156Total (loss) / gain in profit or loss (283) 2,183 1,900Total loss in other comprehensive income – (168) (168)Disposals during the year – (3,162) (3,162)purchases 998 4,090 5,088Closing balance 3,082 11,732 14,814
Although the Group believes that its estimates of fair value are appropriate, the use of different methodologies or assumptions could lead to different measurements of fair value.
For fair value measurements of an investment in level 3, measured using the dividend discount model, changing the market risk premium by ±0.5% would have the following effect:
Income and expenditure Other comprehensive incomefavourable
$’000(unfavourable)
$’000favourable
$’000(unfavourable)
$’000
2013/2014unquoted equity securities 64 (66) – –
2012/2013unquoted equity securities 92 (79) – –
The favourable and unfavourable effects of using reasonably possible alternative assumptions have been calculated by recalibrating the model values using alternative estimates of risk adjusted discount rates that might reasonably have been considered by a market participant for the purpose of pricing the instruments at the reporting date.
24 Net assets of trust and agency funds
Details of the trust and agency funds are set out below and have been prepared from the records of these funds and reflect only transactions handled by the Group and the Authority:
Group and Authority2013/2014
$’0002012/2013
$’000
Receipts 180,585 187,319Interest income 109 92Expenditures (181,855) (184,405)net (deficit)/surplus for the year (1,161) 3,006Accumulated surplus at 1 April 6,519 3,513Accumulated surplus at 31 March 5,358 6,519
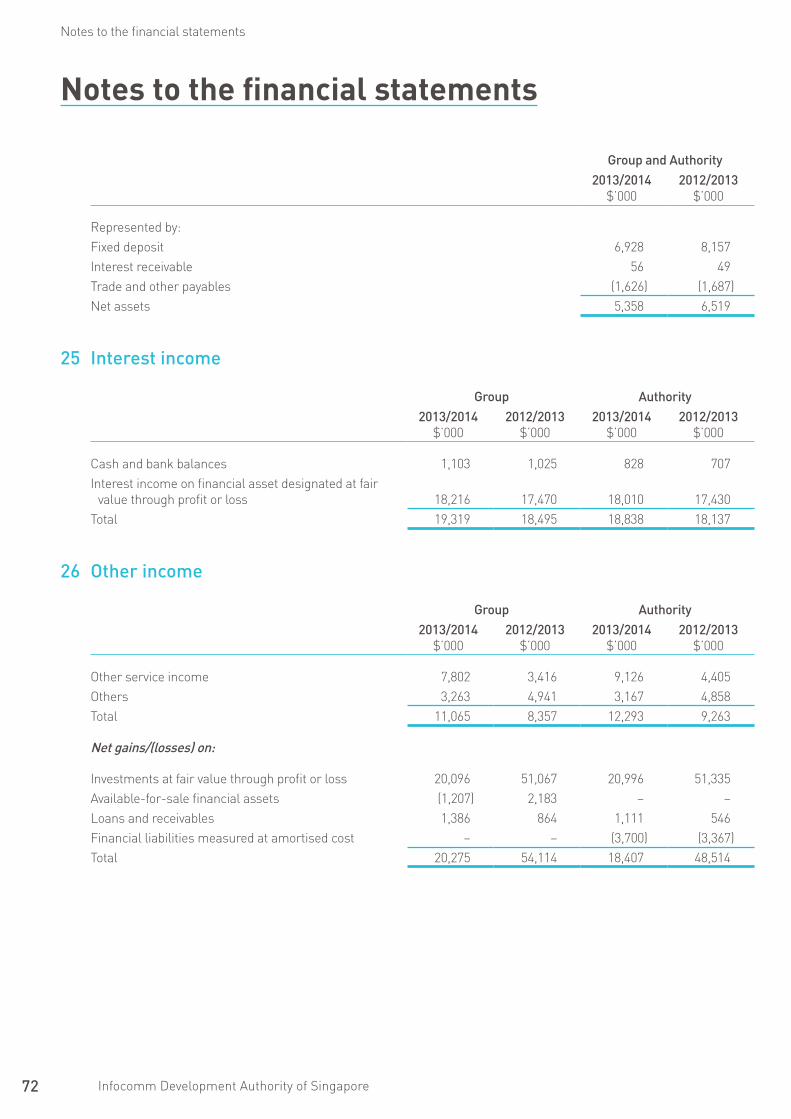
72 Infocomm Development Authority of Singapore
Notes to the financial statements
Group and Authority2013/2014
$’0002012/2013
$’000
Represented by:Fixed deposit 6,928 8,157Interest receivable 56 49Trade and other payables (1,626) (1,687)net assets 5,358 6,519
25 Interest income
Group Authority2013/2014
$’0002012/2013
$’0002013/2014
$’0002012/2013
$’000
Cash and bank balances 1,103 1,025 828 707Interest income on financial asset designated at fair
value through profit or loss 18,216 17,470 18,010 17,430Total 19,319 18,495 18,838 18,137
26 Other income
Group Authority2013/2014
$’0002012/2013
$’0002013/2014
$’0002012/2013
$’000
Other service income 7,802 3,416 9,126 4,405Others 3,263 4,941 3,167 4,858Total 11,065 8,357 12,293 9,263
Net gains/(losses) on:
Investments at fair value through profit or loss 20,096 51,067 20,996 51,335Available-for-sale financial assets (1,207) 2,183 – –loans and receivables 1,386 864 1,111 546Financial liabilities measured at amortised cost – – (3,700) (3,367)Total 20,275 54,114 18,407 48,514
Notes to the financial statements
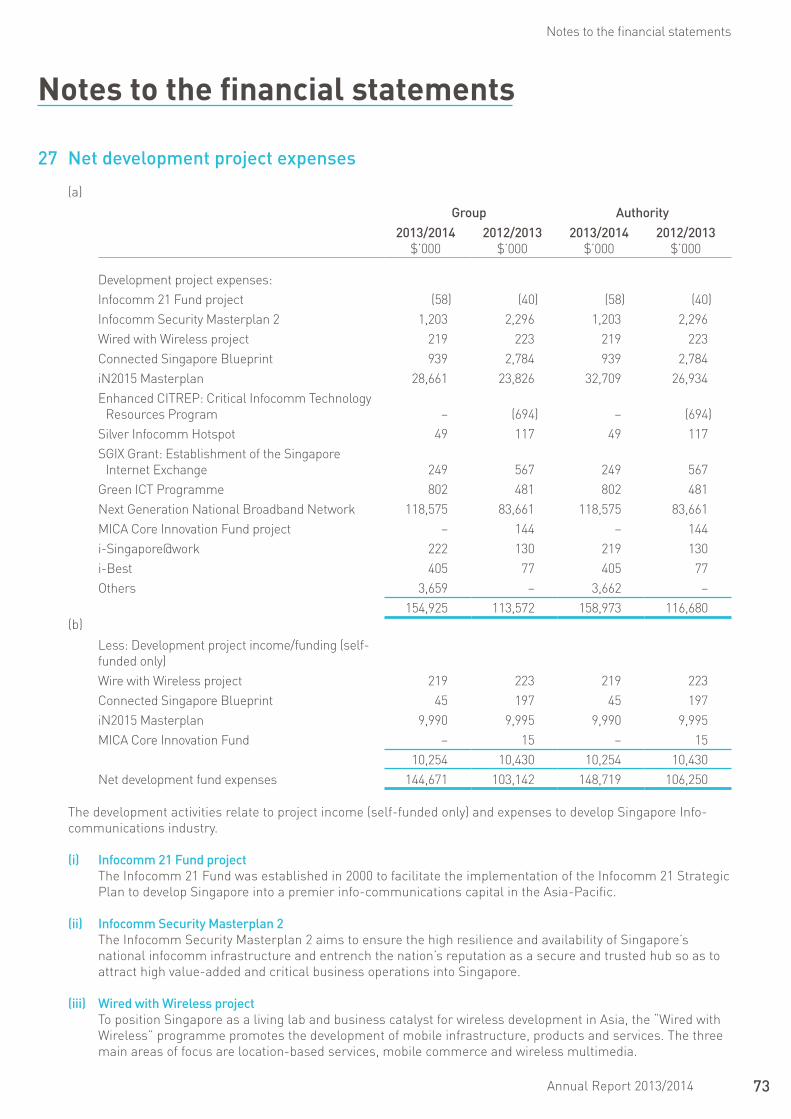
73Annual Report 2013/2014
Notes to the financial statements
27 Net development project expenses
(a)
Group Authority2013/2014
$’0002012/2013
$’0002013/2014
$’0002012/2013
$’000
Development project expenses:Infocomm 21 Fund project (58) (40) (58) (40)Infocomm Security Masterplan 2 1,203 2,296 1,203 2,296Wired with Wireless project 219 223 219 223Connected Singapore Blueprint 939 2,784 939 2,784in2015 Masterplan 28,661 23,826 32,709 26,934Enhanced CITREp: Critical Infocomm Technology
Resources program – (694) – (694)Silver Infocomm hotspot 49 117 49 117SGIX Grant: Establishment of the Singapore
Internet Exchange 249 567 249 567Green ICT programme 802 481 802 481next Generation national Broadband network 118,575 83,661 118,575 83,661MICA Core Innovation Fund project – 144 – 144i-Singapore@work 222 130 219 130i-Best 405 77 405 77Others 3,659 – 3,662 –
154,925 113,572 158,973 116,680 (b)
less: Development project income/funding (self-funded only)Wire with Wireless project 219 223 219 223Connected Singapore Blueprint 45 197 45 197in2015 Masterplan 9,990 9,995 9,990 9,995MICA Core Innovation Fund – 15 – 15
10,254 10,430 10,254 10,430net development fund expenses 144,671 103,142 148,719 106,250
The development activities relate to project income (self-funded only) and expenses to develop Singapore Info-communications industry.
(i) Infocomm 21 fund project The Infocomm 21 Fund was established in 2000 to facilitate the implementation of the Infocomm 21 Strategic
plan to develop Singapore into a premier info-communications capital in the Asia-pacific.
(ii) Infocomm security Masterplan 2 The Infocomm Security Masterplan 2 aims to ensure the high resilience and availability of Singapore’s
national infocomm infrastructure and entrench the nation’s reputation as a secure and trusted hub so as to attract high value-added and critical business operations into Singapore.
(iii) wired with wireless project To position Singapore as a living lab and business catalyst for wireless development in Asia, the “Wired with
Wireless” programme promotes the development of mobile infrastructure, products and services. The three main areas of focus are location-based services, mobile commerce and wireless multimedia.
Notes to the financial statements
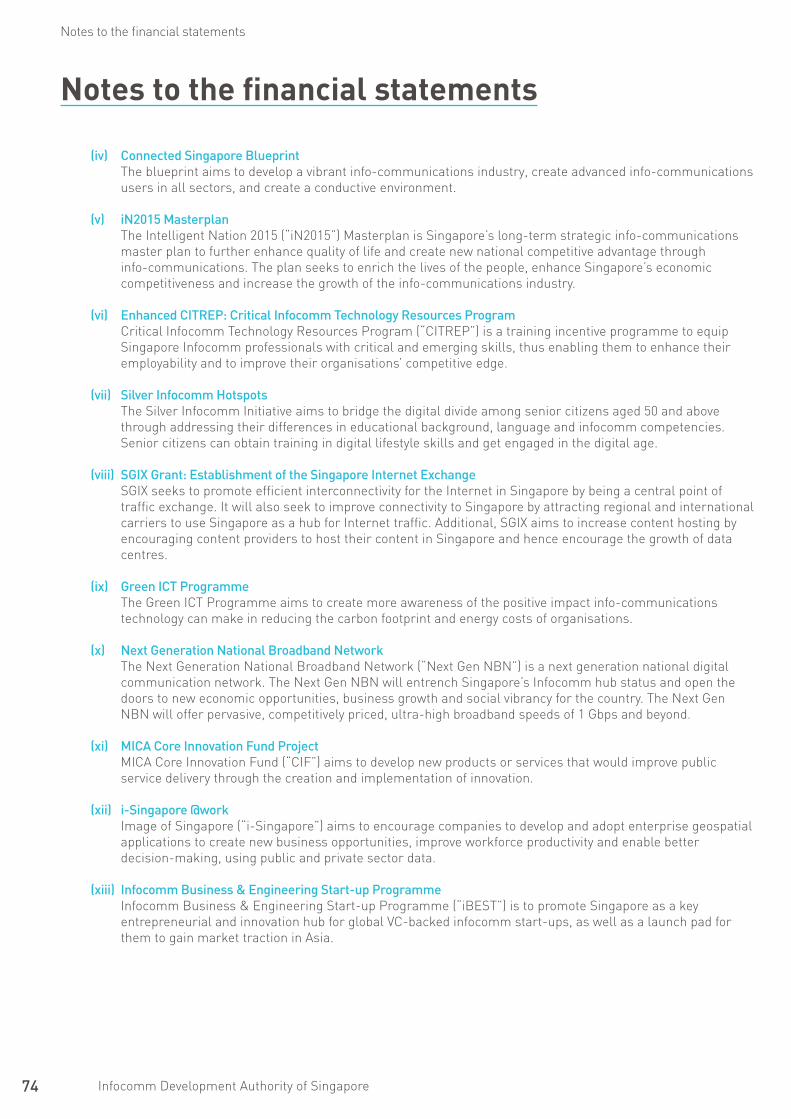
74 Infocomm Development Authority of Singapore
Notes to the financial statements
(iv) connected singapore Blueprint The blueprint aims to develop a vibrant info-communications industry, create advanced info-communications
users in all sectors, and create a conductive environment.
(v) iN2015 Masterplan The Intelligent nation 2015 (“in2015”) Masterplan is Singapore’s long-term strategic info-communications
master plan to further enhance quality of life and create new national competitive advantage through info-communications. The plan seeks to enrich the lives of the people, enhance Singapore’s economic competitiveness and increase the growth of the info-communications industry.
(vi) enhanced cItRep: critical Infocomm technology Resources program Critical Infocomm Technology Resources program (“CITREp”) is a training incentive programme to equip
Singapore Infocomm professionals with critical and emerging skills, thus enabling them to enhance their employability and to improve their organisations’ competitive edge.
(vii) silver Infocomm hotspots The Silver Infocomm Initiative aims to bridge the digital divide among senior citizens aged 50 and above
through addressing their differences in educational background, language and infocomm competencies. Senior citizens can obtain training in digital lifestyle skills and get engaged in the digital age.
(viii) sGIx Grant: establishment of the singapore Internet exchange SGIX seeks to promote efficient interconnectivity for the Internet in Singapore by being a central point of
traffic exchange. It will also seek to improve connectivity to Singapore by attracting regional and international carriers to use Singapore as a hub for Internet traffic. Additional, SGIX aims to increase content hosting by encouraging content providers to host their content in Singapore and hence encourage the growth of data centres.
(ix) Green Ict programme The Green ICT programme aims to create more awareness of the positive impact info-communications
technology can make in reducing the carbon footprint and energy costs of organisations.
(x) Next Generation National Broadband Network The next Generation national Broadband network (“next Gen nBn”) is a next generation national digital
communication network. The next Gen nBn will entrench Singapore’s Infocomm hub status and open the doors to new economic opportunities, business growth and social vibrancy for the country. The next Gen nBn will offer pervasive, competitively priced, ultra-high broadband speeds of 1 Gbps and beyond.
(xi) MIcA core Innovation fund project MICA Core Innovation Fund (“CIF”) aims to develop new products or services that would improve public
service delivery through the creation and implementation of innovation.
(xii) i-singapore @work Image of Singapore (“i-Singapore”) aims to encourage companies to develop and adopt enterprise geospatial
applications to create new business opportunities, improve workforce productivity and enable better decision-making, using public and private sector data.
(xiii) Infocomm Business & engineering start-up programme Infocomm Business & Engineering Start-up programme (“iBEST”) is to promote Singapore as a key
entrepreneurial and innovation hub for global vC-backed infocomm start-ups, as well as a launch pad for them to gain market traction in Asia.
Notes to the financial statements

75Annual Report 2013/2014
Notes to the financial statements
28 salaries, cpf and other contributions
Group Authority2013/2014
$’0002012/2013
$’0002013/2014
$’0002012/2013
$’000
Wages and salaries 215,676 198,509 207,333 189,429Employer’s contribution to Central provident Fund 23,325 19,273 22,684 18,534Other related staff costs 8,999 12,961 8,829 12,542
248,000 230,743 238,846 220,505
29 Other expenses
Group Authority2013/2014
$’0002012/2013
$’0002013/2014
$’0002012/2013
$’000
IT promotion and sponsorship 249 224 249 224utilities 4,010 4,915 4,002 4,901publicity expense 1,050 607 1,050 607Telecommunications and internet services 5,518 715 5,265 469Irrecoverable GST 1,839 2,170 1,839 2,170General and administrative expense 5,127 9,649 4,266 8,025local travelling 817 754 753 703Amortisation of deferred expenditure 496 716 496 716
19,106 19,750 17,920 17,815
30 commitments
Capitalandinvestmentcommitments At the end of the reporting period, capital commitments not provided for in the financial statements are as follows:
Group Authority2013/2014
$’0002012/2013
$’0002013/2014
$’0002012/2013
$’000
Capital expenditure 93,596 37,180 79,144 6,137
Notes to the financial statements
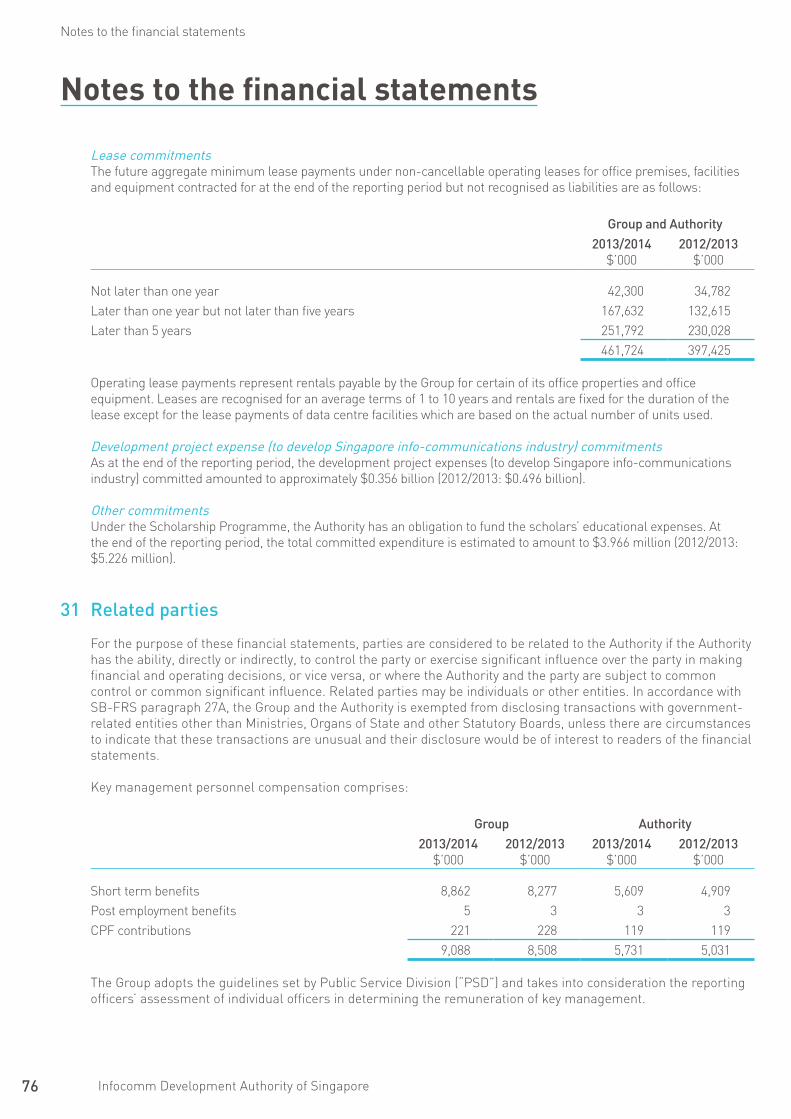
76 Infocomm Development Authority of Singapore
Notes to the financial statements
Leasecommitments The future aggregate minimum lease payments under non-cancellable operating leases for office premises, facilities
and equipment contracted for at the end of the reporting period but not recognised as liabilities are as follows:
Group and Authority2013/2014
$’0002012/2013
$’000
not later than one year 42,300 34,782later than one year but not later than five years 167,632 132,615later than 5 years 251,792 230,028
461,724 397,425
Operating lease payments represent rentals payable by the Group for certain of its office properties and office equipment. leases are recognised for an average terms of 1 to 10 years and rentals are fixed for the duration of the lease except for the lease payments of data centre facilities which are based on the actual number of units used.
Developmentprojectexpense(todevelopSingaporeinfo-communicationsindustry)commitments As at the end of the reporting period, the development project expenses (to develop Singapore info-communications
industry) committed amounted to approximately $0.356 billion (2012/2013: $0.496 billion).
Othercommitments under the Scholarship programme, the Authority has an obligation to fund the scholars’ educational expenses. At
the end of the reporting period, the total committed expenditure is estimated to amount to $3.966 million (2012/2013: $5.226 million).
31 Related parties
For the purpose of these financial statements, parties are considered to be related to the Authority if the Authority has the ability, directly or indirectly, to control the party or exercise significant influence over the party in making financial and operating decisions, or vice versa, or where the Authority and the party are subject to common control or common significant influence. Related parties may be individuals or other entities. In accordance with SB-FRS paragraph 27A, the Group and the Authority is exempted from disclosing transactions with government-related entities other than Ministries, Organs of State and other Statutory Boards, unless there are circumstances to indicate that these transactions are unusual and their disclosure would be of interest to readers of the financial statements.
Key management personnel compensation comprises:
Group Authority2013/2014
$’0002012/2013
$’0002013/2014
$’0002012/2013
$’000
Short term benefits 8,862 8,277 5,609 4,909post employment benefits 5 3 3 3CpF contributions 221 228 119 119
9,088 8,508 5,731 5,031
The Group adopts the guidelines set by public Service Division (“pSD”) and takes into consideration the reporting officers’ assessment of individual officers in determining the remuneration of key management.
Notes to the financial statements

77Annual Report 2013/2014
Notes to the financial statements
During the financial year, other than as disclosed elsewhere in the financial statements, the significant transactions with related parties which were carried out in the normal course of business are as follows:
(a) transactions with subsidiaries
Authority2013/2014
$’0002012/2013
$’000
Dividend income 1,963 2,777professional service fees 169 244Rental income 812 816Other income 632 629Recovery of manpower charges 114 210
3,690 4,676
Interest expenses (3,700) (3,367)Grant expenses (4,049) (3,108)
(7,749) (6,475)
(b) transactions with Ministries and statutory Board
Authority2013/2014
$’0002012/2013
$’000
professional service fees 193,332 181,775Standard ICT service fees 233,260 226,941Grant received 117,348 238,317
543,940 647,033
Contribution to consolidated fund (1,462) (9,567)
32 dividends
During the financial year ended 31 March 2014, the Authority declared and paid a dividend of $1.1544 per share (total dividend: $20.780 million) on the ordinary shares issued to the Minister for Finance in respect of the financial year ended 31 March 2014. In 2012/2013, the dividend paid was $0.4185 per share (total dividend: $7.533 million).
Notes to the financial statements

This page is intentionally left blank