Embed Size (px)
Citation preview
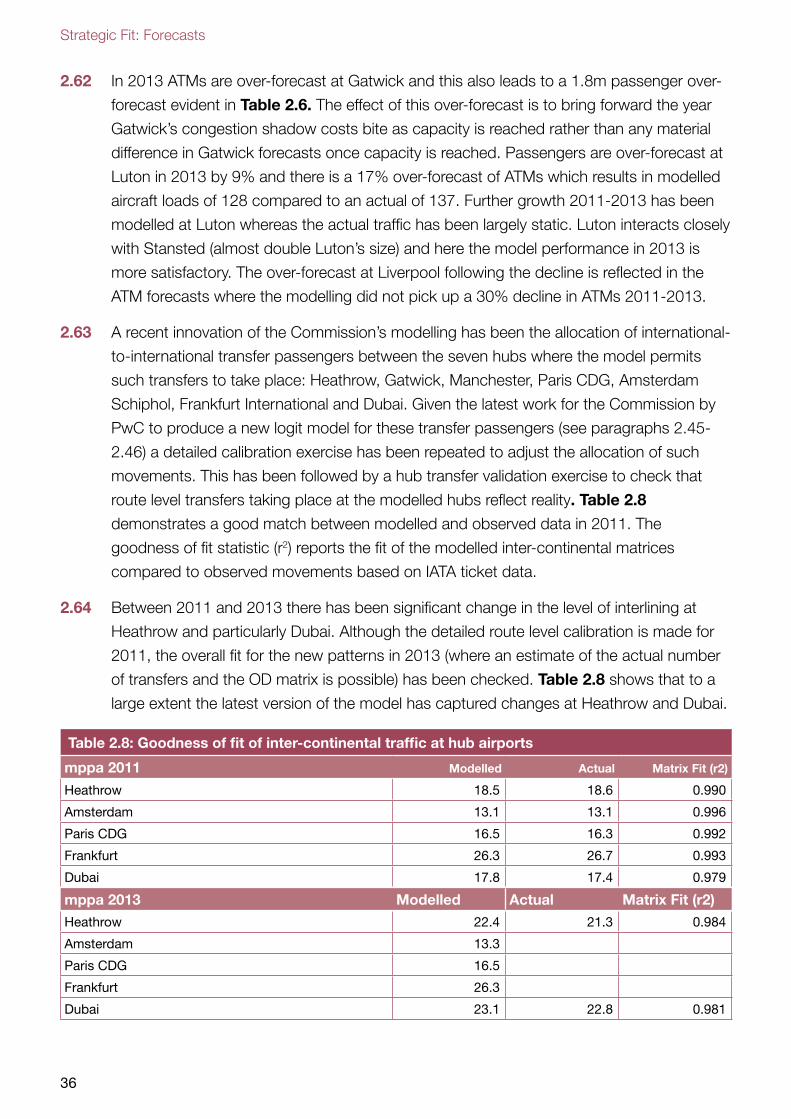
Strategic Fit: Forecasts
November 2014
An independent commission appointed by Government

The Aiports Commission has actively considered the needs of blind and partially sighted people in accessing this document. The text will be made available in full on the Commission’s website. The text may be freely downloaded and translated by individuals or organisations for conversation into other accessible formats. If you have other needs in this regard please contact:
Airports Commission Consultation Freepost RTKX-USUC-CXA PO BOX 1492 Working GU22 2QR
Email: [email protected]
© Crown copyright 2014
Copyright in the typographical arrangement rests with the Crown.
You may re-use this information (not including logos or third-party material) free of charge in any format or medium, under the terms of the Open Government Licence. To view this licence, visit www.nationalarchives.gov.uk/doc/open-government-licence/ or write to the Information Policy Team, The National Archives, Kew, London TW9 4DU, or e-mail: [email protected].
Where we have identified any third-party copyright information you will need to obtain permission from the copyright holders concerned.
1
Contents
Glossary 3
1 Introduction 6Report overview 6
Capacity development options 7
Future demand scenarios 7
Terminology 9
2 Model updates 10Introduction 10
National Air Passenger Demand Model 11
National Air Passenger Allocation Model 13
Commission changes to the DfT model for the Interim Report 21
Scheme promoter forecasts 22
Recent changes to the National Air Passenger Demand Model (NAPDM) 23
Recent updates to the DfT Passenger Allocation Model (NAPAM) 26
Aircraft size and passenger loads 27
Model validation 30
Impact of including HS2 in the demand model 37
3 Input assumptions 38Assessment of need 39
Summary of updated economic input assumptions 39
Global growth 42
Relative decline of Europe 43
Low-cost is king 44
Global fragmentation 45
Baseline airport capacities 45
Baseline surface access 47
Airport development options 48
4 CO2 Modelling 49CO2 emission targets 49
Carbon-traded and carbon capped 51
CO2 emission forecasts 52
2
5 The national baseline 55National demand 55
Base constrained national demand 57
Baseline airport passenger demand forecasts with capacity timelines 58
Long-haul share 64
Journey purpose 66
Baseline transfers 71
Baseline destinations served 75
Baseline catchment areas 79
Baseline air transport movements (ATMs) and CO2 emissions by option 82
6 Option passenger forecasts 89Capacity options 89
Demand scenarios 90
Option passenger demand forecasts with capacity timelines 91
Long-haul share 111
Journey purpose 119
Transfers 133
Destinations served: daily scheduled services 141
Destinations served: all services 147
Air transport movements (ATMs) and CO2 emissions by option 153
Passengers per ATM 172
CO2 emissions by option 176
Catchment areas 180
7 Sensitivity Tests 181No international-to-international transfer passengers 181
No carbon price in fares 191
Phased in capacity at Heathrow Airport Northwest Runway 195
Surface access at Heathrow Hub 197
Lower capacity at Heathrow Airport Extended Northern Runway 198
High DECC carbon prices 199
Appendix 1: Additional model validation detail 204
Appendix 2: Baseline and option road and rail schemes 206
Appendix 3: Assessment of need range forecasts 209
Appendix 4: Option catchment area maps 213
Appendix 5: Carbon capping prices 216
Glossary
3
Glossary
Aircraft-kilometres,
Aircraft-km
The number of kilometres travelled by an aircraft
AMS Amsterdam Schiphol Airport (IATA code)
AoN Demand Scenario assessment of need
APD Air Passenger Duty
ATM Air Transport Movement
ATM Demand Model Part of NAPAM which calculates the number and size (seats) of
ATMs needed to serve the demand allocated to the route
Base/‘Do Minimum’ Specifically the option of adding no new runway capacity as
assessed in the Interim Report
CAA Civil Aviation Authority
Capacity constrained Modelling case where passenger and ATM demand must fit available
future capacity where no significant additional runway or terminal
capacity is added
Capacity unconstrained Modelling case where passenger and ATM demand is not limited by
runway or terminal capacity
Carbon capped Modelling scenario where CO2 emissions are limited to 2005 levels
through both an ETS and higher carbon prices
Carbon-traded Modelling scenario where CO2 emissions are part of an Emissions
Trading Scheme
CCC UK Committee on Climate Change
CDG Paris Charles De Gaulle Airport (IATA code)
CO2 Carbon dioxide
DECC Department for Energy and Climate Change
Demand Allocation Routine Part of NAPAM which models the impact of future UK airport
capacity constraints on air transport movements and passengers at
the UK and four foreign hub airports
DfT Department for Transport
DXB Dubai Airport (IATA code)
EC European Commission
EEA European Economic Area
EU ETS European Union Emissions Trading System
FRA Frankfurt International Airport (IATA code)
GAL Gatwick Airport Limited, promoter of Gatwick Airport Second
Runway option
GDP Gross Domestic Product (National Income)
Strategic Fit: Forecasts
4
GF Demand Scenario global fragmentation
GG Demand Scenario global growth
GVA Gross Value Added
HAL Heathrow Airport Limited, the promoter of the Heathrow Airport
North West Runway option
HH Heathrow Hub Limited, the promoter of the Heathrow Airport
Extended Northern Runway option
HMRC Her Majesty’s Revenue and Customs
HS2 High Speed Two
IATA International Air Transport Association (airline trade body)
IEA International Energy Agency
I-I International-to-International interliners i.e. passengers who are
transferring via a UK airport with their origin and destination outside
the UK
IMF International Monetary Fund
International-interliners Passengers starting or finishing their journey in the UK but using a
foreign hub
Larame A term in the DfT model referring to the relationships between
passenger demand, aircraft size and load factors, and flight
frequency that have been derived statistically from historical data
LCC Low-cost carrier
LCK Demand Scenario low-cost is king
LDC Less Developed Country
LGW 2R Gatwick Airport Second Runway, the option promoted by Gatwick
Airport Limited
LHR NWR Heathrow Airport North West Runway, the option promoted by
Heathrow Airport Limited
LHR ENR Heathrow Airport Extended Northern Runway, the option promoted
by Heathrow Hub Limited
London airport system For the purposes of this report, the London airport system refers to
the following airports: Heathrow, Gatwick, Stansted, Luton and
London City.
Monte Carlo analysis A method of forecasting where inputs are randomly varied within a
distribution to calculate the probability of a particular outcome
mppa Million passengers per annum
Mt Million tonnes
MtCO2e Million tonnes of carbon dioxide equivalent
NAPAM The DfT’s National Air Passenger Allocation Model
NAPDM The DfT’s National Air Passenger Demand Model
NIC Newly Industrialised Country
Glossary
5
OBR Office for Budget Responsibility
O-D Origin and Destination
OECD Organisation for Economic Co-operation and Development (used in
this report to refer to members outside the European Union)
Passenger Airport Choice
Model
Part of NAPAM that models how national passenger demand splits
between the UK airports
Passenger-kilometres,
passenger-km
The number of kilometres travelled by an aircraft multiplied by the
number of passengers on board, sometimes referred to as RPK.
PaxIS Passenger Intelligence Services, which in this context comes from
ticket data obtained from the IATA
PLANET Rail model used by HS2 Ltd to forecast passenger flows
Point to Point Direct connection between two destinations
PwC PricewaterhouseCoopers
RDE Demand Scenario relative decline of Europe
SE South East
Seat-kilometres, seat-km The number of kilometres travelled by an aircraft multiplied by the
number of seats
Shadow cost The extra cost of flying required to reduce passenger demand from
above an airport’s runway or terminal capacity, to a level that is back
within capacity
Seeding Seeding is the process whereby for specified years ATMs user input
frequencies are used rather than being calculated within the model in
response to demand and then being tested for viability.
Suppression The process whereby passengers respond to a shadow cost by
deciding not to fly rather than using a ‘less preferred’ airport
Terminal passenger A person joining or leaving an aircraft at a reporting airport, as part of
an ATM. More detail is included in DfT’s January 2013 publication1
tph Trains per hour
WE Western Europe
WebTAG Department for Transport Appraisal Guidance
1 DfT UK Aviation forecasts, January 2013, particularly paragraphs 2.6 to 2.8, https://www.gov.uk/government/publications/uk-aviation-forecasts-2013
Strategic Fit: Forecasts
6
1. Introduction
Report overview
1.1 As part of the Strategic Fit module the Commission has produced updated aviation
demand forecasts. These forecasts allow the Commission to assess each scheme against
the objective “to provide additional capacity that facilitates connectivity in line with the
assessment of need”. In addition these demand forecasts are an input to various other
areas of the appraisal, such as the modelling of commercial and national economy
impacts.
1.2 They have been produced using an updated version of the Department for Transport’s
(DfT) aviation forecasting model. Technical advice and support, including undertaking
model runs, has been provided by DfT modellers. This report sets out forecasts of
passenger numbers, air transport movements (ATMs) and aviation carbon emissions (CO2)
at UK airports for the three capacity development options together with a baseline of no
new runway capacity. The forecasts are considered under five broad aviation demand
scenarios, introduced in this chapter.
1.3 Over the past year the Commission has continued to build on the DfT aviation forecasting
model, undertaking model developments and adopting new and alternative input
assumptions, to produce these forecasts. Chapter 2 describes the forecasting models
and changes made to them since the Interim Report.
1.4 Chapter 3 presents the changes to input assumptions that have been adopted since the
last Airports Commission forecasts were published in December 2013.
1.5 Chapter 4 sets out how the forecasts deal with CO2 emissions from aviation and reports
those emissions for the base without added runway capacity. Chapter 5 describes the
total level of national demand expected without allowing for airport capacity constraints
and reports passenger demand at airports for the base without added runway capacity.
Chapter 6 sets out demand and CO2 emission forecasts for both ‘carbon capped’ and
‘carbon-traded’ cases in the five demand scenarios for the three additional runway
capacity options outlined below.
1.6 Finally, Chapter 7 reports a number of tests to test the sensitivity of the modelling results
to changes in key input assumptions.
Introduction
7
Capacity development options
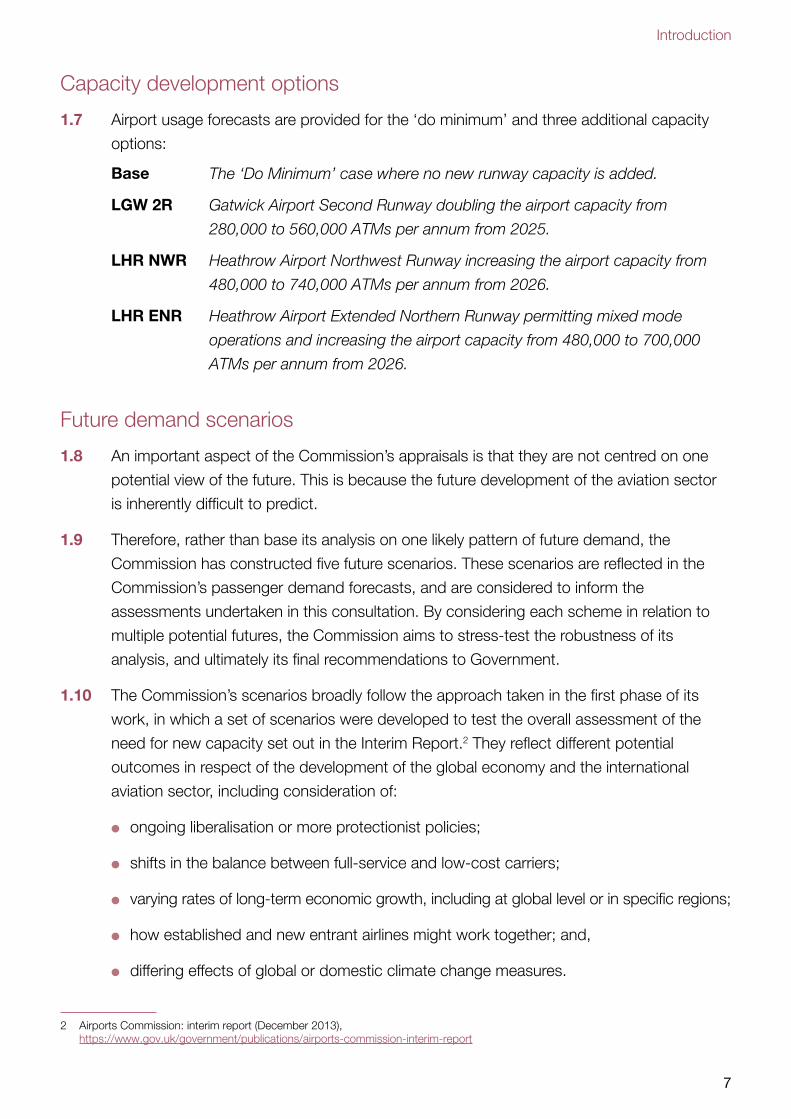
1.7 Airport usage forecasts are provided for the ‘do minimum’ and three additional capacity
options:
Base The ‘Do Minimum’ case where no new runway capacity is added.
LGW 2R Gatwick Airport Second Runway doubling the airport capacity from
280,000 to 560,000 ATMs per annum from 2025.
LHR NWR Heathrow Airport Northwest Runway increasing the airport capacity from
480,000 to 740,000 ATMs per annum from 2026.
LHR ENR Heathrow Airport Extended Northern Runway permitting mixed mode
operations and increasing the airport capacity from 480,000 to 700,000
ATMs per annum from 2026.
Future demand scenarios
1.8 An important aspect of the Commission’s appraisals is that they are not centred on one
potential view of the future. This is because the future development of the aviation sector
is inherently difficult to predict.
1.9 Therefore, rather than base its analysis on one likely pattern of future demand, the
Commission has constructed five future scenarios. These scenarios are reflected in the
Commission’s passenger demand forecasts, and are considered to inform the
assessments undertaken in this consultation. By considering each scheme in relation to
multiple potential futures, the Commission aims to stress-test the robustness of its
analysis, and ultimately its final recommendations to Government.
1.10 The Commission’s scenarios broadly follow the approach taken in the first phase of its
work, in which a set of scenarios were developed to test the overall assessment of the
need for new capacity set out in the Interim Report.2 They reflect different potential
outcomes in respect of the development of the global economy and the international
aviation sector, including consideration of:
●● ongoing liberalisation or more protectionist policies;
●● shifts in the balance between full-service and low-cost carriers;
●● varying rates of long-term economic growth, including at global level or in specific regions;
●● how established and new entrant airlines might work together; and,
●● differing effects of global or domestic climate change measures.
2 Airports Commission: interim report (December 2013), https://www.gov.uk/government/publications/airports-commission-interim-report
Strategic Fit: Forecasts
8
1.11 Five possible scenarios of future demand are considered to test how the scheme performs
against different futures, these are briefly described below and discussed more fully in
Chapter 3.
Assessment
of need
Future demand is primarily determined by central projections
published by sources such as the Office for Budgetary
Responsibility, OECD and IMF.
Global growth This scenario sees higher global growth in demand for air travel.
It adopts higher GDP growth forecasts for all world regions, coupled
with lower operating costs.
Relative decline
of Europe
This scenario sees higher relative growth of passenger demand in
emerging economies in the future compared to the growth in the
developed world. It adopts higher GDP growth rates for newly
industrialised and developing countries, and a strengthened position
of Far and Middle Eastern aviation hubs and airlines.
Low-cost is king This scenario sees the low-cost carriers strengthening their position
in the short-haul market and capturing a substantial share of the
long-haul market. As with the global growth scenario, it also sees
GDP growth rates for all world regions and lower operating costs,
resulting in higher passenger demand growth rates.
Global
fragmentation
This scenario sees economies close themselves off by adopting
more conditional and interventionist national policies. As a result,
there is a decline in GDP growth rates for all world regions, coupled
with higher operating costs. This results in lower passenger demand
growth rates.
1.12 It must be stressed that none of these should be considered a ‘central’ scenario. It would
be as risky, for example, to assume that past trends will simply continue into the future as
it would be to base a decision on any single view of how those trends might alter over
time. The purpose of the scenarios is not to identify a single correct or most plausible
future. It is to provide a range of potential demand forecasts, reflecting differing potential
futures, to understand better the ways in which the appraisal results for each shortlisted
option might be affected by long-term structural changes.
1.13 In line with the approach taken in the Interim Report, the Commission has also prepared
two sets of forecasts based on different approaches to handling carbon emissions from
aviation:
●● ‘Carbon-traded’ – These cases assume that carbon emissions from flights departing
UK airports are traded at the European level until 2030 and then as part of a liberal
global carbon market. As such these forecasts assume that the total emissions allowed
Introduction
9
beyond 2030 in the global market are set with reference to stabilisation targets and that
society seeks to make reductions where they are most desirable or efficient across the
global economy. This market would be established under a future international
agreement that aims for a global temperature increase of equal, or close to 2 degrees C
and aims to ensure that a 4 degree C global temperature increase is reached only with
very low probability (less than 1 per cent). Therefore, it is assumed that any aviation
emissions target can be met in part through buying credits from other sectors. The
carbon-traded case assumes that carbon is traded at a price equal to DECC’s central
long run forecast of carbon prices (September 2013 version) for appraisal.
●● Carbon capped’ – These cases represent the level of aviation demand consistent with
the Committee on Climate Change’s (CCC) current assessment of how UK climate
change targets can most effectively be met. These forecasts increase the costs of
carbon to ensure demand for aviation in the UK is reduced to stay within this planning
assumption and as such assume no trading of aviation emissions either within the UK
economy or internationally e.g. such as under an EU Emissions Trading Scheme or any
international global agreement to tackle these emissions.
1.14 As with the Commission’s scenarios, the objective is not to identify a single ‘correct’
forecast, but rather to understand the varying effects on aviation demand of constraining
and pricing carbon emissions. In practice, the impacts on overall demand will depend
upon the precise mix of policies used to address carbon emissions in aviation and other
sectors. This could include domestic, European or global measures, and the carbon prices
used for modelling purposes in the carbon capped scenario should not be taken as
indicating any policy recommendation.
Terminology
1.15 Throughout this report the following terminology is used to differentiate how the different
elements of the forecasts are described:
‘Scenario’ A specific set of future demand assumptions and forecasts.
‘Carbon case’ A variant on each of the demand scenarios where carbon is either
‘traded’ as part of an emissions trading scheme or ‘capped’ to a
specific target (see Chapter 4).
‘Option’ A scheme for adding runway capacity e.g. ‘LGW 2R’, ‘LHR NWR’
and ‘LHR ENR’.
Strategic Fit: Forecasts
10
National Air Passenger Demand Model (NAPDM)
National Air Passenger Allocation Model (NAPAM)
CO2 Emissions model
Fleet Mix Model
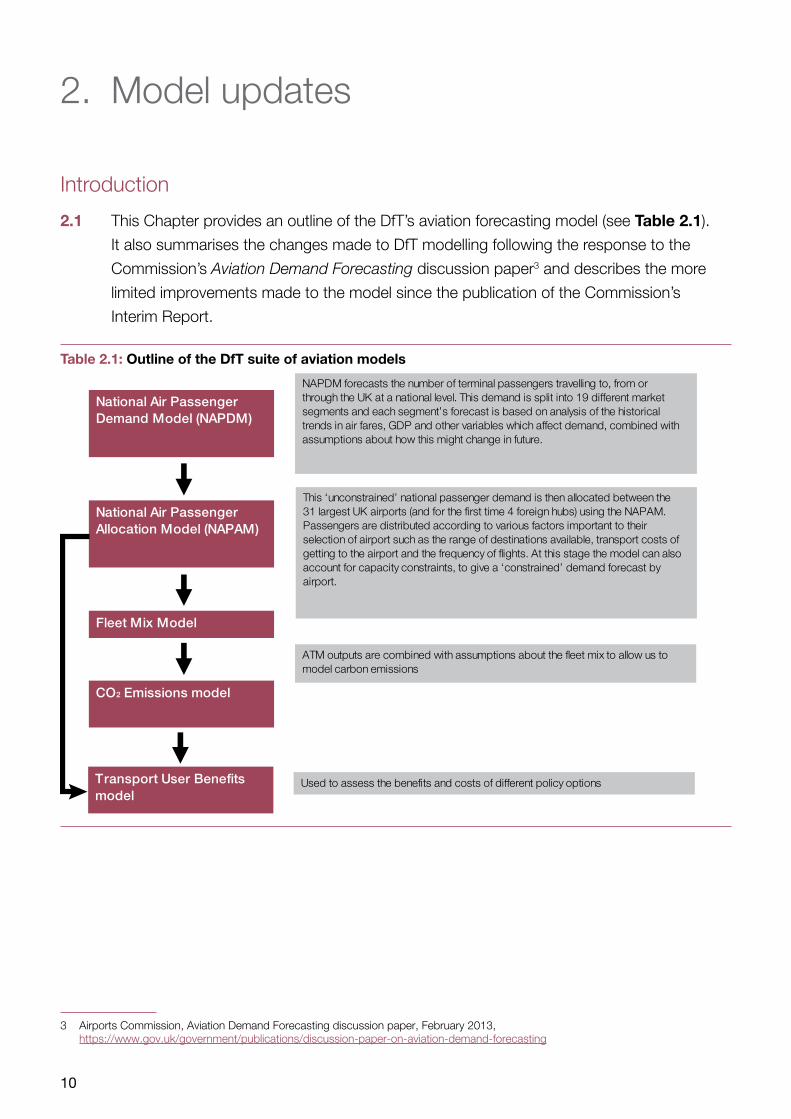
NAPDM forecasts the number of terminal passengers travelling to, from or through the UK at a national level. This demand is split into 19 different market segments and each segment’s forecast is based on analysis of the historical trends in air fares, GDP and other variables which affect demand, combined with assumptions about how this might change in future.
This ‘unconstrained’ national passenger demand is then allocated between the 31 largest UK airports (and for the first time 4 foreign hubs) using the NAPAM. Passengers are distributed according to various factors important to their selection of airport such as the range of destinations available, transport costs of getting to the airport and the frequency of flights. At this stage the model can also account for capacity constraints, to give a ‘constrained’ demand forecast by airport.
Transport User Benefits model
ATM outputs are combined with assumptions about the fleet mix to allow us to model carbon emissions
Used to assess the benefits and costs of different policy options
2. Model updates
Introduction
2.1 This Chapter provides an outline of the DfT’s aviation forecasting model (see Table 2.1).
It also summarises the changes made to DfT modelling following the response to the
Commission’s Aviation Demand Forecasting discussion paper3 and describes the more
limited improvements made to the model since the publication of the Commission’s
Interim Report.
Table 2.1: Outline of the DfT suite of aviation models
3 Airports Commission, Aviation Demand Forecasting discussion paper, February 2013, https://www.gov.uk/government/publications/discussion-paper-on-aviation-demand-forecasting
Model updates
11
2.2 The two major components of the DfT’s aviation modelling suite that have been updated
for the Commission are:
●● the National Air Passenger Demand Model (NAPDM or “Demand Model”) which
forecasts the number of air passengers before taking account of airport capacity
constraints; and,
●● the National Air Passenger Allocation Model (NAPAM or “Allocation Model”) which
allocates these passengers to airports, taking into account capacity constraints.
2.3 These models are described in greater detail in DfT’s UK Aviation Forecasts,
January 2013.4
National Air Passenger Demand Model
2.4 NAPDM combines a set of time series econometric models of past UK air travel demand
with projections of key driving variables and assumptions about how the relationship
between UK air travel and these drivers will change in the future. The market for passenger
air travel is split into separate sub-markets reflecting different trends, strength of driving
forces and availability of data. The markets are split according to:
●● the global region (including within the UK) the passenger is travelling to or from;
●● whether the passenger is a UK or overseas resident;
●● the passenger’s journey purpose (leisure or business); and,
●● whether the passenger is making an international-to-international connection which
could be made at one of the airports within the model, including the overseas hubs.
2.5 The drivers of demand are set out in Chapter 3. The estimated responsiveness of
demand to these drivers is largely unchanged from that used by DfT in their January 2013
publication.5 The only change relates to the price elasticity of demand applied to
international-to-international (I-I) transfer passengers, which was lowered from -0.7 to -0.5
to reflect the fact that many of the choices available to these passengers are now explicitly
modelled within the National Air Passenger Allocation Model (NAPAM, see paragraph 2.6
onwards). This year the Commission has reviewed the recent literature to verify that the
DfT assumptions on elasticities are still the most appropriate based on the evidence
available.
4 DfT UK Aviation forecasts, January 2013, particularly chapter 2, https://www.gov.uk/government/publications/uk-aviation-forecasts-2013
5 DfT UK Aviation forecasts, January 2013, particularly Annex A, https://www.gov.uk/government/publications/uk-aviation-forecasts-2013
Strategic Fit: Forecasts
12
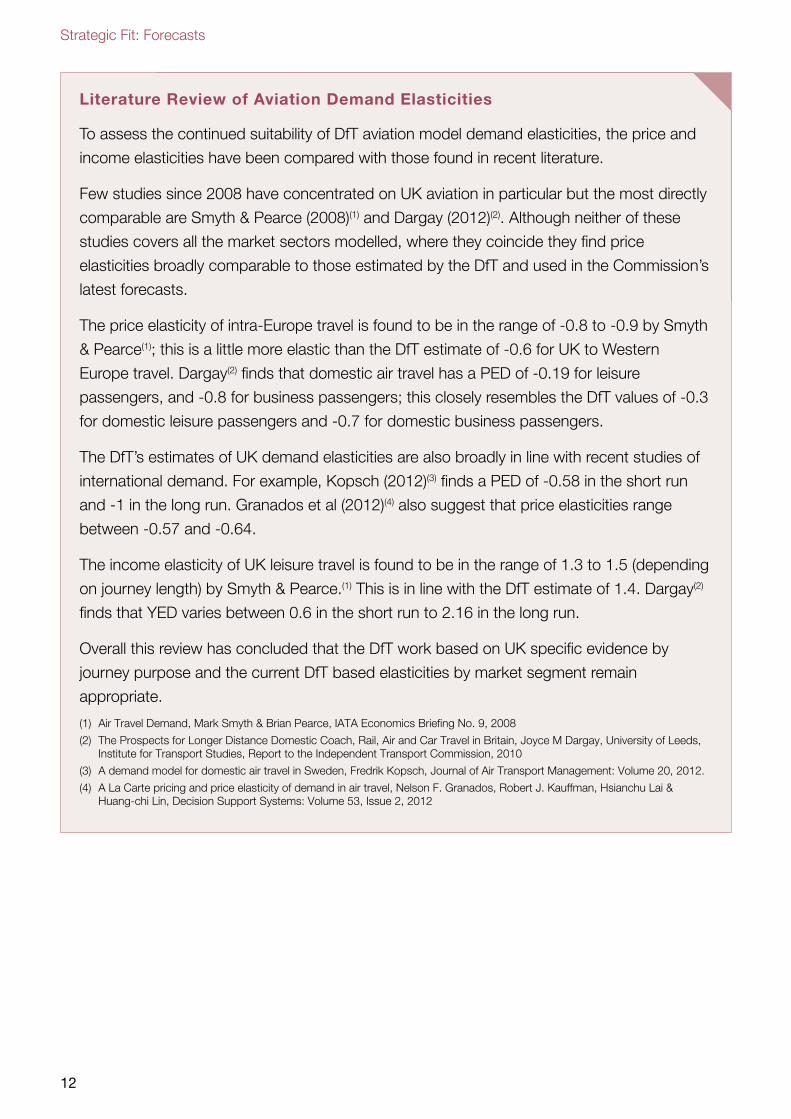
Literature Review of Aviation Demand Elasticities
To assess the continued suitability of DfT aviation model demand elasticities, the price and
income elasticities have been compared with those found in recent literature.
Few studies since 2008 have concentrated on UK aviation in particular but the most directly
comparable are Smyth & Pearce (2008)(1) and Dargay (2012)(2). Although neither of these
studies covers all the market sectors modelled, where they coincide they find price
elasticities broadly comparable to those estimated by the DfT and used in the Commission’s
latest forecasts.
The price elasticity of intra-Europe travel is found to be in the range of -0.8 to -0.9 by Smyth
& Pearce(1); this is a little more elastic than the DfT estimate of -0.6 for UK to Western
Europe travel. Dargay(2) finds that domestic air travel has a PED of -0.19 for leisure
passengers, and -0.8 for business passengers; this closely resembles the DfT values of -0.3
for domestic leisure passengers and -0.7 for domestic business passengers.
The DfT’s estimates of UK demand elasticities are also broadly in line with recent studies of
international demand. For example, Kopsch (2012)(3) finds a PED of -0.58 in the short run
and -1 in the long run. Granados et al (2012)(4) also suggest that price elasticities range
between -0.57 and -0.64.
The income elasticity of UK leisure travel is found to be in the range of 1.3 to 1.5 (depending
on journey length) by Smyth & Pearce.(1) This is in line with the DfT estimate of 1.4. Dargay(2)
finds that YED varies between 0.6 in the short run to 2.16 in the long run.
Overall this review has concluded that the DfT work based on UK specific evidence by
journey purpose and the current DfT based elasticities by market segment remain
appropriate.
(1) Air Travel Demand, Mark Smyth & Brian Pearce, IATA Economics Briefing No. 9, 2008
(2) The Prospects for Longer Distance Domestic Coach, Rail, Air and Car Travel in Britain, Joyce M Dargay, University of Leeds, Institute for Transport Studies, Report to the Independent Transport Commission, 2010
(3) A demand model for domestic air travel in Sweden, Fredrik Kopsch, Journal of Air Transport Management: Volume 20, 2012.
(4) A La Carte pricing and price elasticity of demand in air travel, Nelson F. Granados, Robert J. Kauffman, Hsianchu Lai & Huang-chi Lin, Decision Support Systems: Volume 53, Issue 2, 2012
Model updates
13
National Air Passenger Allocation Model
Scope
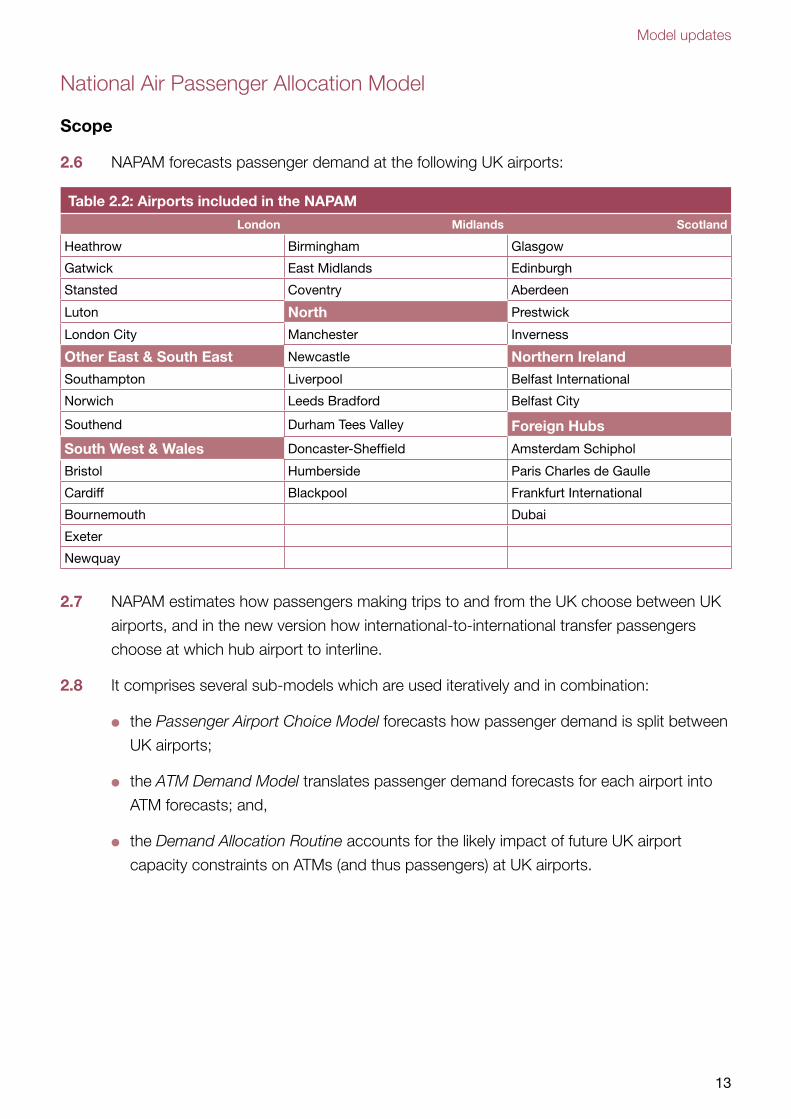
2.6 NAPAM forecasts passenger demand at the following UK airports:
Table 2.2: Airports included in the NAPAM
London Midlands Scotland
Heathrow Birmingham Glasgow
Gatwick East Midlands Edinburgh
Stansted Coventry Aberdeen
Luton North Prestwick
London City Manchester Inverness
Other East & South East Newcastle Northern IrelandSouthampton Liverpool Belfast International
Norwich Leeds Bradford Belfast City
Southend Durham Tees Valley Foreign Hubs
South West & Wales Doncaster-Sheffield Amsterdam Schiphol
Bristol Humberside Paris Charles de Gaulle
Cardiff Blackpool Frankfurt International
Bournemouth Dubai
Exeter
Newquay
2.7 NAPAM estimates how passengers making trips to and from the UK choose between UK
airports, and in the new version how international-to-international transfer passengers
choose at which hub airport to interline.
2.8 It comprises several sub-models which are used iteratively and in combination:
●● the Passenger Airport Choice Model forecasts how passenger demand is split between
UK airports;
●● the ATM Demand Model translates passenger demand forecasts for each airport into
ATM forecasts; and,
●● the Demand Allocation Routine accounts for the likely impact of future UK airport
capacity constraints on ATMs (and thus passengers) at UK airports.
Strategic Fit: Forecasts
14
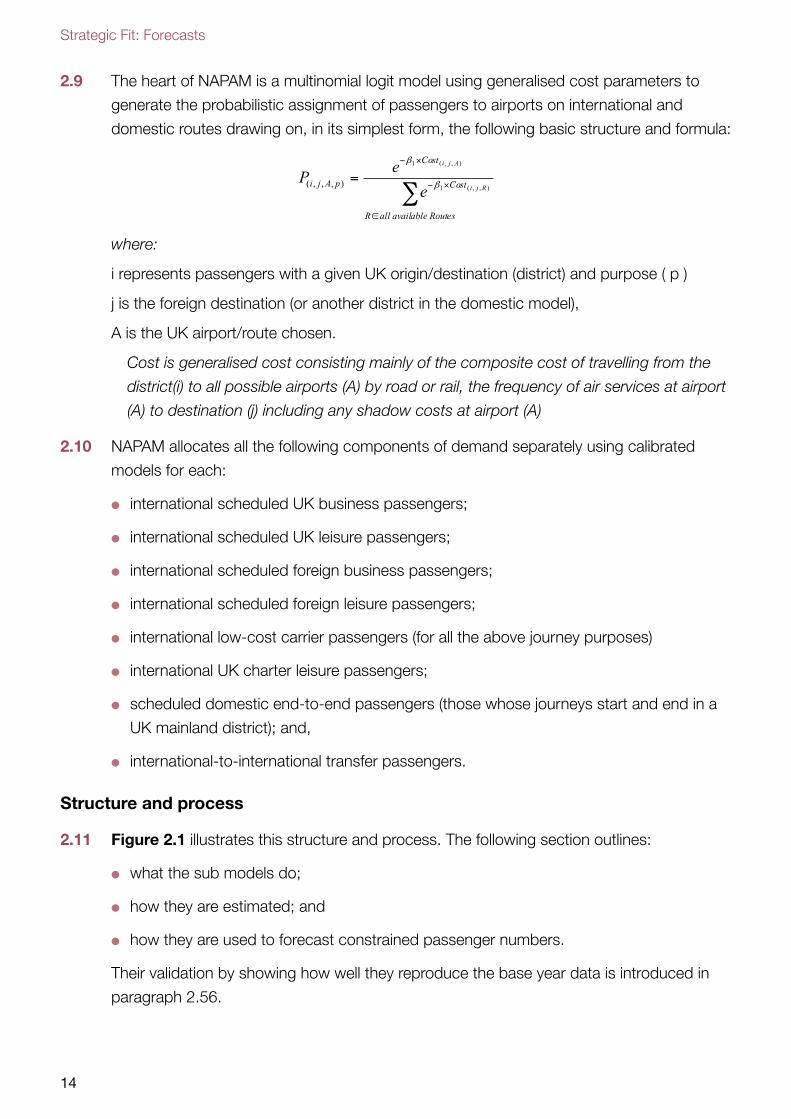
2.9 The heart of NAPAM is a multinomial logit model using generalised cost parameters to
generate the probabilistic assignment of passengers to airports on international and
domestic routes drawing on, in its simplest form, the following basic structure and formula:
where:
i represents passengers with a given UK origin/destination (district) and purpose ( p )
j is the foreign destination (or another district in the domestic model),
A is the UK airport/route chosen.
Cost is generalised cost consisting mainly of the composite cost of travelling from the
district(i) to all possible airports (A) by road or rail, the frequency of air services at airport
(A) to destination (j) including any shadow costs at airport (A)
2.10 NAPAM allocates all the following components of demand separately using calibrated
models for each:
●● international scheduled UK business passengers;
●● international scheduled UK leisure passengers;
●● international scheduled foreign business passengers;
●● international scheduled foreign leisure passengers;
●● international low-cost carrier passengers (for all the above journey purposes)
●● international UK charter leisure passengers;
●● scheduled domestic end-to-end passengers (those whose journeys start and end in a
UK mainland district); and,
●● international-to-international transfer passengers.
Structure and process
2.11 Figure 2.1 illustrates this structure and process. The following section outlines:
●● what the sub models do;
●● how they are estimated; and
●● how they are used to forecast constrained passenger numbers.
Their validation by showing how well they reproduce the base year data is introduced in
paragraph 2.56.
Model updates
15
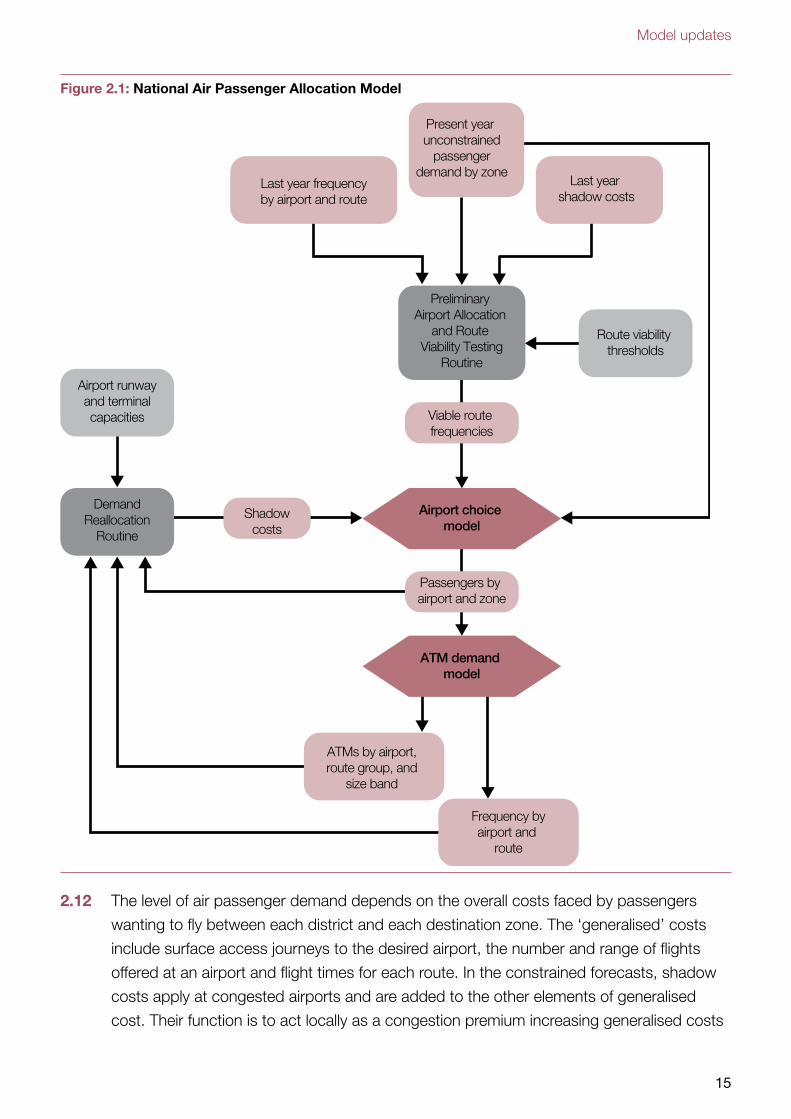
Figure 2.1: National Air Passenger Allocation Model
Airport runwayand terminalcapacities
DemandReallocation
Routine
Present year unconstrained
passengerdemand by zone
Shadowcosts
Airport choice model
Passengers by airport and zone
ATM demand model
ATMs by airport,route group, and
size band
Frequency byairport and
route
Last year shadow costs
Last year frequencyby airport and route
Route viability thresholds
Preliminary Airport Allocation
and Route Viability Testing
Routine
Viable route frequencies
2.12 The level of air passenger demand depends on the overall costs faced by passengers
wanting to fly between each district and each destination zone. The ‘generalised’ costs
include surface access journeys to the desired airport, the number and range of flights
offered at an airport and flight times for each route. In the constrained forecasts, shadow
costs apply at congested airports and are added to the other elements of generalised
cost. Their function is to act locally as a congestion premium increasing generalised costs
Strategic Fit: Forecasts
16
to bring allocated demand into line with the capacity at an over-capacity airport. They
represent the general inconvenience of using an overloaded airport: they could be a locally
increased fare differential, but shadow costs could also represent higher access costs
(e.g. increased parking charges, longer transfer times, or a generally more unpleasant
travelling environment). They therefore also represent the value a marginal passenger
would place on flying to/from that airport, if extra capacity were available and are a key
monetised input to the appraisal of potential additional capacity.
2.13 In this report the forecasts for all the capacity options use shadow costs and are
constrained. In the Interim Report a constrained base option was compared with an
unconstrained forecast to assess the national need for new capacity. An unconstrained
forecast is essentially a useful modelling diagnostic tool rather than a real world
representation. It is a theoretical forecast that switches off shadow costs by modelling
unlimited terminal and runway capacity at all modelled airports. All demand can then travel
from its most preferred airport and no travel is suppressed. But as the input demand is
limited to the NAPDM national forecast levels, and all the demand can be accommodated
at the most demanded airports, it logically follows that in an unconstrained system some
airports will see lower passenger allocations than they receive when in-demand airports
are constrained. When airport constraints are turned on some airports will receive more
passengers.
2.14 Given this theoretical nature of unconstrained forecasts, they are only used to provide a
broad estimate of national demand for aviation in the UK rather than being a useful tool
when considering demand at individual airports or options for adding capacity.
Allocating passengers to airports
2.15 A passenger flight is usually just one part of a journey, comprising several stages and
modes, between different parts of the world. To understand how passengers choose
between UK airports it is therefore necessary to consider not just the airports they are
flying between, but the initial origin or ultimate destination of their journey in the UK. For
example, a passenger leaving Gatwick might have an initial origin in Brighton and a
passenger arriving at Leeds-Bradford might have a destination in York.
2.16 NAPAM has been built to explain and reproduce passengers’ current choice of airport by
their journey purpose (and country of residence) from the place where the journey started
to their ultimate destination. This type of data forms the base pattern of passenger
demand and is only available from the CAA passenger interview surveys. These surveys
are annual at the London airports and Manchester (allowing a very large sample to be built
up) and generally on 3-5 year cycles at all the larger regional airports. The forecasts of
demand by airport are then obtained by applying projections of the variables driving
airport choice described below: principally surface access, availability of services and
shadow costs.
Model updates
17
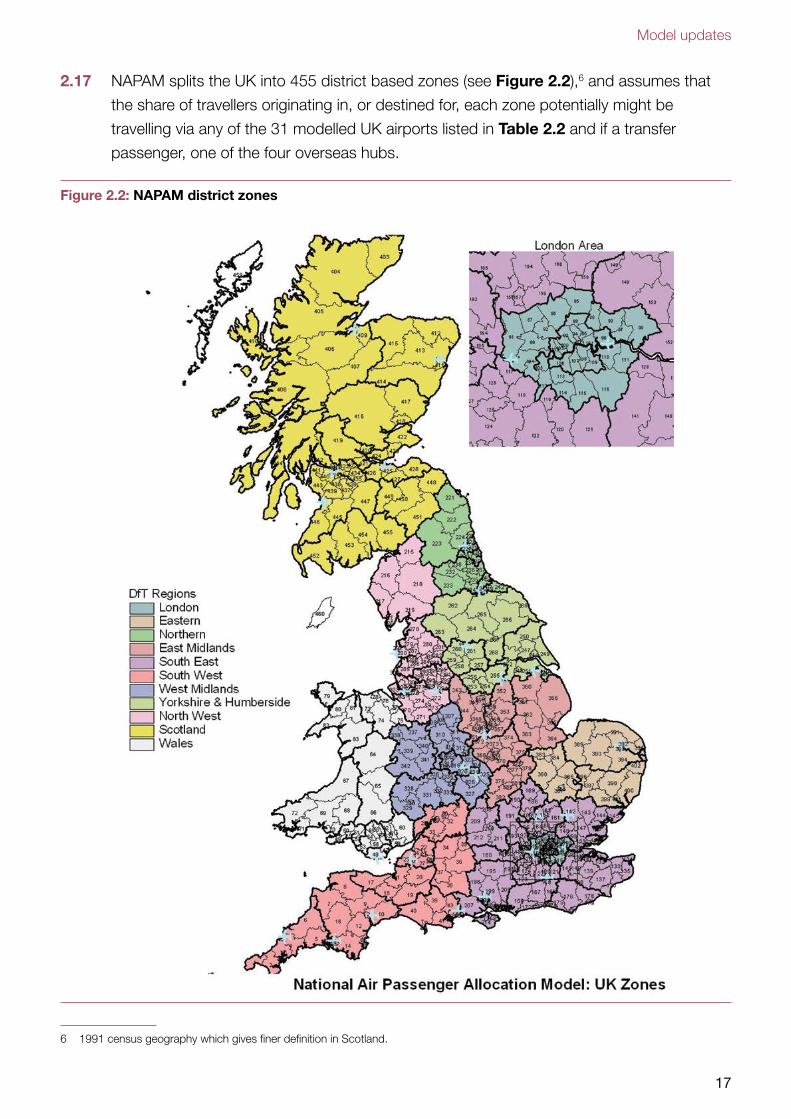
2.17 NAPAM splits the UK into 455 district based zones (see Figure 2.2),6 and assumes that
the share of travellers originating in, or destined for, each zone potentially might be
travelling via any of the 31 modelled UK airports listed in Table 2.2 and if a transfer
passenger, one of the four overseas hubs.
Figure 2.2: NAPAM district zones
6 1991 census geography which gives finer definition in Scotland.
Strategic Fit: Forecasts
18
2.18 Information about the overseas zones and the modelling of individual destinations within
these zones are available in DfT’s January 2013 publication.7
2.19 Passenger choice of airport from a UK ground origin or destination has been found to
depend on:
●● time and money costs of accessing that airport by road or public transport based on
the network of future road and rail services, and using the standard transport modelling
approach of combining journey time, including waiting and interchanging, and money
costs into a single ‘generalised cost’ measure;
●● frequency of the service at each airport converted into money costs using standard
transport modelling approaches;
●● flight duration (‘in-flight time’);
●● travellers’ preferences for particular airports; and,
●● travellers’ value of time (which varies by journey purpose).
For example, the lower the time and money costs of accessing an airport, and the greater
the range and depth of services offered, the greater will be the share of demand to/from a
given zone the airport will attract.
2.20 Air fares have not been found to be a significant driving factor of airport choice.
An extensive exercise undertaken by the DfT in 2010 to re-estimate the factors driving
airport choice confirmed an earlier study from 2001, and failed to find a statistically
significant relationship between fares for particular routes and passengers’ choice of
airport.8 This may in part be attributable to the difficulty in deriving reliable mean fares with
the increasingly wide spread of fares for each route available with web based ticketing
and modern yield management systems. The decision to omit fares as an airport choice
variable was supported by the subsequent Peer Review process.9 But as the previous
section has described, fares remain a key driver of the underlying national unconstrained
demand forecasts. They are important in forecasting the overall decision whether or not
to travel by air, if not the choice of airport itself.
7 DfT UK Aviation forecasts, January 2013, particularly chapter 2 paragraphs 2.36-2.37 and Figure 2.6, https://www.gov.uk/government/publications/uk-aviation-forecasts-2013
8 See DfT UK Aviation forecasts, August 2011, Annex E, https://www.gov.uk/government/publications/uk-aviation-forecasts-2011
9 Peer Review of NAPALM, John Bates Services, October 2010 (available at www.dft.gov.uk)
Model updates
19
2.21 The strength of each factor in driving an airport’s share of demand is determined by
calibrating the model to 2008 CAA airport choice data.10 Calibration is a statistical
technique by which the weight placed on each factor is chosen so as to maximise the
model’s accuracy in predicting current choices. This means that the model represents
passengers’ actual, observed, airport choice behaviour.
2.22 The model of passengers’ airport choice delivered by the estimation process outlined
above is used to forecast passenger demand at each modelled UK airport. The first step
is to use the unconstrained demand forecasts from the National Air Passenger Demand
Model for each type of passenger journey purpose to project growth in demand to/from
zones (the districts of ultimate origin or destination) in the UK. Immediately prior to
allocation to airports, growth rates by journey purpose are varied at the zonal (district) level
to take account of local forecasts of population, households, employment and income
used in the DfT’s National Trip End Model. The growth in passengers at the national level
is however, controlled to be consistent with the forecast growth from the National Air
Passenger Demand Model.11 The following are then also projected to forecast how this
demand splits between airports:
●● travel time and costs between each zone and each airport, based on future road and
rail network and conditions:12 these have been assumed to be broadly constant at 2008
levels and assume that road improvements or other management measures offset
future traffic growth and maintain broadly similar levels of service; the 2008 rail network
is supplemented by High Speed Rail introduced between 2026 and 2033.
●● route availability and frequency at each airport;
●● travellers’ value of time; and,
●● for modelling domestic air travel, comparative road, rail and air travel time and other
costs between all UK zones.
2.23 As illustrated in Figure 2.1, the availability of routes from each modelled airport is initially
checked at the start of each model year. The process of checking whether sufficient
demand exists to support new routes, or indeed whether existing routes are still viable,
is a key part of the calculation of route frequencies.
10 As described in paragraph 2.16 passengers are interviewed by the CAA at Heathrow, Gatwick, Stansted, Luton and Manchester every year with all but the smallest regional airports in the model being rotated on an annual basis normally on a 3-5 year cycle. The 2008 choice data includes the nine airports surveyed by the CAA in 2008 with data from other airports taken from the most recent survey and updated to 2008 traffic levels from published CAA activity statistics.
11 See DfT UK Aviation forecasts, August 2011, Annex E, https://www.gov.uk/government/publications/uk-aviation-forecasts-2011 for more information on this process.
12 Future road and rail schemes included in these costs are given in Appendix 2.
Strategic Fit: Forecasts
20
Capacity constraint
2.24 The forecast must account for the effect of capacity constraints on demand at every
airport in a system-wide manner. The shadow cost component of NAPAM therefore
models the impact of capacity constraints on the numbers of air passengers, and on
ATMs and their passenger loads at each UK airport. If unconstrained passenger demand
at an airport exceeds capacity, the shadow cost process estimates the extra generalised
cost of using the airport that would be necessary to reduce excess demand to zero. It also
represents the value a marginal passenger would place on flying to/from that airport, if
extra capacity were available. This routine is iterated until an equilibrium solution is found in
which capacity is not exceeded at any airport.13 It is a key input to the appraisal of
potential additional capacity.
2.25 As the shadow cost is ultimately added to the individual passenger’s overall cost of travel,
a runway constraint will stimulate the use of larger aircraft and higher passenger loads to
help airlines meet demand and because the charge levied on the use of the runway is
lower on a per passenger basis for heavier loaded aircraft. Conversely a terminal shadow
cost will not penalise the use of smaller aircraft. Runway capacity is generally a more finite
or ‘binding’ limit than terminal capacity and the NAPAM settings encourage a runway
shadow cost solution, particularly at the congested London airports.
2.26 Where new airport runway capacity options have been modelled, the options reported in
Chapter 6, an infinite terminal capacity has been given. This is because this is primarily an
investigation of more runway capacity and it is assumed that sufficient terminal capacity
will be provided by the airport operator. A consequence of this approach is that terminal
throughputs can exceed the terminal capacities assessed elsewhere in the option
appraisal, for example in the costs assessment. Where the modelled terminal demand
exceeds the capacity built in to the assessment this has been noted and further
discussion of this issue can be found in the Operational Efficiency module.
2.27 As explained in more detail above in paragraph 2.13, all the forecasts reported here are
capacity constrained and are different to the unconstrained forecast considered in the
Interim Report. In the Interim Report’s unconstrained case infinite terminal and runway
capacity were allowed at all modelled airports.
13 An equilibrium solution which satisfies capacity limits at all airports is computationally intensive and progressively more difficult to solve as demand mounts through the forecasting period. The solution is generally deemed to be found when over-capacity airports are within +/-1.5% of their input capacities. Runway capacity is regarded as a “harder” capacity than terminal capacity in the search for an equilibrium solution.
Model updates
21
Commission changes to the DfT model for the Interim Report
2.28 The Airports Commission published a discussion paper, Aviation Demand Forecasting,
in February 2013,14 which asked:
●● To what extent do you consider that the DfT forecasts support or challenge the
argument that additional capacity is needed?
●● What impact do you consider capacity constraints will have on the frequency and
number of destinations served by the UK?
●● How effectively do the DfT forecasts capture the effect on UK aviation demand of trends
in international aviation?
●● How could the DfT model be strengthened, for example to improve its handling of the
international passenger transfer market?
●● What approach should the Commission take to forecasting the UK’s share of the
international aviation market and how forecasts may change in different scenarios?
●● How well do you consider that the DfT’s aviation model replicates current patterns of
demand? How could it be improved?
2.29 Overall, a total of 36 submissions from airport operators, airlines, industry bodies (including
the regulator), environmental and other pressure groups and private individuals were
received and analysed.
2.30 Responses were cautiously supportive of using the DfT forecasting model, particularly if
there was to be some further development. There was a clear steer not to rely on one
particular forecast but to consider alternative approaches, especially ‘scenario
development’. The developments led by the Commission last year aimed at tackling the
issues most respondents cited as areas of concern, and the scenario based approach has
been taken further in phase two of the work programme.
2.31 The key updates undertaken in 2013 and reported fully in Chapter 3 of Appendix 3 to the
Interim Report were:
1. A revised definition of emerging economies. The definition of markets used for
international forecasting was re-evaluated with several countries, such as Brazil and
Indonesia, previously classified as Less Developed Countries (LDCs), being re-classified
as Newly Industrialised Countries (NICs).
14 Airports Commission, Aviation Demand Forecasting discussion paper, February 2013, https://www.gov.uk/government/publications/discussion-paper-on-aviation-demand-forecasting
Strategic Fit: Forecasts
22
2. Decreased levels of ‘demand overspill’ from the South East. Once an airport
reaches capacity, prospective passengers either travel to an alternative airport or do
not fly at all. Forecasting procedures were modified so that more people choose not to
travel at all than to go to another available airport. This change reduced some
implausibly high demand growth in the later years of the forecast period at the smaller
regional airports.
3. Probabilistic forecasts. Monte Carlo simulation, a statistical technique involving
repeated random sampling, was introduced to produce a range of all possible levels of
output and the probability they will occur for any combination of inputs. This was a
better approach to capturing some of the inherent uncertainty in forecasting than
traditional high/low scenarios.
4. Modelling overseas hubs. The biggest overseas hub competitors to London were
introduced into the model at the same level of detail as UK airports. The four newly
modelled hubs were Paris Charles de Gaulle (CDG), Amsterdam Schiphol (AMS),
Frankfurt International (FRA) and Dubai (DXB).
5. Revisions to model inputs. The forecasts used updated oil price assumptions, using
forecasts from the International Energy Agency (IEA). The Commission also led work to
improve the assumptions about growth in aircraft size, which increased as a result.
It also reviewed the assumptions on aircraft load factors, concluding that they remain
appropriate.
Scheme promoter forecasts
Gatwick Airport Limited (GAL) demand forecasts
2.32 GAL have used the ICF London Air Traffic model to forecast passenger demand in the
South East up to 2050. They have produced passenger and ATM forecasts for a baseline,
unconstrained and constrained London system under a Gatwick and Heathrow expansion.
It is assumed a two runway Gatwick can serve 560,000 ATMs from 2025. The model
outputs include destinations and journey purpose forecasts in addition to passengers
and ATMs.
Heathrow Airport Limited (HAL) demand forecasts
2.33 HAL developed an econometric model to forecast passenger demand and have produced
passenger projections up to 2050. They forecast a two runway and three runway
Heathrow, assuming a capacity of 740,000 ATMs from 2025 and consider demand solely
at Heathrow.
Model updates
23
Heathrow Hub Limited (HH) demand forecasts
2.34 HH have produced passenger projections up to 2050, under a baseline two runway airport
and with an expanded Heathrow capable of serving 700,000 ATMs annually from 2023.
The model considers demand solely at Heathrow.
Recent changes to the National Air Passenger Demand Model (NAPDM)
2.35 Changes made to the forecasting process since the Interim Report are described below
and were generally limited to updating inputs and improving model precision where
possible. These processes are reported separately for demand model (NAPDM) and the
passenger allocation model (NAPAM).
Monte Carlo range forecasts
2.36 The assessment of need scenario includes a confidence range of 60%, based on Monte
Carlo analysis. Monte Carlo is a form of probability assessment, which estimates the
likelihood of different outcomes occurring. More details are provided in the Interim Report;
in summary this is achieved by:
●● identifying the key variables that determine demand;
●● checking past data on these variables for stationarity and transforming them when
needed;
●● assigning probability distributions to the forecast values of these variables;
●● assigning correlations between variables; and,
●● running repeated simulations of NAPDM.
2.37 The distribution of the forecast values of each variable continue to be assigned by, where
possible, assessing which statistical distribution best described the variation of that
variable in historic data.
2.38 Again, judgments are made where no robust evidence was available – for example around
the uncertainty attached to market maturity parameters. For those variables where historic
data was available, a correlation matrix is used.
Strategic Fit: Forecasts
24
2.39 Some changes to specific distributions of some variables, or their treatment, have been
updated:
1. Foreign GDP is assumed to follow a logistic distribution, rather than the normal
distribution assumed in the Interim Report – this better reflects the historic data.
2. To better reflect DECC appraisal carbon prices, a lognormal distribution is now used,
rather than a normal distribution. But as there is no usable observed data on carbon
prices, the distribution parameters continue to rely on assumptions.15
These changes had relatively little impact on the range forecasts reported in Appendix 3.
2.40 The scope of the probability assessment has been extended to include the year in which
the process of maturity starts and ends. As before, the scope includes the final income
elasticity that is reached via the process of market maturity.
2.41 The result of all these updates is a wider 60% confidence range, with a stronger tendency
towards the higher end of the range.
Load factors
2.42 Load factors used in NAPDM primarily to calculate fare cost components on a per
passenger basis are now determined by NAPAM model outputs from the current (2014)
version of the model. This change is essentially model maintenance and updating.
The new version of NAPDM includes all the changes to the aircraft size and load factor
modelling in NAPAM requested by the Commission and discussed in paragraphs
2.49-2.50.
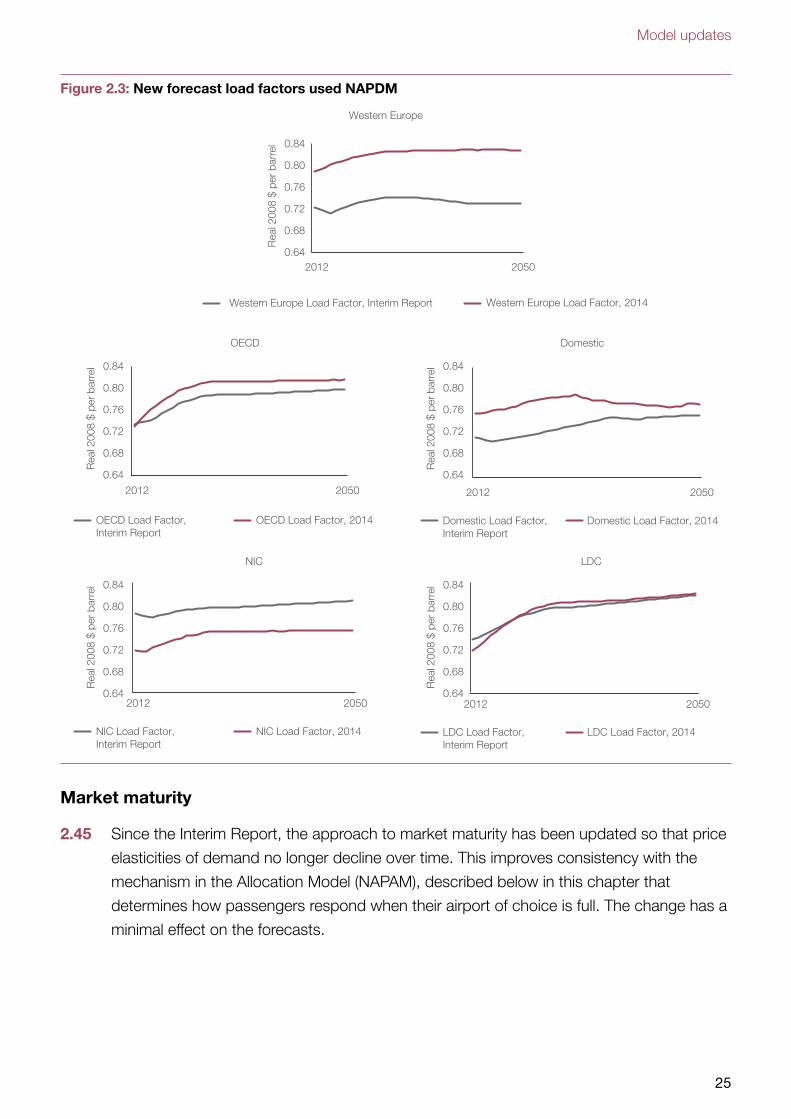
2.43 Figure 2.3 shows that the updated load factors are noticeably higher in the Western
Europe, domestic and OECD market segments, and lower in the NIC segment. The
change is less pronounced in the LDC segment. These higher load factors will slightly
increase national demand as they reduce the average fare paid per passenger per market
segment.
2.44 The method used for applying this input is now more compatible with other NAPAM
outputs. The new approach involves taking distance weighted averages.
15 Carbon prices now adopt the lognormal distribution rather than the normal distribution, which was previously assumed.
Model updates
25
Figure 2.3: New forecast load factors used NAPDM
0.64
0.68
0.72
0.76
0.80
0.84
2012 2050R
eal 2
008
$ pe
r ba
rrel
Western Europe
Western Europe Load Factor, Interim Report Western Europe Load Factor, 2014
2012 2050
OECD
OECD Load Factor, Interim Report
OECD Load Factor, 2014
2012 2050
NIC
2012 2050
LDC
2012 2050
Domestic
Domestic Load Factor, Interim Report
Domestic Load Factor, 2014
NIC Load Factor, Interim Report
NIC Load Factor, 2014 LDC Load Factor, Interim Report
LDC Load Factor, 2014
0.64
0.68
0.72
0.76
0.80
0.84
Rea
l 200
8 $
per
barr
el
0.64
0.68
0.72
0.76
0.80
0.84
Rea
l 200
8 $
per
barr
el
0.64
0.68
0.72
0.76
0.80
0.84
Rea
l 200
8 $
per
barr
el
0.64
0.68
0.72
0.76
0.80
0.84
Rea
l 200
8 $
per
barr
el
Market maturity
2.45 Since the Interim Report, the approach to market maturity has been updated so that price
elasticities of demand no longer decline over time. This improves consistency with the
mechanism in the Allocation Model (NAPAM), described below in this chapter that
determines how passengers respond when their airport of choice is full. The change has a
minimal effect on the forecasts.
Strategic Fit: Forecasts
26
Input updates
2.46 The model inputs have been updated where new data was available. Updated variables
include short run UK and foreign GDP, oil prices, long run carbon prices, load factors,
fuel efficiency and air passenger duty. The input assumptions are described in detail in
Chapter 3.
Recent updates to the DfT Passenger Allocation Model (NAPAM)
International-international interliner model
2.47 In 2013 the Commission undertook a study to recalibrate the logit models used to allocate
international-to-international transfer passengers between hub airports available in the
model.16 This used a combination of PaxIS ticket data for Paris CDG, Amsterdam,
Frankfurt and Dubai and CAA passenger interview survey data for Heathrow and Gatwick
for demand and fares with timetable data for frequency, and in-flight times to recalibrate
the logit models.17 At the time of the publication of the Interim Report the results of the
study were still subject to peer review. Following that review the new logit parameters
prepared by PwC for the Commission have now been included in NAPAM and a
comprehensive re-validation exercise made to provide evidence of their suitability.
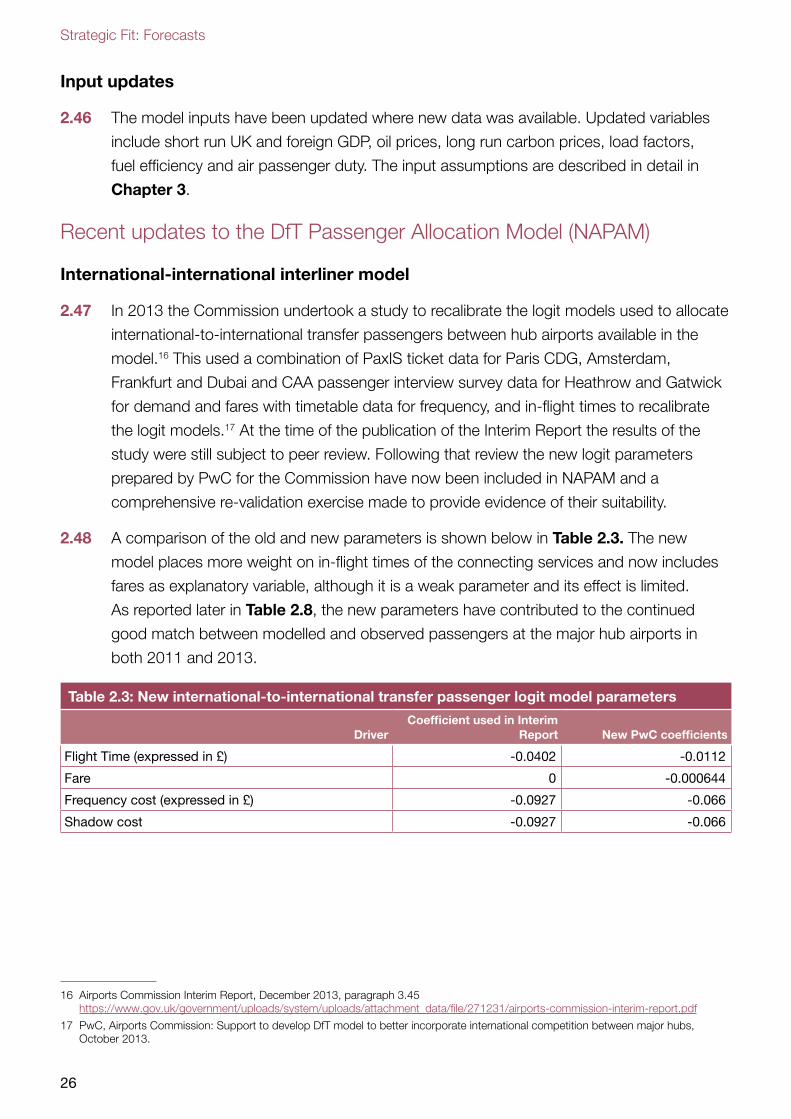
2.48 A comparison of the old and new parameters is shown below in Table 2.3. The new
model places more weight on in-flight times of the connecting services and now includes
fares as explanatory variable, although it is a weak parameter and its effect is limited.
As reported later in Table 2.8, the new parameters have contributed to the continued
good match between modelled and observed passengers at the major hub airports in
both 2011 and 2013.
Table 2.3: New international-to-international transfer passenger logit model parameters
DriverCoefficient used in Interim
Report New PwC coefficients
Flight Time (expressed in £) -0.0402 -0.0112
Fare 0 -0.000644
Frequency cost (expressed in £) -0.0927 -0.066
Shadow cost -0.0927 -0.066
16 Airports Commission Interim Report, December 2013, paragraph 3.45 https://www.gov.uk/government/uploads/system/uploads/attachment_data/file/271231/airports-commission-interim-report.pdf
17 PwC, Airports Commission: Support to develop DfT model to better incorporate international competition between major hubs, October 2013.
Model updates
27
Aircraft size and passenger loads
2.49 Since the Interim Report the graphs which relate potential demand on a route to aircraft
size over time have been further reviewed and replaced where appropriate.18
2.50 Of greater impact was the implementation of a recommendation of the 2011 Peer Review
of NAPAM by John Bates which suggested load factors need not be tied to each graph.19
The input load factor is now no longer part of the aircraft size graph but is allocated on a
route basis separately for scheduled, charter and LCC airline types. This change adds
greater precision to both the aircraft size and passenger load modelling. Like the logit
model change described above, this change also necessitated the re-calibration and
re-validation of the model 2011 base year prediction of ATMs and passenger loads.
This was carried out to the same standard of quality as previously achieved in 2013.
Route group zone proportions
2.51 The distribution of traffic within each of the 27 route group zones (see DfT 2013
forecasts20) is now a separate input for each of the three airline types in the model:
scheduled, charter and LCC. So the three different airline types can have different
proportions of passengers to different destinations in a route group. This makes the model
more precise and improves its performance in predicting the number of destinations
served at each airport.
Demand suppression
2.52 Suppression describes the process by which passengers are deterred from flying by
higher shadow costs. There had been some criticism of the balance between passengers
choosing different airports and choosing not to fly in the responses to the Commission’s
consultation on the forecasts.21 Since the Interim Report further improvements to the
suppression algorithm were made:
●● changing its functional form, in line with the 2011 Peer Review recommendations;22
●● applying the logit model weights to the components of generalised cost in the
calculation of composite costs; and,
●● using the NAPDM fare elasticities.
18 See PwC report Review of DfT model aircraft size and route threshold assumption (sic)-1 April 2014, published under Economic Analysis: consultants reports, on the Commissions website. http://www.gov.uk/government/publications/airports-commission-interim-report
19 John Bates Services, Peer Review of NAPALM https://www.gov.uk/government/uploads/system/uploads/attachment_data/file/4506/review-napalm.pdf
20 DfT UK Aviation forecasts, January 2013, particularly chapter 2 paragraphs 2.36-2.37 and Figure 2.6, https://www.gov.uk/government/publications/uk-aviation-forecasts-2013
21 Airports Commission, Aviation Demand Forecasting discussion paper, February 2013, https://www.gov.uk/government/publications/discussion-paper-on-aviation-demand-forecasting
22 John Bates Services, Peer Review of NAPALM https://www.gov.uk/government/uploads/system/uploads/attachment_data/file/4506/review-napalm.pdf
Strategic Fit: Forecasts
28
2.53 The new approach introduced greater consistency with NAPDM and within NAPAM itself,
used suppression elasticities that were more evidence based and more precisely
disaggregated to match the modelled passenger purpose. Test model runs demonstrated
that the overall impact on demand and airport allocation were minimal.
Surface access inputs model
2.54 The time and money costs of surface access from origin district to airport play a key role in
determining passenger airport choice, making the surface access module within the DfT
aviation model suite particularly important. Although the focus of the changes to this
module relates to updates of future year rail and road schemes set out in Chapter 3 and
Appendix 2, the structure of the surface access model has changed. It is now more fully
integrated into DfT’s aviation modelling suite and called the National Airport Accessibility
Model (NAAM2). The most significant developments were modernising the software
platform but these had little impact on the costs generated. There was also improved
disaggregation in some regions, particularly in Scotland, which allows for a better
representation of how passengers access both the road and rail networks and improves
the allocation of passengers to the Scottish airports.
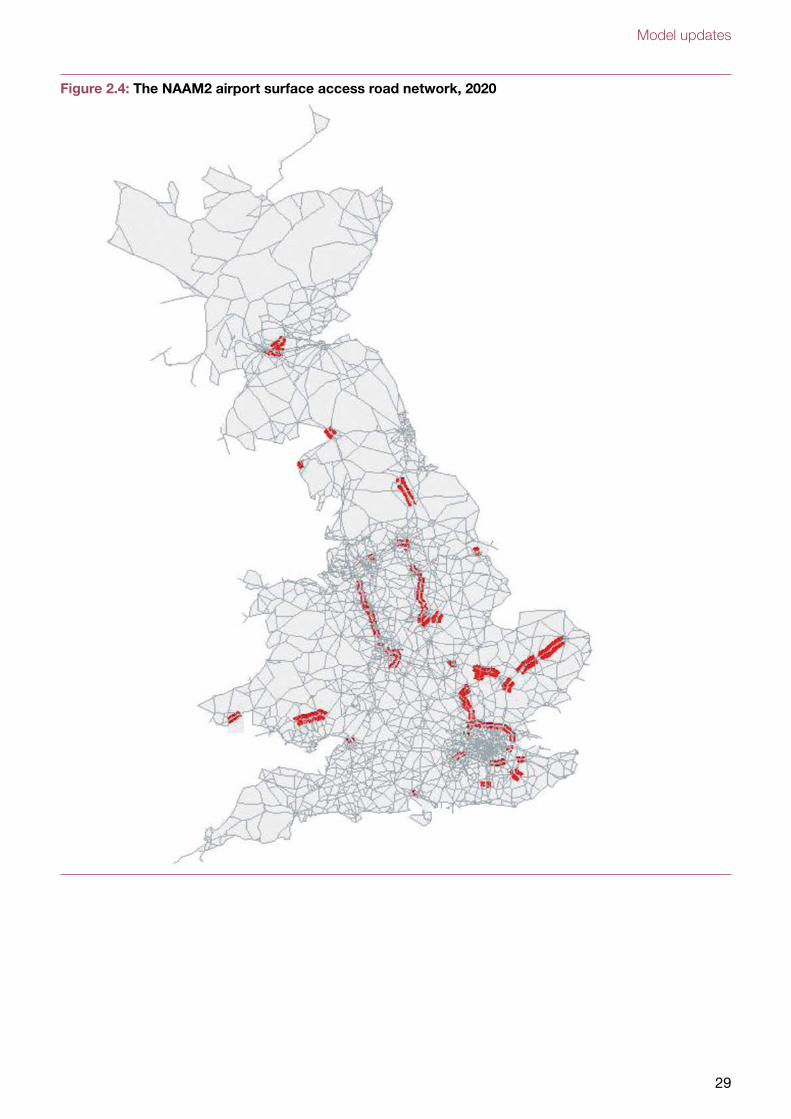
2.55 Figure 2.4 illustrates the NAAM2 highway network for 2020 with highway improvements
marked in red.23 The figure gives an indication of the detail available in the airport access
costs input into the passenger allocation model, NAPAM.
23 Full lists of future road and rail improvements included in NAAM2 for the base and options is given in Appendix 2.
Model updates
29
Figure 2.4: The NAAM2 airport surface access road network, 2020
Strategic Fit: Forecasts
30
Model validation
2.56 Several of the model updates described above had an effect on the base year passenger
allocation and so necessitated a revalidation exercise. Model validation is a very important
part of the transport modelling where modelled outputs are compared in detail with
independent observations. This is to ensure that the model is fit for forecasting and can
accurately reproduce current patterns of airport use, traffic on particular routes, aircraft
movements and aircraft passenger loads.
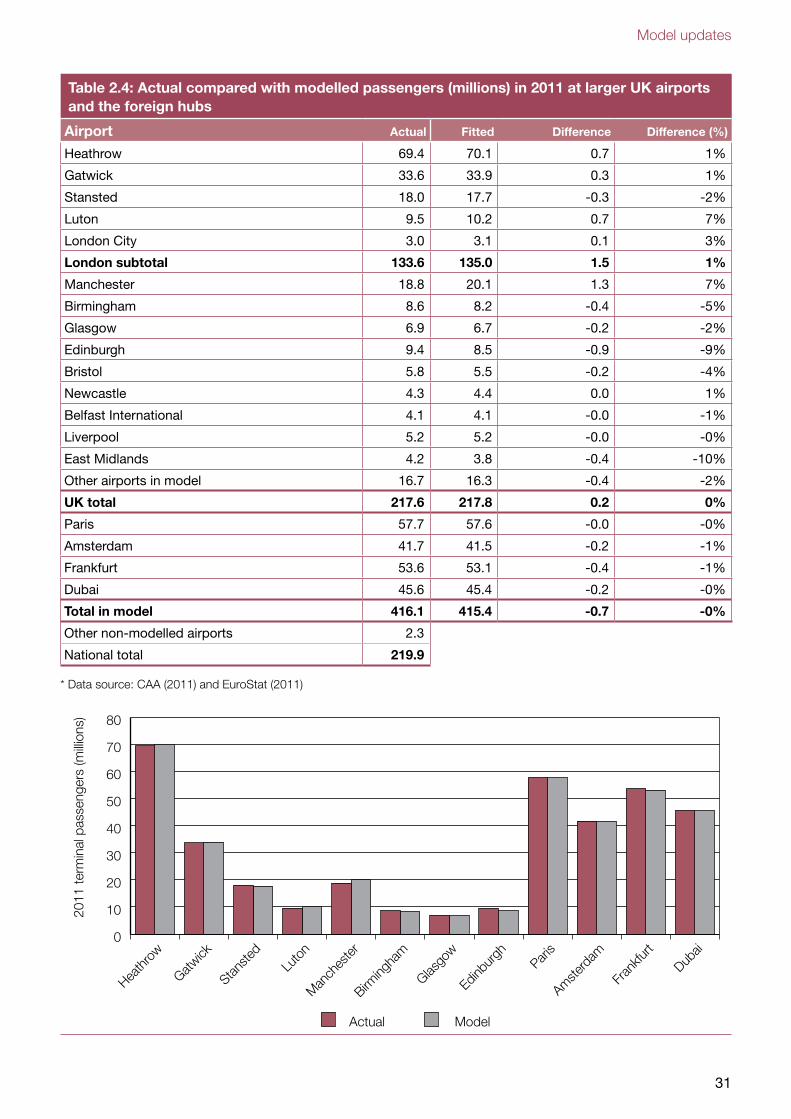
2.57 The principal model base year for validating detailed route level outputs against observed
statistical returns (actuals) is 2011. Table 2.6 (with graphic) compares modelled
passengers at the most significant airports, including overseas hubs, with observed data
for the model base year of 2011. It can be seen that a good correspondence between
modelled and observed data has been achieved.
2.58 As the overseas hubs are fully incorporated into the model and the logit model and the
load factor modelling has been improved, it is necessary to ensure that ATMs at these
airports are forecast as accurately as at UK airports. This is necessary for accurate
modelling of frequencies. Table 2.7 compares modelled ATMs with those reported at the
principal airports in the model.
Model updates
31
0
10
20
30
40
50
60
70
80
Dubai
Fran
kfurt
Amste
rdamPar
is
Edinbu
rgh
Glasgo
w
Birming
ham
Man
ches
ter
Luto
n
Stanste
d
Gatwick
Heath
row
2011
term
inal
pas
seng
ers
(milli
ons)
Actual Model
Table 2.4: Actual compared with modelled passengers (millions) in 2011 at larger UK airports and the foreign hubs
Airport Actual Fitted Difference Difference (%)
Heathrow 69.4 70.1 0.7 1%
Gatwick 33.6 33.9 0.3 1%
Stansted 18.0 17.7 -0.3 -2%
Luton 9.5 10.2 0.7 7%
London City 3.0 3.1 0.1 3%
London subtotal 133.6 135.0 1.5 1%
Manchester 18.8 20.1 1.3 7%
Birmingham 8.6 8.2 -0.4 -5%
Glasgow 6.9 6.7 -0.2 -2%
Edinburgh 9.4 8.5 -0.9 -9%
Bristol 5.8 5.5 -0.2 -4%
Newcastle 4.3 4.4 0.0 1%
Belfast International 4.1 4.1 -0.0 -1%
Liverpool 5.2 5.2 -0.0 -0%
East Midlands 4.2 3.8 -0.4 -10%
Other airports in model 16.7 16.3 -0.4 -2%
UK total 217.6 217.8 0.2 0%
Paris 57.7 57.6 -0.0 -0%
Amsterdam 41.7 41.5 -0.2 -1%
Frankfurt 53.6 53.1 -0.4 -1%
Dubai 45.6 45.4 -0.2 -0%
Total in model 416.1 415.4 -0.7 -0%
Other non-modelled airports 2.3
National total 219.9
* Data source: CAA (2011) and EuroStat (2011)
Strategic Fit: Forecasts
32
0
100
200
300
400
500
Dubai
Fran
kfurt
Amste
rdamParis
Edinbu
rgh
Glasgo
w
Birming
ham
Man
ches
ter
Luto
n
Stanste
d
Gatwick
Heath
row
2011
ATM
s (0
00)
Actual Model
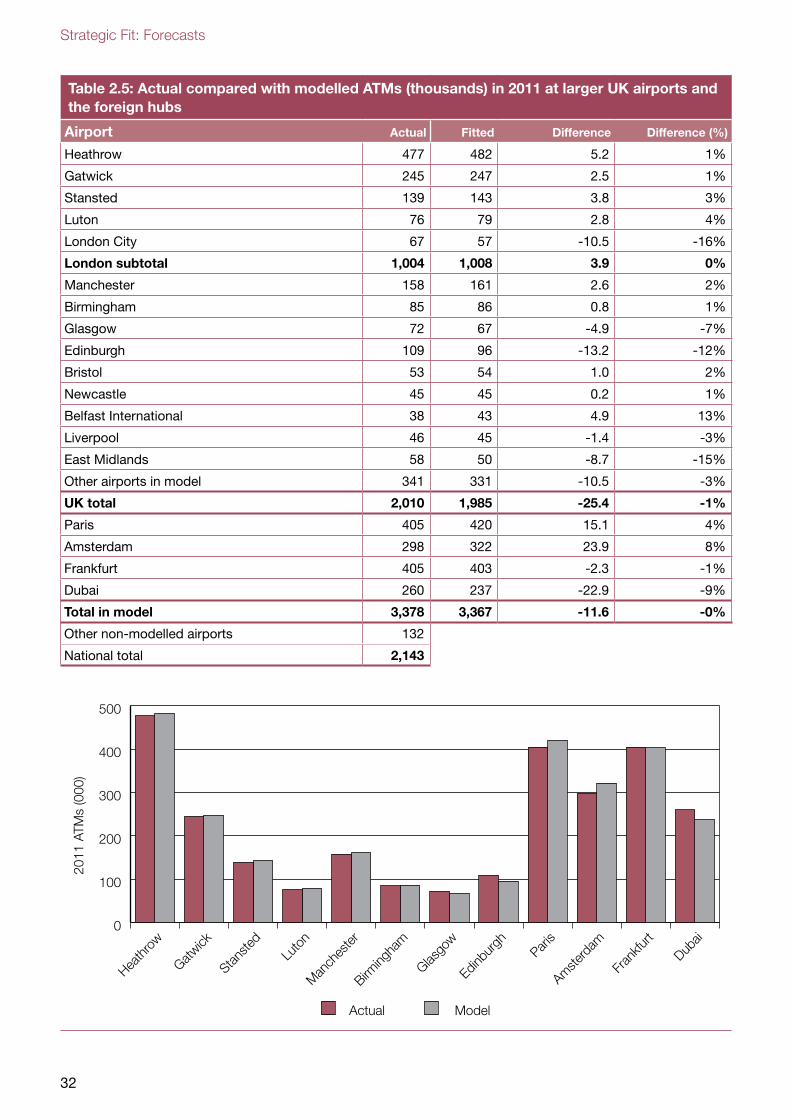
Table 2.5: Actual compared with modelled ATMs (thousands) in 2011 at larger UK airports and the foreign hubs
Airport Actual Fitted Difference Difference (%)
Heathrow 477 482 5.2 1%
Gatwick 245 247 2.5 1%
Stansted 139 143 3.8 3%
Luton 76 79 2.8 4%
London City 67 57 -10.5 -16%
London subtotal 1,004 1,008 3.9 0%
Manchester 158 161 2.6 2%
Birmingham 85 86 0.8 1%
Glasgow 72 67 -4.9 -7%
Edinburgh 109 96 -13.2 -12%
Bristol 53 54 1.0 2%
Newcastle 45 45 0.2 1%
Belfast International 38 43 4.9 13%
Liverpool 46 45 -1.4 -3%
East Midlands 58 50 -8.7 -15%
Other airports in model 341 331 -10.5 -3%
UK total 2,010 1,985 -25.4 -1%
Paris 405 420 15.1 4%
Amsterdam 298 322 23.9 8%
Frankfurt 405 403 -2.3 -1%
Dubai 260 237 -22.9 -9%
Total in model 3,378 3,367 -11.6 -0%
Other non-modelled airports 132
National total 2,143
Model updates
33
2.59 More details of the modelled passengers and ATMs in 2011 are shown in Appendix 1.
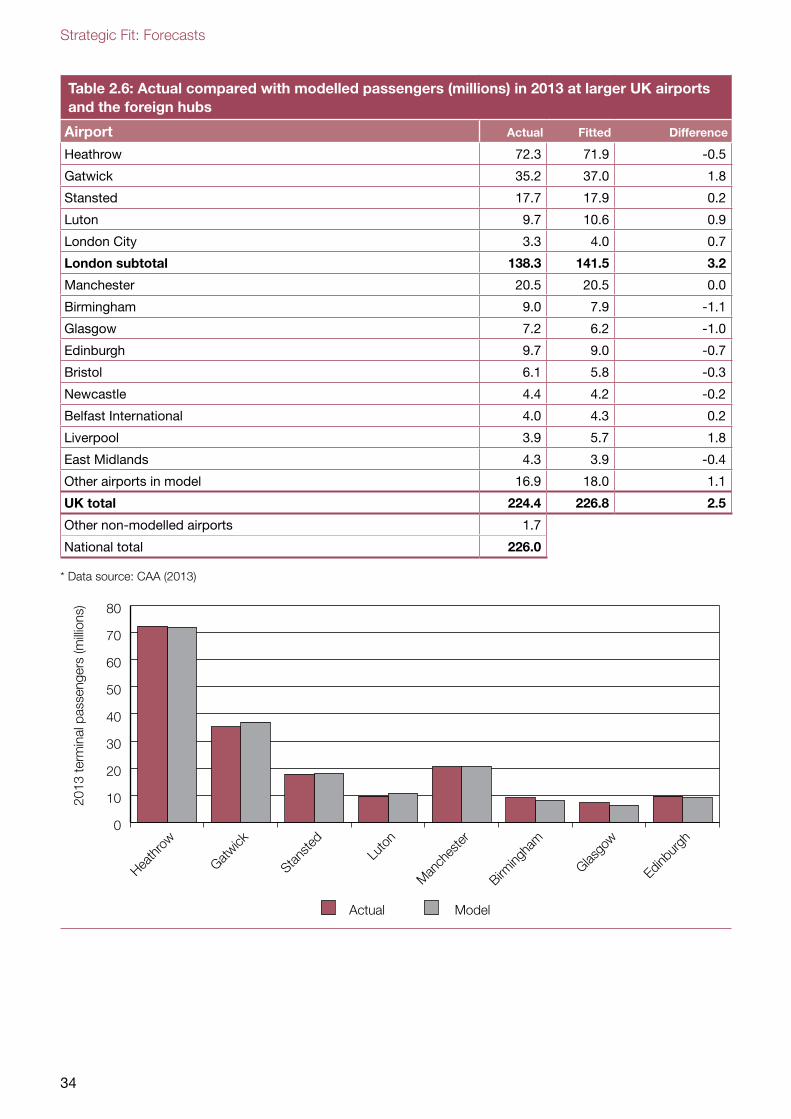
2.60 The model forecasts every year in the period 2011-2050. Although the model is not
calibrated to produce the 2013 outturn in the detail of the validation year of 2011,
checking uncalibrated 2013 forecasts against actuals provides a rigorous independent
check of modelling performance and suitability for forecasting.24 Table 2.6 (with graphic)
compares modelled passengers at the most significant UK airports with observed data for
2013. Although not to the standard of the 2011 validation year shown in the previous two
tables, it can be seen that a good correspondence between modelled and observed data
has been achieved. The most noticeable discrepancy is at Liverpool where there
passenger numbers have dropped by close to a quarter 2011-2013, an effect not
captured in the model. Liverpool accounts for 72% of the national total over-forecast.
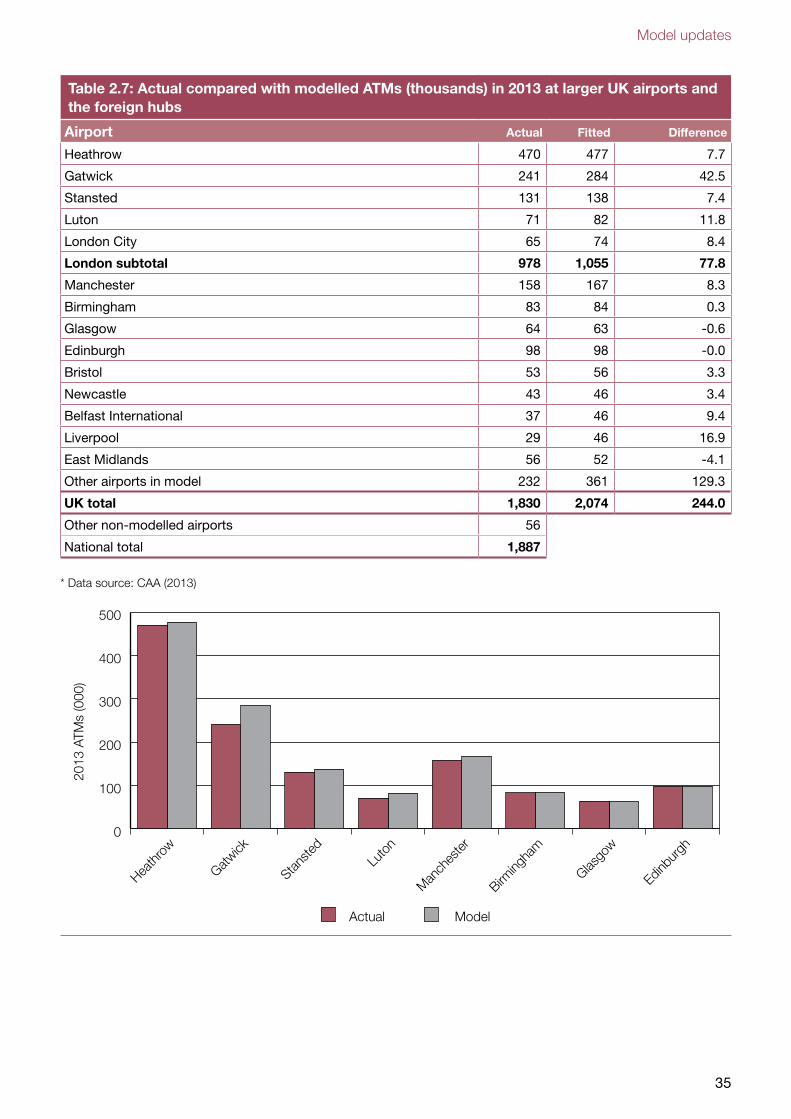
2.61 Table 2.7 compares modelled ATMs with those reported at the principal airports in the
model. Again the model has not been calibrated to produce 2013 ATMs, so this
constitutes a tough validation test. Although not to the standard of the 2011 validation
year shown in Table 2.4 and Table 2.5 above, it can be seen that with some exceptions
a good correspondence between modelled and observed data has been achieved.
24 The throughputs for foreign hubs in 2013 are not shown as there is less good quality observed data available on passenger O-Ds and ATMs compared to 2011 where many independent checks were run on the overseas data.
Strategic Fit: Forecasts
34
0
10
20
30
40
50
60
70
80
Edinbu
rgh
Glasgo
w
Birming
ham
Man
ches
ter
Luto
n
Stanste
d
Gatwick
Heath
row
2013
term
inal
pas
seng
ers
(milli
ons)
Actual Model
Table 2.6: Actual compared with modelled passengers (millions) in 2013 at larger UK airports and the foreign hubs
Airport Actual Fitted Difference
Heathrow 72.3 71.9 -0.5
Gatwick 35.2 37.0 1.8
Stansted 17.7 17.9 0.2
Luton 9.7 10.6 0.9
London City 3.3 4.0 0.7
London subtotal 138.3 141.5 3.2
Manchester 20.5 20.5 0.0
Birmingham 9.0 7.9 -1.1
Glasgow 7.2 6.2 -1.0
Edinburgh 9.7 9.0 -0.7
Bristol 6.1 5.8 -0.3
Newcastle 4.4 4.2 -0.2
Belfast International 4.0 4.3 0.2
Liverpool 3.9 5.7 1.8
East Midlands 4.3 3.9 -0.4
Other airports in model 16.9 18.0 1.1
UK total 224.4 226.8 2.5
Other non-modelled airports 1.7
National total 226.0
* Data source: CAA (2013)
Model updates
35
0
100
200
300
400
500
Edinbu
rgh
Glasgo
w
Birming
ham
Man
ches
ter
Luto
n
Stanste
d
Gatwick
Heath
row
2013
ATM
s (0
00)
Actual Model
Table 2.7: Actual compared with modelled ATMs (thousands) in 2013 at larger UK airports and the foreign hubs
Airport Actual Fitted Difference
Heathrow 470 477 7.7
Gatwick 241 284 42.5
Stansted 131 138 7.4
Luton 71 82 11.8
London City 65 74 8.4
London subtotal 978 1,055 77.8
Manchester 158 167 8.3
Birmingham 83 84 0.3
Glasgow 64 63 -0.6
Edinburgh 98 98 -0.0
Bristol 53 56 3.3
Newcastle 43 46 3.4
Belfast International 37 46 9.4
Liverpool 29 46 16.9
East Midlands 56 52 -4.1
Other airports in model 232 361 129.3
UK total 1,830 2,074 244.0
Other non-modelled airports 56
National total 1,887
* Data source: CAA (2013)
Strategic Fit: Forecasts
36
2.62 In 2013 ATMs are over-forecast at Gatwick and this also leads to a 1.8m passenger over-
forecast evident in Table 2.6. The effect of this over-forecast is to bring forward the year
Gatwick’s congestion shadow costs bite as capacity is reached rather than any material
difference in Gatwick forecasts once capacity is reached. Passengers are over-forecast at
Luton in 2013 by 9% and there is a 17% over-forecast of ATMs which results in modelled
aircraft loads of 128 compared to an actual of 137. Further growth 2011-2013 has been
modelled at Luton whereas the actual traffic has been largely static. Luton interacts closely
with Stansted (almost double Luton’s size) and here the model performance in 2013 is
more satisfactory. The over-forecast at Liverpool following the decline is reflected in the
ATM forecasts where the modelling did not pick up a 30% decline in ATMs 2011-2013.
2.63 A recent innovation of the Commission’s modelling has been the allocation of international-
to-international transfer passengers between the seven hubs where the model permits
such transfers to take place: Heathrow, Gatwick, Manchester, Paris CDG, Amsterdam
Schiphol, Frankfurt International and Dubai. Given the latest work for the Commission by
PwC to produce a new logit model for these transfer passengers (see paragraphs 2.45-
2.46) a detailed calibration exercise has been repeated to adjust the allocation of such
movements. This has been followed by a hub transfer validation exercise to check that
route level transfers taking place at the modelled hubs reflect reality. Table 2.8
demonstrates a good match between modelled and observed data in 2011. The
goodness of fit statistic (r2) reports the fit of the modelled inter-continental matrices
compared to observed movements based on IATA ticket data.
2.64 Between 2011 and 2013 there has been significant change in the level of interlining at
Heathrow and particularly Dubai. Although the detailed route level calibration is made for
2011, the overall fit for the new patterns in 2013 (where an estimate of the actual number
of transfers and the OD matrix is possible) has been checked. Table 2.8 shows that to a
large extent the latest version of the model has captured changes at Heathrow and Dubai.
Table 2.8: Goodness of fit of inter-continental traffic at hub airports
mppa 2011 Modelled Actual Matrix Fit (r2)
Heathrow 18.5 18.6 0.990
Amsterdam 13.1 13.1 0.996
Paris CDG 16.5 16.3 0.992
Frankfurt 26.3 26.7 0.993
Dubai 17.8 17.4 0.979
mppa 2013 Modelled Actual Matrix Fit (r2)Heathrow 22.4 21.3 0.984
Amsterdam 13.3
Paris CDG 16.5
Frankfurt 26.3
Dubai 23.1 22.8 0.981
Model updates
37
Impact of including HS2 in the demand model
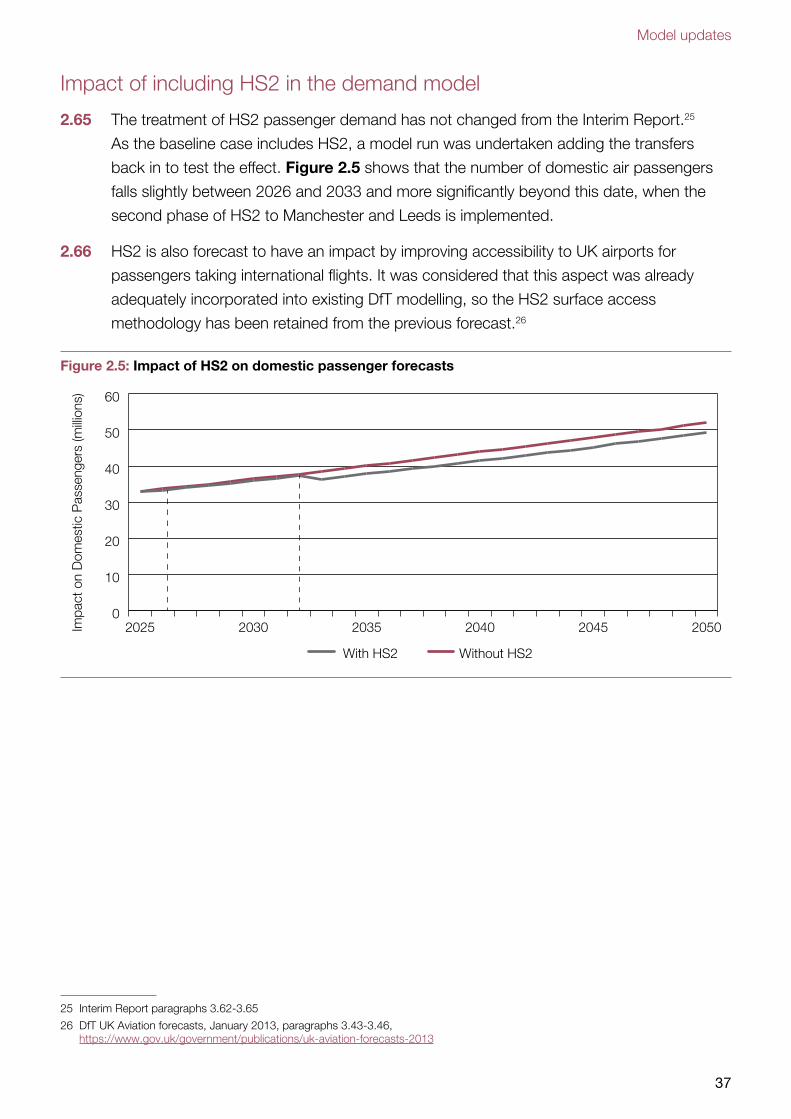
2.65 The treatment of HS2 passenger demand has not changed from the Interim Report.25
As the baseline case includes HS2, a model run was undertaken adding the transfers
back in to test the effect. Figure 2.5 shows that the number of domestic air passengers
falls slightly between 2026 and 2033 and more significantly beyond this date, when the
second phase of HS2 to Manchester and Leeds is implemented.
2.66 HS2 is also forecast to have an impact by improving accessibility to UK airports for
passengers taking international flights. It was considered that this aspect was already
adequately incorporated into existing DfT modelling, so the HS2 surface access
methodology has been retained from the previous forecast.26
Figure 2.5: Impact of HS2 on domestic passenger forecasts
0
10
20
30
40
50
60
205020452040203520302025Impa
ct o
n D
omes
tic P
asse
nger
s (m
illion
s)
With HS2 Without HS2
25 Interim Report paragraphs 3.62-3.65
26 DfT UK Aviation forecasts, January 2013, paragraphs 3.43-3.46, https://www.gov.uk/government/publications/uk-aviation-forecasts-2013
Strategic Fit: Forecasts
38
3. Input assumptions
3.1 Historically, the two main input drivers of aviation demand have been economic activity
and air fares. As such, projections of these drivers are required to generate passenger
demand forecasts.
3.2 Forecasts of future economic activity are based on projections of UK and foreign GDP,
UK consumer expenditure and trade. Forecasts of air fares are based on projections of
the fare drivers which include oil prices, fuel efficiency, rates of Air Passenger Duty (APD),
carbon prices and other non-fuel costs.
3.3 It is anticipated that the aviation market will “mature”, becoming progressively less
responsive to changes in its key drivers. Therefore the passenger demand forecasts also
include some judgement-based assumptions to reflect different levels of market maturity.
3.4 There is inherent uncertainty in projecting any of these variables into the future. To reflect
this, the Airports Commission has produced forecasts of demand under five global
economic scenarios:
●● assessment of need
●● global growth
●● relative decline of Europe
●● low-cost is king
●● global fragmentation
3.5 The assessment of need scenario repeats the input assumptions from the Interim Report
forecasts, updated to take account of new data. The four global scenarios build on those
introduced in the Interim Report, particularly on the economic input variations to the
assessment of need scenario. Some of the input assumptions are transformed based on
judgment. Many of the NAPAM inputs introduce airline behaviour in response to changes
in capacity into the modelling.
3.6 This chapter describes the input assumptions that have been adopted under all five
economic scenarios, noting how they differ from those presented in the Airports
Commission’s Interim Report. The assessment of need inputs described below are all
adopted in all other scenarios, unless specifically qualified in the description of a
scenario’s inputs.
Input assumptions
39
Assessment of need
3.7 This scenario uses consistent input assumptions to the forecasts published in the Interim
Report. Where possible, the inputs are sourced from the Office for Budgetary
Responsibility, OECD and IMF. However some inputs remain judgment-based, such as
those reflecting market maturity.
3.8 This scenario includes a high and low range, which is based on a probability assessment.
The range represents a 60% confidence interval, and is informed by historic variation in the
main input drivers of demand. This section describes the inputs used in the probability
assessment, along with the option-specific assumptions that have been developed since
the Interim Report.
Summary of updated economic input assumptions
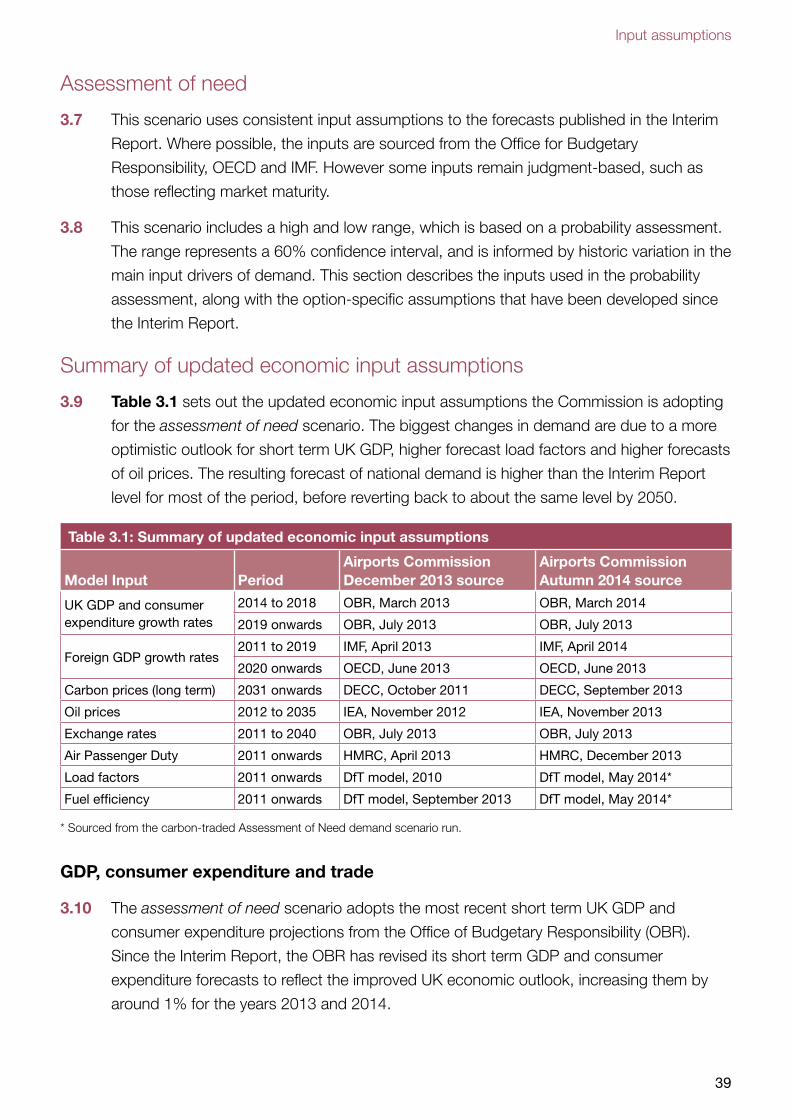
3.9 Table 3.1 sets out the updated economic input assumptions the Commission is adopting
for the assessment of need scenario. The biggest changes in demand are due to a more
optimistic outlook for short term UK GDP, higher forecast load factors and higher forecasts
of oil prices. The resulting forecast of national demand is higher than the Interim Report
level for most of the period, before reverting back to about the same level by 2050.
Table 3.1: Summary of updated economic input assumptions
Model Input PeriodAirports Commission December 2013 source
Airports Commission Autumn 2014 source
UK GDP and consumer expenditure growth rates
2014 to 2018 OBR, March 2013 OBR, March 2014
2019 onwards OBR, July 2013 OBR, July 2013
Foreign GDP growth rates2011 to 2019 IMF, April 2013 IMF, April 2014
2020 onwards OECD, June 2013 OECD, June 2013
Carbon prices (long term) 2031 onwards DECC, October 2011 DECC, September 2013
Oil prices 2012 to 2035 IEA, November 2012 IEA, November 2013
Exchange rates 2011 to 2040 OBR, July 2013 OBR, July 2013
Air Passenger Duty 2011 onwards HMRC, April 2013 HMRC, December 2013
Load factors 2011 onwards DfT model, 2010 DfT model, May 2014*
Fuel efficiency 2011 onwards DfT model, September 2013 DfT model, May 2014*
* Sourced from the carbon-traded Assessment of Need demand scenario run.
GDP, consumer expenditure and trade
3.10 The assessment of need scenario adopts the most recent short term UK GDP and
consumer expenditure projections from the Office of Budgetary Responsibility (OBR).
Since the Interim Report, the OBR has revised its short term GDP and consumer
expenditure forecasts to reflect the improved UK economic outlook, increasing them by
around 1% for the years 2013 and 2014.
Strategic Fit: Forecasts
40
3.11 The long term UK GDP forecasts are unchanged, and continue to be based on the
projections published by the OBR in July 2013.
3.12 The assessment of need scenario adopts the most recent short term foreign GDP growth
rates from the IMF.27 Since the Interim Report, the IMF has revised their short term GDP
growth forecasts for the two dominant regional blocks, Western Europe and OECD to be
slightly lower. Long term foreign GDP growth rates are unchanged, and continue to be
sourced from the OECD Economic Outlook No 93.28
3.13 Based on an assessment of the historic relationship between trade and GDP growth rates,
and in line with the Interim Report forecasts, it is assumed that trade with Western Europe
and other OECD members grows at the same rate as the local GDP of those regions. Trade
with NICs and LDCs grows at the same rate as UK GDP. This reflects internal DfT research
which identified these historic relationships between visible trade and GDP by region.
Oil prices
3.14 The assessment of need scenario adopts oil price projections from the IEA, published in
2013. Since the Interim Report inputs were derived, the IEA has revised its projection of oil
prices upwards. The price per barrel in the year 2035 has increased to $121 compared to
$114 in the Interim Report.29
3.15 The projections continue to be taken from the ‘New Policies Scenario’, which takes
account of broad policy commitments and plans that have been announced. This includes
national pledges to reduce greenhouse-gas emissions and the G20 commitment to phase
out fossil-fuel subsidies, even if the specific measures to implement these commitments
have yet to be identified or announced. The IEA forecast is extrapolated by applying the
average growth rate between 2030 and 2035 to the rest of the forecast period.
Carbon prices
3.16 The assessment of need scenario includes forecasts under two carbon policy cases;
carbon-traded and carbon capped. The carbon-traded case assumes that carbon is
traded at a price equal to DECC’s central long run forecast of carbon prices for appraisal
(September 2013 version).30 A sensitivity has also been completed adopting DECC’s high
long run forecast of carbon prices. The carbon capped case assumes that carbon is
capped to the 2005 level. It is implemented by raising the price of carbon until UK
departing aircraft CO2 emissions fall to 37.5Mt in 2050. Assumptions regarding the carbon
cases are described in detail in Chapter 4.
27 http://www.imf.org/external/ns/cs.aspx?id=29 28 http://stats.oecd.org/index.aspx?DataSetCode=EO93_INTERNET 29 In real 2008 prices
30 https://www.gov.uk/government/uploads/system/uploads/attachment_data/file/360323/20141001_Supporting_Tables_for_DECC-HMT_Supplementary_Appraisal_Guidance.xlsx These are in practice the DECC 2012 published values.
Input assumptions
41
Market maturity
3.17 As in the Interim Report, the assessment of need scenario continues to adopt a series of
assumptions about the extent to which the response of air travel demand to additional
income could decline in the future. In the absence of quantified evidence, these forecasts
are drawn on qualitative evidence provided by the University of Westminster to generate
judgment-based adjustments to reflect market maturity. The approach is described in
detail by the DfT in the January 2013 forecasts.31
Air Passenger Duty
3.18 The treatment of Air Passenger Duty (APD) has been changed since the Interim Report,
following the announcement in the 2014 Budget that the number of Air Passenger Duty
bands will be reduced from four to two in April 2015. The highest long-haul bands C and
D, will be merged into the lowest long-haul charge, Band B. So overall long-haul APD is
reduced from the Interim Report. APD rates are sourced from HMRC.32
3.19 The inputs to all scenarios have been updated to reflect the change in policy, but as
modelled demand is calculated by calendar year, they have been assumed to come into
force from the start of 2016.
Local demand growth at the foreign hubs
3.20 The inclusion of overseas hubs as modelled airports in NAPAM requires a forecast how
local demand at these airports will change in the future.
3.21 The assessment of need scenario continues to adopt the Interim Report assumption that
demand at overseas European hubs, excluding international transfer passengers, grows at
the same rate as total UK unconstrained demand.
3.22 In the Interim Report, local passenger demand at Dubai airport was assumed to grow at
the same rate as demand to and from Newly Industrialised Countries (NICs) from UK
airports – a faster rate than the European hubs. However between 2003 and 2012,
passenger growth at Dubai has significantly exceeded the European hubs, at 12% per
annum on average. To reflect this, the assessment of need scenario adopts a local
demand growth rate of 12% in the years 2012 and 2013, which is linearly phased into the
NIC growth rate over five years.
31 DfT UK Aviation forecasts, January 2013 particularly Chapter 3 and Annex A, https://www.gov.uk/government/publications/uk-aviation-forecasts-2013
32 https://www.gov.uk/government/publications/rates-and-allowances-excise-duty-air-passenger-duty
Strategic Fit: Forecasts
42
Other demand inputs
3.23 The scenarios adopt short term exchange rates from the OBR’s economic and fiscal
outlook.33 Beyond this date, they continue to be held constant at the 2013 level.
3.24 Fuel efficiency and load factor changes over time continue to be determined by the
outputs of NAPAM. Both of these inputs have been updated to adopt outputs from the
most recent version of NAPAM.
3.25 Biofuels are assumed to account for 0.5 per cent of fuel on flights using UK airports by
2030, rising to 2.5 per cent by 2050.
3.26 The price elasticity of demand for international-to-international interliners was reviewed
as part of the improvements to demand suppression being made to NAPAM (see
Chapter 2), and has been changed to -0.5, from -0.2. The new value is the weighted
average price elasticity of all foreign passengers in NAPDM.
Monte Carlo low-high range
3.27 As described in paragraph 2.34 in the previous chapter, the assessment of need scenario
continues to include a confidence range of 60%, based on Monte Carlo analysis. Beyond
the minor methodological changes described in Chapter 2, no changes in the underlying
sources have been made since the Interim Report.
Global growth
3.28 This scenario sees higher passenger demand from all world regions, coupled with lower
operating costs and the alternative cases of a global carbon cap and a global emissions
trading scheme.
3.29 GDP growth is increased relative to the assessment of need scenario by 2% points per
annum for newly industrialised (NIC) and developing countries (LDC), and 0.5% for Europe,
the OECD and the UK up to 2050. This is coupled with an increase in trade in line with
GDP for all world zones.
3.30 The role of hubs is enhanced, with a rise in international-to-international transfer passenger
demand of 1% per annum cumulatively. Meanwhile, airlines enjoy cheaper operating costs
with the price of oil set at the ‘450 scenario’, the lowest of the scenarios published by IEA.
Both carbon-traded and carbon capped policy cases are modelled.
3.31 With the Gatwick Airport Second Runway (LGW 2R), this scenario involves an airline
alliance, modelled as SkyTeam, moving both its short-haul and long-haul services from
Heathrow to Gatwick when the second runway opens. This is represented by an increase
in flight frequencies equivalent to that alliance’s operations at Heathrow being applied at
33 http://budgetresponsibility.org.uk/category/topics/economic-forecasts/
Input assumptions
43
Gatwick in 2025. The Heathrow frequencies are ‘seeded’ at Gatwick. Seeding is the
process whereby for specified years ATMs user input frequencies are used rather than
being calculated within the model in response to demand and then being tested for
viability. Domestic services at Gatwick are also bolstered to provide SkyTeam with feeder
services by seeding to the maximum value between the domestic ATMs calculated by the
model for 2025 and frequencies in the validation year of 2011. In both cases the frequency
seeds at Gatwick were applied for 2025-2028.
3.32 The frequencies at Heathrow are not altered, representing an assumption that other
carriers fill the SkyTeam slots. Otherwise no extra airport specific assumptions are
assumed for the Heathrow Airport North West Runway (LHR NWR) and Heathrow Airport
Extended Northern Runway (LHR ENR) capacity options.
Relative decline of Europe
3.33 This scenario sees higher growth of passenger demand in emerging economies, a
strengthened position of Far and Middle Eastern aviation hubs and airlines, and the
alternate cases of a global carbon cap and a global emissions trading scheme.
3.34 GDP growth is increased relative to the assessment of need scenario by 2% points per
annum in NIC and LDC. This is coupled with an equivalent increase in trade between the
UK and these regions. It is assumed that Heathrow, Frankfurt and Paris CDG become
progressively less attractive to interliners than the Middle-Eastern hubs and revert their
focus to the European market. In this process of consolidation, it is assumed that
Amsterdam Schiphol successfully gains a share of transfer traffic from the other European
hubs. In this, as in all scenarios, Dubai can in effect be viewed as a proxy for all developing
Middle-Eastern hubs. The change was modelled by increasing ‘hub penalties’ at the
European airports excluding Amsterdam and halving the calibrated penalty at Dubai.
3.35 In the Heathrow Airport North West Runway and Heathrow Airport Extended Northern
Runway options, this scenario involves one of the large Middle-Eastern or Asian carriers
purchasing a controlling equity stake in British Airways (BA) parent company IAG. This results
in Heathrow feeder services to the Dubai hub being increased, while direct services to
destinations beyond Dubai (the Indian sub-continent, the Far East and Australasia) decline,
with BA long-haul services focusing on the Americas and Africa. This change was effected
by ‘de-seeding’ the BA share of frequencies to destinations east of Dubai and moving those
frequencies as seeds to the Americas and Africa zones (2026-2028). Domestic feeder
services are strengthened by seeding them (2026-2028) to restore them to their 2011 level if
they have subsequently been modelled as declining from that level with rising shadow costs.
Overall the route network offered by Heathrow contracts, resulting in a greater reliance on
the origin and destination market. Consequently, low-cost carriers are ‘unbanned’ from
Heathrow from 2026 onwards and some LCC services prove viable when the runway
capacity is increased.
Strategic Fit: Forecasts
44
3.36 In the Gatwick Airport Second Runway option, this scenario involves a Middle-Eastern
airline purchasing a controlling equity stake in LCCs at Gatwick to provide feeder traffic for
the parent airline’s long-haul operations. To allow this effect to be represented in the
model, all LCC passengers at Gatwick are re-classified as scheduled in 2025, enabling
them to make all possible transfers and act as a feeder traffic to long-haul (and short-haul)
operations. This is supported in the modelling with an increase in services between
Gatwick and Dubai. The proportion of Heathrow frequencies to the model’s Middle
East zone which were Emirates flights to Dubai in the base year were calculated (15%).
This proportion was then applied to Heathrow’s 2025 modelled Middle East services and
the calculated service frequencies representing Emirates were used at Gatwick for
2025-2028. The Gatwick seeded frequencies were not removed from Heathrow.
Low-cost is king
3.37 This scenario sees the LCC model expanding into new markets, which could include
long-haul. It also sees higher passenger demand from all world regions, lower operating
costs, and the alternative cases of a global carbon cap and a global emissions trading
scheme.
3.38 The baseline assumptions, including those about economic growth, across all of the
options are the same as for the global growth. In the Heathrow Airport North West
Runway and Heathrow Airport Extended Northern Runway options, low-cost airlines are
allowed to operate at Heathrow when the new runway capacity is provided and there is a
strengthening of domestic services back to 2011 levels to allow low-cost airlines to
provide domestic-international transfer traffic. Domestic feeder services are strengthened
by seeding them (2026-2028) to restore them to their 2011 level if they have subsequently
been modelled as declining from that level with rising shadow costs.
3.39 In the Gatwick Airport Second Runway option, the new capacity is assumed to result in a
significant improvement in the viability of long-haul services at Gatwick. It gains a third of
the long-haul services operating at Heathrow at the time the new runway opens (Heathrow
services are unaltered). This is effected through seeding Gatwick with 33% of Heathrow’s
modelled 2025 long-haul baseline frequencies for the seeding period 2025-2028. The
seeded frequencies are not removed at Heathrow. There is an associated improvement in
Gatwick’s attractiveness to transfer passengers and its ‘hub penalty’ relative to the other
modelled hubs is reduced between 2025 and 2040. LCC passengers at Gatwick are
re-classified as scheduled in 2025, enabling them also to act as a feeder traffic for
transfers. Domestic services are also significantly improved (by seeding 2025-2028 to be
the equivalent to 33% of those at Heathrow in the ‘Do Minimum’ baseline) to better feed
the expanded long-haul operations. Interchange penalties for passengers transferring at
Gatwick are halved from the calibrated baseline levels.
Input assumptions
45
Global fragmentation
3.40 This scenario sees a reversal of globalisation trends as economies close themselves off
by adopting more interventionist national policy models. As a result, there is a decline in
passenger demand from all world regions, coupled with higher operating costs for airlines
and the UK introducing a stand-alone carbon price, or stand-alone carbon cap as no
global carbon agreement is reached.
3.41 Across all of the options, it is assumed that the UK experiences GDP growth consistent
with the bottom end of the OBR forecast range, which is on average 1.6% GDP growth
throughout the period. GDP growth for all other countries is lower by 1% point per annum
and there is a fall in trade in line with GDP for all world zones. International-to-international
transfer traffic falls back to 2011 levels by 2040 and there is a decline in the attractiveness
of all hub airports to UK originating transfer passengers. Meanwhile, airlines face higher
operating costs with the price of oil set at the ‘new policies scenario’ the highest of the
scenarios published by IEA. Both the carbon-traded and carbon capped cases are
modelled such that only UK passengers pay a carbon price in each.
3.42 In the Gatwick Second Runway option, the new capacity is assumed to be accompanied
by Gatwick discontinuing thinner routes with insufficient load factors and yields. This is
modelled by increasing the volume of demand needed to make a route viable. No further
changes are made under the Heathrow Airport North West Runway or Heathrow Airport
Extended Northern Runway options.
Baseline airport capacities
3.43 Table 3.2 gives the assumed capacities for the baseline capacity used to constrain
demand to airports. These capacities are in line with those used in the Interim Report
which in turn were in line with the last DfT forecasts.34 It is assumed that:
●● no new runways are built in the UK;
●● extra capacity included in planning applications or published masterplans is constructed;
●● terminal capacity is increased incrementally to service additional runway capacity where
there is no planning constraint; and,
●● depending on location, runways are subject to up to 13 per cent capacity gain through
operational and technological improvements.
34 DfT UK Aviation forecasts, January 2013, pp 56- 57, https://www.gov.uk/government/publications/uk-aviation-forecasts-2013
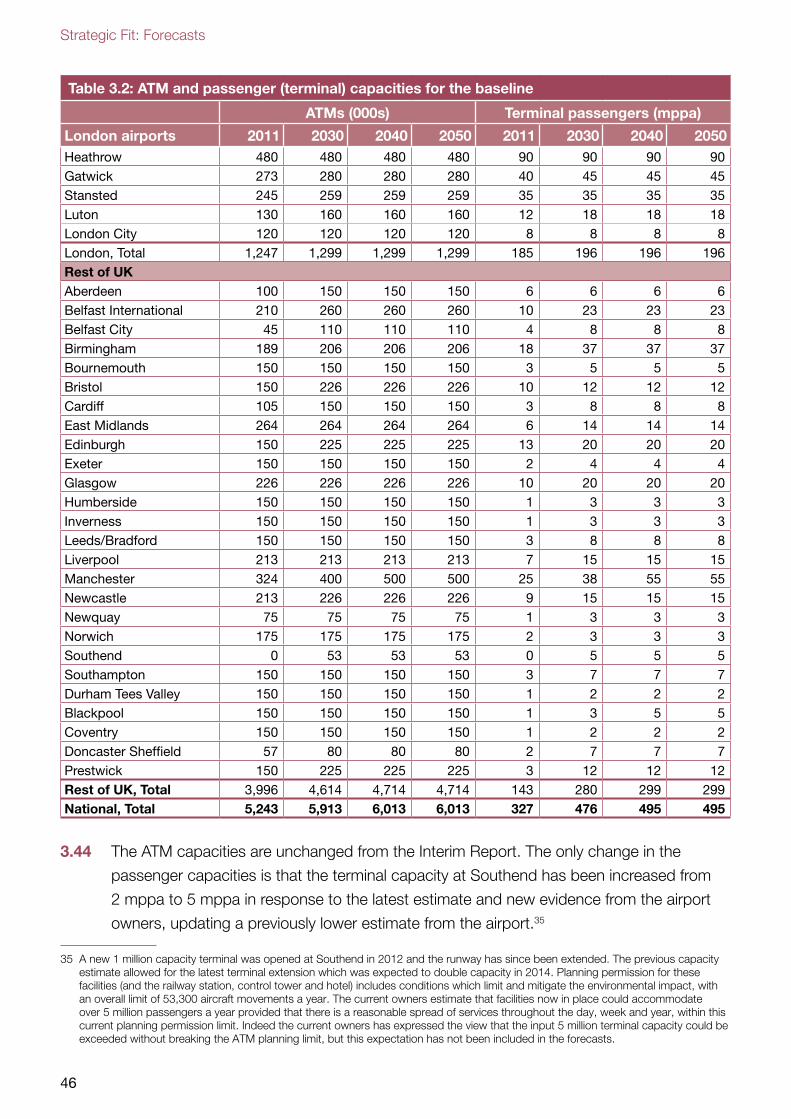
Strategic Fit: Forecasts
46
Table 3.2: ATM and passenger (terminal) capacities for the baseline
ATMs (000s) Terminal passengers (mppa)
London airports 2011 2030 2040 2050 2011 2030 2040 2050Heathrow 480 480 480 480 90 90 90 90Gatwick 273 280 280 280 40 45 45 45Stansted 245 259 259 259 35 35 35 35Luton 130 160 160 160 12 18 18 18London City 120 120 120 120 8 8 8 8London, Total 1,247 1,299 1,299 1,299 185 196 196 196Rest of UKAberdeen 100 150 150 150 6 6 6 6Belfast International 210 260 260 260 10 23 23 23Belfast City 45 110 110 110 4 8 8 8Birmingham 189 206 206 206 18 37 37 37Bournemouth 150 150 150 150 3 5 5 5Bristol 150 226 226 226 10 12 12 12Cardiff 105 150 150 150 3 8 8 8East Midlands 264 264 264 264 6 14 14 14Edinburgh 150 225 225 225 13 20 20 20Exeter 150 150 150 150 2 4 4 4Glasgow 226 226 226 226 10 20 20 20Humberside 150 150 150 150 1 3 3 3Inverness 150 150 150 150 1 3 3 3Leeds/Bradford 150 150 150 150 3 8 8 8Liverpool 213 213 213 213 7 15 15 15Manchester 324 400 500 500 25 38 55 55Newcastle 213 226 226 226 9 15 15 15Newquay 75 75 75 75 1 3 3 3Norwich 175 175 175 175 2 3 3 3Southend 0 53 53 53 0 5 5 5Southampton 150 150 150 150 3 7 7 7Durham Tees Valley 150 150 150 150 1 2 2 2Blackpool 150 150 150 150 1 3 5 5Coventry 150 150 150 150 1 2 2 2Doncaster Sheffield 57 80 80 80 2 7 7 7Prestwick 150 225 225 225 3 12 12 12Rest of UK, Total 3,996 4,614 4,714 4,714 143 280 299 299National, Total 5,243 5,913 6,013 6,013 327 476 495 495
3.44 The ATM capacities are unchanged from the Interim Report. The only change in the
passenger capacities is that the terminal capacity at Southend has been increased from
2 mppa to 5 mppa in response to the latest estimate and new evidence from the airport
owners, updating a previously lower estimate from the airport.35
35 A new 1 million capacity terminal was opened at Southend in 2012 and the runway has since been extended. The previous capacity estimate allowed for the latest terminal extension which was expected to double capacity in 2014. Planning permission for these facilities (and the railway station, control tower and hotel) includes conditions which limit and mitigate the environmental impact, with an overall limit of 53,300 aircraft movements a year. The current owners estimate that facilities now in place could accommodate over 5 million passengers a year provided that there is a reasonable spread of services throughout the day, week and year, within this current planning permission limit. Indeed the current owners has expressed the view that the input 5 million terminal capacity could be exceeded without breaking the ATM planning limit, but this expectation has not been included in the forecasts.
Input assumptions
47
3.45 The capacities of the foreign hubs included in the model are also unchanged from the
Interim Report.
Baseline surface access
3.46 The allocation of passengers with a journey end in mainland UK to airports uses travel time
and costs between each zone and each airport, based on models of future road and rail
network and conditions. The surface access information is sourced from the DfT’s National
Airport Accessibility Model (NAAM2) introduced in Chapter 2.
3.47 NAAM2 is used to generate future inter-peak road and rail surface access costs from all
the UK districts to all modelled airports. This process should not be confused with the
assessment of the surface access impacts of the airport options themselves. These
impacts are addressed elsewhere in the appraisal, primarily in the Surface Access module.
3.48 Future base airport access costs take account of major planned future surface transport
infrastructure:
●● all committed major motorway and A-road schemes in the Highways Agency Roads
Programme (assumed to be in place by 2020);
●● Crossrail, Thameslink, Heathrow Western Rail Access and all larger programmed public
transport improvements (assumed to be in place by 2020);
●● High Speed 2 (HS2) from 2026 and with extension north of Birmingham from 2033
onwards taken from the Government’s decision on the HS2 route published in
January 2012.36
3.49 Future network assumptions are taken only for baseline modelling purposes. Rail service
patterns and highway designs associated with these schemes are indicative. The opening
dates of schemes are uncertain and are simplified for modelling purposes. All surface
access schemes introduced after the model base year (2008) and prior to HS2 are
assumed to be in place by 2020, which may in some cases be unrealistic. But this does
not affect the aviation modelling results.
3.50 Baseline future year rail schemes have been sourced primarily from the DfT’s Network
Modelling Framework (NMF), and the PLANET Long Distance Model (PLD) used by High
Speed Two (HS2) Ltd to model the demand impacts of the HS2 project. They are based
primarily on committed schemes. The rail scheme assumptions are similar to those
described in HS2 Ltd’s publication, The Economic Case For HS2 PFM v4.3,37 although
some airport specific schemes, notably Western Rail Access to Heathrow, have been
updated.
36 High Speed Rail: Investing in Britain’s Future – Decisions and Next Steps, HS2 Ltd, January 2012
37 Available at http://assets.hs2.org.uk/sites/default/files/inserts/SA%2020_PFM%20assumptions%20report_V3_0.pdf. See, in particular chapters 5 and 6.
Strategic Fit: Forecasts
48
3.51 Lists of all the major rail and highway schemes included in the NAAM2 network used to
derive future airport surface access costs are given in Appendix 2.
Airport development options
3.52 Airport usage forecasts are provided for the three additional capacity options:
1. LGW 2R Gatwick Airport Second Runway of over 3,000m to the south of the existing
airport and capable of independent operation, doubling the potential airport capacity
from 280,000 to 560,000 ATMs per annum from 2025.
2. LHR NWR Heathrow Airport North West Runway capable of independent operation
adds a potential 260,000 ATMs increasing the airport capacity from 480,000 to
740,000 ATMs per annum from 2026.
3. LHR ENR Heathrow Airport Extended Northern Runway of 3,000m, in line with the
existing northern runway and permitting mixed mode operations. This adds a potential
220,000 ATMs, increasing the airport capacity from 480,000 to 700,000 ATMs per
annum from 2026.
3.53 In each option where new runway capacity is provided (i.e. those reported in Chapter 6)
terminal capacity is assumed to be unconstrained as runway capacity is typically the
binding constraint. Terminals are therefore assumed to expand to meet the number of
passengers demanding use of the runway. This means that in some scenarios the stated
passenger throughput is higher than the stated passenger capacity assessed in the
Operational Efficiency module. Where there are large discrepancies there could be
implications for the scheme design and cost of terminal facilities. However, it is noted in
the Operational Efficiency module that the airport operator would be expected to increase
terminal capacity to meet demand.
3.54 In the baseline the capacities are those shown in Table 3.2 and terminal capacities are
applied at Gatwick and Heathrow.
3.55 A number of surface access schemes are assumed to be introduced alongside airport
capacity changes, and so vary depending on the option – these are described in detail in
the Surface Access module. The rail schemes assumed are listed in Table A2.3 of
Appendix 2. At the strategic level, it is assumed that highway works associated with the
options are essentially local, serving to maintain baseline levels of accessibility to the
airports. Therefore no new option road schemes over and above those included in the
baseline as set out in Table A2.2 of Appendix 2
CO2 Modelling
49
4. CO2 Modelling
CO2 emission targets
4.1 Two types of carbon scenario (carbon cases) have been modelled. The carbon-traded
cases assume that aviation participates in an emissions trading system, and so ‘net’ CO2
costs are included in fares. An increase in the ‘gross’ CO2 emissions from flights covered
by the system would therefore not increase the net global CO2 emissions as compensatory
offsets from elsewhere would have been purchased under the scheme. So under trading
it is assumed that there would be no cap on the gross level of UK departing aviation
emissions.
4.2 Carbon prices are based on the recommended traded values provided by DECC for use in
policy appraisals, and it is assumed that the CO2 emissions from flights to and from the UK
would be covered by the EU ETS until at least 2030 and traded as part of a global carbon
market beyond then.38 Variations on these carbon price assumptions have been included
in the sensitivity tests reported in Chapter 7.
4.3 The Climate Change Act 2008 set a target for total UK greenhouse gas emissions to be
reduced by 80 per cent by 2050, relative to a 1990 baseline. Analysis by the Committee
on Climate Change (CCC) of how this can be achieved shows that CO2 emissions from
UK aviation in 2050 should be at or below 2005 levels. This is the carbon capped case
adopted by the Commission. When modelling the carbon capped cases, UK departing
flights’ emissions are thus limited to the 2005 level of 37.5MtCO2 in 2050.39
4.4 The targeted emissions level is met through supplementing the DECC price of traded
carbon already included in the traded carbon case in air fares in the passenger demand
model, NAPDM.40 This does not represent a new forecast of carbon prices, but is simply
the value required, in the assumed absence of any other mechanism, to achieve the target
of no more than 37.5MtCO2 from aircraft departing UK airports in 2050. The carbon price
adjustment only aims at hitting the emissions target in 2050, as achieving the target earlier
would require further transitions of the fleet and operational practices beyond those
38 This is in line with the Aviation EU ETS scope for 2013 to 2020 under the existing UK Regulations. However, under an EU Regulation which was adopted in April 2014, it was agreed that the Aviation EU ETS will only cover emissions from flights between two European Economic Area (EEA) aerodromes between 1 January 2013 and 31 December 2016; and it expected that the existing UK Regulations will be amended to implement the new EU Regulation in UK law by the end of 2014. In addition, a review will be undertaken by the European Commission in 2016 to consider whether the scope of the Aviation EU ETS should be amended from 2017 onwards based on progress towards a global market based measure (GMBM) at the International Civil Aviation Organisation (ICAO) Assembly in 2016. More details can be found at https://www.gov.uk/government/consultations/aviation-eu-emissions-trading-system-eu-ets
39 Committee on Climate Change, Meeting the UK aviation target – options for reducing emissions to 2050, 2009, http://www.theccc.org.uk/reports/aviation-report
40 https://www.gov.uk/government/uploads/system/uploads/attachment_data/file/360323/20141001_Supporting_Tables_for_DECC-HMT_Supplementary_Appraisal_Guidance.xlsx These are in practice the DECC 2012 published values.
Strategic Fit: Forecasts
50
included in the baseline. It therefore follows that in all cases emissions can be expected to
exceed 37.5MtCO2 at some point prior to 2050.41
4.5 Carbon capping only through carbon pricing is a simplifying assumption and in many
respects unrealistic in future policy terms. In reality, policy might focus on other areas of
the economy where carbon abatement costs would be lower than these modelled levels
for aviation. It is also likely that with such high carbon prices the drive for further
technological improvement in aircraft fuel efficiency would be greater than those already
built into the modelling inputs.
4.6 Analysis by the CCC and the DfT has demonstrated that this target could be achieved by
mechanisms other than the carbon price.42 In addition to the effect of controlling UK
airport capacity, this analysis assessed the effectiveness and costs and benefits of levers
such as:
●● mandatory CO2 standards for aircraft;
●● further investment in fuel efficiency and the modernisation of the fleet beyond that in the
base assumptions;
●● changing operational practices (e.g. further air traffic management measures, or flying
at different altitudes and velocities);
●● encouraging a greater uptake of biofuels; and,
●● limiting demand through effecting behavioural change in the public.
4.7 As with the Commission’s scenarios, the objective is not to identify a single ‘correct’
forecast, but rather to understand the varying effects on aviation demand of constraining
and pricing carbon emissions. In effect the two worlds set out above represent a range of
possible ways in which aviation in the UK may contribute to achieving stabilisation of the
global climate.
4.8 At one end of the range the capped approach sees that happen within the UK economy.
This takes a static view of what the relative effort between sectors should be, assuming no
flexibility or interactivity to promote economic efficiency or reflect society’s changing views
of the value of aviation relative to other sectors. It is set with reference to the 37.5MTCO2e
planning assumption the CCC recommends as a proxy until such time as a long term
global climate agreement is reached. This planning assumption has been developed with a
view of what the relative effort of sectors should be, based on what is known now – and
thus reflects the CCC’s concern that should aviation grow to 37.5MtCO2e, the implied
41 See DfT UK Aviation forecasts, January 2013, Chapter 3, paragraphs 3.54-3.68, https://www.gov.uk/government/publications/uk-aviation-forecasts-2013.
42 Committee on Climate Change, Meeting the UK aviation target – options for reducing emissions to 2050, 2009, http://www.theccc.org.uk/reports/aviation-report http://www.theccc.org.uk/reports/aviation-report and EMRC & AEA, A marginal abatement cost curve model for the UK aviation sector, August 2011 http://assets.dft.gov.uk/publications/response-ccc-report/mac-report.pdf
CO2 Modelling
51
near 85% reduction in the CO2e emissions of other sectors may be at the limit of what is
feasible. As the CCC notes it is a limit that should be kept under review, to allow for policy
changes and new information about technology and abatement in different sectors.
4.9 The other end of the range assumes action to tackle emissions from this international
industry seeks the most globally economic efficient approach without reference to national
boundaries or other concerns that characterise current international negotiations. The
future will almost certainly lie between these two points, for example the agreement to
inclusion of aviation emissions in the EU emissions trading system, but also the adverse
international reactions to its full implementation.
4.10 Detailed descriptions of how passenger demand and ATM forecasts are converted into
CO2 emissions forecasts are given in the last published DfT forecasts.43 These forecasts
also outline how the UK passenger aircraft fleet evolves over the forecast period and give
baseline assumptions for the fuel efficiency of new aircraft, operational practices, biofuel
uptake and behavioural change. These base assumptions, which reflected the work of the
CCC in 2009, have been retained for the Commission’s CO2 forecasting.
Carbon-traded and carbon capped
4.11 The process for determining carbon-traded and carbon capped demand forecasts are
unchanged from that described in the Interim Report.44 In the carbon-traded case, carbon
prices are based on the recommended traded values provided by DECC for use in policy
appraisals. As described above, is assumed that the CO2 emissions from flights to and
from the UK would be covered by the EU ETS until at least 2030 and covered by a global
carbon market beyond then.
4.12 In the carbon capped case, the target emissions level (37.5Mt CO2 in 2050 from departing
flights) is assumed to be met solely by increasing fares and reducing demand until the
carbon cap is met. This is implemented by increasing the carbon price over and above
that assumed in the carbon-traded case. It is assumed, consistent with a global carbon
trading scheme, that all airports including overseas hubs face, the same carbon price.45
4.13 Figure 4.1 shows that in the assessment of need scenario for the baseline of no additional
capacity the price of CO2e46 would have to rise from the DECC central value of £36/tonne
to £62/tonne in 2030 and from £196/tonne to £334/tonne in 2050 in order to limit UK
departing emissions to 37.5Mt of CO2e in 2050.
43 See DfT UK Aviation forecasts, January 2013, Chapter 3.
44 See, in particular, section 5 of Appendix 3.
45 Except for demand scenario global fragmentation.
46 Multiply these figures by 44/12 to convert to carbon price units.
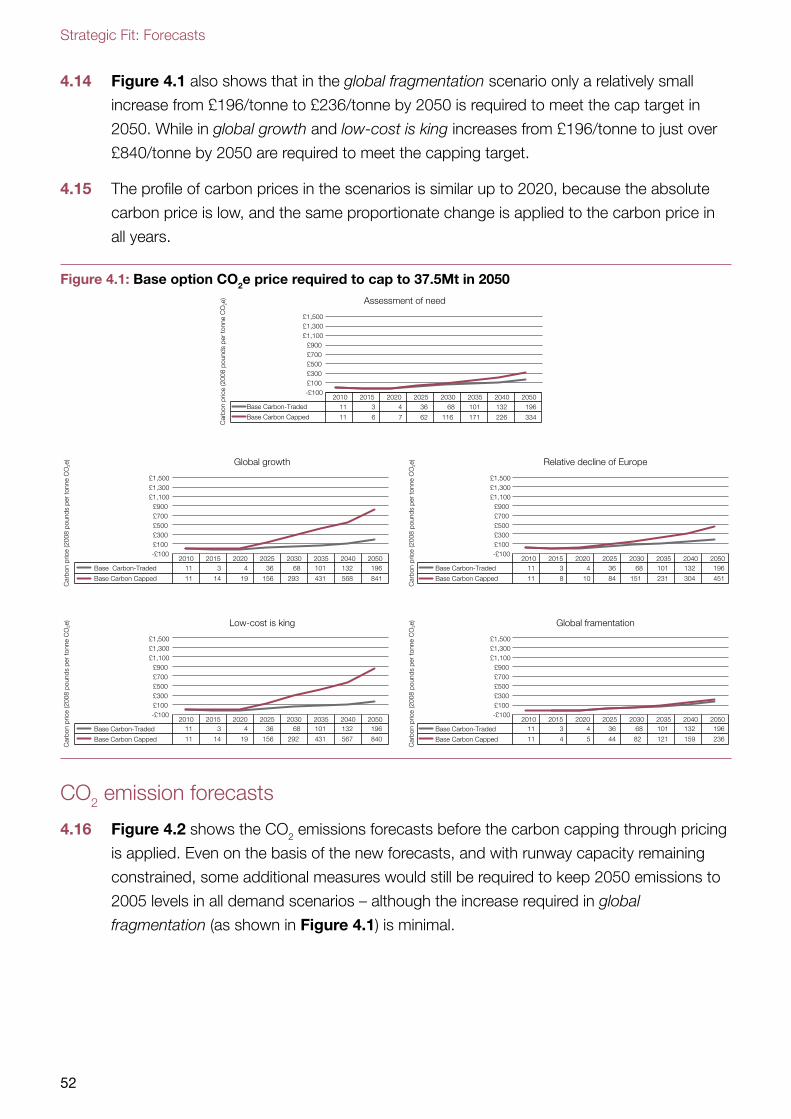
Strategic Fit: Forecasts
52
4.14 Figure 4.1 also shows that in the global fragmentation scenario only a relatively small
increase from £196/tonne to £236/tonne by 2050 is required to meet the cap target in
2050. While in global growth and low-cost is king increases from £196/tonne to just over
£840/tonne by 2050 are required to meet the capping target.
4.15 The profile of carbon prices in the scenarios is similar up to 2020, because the absolute
carbon price is low, and the same proportionate change is applied to the carbon price in
all years.
Figure 4.1: Base option CO2e price required to cap to 37.5Mt in 2050
11 3 4 36 68 101 132 196
11 14 19 156 293 431 568 841
11 3 4 36 68 101 132 196
11 8 10 84 151 231 304 451
11 3 4 36 68 101 132 196
11 14 19 156 292 431 567 840
11 3 4 36 68 101 132 196
11 4 5 44 82 121 159 236
11 3 4 36 68 101 132 196
11 6 7 62 116 171 226 334
2010 2015 2020 2025 2030 2035 2040 2050Base Carbon-Traded
Base Carbon Capped
-£100£100£300£500£700£900
£1,100£1,300£1,500
Car
bon
pric
e (2
008
poun
ds p
er to
nne
CO
2e)
2010 2015 2020 2025 2030 2035 2040 2050Base Carbon-Traded
Base Carbon Capped
-£100£100£300£500£700£900
£1,100£1,300£1,500
Car
bon
pric
e (2
008
poun
ds p
er to
nne
CO
2e)
2010 2015 2020 2025 2030 2035 2040 2050Base Carbon-Traded
Base Carbon Capped
-£100£100£300£500£700£900
£1,100£1,300£1,500
Car
bon
pric
e (2
008
poun
ds p
er to
nne
CO
2e)
2010 2015 2020 2025 2030 2035 2040 2050Base Carbon-Traded
Base Carbon Capped
-£100£100£300£500£700£900
£1,100£1,300£1,500
Car
bon
pric
e (2
008
poun
ds p
er to
nne
CO
2e)
2010 2015 2020 2025 2030 2035 2040 2050Base Carbon-Traded
Base Carbon Capped
-£100£100£300£500£700£900
£1,100£1,300£1,500
Car
bon
pric
e (2
008
poun
ds p
er to
nne
CO
2e)
Assessment of need
Global growth Relative decline of Europe
Low-cost is king Global framentation
CO2 emission forecasts
4.16 Figure 4.2 shows the CO2 emissions forecasts before the carbon capping through pricing
is applied. Even on the basis of the new forecasts, and with runway capacity remaining
constrained, some additional measures would still be required to keep 2050 emissions to
2005 levels in all demand scenarios – although the increase required in global
fragmentation (as shown in Figure 4.1) is minimal.
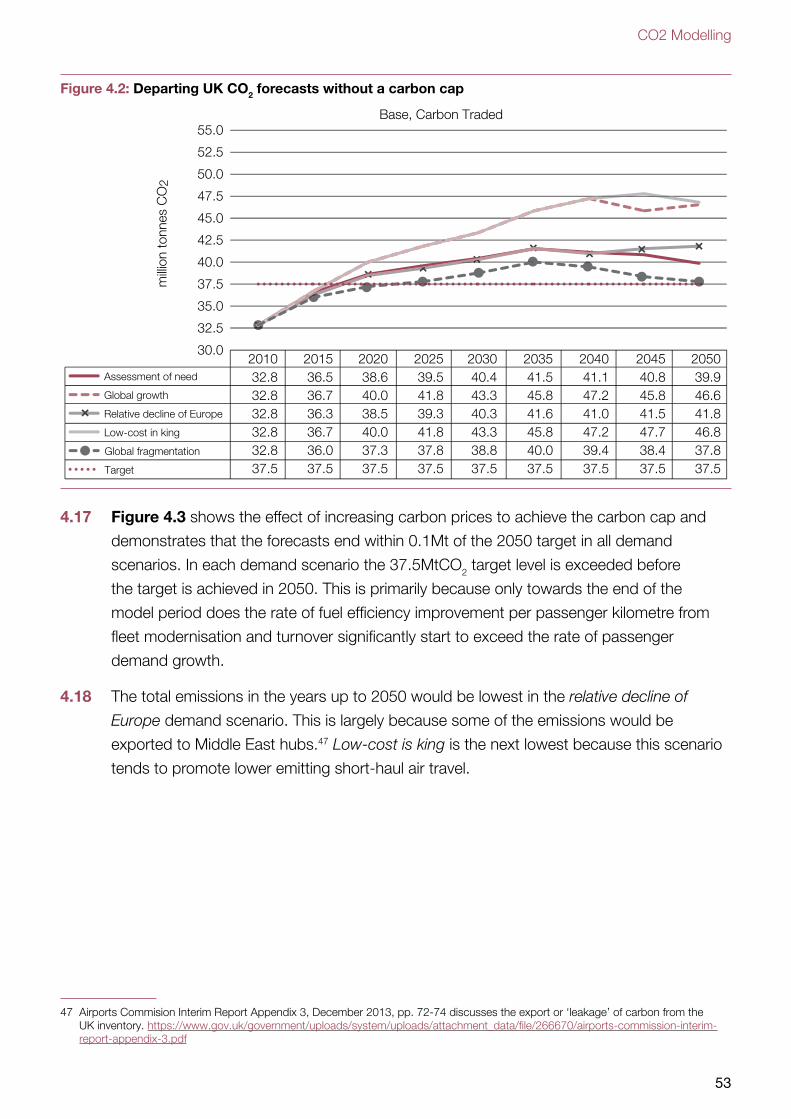
CO2 Modelling
53
Figure 4.2: Departing UK CO2 forecasts without a carbon cap
Assessment of need
Global growth
Relative decline of Europe
Low-cost in king
Global fragmentation
Target
30.0
32.5
35.0
37.5
40.0
42.5
45.0
47.5
50.0
52.5
55.0
milli
on to
nnes
CO
2
Base, Carbon Traded
2010 2015 2020 2025 2030 2035 2040 2045 2050 32.8 36.5 38.6 39.5 40.4 41.5 41.1 40.8 39.9 32.8 36.7 40.0 41.8 43.3 45.8 47.2 45.8 46.6 32.8 36.3 38.5 39.3 40.3 41.6 41.0 41.5 41.8 32.8 36.7 40.0 41.8 43.3 45.8 47.2 47.7 46.8 32.8 36.0 37.3 37.8 38.8 40.0 39.4 38.4 37.8 37.5 37.5 37.5 37.5 37.5 37.5 37.5 37.5 37.5
4.17 Figure 4.3 shows the effect of increasing carbon prices to achieve the carbon cap and
demonstrates that the forecasts end within 0.1Mt of the 2050 target in all demand
scenarios. In each demand scenario the 37.5MtCO2 target level is exceeded before
the target is achieved in 2050. This is primarily because only towards the end of the
model period does the rate of fuel efficiency improvement per passenger kilometre from
fleet modernisation and turnover significantly start to exceed the rate of passenger
demand growth.
4.18 The total emissions in the years up to 2050 would be lowest in the relative decline of
Europe demand scenario. This is largely because some of the emissions would be
exported to Middle East hubs.47 Low-cost is king is the next lowest because this scenario
tends to promote lower emitting short-haul air travel.
47 Airports Commision Interim Report Appendix 3, December 2013, pp. 72-74 discusses the export or ‘leakage’ of carbon from the UK inventory. https://www.gov.uk/government/uploads/system/uploads/attachment_data/file/266670/airports-commission-interim-report-appendix-3.pdf
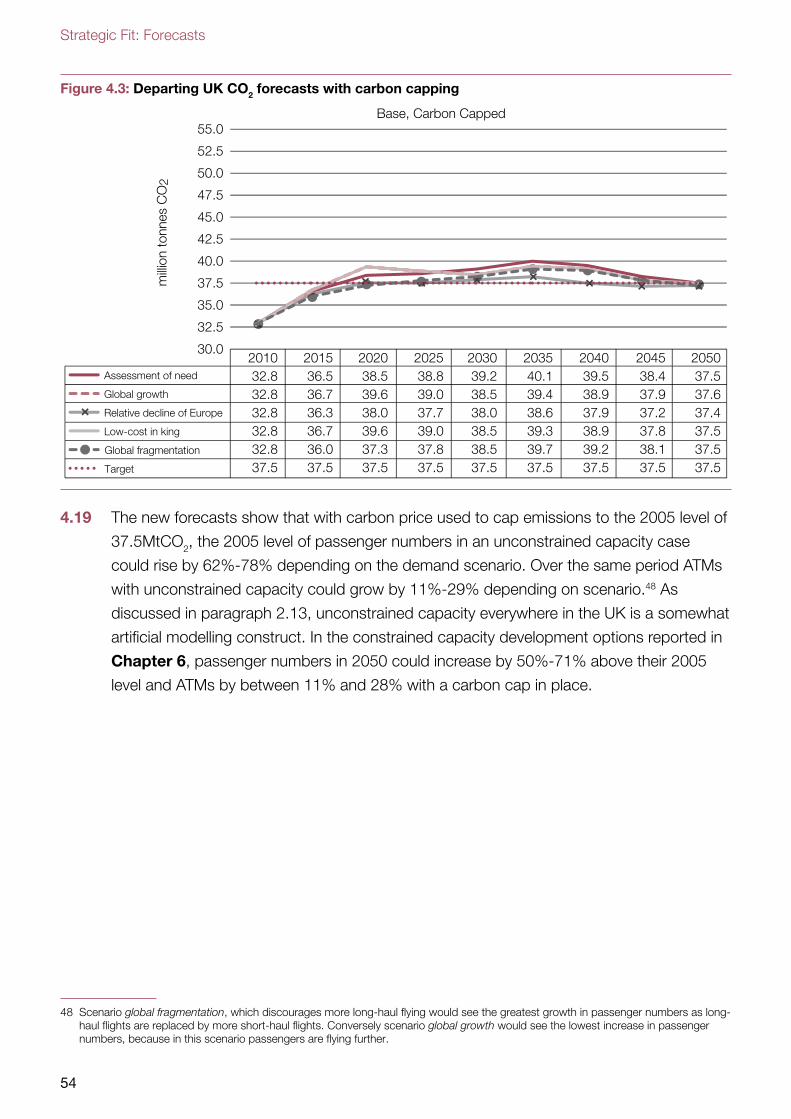
Strategic Fit: Forecasts
54
Figure 4.3: Departing UK CO2 forecasts with carbon capping
Assessment of need
Global growth
Relative decline of Europe
Low-cost in king
Global fragmentation
Target
30.0
32.5
35.0
37.5
40.0
42.5
45.0
47.5
50.0
52.5
55.0
milli
on to
nnes
CO
2
Base, Carbon Capped
2010 2015 2020 2025 2030 2035 2040 2045 2050 32.8 36.5 38.5 38.8 39.2 40.1 39.5 38.4 37.5 32.8 36.7 39.6 39.0 38.5 39.4 38.9 37.9 37.6 32.8 36.3 38.0 37.7 38.0 38.6 37.9 37.2 37.4 32.8 36.7 39.6 39.0 38.5 39.3 38.9 37.8 37.5 32.8 36.0 37.3 37.8 38.5 39.7 39.2 38.1 37.5 37.5 37.5 37.5 37.5 37.5 37.5 37.5 37.5 37.5
4.19 The new forecasts show that with carbon price used to cap emissions to the 2005 level of
37.5MtCO2, the 2005 level of passenger numbers in an unconstrained capacity case
could rise by 62%-78% depending on the demand scenario. Over the same period ATMs
with unconstrained capacity could grow by 11%-29% depending on scenario.48 As
discussed in paragraph 2.13, unconstrained capacity everywhere in the UK is a somewhat
artificial modelling construct. In the constrained capacity development options reported in
Chapter 6, passenger numbers in 2050 could increase by 50%-71% above their 2005
level and ATMs by between 11% and 28% with a carbon cap in place.
48 Scenario global fragmentation, which discourages more long-haul flying would see the greatest growth in passenger numbers as long-haul flights are replaced by more short-haul flights. Conversely scenario global growth would see the lowest increase in passenger numbers, because in this scenario passengers are flying further.
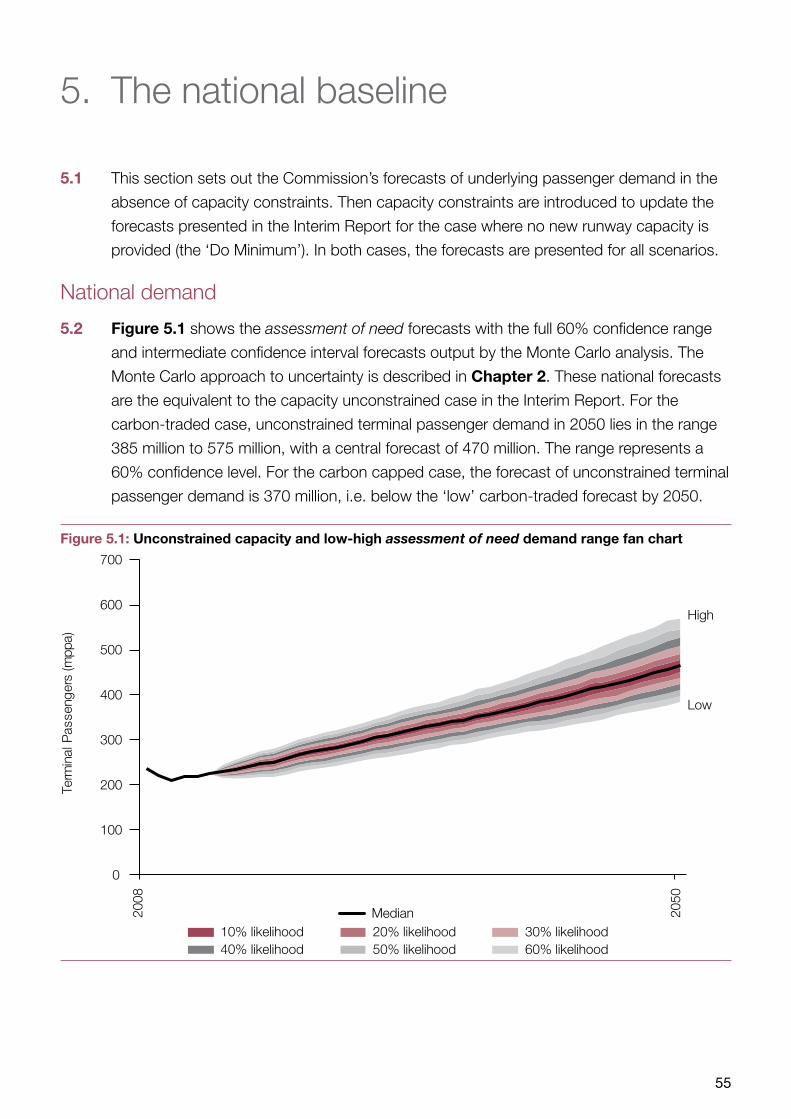
The national baseline
55
5. The national baseline
5.1 This section sets out the Commission’s forecasts of underlying passenger demand in the
absence of capacity constraints. Then capacity constraints are introduced to update the
forecasts presented in the Interim Report for the case where no new runway capacity is
provided (the ‘Do Minimum’). In both cases, the forecasts are presented for all scenarios.
National demand
5.2 Figure 5.1 shows the assessment of need forecasts with the full 60% confidence range
and intermediate confidence interval forecasts output by the Monte Carlo analysis. The
Monte Carlo approach to uncertainty is described in Chapter 2. These national forecasts
are the equivalent to the capacity unconstrained case in the Interim Report. For the
carbon-traded case, unconstrained terminal passenger demand in 2050 lies in the range
385 million to 575 million, with a central forecast of 470 million. The range represents a
60% confidence level. For the carbon capped case, the forecast of unconstrained terminal
passenger demand is 370 million, i.e. below the ‘low’ carbon-traded forecast by 2050.
Figure 5.1: Unconstrained capacity and low-high assessment of need demand range fan chart
0
100
200
300
400
500
600
700
2008
2050
Term
inal
Pas
seng
ers
(mpp
a)
10% likelihood 20% likelihood 30% likelihood40% likelihood 50% likelihood 60% likelihood
Median
High
Low
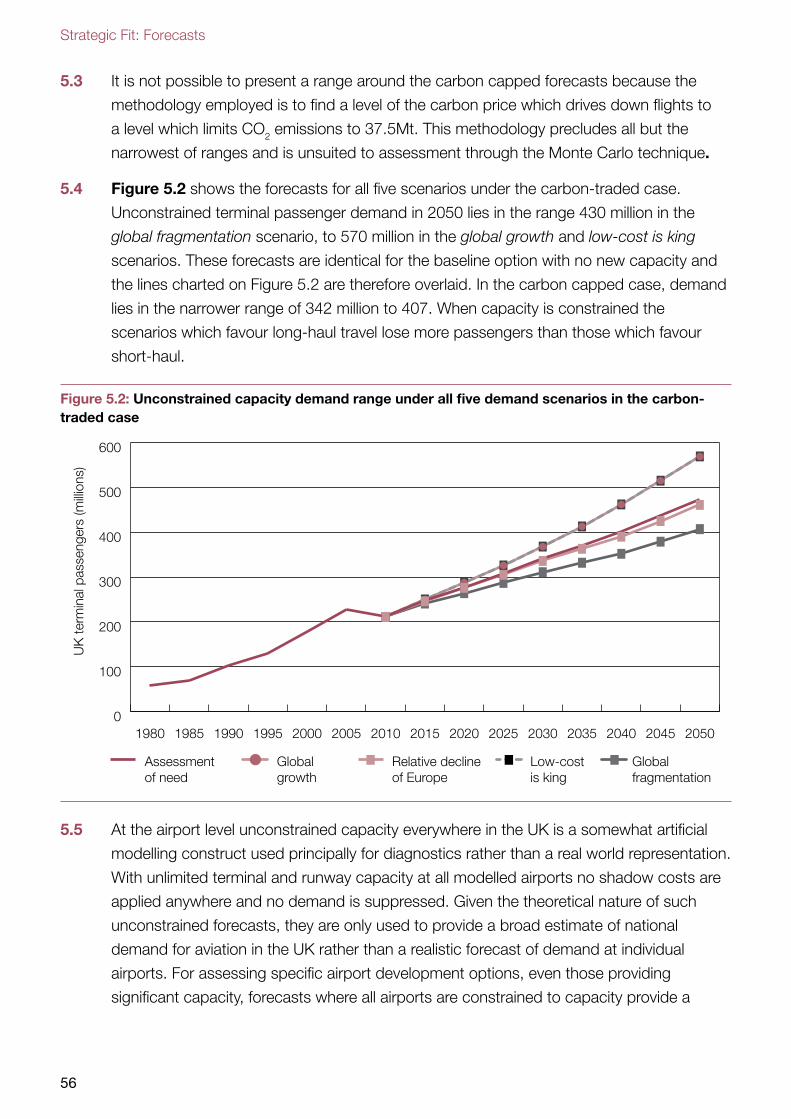
Strategic Fit: Forecasts
56
5.3 It is not possible to present a range around the carbon capped forecasts because the
methodology employed is to find a level of the carbon price which drives down flights to
a level which limits CO2 emissions to 37.5Mt. This methodology precludes all but the
narrowest of ranges and is unsuited to assessment through the Monte Carlo technique.
5.4 Figure 5.2 shows the forecasts for all five scenarios under the carbon-traded case.
Unconstrained terminal passenger demand in 2050 lies in the range 430 million in the
global fragmentation scenario, to 570 million in the global growth and low-cost is king
scenarios. These forecasts are identical for the baseline option with no new capacity and
the lines charted on Figure 5.2 are therefore overlaid. In the carbon capped case, demand
lies in the narrower range of 342 million to 407. When capacity is constrained the
scenarios which favour long-haul travel lose more passengers than those which favour
short-haul.
Figure 5.2: Unconstrained capacity demand range under all five demand scenarios in the carbon-traded case
0
100
200
300
400
500
600
205020452040203520302025202020152010200520001995199019851980
UK
term
inal
pas
seng
ers
(milli
ons)
Low-costis king
Globalfragmentation
Relative declineof Europe
Assessmentof need
Globalgrowth
5.5 At the airport level unconstrained capacity everywhere in the UK is a somewhat artificial
modelling construct used principally for diagnostics rather than a real world representation.
With unlimited terminal and runway capacity at all modelled airports no shadow costs are
applied anywhere and no demand is suppressed. Given the theoretical nature of such
unconstrained forecasts, they are only used to provide a broad estimate of national
demand for aviation in the UK rather than a realistic forecast of demand at individual
airports. For assessing specific airport development options, even those providing
significant capacity, forecasts where all airports are constrained to capacity provide a
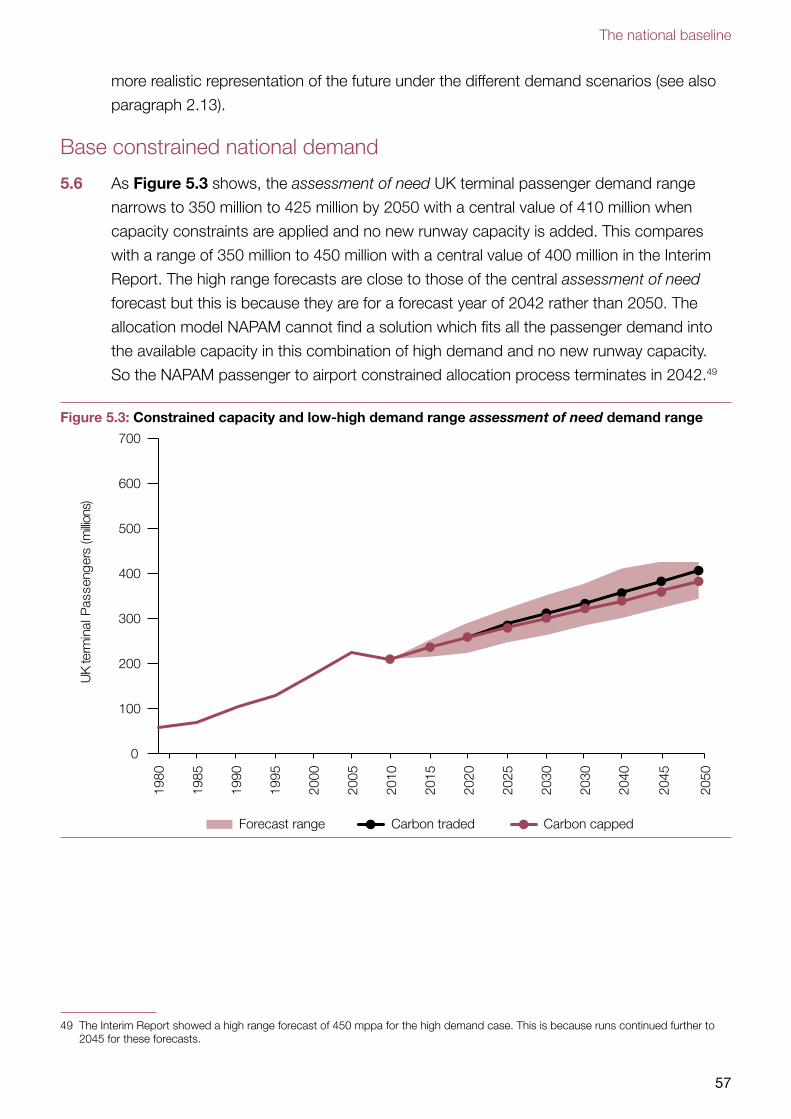
The national baseline
57
more realistic representation of the future under the different demand scenarios (see also
paragraph 2.13).
Base constrained national demand
5.6 As Figure 5.3 shows, the assessment of need UK terminal passenger demand range
narrows to 350 million to 425 million by 2050 with a central value of 410 million when
capacity constraints are applied and no new runway capacity is added. This compares
with a range of 350 million to 450 million with a central value of 400 million in the Interim
Report. The high range forecasts are close to those of the central assessment of need
forecast but this is because they are for a forecast year of 2042 rather than 2050. The
allocation model NAPAM cannot find a solution which fits all the passenger demand into
the available capacity in this combination of high demand and no new runway capacity.
So the NAPAM passenger to airport constrained allocation process terminates in 2042.49
Figure 5.3: Constrained capacity and low-high demand range assessment of need demand range
0
100
200
300
400
500
600
700
1980
1985
1990
1995
2000
2005
2010
2015
2020
2025
2030
2030
2040
2045
2050
UK
term
inal
Pas
seng
ers
(millio
ns)
Forecast range Carbon traded Carbon capped
49 The Interim Report showed a high range forecast of 450 mppa for the high demand case. This is because runs continued further to 2045 for these forecasts.
Strategic Fit: Forecasts
58
Baseline airport passenger demand forecasts with capacity timelines
5.7 Table 5.1 and Table 5.2 show airport forecasts for all five scenarios (carbon-traded and
carbon capped) for the base (‘maximum use of existing runways’) case where no capacity
is added. These forecasts are equivalent to the base forecasts in the Interim Report
except:
●● there have since been a number of relatively minor updates to the model described in
Chapter 2;
●● input parameters and some base capacities have been brought up to date as
described in Chapter 3; and,
●● there have been some updates to the scenarios introduced in Chapter 1 and
described further in Chapter 3.
5.8 Table 5.1 and Table 5.2 below show terminal passengers per annum for 2030, 2040
and 2050. The tables separately report the five London airports, the nine largest regional
airports and the four modelled overseas hubs. The remaining 17 UK airports (although
separately modelled) are grouped. The timelines show when runway capacity at the five
London airports is exhausted in red, with amber indicating less than 10% capacity
remaining.
5.9 The shadow cost state marked in red on the timeline could be triggered by a runway or
terminal constraint. In the case of Heathrow and Gatwick this will be a runway constraint
(as they have unlimited terminal capacity in the modelling). But Stansted, Luton and
London City can and do incur either a runway or terminal capacity shadow cost
depending on scenario and option. When airports incur terminal shadow costs they can
be shown as going straight from green to red in the timeline figures.
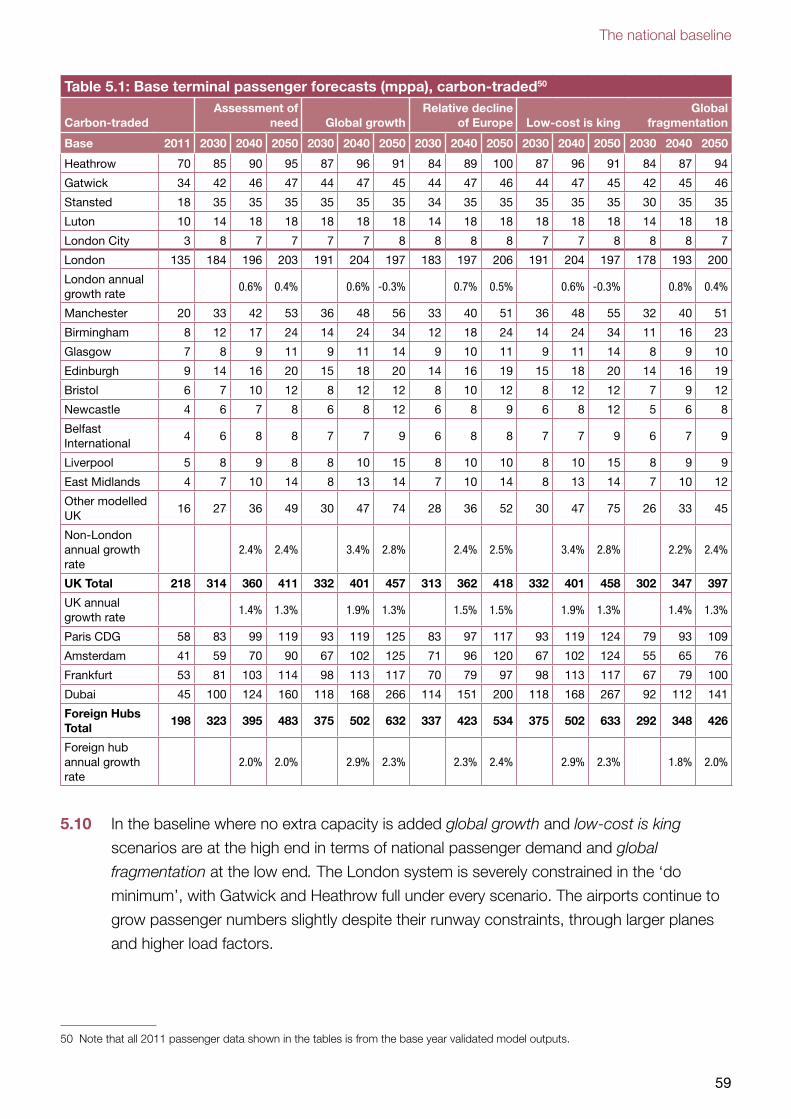
The national baseline
59
Table 5.1: Base terminal passenger forecasts (mppa), carbon-traded50
Carbon-tradedAssessment of
need Global growthRelative decline
of Europe Low-cost is kingGlobal
fragmentation
Base 2011 2030 2040 2050 2030 2040 2050 2030 2040 2050 2030 2040 2050 2030 2040 2050
Heathrow 70 85 90 95 87 96 91 84 89 100 87 96 91 84 87 94
Gatwick 34 42 46 47 44 47 45 44 47 46 44 47 45 42 45 46
Stansted 18 35 35 35 35 35 35 34 35 35 35 35 35 30 35 35
Luton 10 14 18 18 18 18 18 14 18 18 18 18 18 14 18 18
London City 3 8 7 7 7 7 8 8 8 8 7 7 8 8 8 7
London 135 184 196 203 191 204 197 183 197 206 191 204 197 178 193 200
London annual growth rate
0.6% 0.4% 0.6% -0.3% 0.7% 0.5% 0.6% -0.3% 0.8% 0.4%
Manchester 20 33 42 53 36 48 56 33 40 51 36 48 55 32 40 51
Birmingham 8 12 17 24 14 24 34 12 18 24 14 24 34 11 16 23
Glasgow 7 8 9 11 9 11 14 9 10 11 9 11 14 8 9 10
Edinburgh 9 14 16 20 15 18 20 14 16 19 15 18 20 14 16 19
Bristol 6 7 10 12 8 12 12 8 10 12 8 12 12 7 9 12
Newcastle 4 6 7 8 6 8 12 6 8 9 6 8 12 5 6 8
Belfast International
4 6 8 8 7 7 9 6 8 8 7 7 9 6 7 9
Liverpool 5 8 9 8 8 10 15 8 10 10 8 10 15 8 9 9
East Midlands 4 7 10 14 8 13 14 7 10 14 8 13 14 7 10 12
Other modelled UK
16 27 36 49 30 47 74 28 36 52 30 47 75 26 33 45
Non-London annual growth rate
2.4% 2.4% 3.4% 2.8% 2.4% 2.5% 3.4% 2.8% 2.2% 2.4%
UK Total 218 314 360 411 332 401 457 313 362 418 332 401 458 302 347 397
UK annual growth rate
1.4% 1.3% 1.9% 1.3% 1.5% 1.5% 1.9% 1.3% 1.4% 1.3%
Paris CDG 58 83 99 119 93 119 125 83 97 117 93 119 124 79 93 109
Amsterdam 41 59 70 90 67 102 125 71 96 120 67 102 124 55 65 76
Frankfurt 53 81 103 114 98 113 117 70 79 97 98 113 117 67 79 100
Dubai 45 100 124 160 118 168 266 114 151 200 118 168 267 92 112 141
Foreign Hubs Total
198 323 395 483 375 502 632 337 423 534 375 502 633 292 348 426
Foreign hub annual growth rate
2.0% 2.0% 2.9% 2.3% 2.3% 2.4% 2.9% 2.3% 1.8% 2.0%
5.10 In the baseline where no extra capacity is added global growth and low-cost is king
scenarios are at the high end in terms of national passenger demand and global
fragmentation at the low end. The London system is severely constrained in the ‘do
minimum’, with Gatwick and Heathrow full under every scenario. The airports continue to
grow passenger numbers slightly despite their runway constraints, through larger planes
and higher load factors.
50 Note that all 2011 passenger data shown in the tables is from the base year validated model outputs.
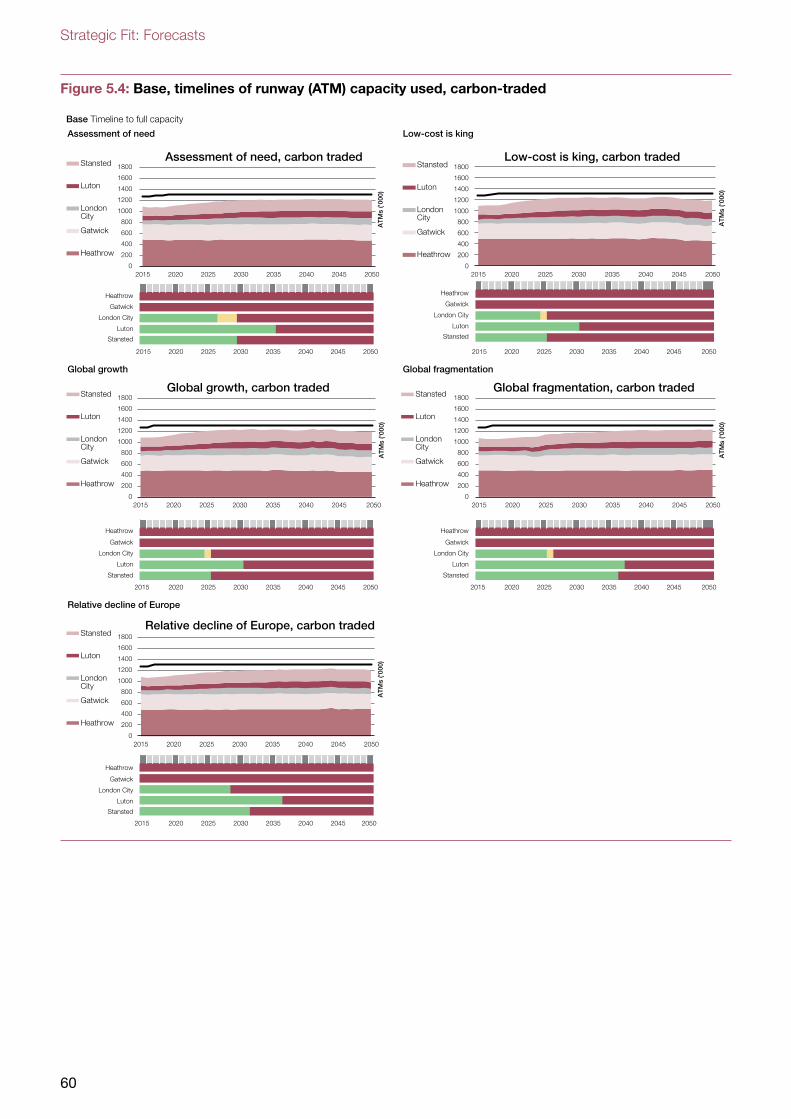
Strategic Fit: Forecasts
60
Figure 5.4: Base, timelines of runway (ATM) capacity used, carbon-traded
Base Timeline to full capacity
Assessment of need Low-cost is king
Heathrow Heathrow
Gatwick Gatwick
London City London City
Luton Luton
Stansted Stansted
Global growth Global fragmentation
Heathrow Heathrow
Gatwick Gatwick
London City London City
Luton Luton
Stansted Stansted
Relative decline of Europe
Heathrow
Gatwick
London City
Luton
Stansted
2015 2020 2025 2030 2035 2040 2045 2050
2020 2025 2030 2035 2040
2015
2015 2050
2015
2045
2020 2025 2030 2035 2040 2045 2050 2045 2050
2015 2050
2020 2025 2030 2035 2040
2040 20452020 2025 2030 2035
0
200
400
600
800
1000
1200
1400
1600
1800
2015 2020 2025 2030 2035 2040 2045 2050
AT
Ms
('000
)
Assessment of need, carbon tradedStansted
Luton
LondonCity
Gatwick
Heathrow
0
200
400
600
800
1000
1200
1400
1600
1800
2015 2020 2025 2030 2035 2040 2045 2050
AT
Ms
('000
)Global growth, carbon traded
Stansted
Luton
LondonCity
Gatwick
Heathrow
0
200
400
600
800
1000
1200
1400
1600
1800
2015 2020 2025 2030 2035 2040 2045 2050
AT
Ms
('000
)
Relative decline of Europe, carbon tradedStansted
Luton
LondonCity
Gatwick
Heathrow
0
200
400
600
800
1000
1200
1400
1600
1800
2015 2020 2025 2030 2035 2040 2045 2050
AT
Ms
('000
)
Low-cost is king, carbon tradedStansted
Luton
LondonCity
Gatwick
Heathrow
0
200
400
600
800
1000
1200
1400
1600
1800
2015 2020 2025 2030 2035 2040 2045 2050
AT
Ms
('000
)
Global fragmentation, carbon tradedStansted
Luton
LondonCity
Gatwick
Heathrow
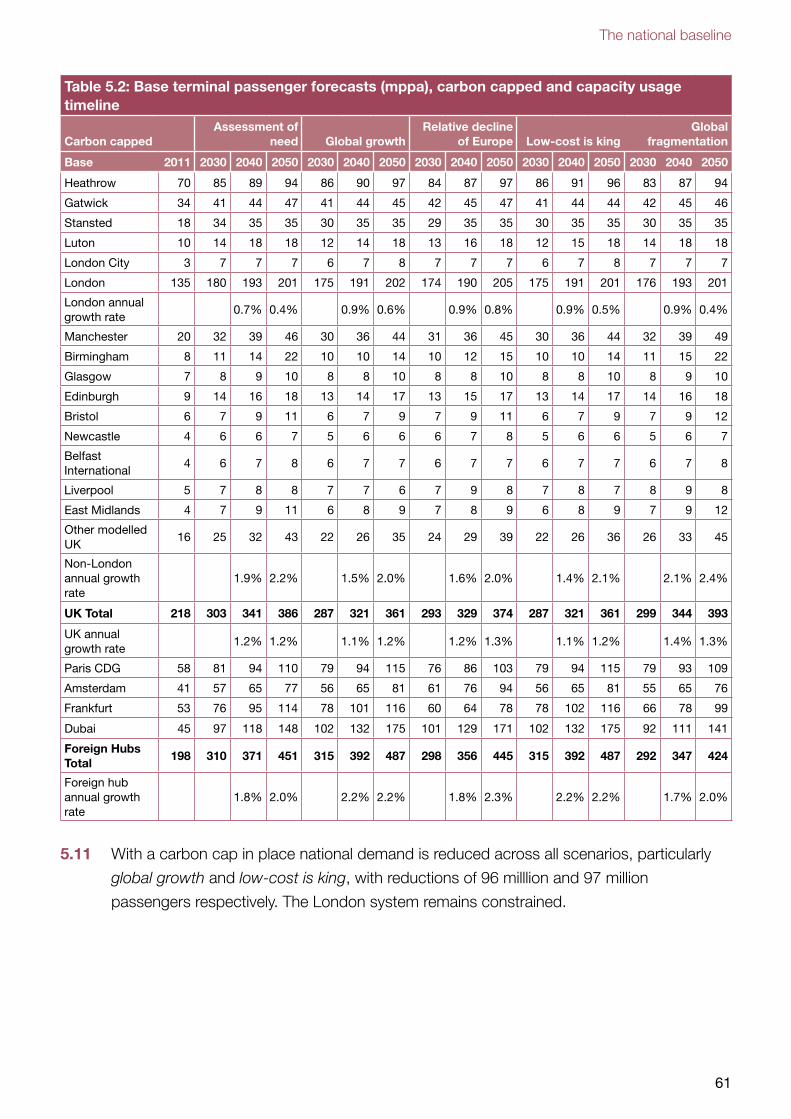
The national baseline
61
Table 5.2: Base terminal passenger forecasts (mppa), carbon capped and capacity usage timeline
Carbon cappedAssessment of
need Global growthRelative decline
of Europe Low-cost is kingGlobal
fragmentation
Base 2011 2030 2040 2050 2030 2040 2050 2030 2040 2050 2030 2040 2050 2030 2040 2050
Heathrow 70 85 89 94 86 90 97 84 87 97 86 91 96 83 87 94
Gatwick 34 41 44 47 41 44 45 42 45 47 41 44 44 42 45 46
Stansted 18 34 35 35 30 35 35 29 35 35 30 35 35 30 35 35
Luton 10 14 18 18 12 14 18 13 16 18 12 15 18 14 18 18
London City 3 7 7 7 6 7 8 7 7 7 6 7 8 7 7 7
London 135 180 193 201 175 191 202 174 190 205 175 191 201 176 193 201
London annual growth rate
0.7% 0.4% 0.9% 0.6% 0.9% 0.8% 0.9% 0.5% 0.9% 0.4%
Manchester 20 32 39 46 30 36 44 31 36 45 30 36 44 32 39 49
Birmingham 8 11 14 22 10 10 14 10 12 15 10 10 14 11 15 22
Glasgow 7 8 9 10 8 8 10 8 8 10 8 8 10 8 9 10
Edinburgh 9 14 16 18 13 14 17 13 15 17 13 14 17 14 16 18
Bristol 6 7 9 11 6 7 9 7 9 11 6 7 9 7 9 12
Newcastle 4 6 6 7 5 6 6 6 7 8 5 6 6 5 6 7
Belfast International
4 6 7 8 6 7 7 6 7 7 6 7 7 6 7 8
Liverpool 5 7 8 8 7 7 6 7 9 8 7 8 7 8 9 8
East Midlands 4 7 9 11 6 8 9 7 8 9 6 8 9 7 9 12
Other modelled UK
16 25 32 43 22 26 35 24 29 39 22 26 36 26 33 45
Non-London annual growth rate
1.9% 2.2% 1.5% 2.0% 1.6% 2.0% 1.4% 2.1% 2.1% 2.4%
UK Total 218 303 341 386 287 321 361 293 329 374 287 321 361 299 344 393
UK annual growth rate
1.2% 1.2% 1.1% 1.2% 1.2% 1.3% 1.1% 1.2% 1.4% 1.3%
Paris CDG 58 81 94 110 79 94 115 76 86 103 79 94 115 79 93 109
Amsterdam 41 57 65 77 56 65 81 61 76 94 56 65 81 55 65 76
Frankfurt 53 76 95 114 78 101 116 60 64 78 78 102 116 66 78 99
Dubai 45 97 118 148 102 132 175 101 129 171 102 132 175 92 111 141
Foreign Hubs Total
198 310 371 451 315 392 487 298 356 445 315 392 487 292 347 424
Foreign hub annual growth rate
1.8% 2.0% 2.2% 2.2% 1.8% 2.3% 2.2% 2.2% 1.7% 2.0%
5.11 With a carbon cap in place national demand is reduced across all scenarios, particularly
global growth and low-cost is king, with reductions of 96 milllion and 97 million
passengers respectively. The London system remains constrained.
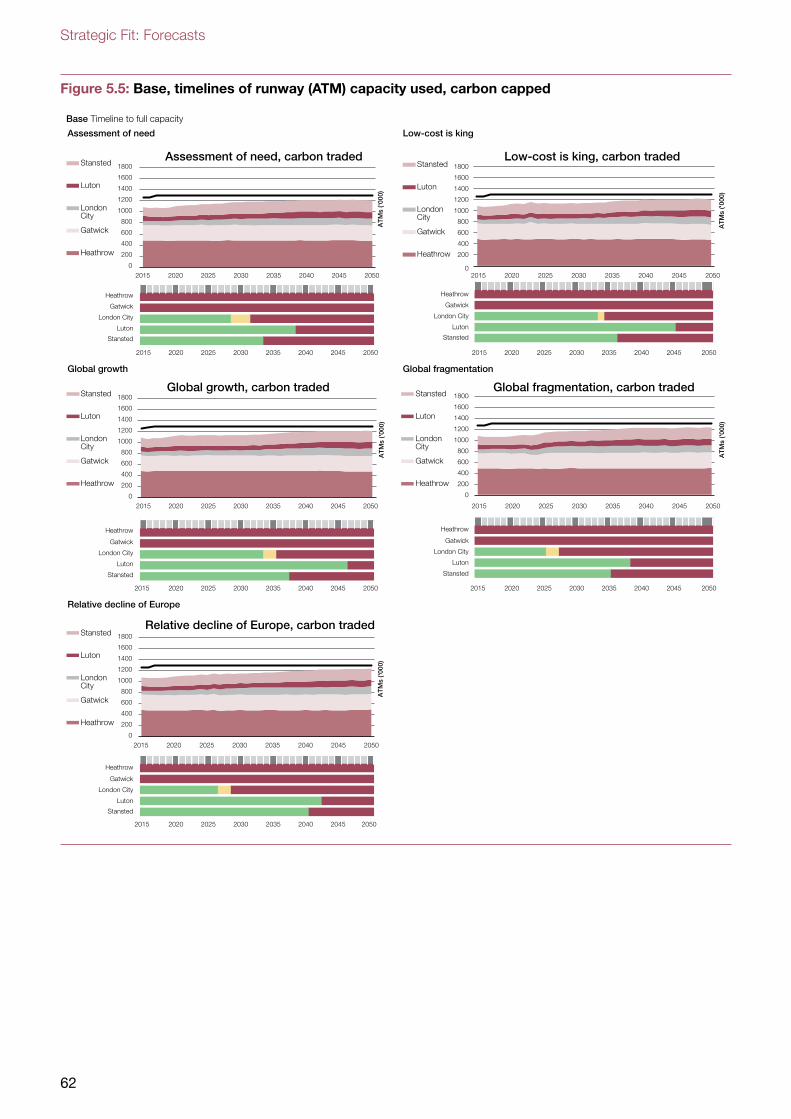
Strategic Fit: Forecasts
62
Figure 5.5: Base, timelines of runway (ATM) capacity used, carbon capped
Base Timeline to full capacity
Assessment of need Low-cost is king
Global growth Global fragmentation
Relative decline of Europe
AT
Ms
('000
)
Assessment of need, carbon tradedStansted
Luton
LondonCity
Gatwick
Heathrow
AT
Ms
('000
)Global growth, carbon traded
Stansted
Luton
LondonCity
Gatwick
Heathrow
AT
Ms
('000
)
Relative decline of Europe, carbon tradedStansted
Luton
LondonCity
Gatwick
HeathrowA
TM
s ('0
00)
Low-cost is king, carbon tradedStansted
Luton
LondonCity
Gatwick
Heathrow
AT
Ms
('000
)
Global fragmentation, carbon tradedStansted
Luton
LondonCity
Gatwick
Heathrow
Heathrow Heathrow
Gatwick Gatwick
London City London City
Luton Luton
Stansted Stansted
Heathrow Heathrow
Gatwick Gatwick
London City London City
Luton Luton
Stansted Stansted
Heathrow
Gatwick
London City
Luton
Stansted
2015 2020 2025 2030 2035 2040 2045 2050
2015 2020 2025 2030 2035 2040 2045 2050
2020 2025 2030 2035 2040
2015
2015 2050
2015
2045
2020 2025 2030 2035 2040 2045 2050 2045 2050
2015 2050
2020 2025 2030 2035 2040
2040 20452020 2025 2030 2035
0
200
400
600
800
1000
1200
1400
1600
1800
2015 2020 2025 2030 2035 2040 2045 2050
0
200
400
600
800
1000
1200
1400
1600
1800
0
200
400
600
800
1000
1200
1400
1600
1800
2015 2020 2025 2030 2035 2040 2045 2050
0
0
200
400
600
800
1000
1200
1400
1600
1800
2015 2020 2025 2030 2035 2040 2045 2050
200
400
600
800
1000
1200
1400
1600
1800
2015 2020 2025 2030 2035 2040 2045 2050
The national baseline
63
5.12 The low-high range of airport throughput forecasts for the assessment of need scenario is
shown in Appendix 3. It should be noted that as described in paragraph 5.6, for the high
range the NAPAM model runs cannot continue beyond 2042, so no 2050 forecasts are
shown. As described earlier, range forecasts are only available for the carbon-traded
demand scenario.
5.13 The passenger forecasts and the capacity timelines shown above suggest a steady and
then sharply deteriorating passenger experience as the UK appears to be reaching the
limits of the air travel that can be made with the existing airport infrastructure.
5.14 Passengers at Heathrow already suffer from a high level of delay and unreliability, as a
result of capacity constraints limiting the airport’s day-to-day efficiency and its ability to
respond to one-off events. These issues not only affect passengers, but also limit the
airport’s ability to offer predictable patterns of respite from noise for local communities.
5.15 As other airports reach capacity, similar impacts can be foreseen at the other London
airports and congestion could spill out to affect other airports in southern England and
Birmingham.
5.16 In terms of connectivity in the ‘do minimum’, all London airports will suffer from a lack of
opportunity to establish new routes to emerging economies. And the number of domestic
routes to these airports is forecast to decline, restricting access from other UK regions to
London airport’s network of international services.
5.17 The Commission’s economic analysis in phase one concluded there is also likely to be a
high cost to the wider economy or having a capacity constrained system, between
£30 billion and £45 billion.51
5.18 The current approach of forcing ever greater volumes of traffic through the existing
infrastructure, if continued, would therefore have increasingly detrimental effects on the
national economy, businesses, and air passengers.
51 Wider economic costs, present values 2021-2080 in 2013 prices.
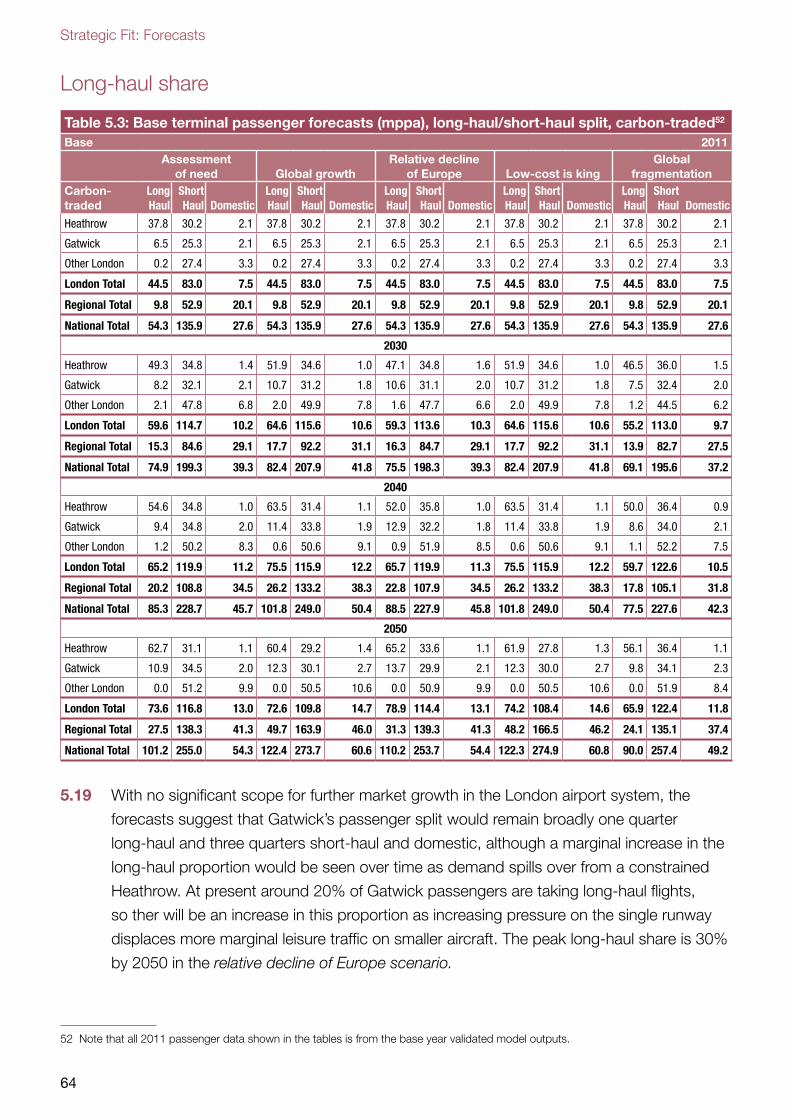
Strategic Fit: Forecasts
64
Long-haul share
Table 5.3: Base terminal passenger forecasts (mppa), long-haul/short-haul split, carbon-traded52
Base 2011Assessment
of need Global growthRelative decline
of Europe Low-cost is kingGlobal
fragmentationCarbon-traded
Long Haul
Short Haul Domestic
Long Haul
Short Haul Domestic
Long Haul
Short Haul Domestic
Long Haul
Short Haul Domestic
Long Haul
Short Haul Domestic
Heathrow 37.8 30.2 2.1 37.8 30.2 2.1 37.8 30.2 2.1 37.8 30.2 2.1 37.8 30.2 2.1
Gatwick 6.5 25.3 2.1 6.5 25.3 2.1 6.5 25.3 2.1 6.5 25.3 2.1 6.5 25.3 2.1
Other London 0.2 27.4 3.3 0.2 27.4 3.3 0.2 27.4 3.3 0.2 27.4 3.3 0.2 27.4 3.3
London Total 44.5 83.0 7.5 44.5 83.0 7.5 44.5 83.0 7.5 44.5 83.0 7.5 44.5 83.0 7.5
Regional Total 9.8 52.9 20.1 9.8 52.9 20.1 9.8 52.9 20.1 9.8 52.9 20.1 9.8 52.9 20.1
National Total 54.3 135.9 27.6 54.3 135.9 27.6 54.3 135.9 27.6 54.3 135.9 27.6 54.3 135.9 27.6
2030
Heathrow 49.3 34.8 1.4 51.9 34.6 1.0 47.1 34.8 1.6 51.9 34.6 1.0 46.5 36.0 1.5
Gatwick 8.2 32.1 2.1 10.7 31.2 1.8 10.6 31.1 2.0 10.7 31.2 1.8 7.5 32.4 2.0
Other London 2.1 47.8 6.8 2.0 49.9 7.8 1.6 47.7 6.6 2.0 49.9 7.8 1.2 44.5 6.2
London Total 59.6 114.7 10.2 64.6 115.6 10.6 59.3 113.6 10.3 64.6 115.6 10.6 55.2 113.0 9.7
Regional Total 15.3 84.6 29.1 17.7 92.2 31.1 16.3 84.7 29.1 17.7 92.2 31.1 13.9 82.7 27.5
National Total 74.9 199.3 39.3 82.4 207.9 41.8 75.5 198.3 39.3 82.4 207.9 41.8 69.1 195.6 37.2
2040
Heathrow 54.6 34.8 1.0 63.5 31.4 1.1 52.0 35.8 1.0 63.5 31.4 1.1 50.0 36.4 0.9
Gatwick 9.4 34.8 2.0 11.4 33.8 1.9 12.9 32.2 1.8 11.4 33.8 1.9 8.6 34.0 2.1
Other London 1.2 50.2 8.3 0.6 50.6 9.1 0.9 51.9 8.5 0.6 50.6 9.1 1.1 52.2 7.5
London Total 65.2 119.9 11.2 75.5 115.9 12.2 65.7 119.9 11.3 75.5 115.9 12.2 59.7 122.6 10.5
Regional Total 20.2 108.8 34.5 26.2 133.2 38.3 22.8 107.9 34.5 26.2 133.2 38.3 17.8 105.1 31.8
National Total 85.3 228.7 45.7 101.8 249.0 50.4 88.5 227.9 45.8 101.8 249.0 50.4 77.5 227.6 42.3
2050
Heathrow 62.7 31.1 1.1 60.4 29.2 1.4 65.2 33.6 1.1 61.9 27.8 1.3 56.1 36.4 1.1
Gatwick 10.9 34.5 2.0 12.3 30.1 2.7 13.7 29.9 2.1 12.3 30.0 2.7 9.8 34.1 2.3
Other London 0.0 51.2 9.9 0.0 50.5 10.6 0.0 50.9 9.9 0.0 50.5 10.6 0.0 51.9 8.4
London Total 73.6 116.8 13.0 72.6 109.8 14.7 78.9 114.4 13.1 74.2 108.4 14.6 65.9 122.4 11.8
Regional Total 27.5 138.3 41.3 49.7 163.9 46.0 31.3 139.3 41.3 48.2 166.5 46.2 24.1 135.1 37.4
National Total 101.2 255.0 54.3 122.4 273.7 60.6 110.2 253.7 54.4 122.3 274.9 60.8 90.0 257.4 49.2
5.19 With no significant scope for further market growth in the London airport system, the
forecasts suggest that Gatwick’s passenger split would remain broadly one quarter
long-haul and three quarters short-haul and domestic, although a marginal increase in the
long-haul proportion would be seen over time as demand spills over from a constrained
Heathrow. At present around 20% of Gatwick passengers are taking long-haul flights,
so ther will be an increase in this proportion as increasing pressure on the single runway
displaces more marginal leisure traffic on smaller aircraft. The peak long-haul share is 30%
by 2050 in the relative decline of Europe scenario.
52 Note that all 2011 passenger data shown in the tables is from the base year validated model outputs.
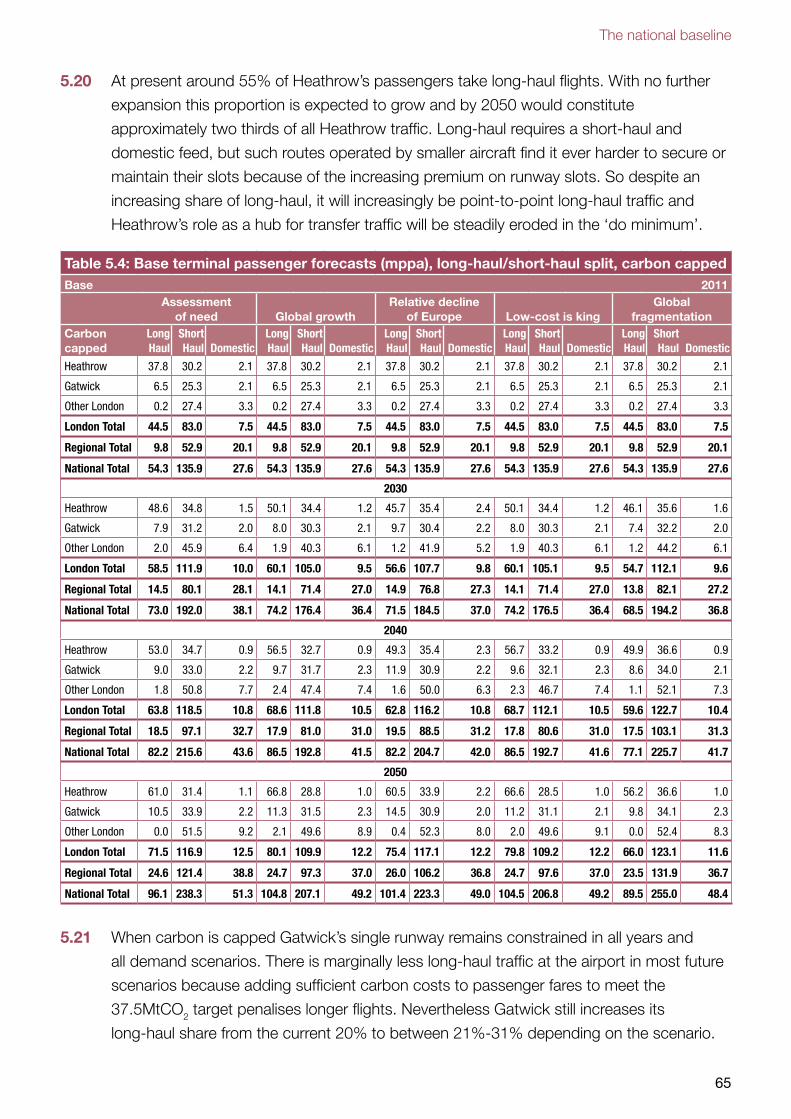
The national baseline
65
5.20 At present around 55% of Heathrow’s passengers take long-haul flights. With no further
expansion this proportion is expected to grow and by 2050 would constitute
approximately two thirds of all Heathrow traffic. Long-haul requires a short-haul and
domestic feed, but such routes operated by smaller aircraft find it ever harder to secure or
maintain their slots because of the increasing premium on runway slots. So despite an
increasing share of long-haul, it will increasingly be point-to-point long-haul traffic and
Heathrow’s role as a hub for transfer traffic will be steadily eroded in the ‘do minimum’.
Table 5.4: Base terminal passenger forecasts (mppa), long-haul/short-haul split, carbon cappedBase 2011
Assessment of need Global growth
Relative decline of Europe Low-cost is king
Global fragmentation
Carbon capped
Long Haul
Short Haul Domestic
Long Haul
Short Haul Domestic
Long Haul
Short Haul Domestic
Long Haul
Short Haul Domestic
Long Haul
Short Haul Domestic
Heathrow 37.8 30.2 2.1 37.8 30.2 2.1 37.8 30.2 2.1 37.8 30.2 2.1 37.8 30.2 2.1
Gatwick 6.5 25.3 2.1 6.5 25.3 2.1 6.5 25.3 2.1 6.5 25.3 2.1 6.5 25.3 2.1
Other London 0.2 27.4 3.3 0.2 27.4 3.3 0.2 27.4 3.3 0.2 27.4 3.3 0.2 27.4 3.3
London Total 44.5 83.0 7.5 44.5 83.0 7.5 44.5 83.0 7.5 44.5 83.0 7.5 44.5 83.0 7.5
Regional Total 9.8 52.9 20.1 9.8 52.9 20.1 9.8 52.9 20.1 9.8 52.9 20.1 9.8 52.9 20.1
National Total 54.3 135.9 27.6 54.3 135.9 27.6 54.3 135.9 27.6 54.3 135.9 27.6 54.3 135.9 27.6
2030
Heathrow 48.6 34.8 1.5 50.1 34.4 1.2 45.7 35.4 2.4 50.1 34.4 1.2 46.1 35.6 1.6
Gatwick 7.9 31.2 2.0 8.0 30.3 2.1 9.7 30.4 2.2 8.0 30.3 2.1 7.4 32.2 2.0
Other London 2.0 45.9 6.4 1.9 40.3 6.1 1.2 41.9 5.2 1.9 40.3 6.1 1.2 44.2 6.1
London Total 58.5 111.9 10.0 60.1 105.0 9.5 56.6 107.7 9.8 60.1 105.1 9.5 54.7 112.1 9.6
Regional Total 14.5 80.1 28.1 14.1 71.4 27.0 14.9 76.8 27.3 14.1 71.4 27.0 13.8 82.1 27.2
National Total 73.0 192.0 38.1 74.2 176.4 36.4 71.5 184.5 37.0 74.2 176.5 36.4 68.5 194.2 36.8
2040
Heathrow 53.0 34.7 0.9 56.5 32.7 0.9 49.3 35.4 2.3 56.7 33.2 0.9 49.9 36.6 0.9
Gatwick 9.0 33.0 2.2 9.7 31.7 2.3 11.9 30.9 2.2 9.6 32.1 2.3 8.6 34.0 2.1
Other London 1.8 50.8 7.7 2.4 47.4 7.4 1.6 50.0 6.3 2.3 46.7 7.4 1.1 52.1 7.3
London Total 63.8 118.5 10.8 68.6 111.8 10.5 62.8 116.2 10.8 68.7 112.1 10.5 59.6 122.7 10.4
Regional Total 18.5 97.1 32.7 17.9 81.0 31.0 19.5 88.5 31.2 17.8 80.6 31.0 17.5 103.1 31.3
National Total 82.2 215.6 43.6 86.5 192.8 41.5 82.2 204.7 42.0 86.5 192.7 41.6 77.1 225.7 41.7
2050
Heathrow 61.0 31.4 1.1 66.8 28.8 1.0 60.5 33.9 2.2 66.6 28.5 1.0 56.2 36.6 1.0
Gatwick 10.5 33.9 2.2 11.3 31.5 2.3 14.5 30.9 2.0 11.2 31.1 2.1 9.8 34.1 2.3
Other London 0.0 51.5 9.2 2.1 49.6 8.9 0.4 52.3 8.0 2.0 49.6 9.1 0.0 52.4 8.3
London Total 71.5 116.9 12.5 80.1 109.9 12.2 75.4 117.1 12.2 79.8 109.2 12.2 66.0 123.1 11.6
Regional Total 24.6 121.4 38.8 24.7 97.3 37.0 26.0 106.2 36.8 24.7 97.6 37.0 23.5 131.9 36.7
National Total 96.1 238.3 51.3 104.8 207.1 49.2 101.4 223.3 49.0 104.5 206.8 49.2 89.5 255.0 48.4
5.21 When carbon is capped Gatwick’s single runway remains constrained in all years and
all demand scenarios. There is marginally less long-haul traffic at the airport in most future
scenarios because adding sufficient carbon costs to passenger fares to meet the
37.5MtCO2 target penalises longer flights. Nevertheless Gatwick still increases its
long-haul share from the current 20% to between 21%-31% depending on the scenario.
Strategic Fit: Forecasts
66
5.22 Heathrow’s two runways also remain constrained throughout the period. In such
congested conditions, long-haul has a competitive advantage because it uses larger
aircraft which lower the pass-through costs to passengers of using ever more expensive
slots. So the carbon cap does not significantly dilute the long-haul share at Heathrow and
it rises from the current 55% to between 60% – 70% with the airport successfully
exploiting its dominant long-haul position in those demand scenarios such as global
growth and low-cost is king which include strong economic growth in developing
countries.
Journey purpose
5.23 Table 5.5 (carbon-traded) and Table 5.6 (carbon capped) below show how the journey
purposes of baseline passengers at Heathrow and Gatwick, across London and nationally
would vary between future demand scenario in 2030 and 2050 without any airport
capacity expansion.53
5.24 Business travellers are forecast to make up between 15% and 17% of Gatwick’s
passengers in 2030 compared to 15% today. By 2050 with business passengers more
willing to pay the higher costs of using the crowded airport the range widens to 7.2 million
(relative decline of Europe) to 9.7 million (low-cost is king) and business passengers
represent between 16% and 22% of Gatwick passengers.
5.25 The business component at the unexpanded Heathrow varies between 31% and 34% of
all passengers in 2030 compared to the current proportion of 31%. By 2050 as fares and
congestion continue to rise, depending on scenario, the business proportion continues to
rise varying between 31% and 42% as more leisure passengers are forced to use less
convenient airports, and transfer passengers, who are predominantly leisure, hub
elsewhere.
5.26 Nationally today around 24% of all air passengers travel for business purposes. This varies
between 25% for London as a whole and 21% for the other regional UK airports in total.
By 2030 the national business proportion ranges between 22% and 24%. There is
significant variation between scenarios for London as whole ranging in 2050 between 24%
in global fragmentation to 34% in the most economically optimistic scenarios of global
growth and low-cost is king. Outside London the other airports range in the much
narrower band of 18% to 20% business passengers.
53 In interpreting the purpose split tables, it is assumed that the international-to-international transfer passengers (who are treated in the modelling as a separate purpose category) split 27% business and 73% leisure. This is the currently observed journey purpose split. It should also be noted that leisure passengers include the ‘visiting friends and relatives’ (VFR) journey purpose, though this is not identified separately.
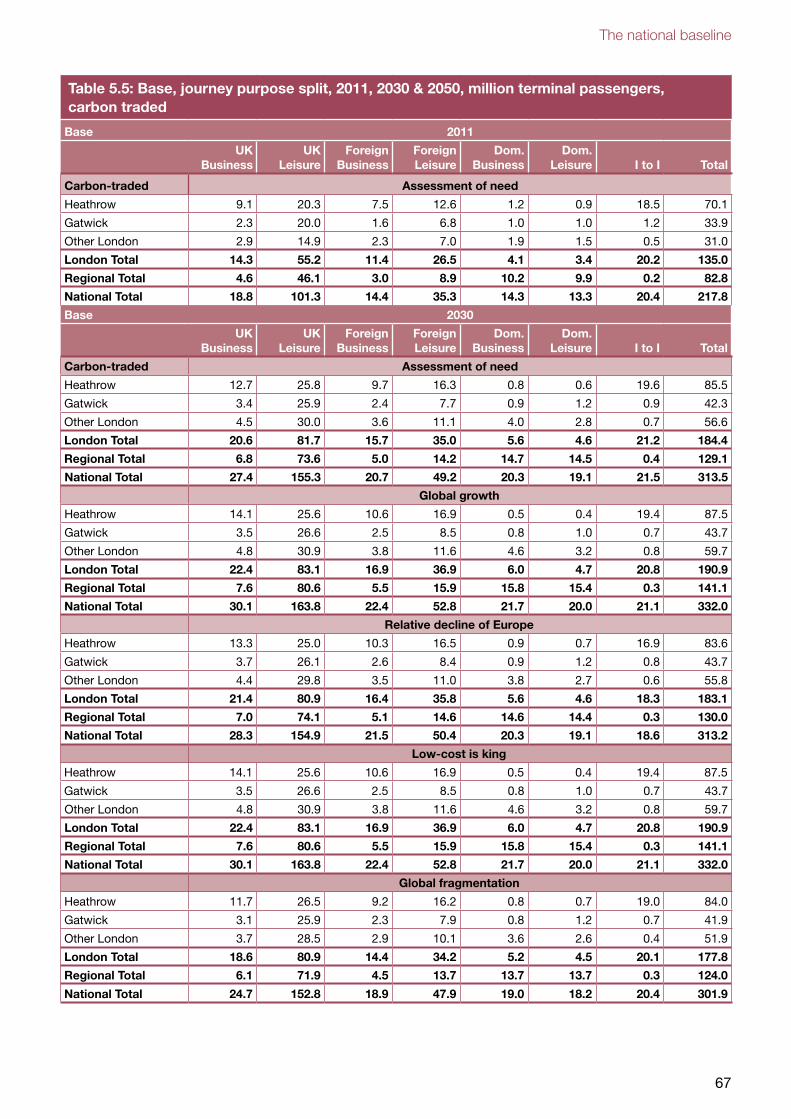
The national baseline
67
Table 5.5: Base, journey purpose split, 2011, 2030 & 2050, million terminal passengers, carbon traded
Base 2011
UK Business
UK Leisure
Foreign Business
Foreign Leisure
Dom. Business
Dom. Leisure I to I Total
Carbon-traded Assessment of need
Heathrow 9.1 20.3 7.5 12.6 1.2 0.9 18.5 70.1
Gatwick 2.3 20.0 1.6 6.8 1.0 1.0 1.2 33.9
Other London 2.9 14.9 2.3 7.0 1.9 1.5 0.5 31.0
London Total 14.3 55.2 11.4 26.5 4.1 3.4 20.2 135.0
Regional Total 4.6 46.1 3.0 8.9 10.2 9.9 0.2 82.8
National Total 18.8 101.3 14.4 35.3 14.3 13.3 20.4 217.8
Base 2030
UK Business
UK Leisure
Foreign Business
Foreign Leisure
Dom. Business
Dom. Leisure I to I Total
Carbon-traded Assessment of need
Heathrow 12.7 25.8 9.7 16.3 0.8 0.6 19.6 85.5
Gatwick 3.4 25.9 2.4 7.7 0.9 1.2 0.9 42.3
Other London 4.5 30.0 3.6 11.1 4.0 2.8 0.7 56.6
London Total 20.6 81.7 15.7 35.0 5.6 4.6 21.2 184.4
Regional Total 6.8 73.6 5.0 14.2 14.7 14.5 0.4 129.1
National Total 27.4 155.3 20.7 49.2 20.3 19.1 21.5 313.5
Global growth
Heathrow 14.1 25.6 10.6 16.9 0.5 0.4 19.4 87.5
Gatwick 3.5 26.6 2.5 8.5 0.8 1.0 0.7 43.7
Other London 4.8 30.9 3.8 11.6 4.6 3.2 0.8 59.7
London Total 22.4 83.1 16.9 36.9 6.0 4.7 20.8 190.9
Regional Total 7.6 80.6 5.5 15.9 15.8 15.4 0.3 141.1
National Total 30.1 163.8 22.4 52.8 21.7 20.0 21.1 332.0
Relative decline of Europe
Heathrow 13.3 25.0 10.3 16.5 0.9 0.7 16.9 83.6
Gatwick 3.7 26.1 2.6 8.4 0.9 1.2 0.8 43.7
Other London 4.4 29.8 3.5 11.0 3.8 2.7 0.6 55.8
London Total 21.4 80.9 16.4 35.8 5.6 4.6 18.3 183.1
Regional Total 7.0 74.1 5.1 14.6 14.6 14.4 0.3 130.0
National Total 28.3 154.9 21.5 50.4 20.3 19.1 18.6 313.2
Low-cost is king
Heathrow 14.1 25.6 10.6 16.9 0.5 0.4 19.4 87.5
Gatwick 3.5 26.6 2.5 8.5 0.8 1.0 0.7 43.7
Other London 4.8 30.9 3.8 11.6 4.6 3.2 0.8 59.7
London Total 22.4 83.1 16.9 36.9 6.0 4.7 20.8 190.9
Regional Total 7.6 80.6 5.5 15.9 15.8 15.4 0.3 141.1
National Total 30.1 163.8 22.4 52.8 21.7 20.0 21.1 332.0
Global fragmentation
Heathrow 11.7 26.5 9.2 16.2 0.8 0.7 19.0 84.0
Gatwick 3.1 25.9 2.3 7.9 0.8 1.2 0.7 41.9
Other London 3.7 28.5 2.9 10.1 3.6 2.6 0.4 51.9
London Total 18.6 80.9 14.4 34.2 5.2 4.5 20.1 177.8
Regional Total 6.1 71.9 4.5 13.7 13.7 13.7 0.3 124.0
National Total 24.7 152.8 18.9 47.9 19.0 18.2 20.4 301.9
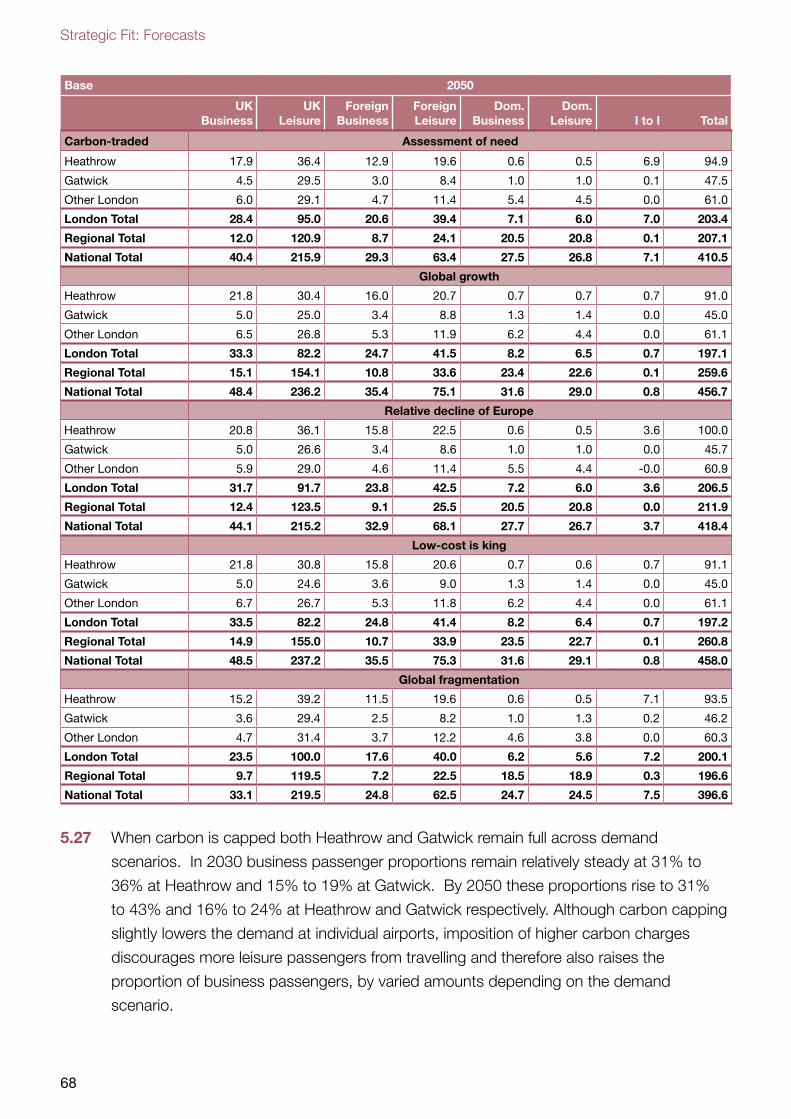
Strategic Fit: Forecasts
68
Base 2050
UK Business
UK Leisure
Foreign Business
Foreign Leisure
Dom. Business
Dom. Leisure I to I Total
Carbon-traded Assessment of need
Heathrow 17.9 36.4 12.9 19.6 0.6 0.5 6.9 94.9
Gatwick 4.5 29.5 3.0 8.4 1.0 1.0 0.1 47.5
Other London 6.0 29.1 4.7 11.4 5.4 4.5 0.0 61.0
London Total 28.4 95.0 20.6 39.4 7.1 6.0 7.0 203.4
Regional Total 12.0 120.9 8.7 24.1 20.5 20.8 0.1 207.1
National Total 40.4 215.9 29.3 63.4 27.5 26.8 7.1 410.5
Global growth
Heathrow 21.8 30.4 16.0 20.7 0.7 0.7 0.7 91.0
Gatwick 5.0 25.0 3.4 8.8 1.3 1.4 0.0 45.0
Other London 6.5 26.8 5.3 11.9 6.2 4.4 0.0 61.1
London Total 33.3 82.2 24.7 41.5 8.2 6.5 0.7 197.1
Regional Total 15.1 154.1 10.8 33.6 23.4 22.6 0.1 259.6
National Total 48.4 236.2 35.4 75.1 31.6 29.0 0.8 456.7
Relative decline of Europe
Heathrow 20.8 36.1 15.8 22.5 0.6 0.5 3.6 100.0
Gatwick 5.0 26.6 3.4 8.6 1.0 1.0 0.0 45.7
Other London 5.9 29.0 4.6 11.4 5.5 4.4 -0.0 60.9
London Total 31.7 91.7 23.8 42.5 7.2 6.0 3.6 206.5
Regional Total 12.4 123.5 9.1 25.5 20.5 20.8 0.0 211.9
National Total 44.1 215.2 32.9 68.1 27.7 26.7 3.7 418.4
Low-cost is king
Heathrow 21.8 30.8 15.8 20.6 0.7 0.6 0.7 91.1
Gatwick 5.0 24.6 3.6 9.0 1.3 1.4 0.0 45.0
Other London 6.7 26.7 5.3 11.8 6.2 4.4 0.0 61.1
London Total 33.5 82.2 24.8 41.4 8.2 6.4 0.7 197.2
Regional Total 14.9 155.0 10.7 33.9 23.5 22.7 0.1 260.8
National Total 48.5 237.2 35.5 75.3 31.6 29.1 0.8 458.0
Global fragmentation
Heathrow 15.2 39.2 11.5 19.6 0.6 0.5 7.1 93.5
Gatwick 3.6 29.4 2.5 8.2 1.0 1.3 0.2 46.2
Other London 4.7 31.4 3.7 12.2 4.6 3.8 0.0 60.3
London Total 23.5 100.0 17.6 40.0 6.2 5.6 7.2 200.1
Regional Total 9.7 119.5 7.2 22.5 18.5 18.9 0.3 196.6
National Total 33.1 219.5 24.8 62.5 24.7 24.5 7.5 396.6
5.27 When carbon is capped both Heathrow and Gatwick remain full across demand
scenarios. In 2030 business passenger proportions remain relatively steady at 31% to
36% at Heathrow and 15% to 19% at Gatwick. By 2050 these proportions rise to 31%
to 43% and 16% to 24% at Heathrow and Gatwick respectively. Although carbon capping
slightly lowers the demand at individual airports, imposition of higher carbon charges
discourages more leisure passengers from travelling and therefore also raises the
proportion of business passengers, by varied amounts depending on the demand
scenario.
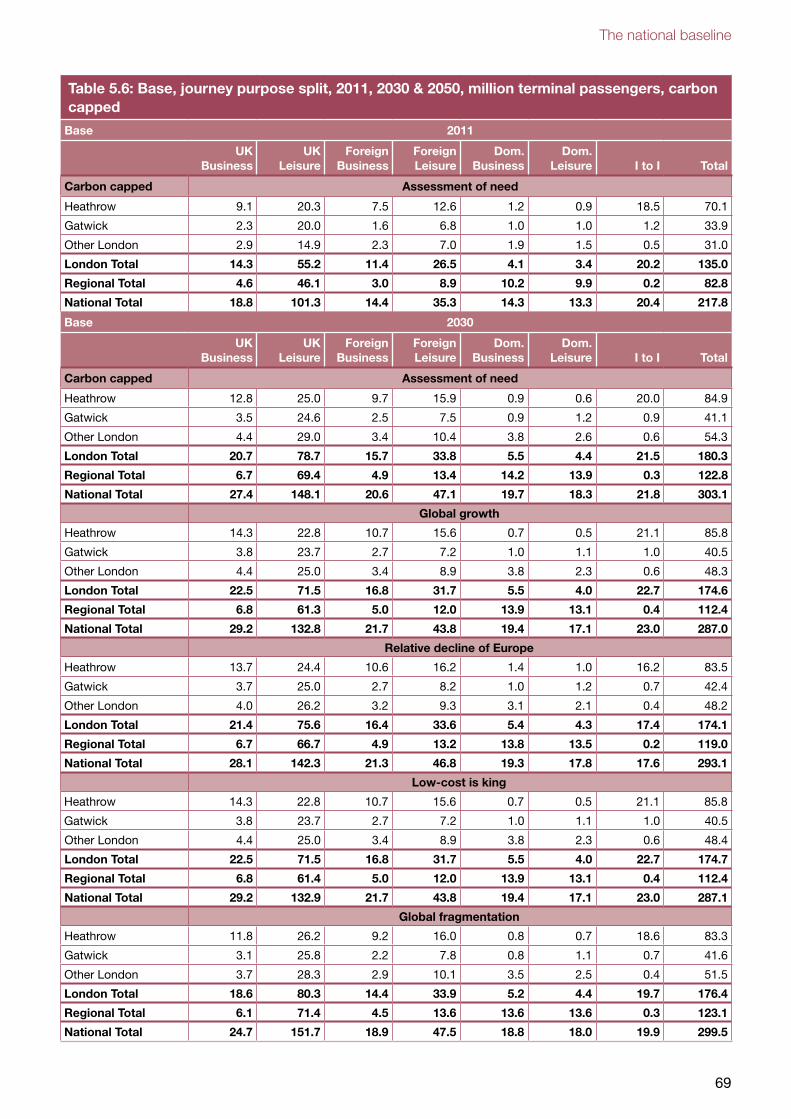
The national baseline
69
Table 5.6: Base, journey purpose split, 2011, 2030 & 2050, million terminal passengers, carbon capped
Base 2011
UK Business
UK Leisure
Foreign Business
Foreign Leisure
Dom. Business
Dom. Leisure I to I Total
Carbon capped Assessment of need
Heathrow 9.1 20.3 7.5 12.6 1.2 0.9 18.5 70.1
Gatwick 2.3 20.0 1.6 6.8 1.0 1.0 1.2 33.9
Other London 2.9 14.9 2.3 7.0 1.9 1.5 0.5 31.0
London Total 14.3 55.2 11.4 26.5 4.1 3.4 20.2 135.0
Regional Total 4.6 46.1 3.0 8.9 10.2 9.9 0.2 82.8
National Total 18.8 101.3 14.4 35.3 14.3 13.3 20.4 217.8
Base 2030
UK Business
UK Leisure
Foreign Business
Foreign Leisure
Dom. Business
Dom. Leisure I to I Total
Carbon capped Assessment of need
Heathrow 12.8 25.0 9.7 15.9 0.9 0.6 20.0 84.9
Gatwick 3.5 24.6 2.5 7.5 0.9 1.2 0.9 41.1
Other London 4.4 29.0 3.4 10.4 3.8 2.6 0.6 54.3
London Total 20.7 78.7 15.7 33.8 5.5 4.4 21.5 180.3
Regional Total 6.7 69.4 4.9 13.4 14.2 13.9 0.3 122.8
National Total 27.4 148.1 20.6 47.1 19.7 18.3 21.8 303.1
Global growth
Heathrow 14.3 22.8 10.7 15.6 0.7 0.5 21.1 85.8
Gatwick 3.8 23.7 2.7 7.2 1.0 1.1 1.0 40.5
Other London 4.4 25.0 3.4 8.9 3.8 2.3 0.6 48.3
London Total 22.5 71.5 16.8 31.7 5.5 4.0 22.7 174.6
Regional Total 6.8 61.3 5.0 12.0 13.9 13.1 0.4 112.4
National Total 29.2 132.8 21.7 43.8 19.4 17.1 23.0 287.0
Relative decline of Europe
Heathrow 13.7 24.4 10.6 16.2 1.4 1.0 16.2 83.5
Gatwick 3.7 25.0 2.7 8.2 1.0 1.2 0.7 42.4
Other London 4.0 26.2 3.2 9.3 3.1 2.1 0.4 48.2
London Total 21.4 75.6 16.4 33.6 5.4 4.3 17.4 174.1
Regional Total 6.7 66.7 4.9 13.2 13.8 13.5 0.2 119.0
National Total 28.1 142.3 21.3 46.8 19.3 17.8 17.6 293.1
Low-cost is king
Heathrow 14.3 22.8 10.7 15.6 0.7 0.5 21.1 85.8
Gatwick 3.8 23.7 2.7 7.2 1.0 1.1 1.0 40.5
Other London 4.4 25.0 3.4 8.9 3.8 2.3 0.6 48.4
London Total 22.5 71.5 16.8 31.7 5.5 4.0 22.7 174.7
Regional Total 6.8 61.4 5.0 12.0 13.9 13.1 0.4 112.4
National Total 29.2 132.9 21.7 43.8 19.4 17.1 23.0 287.1
Global fragmentation
Heathrow 11.8 26.2 9.2 16.0 0.8 0.7 18.6 83.3
Gatwick 3.1 25.8 2.2 7.8 0.8 1.1 0.7 41.6
Other London 3.7 28.3 2.9 10.1 3.5 2.5 0.4 51.5
London Total 18.6 80.3 14.4 33.9 5.2 4.4 19.7 176.4
Regional Total 6.1 71.4 4.5 13.6 13.6 13.6 0.3 123.1
National Total 24.7 151.7 18.9 47.5 18.8 18.0 19.9 299.5

Strategic Fit: Forecasts
70
Base 2050
UK Business
UK Leisure
Foreign Business
Foreign Leisure
Dom. Business
Dom. Leisure I to I Total
Carbon capped Assessment of need
Heathrow 18.1 34.5 13.0 18.9 0.6 0.5 8.1 93.5
Gatwick 4.7 28.3 3.1 8.1 1.1 1.2 0.1 46.6
Other London 6.1 29.7 4.6 11.1 5.2 4.0 0.0 60.7
London Total 28.8 92.6 20.7 38.1 6.8 5.7 8.2 200.9
Regional Total 11.2 105.9 8.3 20.5 19.5 19.3 0.1 184.8
National Total 40.0 198.5 29.0 58.5 26.3 25.0 8.3 385.7
Global growth
Heathrow 22.5 28.9 16.0 19.3 0.5 0.6 9.1 96.6
Gatwick 5.7 25.4 3.8 7.6 1.0 1.2 0.2 45.0
Other London 7.0 28.8 5.3 10.4 5.6 3.3 0.0 60.5
London Total 35.2 83.1 25.1 37.3 7.2 5.1 9.3 202.2
Regional Total 11.6 85.0 8.4 16.9 19.1 17.9 0.1 158.9
National Total 46.8 168.1 33.5 54.2 26.2 22.9 9.3 361.2
Relative decline of Europe
Heathrow 21.0 32.2 15.8 20.3 1.3 0.9 5.2 96.6
Gatwick 5.4 27.0 3.7 9.0 0.9 1.1 0.2 47.5
Other London 6.0 30.9 4.6 11.2 4.6 3.5 0.0 60.7
London Total 32.4 90.1 24.2 40.5 6.8 5.4 5.4 204.8
Regional Total 10.8 94.6 7.9 18.8 18.5 18.3 0.2 169.0
National Total 43.2 184.6 32.1 59.3 25.3 23.7 5.6 373.8
Low-cost is king
Heathrow 22.4 28.8 15.9 19.2 0.5 0.6 8.7 96.1
Gatwick 5.7 25.1 3.8 7.6 1.0 1.1 0.2 44.4
Other London 6.9 29.0 5.2 10.5 5.7 3.4 0.0 60.7
London Total 35.0 82.8 25.0 37.2 7.2 5.1 9.0 201.2
Regional Total 11.8 85.1 8.5 17.0 19.1 17.9 0.1 159.3
National Total 46.7 167.9 33.5 54.2 26.2 23.0 9.0 360.6
Global fragmentation
Heathrow 15.2 38.9 11.5 19.5 0.6 0.5 7.7 93.8
Gatwick 3.6 29.3 2.5 8.2 1.0 1.3 0.2 46.2
Other London 4.7 32.1 3.6 12.0 4.5 3.7 0.0 60.7
London Total 23.5 100.3 17.6 39.7 6.2 5.5 7.9 200.7
Regional Total 9.6 116.4 7.2 22.1 18.2 18.6 0.2 192.2
National Total 33.1 216.8 24.8 61.8 24.3 24.0 8.2 392.9
5.28 By 2030 the national business proportion ranges between 22% and 26% and by 2050 the
variation becomes even more pronounced when carbon is capped, ranging between 21%
under global fragmentation and 30% in the higher GDP scenarios, global growth and
low-cost is king. There is the same significant variation as with carbon-traded between
scenarios for London as a whole with a range in 2050 from 24% to 34%. But outside
London the other airports range more widely: from 18% in global fragmentation to 25%
business passengers in the global growth, and low-cost is king scenarios.
The national baseline
71
Baseline transfers
5.29 Three types of transfer at hub airports are reported in the tables below:
1. ‘International-to-international’: these passengers are passing through the country of the
hub airport and do not stay there more than 24 hours; at present at all the hubs
airports this is much the largest group of transfer passengers. These are shown in
Table 5.7.
In 2011 there were some 18 million international-to-international transfer passengers at
Heathrow. These should not be confused with journeys. They represent 9 million
connecting passengers arriving or departing at the hub on the international first leg of
their trip and the same 9 million passengers counted again arriving or departing at the
hub on the international second leg of their trip. It follows that one return journey by an
international-to-international transfer passenger contributes four ‘terminal passenger’
movements to total throughput. Heathrow international-to-international transfer
passenger numbers have grown significantly between 2011 and 2013 to 21 million.
Table 2.8 on the international-to-international transfer passenger model validation
demonstrates that this increase has been captured in the modelling.
Gatwick had 1 million international-to-international transfer passengers in 2011. This
represents 0.5 million connecting passengers arriving or departing on the international
first leg of their trip and the same 0.5 million passengers counted again arriving or
departing on the international second leg of their trip. One reason that Gatwick has a
smaller volume of international-to-international transfer passengers is because a
significant proportion of passengers are on low-cost or charter carriers and these
airlines do not support through-ticketing, so transfer movements tend to take the
form of ‘self connecting’.
2. ‘Domestic-interliners’: in the model these are only forecast at UK hub airports, they
are passengers bound for or originating in the UK (both UK and foreign residents) who
fly to or from Heathrow, Gatwick or another UK hub on a feeder service from another
UK airport. These are the UK hub totals reported in the top half of Table 5.8.
This table shows that in 2011 there were 5.1 million domestic interliners at Heathrow.
This means that there were 2.55 million connecting passengers counted arriving or
departing on domestic flights at Heathrow and the same 2.55 million passengers
counted again connecting to international flights.54 These passengers would also have
been counted separately in the national totals at their domestic airport of origin
(Manchester, Glasgow, Aberdeen etc.), so one domestic interlining return journey
contributes 6 terminal passenger movements to the national total.
54 There were also around 2.1m domestic passengers at Heathrow who were starting or terminating their journey at Heathrow. The CAA statistical returns for Heathrow show some 4.7m domestic passengers at Heathrow in 2011. In practice this is the 2.1m terminating passengers combined with the 2.55m connecting passengers on the domestic leg of their journeys.
Strategic Fit: Forecasts
72
Table 5.8 shows that at Gatwick in 2011 there were 1.2 million domestic-interliners.
That represents 0.6 million connecting passengers counted arriving or departing on
domestic flights and the same 0.6 million passengers counted again connecting to
international flights.
3. ‘International-interliners’: are similar to domestic interliners in that they are bound
for or originating in the UK but they are to or from one of the overseas hubs on a feeder
service from another UK airport i.e. they use Amsterdam Schiphol or Paris CDG as an
alternative hub to using Heathrow or Gatwick. ‘International interliners’ are the overseas
hub totals reported in the lower half of Table 5.8 which shows that, for example, in
2011 there were 0.8 million passengers arriving and departing from the UK as transfer
passengers at Paris CDG. Note these figures are not the total transfer activity at the
overseas hubs, but just the total arrivals and departures from connecting passengers
starting or ending their journeys in the UK.
5.30 Domestic interlining and international-to-international transfer passenger traffic is
particularly sensitive to shadow costs at congested UK airports. When a runway shadow
cost is applied at an over-capacity airport, transfer passengers face paying it twice: both
on the feeder and connecting service. Therefore transfer passengers generally reduce at a
faster rate than point-to-point traffic at a congested airport. Even if in some cases the
costs of double-runway use might not always be fully passed through to transfer
passengers, the higher shadow cost also reflects the greater sensitivity to service
uncertainty and inconvenience that transfer passengers face at a congested airport.
5.31 Domestic and international interliners to or from the UK are usually even more vulnerable
to shadow costs at over-capacity airports as feeder services are often smaller aircraft more
susceptible to runway shadow costs. Domestic-interliners will also reduce faster as in
some cases direct services bypassing the hub become viable at the origin airport and in
other cases, trips by surface transport to the hub may replace the feeder service. These
effects of lost transfer traffic are most evident in the base case of no additional runway
capacity where shadow costs are highest.
5.32 Note that all 2011 passenger data shown in the tables is from the base year validated
model outputs.
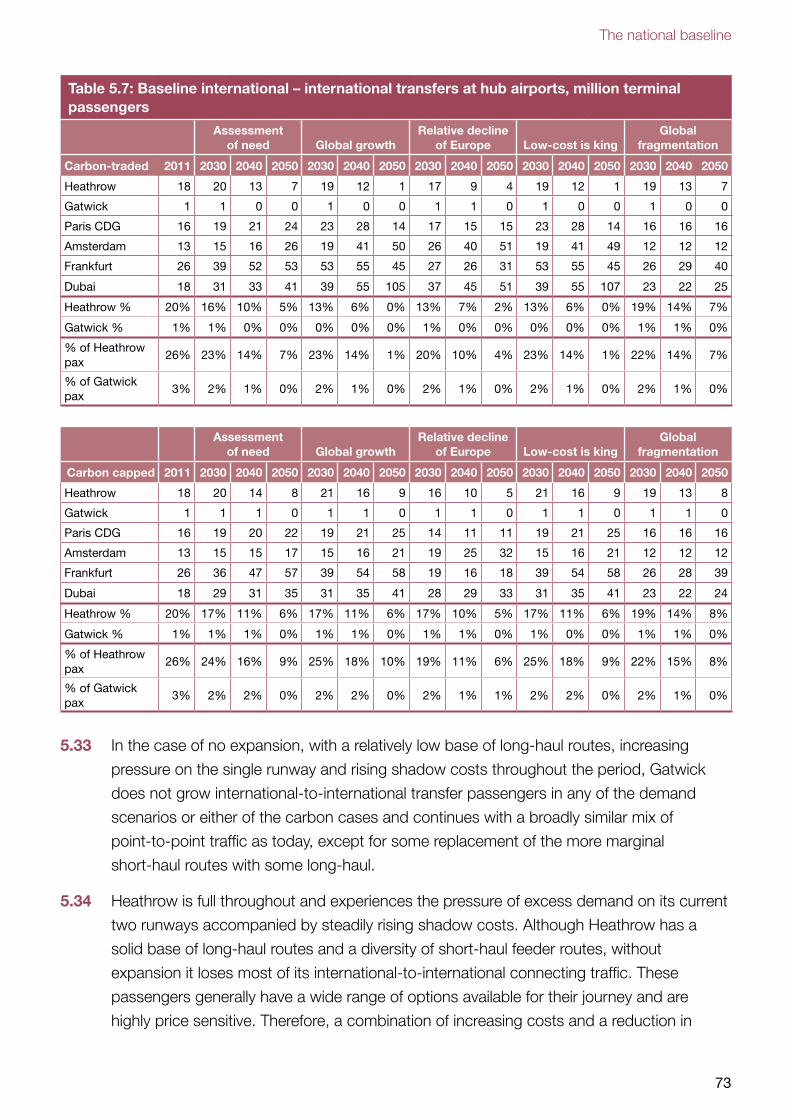
The national baseline
73
Table 5.7: Baseline international – international transfers at hub airports, million terminal passengers
Assessment of need Global growth
Relative decline of Europe Low-cost is king
Global fragmentation
Carbon-traded 2011 2030 2040 2050 2030 2040 2050 2030 2040 2050 2030 2040 2050 2030 2040 2050
Heathrow 18 20 13 7 19 12 1 17 9 4 19 12 1 19 13 7
Gatwick 1 1 0 0 1 0 0 1 1 0 1 0 0 1 0 0
Paris CDG 16 19 21 24 23 28 14 17 15 15 23 28 14 16 16 16
Amsterdam 13 15 16 26 19 41 50 26 40 51 19 41 49 12 12 12
Frankfurt 26 39 52 53 53 55 45 27 26 31 53 55 45 26 29 40
Dubai 18 31 33 41 39 55 105 37 45 51 39 55 107 23 22 25
Heathrow % 20% 16% 10% 5% 13% 6% 0% 13% 7% 2% 13% 6% 0% 19% 14% 7%
Gatwick % 1% 1% 0% 0% 0% 0% 0% 1% 0% 0% 0% 0% 0% 1% 1% 0%
% of Heathrow pax
26% 23% 14% 7% 23% 14% 1% 20% 10% 4% 23% 14% 1% 22% 14% 7%
% of Gatwick pax
3% 2% 1% 0% 2% 1% 0% 2% 1% 0% 2% 1% 0% 2% 1% 0%
Assessment of need Global growth
Relative decline of Europe Low-cost is king
Global fragmentation
Carbon capped 2011 2030 2040 2050 2030 2040 2050 2030 2040 2050 2030 2040 2050 2030 2040 2050
Heathrow 18 20 14 8 21 16 9 16 10 5 21 16 9 19 13 8
Gatwick 1 1 1 0 1 1 0 1 1 0 1 1 0 1 1 0
Paris CDG 16 19 20 22 19 21 25 14 11 11 19 21 25 16 16 16
Amsterdam 13 15 15 17 15 16 21 19 25 32 15 16 21 12 12 12
Frankfurt 26 36 47 57 39 54 58 19 16 18 39 54 58 26 28 39
Dubai 18 29 31 35 31 35 41 28 29 33 31 35 41 23 22 24
Heathrow % 20% 17% 11% 6% 17% 11% 6% 17% 10% 5% 17% 11% 6% 19% 14% 8%
Gatwick % 1% 1% 1% 0% 1% 1% 0% 1% 1% 0% 1% 0% 0% 1% 1% 0%
% of Heathrow pax
26% 24% 16% 9% 25% 18% 10% 19% 11% 6% 25% 18% 9% 22% 15% 8%
% of Gatwick pax
3% 2% 2% 0% 2% 2% 0% 2% 1% 1% 2% 2% 0% 2% 1% 0%
5.33 In the case of no expansion, with a relatively low base of long-haul routes, increasing
pressure on the single runway and rising shadow costs throughout the period, Gatwick
does not grow international-to-international transfer passengers in any of the demand
scenarios or either of the carbon cases and continues with a broadly similar mix of
point-to-point traffic as today, except for some replacement of the more marginal
short-haul routes with some long-haul.
5.34 Heathrow is full throughout and experiences the pressure of excess demand on its current
two runways accompanied by steadily rising shadow costs. Although Heathrow has a
solid base of long-haul routes and a diversity of short-haul feeder routes, without
expansion it loses most of its international-to-international connecting traffic. These
passengers generally have a wide range of options available for their journey and are
highly price sensitive. Therefore, a combination of increasing costs and a reduction in
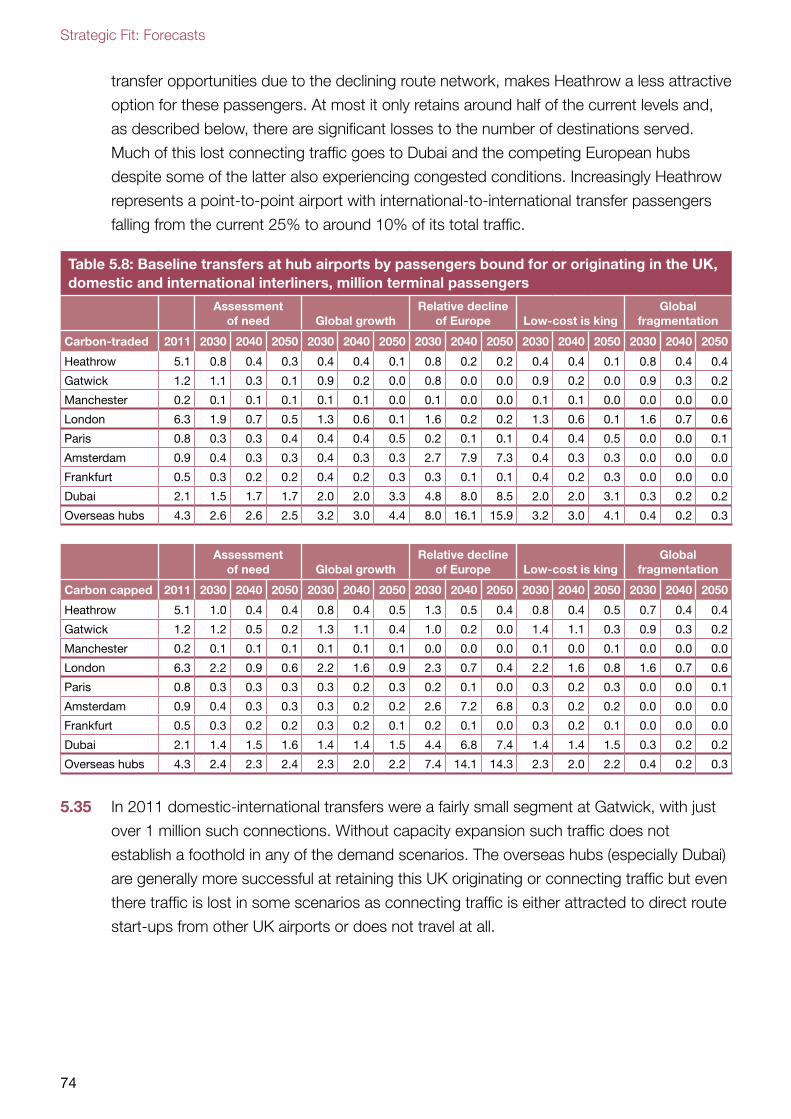
Strategic Fit: Forecasts
74
transfer opportunities due to the declining route network, makes Heathrow a less attractive
option for these passengers. At most it only retains around half of the current levels and,
as described below, there are significant losses to the number of destinations served.
Much of this lost connecting traffic goes to Dubai and the competing European hubs
despite some of the latter also experiencing congested conditions. Increasingly Heathrow
represents a point-to-point airport with international-to-international transfer passengers
falling from the current 25% to around 10% of its total traffic.
Table 5.8: Baseline transfers at hub airports by passengers bound for or originating in the UK, domestic and international interliners, million terminal passengers
Assessment of need Global growth
Relative decline of Europe Low-cost is king
Global fragmentation
Carbon-traded 2011 2030 2040 2050 2030 2040 2050 2030 2040 2050 2030 2040 2050 2030 2040 2050
Heathrow 5.1 0.8 0.4 0.3 0.4 0.4 0.1 0.8 0.2 0.2 0.4 0.4 0.1 0.8 0.4 0.4
Gatwick 1.2 1.1 0.3 0.1 0.9 0.2 0.0 0.8 0.0 0.0 0.9 0.2 0.0 0.9 0.3 0.2
Manchester 0.2 0.1 0.1 0.1 0.1 0.1 0.0 0.1 0.0 0.0 0.1 0.1 0.0 0.0 0.0 0.0
London 6.3 1.9 0.7 0.5 1.3 0.6 0.1 1.6 0.2 0.2 1.3 0.6 0.1 1.6 0.7 0.6
Paris 0.8 0.3 0.3 0.4 0.4 0.4 0.5 0.2 0.1 0.1 0.4 0.4 0.5 0.0 0.0 0.1
Amsterdam 0.9 0.4 0.3 0.3 0.4 0.3 0.3 2.7 7.9 7.3 0.4 0.3 0.3 0.0 0.0 0.0
Frankfurt 0.5 0.3 0.2 0.2 0.4 0.2 0.3 0.3 0.1 0.1 0.4 0.2 0.3 0.0 0.0 0.0
Dubai 2.1 1.5 1.7 1.7 2.0 2.0 3.3 4.8 8.0 8.5 2.0 2.0 3.1 0.3 0.2 0.2
Overseas hubs 4.3 2.6 2.6 2.5 3.2 3.0 4.4 8.0 16.1 15.9 3.2 3.0 4.1 0.4 0.2 0.3
Assessment of need Global growth
Relative decline of Europe Low-cost is king
Global fragmentation
Carbon capped 2011 2030 2040 2050 2030 2040 2050 2030 2040 2050 2030 2040 2050 2030 2040 2050
Heathrow 5.1 1.0 0.4 0.4 0.8 0.4 0.5 1.3 0.5 0.4 0.8 0.4 0.5 0.7 0.4 0.4
Gatwick 1.2 1.2 0.5 0.2 1.3 1.1 0.4 1.0 0.2 0.0 1.4 1.1 0.3 0.9 0.3 0.2
Manchester 0.2 0.1 0.1 0.1 0.1 0.1 0.1 0.0 0.0 0.0 0.1 0.0 0.1 0.0 0.0 0.0
London 6.3 2.2 0.9 0.6 2.2 1.6 0.9 2.3 0.7 0.4 2.2 1.6 0.8 1.6 0.7 0.6
Paris 0.8 0.3 0.3 0.3 0.3 0.2 0.3 0.2 0.1 0.0 0.3 0.2 0.3 0.0 0.0 0.1
Amsterdam 0.9 0.4 0.3 0.3 0.3 0.2 0.2 2.6 7.2 6.8 0.3 0.2 0.2 0.0 0.0 0.0
Frankfurt 0.5 0.3 0.2 0.2 0.3 0.2 0.1 0.2 0.1 0.0 0.3 0.2 0.1 0.0 0.0 0.0
Dubai 2.1 1.4 1.5 1.6 1.4 1.4 1.5 4.4 6.8 7.4 1.4 1.4 1.5 0.3 0.2 0.2
Overseas hubs 4.3 2.4 2.3 2.4 2.3 2.0 2.2 7.4 14.1 14.3 2.3 2.0 2.2 0.4 0.2 0.3
5.35 In 2011 domestic-international transfers were a fairly small segment at Gatwick, with just
over 1 million such connections. Without capacity expansion such traffic does not
establish a foothold in any of the demand scenarios. The overseas hubs (especially Dubai)
are generally more successful at retaining this UK originating or connecting traffic but even
there traffic is lost in some scenarios as connecting traffic is either attracted to direct route
start-ups from other UK airports or does not travel at all.
The national baseline
75
5.36 Without expansion, domestic-international transfers are forecast to decline dramatically at
Heathrow, falling from around 5 million terminal passenger movements today, to under 1
million by the 2040s. In such congested conditions with demand more focused on routes
which can be served by larger aircraft, Heathrow loses around half its domestic feeder
routes. Again the competing overseas hubs capture some of this UK traffic, but other
passengers switch to new but also lower frequency direct regional routes or they do not
travel at all.
Baseline destinations served
5.37 The analysis presented in Table 5.9 and Table 5.10 summarises the number of separate
route destinations served without any extra runway capacity for Gatwick, Heathrow, all five
London airports, non-London airports and all UK airports. There are separate tables for
the carbon-traded and capped cases. A threshold of at least one daily service throughout
the year is applied. This is defined in the analysis as being at least 365 daily scheduled
departures a year, or 730 annual passenger ATMs (arriving and departing). The daily
threshold applied is relatively stringent. The tables include only scheduled services (both
‘full-service’ and LCC), and therefore exclude charter. The modelling of destinations served
by each airport for each airline sector is part of the model validation process and is
reported in Appendix 1.
5.38 Note that these tables are not additive. If a route exists at Gatwick, Heathrow and
elsewhere in the London system it is counted in each table, so will appear three times;
likewise between London and the regions. Similarly, destination totals cannot be derived
by simple subtraction. This means that the destination count served at other London
airports is not the Heathrow and Gatwick destinations subtracted from the London total
likewise for London and regions.
5.39 Counting destinations served from a particular airport or region is a relatively limited
measure of connectivity because the new destinations added will initially be at the
margin and very often at less than daily frequencies or operating at times not convenient
to many passengers.
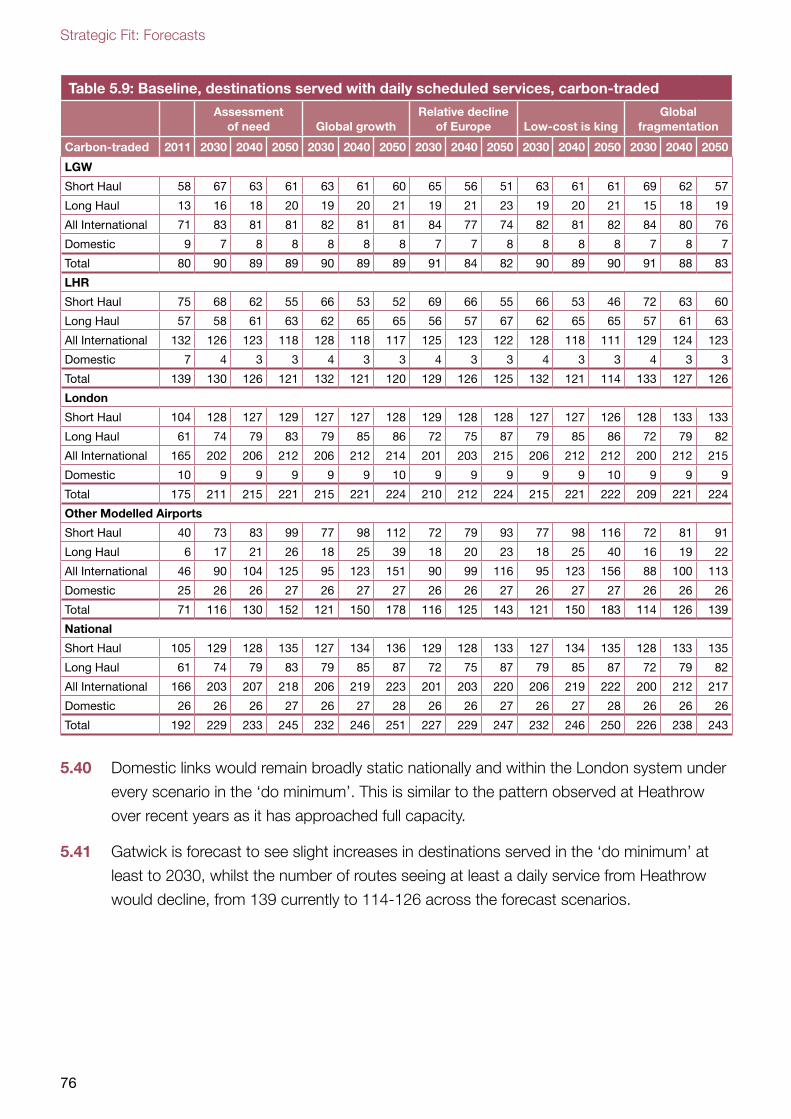
Strategic Fit: Forecasts
76
Table 5.9: Baseline, destinations served with daily scheduled services, carbon-traded
Assessment of need Global growth
Relative decline of Europe Low-cost is king
Global fragmentation
Carbon-traded 2011 2030 2040 2050 2030 2040 2050 2030 2040 2050 2030 2040 2050 2030 2040 2050
LGW
Short Haul 58 67 63 61 63 61 60 65 56 51 63 61 61 69 62 57
Long Haul 13 16 18 20 19 20 21 19 21 23 19 20 21 15 18 19
All International 71 83 81 81 82 81 81 84 77 74 82 81 82 84 80 76
Domestic 9 7 8 8 8 8 8 7 7 8 8 8 8 7 8 7
Total 80 90 89 89 90 89 89 91 84 82 90 89 90 91 88 83
LHR
Short Haul 75 68 62 55 66 53 52 69 66 55 66 53 46 72 63 60
Long Haul 57 58 61 63 62 65 65 56 57 67 62 65 65 57 61 63
All International 132 126 123 118 128 118 117 125 123 122 128 118 111 129 124 123
Domestic 7 4 3 3 4 3 3 4 3 3 4 3 3 4 3 3
Total 139 130 126 121 132 121 120 129 126 125 132 121 114 133 127 126
London
Short Haul 104 128 127 129 127 127 128 129 128 128 127 127 126 128 133 133
Long Haul 61 74 79 83 79 85 86 72 75 87 79 85 86 72 79 82
All International 165 202 206 212 206 212 214 201 203 215 206 212 212 200 212 215
Domestic 10 9 9 9 9 9 10 9 9 9 9 9 10 9 9 9
Total 175 211 215 221 215 221 224 210 212 224 215 221 222 209 221 224
Other Modelled Airports
Short Haul 40 73 83 99 77 98 112 72 79 93 77 98 116 72 81 91
Long Haul 6 17 21 26 18 25 39 18 20 23 18 25 40 16 19 22
All International 46 90 104 125 95 123 151 90 99 116 95 123 156 88 100 113
Domestic 25 26 26 27 26 27 27 26 26 27 26 27 27 26 26 26
Total 71 116 130 152 121 150 178 116 125 143 121 150 183 114 126 139
National
Short Haul 105 129 128 135 127 134 136 129 128 133 127 134 135 128 133 135
Long Haul 61 74 79 83 79 85 87 72 75 87 79 85 87 72 79 82
All International 166 203 207 218 206 219 223 201 203 220 206 219 222 200 212 217
Domestic 26 26 26 27 26 27 28 26 26 27 26 27 28 26 26 26
Total 192 229 233 245 232 246 251 227 229 247 232 246 250 226 238 243
5.40 Domestic links would remain broadly static nationally and within the London system under
every scenario in the ‘do minimum’. This is similar to the pattern observed at Heathrow
over recent years as it has approached full capacity.
5.41 Gatwick is forecast to see slight increases in destinations served in the ‘do minimum’ at
least to 2030, whilst the number of routes seeing at least a daily service from Heathrow
would decline, from 139 currently to 114-126 across the forecast scenarios.
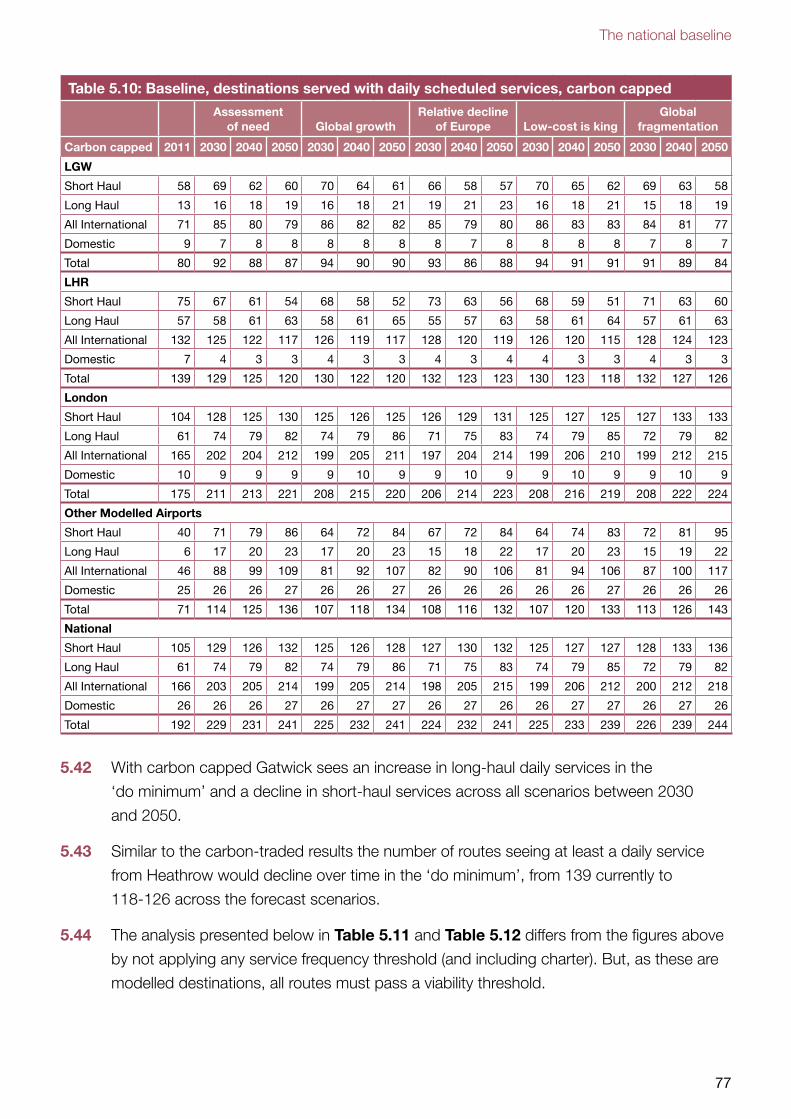
The national baseline
77
Table 5.10: Baseline, destinations served with daily scheduled services, carbon capped
Assessment of need Global growth
Relative decline of Europe Low-cost is king
Global fragmentation
Carbon capped 2011 2030 2040 2050 2030 2040 2050 2030 2040 2050 2030 2040 2050 2030 2040 2050
LGW
Short Haul 58 69 62 60 70 64 61 66 58 57 70 65 62 69 63 58
Long Haul 13 16 18 19 16 18 21 19 21 23 16 18 21 15 18 19
All International 71 85 80 79 86 82 82 85 79 80 86 83 83 84 81 77
Domestic 9 7 8 8 8 8 8 8 7 8 8 8 8 7 8 7
Total 80 92 88 87 94 90 90 93 86 88 94 91 91 91 89 84
LHR
Short Haul 75 67 61 54 68 58 52 73 63 56 68 59 51 71 63 60
Long Haul 57 58 61 63 58 61 65 55 57 63 58 61 64 57 61 63
All International 132 125 122 117 126 119 117 128 120 119 126 120 115 128 124 123
Domestic 7 4 3 3 4 3 3 4 3 4 4 3 3 4 3 3
Total 139 129 125 120 130 122 120 132 123 123 130 123 118 132 127 126
London
Short Haul 104 128 125 130 125 126 125 126 129 131 125 127 125 127 133 133
Long Haul 61 74 79 82 74 79 86 71 75 83 74 79 85 72 79 82
All International 165 202 204 212 199 205 211 197 204 214 199 206 210 199 212 215
Domestic 10 9 9 9 9 10 9 9 10 9 9 10 9 9 10 9
Total 175 211 213 221 208 215 220 206 214 223 208 216 219 208 222 224
Other Modelled Airports
Short Haul 40 71 79 86 64 72 84 67 72 84 64 74 83 72 81 95
Long Haul 6 17 20 23 17 20 23 15 18 22 17 20 23 15 19 22
All International 46 88 99 109 81 92 107 82 90 106 81 94 106 87 100 117
Domestic 25 26 26 27 26 26 27 26 26 26 26 26 27 26 26 26
Total 71 114 125 136 107 118 134 108 116 132 107 120 133 113 126 143
National
Short Haul 105 129 126 132 125 126 128 127 130 132 125 127 127 128 133 136
Long Haul 61 74 79 82 74 79 86 71 75 83 74 79 85 72 79 82
All International 166 203 205 214 199 205 214 198 205 215 199 206 212 200 212 218
Domestic 26 26 26 27 26 27 27 26 27 26 26 27 27 26 27 26
Total 192 229 231 241 225 232 241 224 232 241 225 233 239 226 239 244
5.42 With carbon capped Gatwick sees an increase in long-haul daily services in the
‘do minimum’ and a decline in short-haul services across all scenarios between 2030
and 2050.
5.43 Similar to the carbon-traded results the number of routes seeing at least a daily service
from Heathrow would decline over time in the ‘do minimum’, from 139 currently to
118-126 across the forecast scenarios.
5.44 The analysis presented below in Table 5.11 and Table 5.12 differs from the figures above
by not applying any service frequency threshold (and including charter). But, as these are
modelled destinations, all routes must pass a viability threshold.
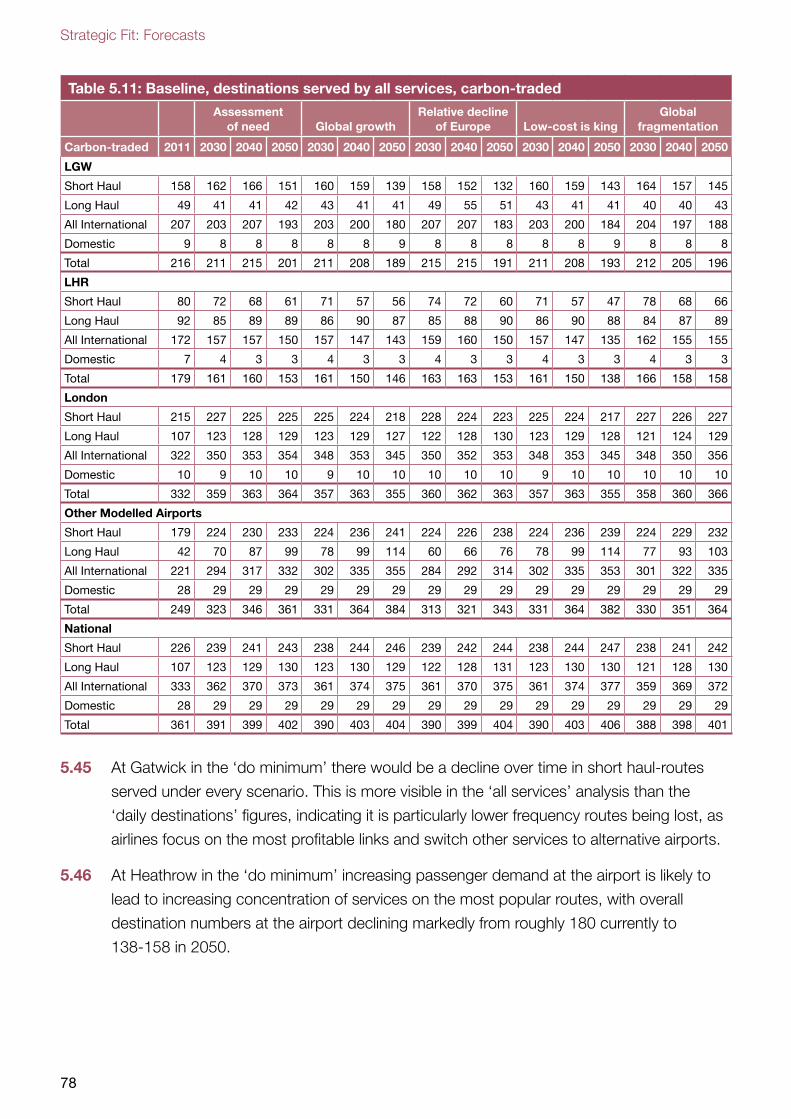
Strategic Fit: Forecasts
78
Table 5.11: Baseline, destinations served by all services, carbon-traded
Assessment of need Global growth
Relative decline of Europe Low-cost is king
Global fragmentation
Carbon-traded 2011 2030 2040 2050 2030 2040 2050 2030 2040 2050 2030 2040 2050 2030 2040 2050
LGW
Short Haul 158 162 166 151 160 159 139 158 152 132 160 159 143 164 157 145
Long Haul 49 41 41 42 43 41 41 49 55 51 43 41 41 40 40 43
All International 207 203 207 193 203 200 180 207 207 183 203 200 184 204 197 188
Domestic 9 8 8 8 8 8 9 8 8 8 8 8 9 8 8 8
Total 216 211 215 201 211 208 189 215 215 191 211 208 193 212 205 196
LHR
Short Haul 80 72 68 61 71 57 56 74 72 60 71 57 47 78 68 66
Long Haul 92 85 89 89 86 90 87 85 88 90 86 90 88 84 87 89
All International 172 157 157 150 157 147 143 159 160 150 157 147 135 162 155 155
Domestic 7 4 3 3 4 3 3 4 3 3 4 3 3 4 3 3
Total 179 161 160 153 161 150 146 163 163 153 161 150 138 166 158 158
London
Short Haul 215 227 225 225 225 224 218 228 224 223 225 224 217 227 226 227
Long Haul 107 123 128 129 123 129 127 122 128 130 123 129 128 121 124 129
All International 322 350 353 354 348 353 345 350 352 353 348 353 345 348 350 356
Domestic 10 9 10 10 9 10 10 10 10 10 9 10 10 10 10 10
Total 332 359 363 364 357 363 355 360 362 363 357 363 355 358 360 366
Other Modelled Airports
Short Haul 179 224 230 233 224 236 241 224 226 238 224 236 239 224 229 232
Long Haul 42 70 87 99 78 99 114 60 66 76 78 99 114 77 93 103
All International 221 294 317 332 302 335 355 284 292 314 302 335 353 301 322 335
Domestic 28 29 29 29 29 29 29 29 29 29 29 29 29 29 29 29
Total 249 323 346 361 331 364 384 313 321 343 331 364 382 330 351 364
National
Short Haul 226 239 241 243 238 244 246 239 242 244 238 244 247 238 241 242
Long Haul 107 123 129 130 123 130 129 122 128 131 123 130 130 121 128 130
All International 333 362 370 373 361 374 375 361 370 375 361 374 377 359 369 372
Domestic 28 29 29 29 29 29 29 29 29 29 29 29 29 29 29 29
Total 361 391 399 402 390 403 404 390 399 404 390 403 406 388 398 401
5.45 At Gatwick in the ‘do minimum’ there would be a decline over time in short haul-routes
served under every scenario. This is more visible in the ‘all services’ analysis than the
‘daily destinations’ figures, indicating it is particularly lower frequency routes being lost, as
airlines focus on the most profitable links and switch other services to alternative airports.
5.46 At Heathrow in the ‘do minimum’ increasing passenger demand at the airport is likely to
lead to increasing concentration of services on the most popular routes, with overall
destination numbers at the airport declining markedly from roughly 180 currently to
138-158 in 2050.
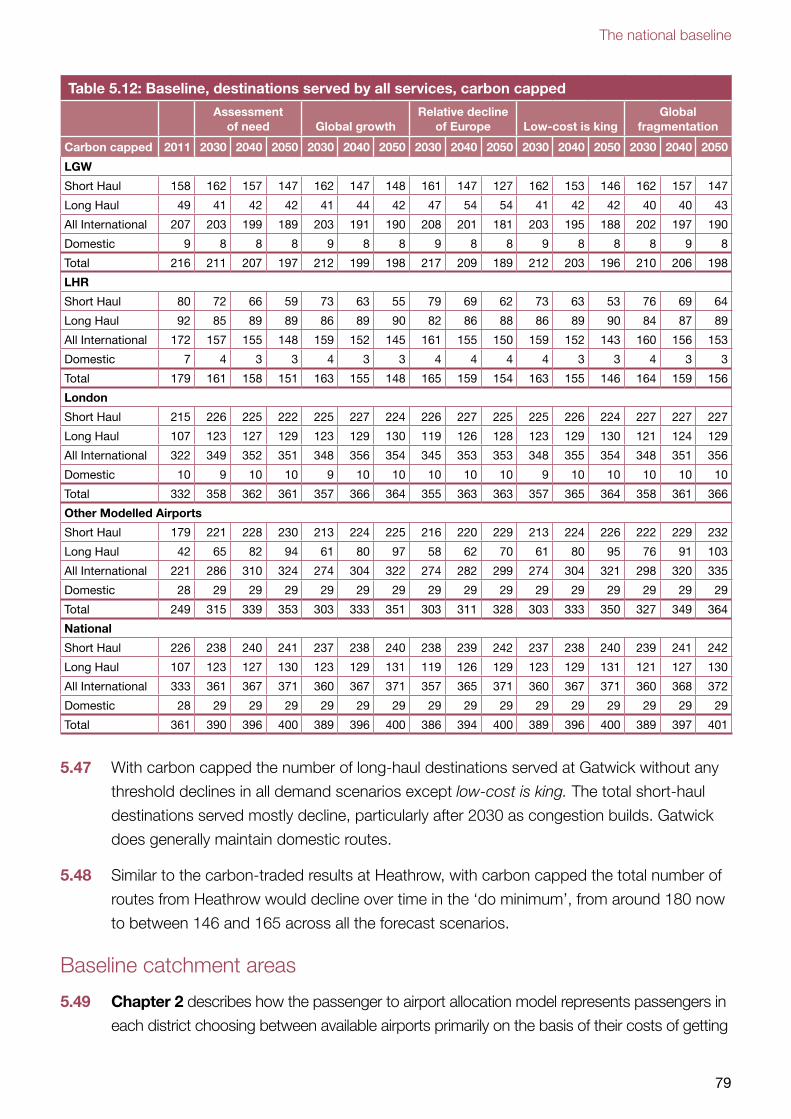
The national baseline
79
Table 5.12: Baseline, destinations served by all services, carbon capped
Assessment of need Global growth
Relative decline of Europe Low-cost is king
Global fragmentation
Carbon capped 2011 2030 2040 2050 2030 2040 2050 2030 2040 2050 2030 2040 2050 2030 2040 2050
LGW
Short Haul 158 162 157 147 162 147 148 161 147 127 162 153 146 162 157 147
Long Haul 49 41 42 42 41 44 42 47 54 54 41 42 42 40 40 43
All International 207 203 199 189 203 191 190 208 201 181 203 195 188 202 197 190
Domestic 9 8 8 8 9 8 8 9 8 8 9 8 8 8 9 8
Total 216 211 207 197 212 199 198 217 209 189 212 203 196 210 206 198
LHR
Short Haul 80 72 66 59 73 63 55 79 69 62 73 63 53 76 69 64
Long Haul 92 85 89 89 86 89 90 82 86 88 86 89 90 84 87 89
All International 172 157 155 148 159 152 145 161 155 150 159 152 143 160 156 153
Domestic 7 4 3 3 4 3 3 4 4 4 4 3 3 4 3 3
Total 179 161 158 151 163 155 148 165 159 154 163 155 146 164 159 156
London
Short Haul 215 226 225 222 225 227 224 226 227 225 225 226 224 227 227 227
Long Haul 107 123 127 129 123 129 130 119 126 128 123 129 130 121 124 129
All International 322 349 352 351 348 356 354 345 353 353 348 355 354 348 351 356
Domestic 10 9 10 10 9 10 10 10 10 10 9 10 10 10 10 10
Total 332 358 362 361 357 366 364 355 363 363 357 365 364 358 361 366
Other Modelled Airports
Short Haul 179 221 228 230 213 224 225 216 220 229 213 224 226 222 229 232
Long Haul 42 65 82 94 61 80 97 58 62 70 61 80 95 76 91 103
All International 221 286 310 324 274 304 322 274 282 299 274 304 321 298 320 335
Domestic 28 29 29 29 29 29 29 29 29 29 29 29 29 29 29 29
Total 249 315 339 353 303 333 351 303 311 328 303 333 350 327 349 364
National
Short Haul 226 238 240 241 237 238 240 238 239 242 237 238 240 239 241 242
Long Haul 107 123 127 130 123 129 131 119 126 129 123 129 131 121 127 130
All International 333 361 367 371 360 367 371 357 365 371 360 367 371 360 368 372
Domestic 28 29 29 29 29 29 29 29 29 29 29 29 29 29 29 29
Total 361 390 396 400 389 396 400 386 394 400 389 396 400 389 397 401
5.47 With carbon capped the number of long-haul destinations served at Gatwick without any
threshold declines in all demand scenarios except low-cost is king. The total short-haul
destinations served mostly decline, particularly after 2030 as congestion builds. Gatwick
does generally maintain domestic routes.
5.48 Similar to the carbon-traded results at Heathrow, with carbon capped the total number of
routes from Heathrow would decline over time in the ‘do minimum’, from around 180 now
to between 146 and 165 across all the forecast scenarios.
Baseline catchment areas
5.49 Chapter 2 describes how the passenger to airport allocation model represents passengers in
each district choosing between available airports primarily on the basis of their costs of getting
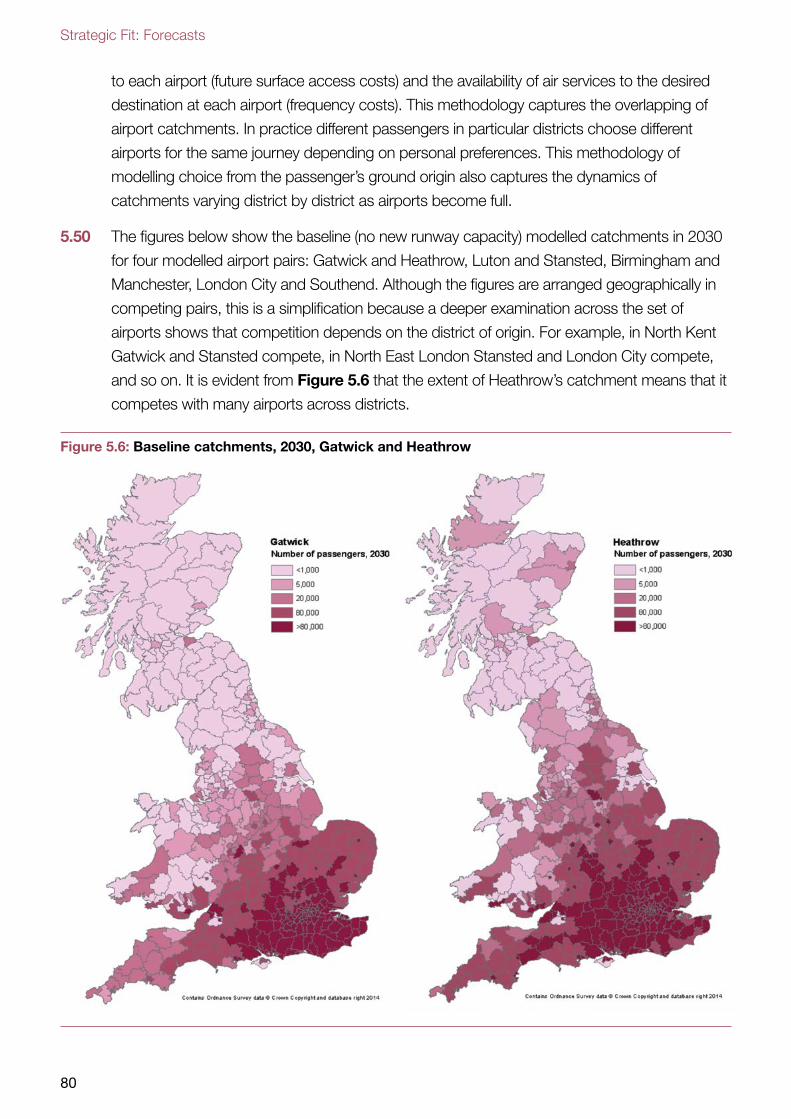
Strategic Fit: Forecasts
80
to each airport (future surface access costs) and the availability of air services to the desired
destination at each airport (frequency costs). This methodology captures the overlapping of
airport catchments. In practice different passengers in particular districts choose different
airports for the same journey depending on personal preferences. This methodology of
modelling choice from the passenger’s ground origin also captures the dynamics of
catchments varying district by district as airports become full.
5.50 The figures below show the baseline (no new runway capacity) modelled catchments in 2030
for four modelled airport pairs: Gatwick and Heathrow, Luton and Stansted, Birmingham and
Manchester, London City and Southend. Although the figures are arranged geographically in
competing pairs, this is a simplification because a deeper examination across the set of
airports shows that competition depends on the district of origin. For example, in North Kent
Gatwick and Stansted compete, in North East London Stansted and London City compete,
and so on. It is evident from Figure 5.6 that the extent of Heathrow’s catchment means that it
competes with many airports across districts.
Figure 5.6: Baseline catchments, 2030, Gatwick and Heathrow
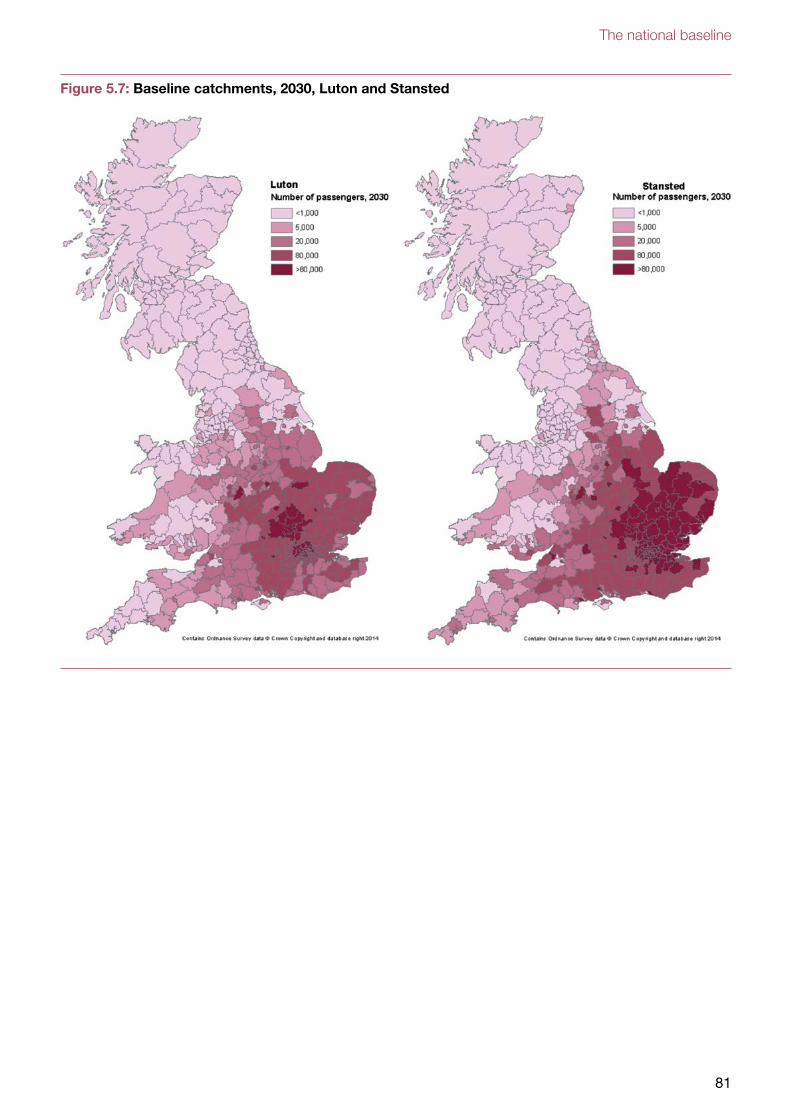
The national baseline
81
Figure 5.7: Baseline catchments, 2030, Luton and Stansted
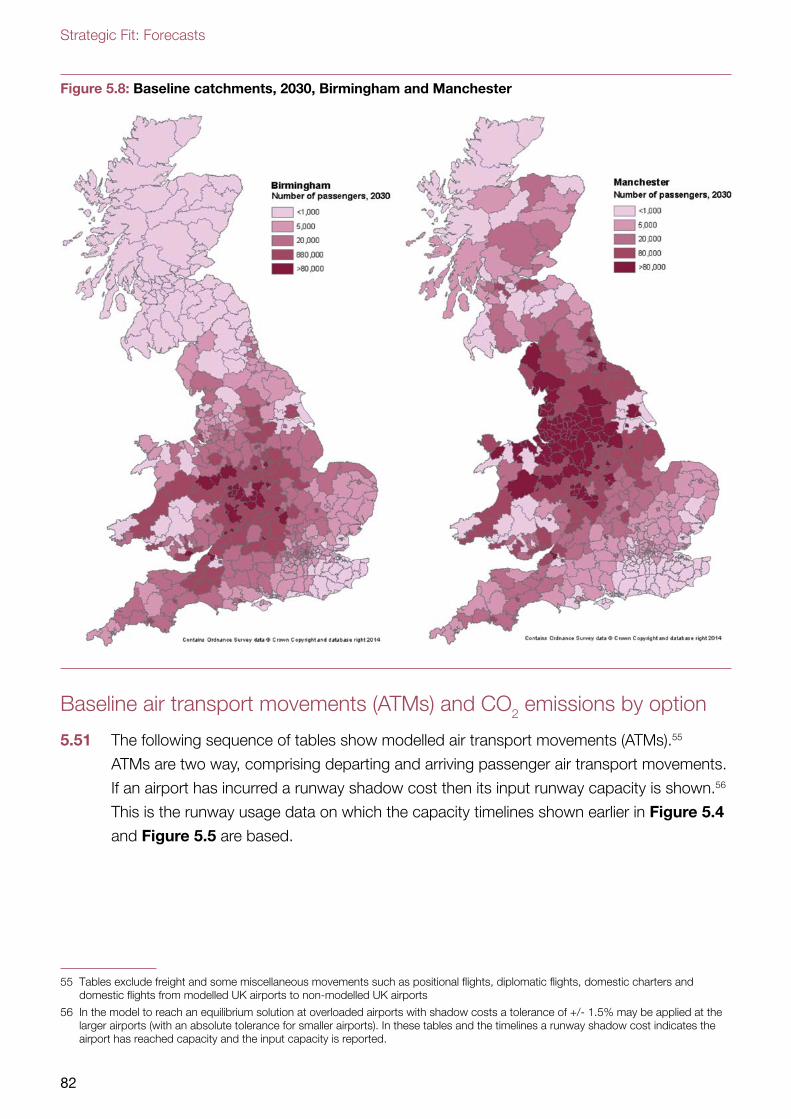
Strategic Fit: Forecasts
82
Figure 5.8: Baseline catchments, 2030, Birmingham and Manchester
Baseline air transport movements (ATMs) and CO2 emissions by option
5.51 The following sequence of tables show modelled air transport movements (ATMs).55
ATMs are two way, comprising departing and arriving passenger air transport movements.
If an airport has incurred a runway shadow cost then its input runway capacity is shown.56
This is the runway usage data on which the capacity timelines shown earlier in Figure 5.4
and Figure 5.5 are based.
55 Tables exclude freight and some miscellaneous movements such as positional flights, diplomatic flights, domestic charters and domestic flights from modelled UK airports to non-modelled UK airports
56 In the model to reach an equilibrium solution at overloaded airports with shadow costs a tolerance of +/- 1.5% may be applied at the larger airports (with an absolute tolerance for smaller airports). In these tables and the timelines a runway shadow cost indicates the airport has reached capacity and the input capacity is reported.
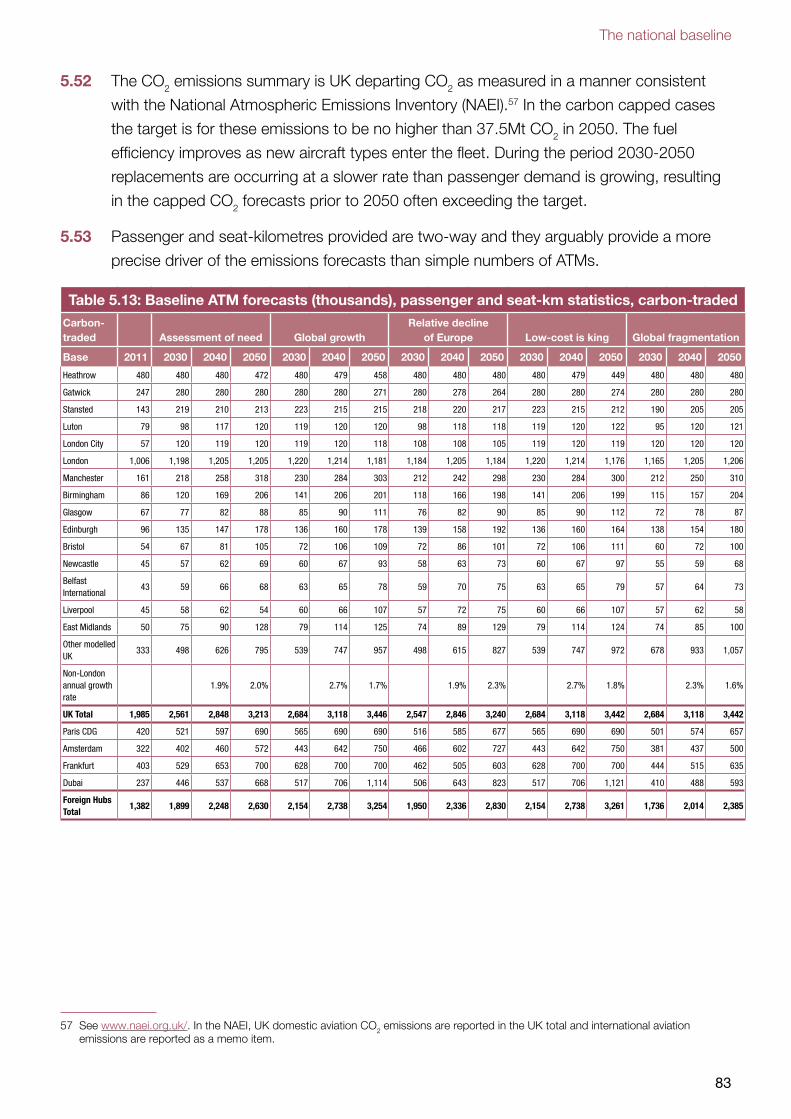
The national baseline
83
5.52 The CO2 emissions summary is UK departing CO2 as measured in a manner consistent
with the National Atmospheric Emissions Inventory (NAEI).57 In the carbon capped cases
the target is for these emissions to be no higher than 37.5Mt CO2 in 2050. The fuel
efficiency improves as new aircraft types enter the fleet. During the period 2030-2050
replacements are occurring at a slower rate than passenger demand is growing, resulting
in the capped CO2 forecasts prior to 2050 often exceeding the target.
5.53 Passenger and seat-kilometres provided are two-way and they arguably provide a more
precise driver of the emissions forecasts than simple numbers of ATMs.
Table 5.13: Baseline ATM forecasts (thousands), passenger and seat-km statistics, carbon-tradedCarbon-traded Assessment of need Global growth
Relative decline of Europe Low-cost is king Global fragmentation
Base 2011 2030 2040 2050 2030 2040 2050 2030 2040 2050 2030 2040 2050 2030 2040 2050
Heathrow 480 480 480 472 480 479 458 480 480 480 480 479 449 480 480 480
Gatwick 247 280 280 280 280 280 271 280 278 264 280 280 274 280 280 280
Stansted 143 219 210 213 223 215 215 218 220 217 223 215 212 190 205 205
Luton 79 98 117 120 119 120 120 98 118 118 119 120 122 95 120 121
London City 57 120 119 120 119 120 118 108 108 105 119 120 119 120 120 120
London 1,006 1,198 1,205 1,205 1,220 1,214 1,181 1,184 1,205 1,184 1,220 1,214 1,176 1,165 1,205 1,206
Manchester 161 218 258 318 230 284 303 212 242 298 230 284 300 212 250 310
Birmingham 86 120 169 206 141 206 201 118 166 198 141 206 199 115 157 204
Glasgow 67 77 82 88 85 90 111 76 82 90 85 90 112 72 78 87
Edinburgh 96 135 147 178 136 160 178 139 158 192 136 160 164 138 154 180
Bristol 54 67 81 105 72 106 109 72 86 101 72 106 111 60 72 100
Newcastle 45 57 62 69 60 67 93 58 63 73 60 67 97 55 59 68
Belfast International
43 59 66 68 63 65 78 59 70 75 63 65 79 57 64 73
Liverpool 45 58 62 54 60 66 107 57 72 75 60 66 107 57 62 58
East Midlands 50 75 90 128 79 114 125 74 89 129 79 114 124 74 85 100
Other modelled UK
333 498 626 795 539 747 957 498 615 827 539 747 972 678 933 1,057
Non-London annual growth rate
1.9% 2.0% 2.7% 1.7% 1.9% 2.3% 2.7% 1.8% 2.3% 1.6%
UK Total 1,985 2,561 2,848 3,213 2,684 3,118 3,446 2,547 2,846 3,240 2,684 3,118 3,442 2,684 3,118 3,442
Paris CDG 420 521 597 690 565 690 690 516 585 677 565 690 690 501 574 657
Amsterdam 322 402 460 572 443 642 750 466 602 727 443 642 750 381 437 500
Frankfurt 403 529 653 700 628 700 700 462 505 603 628 700 700 444 515 635
Dubai 237 446 537 668 517 706 1,114 506 643 823 517 706 1,121 410 488 593
Foreign Hubs Total
1,382 1,899 2,248 2,630 2,154 2,738 3,254 1,950 2,336 2,830 2,154 2,738 3,261 1,736 2,014 2,385
57 See www.naei.org.uk/. In the NAEI, UK domestic aviation CO2 emissions are reported in the UK total and international aviation emissions are reported as a memo item.
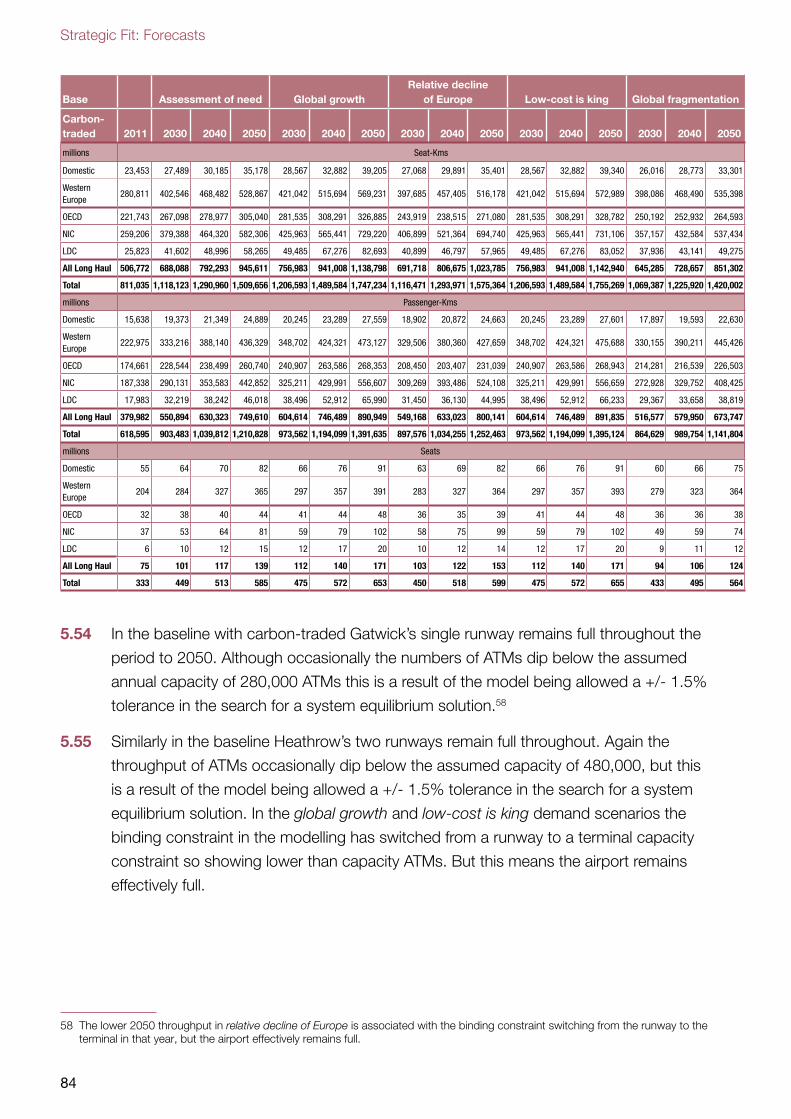
Strategic Fit: Forecasts
84
Base Assessment of need Global growthRelative decline
of Europe Low-cost is king Global fragmentation
Carbon-traded 2011 2030 2040 2050 2030 2040 2050 2030 2040 2050 2030 2040 2050 2030 2040 2050
millions Seat-Kms
Domestic 23,453 27,489 30,185 35,178 28,567 32,882 39,205 27,068 29,891 35,401 28,567 32,882 39,340 26,016 28,773 33,301
Western Europe
280,811 402,546 468,482 528,867 421,042 515,694 569,231 397,685 457,405 516,178 421,042 515,694 572,989 398,086 468,490 535,398
OECD 221,743 267,098 278,977 305,040 281,535 308,291 326,885 243,919 238,515 271,080 281,535 308,291 328,782 250,192 252,932 264,593
NIC 259,206 379,388 464,320 582,306 425,963 565,441 729,220 406,899 521,364 694,740 425,963 565,441 731,106 357,157 432,584 537,434
LDC 25,823 41,602 48,996 58,265 49,485 67,276 82,693 40,899 46,797 57,965 49,485 67,276 83,052 37,936 43,141 49,275
All Long Haul 506,772 688,088 792,293 945,611 756,983 941,008 1,138,798 691,718 806,675 1,023,785 756,983 941,008 1,142,940 645,285 728,657 851,302
Total 811,035 1,118,123 1,290,960 1,509,656 1,206,593 1,489,584 1,747,234 1,116,471 1,293,971 1,575,364 1,206,593 1,489,584 1,755,269 1,069,387 1,225,920 1,420,002
millions Passenger-Kms
Domestic 15,638 19,373 21,349 24,889 20,245 23,289 27,559 18,902 20,872 24,663 20,245 23,289 27,601 17,897 19,593 22,630
Western Europe
222,975 333,216 388,140 436,329 348,702 424,321 473,127 329,506 380,360 427,659 348,702 424,321 475,688 330,155 390,211 445,426
OECD 174,661 228,544 238,499 260,740 240,907 263,586 268,353 208,450 203,407 231,039 240,907 263,586 268,943 214,281 216,539 226,503
NIC 187,338 290,131 353,583 442,852 325,211 429,991 556,607 309,269 393,486 524,108 325,211 429,991 556,659 272,928 329,752 408,425
LDC 17,983 32,219 38,242 46,018 38,496 52,912 65,990 31,450 36,130 44,995 38,496 52,912 66,233 29,367 33,658 38,819
All Long Haul 379,982 550,894 630,323 749,610 604,614 746,489 890,949 549,168 633,023 800,141 604,614 746,489 891,835 516,577 579,950 673,747
Total 618,595 903,483 1,039,812 1,210,828 973,562 1,194,099 1,391,635 897,576 1,034,255 1,252,463 973,562 1,194,099 1,395,124 864,629 989,754 1,141,804
millions Seats
Domestic 55 64 70 82 66 76 91 63 69 82 66 76 91 60 66 75
Western Europe
204 284 327 365 297 357 391 283 327 364 297 357 393 279 323 364
OECD 32 38 40 44 41 44 48 36 35 39 41 44 48 36 36 38
NIC 37 53 64 81 59 79 102 58 75 99 59 79 102 49 59 74
LDC 6 10 12 15 12 17 20 10 12 14 12 17 20 9 11 12
All Long Haul 75 101 117 139 112 140 171 103 122 153 112 140 171 94 106 124
Total 333 449 513 585 475 572 653 450 518 599 475 572 655 433 495 564
5.54 In the baseline with carbon-traded Gatwick’s single runway remains full throughout the
period to 2050. Although occasionally the numbers of ATMs dip below the assumed
annual capacity of 280,000 ATMs this is a result of the model being allowed a +/- 1.5%
tolerance in the search for a system equilibrium solution.58
5.55 Similarly in the baseline Heathrow’s two runways remain full throughout. Again the
throughput of ATMs occasionally dip below the assumed capacity of 480,000, but this
is a result of the model being allowed a +/- 1.5% tolerance in the search for a system
equilibrium solution. In the global growth and low-cost is king demand scenarios the
binding constraint in the modelling has switched from a runway to a terminal capacity
constraint so showing lower than capacity ATMs. But this means the airport remains
effectively full.
58 The lower 2050 throughput in relative decline of Europe is associated with the binding constraint switching from the runway to the terminal in that year, but the airport effectively remains full.
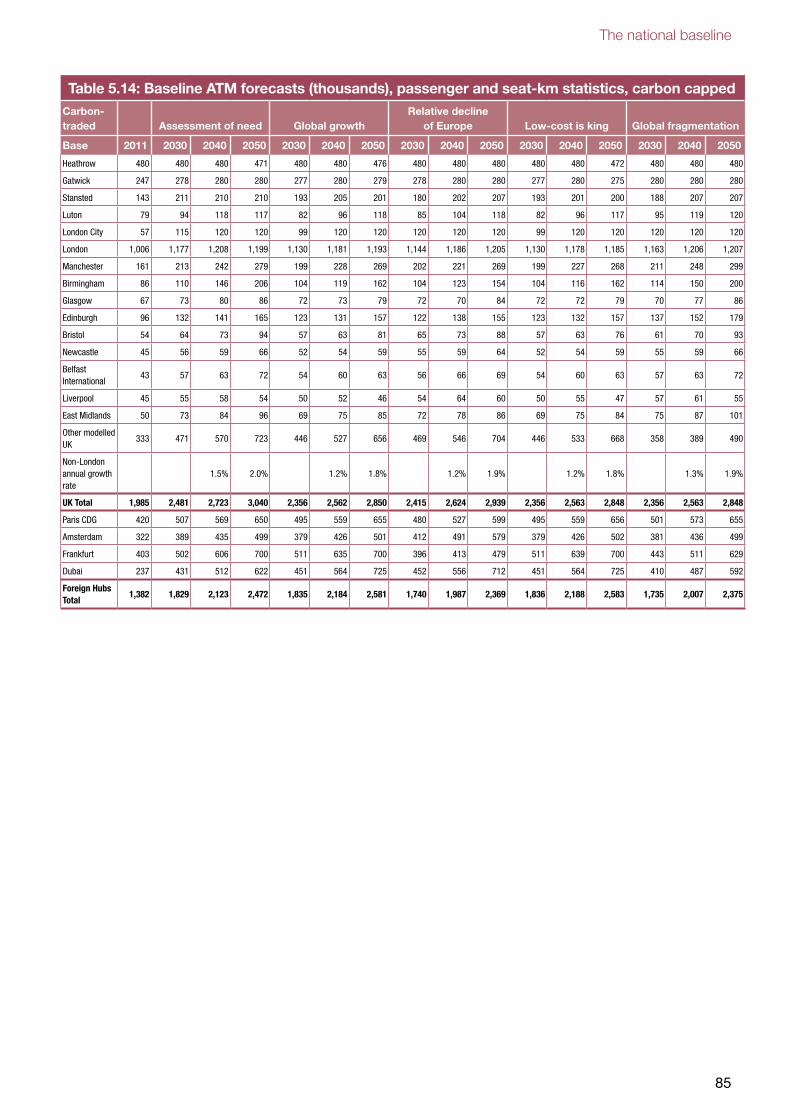
The national baseline
85
Table 5.14: Baseline ATM forecasts (thousands), passenger and seat-km statistics, carbon cappedCarbon-traded Assessment of need Global growth
Relative decline of Europe Low-cost is king Global fragmentation
Base 2011 2030 2040 2050 2030 2040 2050 2030 2040 2050 2030 2040 2050 2030 2040 2050
Heathrow 480 480 480 471 480 480 476 480 480 480 480 480 472 480 480 480
Gatwick 247 278 280 280 277 280 279 278 280 280 277 280 275 280 280 280
Stansted 143 211 210 210 193 205 201 180 202 207 193 201 200 188 207 207
Luton 79 94 118 117 82 96 118 85 104 118 82 96 117 95 119 120
London City 57 115 120 120 99 120 120 120 120 120 99 120 120 120 120 120
London 1,006 1,177 1,208 1,199 1,130 1,181 1,193 1,144 1,186 1,205 1,130 1,178 1,185 1,163 1,206 1,207
Manchester 161 213 242 279 199 228 269 202 221 269 199 227 268 211 248 299
Birmingham 86 110 146 206 104 119 162 104 123 154 104 116 162 114 150 200
Glasgow 67 73 80 86 72 73 79 72 70 84 72 72 79 70 77 86
Edinburgh 96 132 141 165 123 131 157 122 138 155 123 132 157 137 152 179
Bristol 54 64 73 94 57 63 81 65 73 88 57 63 76 61 70 93
Newcastle 45 56 59 66 52 54 59 55 59 64 52 54 59 55 59 66
Belfast International
43 57 63 72 54 60 63 56 66 69 54 60 63 57 63 72
Liverpool 45 55 58 54 50 52 46 54 64 60 50 55 47 57 61 55
East Midlands 50 73 84 96 69 75 85 72 78 86 69 75 84 75 87 101
Other modelled UK
333 471 570 723 446 527 656 469 546 704 446 533 668 358 389 490
Non-London annual growth rate
1.5% 2.0% 1.2% 1.8% 1.2% 1.9% 1.2% 1.8% 1.3% 1.9%
UK Total 1,985 2,481 2,723 3,040 2,356 2,562 2,850 2,415 2,624 2,939 2,356 2,563 2,848 2,356 2,563 2,848
Paris CDG 420 507 569 650 495 559 655 480 527 599 495 559 656 501 573 655
Amsterdam 322 389 435 499 379 426 501 412 491 579 379 426 502 381 436 499
Frankfurt 403 502 606 700 511 635 700 396 413 479 511 639 700 443 511 629
Dubai 237 431 512 622 451 564 725 452 556 712 451 564 725 410 487 592
Foreign Hubs Total
1,382 1,829 2,123 2,472 1,835 2,184 2,581 1,740 1,987 2,369 1,836 2,188 2,583 1,735 2,007 2,375
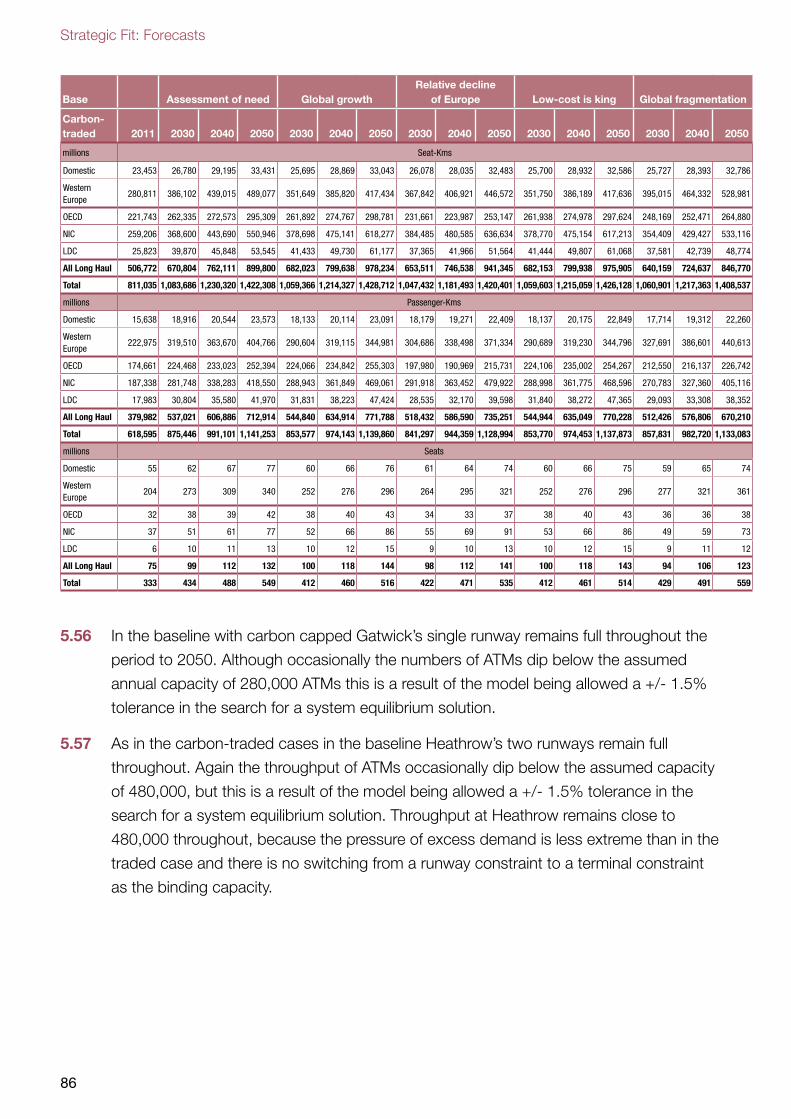
Strategic Fit: Forecasts
86
Base Assessment of need Global growthRelative decline
of Europe Low-cost is king Global fragmentation
Carbon-traded 2011 2030 2040 2050 2030 2040 2050 2030 2040 2050 2030 2040 2050 2030 2040 2050
millions Seat-Kms
Domestic 23,453 26,780 29,195 33,431 25,695 28,869 33,043 26,078 28,035 32,483 25,700 28,932 32,586 25,727 28,393 32,786
Western Europe
280,811 386,102 439,015 489,077 351,649 385,820 417,434 367,842 406,921 446,572 351,750 386,189 417,636 395,015 464,332 528,981
OECD 221,743 262,335 272,573 295,309 261,892 274,767 298,781 231,661 223,987 253,147 261,938 274,978 297,624 248,169 252,471 264,880
NIC 259,206 368,600 443,690 550,946 378,698 475,141 618,277 384,485 480,585 636,634 378,770 475,154 617,213 354,409 429,427 533,116
LDC 25,823 39,870 45,848 53,545 41,433 49,730 61,177 37,365 41,966 51,564 41,444 49,807 61,068 37,581 42,739 48,774
All Long Haul 506,772 670,804 762,111 899,800 682,023 799,638 978,234 653,511 746,538 941,345 682,153 799,938 975,905 640,159 724,637 846,770
Total 811,035 1,083,686 1,230,320 1,422,308 1,059,366 1,214,327 1,428,712 1,047,432 1,181,493 1,420,401 1,059,603 1,215,059 1,426,128 1,060,901 1,217,363 1,408,537
millions Passenger-Kms
Domestic 15,638 18,916 20,544 23,573 18,133 20,114 23,091 18,179 19,271 22,409 18,137 20,175 22,849 17,714 19,312 22,260
Western Europe
222,975 319,510 363,670 404,766 290,604 319,115 344,981 304,686 338,498 371,334 290,689 319,230 344,796 327,691 386,601 440,613
OECD 174,661 224,468 233,023 252,394 224,066 234,842 255,303 197,980 190,969 215,731 224,106 235,002 254,267 212,550 216,137 226,742
NIC 187,338 281,748 338,283 418,550 288,943 361,849 469,061 291,918 363,452 479,922 288,998 361,775 468,596 270,783 327,360 405,116
LDC 17,983 30,804 35,580 41,970 31,831 38,223 47,424 28,535 32,170 39,598 31,840 38,272 47,365 29,093 33,308 38,352
All Long Haul 379,982 537,021 606,886 712,914 544,840 634,914 771,788 518,432 586,590 735,251 544,944 635,049 770,228 512,426 576,806 670,210
Total 618,595 875,446 991,101 1,141,253 853,577 974,143 1,139,860 841,297 944,359 1,128,994 853,770 974,453 1,137,873 857,831 982,720 1,133,083
millions Seats
Domestic 55 62 67 77 60 66 76 61 64 74 60 66 75 59 65 74
Western Europe
204 273 309 340 252 276 296 264 295 321 252 276 296 277 321 361
OECD 32 38 39 42 38 40 43 34 33 37 38 40 43 36 36 38
NIC 37 51 61 77 52 66 86 55 69 91 53 66 86 49 59 73
LDC 6 10 11 13 10 12 15 9 10 13 10 12 15 9 11 12
All Long Haul 75 99 112 132 100 118 144 98 112 141 100 118 143 94 106 123
Total 333 434 488 549 412 460 516 422 471 535 412 461 514 429 491 559
5.56 In the baseline with carbon capped Gatwick’s single runway remains full throughout the
period to 2050. Although occasionally the numbers of ATMs dip below the assumed
annual capacity of 280,000 ATMs this is a result of the model being allowed a +/- 1.5%
tolerance in the search for a system equilibrium solution.
5.57 As in the carbon-traded cases in the baseline Heathrow’s two runways remain full
throughout. Again the throughput of ATMs occasionally dip below the assumed capacity
of 480,000, but this is a result of the model being allowed a +/- 1.5% tolerance in the
search for a system equilibrium solution. Throughput at Heathrow remains close to
480,000 throughout, because the pressure of excess demand is less extreme than in the
traded case and there is no switching from a runway constraint to a terminal constraint
as the binding capacity.
The national baseline
87
Baseline Passengers per ATM
5.58 The baseline passengers per passenger ATM (p/patm) for the five demand scenarios are
shown in Table 5.15. Note that this is not quite the same as the total terminal passengers
in Table 5.1 or Table 5.2 divided by the ATMs in Table 5.13 or Table 5.14 because the
ATM tables also include freight aircraft.
5.59 P/patms ( or ‘loads’) are expected to grow as a result of airlines using larger aircraft and
flying with higher load factors. Long-haul generally uses larger aircraft and a switch from
domestic and short-haul routes at an airport will normally produce an increase in the
p/patms. Where runway capacity is constrained and runway slots become increasingly
valuable there is also a further incentive for airlines to increase both aircraft size and
passenger load factor.
5.60 In the carbon-traded baseline case both Heathrow and Gatwick runways are under
pressure throughout the modelled period and both airports tend to have higher aircraft
loads in all scenarios and across more years than in options described in Chapter 6
where capacity is added. As fleet investment and fleet replacement has long lead times for
airlines much of these higher aircraft passenger loads in the base will be the result of
higher load factors rather than newer and bigger aircraft so will often be another indication
of less attractive flying conditions at capacity constrained London airports.
5.61 Generally capping carbon deters some long-haul flights through higher fares and this is
reflected in lower loads in most demand scenarios. It is noticeable that under the baseline
with no new runway capacity in London, the carbon capped and traded aircraft loads in
the global fragmentation scenario are almost identical. This is because very little additional
carbon cost has to be added because the carbon-traded emissions are close to the
37.5Mt CO2e target – see Figure 4.2.
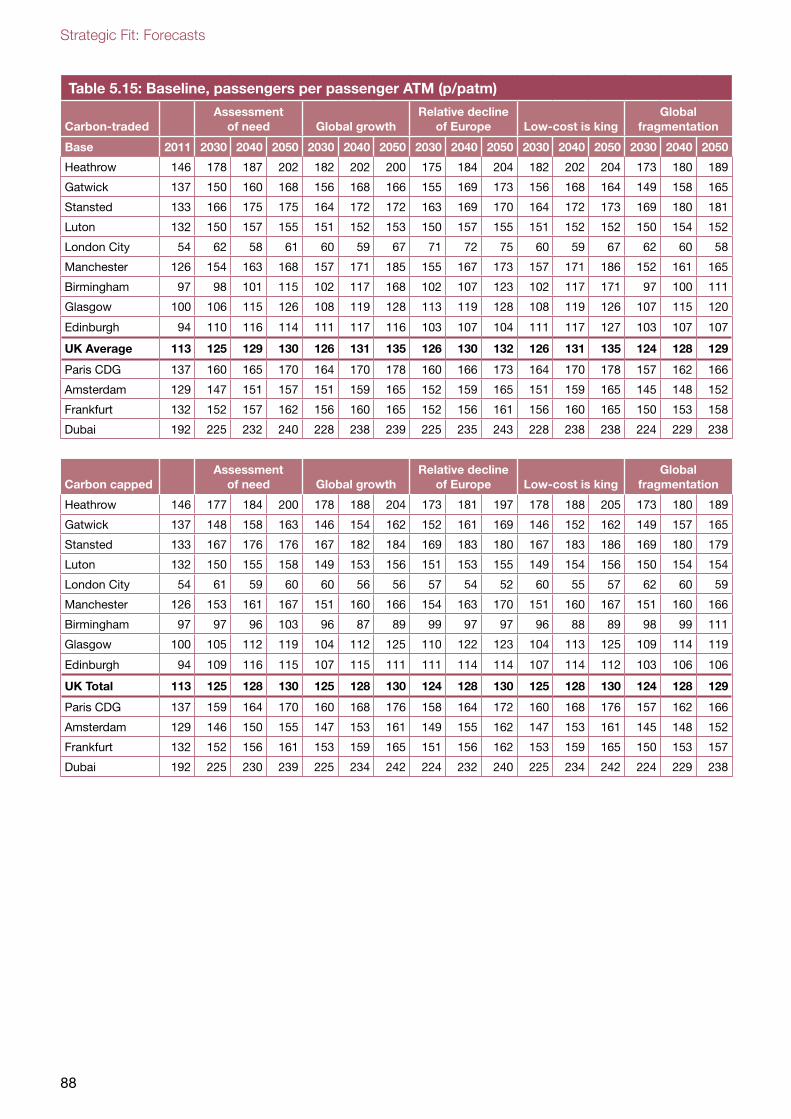
Strategic Fit: Forecasts
88
Table 5.15: Baseline, passengers per passenger ATM (p/patm)
Carbon-tradedAssessment
of need Global growthRelative decline
of Europe Low-cost is kingGlobal
fragmentation
Base 2011 2030 2040 2050 2030 2040 2050 2030 2040 2050 2030 2040 2050 2030 2040 2050
Heathrow 146 178 187 202 182 202 200 175 184 204 182 202 204 173 180 189
Gatwick 137 150 160 168 156 168 166 155 169 173 156 168 164 149 158 165
Stansted 133 166 175 175 164 172 172 163 169 170 164 172 173 169 180 181
Luton 132 150 157 155 151 152 153 150 157 155 151 152 152 150 154 152
London City 54 62 58 61 60 59 67 71 72 75 60 59 67 62 60 58
Manchester 126 154 163 168 157 171 185 155 167 173 157 171 186 152 161 165
Birmingham 97 98 101 115 102 117 168 102 107 123 102 117 171 97 100 111
Glasgow 100 106 115 126 108 119 128 113 119 128 108 119 126 107 115 120
Edinburgh 94 110 116 114 111 117 116 103 107 104 111 117 127 103 107 107
UK Average 113 125 129 130 126 131 135 126 130 132 126 131 135 124 128 129
Paris CDG 137 160 165 170 164 170 178 160 166 173 164 170 178 157 162 166
Amsterdam 129 147 151 157 151 159 165 152 159 165 151 159 165 145 148 152
Frankfurt 132 152 157 162 156 160 165 152 156 161 156 160 165 150 153 158
Dubai 192 225 232 240 228 238 239 225 235 243 228 238 238 224 229 238
Carbon cappedAssessment
of need Global growthRelative decline
of Europe Low-cost is kingGlobal
fragmentation
Heathrow 146 177 184 200 178 188 204 173 181 197 178 188 205 173 180 189
Gatwick 137 148 158 163 146 154 162 152 161 169 146 152 162 149 157 165
Stansted 133 167 176 176 167 182 184 169 183 180 167 183 186 169 180 179
Luton 132 150 155 158 149 153 156 151 153 155 149 154 156 150 154 154
London City 54 61 59 60 60 56 56 57 54 52 60 55 57 62 60 59
Manchester 126 153 161 167 151 160 166 154 163 170 151 160 167 151 160 166
Birmingham 97 97 96 103 96 87 89 99 97 97 96 88 89 98 99 111
Glasgow 100 105 112 119 104 112 125 110 122 123 104 113 125 109 114 119
Edinburgh 94 109 116 115 107 115 111 111 114 114 107 114 112 103 106 106
UK Total 113 125 128 130 125 128 130 124 128 130 125 128 130 124 128 129
Paris CDG 137 159 164 170 160 168 176 158 164 172 160 168 176 157 162 166
Amsterdam 129 146 150 155 147 153 161 149 155 162 147 153 161 145 148 152
Frankfurt 132 152 156 161 153 159 165 151 156 162 153 159 165 150 153 157
Dubai 192 225 230 239 225 234 242 224 232 240 225 234 242 224 229 238
Option passenger forecasts
89
6. Option passenger forecasts
6.1 This chapter sets out the forecasts of future airport usage when the various scenarios of
future national demand described in the previous chapter are allocated by the DfT’s
National Air Passenger Demand Model (NAPAM) to UK and international hub airports.
All forecasts are constrained to airport capacity. This methodology is described in
Chapter 2. When demand exceeds capacity at individual airports a ‘shadow cost’ is
applied and excess demand is either suppressed or moves to another airport in the
system which can viably supply the air service demanded. As discussed in paragraph
2.13, this is a quite different and more realistic form of passenger allocation to particular
airports than the unconstrained style of forecasts used in the assessment of overall
national need in the Interim Report.
Capacity options
6.2 Airport usage forecasts are provided for the three additional capacity options:
1. LGW 2R Gatwick Airport Second Runway doubling the airport capacity from
280,000 to 560,000 ATMs per annum from 2025.
2. LHR NWR Heathrow Airport North West Runway increasing the airport capacity from
480,000 to 740,000 ATMs per annum from 2026.
3. LHR ENR Heathrow Airport Extended Northern Runway permitting mixed mode
operations and increasing the airport capacity from 480,000 to 700,000 ATMs per
annum from 2026.
6.3 In each option where new runway capacity is provided terminal capacity is assumed to be
unconstrained. Terminals are therefore assumed to expand to meet the number of
passengers demanding use of the runway. The passenger forecasts may therefore
sometimes exceed the terminal capacities used elsewhere in the appraisal. In the
Operational Efficiency module it is noted that the airport operator would be expected to
increase terminal capacity to meet demand.
Strategic Fit: Forecasts
90
Demand scenarios
6.4 Forecasts have been produced for five future demand scenarios, labelled assessment of
need to global fragmentation.
6.5 The assessment of need scenario has a range around the main case: the same
approach as adopted in the Interim Report. The range has been updated as described in
Chapter 3. In this chapter and Appendix 3 a total demand cases for which there are
airport usage forecasts are presented for the assessment of need scenario:
1. Carbon-Traded: This is the ‘central’ of the Monte Carlo based assessment of need
forecasts consistent with the Interim Report case. Here ‘central’ means that there is a
50% probability that the outcome will be higher than the forecast and likewise a 50%
probability that the outcome will be lower than the forecast. In this scenario it is
assumed that carbon is traded. This means that a global emissions trading scheme is
in place and passengers pay the forecast carbon-traded price, but there is no capping
of UK CO2 emissions to a target value.
2. Carbon Capped: This is a variant on the ‘central’ forecast above where UK aviation
CO2 emissions are capped to 37.5Mt in 2050.
3. Low: This is the low range of the Monte Carlo based assessment of need forecasts
consistent with the Interim Report case. Here low means that it is expected that there
is only a 20% probability that the outcome demand will be lower than the forecast.
4. High: This is the high range of the Monte Carlo based assessment of need forecasts
consistent with the Interim Report case. Here high means that it is expected that there
is only a 20% probability that the outcome demand will be higher than the forecast.
6.6 Carbon capped forecasts are not presented for the assessment of need low range
forecasts because in this scenario with even the highest capacity increment option (LHR
NWR), CO2 emissions are within the target of 37.5Mt in 2050. Carbon capping forecasts
are not presented for high range forecasts because in this scenario the excess of demand
over capacity prevents the model traded carbon runs from reaching 2050. So the effect of
capping carbon to the 37.5Mt target would be to produce a forecast not significantly
different from the central assessment of need carbon capped forecast.
6.7 As Chapters 1 and 3 describe, these scenarios have been further developed, in particular
and where possible, to introduce elements of airline behaviour in response to capacity
changes into the modelling. This also means that option specific supply-side effects were
introduced into specific capacity options as described in Chapter 3 (e.g. where Gatwick
capacity is expanded, an alliance relocates).
Option passenger forecasts
91
6.8 Global growth: this scenario sees higher passenger demand from all world regions,
coupled with lower operating costs. In the Gatwick Airport Second Runway option the
SkyTeam alliance moves from Heathrow to Gatwick when the second runway opens.
No airport specific interventions are assumed for either of the Heathrow options.
6.9 Relative decline of Europe: this scenario sees higher growth of passenger demand in
emerging economies, a strengthened position of Far and Middle Eastern aviation hubs
and their airlines. In the Gatwick Airport Second Runway option a Middle-Eastern airline
purchases a controlling equity stake in the LCCs at Gatwick to provide feeder traffic to its
hub with a corresponding increase to Dubai.59 In the Heathrow options a Middle Eastern
airline takes controlling equity stake in the airline with the most slots at Heathrow
(assumed to be BA) to provide feeder services to its home hub. Long-haul North Atlantic
and African services are retained but services beyond the Middle East are dropped. LCCs
use the spare slots to develop a limited network of services.
6.10 Low-cost is king: this scenario sees the LCC model expanding to new markets,
including long haul with higher passenger demand from all world regions, and lower airline
operating costs. In the Gatwick Airport Second Runway option the new capacity allows
enhanced transfer opportunities and a significant growth in long-haul services fed by
independently operated LCC services. In the Heathrow options LCCs are allowed to
develop a limited network of services.
6.11 Global fragmentation: this scenario sees world economies close themselves off by
adopting more interventionist national policy models with a global decline in passenger
demand coupled with higher operating costs and the UK introducing a stand-alone cap of
37.5Mt of CO2 emissions while no global carbon agreement is reached. There are no
option specific interventions at Heathrow or Gatwick.
6.12 All five scenarios are presented for both carbon-traded and carbon capped demand
cases. The carbon capping does significantly diminish the differences between each of
these scenarios.
Option passenger demand forecasts with capacity timelines
6.13 The following sequence of figures shows airport forecasts for all five scenarios (carbon-
traded and carbon capped) for each of the three capacity options in turn. Terminal
passenger tables are in millions of terminal passengers per annum for 2030, 2040 and
2050. The tables separately report the five London airports, the nine largest regional
airports and the four modelled overseas hubs. The remaining 17 UK airports (although
separately modelled) are grouped.
59 Note that with its effectively unlimited capacity, Dubai is treated as a proxy for other hubs in the region.
Strategic Fit: Forecasts
92
6.14 The timelines show when runway capacity at each of the five London airports is
exhausted in red with amber indicating less than 10% of runway capacity remaining.
An airport is set to red when a shadow cost has been incurred. As discussed earlier in
paragraph 5.10, that shadow cost could be triggered by a runway or terminal constraint.
However in the case of Heathrow and Gatwick this will be a runway constraint, as in the
capacity options the expanded airport is given infinite terminal capacity. Stansted, Luton
and London City can incur either a runway or terminal capacity shadow cost depending
on demand scenario and runway option. If they incur terminal shadow costs they can be
shown as going straight from green to red.
6.15 It should be noted that 100% utilisation of the theoretical maximum runway capacity
across the whole of the London airport system is unlikely to be either desirable or feasible.
It would create airspace challenges and reduce resilience. In addition, these timelines do
not give an indication as to how much capacity remains at an airport until it hits 90% of its
capacity, therefore they should be considered as only one piece of infomation, to be
viewed alongside the passenger and ATM forecast tables rather than in isolation.
6.16 Note that all 2011 passenger data shown in the tables is from the base year validated
model outputs.
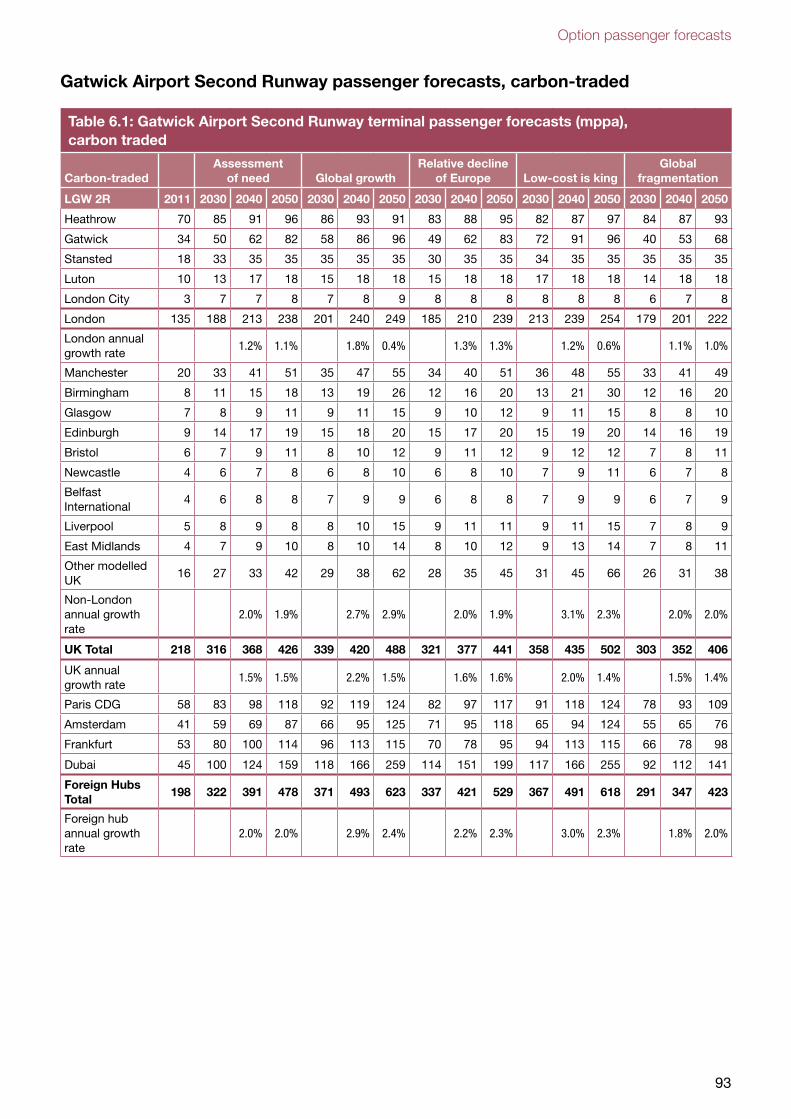
Option passenger forecasts
93
Gatwick Airport Second Runway passenger forecasts, carbon-traded
Table 6.1: Gatwick Airport Second Runway terminal passenger forecasts (mppa), carbon traded
Carbon-tradedAssessment
of need Global growthRelative decline
of Europe Low-cost is kingGlobal
fragmentation
LGW 2R 2011 2030 2040 2050 2030 2040 2050 2030 2040 2050 2030 2040 2050 2030 2040 2050
Heathrow 70 85 91 96 86 93 91 83 88 95 82 87 97 84 87 93
Gatwick 34 50 62 82 58 86 96 49 62 83 72 91 96 40 53 68
Stansted 18 33 35 35 35 35 35 30 35 35 34 35 35 35 35 35
Luton 10 13 17 18 15 18 18 15 18 18 17 18 18 14 18 18
London City 3 7 7 8 7 8 9 8 8 8 8 8 8 6 7 8
London 135 188 213 238 201 240 249 185 210 239 213 239 254 179 201 222
London annual growth rate
1.2% 1.1% 1.8% 0.4% 1.3% 1.3% 1.2% 0.6% 1.1% 1.0%
Manchester 20 33 41 51 35 47 55 34 40 51 36 48 55 33 41 49
Birmingham 8 11 15 18 13 19 26 12 16 20 13 21 30 12 16 20
Glasgow 7 8 9 11 9 11 15 9 10 12 9 11 15 8 8 10
Edinburgh 9 14 17 19 15 18 20 15 17 20 15 19 20 14 16 19
Bristol 6 7 9 11 8 10 12 9 11 12 9 12 12 7 8 11
Newcastle 4 6 7 8 6 8 10 6 8 10 7 9 11 6 7 8
Belfast International
4 6 8 8 7 9 9 6 8 8 7 9 9 6 7 9
Liverpool 5 8 9 8 8 10 15 9 11 11 9 11 15 7 8 9
East Midlands 4 7 9 10 8 10 14 8 10 12 9 13 14 7 8 11
Other modelled UK
16 27 33 42 29 38 62 28 35 45 31 45 66 26 31 38
Non-London annual growth rate
2.0% 1.9% 2.7% 2.9% 2.0% 1.9% 3.1% 2.3% 2.0% 2.0%
UK Total 218 316 368 426 339 420 488 321 377 441 358 435 502 303 352 406
UK annual growth rate
1.5% 1.5% 2.2% 1.5% 1.6% 1.6% 2.0% 1.4% 1.5% 1.4%
Paris CDG 58 83 98 118 92 119 124 82 97 117 91 118 124 78 93 109
Amsterdam 41 59 69 87 66 95 125 71 95 118 65 94 124 55 65 76
Frankfurt 53 80 100 114 96 113 115 70 78 95 94 113 115 66 78 98
Dubai 45 100 124 159 118 166 259 114 151 199 117 166 255 92 112 141
Foreign Hubs Total
198 322 391 478 371 493 623 337 421 529 367 491 618 291 347 423
Foreign hub annual growth rate
2.0% 2.0% 2.9% 2.4% 2.2% 2.3% 3.0% 2.3% 1.8% 2.0%
Strategic Fit: Forecasts
94
6.17 In the Gatwick Airport Second Runway (LGW 2R) option a new 280,000 capacity runway
is added in 2025 while all other airports retain their baseline capacities. With the new
runway, the number of passengers using Gatwick by 2050 ranges from 68 mppa in global
fragmentation to 96 mppa in low-cost is king. Compared to the 34 mppa who travelled
through Gatwick in 2011, every scenario shows a large increase in traffic.
6.18 Overall with a Gatwick Airport Second Runway the share of national traffic handled by
London airports is highest in assessment of need at 56% and lowest under global growth
and low-cost is king (around 51%). This differs from the baseline where London has a
smaller share of national traffic.
6.19 In 2050 the number of passengers using regional UK airports ranges from 184 mppa in
global fragmentation to 248 mppa in low-cost is king. Traffic numbers at some regional
airports vary significantly between scenarios. By 2050 Manchester’s throughput lies in the
relatively narrow range 50 to 55 mppa in all scenarios but Birmingham, more affected by
spill from London, varies between 18 and 28 mppa. The passenger demand for the
regional airports is lower in all scenarios compared to the baseline as Gatwick attracts
back some demand displaced into the regions in the baseline where all London airports
are full by 2050.
6.20 Gatwick Airport Limited’s forecasts predict similar levels of passenger demand at the
airport in 2050 as the Commission’s global growth and low-cost is king scenarios, driven
by significant growth in short-haul and low-cost traffic, including potential expansion by
low-cost carriers into long-haul. Gatwick Airport Limited also assumes an increase in other
long-haul carriers’ presence at the expanded airport, which would offer an alternative
option to a constrained Heathrow for accessing London’s large origin-and-destination
market. In contrast to the global growth scenario, however, it does not assume that an
airline alliance would move from Heathrow to Gatwick.
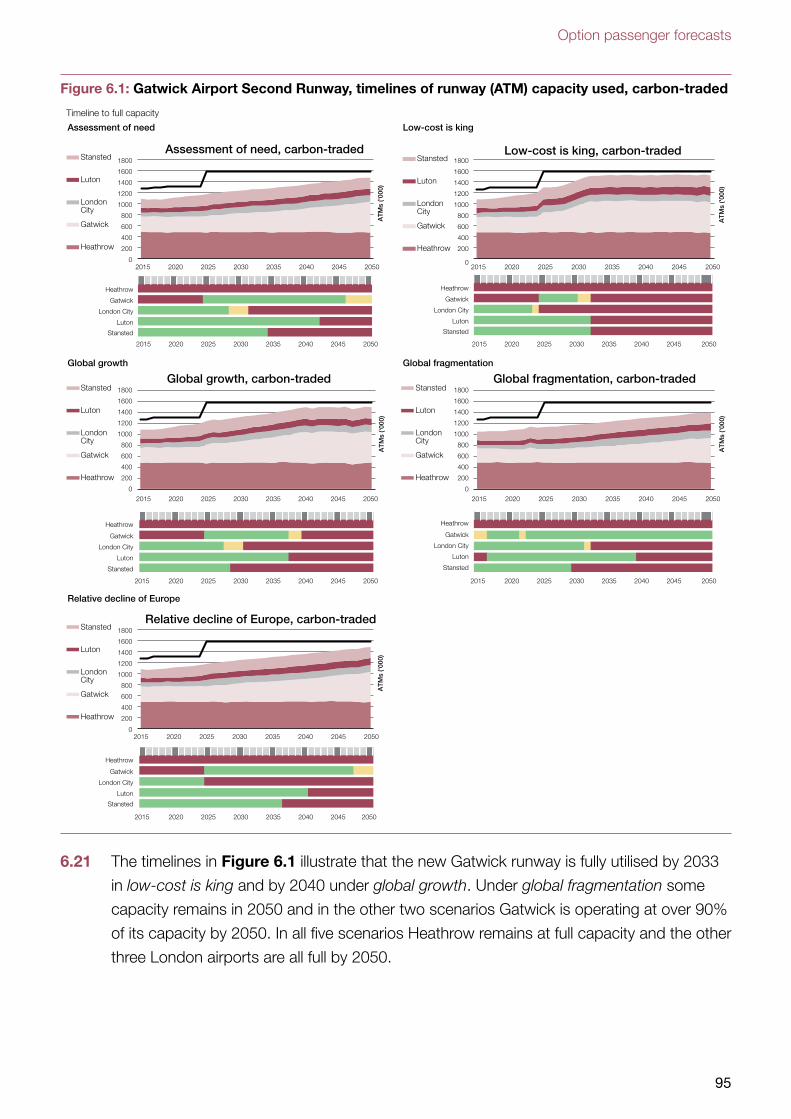
Option passenger forecasts
95
Figure 6.1: Gatwick Airport Second Runway, timelines of runway (ATM) capacity used, carbon-traded
Timeline to full capacity
Assessment of need Low-cost is king
Global growth Global fragmentation
Relative decline of Europe
AT
Ms
('000
)
Assessment of need, carbon-tradedStansted
Luton
LondonCity
Gatwick
Heathrow
AT
Ms
('000
)Global growth, carbon-traded
Stansted
Luton
LondonCity
Gatwick
Heathrow
AT
Ms
('000
)
Relative decline of Europe, carbon-tradedStansted
Luton
LondonCity
Gatwick
HeathrowA
TM
s ('0
00)
Low-cost is king, carbon-tradedStansted
Luton
LondonCity
Gatwick
Heathrow
AT
Ms
('000
)
Global fragmentation, carbon-tradedStansted
Luton
LondonCity
Gatwick
Heathrow
Heathrow Heathrow
Gatwick Gatwick
London City London City
Luton Luton
Stansted Stansted
Heathrow Heathrow
Gatwick Gatwick
London City London City
Luton Luton
Stansted Stansted
Heathrow
Gatwick
London City
Luton
Stansted
2015 2020 2025 2030 2035 2040 2045 2050
2015 2020 2025 2030 2035 2040 2045 2050
2020 2025 2030 2035 2040
2015
2015 2050
2015
2045
2020 2025 2030 2035 2040 2045 2050 2045 2050
2015 2050
2020 2025 2030 2035 2040
2040 20452020 2025 2030 2035
0
200
400
600
800
1000
1200
1400
1600
1800
2015 2020 2025 2030 2035 2040 2045 2050
0
200
400
600
800
1000
1200
1400
1600
1800
0
200
400
600
800
1000
1200
1400
1600
1800
2015 2020 2025 2030 2035 2040 2045 2050
0
0
200
400
600
800
1000
1200
1400
1600
1800
2015 2020 2025 2030 2035 2040 2045 2050
200
400
600
800
1000
1200
1400
1600
1800
2015 2020 2025 2030 2035 2040 2045 2050
6.21 The timelines in Figure 6.1 illustrate that the new Gatwick runway is fully utilised by 2033
in low-cost is king and by 2040 under global growth. Under global fragmentation some
capacity remains in 2050 and in the other two scenarios Gatwick is operating at over 90%
of its capacity by 2050. In all five scenarios Heathrow remains at full capacity and the other
three London airports are all full by 2050.
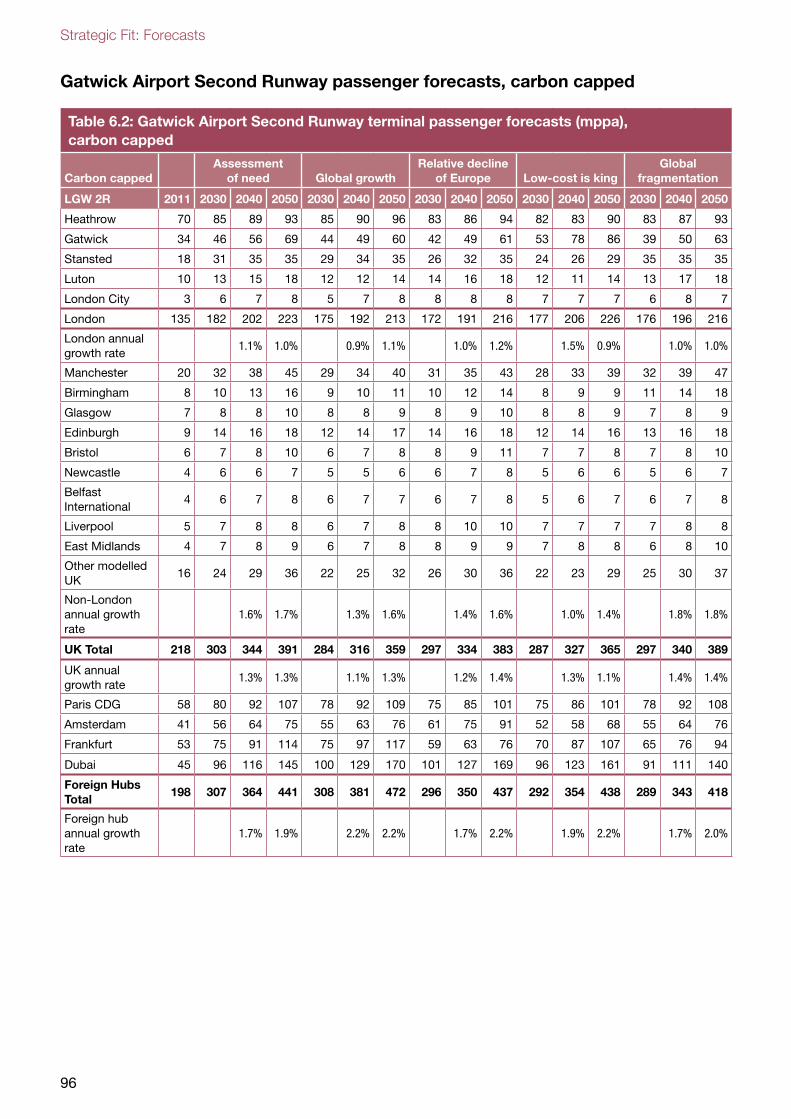
Strategic Fit: Forecasts
96
Gatwick Airport Second Runway passenger forecasts, carbon capped
Table 6.2: Gatwick Airport Second Runway terminal passenger forecasts (mppa), carbon capped
Carbon cappedAssessment
of need Global growthRelative decline
of Europe Low-cost is kingGlobal
fragmentation
LGW 2R 2011 2030 2040 2050 2030 2040 2050 2030 2040 2050 2030 2040 2050 2030 2040 2050
Heathrow 70 85 89 93 85 90 96 83 86 94 82 83 90 83 87 93
Gatwick 34 46 56 69 44 49 60 42 49 61 53 78 86 39 50 63
Stansted 18 31 35 35 29 34 35 26 32 35 24 26 29 35 35 35
Luton 10 13 15 18 12 12 14 14 16 18 12 11 14 13 17 18
London City 3 6 7 8 5 7 8 8 8 8 7 7 7 6 8 7
London 135 182 202 223 175 192 213 172 191 216 177 206 226 176 196 216
London annual growth rate
1.1% 1.0% 0.9% 1.1% 1.0% 1.2% 1.5% 0.9% 1.0% 1.0%
Manchester 20 32 38 45 29 34 40 31 35 43 28 33 39 32 39 47
Birmingham 8 10 13 16 9 10 11 10 12 14 8 9 9 11 14 18
Glasgow 7 8 8 10 8 8 9 8 9 10 8 8 9 7 8 9
Edinburgh 9 14 16 18 12 14 17 14 16 18 12 14 16 13 16 18
Bristol 6 7 8 10 6 7 8 8 9 11 7 7 8 7 8 10
Newcastle 4 6 6 7 5 5 6 6 7 8 5 6 6 5 6 7
Belfast International
4 6 7 8 6 7 7 6 7 8 5 6 7 6 7 8
Liverpool 5 7 8 8 6 7 8 8 10 10 7 7 7 7 8 8
East Midlands 4 7 8 9 6 7 8 8 9 9 7 8 8 6 8 10
Other modelled UK
16 24 29 36 22 25 32 26 30 36 22 23 29 25 30 37
Non-London annual growth rate
1.6% 1.7% 1.3% 1.6% 1.4% 1.6% 1.0% 1.4% 1.8% 1.8%
UK Total 218 303 344 391 284 316 359 297 334 383 287 327 365 297 340 389
UK annual growth rate
1.3% 1.3% 1.1% 1.3% 1.2% 1.4% 1.3% 1.1% 1.4% 1.4%
Paris CDG 58 80 92 107 78 92 109 75 85 101 75 86 101 78 92 108
Amsterdam 41 56 64 75 55 63 76 61 75 91 52 58 68 55 64 76
Frankfurt 53 75 91 114 75 97 117 59 63 76 70 87 107 65 76 94
Dubai 45 96 116 145 100 129 170 101 127 169 96 123 161 91 111 140
Foreign Hubs Total
198 307 364 441 308 381 472 296 350 437 292 354 438 289 343 418
Foreign hub annual growth rate
1.7% 1.9% 2.2% 2.2% 1.7% 2.2% 1.9% 2.2% 1.7% 2.0%
Option passenger forecasts
97
6.22 The effect of capping carbon emissions at a level consistent with current plans to meet UK
climate targets is to reduce the level of demand in the system under every scenario, and to
reduce the difference between demand scenarios in the Gatwick Airport Second Runway
option. The number of passengers using Gatwick by 2050 ranges from 60 mppa in global
growth to 86 mppa in low-cost is king. Carbon capping tends to favour shorter flights, so
the scenario which most favours the low-cost model makes greatest use of the new
capacity.
6.23 Overall carbon capping leads to national forecasts very similar to the baseline by 2050,
although the allocation of demand between airports and market sectors changes more
significantly. Unlike the carbon-traded case, London gains the highest share of traffic
under low-cost is king (62%) and the lowest under global fragmentation – the same
pattern as in the baseline.
6.24 In 2050 traffic at regional airports is similar to the baseline and ranges from 139 mppa in
low-cost is king to 173 mppa in global fragmentation. Regional demand is lower than the
baseline under all scenarios as London gains a higher share of traffic under all Gatwick
Airport Second Runway carbon capped cases compared to the baseline.
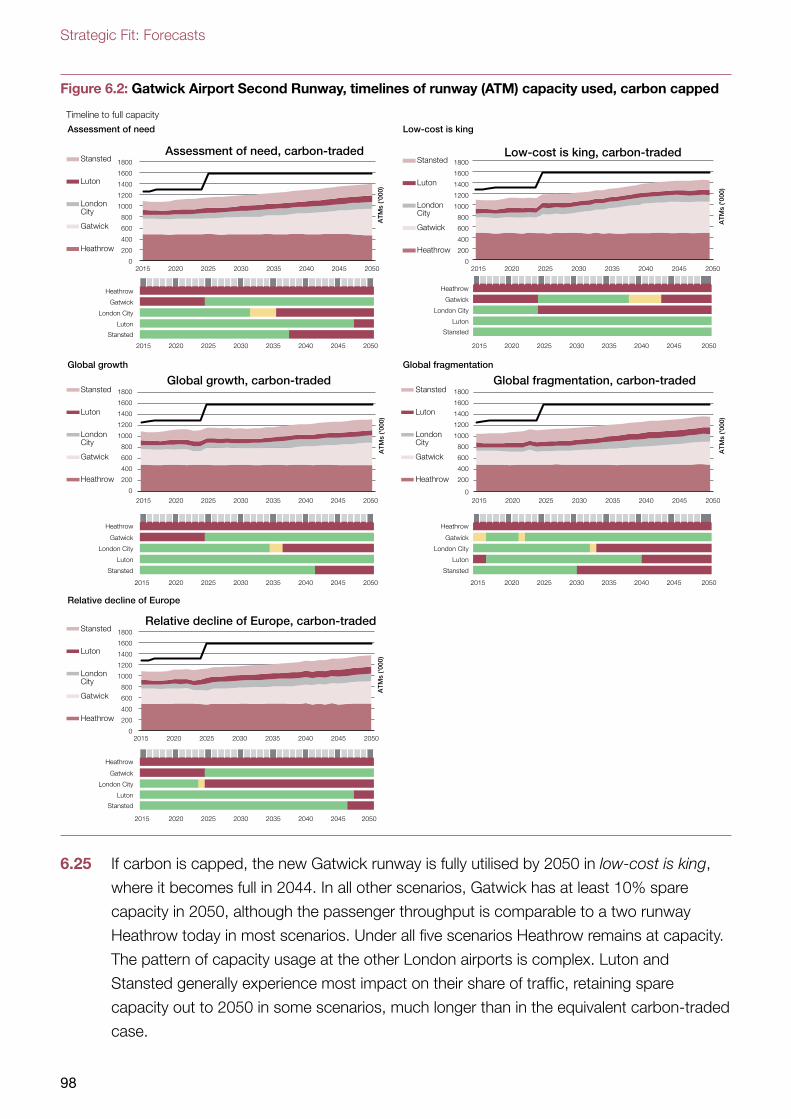
Strategic Fit: Forecasts
98
Figure 6.2: Gatwick Airport Second Runway, timelines of runway (ATM) capacity used, carbon capped
Timeline to full capacity
Assessment of need Low-cost is king
Global growth Global fragmentation
Relative decline of Europe
AT
Ms
('000
)
Assessment of need, carbon-tradedStansted
Luton
LondonCity
Gatwick
Heathrow
AT
Ms
('000
)Global growth, carbon-traded
Stansted
Luton
LondonCity
Gatwick
Heathrow
AT
Ms
('000
)
Relative decline of Europe, carbon-tradedStansted
Luton
LondonCity
Gatwick
HeathrowA
TM
s ('0
00)
Low-cost is king, carbon-tradedStansted
Luton
LondonCity
Gatwick
Heathrow
AT
Ms
('000
)
Global fragmentation, carbon-tradedStansted
Luton
LondonCity
Gatwick
Heathrow
Heathrow Heathrow
Gatwick Gatwick
London City London City
Luton Luton
Stansted Stansted
Heathrow Heathrow
Gatwick Gatwick
London City London City
Luton Luton
Stansted Stansted
Heathrow
Gatwick
London City
Luton
Stansted
2015 2020 2025 2030 2035 2040 2045 2050
2015 2020 2025 2030 2035 2040 2045 2050
2020 2025 2030 2035 2040
2015
2015 2050
2015
2045
2020 2025 2030 2035 2040 2045 2050 2045 2050
2015 2050
2020 2025 2030 2035 2040
2040 20452020 2025 2030 2035
0
200
400
600
800
1000
1200
1400
1600
1800
2015 2020 2025 2030 2035 2040 2045 2050
0
200
400
600
800
1000
1200
1400
1600
1800
0
200
400
600
800
1000
1200
1400
1600
1800
2015 2020 2025 2030 2035 2040 2045 2050
0
0
200
400
600
800
1000
1200
1400
1600
1800
2015 2020 2025 2030 2035 2040 2045 2050
200
400
600
800
1000
1200
1400
1600
1800
2015 2020 2025 2030 2035 2040 2045 2050
6.25 If carbon is capped, the new Gatwick runway is fully utilised by 2050 in low-cost is king,
where it becomes full in 2044. In all other scenarios, Gatwick has at least 10% spare
capacity in 2050, although the passenger throughput is comparable to a two runway
Heathrow today in most scenarios. Under all five scenarios Heathrow remains at capacity.
The pattern of capacity usage at the other London airports is complex. Luton and
Stansted generally experience most impact on their share of traffic, retaining spare
capacity out to 2050 in some scenarios, much longer than in the equivalent carbon-traded
case.
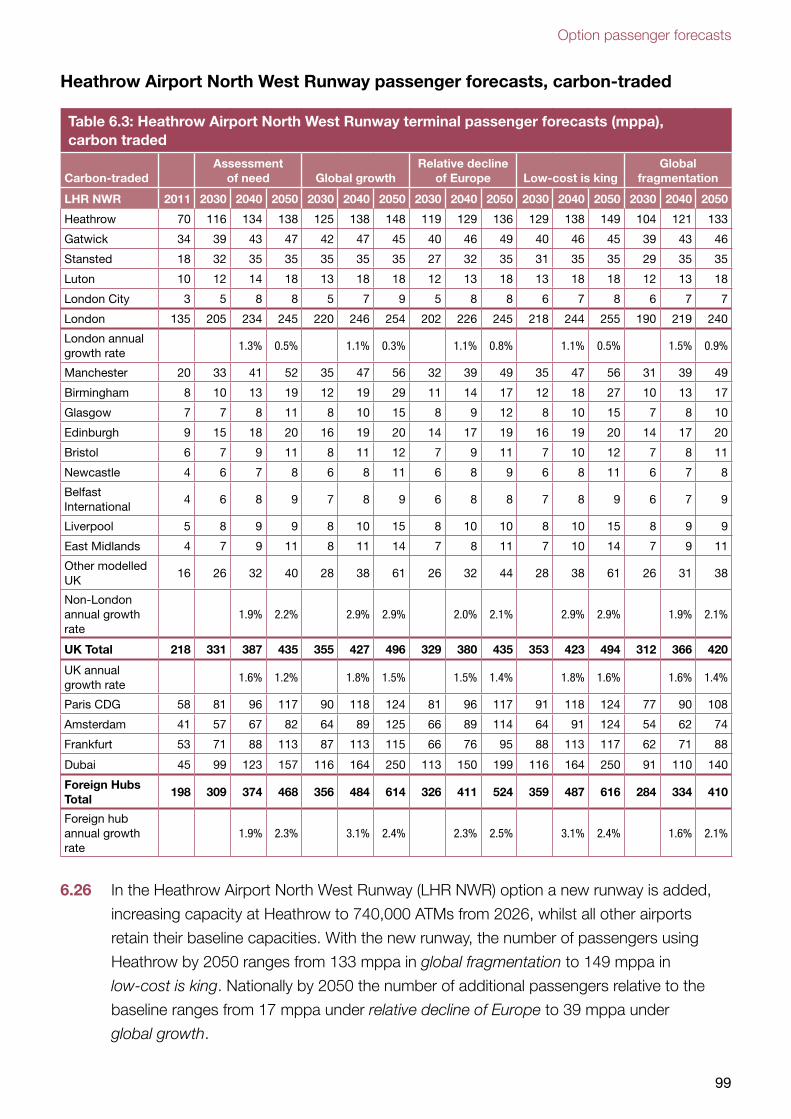
Option passenger forecasts
99
Heathrow Airport North West Runway passenger forecasts, carbon-traded
Table 6.3: Heathrow Airport North West Runway terminal passenger forecasts (mppa), carbon traded
Carbon-tradedAssessment
of need Global growthRelative decline
of Europe Low-cost is kingGlobal
fragmentation
LHR NWR 2011 2030 2040 2050 2030 2040 2050 2030 2040 2050 2030 2040 2050 2030 2040 2050
Heathrow 70 116 134 138 125 138 148 119 129 136 129 138 149 104 121 133
Gatwick 34 39 43 47 42 47 45 40 46 49 40 46 45 39 43 46
Stansted 18 32 35 35 35 35 35 27 32 35 31 35 35 29 35 35
Luton 10 12 14 18 13 18 18 12 13 18 13 18 18 12 13 18
London City 3 5 8 8 5 7 9 5 8 8 6 7 8 6 7 7
London 135 205 234 245 220 246 254 202 226 245 218 244 255 190 219 240
London annual growth rate
1.3% 0.5% 1.1% 0.3% 1.1% 0.8% 1.1% 0.5% 1.5% 0.9%
Manchester 20 33 41 52 35 47 56 32 39 49 35 47 56 31 39 49
Birmingham 8 10 13 19 12 19 29 11 14 17 12 18 27 10 13 17
Glasgow 7 7 8 11 8 10 15 8 9 12 8 10 15 7 8 10
Edinburgh 9 15 18 20 16 19 20 14 17 19 16 19 20 14 17 20
Bristol 6 7 9 11 8 11 12 7 9 11 7 10 12 7 8 11
Newcastle 4 6 7 8 6 8 11 6 8 9 6 8 11 6 7 8
Belfast International
4 6 8 9 7 8 9 6 8 8 7 8 9 6 7 9
Liverpool 5 8 9 9 8 10 15 8 10 10 8 10 15 8 9 9
East Midlands 4 7 9 11 8 11 14 7 8 11 7 10 14 7 9 11
Other modelled UK
16 26 32 40 28 38 61 26 32 44 28 38 61 26 31 38
Non-London annual growth rate
1.9% 2.2% 2.9% 2.9% 2.0% 2.1% 2.9% 2.9% 1.9% 2.1%
UK Total 218 331 387 435 355 427 496 329 380 435 353 423 494 312 366 420
UK annual growth rate
1.6% 1.2% 1.8% 1.5% 1.5% 1.4% 1.8% 1.6% 1.6% 1.4%
Paris CDG 58 81 96 117 90 118 124 81 96 117 91 118 124 77 90 108
Amsterdam 41 57 67 82 64 89 125 66 89 114 64 91 124 54 62 74
Frankfurt 53 71 88 113 87 113 115 66 76 95 88 113 117 62 71 88
Dubai 45 99 123 157 116 164 250 113 150 199 116 164 250 91 110 140
Foreign Hubs Total
198 309 374 468 356 484 614 326 411 524 359 487 616 284 334 410
Foreign hub annual growth rate
1.9% 2.3% 3.1% 2.4% 2.3% 2.5% 3.1% 2.4% 1.6% 2.1%
6.26 In the Heathrow Airport North West Runway (LHR NWR) option a new runway is added,
increasing capacity at Heathrow to 740,000 ATMs from 2026, whilst all other airports
retain their baseline capacities. With the new runway, the number of passengers using
Heathrow by 2050 ranges from 133 mppa in global fragmentation to 149 mppa in
low-cost is king. Nationally by 2050 the number of additional passengers relative to the
baseline ranges from 17 mppa under relative decline of Europe to 39 mppa under
global growth.
Strategic Fit: Forecasts
100
6.27 Overall in the Heathrow Airport North West Runway option the greatest share of
passenger traffic handled by London is in global fragmentation at 57% and lowest in
global growth (51%). This differs from the baseline where London has a smaller share of
national traffic as these airports have more demand than capacity and regional airports
pick up some of the overspill.
6.28 In 2050 in this option the number of passengers using regional UK airports ranges from
124 mppa in global growth to 146 mppa in relative decline of Europe. Traffic numbers at
some regional airports vary significantly between scenarios. By 2050 Manchester handles
between 49 and 56 mppa in 2050, while Birmingham, more affected by spill from London,
ranges from 17 to 29 mppa. The passenger demand for the regional airports is lower in all
scenarios compared to the baseline as Heathrow Airport North West Runway attracts
back some demand displaced into the regions in the baseline.
6.29 The timelines illustrate that with traded carbon the new Heathrow runway is fully utilised
sometime between 2030 and 2035 in all scenarios except global fragmentation, which is
full by 2042. The expanded Heathrow does not greatly ease congestion at Gatwick which
would be full or operating over 90% capacity for the whole 2015-2050 period under every
scenario. By 2050, the other 3 London airports would also be operating at full capacity.
6.30 HAL’s own forecast of unconstrained growth in passengers is based on trend growth of
1% per annum till 2025, when the new runway is expected to open. Between 2025 and
2030, they have assumed a ramp-up of demand to fill the additional capacity available.
This is expected to amount to a growth rate of 5% per annum till 2030, tapering off
thereafter till 2040 when a passenger volume of 130 million is reached. After this, the
growth rate is expected to be much lower at 0.3% per annum to 2050, leading to a
passenger demand of 135 million passengers in 2050. Sensitivities have also been
conducted to account for a faster than 5% per annum level of take-up of additional
runway capacity. By 2040, their forecasts are closer to those prepared by the
Commission, although passenger demand does not achieve the levels predicted in the
global growth or low-cost is king scenarios. A sensitivity test with phased in capacity at
Heathrow has been undertaken and details can be found in Chapter 7.
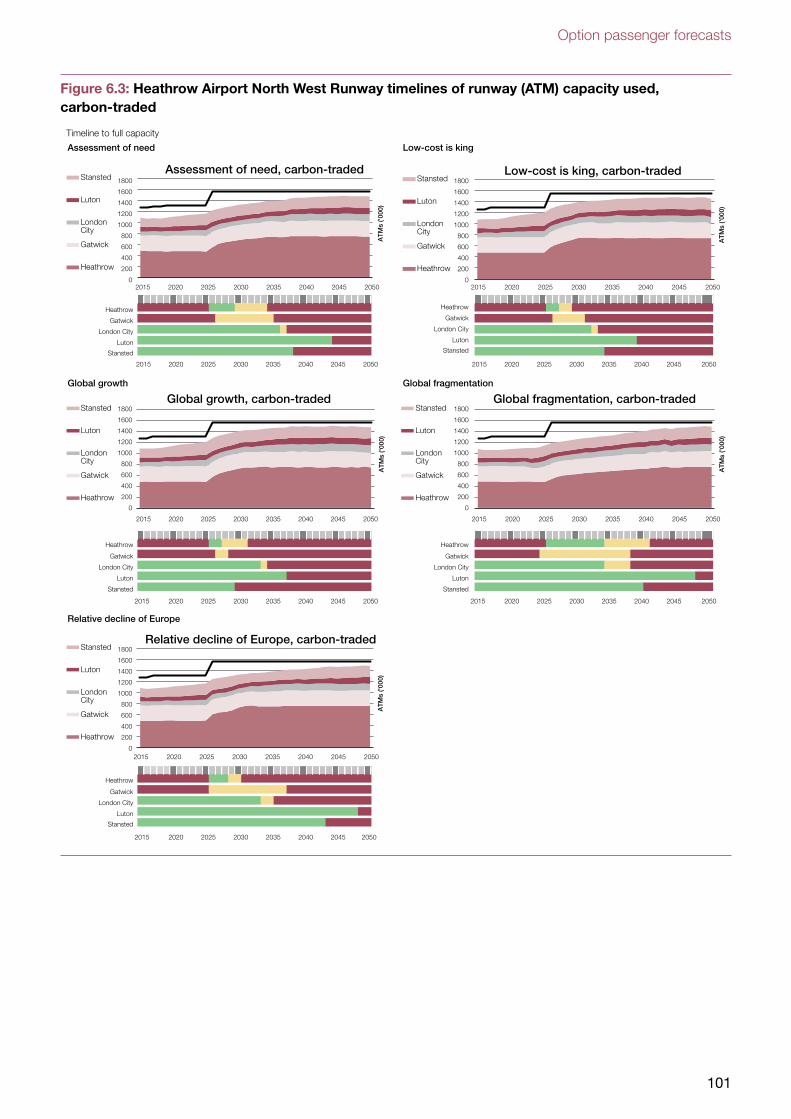
Option passenger forecasts
101
Figure 6.3: Heathrow Airport North West Runway timelines of runway (ATM) capacity used, carbon-traded
Timeline to full capacity
Assessment of need Low-cost is king
Global growth Global fragmentation
Relative decline of Europe
AT
Ms
('000
)
Assessment of need, carbon-tradedStansted
Luton
LondonCity
Gatwick
Heathrow
AT
Ms
('000
)
Global growth, carbon-tradedStansted
Luton
LondonCity
Gatwick
Heathrow
AT
Ms
('000
)
Relative decline of Europe, carbon-tradedStansted
Luton
LondonCity
Gatwick
Heathrow
AT
Ms
('000
)
Low-cost is king, carbon-tradedStansted
Luton
LondonCity
Gatwick
Heathrow
AT
Ms
('000
)
Global fragmentation, carbon-tradedStansted
Luton
LondonCity
Gatwick
Heathrow
Heathrow Heathrow
Gatwick Gatwick
London City London City
Luton Luton
Stansted Stansted
Heathrow Heathrow
Gatwick Gatwick
London City London City
Luton Luton
Stansted Stansted
Heathrow
Gatwick
London City
Luton
Stansted
2015 2020 2025 2030 2035 2040 2045 2050
2015 2020 2025 2030 2035 2040 2045 2050
2020 2025 2030 2035 2040
2015
2015 2050
2015
2045
2020 2025 2030 2035 2040 2045 2050 2045 2050
2015 2050
2020 2025 2030 2035 2040
2040 20452020 2025 2030 2035
0
200
400
600
800
1000
1200
1400
1600
1800
2015 2020 2025 2030 2035 2040 2045 2050
0
200
400
600
800
1000
1200
1400
1600
1800
0
200
400
600
800
1000
1200
1400
1600
1800
2015 2020 2025 2030 2035 2040 2045 2050
0
0
200
400
600
800
1000
1200
1400
1600
1800
2015 2020 2025 2030 2035 2040 2045 2050
200
400
600
800
1000
1200
1400
1600
1800
2015 2020 2025 2030 2035 2040 2045 2050
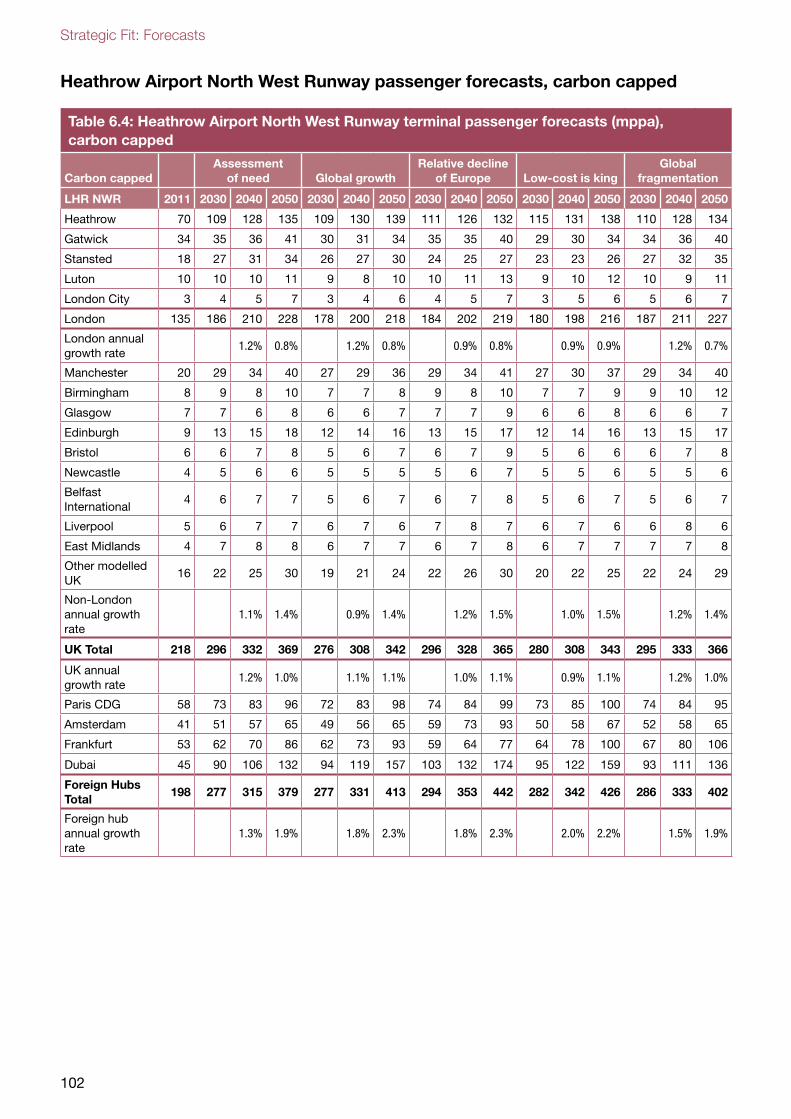
Strategic Fit: Forecasts
102
Heathrow Airport North West Runway passenger forecasts, carbon capped
Table 6.4: Heathrow Airport North West Runway terminal passenger forecasts (mppa), carbon capped
Carbon cappedAssessment
of need Global growthRelative decline
of Europe Low-cost is kingGlobal
fragmentation
LHR NWR 2011 2030 2040 2050 2030 2040 2050 2030 2040 2050 2030 2040 2050 2030 2040 2050
Heathrow 70 109 128 135 109 130 139 111 126 132 115 131 138 110 128 134
Gatwick 34 35 36 41 30 31 34 35 35 40 29 30 34 34 36 40
Stansted 18 27 31 34 26 27 30 24 25 27 23 23 26 27 32 35
Luton 10 10 10 11 9 8 10 10 11 13 9 10 12 10 9 11
London City 3 4 5 7 3 4 6 4 5 7 3 5 6 5 6 7
London 135 186 210 228 178 200 218 184 202 219 180 198 216 187 211 227
London annual growth rate
1.2% 0.8% 1.2% 0.8% 0.9% 0.8% 0.9% 0.9% 1.2% 0.7%
Manchester 20 29 34 40 27 29 36 29 34 41 27 30 37 29 34 40
Birmingham 8 9 8 10 7 7 8 9 8 10 7 7 9 9 10 12
Glasgow 7 7 6 8 6 6 7 7 7 9 6 6 8 6 6 7
Edinburgh 9 13 15 18 12 14 16 13 15 17 12 14 16 13 15 17
Bristol 6 6 7 8 5 6 7 6 7 9 5 6 6 6 7 8
Newcastle 4 5 6 6 5 5 5 5 6 7 5 5 6 5 5 6
Belfast International
4 6 7 7 5 6 7 6 7 8 5 6 7 5 6 7
Liverpool 5 6 7 7 6 7 6 7 8 7 6 7 6 6 8 6
East Midlands 4 7 8 8 6 7 7 6 7 8 6 7 7 7 7 8
Other modelled UK
16 22 25 30 19 21 24 22 26 30 20 22 25 22 24 29
Non-London annual growth rate
1.1% 1.4% 0.9% 1.4% 1.2% 1.5% 1.0% 1.5% 1.2% 1.4%
UK Total 218 296 332 369 276 308 342 296 328 365 280 308 343 295 333 366
UK annual growth rate
1.2% 1.0% 1.1% 1.1% 1.0% 1.1% 0.9% 1.1% 1.2% 1.0%
Paris CDG 58 73 83 96 72 83 98 74 84 99 73 85 100 74 84 95
Amsterdam 41 51 57 65 49 56 65 59 73 93 50 58 67 52 58 65
Frankfurt 53 62 70 86 62 73 93 59 64 77 64 78 100 67 80 106
Dubai 45 90 106 132 94 119 157 103 132 174 95 122 159 93 111 136
Foreign Hubs Total
198 277 315 379 277 331 413 294 353 442 282 342 426 286 333 402
Foreign hub annual growth rate
1.3% 1.9% 1.8% 2.3% 1.8% 2.3% 2.0% 2.2% 1.5% 1.9%
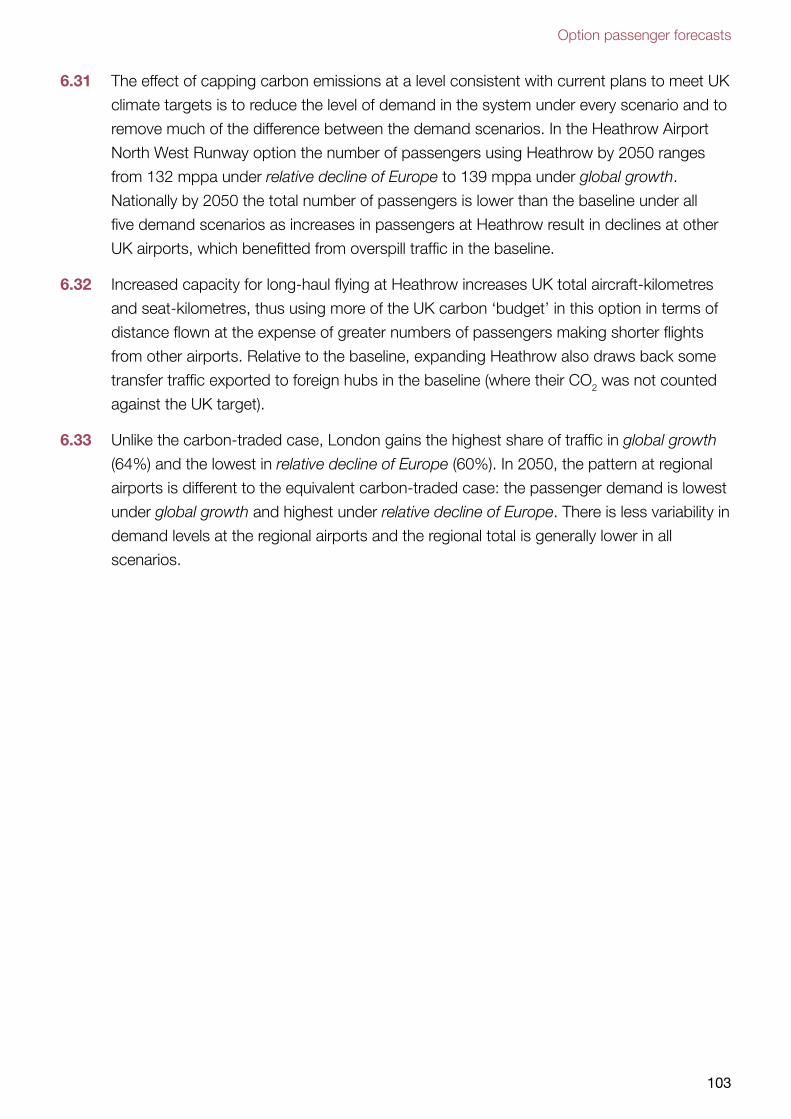
Option passenger forecasts
103
6.31 The effect of capping carbon emissions at a level consistent with current plans to meet UK
climate targets is to reduce the level of demand in the system under every scenario and to
remove much of the difference between the demand scenarios. In the Heathrow Airport
North West Runway option the number of passengers using Heathrow by 2050 ranges
from 132 mppa under relative decline of Europe to 139 mppa under global growth.
Nationally by 2050 the total number of passengers is lower than the baseline under all
five demand scenarios as increases in passengers at Heathrow result in declines at other
UK airports, which benefitted from overspill traffic in the baseline.
6.32 Increased capacity for long-haul flying at Heathrow increases UK total aircraft-kilometres
and seat-kilometres, thus using more of the UK carbon ‘budget’ in this option in terms of
distance flown at the expense of greater numbers of passengers making shorter flights
from other airports. Relative to the baseline, expanding Heathrow also draws back some
transfer traffic exported to foreign hubs in the baseline (where their CO2 was not counted
against the UK target).
6.33 Unlike the carbon-traded case, London gains the highest share of traffic in global growth
(64%) and the lowest in relative decline of Europe (60%). In 2050, the pattern at regional
airports is different to the equivalent carbon-traded case: the passenger demand is lowest
under global growth and highest under relative decline of Europe. There is less variability in
demand levels at the regional airports and the regional total is generally lower in all
scenarios.
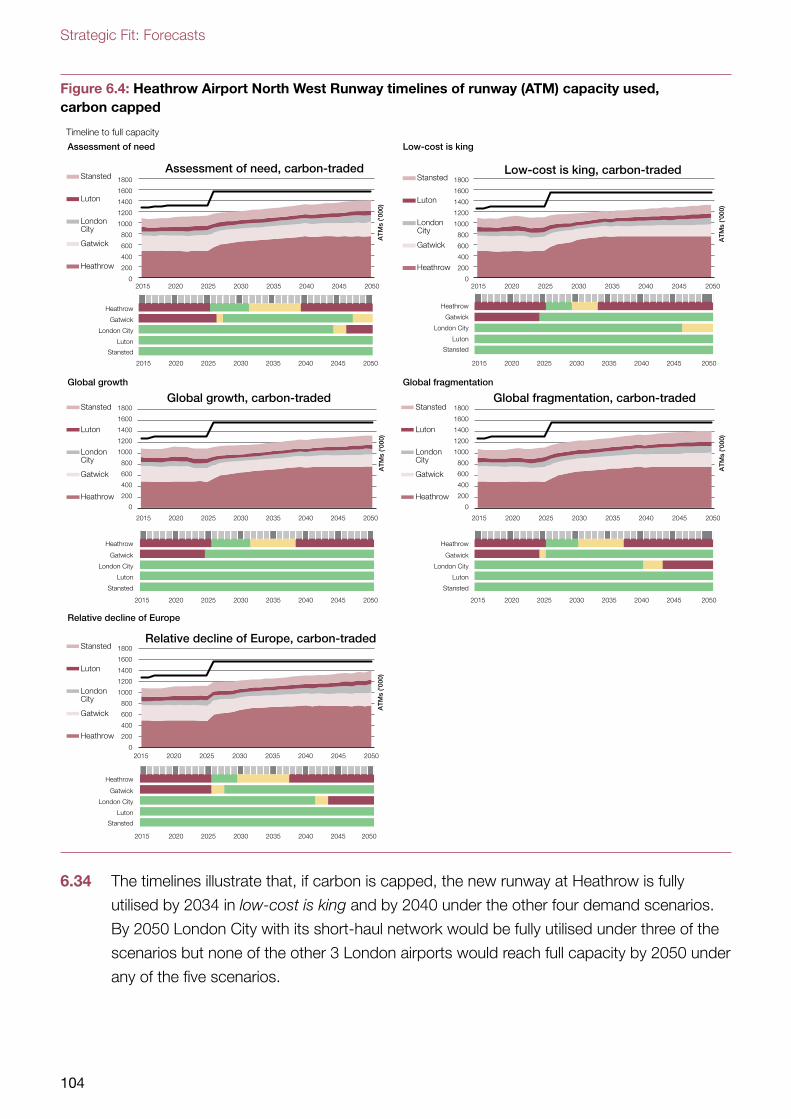
Strategic Fit: Forecasts
104
Figure 6.4: Heathrow Airport North West Runway timelines of runway (ATM) capacity used, carbon capped
Timeline to full capacity
Assessment of need Low-cost is king
Global growth Global fragmentation
Relative decline of Europe
AT
Ms
('000
)
Assessment of need, carbon-tradedStansted
Luton
LondonCity
Gatwick
Heathrow
AT
Ms
('000
)
Global growth, carbon-tradedStansted
Luton
LondonCity
Gatwick
Heathrow
AT
Ms
('000
)
Relative decline of Europe, carbon-tradedStansted
Luton
LondonCity
Gatwick
Heathrow
AT
Ms
('000
)
Low-cost is king, carbon-tradedStansted
Luton
LondonCity
Gatwick
Heathrow
AT
Ms
('000
)
Global fragmentation, carbon-tradedStansted
Luton
LondonCity
Gatwick
Heathrow
Heathrow Heathrow
Gatwick Gatwick
London City London City
Luton Luton
Stansted Stansted
Heathrow Heathrow
Gatwick Gatwick
London City London City
Luton Luton
Stansted Stansted
Heathrow
Gatwick
London City
Luton
Stansted
2015 2020 2025 2030 2035 2040 2045 2050
2015 2020 2025 2030 2035 2040 2045 2050
2020 2025 2030 2035 2040
2015
2015 2050
2015
2045
2020 2025 2030 2035 2040 2045 2050 2045 2050
2015 2050
2020 2025 2030 2035 2040
2040 20452020 2025 2030 2035
0
200
400
600
800
1000
1200
1400
1600
1800
2015 2020 2025 2030 2035 2040 2045 2050
0
200
400
600
800
1000
1200
1400
1600
1800
0
200
400
600
800
1000
1200
1400
1600
1800
2015 2020 2025 2030 2035 2040 2045 2050
0
0
200
400
600
800
1000
1200
1400
1600
1800
2015 2020 2025 2030 2035 2040 2045 2050
200
400
600
800
1000
1200
1400
1600
1800
2015 2020 2025 2030 2035 2040 2045 2050
6.34 The timelines illustrate that, if carbon is capped, the new runway at Heathrow is fully
utilised by 2034 in low-cost is king and by 2040 under the other four demand scenarios.
By 2050 London City with its short-haul network would be fully utilised under three of the
scenarios but none of the other 3 London airports would reach full capacity by 2050 under
any of the five scenarios.
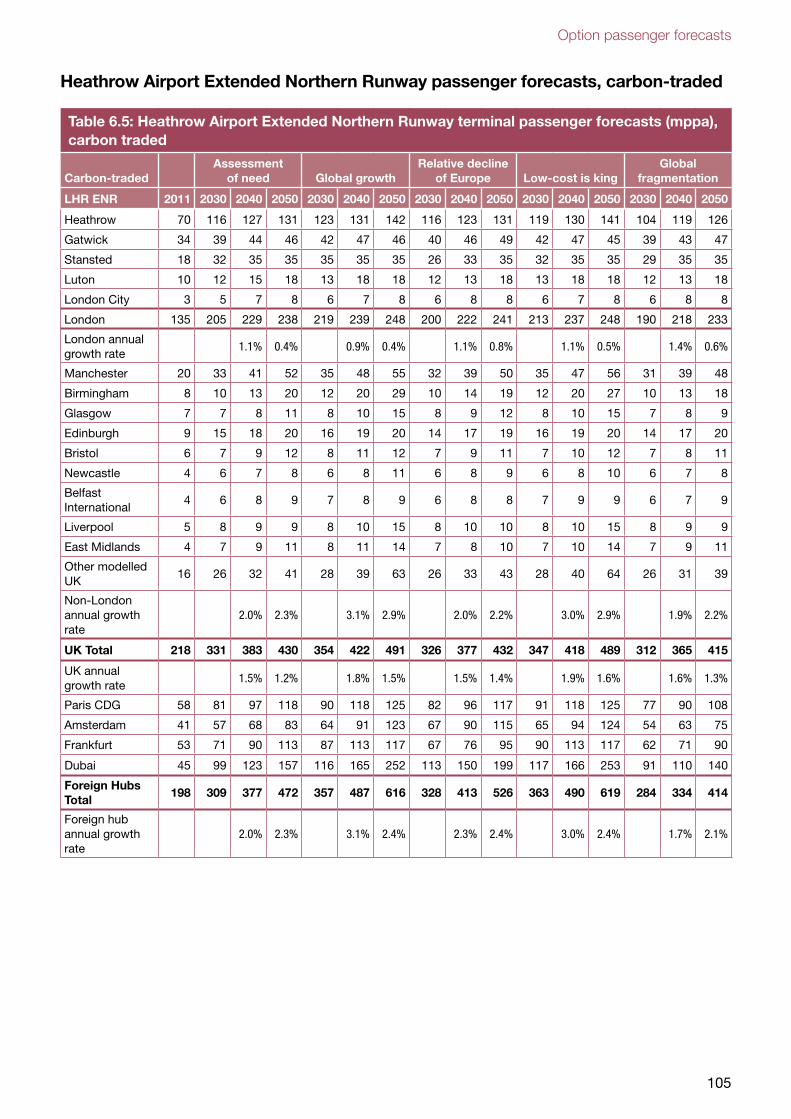
Option passenger forecasts
105
Heathrow Airport Extended Northern Runway passenger forecasts, carbon-traded
Table 6.5: Heathrow Airport Extended Northern Runway terminal passenger forecasts (mppa), carbon traded
Carbon-tradedAssessment
of need Global growthRelative decline
of Europe Low-cost is kingGlobal
fragmentation
LHR ENR 2011 2030 2040 2050 2030 2040 2050 2030 2040 2050 2030 2040 2050 2030 2040 2050
Heathrow 70 116 127 131 123 131 142 116 123 131 119 130 141 104 119 126
Gatwick 34 39 44 46 42 47 46 40 46 49 42 47 45 39 43 47
Stansted 18 32 35 35 35 35 35 26 33 35 32 35 35 29 35 35
Luton 10 12 15 18 13 18 18 12 13 18 13 18 18 12 13 18
London City 3 5 7 8 6 7 8 6 8 8 6 7 8 6 8 8
London 135 205 229 238 219 239 248 200 222 241 213 237 248 190 218 233
London annual growth rate
1.1% 0.4% 0.9% 0.4% 1.1% 0.8% 1.1% 0.5% 1.4% 0.6%
Manchester 20 33 41 52 35 48 55 32 39 50 35 47 56 31 39 48
Birmingham 8 10 13 20 12 20 29 10 14 19 12 20 27 10 13 18
Glasgow 7 7 8 11 8 10 15 8 9 12 8 10 15 7 8 9
Edinburgh 9 15 18 20 16 19 20 14 17 19 16 19 20 14 17 20
Bristol 6 7 9 12 8 11 12 7 9 11 7 10 12 7 8 11
Newcastle 4 6 7 8 6 8 11 6 8 9 6 8 10 6 7 8
Belfast International
4 6 8 9 7 8 9 6 8 8 7 9 9 6 7 9
Liverpool 5 8 9 9 8 10 15 8 10 10 8 10 15 8 9 9
East Midlands 4 7 9 11 8 11 14 7 8 10 7 10 14 7 9 11
Other modelled UK
16 26 32 41 28 39 63 26 33 43 28 40 64 26 31 39
Non-London annual growth rate
2.0% 2.3% 3.1% 2.9% 2.0% 2.2% 3.0% 2.9% 1.9% 2.2%
UK Total 218 331 383 430 354 422 491 326 377 432 347 418 489 312 365 415
UK annual growth rate
1.5% 1.2% 1.8% 1.5% 1.5% 1.4% 1.9% 1.6% 1.6% 1.3%
Paris CDG 58 81 97 118 90 118 125 82 96 117 91 118 125 77 90 108
Amsterdam 41 57 68 83 64 91 123 67 90 115 65 94 124 54 63 75
Frankfurt 53 71 90 113 87 113 117 67 76 95 90 113 117 62 71 90
Dubai 45 99 123 157 116 165 252 113 150 199 117 166 253 91 110 140
Foreign Hubs Total
198 309 377 472 357 487 616 328 413 526 363 490 619 284 334 414
Foreign hub annual growth rate
2.0% 2.3% 3.1% 2.4% 2.3% 2.4% 3.0% 2.4% 1.7% 2.1%
Strategic Fit: Forecasts
106
6.35 In the Heathrow Airport Extended Northern Runway option the northern runway is
extended, increasing capacity at Heathrow to 700,000 ATMs from 2026, while all other
airports retain their baseline capacities. With the extended runway, the number of
passengers using Heathrow by 2050 with carbon-traded ranges from 126 mppa in global
fragmentation to 142 mppa in global growth. Nationally by 2050 the number of additional
passengers over baseline ranges from 14 mppa under relative decline of Europe to 34
mppa under global growth.
6.36 Overall with the Heathrow Airport Extended Northern Runway option the share of national
traffic handled by London is highest in global fragmentation at 56% and lowest in low-cost
is king at 51%. This differs from the baseline where London has a smaller share of national
traffic as these airports have more demand than capacity and regional airports pick up
some of the overspill.
6.37 In 2050 under the Heathrow Airport Extended Northern Runway option the number of
passengers using regional UK airports ranges from 182 mppa in global fragmentation to
243 mppa in global growth. The number of passengers at the larger regional airports vary
significantly between scenarios. By 2050 Manchester handles between 48 and 56 mppa,
but Birmingham, most affected by spill from London, varies between 18 and 29 mppa.
The passenger demand for the regional airports is lower in all scenarios compared to the
baseline as Heathrow attracts back some demand displaced into the regions in the
baseline.
6.38 The ATM capacity timelines illustrate that, with the extended runway, Heathrow reaches
full capacity between 2029 and 2032 in all scenarios except global fragmentation, under
which Heathrow is full by 2038. Under all 5 scenarios, Gatwick would be operating at
full capacity before 2050 and would be at full or at least 90% capacity for the whole
2015-2050 period. By 2050, the other 3 London airports would also be at full capacity,
with Luton the last airport to fill up in all cases.

Option passenger forecasts
107
Figure 6.5: Heathrow Airport Extended Northern Runway timelines of runway (ATM) capacity used, carbon-traded
Timeline to full capacity
Assessment of need Low-cost is king
Global growth Global fragmentation
Relative decline of Europe
AT
Ms
('000
)
Assessment of need, carbon-tradedStansted
Luton
LondonCity
Gatwick
Heathrow
AT
Ms
('000
)
Global growth, carbon-tradedStansted
Luton
LondonCity
Gatwick
Heathrow
AT
Ms
('000
)
Relative decline of Europe, carbon-tradedStansted
Luton
LondonCity
Gatwick
Heathrow
AT
Ms
('000
)
Low-cost is king, carbon-tradedStansted
Luton
LondonCity
Gatwick
Heathrow
AT
Ms
('000
)
Global fragmentation, carbon-tradedStansted
Luton
LondonCity
Gatwick
Heathrow
Heathrow Heathrow
Gatwick Gatwick
London City London City
Luton Luton
Stansted Stansted
Heathrow Heathrow
Gatwick Gatwick
London City London City
Luton Luton
Stansted Stansted
Heathrow
Gatwick
London City
Luton
Stansted
2015 2020 2025 2030 2035 2040 2045 2050
2015 2020 2025 2030 2035 2040 2045 2050
2020 2025 2030 2035 2040
2015
2015 2050
2015
2045
2020 2025 2030 2035 2040 2045 2050 2045 2050
2015 2050
2020 2025 2030 2035 2040
2040 20452020 2025 2030 2035
0
200
400
600
800
1000
1200
1400
1600
1800
2015 2020 2025 2030 2035 2040 2045 2050
0
200
400
600
800
1000
1200
1400
1600
1800
0
200
400
600
800
1000
1200
1400
1600
1800
2015 2020 2025 2030 2035 2040 2045 2050
0
0
200
400
600
800
1000
1200
1400
1600
1800
2015 2020 2025 2030 2035 2040 2045 2050
200
400
600
800
1000
1200
1400
1600
1800
2015 2020 2025 2030 2035 2040 2045 2050
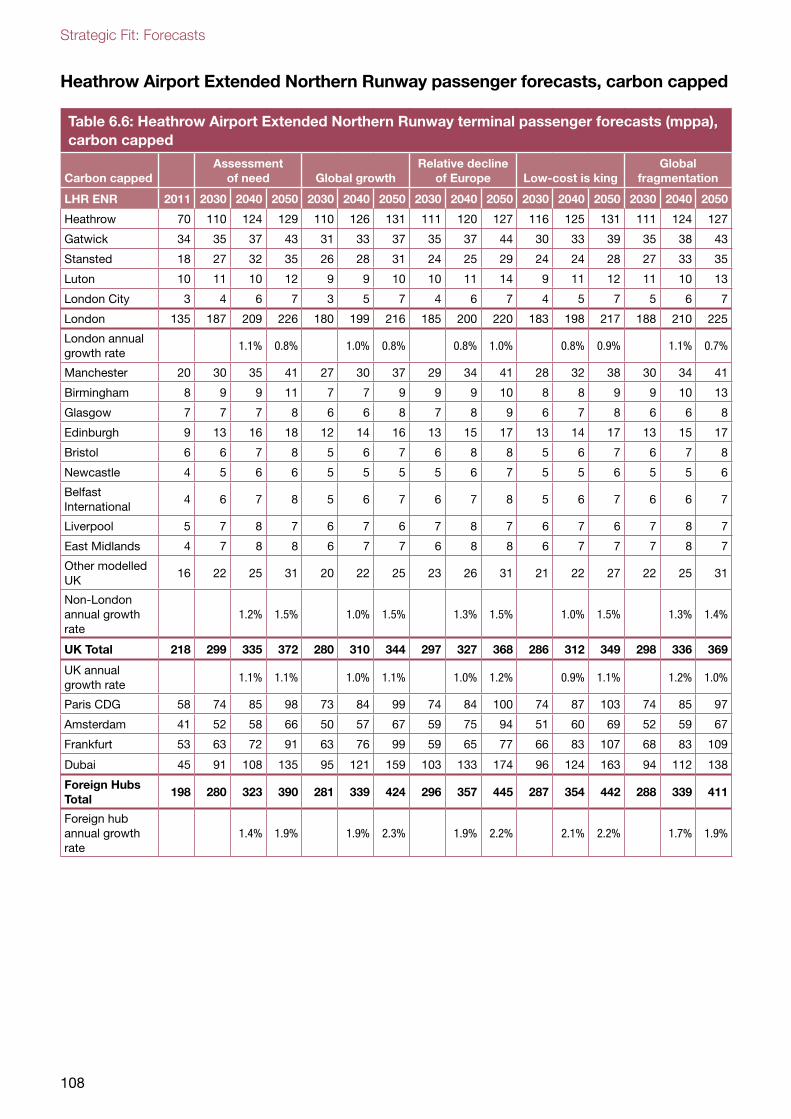
Strategic Fit: Forecasts
108
Heathrow Airport Extended Northern Runway passenger forecasts, carbon capped
Table 6.6: Heathrow Airport Extended Northern Runway terminal passenger forecasts (mppa), carbon capped
Carbon cappedAssessment
of need Global growthRelative decline
of Europe Low-cost is kingGlobal
fragmentation
LHR ENR 2011 2030 2040 2050 2030 2040 2050 2030 2040 2050 2030 2040 2050 2030 2040 2050
Heathrow 70 110 124 129 110 126 131 111 120 127 116 125 131 111 124 127
Gatwick 34 35 37 43 31 33 37 35 37 44 30 33 39 35 38 43
Stansted 18 27 32 35 26 28 31 24 25 29 24 24 28 27 33 35
Luton 10 11 10 12 9 9 10 10 11 14 9 11 12 11 10 13
London City 3 4 6 7 3 5 7 4 6 7 4 5 7 5 6 7
London 135 187 209 226 180 199 216 185 200 220 183 198 217 188 210 225
London annual growth rate
1.1% 0.8% 1.0% 0.8% 0.8% 1.0% 0.8% 0.9% 1.1% 0.7%
Manchester 20 30 35 41 27 30 37 29 34 41 28 32 38 30 34 41
Birmingham 8 9 9 11 7 7 9 9 9 10 8 8 9 9 10 13
Glasgow 7 7 7 8 6 6 8 7 8 9 6 7 8 6 6 8
Edinburgh 9 13 16 18 12 14 16 13 15 17 13 14 17 13 15 17
Bristol 6 6 7 8 5 6 7 6 8 8 5 6 7 6 7 8
Newcastle 4 5 6 6 5 5 5 5 6 7 5 5 6 5 5 6
Belfast International
4 6 7 8 5 6 7 6 7 8 5 6 7 6 6 7
Liverpool 5 7 8 7 6 7 6 7 8 7 6 7 6 7 8 7
East Midlands 4 7 8 8 6 7 7 6 8 8 6 7 7 7 8 7
Other modelled UK
16 22 25 31 20 22 25 23 26 31 21 22 27 22 25 31
Non-London annual growth rate
1.2% 1.5% 1.0% 1.5% 1.3% 1.5% 1.0% 1.5% 1.3% 1.4%
UK Total 218 299 335 372 280 310 344 297 327 368 286 312 349 298 336 369
UK annual growth rate
1.1% 1.1% 1.0% 1.1% 1.0% 1.2% 0.9% 1.1% 1.2% 1.0%
Paris CDG 58 74 85 98 73 84 99 74 84 100 74 87 103 74 85 97
Amsterdam 41 52 58 66 50 57 67 59 75 94 51 60 69 52 59 67
Frankfurt 53 63 72 91 63 76 99 59 65 77 66 83 107 68 83 109
Dubai 45 91 108 135 95 121 159 103 133 174 96 124 163 94 112 138
Foreign Hubs Total
198 280 323 390 281 339 424 296 357 445 287 354 442 288 339 411
Foreign hub annual growth rate
1.4% 1.9% 1.9% 2.3% 1.9% 2.2% 2.1% 2.2% 1.7% 1.9%
Option passenger forecasts
109
6.39 The effect of capping carbon emissions at a level consistent with current plans to meet UK
climate targets is to reduce the level of demand in the system under every scenario and to
remove much of the difference between the demand scenarios. In the Heathrow Airport
Extended Northern Runway option the number of passengers using Heathrow by 2050
ranges from 127 mppa under both relative decline of Europe and global fragmentation to
131 mppa under both global growth and low-cost is king. Nationally by 2050 the total
number of passengers is lower than the baseline under all five demand scenarios as
increases in passengers at Heathrow result in declines at other UK airports, which are
expected to capture some overspill traffic as the London system fills up in the baseline.
6.40 Increased capacity for long-haul flying at Heathrow increases UK total aircraft-kilometres
and seat-kilometres, thus using more of the UK carbon ‘budget’ in this option at the
expense of more passengers making shorter flights from other airports. Relative to the
baseline, expanding Heathrow also draws backs some transfer traffic exported to foreign
hubs in the baseline (where their CO2 was not counted against the UK target) reducing the
carbon capacity at other UK airports.
6.41 Unlike the carbon-traded case, London has the highest share of national traffic under
global growth (around 63%) and the lowest under relative decline of Europe (60%). In the
carbon capped case passenger throughputs in 2050 for regional airports is noticeably
different to the carbon-traded case and significantly lower. There are most passengers at
regional airports in relative decline of Europe and assessment of need and least in global
growth. There is also less variability in passenger numbers at the larger regional airports
than in the Heathrow Airport Extended Northern Runway carbon-traded case with less
spill of demand from the London airports.
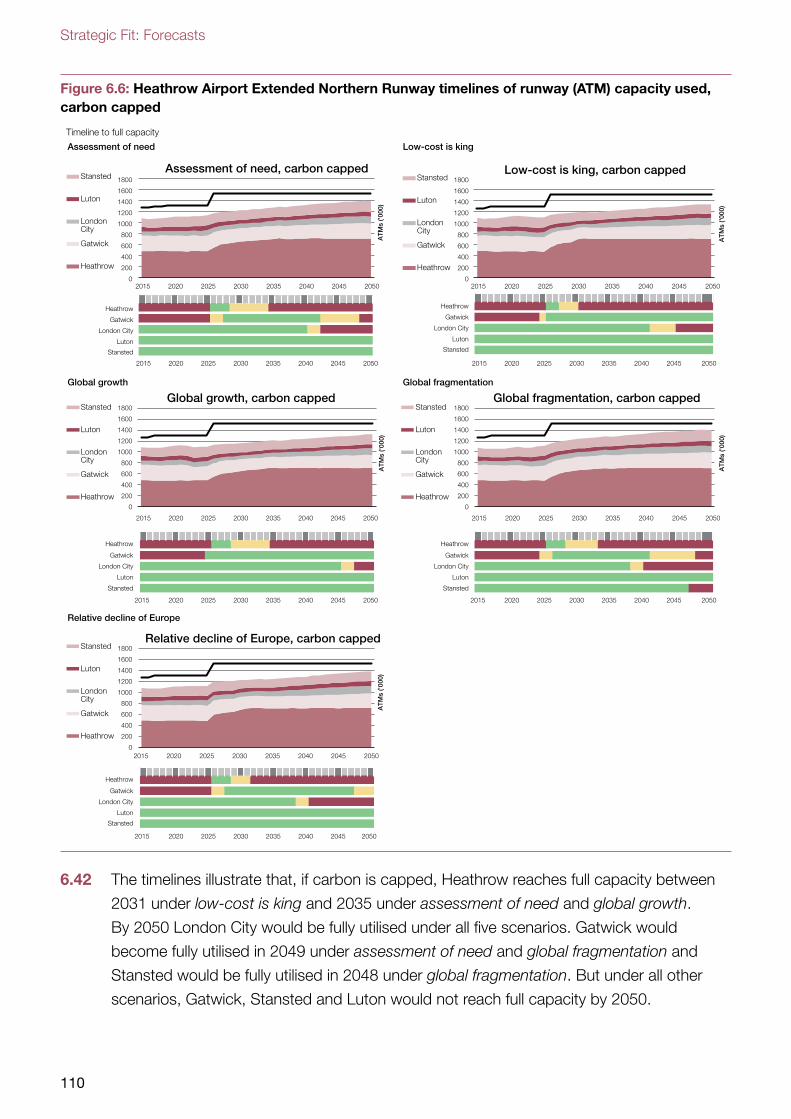
Strategic Fit: Forecasts
110
Figure 6.6: Heathrow Airport Extended Northern Runway timelines of runway (ATM) capacity used, carbon capped
Timeline to full capacity
Assessment of need Low-cost is king
Global growth Global fragmentation
Relative decline of Europe
AT
Ms
('000
)
Assessment of need, carbon cappedStansted
Luton
LondonCity
Gatwick
Heathrow
AT
Ms
('000
)
Global growth, carbon cappedStansted
Luton
LondonCity
Gatwick
Heathrow
AT
Ms
('000
)
Relative decline of Europe, carbon cappedStansted
Luton
LondonCity
Gatwick
Heathrow
AT
Ms
('000
)
Low-cost is king, carbon cappedStansted
Luton
LondonCity
Gatwick
Heathrow
AT
Ms
('000
)
Global fragmentation, carbon cappedStansted
Luton
LondonCity
Gatwick
Heathrow
Heathrow Heathrow
Gatwick Gatwick
London City London City
Luton Luton
Stansted Stansted
Heathrow Heathrow
Gatwick Gatwick
London City London City
Luton Luton
Stansted Stansted
Heathrow
Gatwick
London City
Luton
Stansted
2015 2020 2025 2030 2035 2040 2045 2050
2015 2020 2025 2030 2035 2040 2045 2050
2020 2025 2030 2035 2040
2015
2015 2050
2015
2045
2020 2025 2030 2035 2040 2045 2050 2045 2050
2015 2050
2020 2025 2030 2035 2040
2040 20452020 2025 2030 2035
0
200
400
600
800
1000
1200
1400
1600
1800
2015 2020 2025 2030 2035 2040 2045 2050
0
200
400
600
800
1000
1200
1400
1600
1800
0
200
400
600
800
1000
1200
1400
1600
1800
2015 2020 2025 2030 2035 2040 2045 2050
0
0
200
400
600
800
1000
1200
1400
1600
1800
2015 2020 2025 2030 2035 2040 2045 2050
200
400
600
800
1000
1200
1400
1600
1800
2015 2020 2025 2030 2035 2040 2045 2050
6.42 The timelines illustrate that, if carbon is capped, Heathrow reaches full capacity between
2031 under low-cost is king and 2035 under assessment of need and global growth.
By 2050 London City would be fully utilised under all five scenarios. Gatwick would
become fully utilised in 2049 under assessment of need and global fragmentation and
Stansted would be fully utilised in 2048 under global fragmentation. But under all other
scenarios, Gatwick, Stansted and Luton would not reach full capacity by 2050.
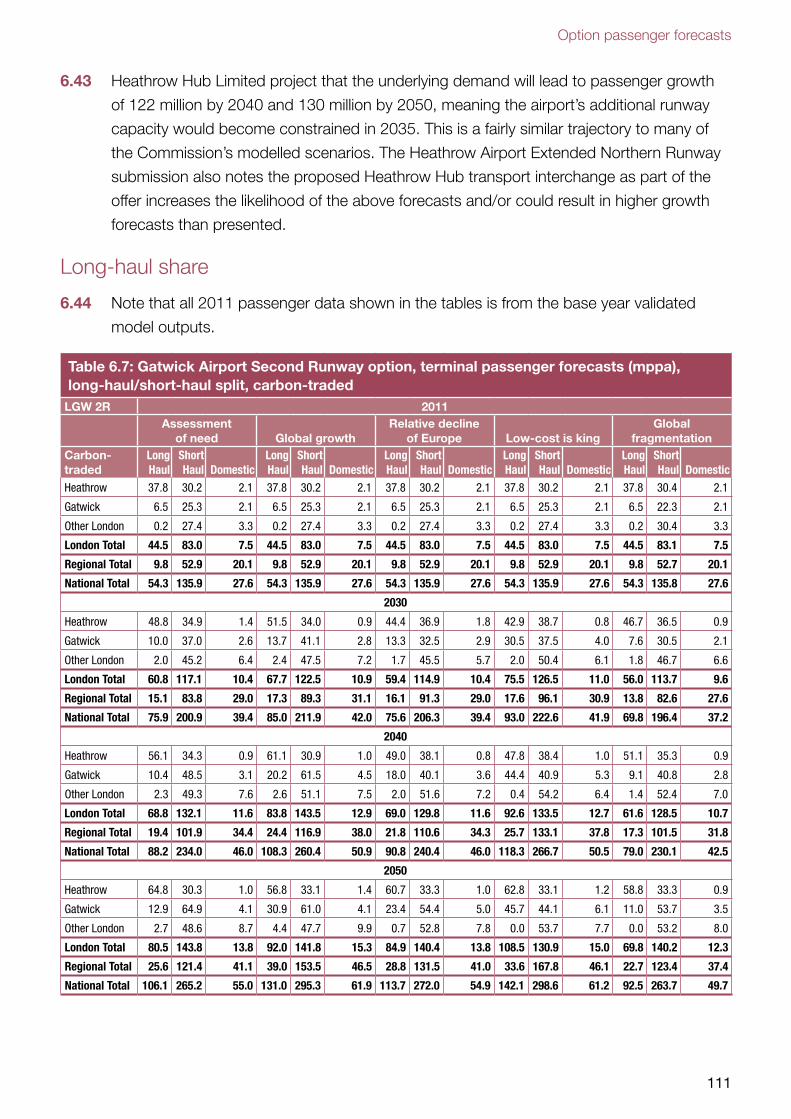
Option passenger forecasts
111
6.43 Heathrow Hub Limited project that the underlying demand will lead to passenger growth
of 122 million by 2040 and 130 million by 2050, meaning the airport’s additional runway
capacity would become constrained in 2035. This is a fairly similar trajectory to many of
the Commission’s modelled scenarios. The Heathrow Airport Extended Northern Runway
submission also notes the proposed Heathrow Hub transport interchange as part of the
offer increases the likelihood of the above forecasts and/or could result in higher growth
forecasts than presented.
Long-haul share
6.44 Note that all 2011 passenger data shown in the tables is from the base year validated
model outputs.
Table 6.7: Gatwick Airport Second Runway option, terminal passenger forecasts (mppa), long-haul/short-haul split, carbon-traded
LGW 2R 2011Assessment
of need Global growthRelative decline
of Europe Low-cost is kingGlobal
fragmentationCarbon-traded
Long Haul
Short Haul Domestic
Long Haul
Short Haul Domestic
Long Haul
Short Haul Domestic
Long Haul
Short Haul Domestic
Long Haul
Short Haul Domestic
Heathrow 37.8 30.2 2.1 37.8 30.2 2.1 37.8 30.2 2.1 37.8 30.2 2.1 37.8 30.4 2.1
Gatwick 6.5 25.3 2.1 6.5 25.3 2.1 6.5 25.3 2.1 6.5 25.3 2.1 6.5 22.3 2.1
Other London 0.2 27.4 3.3 0.2 27.4 3.3 0.2 27.4 3.3 0.2 27.4 3.3 0.2 30.4 3.3
London Total 44.5 83.0 7.5 44.5 83.0 7.5 44.5 83.0 7.5 44.5 83.0 7.5 44.5 83.1 7.5
Regional Total 9.8 52.9 20.1 9.8 52.9 20.1 9.8 52.9 20.1 9.8 52.9 20.1 9.8 52.7 20.1
National Total 54.3 135.9 27.6 54.3 135.9 27.6 54.3 135.9 27.6 54.3 135.9 27.6 54.3 135.8 27.6
2030
Heathrow 48.8 34.9 1.4 51.5 34.0 0.9 44.4 36.9 1.8 42.9 38.7 0.8 46.7 36.5 0.9
Gatwick 10.0 37.0 2.6 13.7 41.1 2.8 13.3 32.5 2.9 30.5 37.5 4.0 7.6 30.5 2.1
Other London 2.0 45.2 6.4 2.4 47.5 7.2 1.7 45.5 5.7 2.0 50.4 6.1 1.8 46.7 6.6
London Total 60.8 117.1 10.4 67.7 122.5 10.9 59.4 114.9 10.4 75.5 126.5 11.0 56.0 113.7 9.6
Regional Total 15.1 83.8 29.0 17.3 89.3 31.1 16.1 91.3 29.0 17.6 96.1 30.9 13.8 82.6 27.6
National Total 75.9 200.9 39.4 85.0 211.9 42.0 75.6 206.3 39.4 93.0 222.6 41.9 69.8 196.4 37.2
2040
Heathrow 56.1 34.3 0.9 61.1 30.9 1.0 49.0 38.1 0.8 47.8 38.4 1.0 51.1 35.3 0.9
Gatwick 10.4 48.5 3.1 20.2 61.5 4.5 18.0 40.1 3.6 44.4 40.9 5.3 9.1 40.8 2.8
Other London 2.3 49.3 7.6 2.6 51.1 7.5 2.0 51.6 7.2 0.4 54.2 6.4 1.4 52.4 7.0
London Total 68.8 132.1 11.6 83.8 143.5 12.9 69.0 129.8 11.6 92.6 133.5 12.7 61.6 128.5 10.7
Regional Total 19.4 101.9 34.4 24.4 116.9 38.0 21.8 110.6 34.3 25.7 133.1 37.8 17.3 101.5 31.8
National Total 88.2 234.0 46.0 108.3 260.4 50.9 90.8 240.4 46.0 118.3 266.7 50.5 79.0 230.1 42.5
2050
Heathrow 64.8 30.3 1.0 56.8 33.1 1.4 60.7 33.3 1.0 62.8 33.1 1.2 58.8 33.3 0.9
Gatwick 12.9 64.9 4.1 30.9 61.0 4.1 23.4 54.4 5.0 45.7 44.1 6.1 11.0 53.7 3.5
Other London 2.7 48.6 8.7 4.4 47.7 9.9 0.7 52.8 7.8 0.0 53.7 7.7 0.0 53.2 8.0
London Total 80.5 143.8 13.8 92.0 141.8 15.3 84.9 140.4 13.8 108.5 130.9 15.0 69.8 140.2 12.3
Regional Total 25.6 121.4 41.1 39.0 153.5 46.5 28.8 131.5 41.0 33.6 167.8 46.1 22.7 123.4 37.4
National Total 106.1 265.2 55.0 131.0 295.3 61.9 113.7 272.0 54.9 142.1 298.6 61.2 92.5 263.7 49.7
Strategic Fit: Forecasts
112
6.45 In the Gatwick Airport Second Runway option with traded carbon in 2050 Gatwick attracts
the least long-haul passengers in global fragmentation (11 mppa) and in terms of extra
traffic over the baseline in 2050 this is in a range of 1mppa to 33mppa. By far the most
long-haul at Gatwick is attracted in low-cost is king, (46mppa) where over half the
passengers at Gatwick are long-haul by 2050. The low-cost is king scenario includes
significantly improving the attractiveness to transfer passengers and gaining a third of the
Heathrow long-haul network when the second runway opens. This appears a much
stronger intervention at Gatwick than moving SkyTeam in global growth or strengthening
Dubai services in relative decline of Europe.
6.46 Heathrow’s long-haul throughput remains relatively resilient, only varying between 56 mppa
and 63 mppa across all the demand scenarios and comprising between 62% and 67%
of total traffic. Global fragmentation and low-cost is king also represent the low and high
bounds in the 2050 long-haul range nationally. The regional share of national long-haul is
generally around 25% in most scenarios, but it reaches 30% under global growth.
6.47 Carbon capping increases the air fare per kilometre travelled and therefore the long-haul
share is penalised. In Gatwick Airport Second Runway, the balance between short-haul
and long-haul demand changes and both long-haul and short-haul traffic is lower
nationally. Low-cost is king remains the most attractive scenario for long-haul at Gatwick
with 41mppa in 2050, whilst in all the other demand scenarios long-haul at the expanded
Gatwick ranges from 11mppa to 16mppa. Heathrow long-haul in 2050 ranges from
52mppa in to 67mppa in global growth.
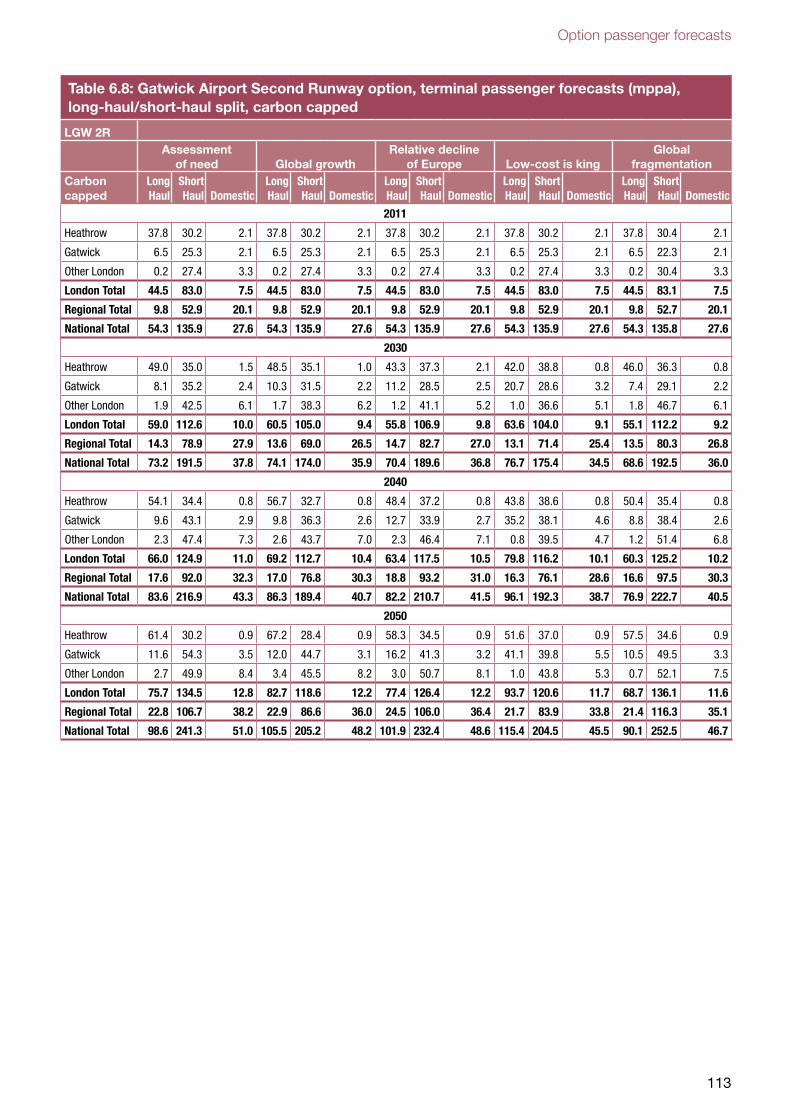
Option passenger forecasts
113
Table 6.8: Gatwick Airport Second Runway option, terminal passenger forecasts (mppa), long-haul/short-haul split, carbon capped
LGW 2RAssessment
of need Global growthRelative decline
of Europe Low-cost is kingGlobal
fragmentationCarbon capped
Long Haul
Short Haul Domestic
Long Haul
Short Haul Domestic
Long Haul
Short Haul Domestic
Long Haul
Short Haul Domestic
Long Haul
Short Haul Domestic
2011
Heathrow 37.8 30.2 2.1 37.8 30.2 2.1 37.8 30.2 2.1 37.8 30.2 2.1 37.8 30.4 2.1
Gatwick 6.5 25.3 2.1 6.5 25.3 2.1 6.5 25.3 2.1 6.5 25.3 2.1 6.5 22.3 2.1
Other London 0.2 27.4 3.3 0.2 27.4 3.3 0.2 27.4 3.3 0.2 27.4 3.3 0.2 30.4 3.3
London Total 44.5 83.0 7.5 44.5 83.0 7.5 44.5 83.0 7.5 44.5 83.0 7.5 44.5 83.1 7.5
Regional Total 9.8 52.9 20.1 9.8 52.9 20.1 9.8 52.9 20.1 9.8 52.9 20.1 9.8 52.7 20.1
National Total 54.3 135.9 27.6 54.3 135.9 27.6 54.3 135.9 27.6 54.3 135.9 27.6 54.3 135.8 27.6
2030
Heathrow 49.0 35.0 1.5 48.5 35.1 1.0 43.3 37.3 2.1 42.0 38.8 0.8 46.0 36.3 0.8
Gatwick 8.1 35.2 2.4 10.3 31.5 2.2 11.2 28.5 2.5 20.7 28.6 3.2 7.4 29.1 2.2
Other London 1.9 42.5 6.1 1.7 38.3 6.2 1.2 41.1 5.2 1.0 36.6 5.1 1.8 46.7 6.1
London Total 59.0 112.6 10.0 60.5 105.0 9.4 55.8 106.9 9.8 63.6 104.0 9.1 55.1 112.2 9.2
Regional Total 14.3 78.9 27.9 13.6 69.0 26.5 14.7 82.7 27.0 13.1 71.4 25.4 13.5 80.3 26.8
National Total 73.2 191.5 37.8 74.1 174.0 35.9 70.4 189.6 36.8 76.7 175.4 34.5 68.6 192.5 36.0
2040
Heathrow 54.1 34.4 0.8 56.7 32.7 0.8 48.4 37.2 0.8 43.8 38.6 0.8 50.4 35.4 0.8
Gatwick 9.6 43.1 2.9 9.8 36.3 2.6 12.7 33.9 2.7 35.2 38.1 4.6 8.8 38.4 2.6
Other London 2.3 47.4 7.3 2.6 43.7 7.0 2.3 46.4 7.1 0.8 39.5 4.7 1.2 51.4 6.8
London Total 66.0 124.9 11.0 69.2 112.7 10.4 63.4 117.5 10.5 79.8 116.2 10.1 60.3 125.2 10.2
Regional Total 17.6 92.0 32.3 17.0 76.8 30.3 18.8 93.2 31.0 16.3 76.1 28.6 16.6 97.5 30.3
National Total 83.6 216.9 43.3 86.3 189.4 40.7 82.2 210.7 41.5 96.1 192.3 38.7 76.9 222.7 40.5
2050
Heathrow 61.4 30.2 0.9 67.2 28.4 0.9 58.3 34.5 0.9 51.6 37.0 0.9 57.5 34.6 0.9
Gatwick 11.6 54.3 3.5 12.0 44.7 3.1 16.2 41.3 3.2 41.1 39.8 5.5 10.5 49.5 3.3
Other London 2.7 49.9 8.4 3.4 45.5 8.2 3.0 50.7 8.1 1.0 43.8 5.3 0.7 52.1 7.5
London Total 75.7 134.5 12.8 82.7 118.6 12.2 77.4 126.4 12.2 93.7 120.6 11.7 68.7 136.1 11.6
Regional Total 22.8 106.7 38.2 22.9 86.6 36.0 24.5 106.0 36.4 21.7 83.9 33.8 21.4 116.3 35.1
National Total 98.6 241.3 51.0 105.5 205.2 48.2 101.9 232.4 48.6 115.4 204.5 45.5 90.1 252.5 46.7
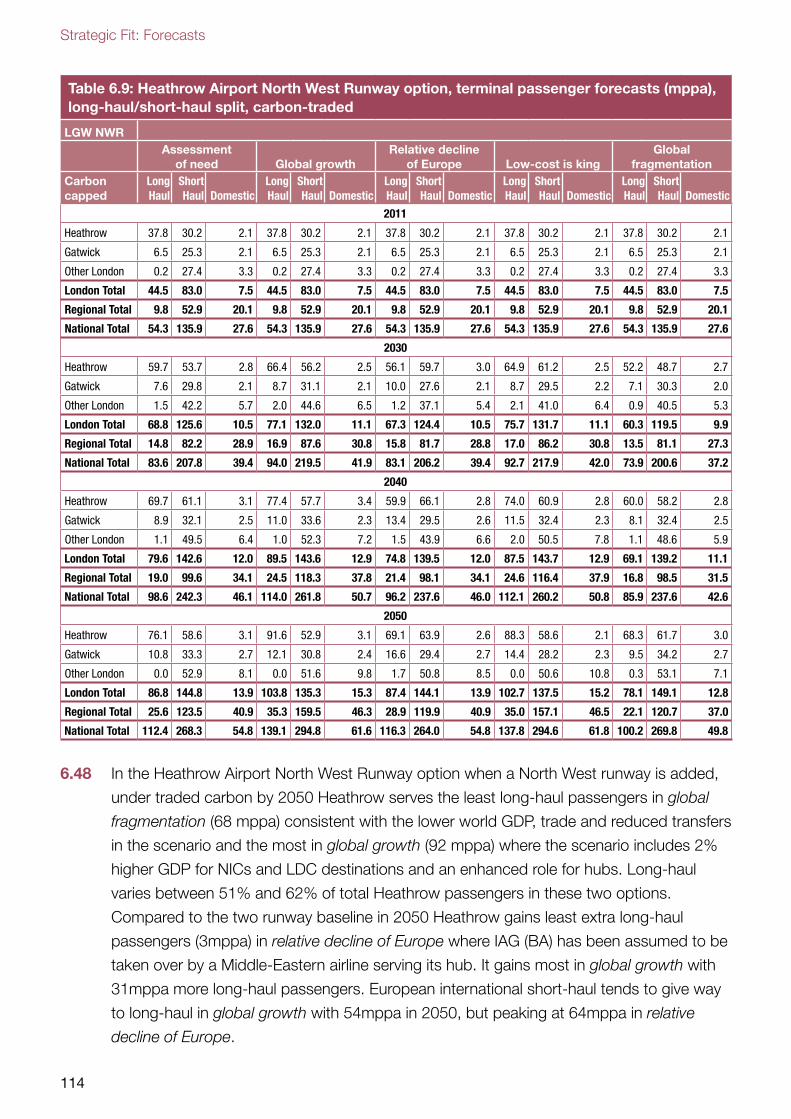
Strategic Fit: Forecasts
114
Table 6.9: Heathrow Airport North West Runway option, terminal passenger forecasts (mppa), long-haul/short-haul split, carbon-traded
LGW NWRAssessment
of need Global growthRelative decline
of Europe Low-cost is kingGlobal
fragmentationCarbon capped
Long Haul
Short Haul Domestic
Long Haul
Short Haul Domestic
Long Haul
Short Haul Domestic
Long Haul
Short Haul Domestic
Long Haul
Short Haul Domestic
2011
Heathrow 37.8 30.2 2.1 37.8 30.2 2.1 37.8 30.2 2.1 37.8 30.2 2.1 37.8 30.2 2.1
Gatwick 6.5 25.3 2.1 6.5 25.3 2.1 6.5 25.3 2.1 6.5 25.3 2.1 6.5 25.3 2.1
Other London 0.2 27.4 3.3 0.2 27.4 3.3 0.2 27.4 3.3 0.2 27.4 3.3 0.2 27.4 3.3
London Total 44.5 83.0 7.5 44.5 83.0 7.5 44.5 83.0 7.5 44.5 83.0 7.5 44.5 83.0 7.5
Regional Total 9.8 52.9 20.1 9.8 52.9 20.1 9.8 52.9 20.1 9.8 52.9 20.1 9.8 52.9 20.1
National Total 54.3 135.9 27.6 54.3 135.9 27.6 54.3 135.9 27.6 54.3 135.9 27.6 54.3 135.9 27.6
2030
Heathrow 59.7 53.7 2.8 66.4 56.2 2.5 56.1 59.7 3.0 64.9 61.2 2.5 52.2 48.7 2.7
Gatwick 7.6 29.8 2.1 8.7 31.1 2.1 10.0 27.6 2.1 8.7 29.5 2.2 7.1 30.3 2.0
Other London 1.5 42.2 5.7 2.0 44.6 6.5 1.2 37.1 5.4 2.1 41.0 6.4 0.9 40.5 5.3
London Total 68.8 125.6 10.5 77.1 132.0 11.1 67.3 124.4 10.5 75.7 131.7 11.1 60.3 119.5 9.9
Regional Total 14.8 82.2 28.9 16.9 87.6 30.8 15.8 81.7 28.8 17.0 86.2 30.8 13.5 81.1 27.3
National Total 83.6 207.8 39.4 94.0 219.5 41.9 83.1 206.2 39.4 92.7 217.9 42.0 73.9 200.6 37.2
2040
Heathrow 69.7 61.1 3.1 77.4 57.7 3.4 59.9 66.1 2.8 74.0 60.9 2.8 60.0 58.2 2.8
Gatwick 8.9 32.1 2.5 11.0 33.6 2.3 13.4 29.5 2.6 11.5 32.4 2.3 8.1 32.4 2.5
Other London 1.1 49.5 6.4 1.0 52.3 7.2 1.5 43.9 6.6 2.0 50.5 7.8 1.1 48.6 5.9
London Total 79.6 142.6 12.0 89.5 143.6 12.9 74.8 139.5 12.0 87.5 143.7 12.9 69.1 139.2 11.1
Regional Total 19.0 99.6 34.1 24.5 118.3 37.8 21.4 98.1 34.1 24.6 116.4 37.9 16.8 98.5 31.5
National Total 98.6 242.3 46.1 114.0 261.8 50.7 96.2 237.6 46.0 112.1 260.2 50.8 85.9 237.6 42.6
2050
Heathrow 76.1 58.6 3.1 91.6 52.9 3.1 69.1 63.9 2.6 88.3 58.6 2.1 68.3 61.7 3.0
Gatwick 10.8 33.3 2.7 12.1 30.8 2.4 16.6 29.4 2.7 14.4 28.2 2.3 9.5 34.2 2.7
Other London 0.0 52.9 8.1 0.0 51.6 9.8 1.7 50.8 8.5 0.0 50.6 10.8 0.3 53.1 7.1
London Total 86.8 144.8 13.9 103.8 135.3 15.3 87.4 144.1 13.9 102.7 137.5 15.2 78.1 149.1 12.8
Regional Total 25.6 123.5 40.9 35.3 159.5 46.3 28.9 119.9 40.9 35.0 157.1 46.5 22.1 120.7 37.0
National Total 112.4 268.3 54.8 139.1 294.8 61.6 116.3 264.0 54.8 137.8 294.6 61.8 100.2 269.8 49.8
6.48 In the Heathrow Airport North West Runway option when a North West runway is added,
under traded carbon by 2050 Heathrow serves the least long-haul passengers in global
fragmentation (68 mppa) consistent with the lower world GDP, trade and reduced transfers
in the scenario and the most in global growth (92 mppa) where the scenario includes 2%
higher GDP for NICs and LDC destinations and an enhanced role for hubs. Long-haul
varies between 51% and 62% of total Heathrow passengers in these two options.
Compared to the two runway baseline in 2050 Heathrow gains least extra long-haul
passengers (3mppa) in relative decline of Europe where IAG (BA) has been assumed to be
taken over by a Middle-Eastern airline serving its hub. It gains most in global growth with
31mppa more long-haul passengers. European international short-haul tends to give way
to long-haul in global growth with 54mppa in 2050, but peaking at 64mppa in relative
decline of Europe.
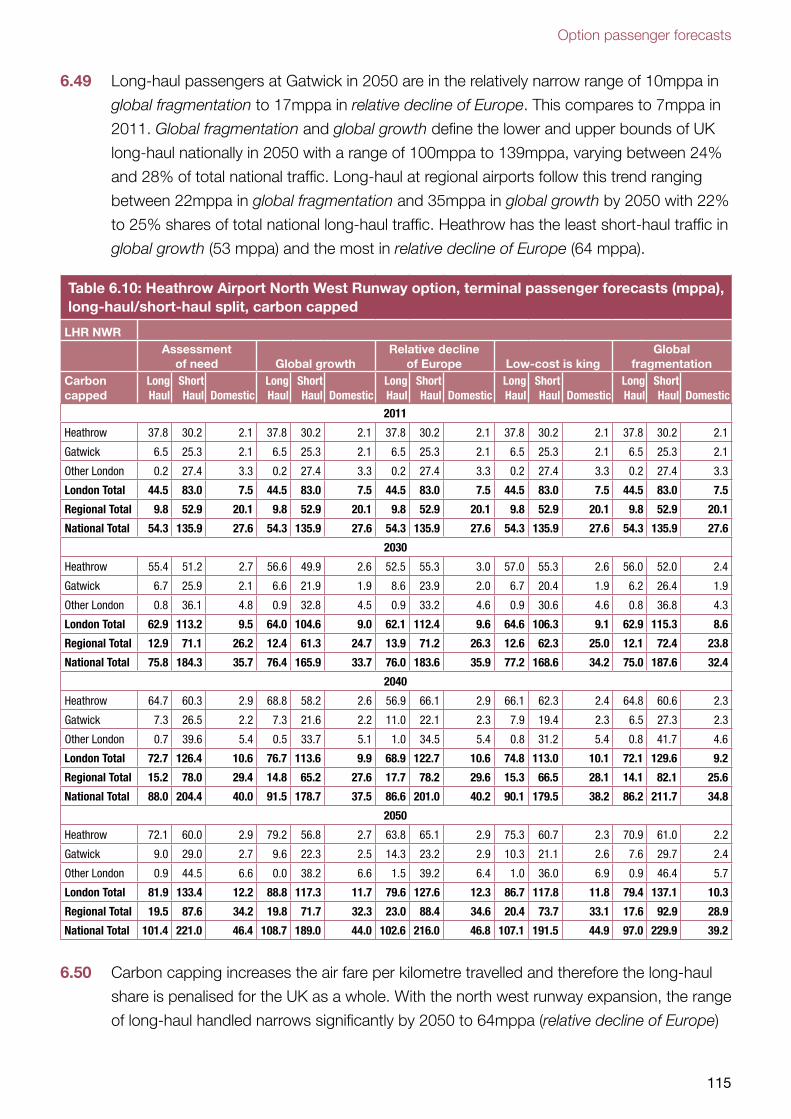
Option passenger forecasts
115
6.49 Long-haul passengers at Gatwick in 2050 are in the relatively narrow range of 10mppa in
global fragmentation to 17mppa in relative decline of Europe. This compares to 7mppa in
2011. Global fragmentation and global growth define the lower and upper bounds of UK
long-haul nationally in 2050 with a range of 100mppa to 139mppa, varying between 24%
and 28% of total national traffic. Long-haul at regional airports follow this trend ranging
between 22mppa in global fragmentation and 35mppa in global growth by 2050 with 22%
to 25% shares of total national long-haul traffic. Heathrow has the least short-haul traffic in
global growth (53 mppa) and the most in relative decline of Europe (64 mppa).
Table 6.10: Heathrow Airport North West Runway option, terminal passenger forecasts (mppa), long-haul/short-haul split, carbon capped
LHR NWRAssessment
of need Global growthRelative decline
of Europe Low-cost is kingGlobal
fragmentationCarbon capped
Long Haul
Short Haul Domestic
Long Haul
Short Haul Domestic
Long Haul
Short Haul Domestic
Long Haul
Short Haul Domestic
Long Haul
Short Haul Domestic
2011
Heathrow 37.8 30.2 2.1 37.8 30.2 2.1 37.8 30.2 2.1 37.8 30.2 2.1 37.8 30.2 2.1
Gatwick 6.5 25.3 2.1 6.5 25.3 2.1 6.5 25.3 2.1 6.5 25.3 2.1 6.5 25.3 2.1
Other London 0.2 27.4 3.3 0.2 27.4 3.3 0.2 27.4 3.3 0.2 27.4 3.3 0.2 27.4 3.3
London Total 44.5 83.0 7.5 44.5 83.0 7.5 44.5 83.0 7.5 44.5 83.0 7.5 44.5 83.0 7.5
Regional Total 9.8 52.9 20.1 9.8 52.9 20.1 9.8 52.9 20.1 9.8 52.9 20.1 9.8 52.9 20.1
National Total 54.3 135.9 27.6 54.3 135.9 27.6 54.3 135.9 27.6 54.3 135.9 27.6 54.3 135.9 27.6
2030
Heathrow 55.4 51.2 2.7 56.6 49.9 2.6 52.5 55.3 3.0 57.0 55.3 2.6 56.0 52.0 2.4
Gatwick 6.7 25.9 2.1 6.6 21.9 1.9 8.6 23.9 2.0 6.7 20.4 1.9 6.2 26.4 1.9
Other London 0.8 36.1 4.8 0.9 32.8 4.5 0.9 33.2 4.6 0.9 30.6 4.6 0.8 36.8 4.3
London Total 62.9 113.2 9.5 64.0 104.6 9.0 62.1 112.4 9.6 64.6 106.3 9.1 62.9 115.3 8.6
Regional Total 12.9 71.1 26.2 12.4 61.3 24.7 13.9 71.2 26.3 12.6 62.3 25.0 12.1 72.4 23.8
National Total 75.8 184.3 35.7 76.4 165.9 33.7 76.0 183.6 35.9 77.2 168.6 34.2 75.0 187.6 32.4
2040
Heathrow 64.7 60.3 2.9 68.8 58.2 2.6 56.9 66.1 2.9 66.1 62.3 2.4 64.8 60.6 2.3
Gatwick 7.3 26.5 2.2 7.3 21.6 2.2 11.0 22.1 2.3 7.9 19.4 2.3 6.5 27.3 2.3
Other London 0.7 39.6 5.4 0.5 33.7 5.1 1.0 34.5 5.4 0.8 31.2 5.4 0.8 41.7 4.6
London Total 72.7 126.4 10.6 76.7 113.6 9.9 68.9 122.7 10.6 74.8 113.0 10.1 72.1 129.6 9.2
Regional Total 15.2 78.0 29.4 14.8 65.2 27.6 17.7 78.2 29.6 15.3 66.5 28.1 14.1 82.1 25.6
National Total 88.0 204.4 40.0 91.5 178.7 37.5 86.6 201.0 40.2 90.1 179.5 38.2 86.2 211.7 34.8
2050
Heathrow 72.1 60.0 2.9 79.2 56.8 2.7 63.8 65.1 2.9 75.3 60.7 2.3 70.9 61.0 2.2
Gatwick 9.0 29.0 2.7 9.6 22.3 2.5 14.3 23.2 2.9 10.3 21.1 2.6 7.6 29.7 2.4
Other London 0.9 44.5 6.6 0.0 38.2 6.6 1.5 39.2 6.4 1.0 36.0 6.9 0.9 46.4 5.7
London Total 81.9 133.4 12.2 88.8 117.3 11.7 79.6 127.6 12.3 86.7 117.8 11.8 79.4 137.1 10.3
Regional Total 19.5 87.6 34.2 19.8 71.7 32.3 23.0 88.4 34.6 20.4 73.7 33.1 17.6 92.9 28.9
National Total 101.4 221.0 46.4 108.7 189.0 44.0 102.6 216.0 46.8 107.1 191.5 44.9 97.0 229.9 39.2
6.50 Carbon capping increases the air fare per kilometre travelled and therefore the long-haul
share is penalised for the UK as a whole. With the north west runway expansion, the range
of long-haul handled narrows significantly by 2050 to 64mppa (relative decline of Europe)
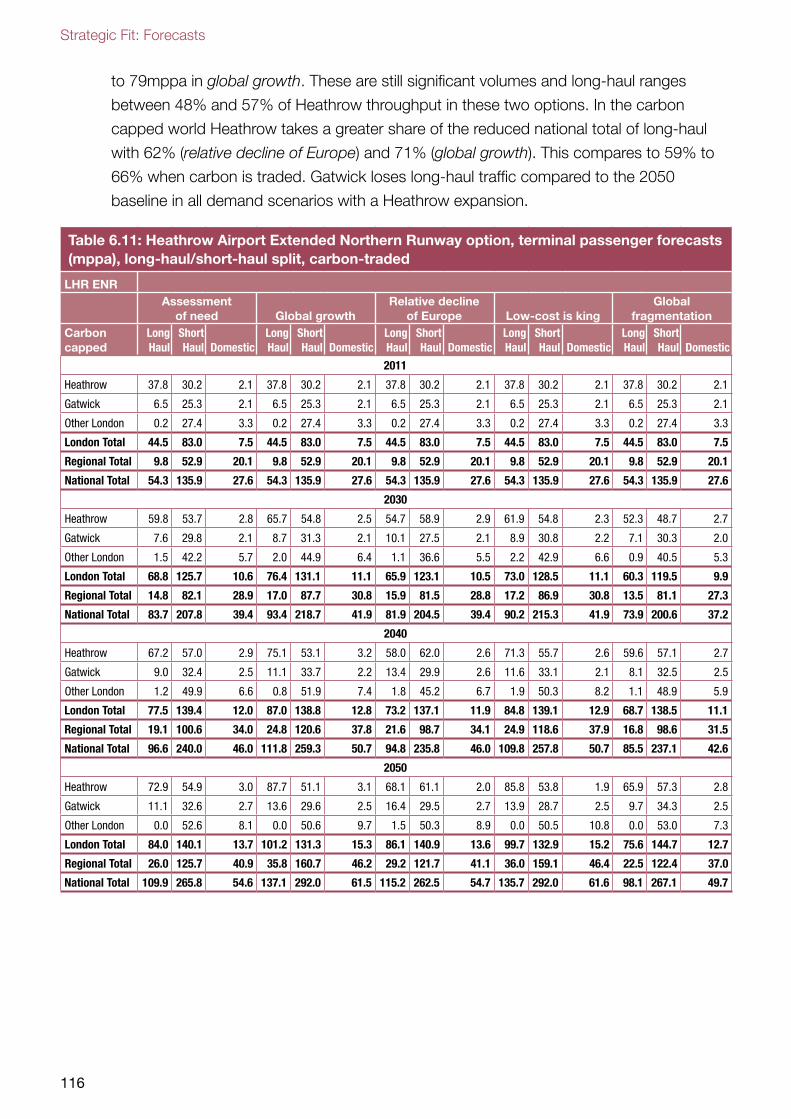
Strategic Fit: Forecasts
116
to 79mppa in global growth. These are still significant volumes and long-haul ranges
between 48% and 57% of Heathrow throughput in these two options. In the carbon
capped world Heathrow takes a greater share of the reduced national total of long-haul
with 62% (relative decline of Europe) and 71% (global growth). This compares to 59% to
66% when carbon is traded. Gatwick loses long-haul traffic compared to the 2050
baseline in all demand scenarios with a Heathrow expansion.
Table 6.11: Heathrow Airport Extended Northern Runway option, terminal passenger forecasts (mppa), long-haul/short-haul split, carbon-traded
LHR ENRAssessment
of need Global growthRelative decline
of Europe Low-cost is kingGlobal
fragmentationCarbon capped
Long Haul
Short Haul Domestic
Long Haul
Short Haul Domestic
Long Haul
Short Haul Domestic
Long Haul
Short Haul Domestic
Long Haul
Short Haul Domestic
2011
Heathrow 37.8 30.2 2.1 37.8 30.2 2.1 37.8 30.2 2.1 37.8 30.2 2.1 37.8 30.2 2.1
Gatwick 6.5 25.3 2.1 6.5 25.3 2.1 6.5 25.3 2.1 6.5 25.3 2.1 6.5 25.3 2.1
Other London 0.2 27.4 3.3 0.2 27.4 3.3 0.2 27.4 3.3 0.2 27.4 3.3 0.2 27.4 3.3
London Total 44.5 83.0 7.5 44.5 83.0 7.5 44.5 83.0 7.5 44.5 83.0 7.5 44.5 83.0 7.5
Regional Total 9.8 52.9 20.1 9.8 52.9 20.1 9.8 52.9 20.1 9.8 52.9 20.1 9.8 52.9 20.1
National Total 54.3 135.9 27.6 54.3 135.9 27.6 54.3 135.9 27.6 54.3 135.9 27.6 54.3 135.9 27.6
2030
Heathrow 59.8 53.7 2.8 65.7 54.8 2.5 54.7 58.9 2.9 61.9 54.8 2.3 52.3 48.7 2.7
Gatwick 7.6 29.8 2.1 8.7 31.3 2.1 10.1 27.5 2.1 8.9 30.8 2.2 7.1 30.3 2.0
Other London 1.5 42.2 5.7 2.0 44.9 6.4 1.1 36.6 5.5 2.2 42.9 6.6 0.9 40.5 5.3
London Total 68.8 125.7 10.6 76.4 131.1 11.1 65.9 123.1 10.5 73.0 128.5 11.1 60.3 119.5 9.9
Regional Total 14.8 82.1 28.9 17.0 87.7 30.8 15.9 81.5 28.8 17.2 86.9 30.8 13.5 81.1 27.3
National Total 83.7 207.8 39.4 93.4 218.7 41.9 81.9 204.5 39.4 90.2 215.3 41.9 73.9 200.6 37.2
2040
Heathrow 67.2 57.0 2.9 75.1 53.1 3.2 58.0 62.0 2.6 71.3 55.7 2.6 59.6 57.1 2.7
Gatwick 9.0 32.4 2.5 11.1 33.7 2.2 13.4 29.9 2.6 11.6 33.1 2.1 8.1 32.5 2.5
Other London 1.2 49.9 6.6 0.8 51.9 7.4 1.8 45.2 6.7 1.9 50.3 8.2 1.1 48.9 5.9
London Total 77.5 139.4 12.0 87.0 138.8 12.8 73.2 137.1 11.9 84.8 139.1 12.9 68.7 138.5 11.1
Regional Total 19.1 100.6 34.0 24.8 120.6 37.8 21.6 98.7 34.1 24.9 118.6 37.9 16.8 98.6 31.5
National Total 96.6 240.0 46.0 111.8 259.3 50.7 94.8 235.8 46.0 109.8 257.8 50.7 85.5 237.1 42.6
2050
Heathrow 72.9 54.9 3.0 87.7 51.1 3.1 68.1 61.1 2.0 85.8 53.8 1.9 65.9 57.3 2.8
Gatwick 11.1 32.6 2.7 13.6 29.6 2.5 16.4 29.5 2.7 13.9 28.7 2.5 9.7 34.3 2.5
Other London 0.0 52.6 8.1 0.0 50.6 9.7 1.5 50.3 8.9 0.0 50.5 10.8 0.0 53.0 7.3
London Total 84.0 140.1 13.7 101.2 131.3 15.3 86.1 140.9 13.6 99.7 132.9 15.2 75.6 144.7 12.7
Regional Total 26.0 125.7 40.9 35.8 160.7 46.2 29.2 121.7 41.1 36.0 159.1 46.4 22.5 122.4 37.0
National Total 109.9 265.8 54.6 137.1 292.0 61.5 115.2 262.5 54.7 135.7 292.0 61.6 98.1 267.1 49.7
Option passenger forecasts
117
6.51 In the Heathrow Airport Extended Northern Runway option, under traded carbon by 2050
Heathrow serves the least long-haul passengers in global fragmentation (66 mppa)
consistent with the lower world GDP, trade and reduced transfers in the scenario and the
most in global growth (88 mppa) where the scenario includes 2% higher GDP for NICs
and LDC destinations and an enhanced role for hubs. Long-haul varies between 52% and
62% of total Heathrow passengers in these two options. Compared to the two runway
baseline in 2050 Heathrow gains least extra long-haul passengers (3mppa) in relative
decline of Europe where IAG (BA) has been assumed to be taken over by a Middle-
Eastern airline serving its hub. It gains most in global growth with 27mppa more long-haul
passengers. European international short-haul tends to give way to long-haul in global
growth with 51mppa in 2050, but peaking at 61mppa in relative decline of Europe.
6.52 Long-haul passengers at Gatwick in 2050 are in the relatively narrow range of 10mppa in
global fragmentation to 17mppa in relative decline of Europe. This compares to 7mppa in
2011. Global fragmentation and global growth define the lower and upper bounds of UK
long-haul nationally in 2050 with a range of 98mppa to 137mppa, varying between 24%
and 28% of total national traffic. Long-haul at regional airports follow this trend ranging
between 22mppa in global fragmentation and 35mppa in global growth by 2050 with 23%
to 27% shares of total national long-haul traffic. Heathrow has the least short-haul traffic in
global growth (51 mppa) and the most in relative decline of Europe (61 mppa).
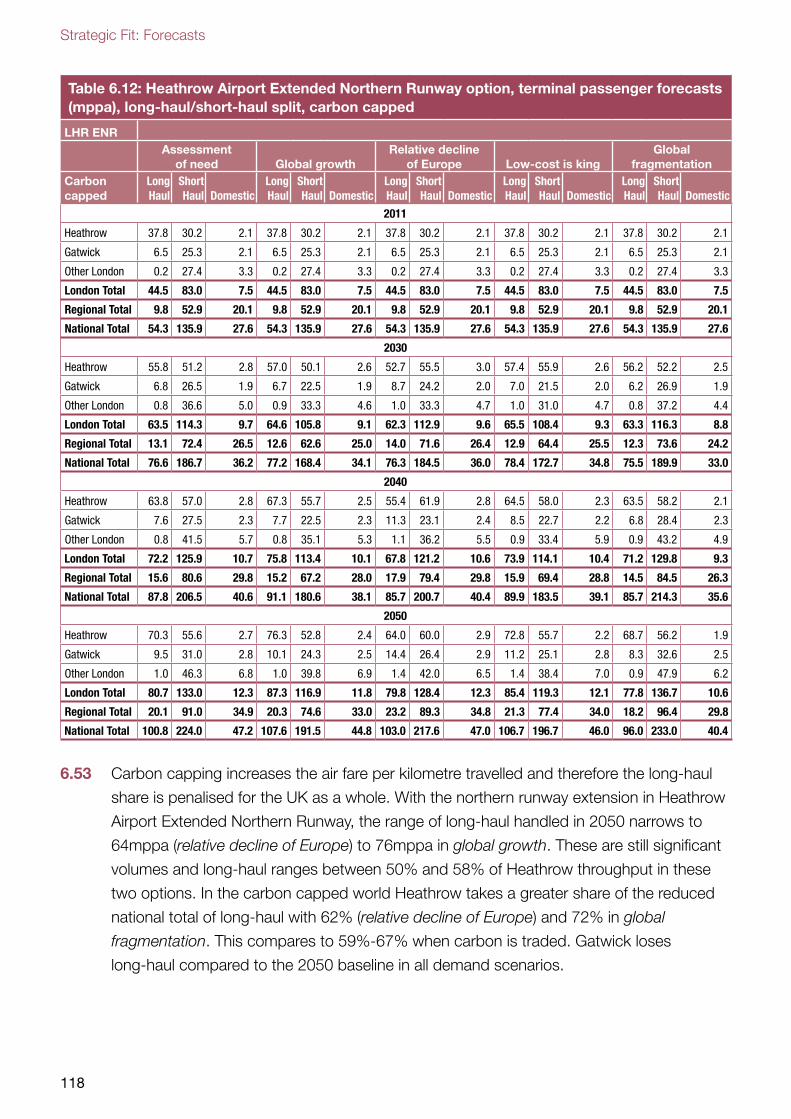
Strategic Fit: Forecasts
118
Table 6.12: Heathrow Airport Extended Northern Runway option, terminal passenger forecasts (mppa), long-haul/short-haul split, carbon capped
LHR ENRAssessment
of need Global growthRelative decline
of Europe Low-cost is kingGlobal
fragmentationCarbon capped
Long Haul
Short Haul Domestic
Long Haul
Short Haul Domestic
Long Haul
Short Haul Domestic
Long Haul
Short Haul Domestic
Long Haul
Short Haul Domestic
2011
Heathrow 37.8 30.2 2.1 37.8 30.2 2.1 37.8 30.2 2.1 37.8 30.2 2.1 37.8 30.2 2.1
Gatwick 6.5 25.3 2.1 6.5 25.3 2.1 6.5 25.3 2.1 6.5 25.3 2.1 6.5 25.3 2.1
Other London 0.2 27.4 3.3 0.2 27.4 3.3 0.2 27.4 3.3 0.2 27.4 3.3 0.2 27.4 3.3
London Total 44.5 83.0 7.5 44.5 83.0 7.5 44.5 83.0 7.5 44.5 83.0 7.5 44.5 83.0 7.5
Regional Total 9.8 52.9 20.1 9.8 52.9 20.1 9.8 52.9 20.1 9.8 52.9 20.1 9.8 52.9 20.1
National Total 54.3 135.9 27.6 54.3 135.9 27.6 54.3 135.9 27.6 54.3 135.9 27.6 54.3 135.9 27.6
2030
Heathrow 55.8 51.2 2.8 57.0 50.1 2.6 52.7 55.5 3.0 57.4 55.9 2.6 56.2 52.2 2.5
Gatwick 6.8 26.5 1.9 6.7 22.5 1.9 8.7 24.2 2.0 7.0 21.5 2.0 6.2 26.9 1.9
Other London 0.8 36.6 5.0 0.9 33.3 4.6 1.0 33.3 4.7 1.0 31.0 4.7 0.8 37.2 4.4
London Total 63.5 114.3 9.7 64.6 105.8 9.1 62.3 112.9 9.6 65.5 108.4 9.3 63.3 116.3 8.8
Regional Total 13.1 72.4 26.5 12.6 62.6 25.0 14.0 71.6 26.4 12.9 64.4 25.5 12.3 73.6 24.2
National Total 76.6 186.7 36.2 77.2 168.4 34.1 76.3 184.5 36.0 78.4 172.7 34.8 75.5 189.9 33.0
2040
Heathrow 63.8 57.0 2.8 67.3 55.7 2.5 55.4 61.9 2.8 64.5 58.0 2.3 63.5 58.2 2.1
Gatwick 7.6 27.5 2.3 7.7 22.5 2.3 11.3 23.1 2.4 8.5 22.7 2.2 6.8 28.4 2.3
Other London 0.8 41.5 5.7 0.8 35.1 5.3 1.1 36.2 5.5 0.9 33.4 5.9 0.9 43.2 4.9
London Total 72.2 125.9 10.7 75.8 113.4 10.1 67.8 121.2 10.6 73.9 114.1 10.4 71.2 129.8 9.3
Regional Total 15.6 80.6 29.8 15.2 67.2 28.0 17.9 79.4 29.8 15.9 69.4 28.8 14.5 84.5 26.3
National Total 87.8 206.5 40.6 91.1 180.6 38.1 85.7 200.7 40.4 89.9 183.5 39.1 85.7 214.3 35.6
2050
Heathrow 70.3 55.6 2.7 76.3 52.8 2.4 64.0 60.0 2.9 72.8 55.7 2.2 68.7 56.2 1.9
Gatwick 9.5 31.0 2.8 10.1 24.3 2.5 14.4 26.4 2.9 11.2 25.1 2.8 8.3 32.6 2.5
Other London 1.0 46.3 6.8 1.0 39.8 6.9 1.4 42.0 6.5 1.4 38.4 7.0 0.9 47.9 6.2
London Total 80.7 133.0 12.3 87.3 116.9 11.8 79.8 128.4 12.3 85.4 119.3 12.1 77.8 136.7 10.6
Regional Total 20.1 91.0 34.9 20.3 74.6 33.0 23.2 89.3 34.8 21.3 77.4 34.0 18.2 96.4 29.8
National Total 100.8 224.0 47.2 107.6 191.5 44.8 103.0 217.6 47.0 106.7 196.7 46.0 96.0 233.0 40.4
6.53 Carbon capping increases the air fare per kilometre travelled and therefore the long-haul
share is penalised for the UK as a whole. With the northern runway extension in Heathrow
Airport Extended Northern Runway, the range of long-haul handled in 2050 narrows to
64mppa (relative decline of Europe) to 76mppa in global growth. These are still significant
volumes and long-haul ranges between 50% and 58% of Heathrow throughput in these
two options. In the carbon capped world Heathrow takes a greater share of the reduced
national total of long-haul with 62% (relative decline of Europe) and 72% in global
fragmentation. This compares to 59%-67% when carbon is traded. Gatwick loses
long-haul compared to the 2050 baseline in all demand scenarios.
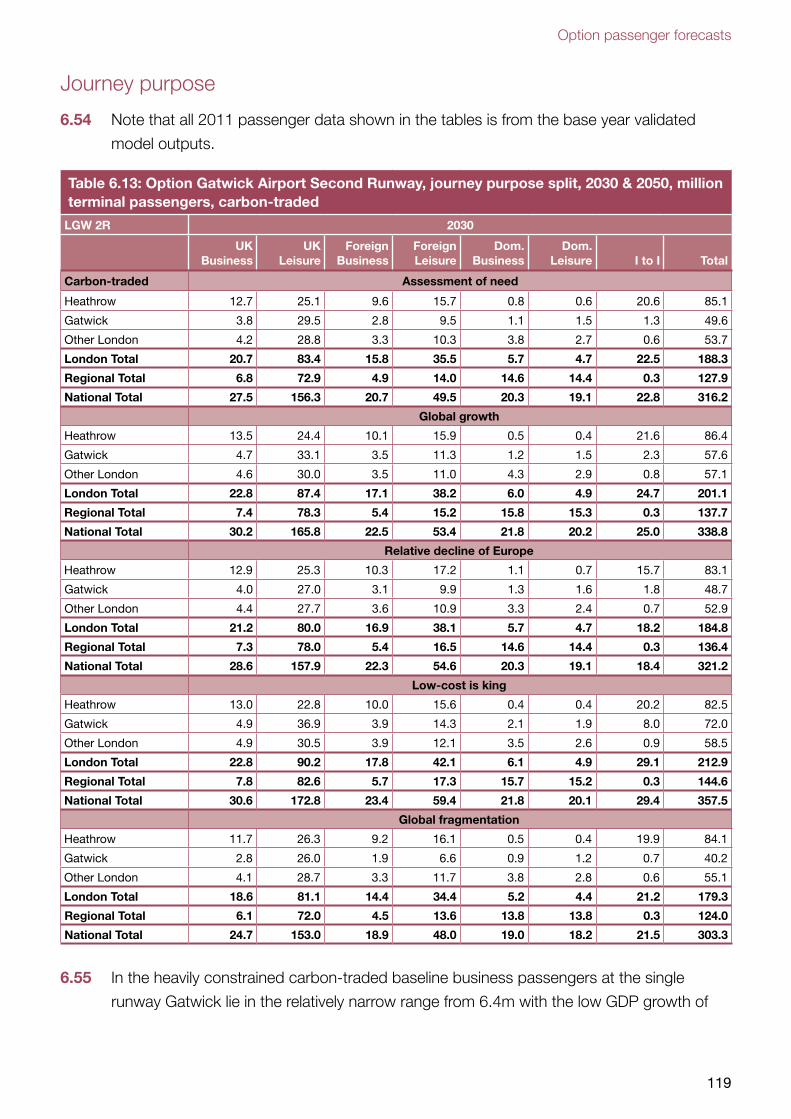
Option passenger forecasts
119
Journey purpose
6.54 Note that all 2011 passenger data shown in the tables is from the base year validated
model outputs.
Table 6.13: Option Gatwick Airport Second Runway, journey purpose split, 2030 & 2050, million terminal passengers, carbon-traded
LGW 2R 2030
UK Business
UK Leisure
Foreign Business
Foreign Leisure
Dom. Business
Dom. Leisure I to I Total
Carbon-traded Assessment of need
Heathrow 12.7 25.1 9.6 15.7 0.8 0.6 20.6 85.1
Gatwick 3.8 29.5 2.8 9.5 1.1 1.5 1.3 49.6
Other London 4.2 28.8 3.3 10.3 3.8 2.7 0.6 53.7
London Total 20.7 83.4 15.8 35.5 5.7 4.7 22.5 188.3
Regional Total 6.8 72.9 4.9 14.0 14.6 14.4 0.3 127.9
National Total 27.5 156.3 20.7 49.5 20.3 19.1 22.8 316.2
Global growth
Heathrow 13.5 24.4 10.1 15.9 0.5 0.4 21.6 86.4
Gatwick 4.7 33.1 3.5 11.3 1.2 1.5 2.3 57.6
Other London 4.6 30.0 3.5 11.0 4.3 2.9 0.8 57.1
London Total 22.8 87.4 17.1 38.2 6.0 4.9 24.7 201.1
Regional Total 7.4 78.3 5.4 15.2 15.8 15.3 0.3 137.7
National Total 30.2 165.8 22.5 53.4 21.8 20.2 25.0 338.8
Relative decline of Europe
Heathrow 12.9 25.3 10.3 17.2 1.1 0.7 15.7 83.1
Gatwick 4.0 27.0 3.1 9.9 1.3 1.6 1.8 48.7
Other London 4.4 27.7 3.6 10.9 3.3 2.4 0.7 52.9
London Total 21.2 80.0 16.9 38.1 5.7 4.7 18.2 184.8
Regional Total 7.3 78.0 5.4 16.5 14.6 14.4 0.3 136.4
National Total 28.6 157.9 22.3 54.6 20.3 19.1 18.4 321.2
Low-cost is king
Heathrow 13.0 22.8 10.0 15.6 0.4 0.4 20.2 82.5
Gatwick 4.9 36.9 3.9 14.3 2.1 1.9 8.0 72.0
Other London 4.9 30.5 3.9 12.1 3.5 2.6 0.9 58.5
London Total 22.8 90.2 17.8 42.1 6.1 4.9 29.1 212.9
Regional Total 7.8 82.6 5.7 17.3 15.7 15.2 0.3 144.6
National Total 30.6 172.8 23.4 59.4 21.8 20.1 29.4 357.5
Global fragmentation
Heathrow 11.7 26.3 9.2 16.1 0.5 0.4 19.9 84.1
Gatwick 2.8 26.0 1.9 6.6 0.9 1.2 0.7 40.2
Other London 4.1 28.7 3.3 11.7 3.8 2.8 0.6 55.1
London Total 18.6 81.1 14.4 34.4 5.2 4.4 21.2 179.3
Regional Total 6.1 72.0 4.5 13.6 13.8 13.8 0.3 124.0
National Total 24.7 153.0 18.9 48.0 19.0 18.2 21.5 303.3
6.55 In the heavily constrained carbon-traded baseline business passengers at the single
runway Gatwick lie in the relatively narrow range from 6.4m with the low GDP growth of
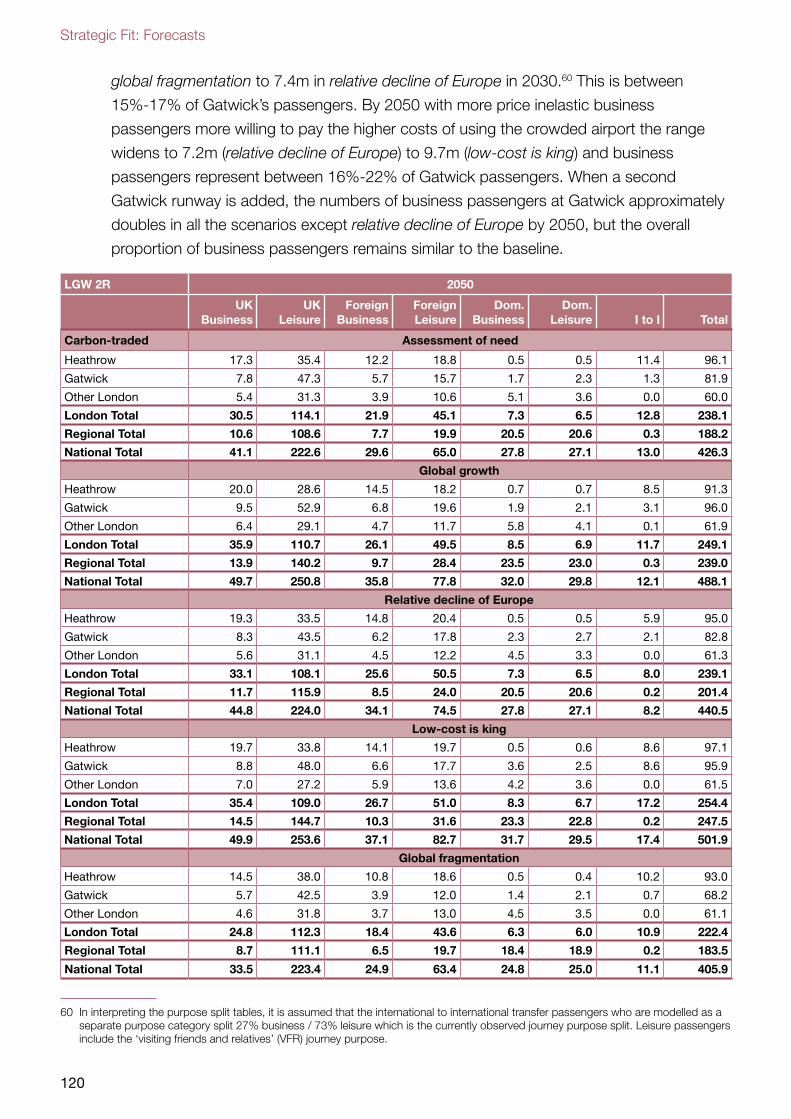
Strategic Fit: Forecasts
120
global fragmentation to 7.4m in relative decline of Europe in 2030.60 This is between
15%-17% of Gatwick’s passengers. By 2050 with more price inelastic business
passengers more willing to pay the higher costs of using the crowded airport the range
widens to 7.2m (relative decline of Europe) to 9.7m (low-cost is king) and business
passengers represent between 16%-22% of Gatwick passengers. When a second
Gatwick runway is added, the numbers of business passengers at Gatwick approximately
doubles in all the scenarios except relative decline of Europe by 2050, but the overall
proportion of business passengers remains similar to the baseline.
LGW 2R 2050
UK Business
UK Leisure
Foreign Business
Foreign Leisure
Dom. Business
Dom. Leisure I to I Total
Carbon-traded Assessment of need
Heathrow 17.3 35.4 12.2 18.8 0.5 0.5 11.4 96.1
Gatwick 7.8 47.3 5.7 15.7 1.7 2.3 1.3 81.9
Other London 5.4 31.3 3.9 10.6 5.1 3.6 0.0 60.0
London Total 30.5 114.1 21.9 45.1 7.3 6.5 12.8 238.1
Regional Total 10.6 108.6 7.7 19.9 20.5 20.6 0.3 188.2
National Total 41.1 222.6 29.6 65.0 27.8 27.1 13.0 426.3
Global growth
Heathrow 20.0 28.6 14.5 18.2 0.7 0.7 8.5 91.3
Gatwick 9.5 52.9 6.8 19.6 1.9 2.1 3.1 96.0
Other London 6.4 29.1 4.7 11.7 5.8 4.1 0.1 61.9
London Total 35.9 110.7 26.1 49.5 8.5 6.9 11.7 249.1
Regional Total 13.9 140.2 9.7 28.4 23.5 23.0 0.3 239.0
National Total 49.7 250.8 35.8 77.8 32.0 29.8 12.1 488.1
Relative decline of Europe
Heathrow 19.3 33.5 14.8 20.4 0.5 0.5 5.9 95.0
Gatwick 8.3 43.5 6.2 17.8 2.3 2.7 2.1 82.8
Other London 5.6 31.1 4.5 12.2 4.5 3.3 0.0 61.3
London Total 33.1 108.1 25.6 50.5 7.3 6.5 8.0 239.1
Regional Total 11.7 115.9 8.5 24.0 20.5 20.6 0.2 201.4
National Total 44.8 224.0 34.1 74.5 27.8 27.1 8.2 440.5
Low-cost is king
Heathrow 19.7 33.8 14.1 19.7 0.5 0.6 8.6 97.1
Gatwick 8.8 48.0 6.6 17.7 3.6 2.5 8.6 95.9
Other London 7.0 27.2 5.9 13.6 4.2 3.6 0.0 61.5
London Total 35.4 109.0 26.7 51.0 8.3 6.7 17.2 254.4
Regional Total 14.5 144.7 10.3 31.6 23.3 22.8 0.2 247.5
National Total 49.9 253.6 37.1 82.7 31.7 29.5 17.4 501.9
Global fragmentation
Heathrow 14.5 38.0 10.8 18.6 0.5 0.4 10.2 93.0
Gatwick 5.7 42.5 3.9 12.0 1.4 2.1 0.7 68.2
Other London 4.6 31.8 3.7 13.0 4.5 3.5 0.0 61.1
London Total 24.8 112.3 18.4 43.6 6.3 6.0 10.9 222.4
Regional Total 8.7 111.1 6.5 19.7 18.4 18.9 0.2 183.5
National Total 33.5 223.4 24.9 63.4 24.8 25.0 11.1 405.9
60 In interpreting the purpose split tables, it is assumed that the international to international transfer passengers who are modelled as a separate purpose category split 27% business / 73% leisure which is the currently observed journey purpose split. Leisure passengers include the ‘visiting friends and relatives’ (VFR) journey purpose.
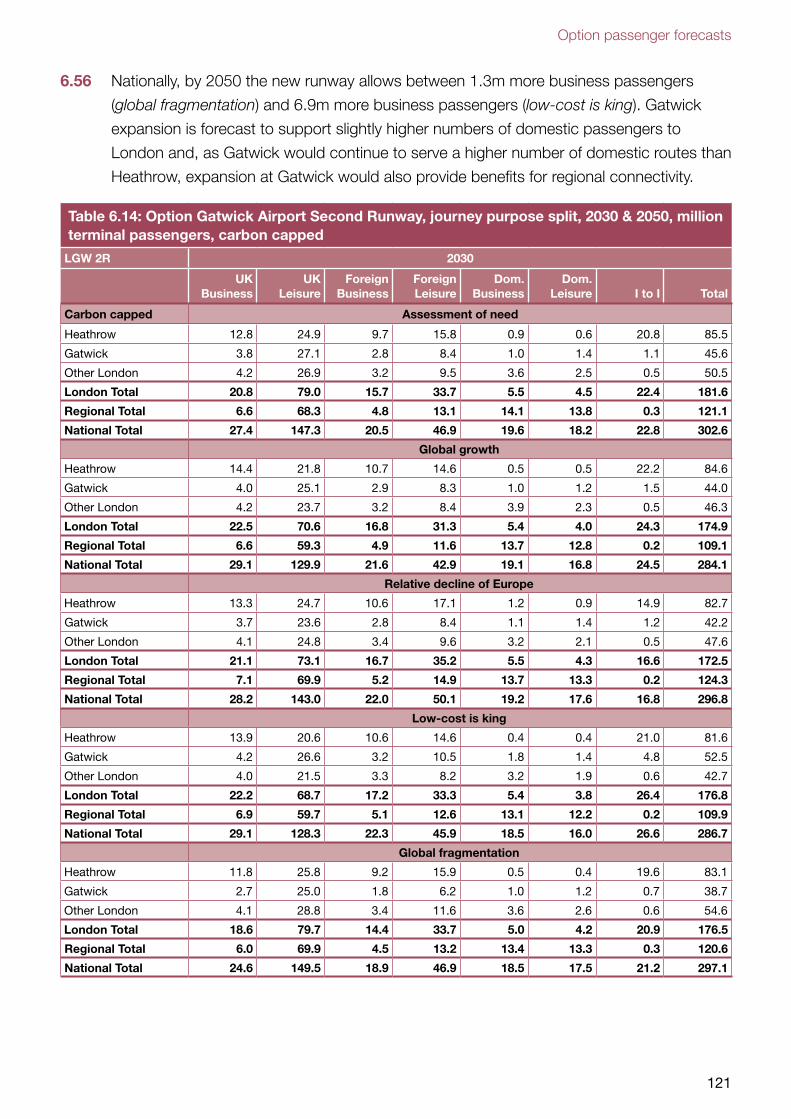
Option passenger forecasts
121
6.56 Nationally, by 2050 the new runway allows between 1.3m more business passengers
(global fragmentation) and 6.9m more business passengers (low-cost is king). Gatwick
expansion is forecast to support slightly higher numbers of domestic passengers to
London and, as Gatwick would continue to serve a higher number of domestic routes than
Heathrow, expansion at Gatwick would also provide benefits for regional connectivity.
Table 6.14: Option Gatwick Airport Second Runway, journey purpose split, 2030 & 2050, million terminal passengers, carbon capped
LGW 2R 2030
UK Business
UK Leisure
Foreign Business
Foreign Leisure
Dom. Business
Dom. Leisure I to I Total
Carbon capped Assessment of need
Heathrow 12.8 24.9 9.7 15.8 0.9 0.6 20.8 85.5
Gatwick 3.8 27.1 2.8 8.4 1.0 1.4 1.1 45.6
Other London 4.2 26.9 3.2 9.5 3.6 2.5 0.5 50.5
London Total 20.8 79.0 15.7 33.7 5.5 4.5 22.4 181.6
Regional Total 6.6 68.3 4.8 13.1 14.1 13.8 0.3 121.1
National Total 27.4 147.3 20.5 46.9 19.6 18.2 22.8 302.6
Global growth
Heathrow 14.4 21.8 10.7 14.6 0.5 0.5 22.2 84.6
Gatwick 4.0 25.1 2.9 8.3 1.0 1.2 1.5 44.0
Other London 4.2 23.7 3.2 8.4 3.9 2.3 0.5 46.3
London Total 22.5 70.6 16.8 31.3 5.4 4.0 24.3 174.9
Regional Total 6.6 59.3 4.9 11.6 13.7 12.8 0.2 109.1
National Total 29.1 129.9 21.6 42.9 19.1 16.8 24.5 284.1
Relative decline of Europe
Heathrow 13.3 24.7 10.6 17.1 1.2 0.9 14.9 82.7
Gatwick 3.7 23.6 2.8 8.4 1.1 1.4 1.2 42.2
Other London 4.1 24.8 3.4 9.6 3.2 2.1 0.5 47.6
London Total 21.1 73.1 16.7 35.2 5.5 4.3 16.6 172.5
Regional Total 7.1 69.9 5.2 14.9 13.7 13.3 0.2 124.3
National Total 28.2 143.0 22.0 50.1 19.2 17.6 16.8 296.8
Low-cost is king
Heathrow 13.9 20.6 10.6 14.6 0.4 0.4 21.0 81.6
Gatwick 4.2 26.6 3.2 10.5 1.8 1.4 4.8 52.5
Other London 4.0 21.5 3.3 8.2 3.2 1.9 0.6 42.7
London Total 22.2 68.7 17.2 33.3 5.4 3.8 26.4 176.8
Regional Total 6.9 59.7 5.1 12.6 13.1 12.2 0.2 109.9
National Total 29.1 128.3 22.3 45.9 18.5 16.0 26.6 286.7
Global fragmentation
Heathrow 11.8 25.8 9.2 15.9 0.5 0.4 19.6 83.1
Gatwick 2.7 25.0 1.8 6.2 1.0 1.2 0.7 38.7
Other London 4.1 28.8 3.4 11.6 3.6 2.6 0.6 54.6
London Total 18.6 79.7 14.4 33.7 5.0 4.2 20.9 176.5
Regional Total 6.0 69.9 4.5 13.2 13.4 13.3 0.3 120.6
National Total 24.6 149.5 18.9 46.9 18.5 17.5 21.2 297.1
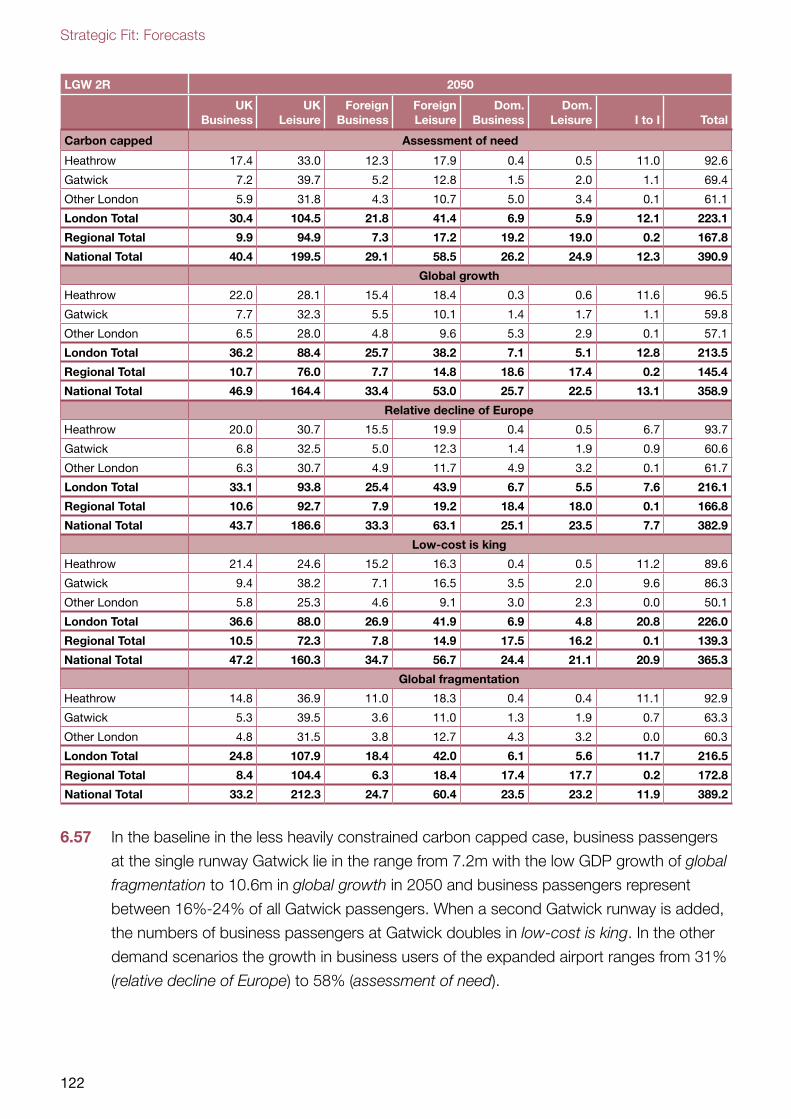
Strategic Fit: Forecasts
122
LGW 2R 2050
UK Business
UK Leisure
Foreign Business
Foreign Leisure
Dom. Business
Dom. Leisure I to I Total
Carbon capped Assessment of need
Heathrow 17.4 33.0 12.3 17.9 0.4 0.5 11.0 92.6
Gatwick 7.2 39.7 5.2 12.8 1.5 2.0 1.1 69.4
Other London 5.9 31.8 4.3 10.7 5.0 3.4 0.1 61.1
London Total 30.4 104.5 21.8 41.4 6.9 5.9 12.1 223.1
Regional Total 9.9 94.9 7.3 17.2 19.2 19.0 0.2 167.8
National Total 40.4 199.5 29.1 58.5 26.2 24.9 12.3 390.9
Global growth
Heathrow 22.0 28.1 15.4 18.4 0.3 0.6 11.6 96.5
Gatwick 7.7 32.3 5.5 10.1 1.4 1.7 1.1 59.8
Other London 6.5 28.0 4.8 9.6 5.3 2.9 0.1 57.1
London Total 36.2 88.4 25.7 38.2 7.1 5.1 12.8 213.5
Regional Total 10.7 76.0 7.7 14.8 18.6 17.4 0.2 145.4
National Total 46.9 164.4 33.4 53.0 25.7 22.5 13.1 358.9
Relative decline of Europe
Heathrow 20.0 30.7 15.5 19.9 0.4 0.5 6.7 93.7
Gatwick 6.8 32.5 5.0 12.3 1.4 1.9 0.9 60.6
Other London 6.3 30.7 4.9 11.7 4.9 3.2 0.1 61.7
London Total 33.1 93.8 25.4 43.9 6.7 5.5 7.6 216.1
Regional Total 10.6 92.7 7.9 19.2 18.4 18.0 0.1 166.8
National Total 43.7 186.6 33.3 63.1 25.1 23.5 7.7 382.9
Low-cost is king
Heathrow 21.4 24.6 15.2 16.3 0.4 0.5 11.2 89.6
Gatwick 9.4 38.2 7.1 16.5 3.5 2.0 9.6 86.3
Other London 5.8 25.3 4.6 9.1 3.0 2.3 0.0 50.1
London Total 36.6 88.0 26.9 41.9 6.9 4.8 20.8 226.0
Regional Total 10.5 72.3 7.8 14.9 17.5 16.2 0.1 139.3
National Total 47.2 160.3 34.7 56.7 24.4 21.1 20.9 365.3
Global fragmentation
Heathrow 14.8 36.9 11.0 18.3 0.4 0.4 11.1 92.9
Gatwick 5.3 39.5 3.6 11.0 1.3 1.9 0.7 63.3
Other London 4.8 31.5 3.8 12.7 4.3 3.2 0.0 60.3
London Total 24.8 107.9 18.4 42.0 6.1 5.6 11.7 216.5
Regional Total 8.4 104.4 6.3 18.4 17.4 17.7 0.2 172.8
National Total 33.2 212.3 24.7 60.4 23.5 23.2 11.9 389.2
6.57 In the baseline in the less heavily constrained carbon capped case, business passengers
at the single runway Gatwick lie in the range from 7.2m with the low GDP growth of global
fragmentation to 10.6m in global growth in 2050 and business passengers represent
between 16%-24% of all Gatwick passengers. When a second Gatwick runway is added,
the numbers of business passengers at Gatwick doubles in low-cost is king. In the other
demand scenarios the growth in business users of the expanded airport ranges from 31%
(relative decline of Europe) to 58% (assessment of need).
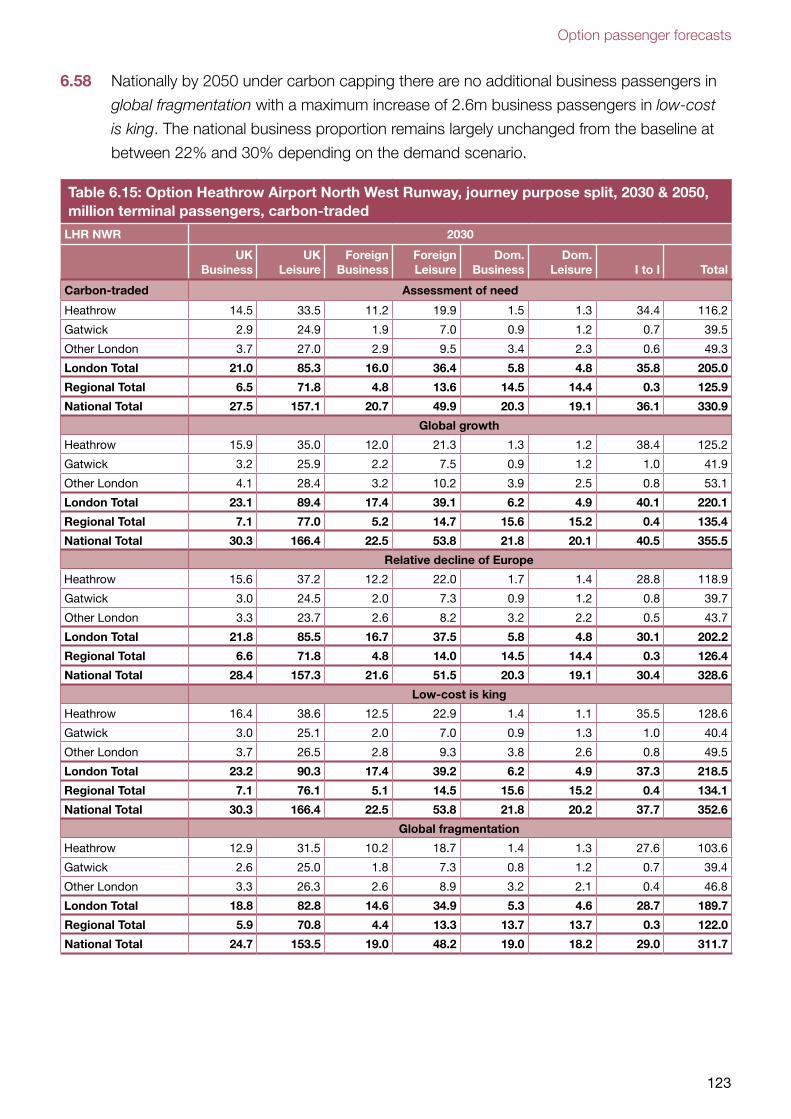
Option passenger forecasts
123
6.58 Nationally by 2050 under carbon capping there are no additional business passengers in
global fragmentation with a maximum increase of 2.6m business passengers in low-cost
is king. The national business proportion remains largely unchanged from the baseline at
between 22% and 30% depending on the demand scenario.
Table 6.15: Option Heathrow Airport North West Runway, journey purpose split, 2030 & 2050, million terminal passengers, carbon-traded
LHR NWR 2030
UK Business
UK Leisure
Foreign Business
Foreign Leisure
Dom. Business
Dom. Leisure I to I Total
Carbon-traded Assessment of need
Heathrow 14.5 33.5 11.2 19.9 1.5 1.3 34.4 116.2
Gatwick 2.9 24.9 1.9 7.0 0.9 1.2 0.7 39.5
Other London 3.7 27.0 2.9 9.5 3.4 2.3 0.6 49.3
London Total 21.0 85.3 16.0 36.4 5.8 4.8 35.8 205.0
Regional Total 6.5 71.8 4.8 13.6 14.5 14.4 0.3 125.9
National Total 27.5 157.1 20.7 49.9 20.3 19.1 36.1 330.9
Global growth
Heathrow 15.9 35.0 12.0 21.3 1.3 1.2 38.4 125.2
Gatwick 3.2 25.9 2.2 7.5 0.9 1.2 1.0 41.9
Other London 4.1 28.4 3.2 10.2 3.9 2.5 0.8 53.1
London Total 23.1 89.4 17.4 39.1 6.2 4.9 40.1 220.1
Regional Total 7.1 77.0 5.2 14.7 15.6 15.2 0.4 135.4
National Total 30.3 166.4 22.5 53.8 21.8 20.1 40.5 355.5
Relative decline of Europe
Heathrow 15.6 37.2 12.2 22.0 1.7 1.4 28.8 118.9
Gatwick 3.0 24.5 2.0 7.3 0.9 1.2 0.8 39.7
Other London 3.3 23.7 2.6 8.2 3.2 2.2 0.5 43.7
London Total 21.8 85.5 16.7 37.5 5.8 4.8 30.1 202.2
Regional Total 6.6 71.8 4.8 14.0 14.5 14.4 0.3 126.4
National Total 28.4 157.3 21.6 51.5 20.3 19.1 30.4 328.6
Low-cost is king
Heathrow 16.4 38.6 12.5 22.9 1.4 1.1 35.5 128.6
Gatwick 3.0 25.1 2.0 7.0 0.9 1.3 1.0 40.4
Other London 3.7 26.5 2.8 9.3 3.8 2.6 0.8 49.5
London Total 23.2 90.3 17.4 39.2 6.2 4.9 37.3 218.5
Regional Total 7.1 76.1 5.1 14.5 15.6 15.2 0.4 134.1
National Total 30.3 166.4 22.5 53.8 21.8 20.2 37.7 352.6
Global fragmentation
Heathrow 12.9 31.5 10.2 18.7 1.4 1.3 27.6 103.6
Gatwick 2.6 25.0 1.8 7.3 0.8 1.2 0.7 39.4
Other London 3.3 26.3 2.6 8.9 3.2 2.1 0.4 46.8
London Total 18.8 82.8 14.6 34.9 5.3 4.6 28.7 189.7
Regional Total 5.9 70.8 4.4 13.3 13.7 13.7 0.3 122.0
National Total 24.7 153.5 19.0 48.2 19.0 18.2 29.0 311.7
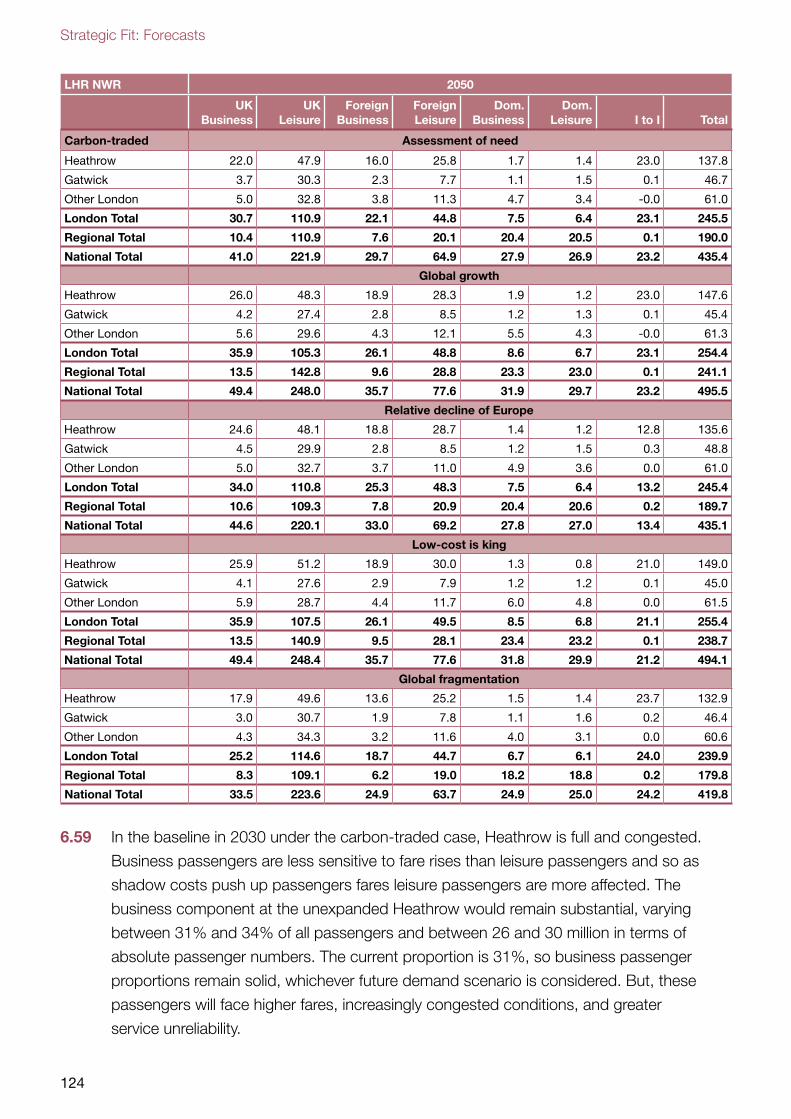
Strategic Fit: Forecasts
124
LHR NWR 2050
UK Business
UK Leisure
Foreign Business
Foreign Leisure
Dom. Business
Dom. Leisure I to I Total
Carbon-traded Assessment of need
Heathrow 22.0 47.9 16.0 25.8 1.7 1.4 23.0 137.8
Gatwick 3.7 30.3 2.3 7.7 1.1 1.5 0.1 46.7
Other London 5.0 32.8 3.8 11.3 4.7 3.4 -0.0 61.0
London Total 30.7 110.9 22.1 44.8 7.5 6.4 23.1 245.5
Regional Total 10.4 110.9 7.6 20.1 20.4 20.5 0.1 190.0
National Total 41.0 221.9 29.7 64.9 27.9 26.9 23.2 435.4
Global growth
Heathrow 26.0 48.3 18.9 28.3 1.9 1.2 23.0 147.6
Gatwick 4.2 27.4 2.8 8.5 1.2 1.3 0.1 45.4
Other London 5.6 29.6 4.3 12.1 5.5 4.3 -0.0 61.3
London Total 35.9 105.3 26.1 48.8 8.6 6.7 23.1 254.4
Regional Total 13.5 142.8 9.6 28.8 23.3 23.0 0.1 241.1
National Total 49.4 248.0 35.7 77.6 31.9 29.7 23.2 495.5
Relative decline of Europe
Heathrow 24.6 48.1 18.8 28.7 1.4 1.2 12.8 135.6
Gatwick 4.5 29.9 2.8 8.5 1.2 1.5 0.3 48.8
Other London 5.0 32.7 3.7 11.0 4.9 3.6 0.0 61.0
London Total 34.0 110.8 25.3 48.3 7.5 6.4 13.2 245.4
Regional Total 10.6 109.3 7.8 20.9 20.4 20.6 0.2 189.7
National Total 44.6 220.1 33.0 69.2 27.8 27.0 13.4 435.1
Low-cost is king
Heathrow 25.9 51.2 18.9 30.0 1.3 0.8 21.0 149.0
Gatwick 4.1 27.6 2.9 7.9 1.2 1.2 0.1 45.0
Other London 5.9 28.7 4.4 11.7 6.0 4.8 0.0 61.5
London Total 35.9 107.5 26.1 49.5 8.5 6.8 21.1 255.4
Regional Total 13.5 140.9 9.5 28.1 23.4 23.2 0.1 238.7
National Total 49.4 248.4 35.7 77.6 31.8 29.9 21.2 494.1
Global fragmentation
Heathrow 17.9 49.6 13.6 25.2 1.5 1.4 23.7 132.9
Gatwick 3.0 30.7 1.9 7.8 1.1 1.6 0.2 46.4
Other London 4.3 34.3 3.2 11.6 4.0 3.1 0.0 60.6
London Total 25.2 114.6 18.7 44.7 6.7 6.1 24.0 239.9
Regional Total 8.3 109.1 6.2 19.0 18.2 18.8 0.2 179.8
National Total 33.5 223.6 24.9 63.7 24.9 25.0 24.2 419.8
6.59 In the baseline in 2030 under the carbon-traded case, Heathrow is full and congested.
Business passengers are less sensitive to fare rises than leisure passengers and so as
shadow costs push up passengers fares leisure passengers are more affected. The
business component at the unexpanded Heathrow would remain substantial, varying
between 31% and 34% of all passengers and between 26 and 30 million in terms of
absolute passenger numbers. The current proportion is 31%, so business passenger
proportions remain solid, whichever future demand scenario is considered. But, these
passengers will face higher fares, increasingly congested conditions, and greater
service unreliability.
Option passenger forecasts
125
6.60 Providing a new North West runway at Heathrow sees around a 30% share of business
passengers in all the different passenger scenarios, although the actual number of
passengers travelling ranges between 31 million in global fragmentation and 39 million
in low-cost is king. This is between 5 and 9 million more business passengers per year
compared to the baseline.
6.61 Nationally in 2030, the share of business passengers at all airports is the same as without
expansion, ranging between 22% and 24% of total UK passengers. But between 2 million
(global fragmentation) and 5 million (global growth) more business passengers pass
through UK airports.
6.62 In 2050 the level of congestion has risen substantially in the baseline and the business
proportion of passengers (less sensitive to the potential fare rises) has risen to 31%-42%
as increasing numbers of more marginal leisure passengers are driven out to less
convenient airports. Shortage of runway slots disproportionately affects transfer
passengers who effectively require double use of the scarce runway capacity and as
leisure passengers are more price sensitive, this also drives up the business share under
congested conditions. By 2050 the additional 260,000 ATM slots from the new Heathrow
capacity has been fully utilised for many years in all the demand scenarios.61 The pressure
on runway resources varies considerably between the demand scenarios. The excess of
demand is lowest under global fragmentation where the business share is 29%. The
excess of demand is highest in global growth where the business share has risen to 35%.
Overall Heathrow serves between 10 and 14 million more business passengers with the
new runway in place.
6.63 Nationally by 2050 without airport expansion the business proportion varies between
21% in global fragmentation and 25% with the higher levels of economic growth and
world trade in the global growth and low-cost is king scenarios. With the extra capacity
provided by the Heathrow North West Runway, the business share continues to range
between 21%-25%, but there are between 5 and 7 million more business passengers at
all UK airports.
61 Ranging from 2032 in global growth to 2042 in global fragmentation.
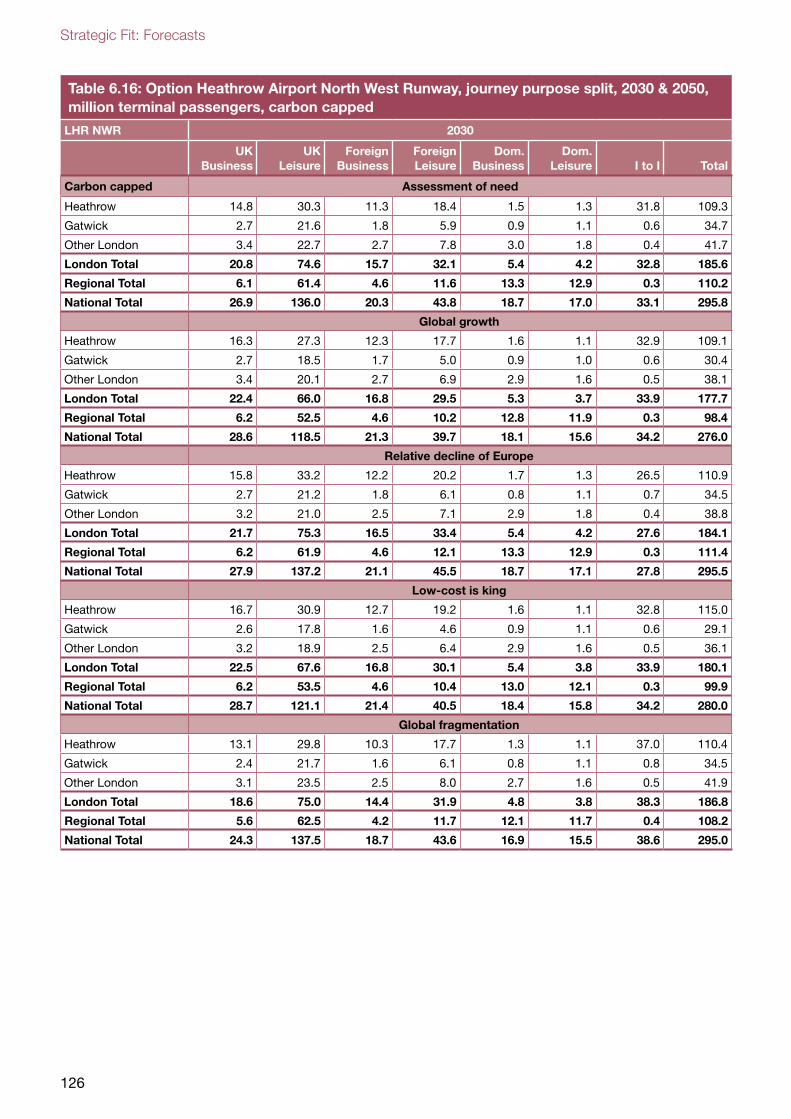
Strategic Fit: Forecasts
126
Table 6.16: Option Heathrow Airport North West Runway, journey purpose split, 2030 & 2050, million terminal passengers, carbon capped
LHR NWR 2030
UK Business
UK Leisure
Foreign Business
Foreign Leisure
Dom. Business
Dom. Leisure I to I Total
Carbon capped Assessment of need
Heathrow 14.8 30.3 11.3 18.4 1.5 1.3 31.8 109.3
Gatwick 2.7 21.6 1.8 5.9 0.9 1.1 0.6 34.7
Other London 3.4 22.7 2.7 7.8 3.0 1.8 0.4 41.7
London Total 20.8 74.6 15.7 32.1 5.4 4.2 32.8 185.6
Regional Total 6.1 61.4 4.6 11.6 13.3 12.9 0.3 110.2
National Total 26.9 136.0 20.3 43.8 18.7 17.0 33.1 295.8
Global growth
Heathrow 16.3 27.3 12.3 17.7 1.6 1.1 32.9 109.1
Gatwick 2.7 18.5 1.7 5.0 0.9 1.0 0.6 30.4
Other London 3.4 20.1 2.7 6.9 2.9 1.6 0.5 38.1
London Total 22.4 66.0 16.8 29.5 5.3 3.7 33.9 177.7
Regional Total 6.2 52.5 4.6 10.2 12.8 11.9 0.3 98.4
National Total 28.6 118.5 21.3 39.7 18.1 15.6 34.2 276.0
Relative decline of Europe
Heathrow 15.8 33.2 12.2 20.2 1.7 1.3 26.5 110.9
Gatwick 2.7 21.2 1.8 6.1 0.8 1.1 0.7 34.5
Other London 3.2 21.0 2.5 7.1 2.9 1.8 0.4 38.8
London Total 21.7 75.3 16.5 33.4 5.4 4.2 27.6 184.1
Regional Total 6.2 61.9 4.6 12.1 13.3 12.9 0.3 111.4
National Total 27.9 137.2 21.1 45.5 18.7 17.1 27.8 295.5
Low-cost is king
Heathrow 16.7 30.9 12.7 19.2 1.6 1.1 32.8 115.0
Gatwick 2.6 17.8 1.6 4.6 0.9 1.1 0.6 29.1
Other London 3.2 18.9 2.5 6.4 2.9 1.6 0.5 36.1
London Total 22.5 67.6 16.8 30.1 5.4 3.8 33.9 180.1
Regional Total 6.2 53.5 4.6 10.4 13.0 12.1 0.3 99.9
National Total 28.7 121.1 21.4 40.5 18.4 15.8 34.2 280.0
Global fragmentation
Heathrow 13.1 29.8 10.3 17.7 1.3 1.1 37.0 110.4
Gatwick 2.4 21.7 1.6 6.1 0.8 1.1 0.8 34.5
Other London 3.1 23.5 2.5 8.0 2.7 1.6 0.5 41.9
London Total 18.6 75.0 14.4 31.9 4.8 3.8 38.3 186.8
Regional Total 5.6 62.5 4.2 11.7 12.1 11.7 0.4 108.2
National Total 24.3 137.5 18.7 43.6 16.9 15.5 38.6 295.0
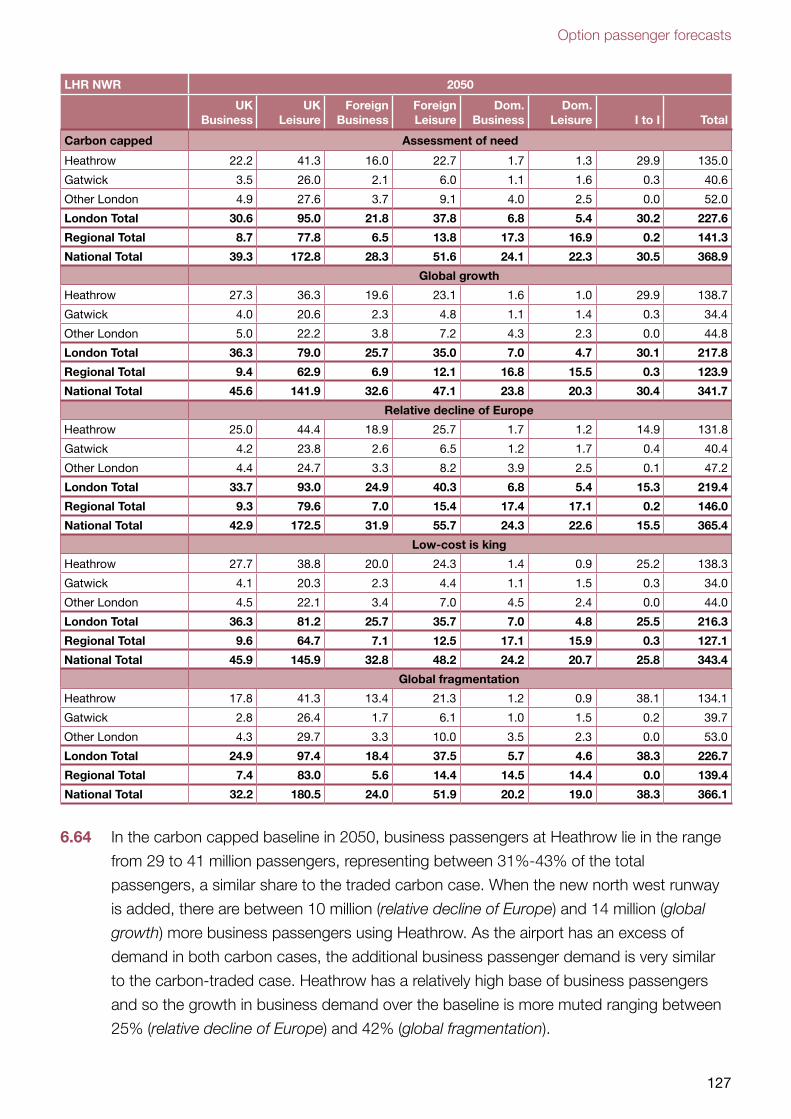
Option passenger forecasts
127
LHR NWR 2050
UK Business
UK Leisure
Foreign Business
Foreign Leisure
Dom. Business
Dom. Leisure I to I Total
Carbon capped Assessment of need
Heathrow 22.2 41.3 16.0 22.7 1.7 1.3 29.9 135.0
Gatwick 3.5 26.0 2.1 6.0 1.1 1.6 0.3 40.6
Other London 4.9 27.6 3.7 9.1 4.0 2.5 0.0 52.0
London Total 30.6 95.0 21.8 37.8 6.8 5.4 30.2 227.6
Regional Total 8.7 77.8 6.5 13.8 17.3 16.9 0.2 141.3
National Total 39.3 172.8 28.3 51.6 24.1 22.3 30.5 368.9
Global growth
Heathrow 27.3 36.3 19.6 23.1 1.6 1.0 29.9 138.7
Gatwick 4.0 20.6 2.3 4.8 1.1 1.4 0.3 34.4
Other London 5.0 22.2 3.8 7.2 4.3 2.3 0.0 44.8
London Total 36.3 79.0 25.7 35.0 7.0 4.7 30.1 217.8
Regional Total 9.4 62.9 6.9 12.1 16.8 15.5 0.3 123.9
National Total 45.6 141.9 32.6 47.1 23.8 20.3 30.4 341.7
Relative decline of Europe
Heathrow 25.0 44.4 18.9 25.7 1.7 1.2 14.9 131.8
Gatwick 4.2 23.8 2.6 6.5 1.2 1.7 0.4 40.4
Other London 4.4 24.7 3.3 8.2 3.9 2.5 0.1 47.2
London Total 33.7 93.0 24.9 40.3 6.8 5.4 15.3 219.4
Regional Total 9.3 79.6 7.0 15.4 17.4 17.1 0.2 146.0
National Total 42.9 172.5 31.9 55.7 24.3 22.6 15.5 365.4
Low-cost is king
Heathrow 27.7 38.8 20.0 24.3 1.4 0.9 25.2 138.3
Gatwick 4.1 20.3 2.3 4.4 1.1 1.5 0.3 34.0
Other London 4.5 22.1 3.4 7.0 4.5 2.4 0.0 44.0
London Total 36.3 81.2 25.7 35.7 7.0 4.8 25.5 216.3
Regional Total 9.6 64.7 7.1 12.5 17.1 15.9 0.3 127.1
National Total 45.9 145.9 32.8 48.2 24.2 20.7 25.8 343.4
Global fragmentation
Heathrow 17.8 41.3 13.4 21.3 1.2 0.9 38.1 134.1
Gatwick 2.8 26.4 1.7 6.1 1.0 1.5 0.2 39.7
Other London 4.3 29.7 3.3 10.0 3.5 2.3 0.0 53.0
London Total 24.9 97.4 18.4 37.5 5.7 4.6 38.3 226.7
Regional Total 7.4 83.0 5.6 14.4 14.5 14.4 0.0 139.4
National Total 32.2 180.5 24.0 51.9 20.2 19.0 38.3 366.1
6.64 In the carbon capped baseline in 2050, business passengers at Heathrow lie in the range
from 29 to 41 million passengers, representing between 31%-43% of the total
passengers, a similar share to the traded carbon case. When the new north west runway
is added, there are between 10 million (relative decline of Europe) and 14 million (global
growth) more business passengers using Heathrow. As the airport has an excess of
demand in both carbon cases, the additional business passenger demand is very similar
to the carbon-traded case. Heathrow has a relatively high base of business passengers
and so the growth in business demand over the baseline is more muted ranging between
25% (relative decline of Europe) and 42% (global fragmentation).
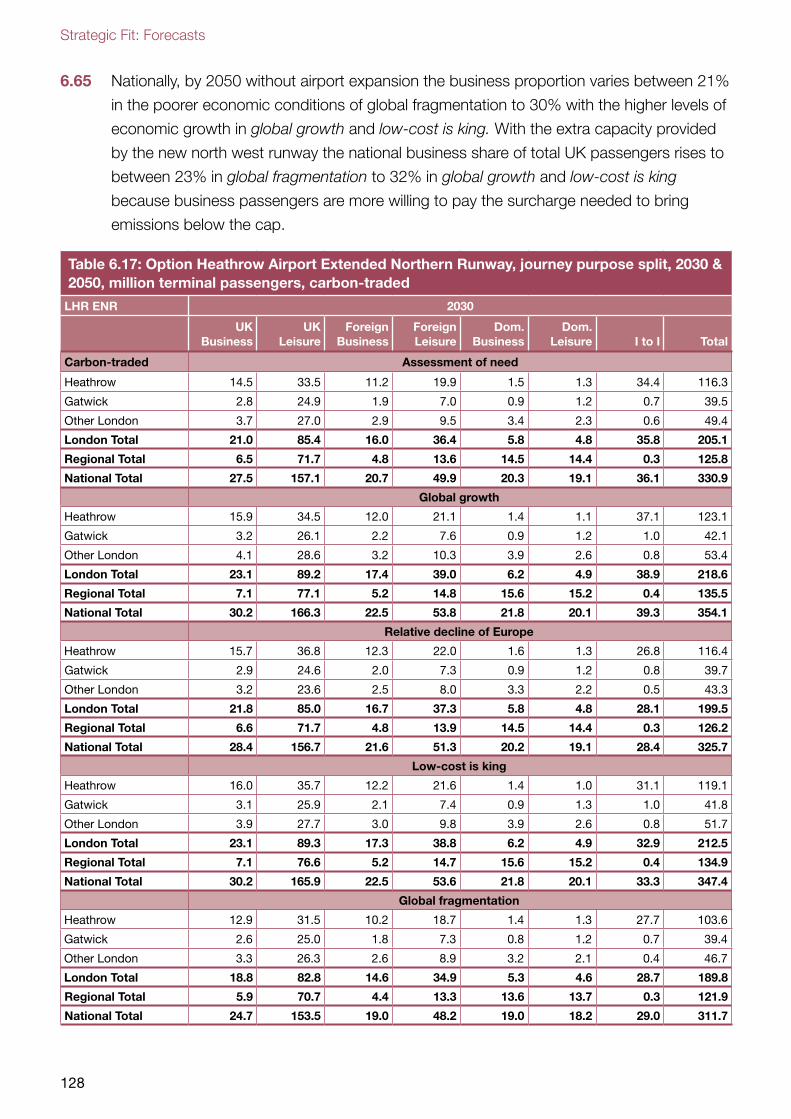
Strategic Fit: Forecasts
128
6.65 Nationally, by 2050 without airport expansion the business proportion varies between 21%
in the poorer economic conditions of global fragmentation to 30% with the higher levels of
economic growth in global growth and low-cost is king. With the extra capacity provided
by the new north west runway the national business share of total UK passengers rises to
between 23% in global fragmentation to 32% in global growth and low-cost is king
because business passengers are more willing to pay the surcharge needed to bring
emissions below the cap.
Table 6.17: Option Heathrow Airport Extended Northern Runway, journey purpose split, 2030 & 2050, million terminal passengers, carbon-traded
LHR ENR 2030
UK Business
UK Leisure
Foreign Business
Foreign Leisure
Dom. Business
Dom. Leisure I to I Total
Carbon-traded Assessment of need
Heathrow 14.5 33.5 11.2 19.9 1.5 1.3 34.4 116.3
Gatwick 2.8 24.9 1.9 7.0 0.9 1.2 0.7 39.5
Other London 3.7 27.0 2.9 9.5 3.4 2.3 0.6 49.4
London Total 21.0 85.4 16.0 36.4 5.8 4.8 35.8 205.1
Regional Total 6.5 71.7 4.8 13.6 14.5 14.4 0.3 125.8
National Total 27.5 157.1 20.7 49.9 20.3 19.1 36.1 330.9
Global growth
Heathrow 15.9 34.5 12.0 21.1 1.4 1.1 37.1 123.1
Gatwick 3.2 26.1 2.2 7.6 0.9 1.2 1.0 42.1
Other London 4.1 28.6 3.2 10.3 3.9 2.6 0.8 53.4
London Total 23.1 89.2 17.4 39.0 6.2 4.9 38.9 218.6
Regional Total 7.1 77.1 5.2 14.8 15.6 15.2 0.4 135.5
National Total 30.2 166.3 22.5 53.8 21.8 20.1 39.3 354.1
Relative decline of Europe
Heathrow 15.7 36.8 12.3 22.0 1.6 1.3 26.8 116.4
Gatwick 2.9 24.6 2.0 7.3 0.9 1.2 0.8 39.7
Other London 3.2 23.6 2.5 8.0 3.3 2.2 0.5 43.3
London Total 21.8 85.0 16.7 37.3 5.8 4.8 28.1 199.5
Regional Total 6.6 71.7 4.8 13.9 14.5 14.4 0.3 126.2
National Total 28.4 156.7 21.6 51.3 20.2 19.1 28.4 325.7
Low-cost is king
Heathrow 16.0 35.7 12.2 21.6 1.4 1.0 31.1 119.1
Gatwick 3.1 25.9 2.1 7.4 0.9 1.3 1.0 41.8
Other London 3.9 27.7 3.0 9.8 3.9 2.6 0.8 51.7
London Total 23.1 89.3 17.3 38.8 6.2 4.9 32.9 212.5
Regional Total 7.1 76.6 5.2 14.7 15.6 15.2 0.4 134.9
National Total 30.2 165.9 22.5 53.6 21.8 20.1 33.3 347.4
Global fragmentation
Heathrow 12.9 31.5 10.2 18.7 1.4 1.3 27.7 103.6
Gatwick 2.6 25.0 1.8 7.3 0.8 1.2 0.7 39.4
Other London 3.3 26.3 2.6 8.9 3.2 2.1 0.4 46.7
London Total 18.8 82.8 14.6 34.9 5.3 4.6 28.7 189.8
Regional Total 5.9 70.7 4.4 13.3 13.6 13.7 0.3 121.9
National Total 24.7 153.5 19.0 48.2 19.0 18.2 29.0 311.7
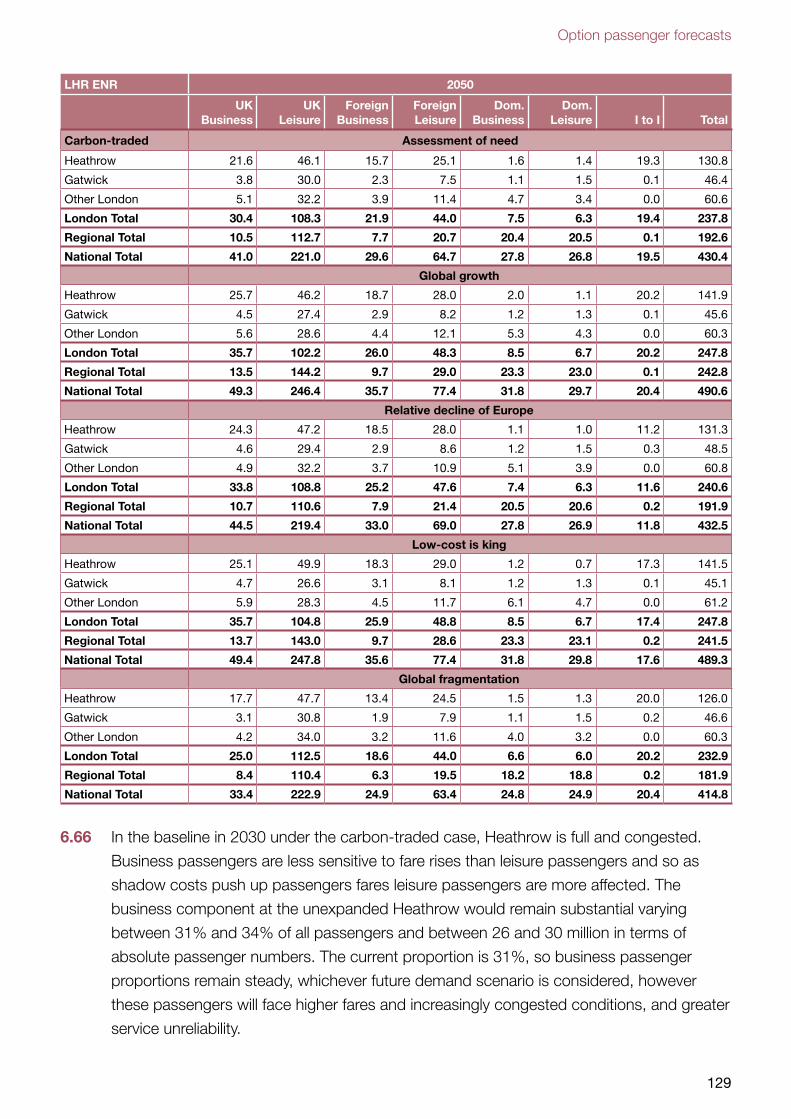
Option passenger forecasts
129
LHR ENR 2050
UK Business
UK Leisure
Foreign Business
Foreign Leisure
Dom. Business
Dom. Leisure I to I Total
Carbon-traded Assessment of need
Heathrow 21.6 46.1 15.7 25.1 1.6 1.4 19.3 130.8
Gatwick 3.8 30.0 2.3 7.5 1.1 1.5 0.1 46.4
Other London 5.1 32.2 3.9 11.4 4.7 3.4 0.0 60.6
London Total 30.4 108.3 21.9 44.0 7.5 6.3 19.4 237.8
Regional Total 10.5 112.7 7.7 20.7 20.4 20.5 0.1 192.6
National Total 41.0 221.0 29.6 64.7 27.8 26.8 19.5 430.4
Global growth
Heathrow 25.7 46.2 18.7 28.0 2.0 1.1 20.2 141.9
Gatwick 4.5 27.4 2.9 8.2 1.2 1.3 0.1 45.6
Other London 5.6 28.6 4.4 12.1 5.3 4.3 0.0 60.3
London Total 35.7 102.2 26.0 48.3 8.5 6.7 20.2 247.8
Regional Total 13.5 144.2 9.7 29.0 23.3 23.0 0.1 242.8
National Total 49.3 246.4 35.7 77.4 31.8 29.7 20.4 490.6
Relative decline of Europe
Heathrow 24.3 47.2 18.5 28.0 1.1 1.0 11.2 131.3
Gatwick 4.6 29.4 2.9 8.6 1.2 1.5 0.3 48.5
Other London 4.9 32.2 3.7 10.9 5.1 3.9 0.0 60.8
London Total 33.8 108.8 25.2 47.6 7.4 6.3 11.6 240.6
Regional Total 10.7 110.6 7.9 21.4 20.5 20.6 0.2 191.9
National Total 44.5 219.4 33.0 69.0 27.8 26.9 11.8 432.5
Low-cost is king
Heathrow 25.1 49.9 18.3 29.0 1.2 0.7 17.3 141.5
Gatwick 4.7 26.6 3.1 8.1 1.2 1.3 0.1 45.1
Other London 5.9 28.3 4.5 11.7 6.1 4.7 0.0 61.2
London Total 35.7 104.8 25.9 48.8 8.5 6.7 17.4 247.8
Regional Total 13.7 143.0 9.7 28.6 23.3 23.1 0.2 241.5
National Total 49.4 247.8 35.6 77.4 31.8 29.8 17.6 489.3
Global fragmentation
Heathrow 17.7 47.7 13.4 24.5 1.5 1.3 20.0 126.0
Gatwick 3.1 30.8 1.9 7.9 1.1 1.5 0.2 46.6
Other London 4.2 34.0 3.2 11.6 4.0 3.2 0.0 60.3
London Total 25.0 112.5 18.6 44.0 6.6 6.0 20.2 232.9
Regional Total 8.4 110.4 6.3 19.5 18.2 18.8 0.2 181.9
National Total 33.4 222.9 24.9 63.4 24.8 24.9 20.4 414.8
6.66 In the baseline in 2030 under the carbon-traded case, Heathrow is full and congested.
Business passengers are less sensitive to fare rises than leisure passengers and so as
shadow costs push up passengers fares leisure passengers are more affected. The
business component at the unexpanded Heathrow would remain substantial varying
between 31% and 34% of all passengers and between 26 and 30 million in terms of
absolute passenger numbers. The current proportion is 31%, so business passenger
proportions remain steady, whichever future demand scenario is considered, however
these passengers will face higher fares and increasingly congested conditions, and greater
service unreliability.
Strategic Fit: Forecasts
130
6.67 Extending the existing northern runway at Heathrow sees a 30%-31% share of business
passengers across the different passenger scenarios. The actual number of passengers
travelling ranges between 31 million in global fragmentation and 38 million in global
growth. This is between 5 and 8 million more business passengers per year compared to
the baseline.
6.68 Nationally in 2030, the share of business passengers at all airports is the same as without
expansion, ranging between 22% and 24% of total UK passengers. But between 2 million
(global fragmentation) and 5 million (global growth) more business passengers pass
through UK airports.
6.69 In 2050 the level of congestion has risen substantially in the baseline and the proportion of
business passengers (less sensitive to the potential fare rises) has risen to between 31%
to 42% as increasing numbers of more marginal leisure passengers are driven out to less
convenient airports. Shortage of runway slots disproportionately affects transfer
passengers who effectively require double use of the scarce runway capacity and as the
majority of passengers are leisure, this also drives up the business share under congested
conditions. By 2050 the additional 220,000 ATM slots from the extended runway capacity
has been fully utilised for many years in all the demand scenarios.62 The pressure on
runway resources now varies considerably between the demand scenarios. The excess
of demand is lowest under global fragmentation where the business share is 29%. The
excess of demand is highest in global growth where the business share has risen to 36%.
Overall Heathrow serves between 8 and 12 million more business passengers with the
extended runway in place.
6.70 Nationally by 2050 without airport expansion the business proportion varies between 21%
in the poorer economic conditions of global fragmentation and 25% with the higher levels
of economic growth and world trade in the global growth and low-cost is king scenarios.
With the extra capacity provided by the Heathrow Extended Northern runway, the
business share continues to range between 21%-25%, but there are between 3 and
6 million more business passengers at all UK airports.
62 Ranging from 2032 in global growth to 2042 in global fragmentation.
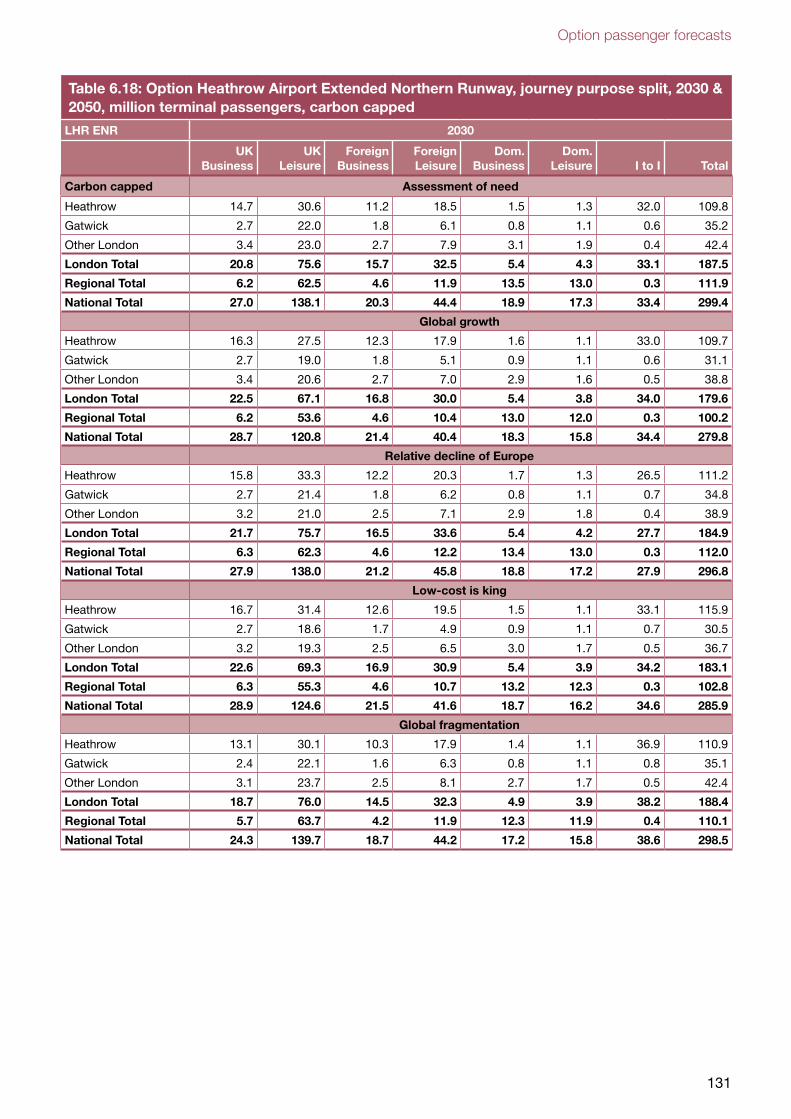
Option passenger forecasts
131
Table 6.18: Option Heathrow Airport Extended Northern Runway, journey purpose split, 2030 & 2050, million terminal passengers, carbon capped
LHR ENR 2030
UK Business
UK Leisure
Foreign Business
Foreign Leisure
Dom. Business
Dom. Leisure I to I Total
Carbon capped Assessment of need
Heathrow 14.7 30.6 11.2 18.5 1.5 1.3 32.0 109.8
Gatwick 2.7 22.0 1.8 6.1 0.8 1.1 0.6 35.2
Other London 3.4 23.0 2.7 7.9 3.1 1.9 0.4 42.4
London Total 20.8 75.6 15.7 32.5 5.4 4.3 33.1 187.5
Regional Total 6.2 62.5 4.6 11.9 13.5 13.0 0.3 111.9
National Total 27.0 138.1 20.3 44.4 18.9 17.3 33.4 299.4
Global growth
Heathrow 16.3 27.5 12.3 17.9 1.6 1.1 33.0 109.7
Gatwick 2.7 19.0 1.8 5.1 0.9 1.1 0.6 31.1
Other London 3.4 20.6 2.7 7.0 2.9 1.6 0.5 38.8
London Total 22.5 67.1 16.8 30.0 5.4 3.8 34.0 179.6
Regional Total 6.2 53.6 4.6 10.4 13.0 12.0 0.3 100.2
National Total 28.7 120.8 21.4 40.4 18.3 15.8 34.4 279.8
Relative decline of Europe
Heathrow 15.8 33.3 12.2 20.3 1.7 1.3 26.5 111.2
Gatwick 2.7 21.4 1.8 6.2 0.8 1.1 0.7 34.8
Other London 3.2 21.0 2.5 7.1 2.9 1.8 0.4 38.9
London Total 21.7 75.7 16.5 33.6 5.4 4.2 27.7 184.9
Regional Total 6.3 62.3 4.6 12.2 13.4 13.0 0.3 112.0
National Total 27.9 138.0 21.2 45.8 18.8 17.2 27.9 296.8
Low-cost is king
Heathrow 16.7 31.4 12.6 19.5 1.5 1.1 33.1 115.9
Gatwick 2.7 18.6 1.7 4.9 0.9 1.1 0.7 30.5
Other London 3.2 19.3 2.5 6.5 3.0 1.7 0.5 36.7
London Total 22.6 69.3 16.9 30.9 5.4 3.9 34.2 183.1
Regional Total 6.3 55.3 4.6 10.7 13.2 12.3 0.3 102.8
National Total 28.9 124.6 21.5 41.6 18.7 16.2 34.6 285.9
Global fragmentation
Heathrow 13.1 30.1 10.3 17.9 1.4 1.1 36.9 110.9
Gatwick 2.4 22.1 1.6 6.3 0.8 1.1 0.8 35.1
Other London 3.1 23.7 2.5 8.1 2.7 1.7 0.5 42.4
London Total 18.7 76.0 14.5 32.3 4.9 3.9 38.2 188.4
Regional Total 5.7 63.7 4.2 11.9 12.3 11.9 0.4 110.1
National Total 24.3 139.7 18.7 44.2 17.2 15.8 38.6 298.5
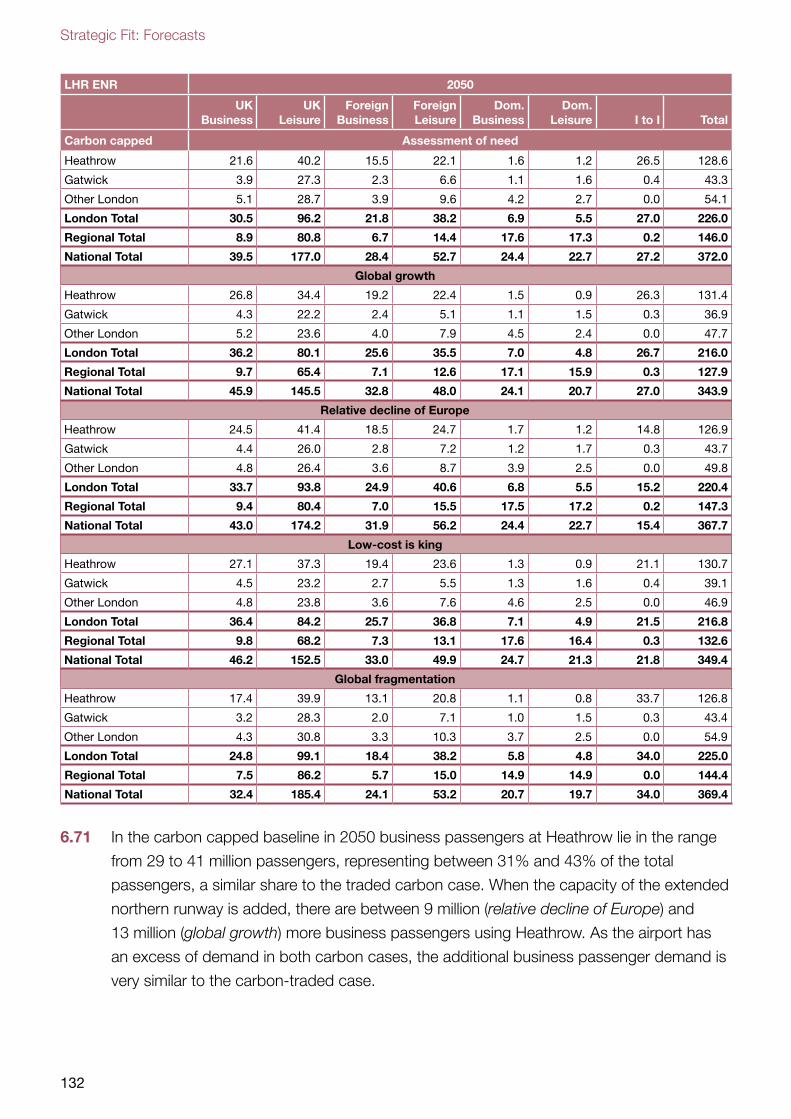
Strategic Fit: Forecasts
132
LHR ENR 2050
UK Business
UK Leisure
Foreign Business
Foreign Leisure
Dom. Business
Dom. Leisure I to I Total
Carbon capped Assessment of need
Heathrow 21.6 40.2 15.5 22.1 1.6 1.2 26.5 128.6
Gatwick 3.9 27.3 2.3 6.6 1.1 1.6 0.4 43.3
Other London 5.1 28.7 3.9 9.6 4.2 2.7 0.0 54.1
London Total 30.5 96.2 21.8 38.2 6.9 5.5 27.0 226.0
Regional Total 8.9 80.8 6.7 14.4 17.6 17.3 0.2 146.0
National Total 39.5 177.0 28.4 52.7 24.4 22.7 27.2 372.0
Global growth
Heathrow 26.8 34.4 19.2 22.4 1.5 0.9 26.3 131.4
Gatwick 4.3 22.2 2.4 5.1 1.1 1.5 0.3 36.9
Other London 5.2 23.6 4.0 7.9 4.5 2.4 0.0 47.7
London Total 36.2 80.1 25.6 35.5 7.0 4.8 26.7 216.0
Regional Total 9.7 65.4 7.1 12.6 17.1 15.9 0.3 127.9
National Total 45.9 145.5 32.8 48.0 24.1 20.7 27.0 343.9
Relative decline of Europe
Heathrow 24.5 41.4 18.5 24.7 1.7 1.2 14.8 126.9
Gatwick 4.4 26.0 2.8 7.2 1.2 1.7 0.3 43.7
Other London 4.8 26.4 3.6 8.7 3.9 2.5 0.0 49.8
London Total 33.7 93.8 24.9 40.6 6.8 5.5 15.2 220.4
Regional Total 9.4 80.4 7.0 15.5 17.5 17.2 0.2 147.3
National Total 43.0 174.2 31.9 56.2 24.4 22.7 15.4 367.7
Low-cost is king
Heathrow 27.1 37.3 19.4 23.6 1.3 0.9 21.1 130.7
Gatwick 4.5 23.2 2.7 5.5 1.3 1.6 0.4 39.1
Other London 4.8 23.8 3.6 7.6 4.6 2.5 0.0 46.9
London Total 36.4 84.2 25.7 36.8 7.1 4.9 21.5 216.8
Regional Total 9.8 68.2 7.3 13.1 17.6 16.4 0.3 132.6
National Total 46.2 152.5 33.0 49.9 24.7 21.3 21.8 349.4
Global fragmentation
Heathrow 17.4 39.9 13.1 20.8 1.1 0.8 33.7 126.8
Gatwick 3.2 28.3 2.0 7.1 1.0 1.5 0.3 43.4
Other London 4.3 30.8 3.3 10.3 3.7 2.5 0.0 54.9
London Total 24.8 99.1 18.4 38.2 5.8 4.8 34.0 225.0
Regional Total 7.5 86.2 5.7 15.0 14.9 14.9 0.0 144.4
National Total 32.4 185.4 24.1 53.2 20.7 19.7 34.0 369.4
6.71 In the carbon capped baseline in 2050 business passengers at Heathrow lie in the range
from 29 to 41 million passengers, representing between 31% and 43% of the total
passengers, a similar share to the traded carbon case. When the capacity of the extended
northern runway is added, there are between 9 million (relative decline of Europe) and
13 million (global growth) more business passengers using Heathrow. As the airport has
an excess of demand in both carbon cases, the additional business passenger demand is
very similar to the carbon-traded case.
Option passenger forecasts
133
6.72 Nationally, by 2050 without airport expansion the business proportion varies between 21%
in the poorer economic outlook of global fragmentation to 30% with the higher levels of
economic growth in global growth and low-cost is king. This is more than when carbon is
traded because the effect of the high carbon surcharge has been to increase the business
share by causing more price sensitive leisure passengers to cease travelling. With the
extra capacity provided by the northern runway extension the national business share of
total UK passengers rises to between 23% in global fragmentation to 32% in global
growth because business passengers are more willing to pay the surcharge needed to
bring emissions below the cap. But, the increase in actual passengers is very small,
amounting to less than 1.3 million in all the scenarios.
Transfers
6.73 As described in the previous chapter in paragraph 5.29, three types of transfer at hub
airports are reported in the tables below. This section of the previous chapter also
describes in more detail how such passengers are counted towards total passenger
numbers at an airport. In brief:
6.74 Three types of transfer at hub airports are reported in the tables below:
1. ‘International-to-international’: these passengers are passing through the country
of the hub airport and do not stay there more than 24 hours; at present at all the hubs
airports this is much the largest group of transfer passengers. These are shown in
Table 6.19, Table 6.21, and Table 6.23 for the three capacity expansion options.
2. ‘Domestic-interliners’: in the model these are only forecast at UK hub airports, they
are passengers bound for or originating in the UK (both UK and foreign residents) who
fly to or from Heathrow, Gatwick or another UK hub on a feeder service from another
UK airport. These are the UK hub totals reported in the top half of Table 6.20, Table
6.22 and Table 6.24 for each of the capacity options.
3. ‘International-interliners’: are similar to domestic interliners in that they are bound
for or originating in the UK but they are to or from one of the overseas hubs on a
feeder service from another UK airport i.e. they use Amsterdam Schiphol or Paris CDG
as an alternative hub to using Heathrow or Gatwick. ‘International interliners’ are the
overseas hub totals reported in the lower half of Table 6.20, Table 6.22 and Table
6.24 for each of the capacity options. Note these figures are not the total transfer
activity at the overseas hubs, but just the total arrivals and departures from connecting
passengers starting or ending their journeys in the UK.
6.75 Paragraph 5.30 in the previous chapter explains why transfer traffic is particularly sensitive
to shadow costs at congested airports and hence why it reduces at a faster rate than
most point-to-point traffic. The UK originating or destined domestic and international-
interliners reduce most rapidly of all.
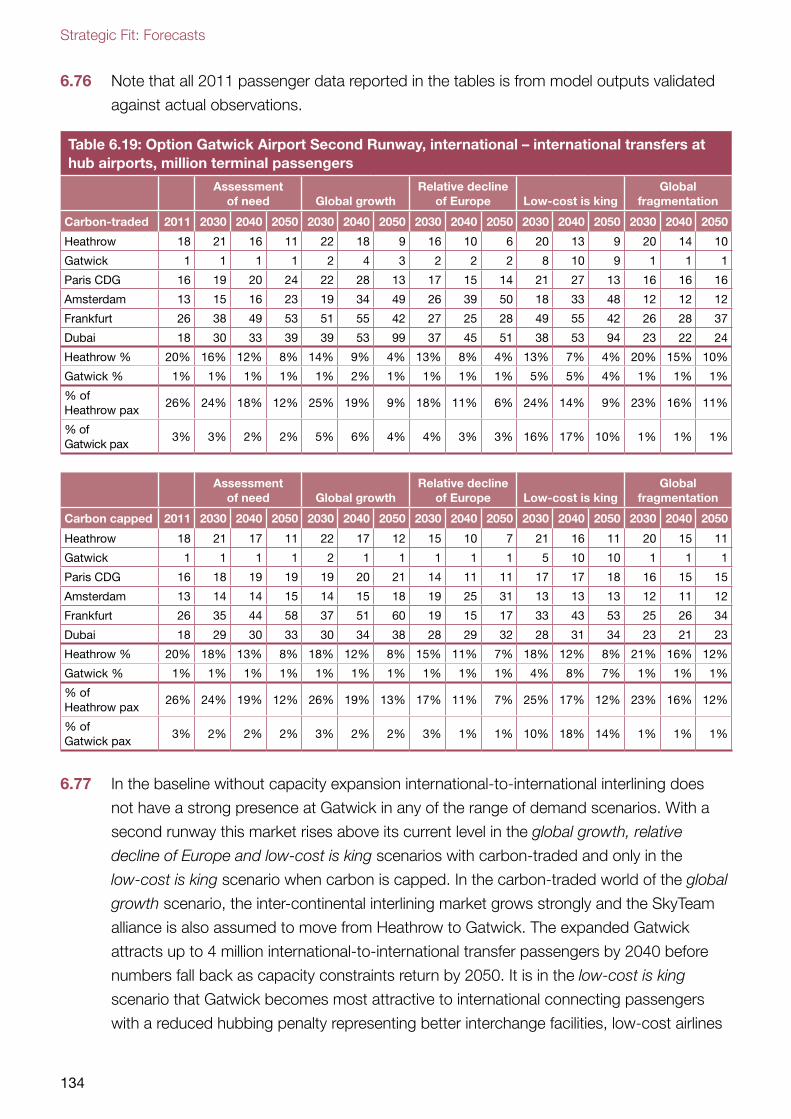
Strategic Fit: Forecasts
134
6.76 Note that all 2011 passenger data reported in the tables is from model outputs validated
against actual observations.
Table 6.19: Option Gatwick Airport Second Runway, international – international transfers at hub airports, million terminal passengers
Assessment of need Global growth
Relative decline of Europe Low-cost is king
Global fragmentation
Carbon-traded 2011 2030 2040 2050 2030 2040 2050 2030 2040 2050 2030 2040 2050 2030 2040 2050
Heathrow 18 21 16 11 22 18 9 16 10 6 20 13 9 20 14 10
Gatwick 1 1 1 1 2 4 3 2 2 2 8 10 9 1 1 1
Paris CDG 16 19 20 24 22 28 13 17 15 14 21 27 13 16 16 16
Amsterdam 13 15 16 23 19 34 49 26 39 50 18 33 48 12 12 12
Frankfurt 26 38 49 53 51 55 42 27 25 28 49 55 42 26 28 37
Dubai 18 30 33 39 39 53 99 37 45 51 38 53 94 23 22 24
Heathrow % 20% 16% 12% 8% 14% 9% 4% 13% 8% 4% 13% 7% 4% 20% 15% 10%
Gatwick % 1% 1% 1% 1% 1% 2% 1% 1% 1% 1% 5% 5% 4% 1% 1% 1%
% of Heathrow pax
26% 24% 18% 12% 25% 19% 9% 18% 11% 6% 24% 14% 9% 23% 16% 11%
% of Gatwick pax
3% 3% 2% 2% 5% 6% 4% 4% 3% 3% 16% 17% 10% 1% 1% 1%
Assessment of need Global growth
Relative decline of Europe Low-cost is king
Global fragmentation
Carbon capped 2011 2030 2040 2050 2030 2040 2050 2030 2040 2050 2030 2040 2050 2030 2040 2050
Heathrow 18 21 17 11 22 17 12 15 10 7 21 16 11 20 15 11
Gatwick 1 1 1 1 2 1 1 1 1 1 5 10 10 1 1 1
Paris CDG 16 18 19 19 19 20 21 14 11 11 17 17 18 16 15 15
Amsterdam 13 14 14 15 14 15 18 19 25 31 13 13 13 12 11 12
Frankfurt 26 35 44 58 37 51 60 19 15 17 33 43 53 25 26 34
Dubai 18 29 30 33 30 34 38 28 29 32 28 31 34 23 21 23
Heathrow % 20% 18% 13% 8% 18% 12% 8% 15% 11% 7% 18% 12% 8% 21% 16% 12%
Gatwick % 1% 1% 1% 1% 1% 1% 1% 1% 1% 1% 4% 8% 7% 1% 1% 1%
% of Heathrow pax
26% 24% 19% 12% 26% 19% 13% 17% 11% 7% 25% 17% 12% 23% 16% 12%
% of Gatwick pax
3% 2% 2% 2% 3% 2% 2% 3% 1% 1% 10% 18% 14% 1% 1% 1%
6.77 In the baseline without capacity expansion international-to-international interlining does
not have a strong presence at Gatwick in any of the range of demand scenarios. With a
second runway this market rises above its current level in the global growth, relative
decline of Europe and low-cost is king scenarios with carbon-traded and only in the
low-cost is king scenario when carbon is capped. In the carbon-traded world of the global
growth scenario, the inter-continental interlining market grows strongly and the SkyTeam
alliance is also assumed to move from Heathrow to Gatwick. The expanded Gatwick
attracts up to 4 million international-to-international transfer passengers by 2040 before
numbers fall back as capacity constraints return by 2050. It is in the low-cost is king
scenario that Gatwick becomes most attractive to international connecting passengers
with a reduced hubbing penalty representing better interchange facilities, low-cost airlines
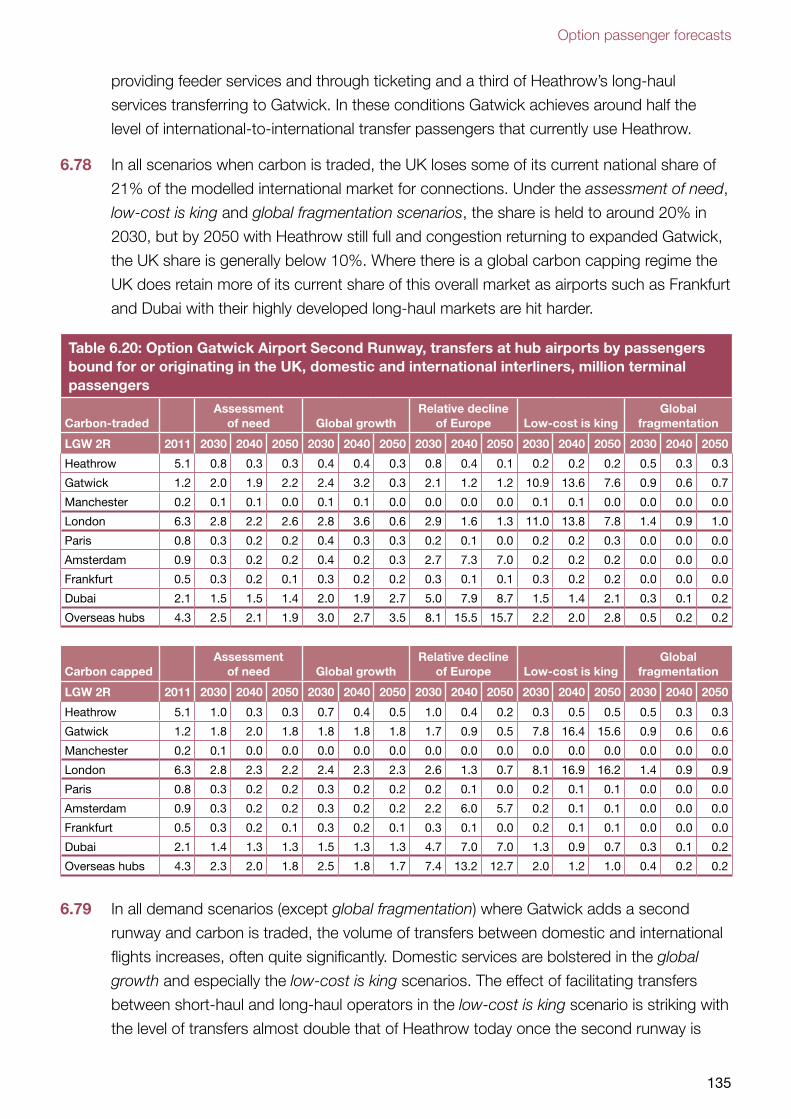
Option passenger forecasts
135
providing feeder services and through ticketing and a third of Heathrow’s long-haul
services transferring to Gatwick. In these conditions Gatwick achieves around half the
level of international-to-international transfer passengers that currently use Heathrow.
6.78 In all scenarios when carbon is traded, the UK loses some of its current national share of
21% of the modelled international market for connections. Under the assessment of need,
low-cost is king and global fragmentation scenarios, the share is held to around 20% in
2030, but by 2050 with Heathrow still full and congestion returning to expanded Gatwick,
the UK share is generally below 10%. Where there is a global carbon capping regime the
UK does retain more of its current share of this overall market as airports such as Frankfurt
and Dubai with their highly developed long-haul markets are hit harder.
Table 6.20: Option Gatwick Airport Second Runway, transfers at hub airports by passengers bound for or originating in the UK, domestic and international interliners, million terminal passengers
Carbon-tradedAssessment
of need Global growthRelative decline
of Europe Low-cost is kingGlobal
fragmentation
LGW 2R 2011 2030 2040 2050 2030 2040 2050 2030 2040 2050 2030 2040 2050 2030 2040 2050
Heathrow 5.1 0.8 0.3 0.3 0.4 0.4 0.3 0.8 0.4 0.1 0.2 0.2 0.2 0.5 0.3 0.3
Gatwick 1.2 2.0 1.9 2.2 2.4 3.2 0.3 2.1 1.2 1.2 10.9 13.6 7.6 0.9 0.6 0.7
Manchester 0.2 0.1 0.1 0.0 0.1 0.1 0.0 0.0 0.0 0.0 0.1 0.1 0.0 0.0 0.0 0.0
London 6.3 2.8 2.2 2.6 2.8 3.6 0.6 2.9 1.6 1.3 11.0 13.8 7.8 1.4 0.9 1.0
Paris 0.8 0.3 0.2 0.2 0.4 0.3 0.3 0.2 0.1 0.0 0.2 0.2 0.3 0.0 0.0 0.0
Amsterdam 0.9 0.3 0.2 0.2 0.4 0.2 0.3 2.7 7.3 7.0 0.2 0.2 0.2 0.0 0.0 0.0
Frankfurt 0.5 0.3 0.2 0.1 0.3 0.2 0.2 0.3 0.1 0.1 0.3 0.2 0.2 0.0 0.0 0.0
Dubai 2.1 1.5 1.5 1.4 2.0 1.9 2.7 5.0 7.9 8.7 1.5 1.4 2.1 0.3 0.1 0.2
Overseas hubs 4.3 2.5 2.1 1.9 3.0 2.7 3.5 8.1 15.5 15.7 2.2 2.0 2.8 0.5 0.2 0.2
Carbon cappedAssessment
of need Global growthRelative decline
of Europe Low-cost is kingGlobal
fragmentation
LGW 2R 2011 2030 2040 2050 2030 2040 2050 2030 2040 2050 2030 2040 2050 2030 2040 2050
Heathrow 5.1 1.0 0.3 0.3 0.7 0.4 0.5 1.0 0.4 0.2 0.3 0.5 0.5 0.5 0.3 0.3
Gatwick 1.2 1.8 2.0 1.8 1.8 1.8 1.8 1.7 0.9 0.5 7.8 16.4 15.6 0.9 0.6 0.6
Manchester 0.2 0.1 0.0 0.0 0.0 0.0 0.0 0.0 0.0 0.0 0.0 0.0 0.0 0.0 0.0 0.0
London 6.3 2.8 2.3 2.2 2.4 2.3 2.3 2.6 1.3 0.7 8.1 16.9 16.2 1.4 0.9 0.9
Paris 0.8 0.3 0.2 0.2 0.3 0.2 0.2 0.2 0.1 0.0 0.2 0.1 0.1 0.0 0.0 0.0
Amsterdam 0.9 0.3 0.2 0.2 0.3 0.2 0.2 2.2 6.0 5.7 0.2 0.1 0.1 0.0 0.0 0.0
Frankfurt 0.5 0.3 0.2 0.1 0.3 0.2 0.1 0.3 0.1 0.0 0.2 0.1 0.1 0.0 0.0 0.0
Dubai 2.1 1.4 1.3 1.3 1.5 1.3 1.3 4.7 7.0 7.0 1.3 0.9 0.7 0.3 0.1 0.2
Overseas hubs 4.3 2.3 2.0 1.8 2.5 1.8 1.7 7.4 13.2 12.7 2.0 1.2 1.0 0.4 0.2 0.2
6.79 In all demand scenarios (except global fragmentation) where Gatwick adds a second
runway and carbon is traded, the volume of transfers between domestic and international
flights increases, often quite significantly. Domestic services are bolstered in the global
growth and especially the low-cost is king scenarios. The effect of facilitating transfers
between short-haul and long-haul operators in the low-cost is king scenario is striking with
the level of transfers almost double that of Heathrow today once the second runway is
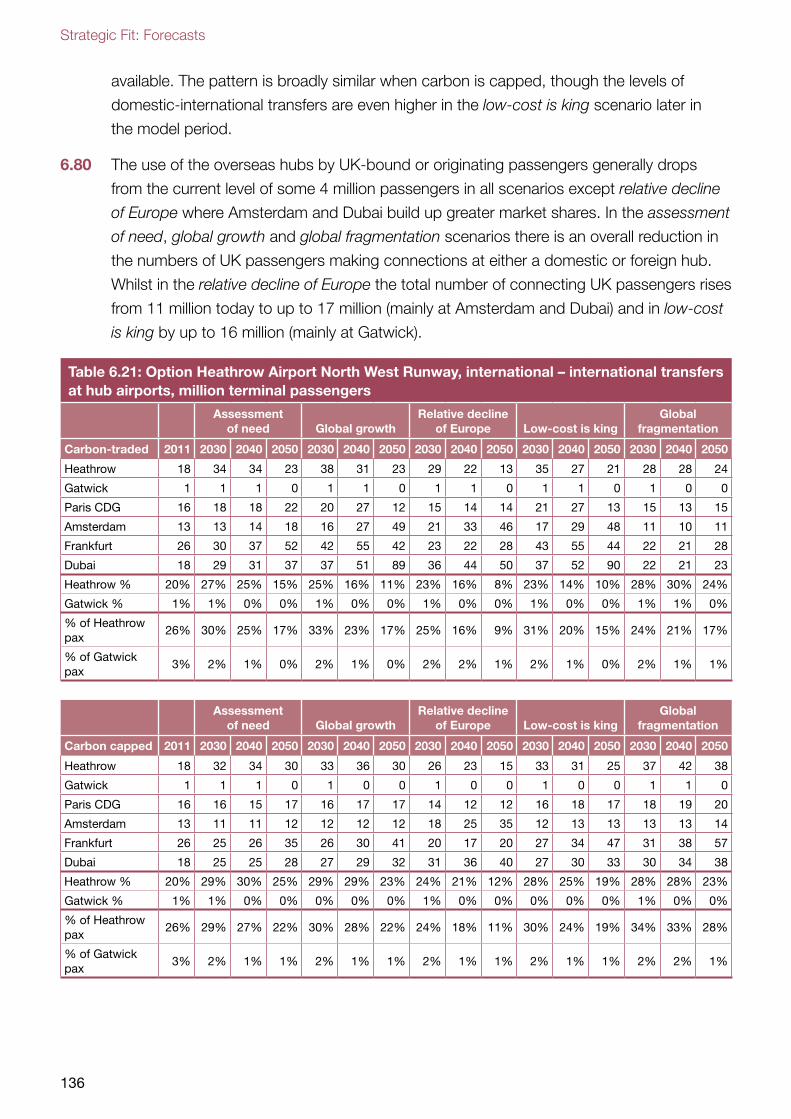
Strategic Fit: Forecasts
136
available. The pattern is broadly similar when carbon is capped, though the levels of
domestic-international transfers are even higher in the low-cost is king scenario later in
the model period.
6.80 The use of the overseas hubs by UK-bound or originating passengers generally drops
from the current level of some 4 million passengers in all scenarios except relative decline
of Europe where Amsterdam and Dubai build up greater market shares. In the assessment
of need, global growth and global fragmentation scenarios there is an overall reduction in
the numbers of UK passengers making connections at either a domestic or foreign hub.
Whilst in the relative decline of Europe the total number of connecting UK passengers rises
from 11 million today to up to 17 million (mainly at Amsterdam and Dubai) and in low-cost
is king by up to 16 million (mainly at Gatwick).
Table 6.21: Option Heathrow Airport North West Runway, international – international transfers at hub airports, million terminal passengers
Assessment of need Global growth
Relative decline of Europe Low-cost is king
Global fragmentation
Carbon-traded 2011 2030 2040 2050 2030 2040 2050 2030 2040 2050 2030 2040 2050 2030 2040 2050
Heathrow 18 34 34 23 38 31 23 29 22 13 35 27 21 28 28 24
Gatwick 1 1 1 0 1 1 0 1 1 0 1 1 0 1 0 0
Paris CDG 16 18 18 22 20 27 12 15 14 14 21 27 13 15 13 15
Amsterdam 13 13 14 18 16 27 49 21 33 46 17 29 48 11 10 11
Frankfurt 26 30 37 52 42 55 42 23 22 28 43 55 44 22 21 28
Dubai 18 29 31 37 37 51 89 36 44 50 37 52 90 22 21 23
Heathrow % 20% 27% 25% 15% 25% 16% 11% 23% 16% 8% 23% 14% 10% 28% 30% 24%
Gatwick % 1% 1% 0% 0% 1% 0% 0% 1% 0% 0% 1% 0% 0% 1% 1% 0%
% of Heathrow pax
26% 30% 25% 17% 33% 23% 17% 25% 16% 9% 31% 20% 15% 24% 21% 17%
% of Gatwick pax
3% 2% 1% 0% 2% 1% 0% 2% 2% 1% 2% 1% 0% 2% 1% 1%
Assessment of need Global growth
Relative decline of Europe Low-cost is king
Global fragmentation
Carbon capped 2011 2030 2040 2050 2030 2040 2050 2030 2040 2050 2030 2040 2050 2030 2040 2050
Heathrow 18 32 34 30 33 36 30 26 23 15 33 31 25 37 42 38
Gatwick 1 1 1 0 1 0 0 1 0 0 1 0 0 1 1 0
Paris CDG 16 16 15 17 16 17 17 14 12 12 16 18 17 18 19 20
Amsterdam 13 11 11 12 12 12 12 18 25 35 12 13 13 13 13 14
Frankfurt 26 25 26 35 26 30 41 20 17 20 27 34 47 31 38 57
Dubai 18 25 25 28 27 29 32 31 36 40 27 30 33 30 34 38
Heathrow % 20% 29% 30% 25% 29% 29% 23% 24% 21% 12% 28% 25% 19% 28% 28% 23%
Gatwick % 1% 1% 0% 0% 0% 0% 0% 1% 0% 0% 0% 0% 0% 1% 0% 0%
% of Heathrow pax
26% 29% 27% 22% 30% 28% 22% 24% 18% 11% 30% 24% 19% 34% 33% 28%
% of Gatwick pax
3% 2% 1% 1% 2% 1% 1% 2% 1% 1% 2% 1% 1% 2% 2% 1%
Option passenger forecasts
137
6.81 When a new north west runway is added at Heathrow with carbon-traded, the airport
increases its volume of international-to-international transfer passengers from current
levels in all scenarios throughout the period. It sees most connecting passengers in the
global growth scenario where these connections are 33% of all passengers in 2030.
Under global growth and low-cost is king scenarios Heathrow has over 20 million more
international-to-international transfer passengers than in the two runway baseline in
2050 despite the expanded airport operating with renewed capacity constraints.
The international-to-international market is also strong at the expanded Heathrow in the
carbon capped cases. In most demand scenarios Heathrow serves between 25-40 million
international-to-international transfer passengers between 2030 and 2050. The exception
is the relative decline of Europe scenario where passengers range from 15 to 26 million
and Heathrow loses out to Amsterdam and Dubai.
6.82 In all scenarios when carbon is traded, in 2030, when the runway is newly open and has
spare capacity, the national share of the international connecting market has increased to
24%-29%. This share declines to 11%-24% by 2050 depending on the scenario when the
additional capacity has been fully utilised for many years already. There is a similar pattern
in 2030 with the lower volumes of connecting passengers in the carbon capped world.
The UK share of the market rises to 25%-30%, depending on scenario. In 2050 the high
carbon costs applied to long-haul connecting traffic affect competitors as much as the UK
in most scenarios and the UK retains a share of the market between 12%-25%.
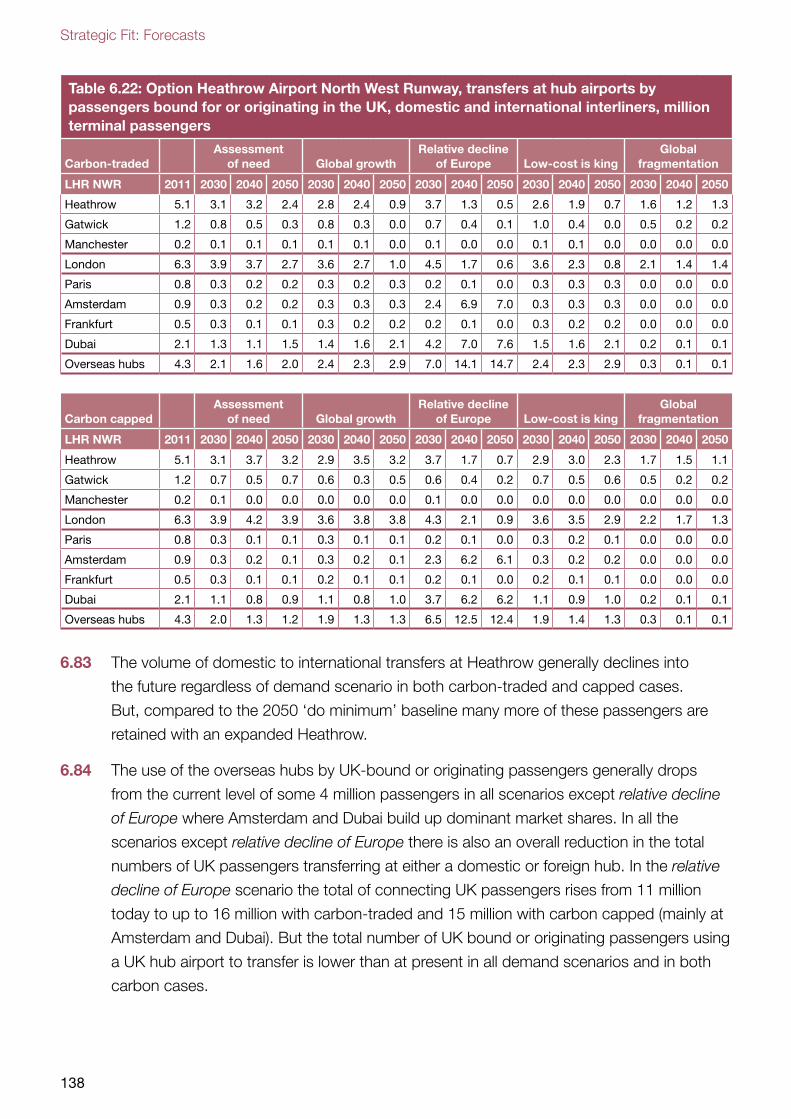
Strategic Fit: Forecasts
138
Table 6.22: Option Heathrow Airport North West Runway, transfers at hub airports by passengers bound for or originating in the UK, domestic and international interliners, million terminal passengers
Carbon-tradedAssessment
of need Global growthRelative decline
of Europe Low-cost is kingGlobal
fragmentation
LHR NWR 2011 2030 2040 2050 2030 2040 2050 2030 2040 2050 2030 2040 2050 2030 2040 2050
Heathrow 5.1 3.1 3.2 2.4 2.8 2.4 0.9 3.7 1.3 0.5 2.6 1.9 0.7 1.6 1.2 1.3
Gatwick 1.2 0.8 0.5 0.3 0.8 0.3 0.0 0.7 0.4 0.1 1.0 0.4 0.0 0.5 0.2 0.2
Manchester 0.2 0.1 0.1 0.1 0.1 0.1 0.0 0.1 0.0 0.0 0.1 0.1 0.0 0.0 0.0 0.0
London 6.3 3.9 3.7 2.7 3.6 2.7 1.0 4.5 1.7 0.6 3.6 2.3 0.8 2.1 1.4 1.4
Paris 0.8 0.3 0.2 0.2 0.3 0.2 0.3 0.2 0.1 0.0 0.3 0.3 0.3 0.0 0.0 0.0
Amsterdam 0.9 0.3 0.2 0.2 0.3 0.3 0.3 2.4 6.9 7.0 0.3 0.3 0.3 0.0 0.0 0.0
Frankfurt 0.5 0.3 0.1 0.1 0.3 0.2 0.2 0.2 0.1 0.0 0.3 0.2 0.2 0.0 0.0 0.0
Dubai 2.1 1.3 1.1 1.5 1.4 1.6 2.1 4.2 7.0 7.6 1.5 1.6 2.1 0.2 0.1 0.1
Overseas hubs 4.3 2.1 1.6 2.0 2.4 2.3 2.9 7.0 14.1 14.7 2.4 2.3 2.9 0.3 0.1 0.1
Carbon cappedAssessment
of need Global growthRelative decline
of Europe Low-cost is kingGlobal
fragmentation
LHR NWR 2011 2030 2040 2050 2030 2040 2050 2030 2040 2050 2030 2040 2050 2030 2040 2050
Heathrow 5.1 3.1 3.7 3.2 2.9 3.5 3.2 3.7 1.7 0.7 2.9 3.0 2.3 1.7 1.5 1.1
Gatwick 1.2 0.7 0.5 0.7 0.6 0.3 0.5 0.6 0.4 0.2 0.7 0.5 0.6 0.5 0.2 0.2
Manchester 0.2 0.1 0.0 0.0 0.0 0.0 0.0 0.1 0.0 0.0 0.0 0.0 0.0 0.0 0.0 0.0
London 6.3 3.9 4.2 3.9 3.6 3.8 3.8 4.3 2.1 0.9 3.6 3.5 2.9 2.2 1.7 1.3
Paris 0.8 0.3 0.1 0.1 0.3 0.1 0.1 0.2 0.1 0.0 0.3 0.2 0.1 0.0 0.0 0.0
Amsterdam 0.9 0.3 0.2 0.1 0.3 0.2 0.1 2.3 6.2 6.1 0.3 0.2 0.2 0.0 0.0 0.0
Frankfurt 0.5 0.3 0.1 0.1 0.2 0.1 0.1 0.2 0.1 0.0 0.2 0.1 0.1 0.0 0.0 0.0
Dubai 2.1 1.1 0.8 0.9 1.1 0.8 1.0 3.7 6.2 6.2 1.1 0.9 1.0 0.2 0.1 0.1
Overseas hubs 4.3 2.0 1.3 1.2 1.9 1.3 1.3 6.5 12.5 12.4 1.9 1.4 1.3 0.3 0.1 0.1
6.83 The volume of domestic to international transfers at Heathrow generally declines into
the future regardless of demand scenario in both carbon-traded and capped cases.
But, compared to the 2050 ‘do minimum’ baseline many more of these passengers are
retained with an expanded Heathrow.
6.84 The use of the overseas hubs by UK-bound or originating passengers generally drops
from the current level of some 4 million passengers in all scenarios except relative decline
of Europe where Amsterdam and Dubai build up dominant market shares. In all the
scenarios except relative decline of Europe there is also an overall reduction in the total
numbers of UK passengers transferring at either a domestic or foreign hub. In the relative
decline of Europe scenario the total of connecting UK passengers rises from 11 million
today to up to 16 million with carbon-traded and 15 million with carbon capped (mainly at
Amsterdam and Dubai). But the total number of UK bound or originating passengers using
a UK hub airport to transfer is lower than at present in all demand scenarios and in both
carbon cases.
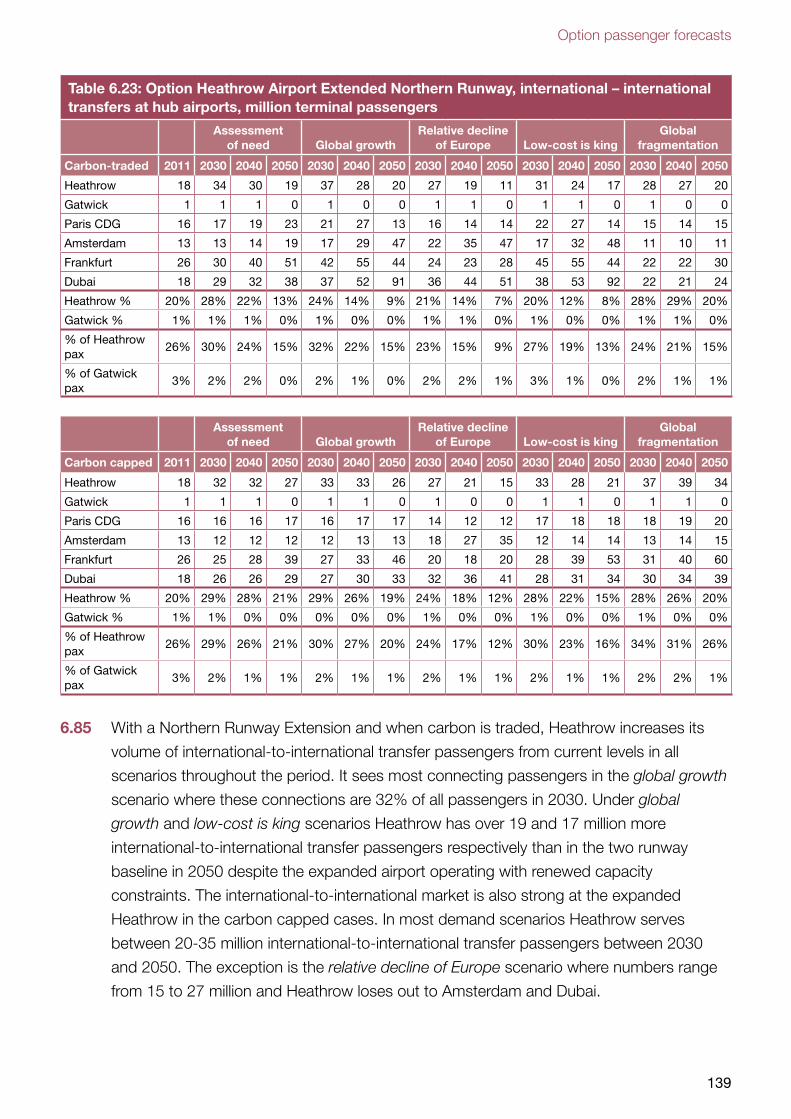
Option passenger forecasts
139
Table 6.23: Option Heathrow Airport Extended Northern Runway, international – international transfers at hub airports, million terminal passengers
Assessment of need Global growth
Relative decline of Europe Low-cost is king
Global fragmentation
Carbon-traded 2011 2030 2040 2050 2030 2040 2050 2030 2040 2050 2030 2040 2050 2030 2040 2050
Heathrow 18 34 30 19 37 28 20 27 19 11 31 24 17 28 27 20
Gatwick 1 1 1 0 1 0 0 1 1 0 1 1 0 1 0 0
Paris CDG 16 17 19 23 21 27 13 16 14 14 22 27 14 15 14 15
Amsterdam 13 13 14 19 17 29 47 22 35 47 17 32 48 11 10 11
Frankfurt 26 30 40 51 42 55 44 24 23 28 45 55 44 22 22 30
Dubai 18 29 32 38 37 52 91 36 44 51 38 53 92 22 21 24
Heathrow % 20% 28% 22% 13% 24% 14% 9% 21% 14% 7% 20% 12% 8% 28% 29% 20%
Gatwick % 1% 1% 1% 0% 1% 0% 0% 1% 1% 0% 1% 0% 0% 1% 1% 0%
% of Heathrow pax
26% 30% 24% 15% 32% 22% 15% 23% 15% 9% 27% 19% 13% 24% 21% 15%
% of Gatwick pax
3% 2% 2% 0% 2% 1% 0% 2% 2% 1% 3% 1% 0% 2% 1% 1%
Assessment of need Global growth
Relative decline of Europe Low-cost is king
Global fragmentation
Carbon capped 2011 2030 2040 2050 2030 2040 2050 2030 2040 2050 2030 2040 2050 2030 2040 2050
Heathrow 18 32 32 27 33 33 26 27 21 15 33 28 21 37 39 34
Gatwick 1 1 1 0 1 1 0 1 0 0 1 1 0 1 1 0
Paris CDG 16 16 16 17 16 17 17 14 12 12 17 18 18 18 19 20
Amsterdam 13 12 12 12 12 13 13 18 27 35 12 14 14 13 14 15
Frankfurt 26 25 28 39 27 33 46 20 18 20 28 39 53 31 40 60
Dubai 18 26 26 29 27 30 33 32 36 41 28 31 34 30 34 39
Heathrow % 20% 29% 28% 21% 29% 26% 19% 24% 18% 12% 28% 22% 15% 28% 26% 20%
Gatwick % 1% 1% 0% 0% 0% 0% 0% 1% 0% 0% 1% 0% 0% 1% 0% 0%
% of Heathrow pax
26% 29% 26% 21% 30% 27% 20% 24% 17% 12% 30% 23% 16% 34% 31% 26%
% of Gatwick pax
3% 2% 1% 1% 2% 1% 1% 2% 1% 1% 2% 1% 1% 2% 2% 1%
6.85 With a Northern Runway Extension and when carbon is traded, Heathrow increases its
volume of international-to-international transfer passengers from current levels in all
scenarios throughout the period. It sees most connecting passengers in the global growth
scenario where these connections are 32% of all passengers in 2030. Under global
growth and low-cost is king scenarios Heathrow has over 19 and 17 million more
international-to-international transfer passengers respectively than in the two runway
baseline in 2050 despite the expanded airport operating with renewed capacity
constraints. The international-to-international market is also strong at the expanded
Heathrow in the carbon capped cases. In most demand scenarios Heathrow serves
between 20-35 million international-to-international transfer passengers between 2030
and 2050. The exception is the relative decline of Europe scenario where numbers range
from 15 to 27 million and Heathrow loses out to Amsterdam and Dubai.
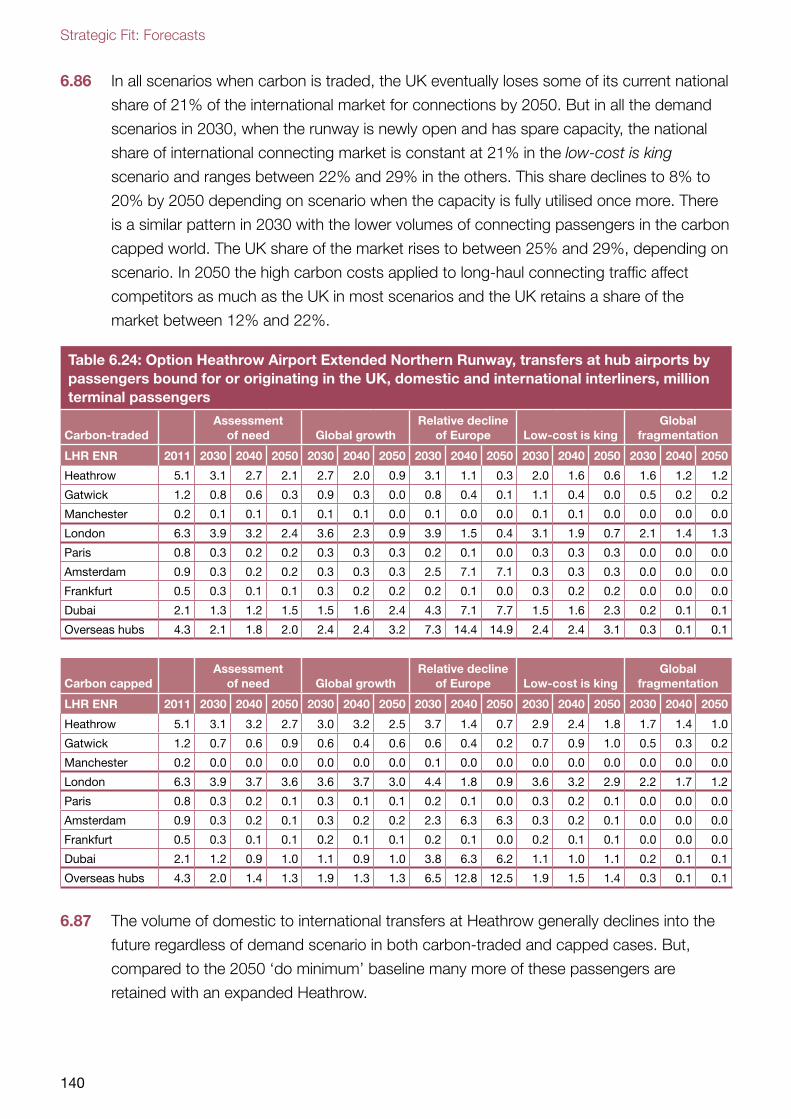
Strategic Fit: Forecasts
140
6.86 In all scenarios when carbon is traded, the UK eventually loses some of its current national
share of 21% of the international market for connections by 2050. But in all the demand
scenarios in 2030, when the runway is newly open and has spare capacity, the national
share of international connecting market is constant at 21% in the low-cost is king
scenario and ranges between 22% and 29% in the others. This share declines to 8% to
20% by 2050 depending on scenario when the capacity is fully utilised once more. There
is a similar pattern in 2030 with the lower volumes of connecting passengers in the carbon
capped world. The UK share of the market rises to between 25% and 29%, depending on
scenario. In 2050 the high carbon costs applied to long-haul connecting traffic affect
competitors as much as the UK in most scenarios and the UK retains a share of the
market between 12% and 22%.
Table 6.24: Option Heathrow Airport Extended Northern Runway, transfers at hub airports by passengers bound for or originating in the UK, domestic and international interliners, million terminal passengers
Carbon-tradedAssessment
of need Global growthRelative decline
of Europe Low-cost is kingGlobal
fragmentation
LHR ENR 2011 2030 2040 2050 2030 2040 2050 2030 2040 2050 2030 2040 2050 2030 2040 2050
Heathrow 5.1 3.1 2.7 2.1 2.7 2.0 0.9 3.1 1.1 0.3 2.0 1.6 0.6 1.6 1.2 1.2
Gatwick 1.2 0.8 0.6 0.3 0.9 0.3 0.0 0.8 0.4 0.1 1.1 0.4 0.0 0.5 0.2 0.2
Manchester 0.2 0.1 0.1 0.1 0.1 0.1 0.0 0.1 0.0 0.0 0.1 0.1 0.0 0.0 0.0 0.0
London 6.3 3.9 3.2 2.4 3.6 2.3 0.9 3.9 1.5 0.4 3.1 1.9 0.7 2.1 1.4 1.3
Paris 0.8 0.3 0.2 0.2 0.3 0.3 0.3 0.2 0.1 0.0 0.3 0.3 0.3 0.0 0.0 0.0
Amsterdam 0.9 0.3 0.2 0.2 0.3 0.3 0.3 2.5 7.1 7.1 0.3 0.3 0.3 0.0 0.0 0.0
Frankfurt 0.5 0.3 0.1 0.1 0.3 0.2 0.2 0.2 0.1 0.0 0.3 0.2 0.2 0.0 0.0 0.0
Dubai 2.1 1.3 1.2 1.5 1.5 1.6 2.4 4.3 7.1 7.7 1.5 1.6 2.3 0.2 0.1 0.1
Overseas hubs 4.3 2.1 1.8 2.0 2.4 2.4 3.2 7.3 14.4 14.9 2.4 2.4 3.1 0.3 0.1 0.1
Carbon cappedAssessment
of need Global growthRelative decline
of Europe Low-cost is kingGlobal
fragmentation
LHR ENR 2011 2030 2040 2050 2030 2040 2050 2030 2040 2050 2030 2040 2050 2030 2040 2050
Heathrow 5.1 3.1 3.2 2.7 3.0 3.2 2.5 3.7 1.4 0.7 2.9 2.4 1.8 1.7 1.4 1.0
Gatwick 1.2 0.7 0.6 0.9 0.6 0.4 0.6 0.6 0.4 0.2 0.7 0.9 1.0 0.5 0.3 0.2
Manchester 0.2 0.0 0.0 0.0 0.0 0.0 0.0 0.1 0.0 0.0 0.0 0.0 0.0 0.0 0.0 0.0
London 6.3 3.9 3.7 3.6 3.6 3.7 3.0 4.4 1.8 0.9 3.6 3.2 2.9 2.2 1.7 1.2
Paris 0.8 0.3 0.2 0.1 0.3 0.1 0.1 0.2 0.1 0.0 0.3 0.2 0.1 0.0 0.0 0.0
Amsterdam 0.9 0.3 0.2 0.1 0.3 0.2 0.2 2.3 6.3 6.3 0.3 0.2 0.1 0.0 0.0 0.0
Frankfurt 0.5 0.3 0.1 0.1 0.2 0.1 0.1 0.2 0.1 0.0 0.2 0.1 0.1 0.0 0.0 0.0
Dubai 2.1 1.2 0.9 1.0 1.1 0.9 1.0 3.8 6.3 6.2 1.1 1.0 1.1 0.2 0.1 0.1
Overseas hubs 4.3 2.0 1.4 1.3 1.9 1.3 1.3 6.5 12.8 12.5 1.9 1.5 1.4 0.3 0.1 0.1
6.87 The volume of domestic to international transfers at Heathrow generally declines into the
future regardless of demand scenario in both carbon-traded and capped cases. But,
compared to the 2050 ‘do minimum’ baseline many more of these passengers are
retained with an expanded Heathrow.
Option passenger forecasts
141
6.88 The use of the overseas hubs by UK-bound or originating passengers generally drops
from the current level of some 4 million passengers in all scenarios except relative decline
of Europe where Amsterdam and Dubai build up larger market shares. In all the scenarios
except relative decline of Europe there is also an overall reduction in the total numbers of
UK passengers transferring at either a domestic or foreign hub. In the relative decline of
Europe scenario the total of connecting UK passengers rises from 11 million today to up
to 16 million with carbon-traded and 15 million with carbon capped (mainly at Amsterdam
and Dubai). But the total number of UK bound or originating passengers using a UK hub
airport to transfer is lower than at present in all demand scenarios and in both carbon
cases.
Destinations served: daily scheduled services
6.89 The analysis presented in the tables below from Table 6.25 through to Table 6.30
summarise the number of separate route destinations served from the airport with
capacity development for the five London airports, the rest of the UK airports and a
national total. There are separate tables for the carbon-traded and capped cases.
A threshold of daily services is applied. This is defined as being at least 365 daily
scheduled departures a year, or 730 annual passenger ATMs (arriving and departing)
air transport movements. The daily threshold applied is relatively stringent. It includes
only scheduled services (both ‘full-service’ and LCC), and therefore excludes charter.
The modelling of destinations served by each airport for each airline sector is part of the
model validation process and is reported in Appendix 1.
6.90 Note that the tables are not additive. If a route exists at the airport with the capacity
development and also elsewhere in the London system, it is counted in both tables,
likewise between London and the regions. Similarly destination totals cannot be derived by
simple subtraction. This means that the national total of destinations served is not the sum
of London and the other regional airports, as the latter will normally have most, if not all,
destinations in common with London.
6.91 As discussed earlier in paragraph 5.39, counting destinations served from a particular
airport or region is a limited measure of connectivity because the new destinations added
will initially be at the margin often operating at less than daily frequencies or at times
inconvenient to many passengers. Destinations with daily services might be seen as more
relevant at airports with significant proportions of business travellers, but at airports with a
range of seasonal and charter traffic, the total destinations served without a threshold may
be just as relevant.
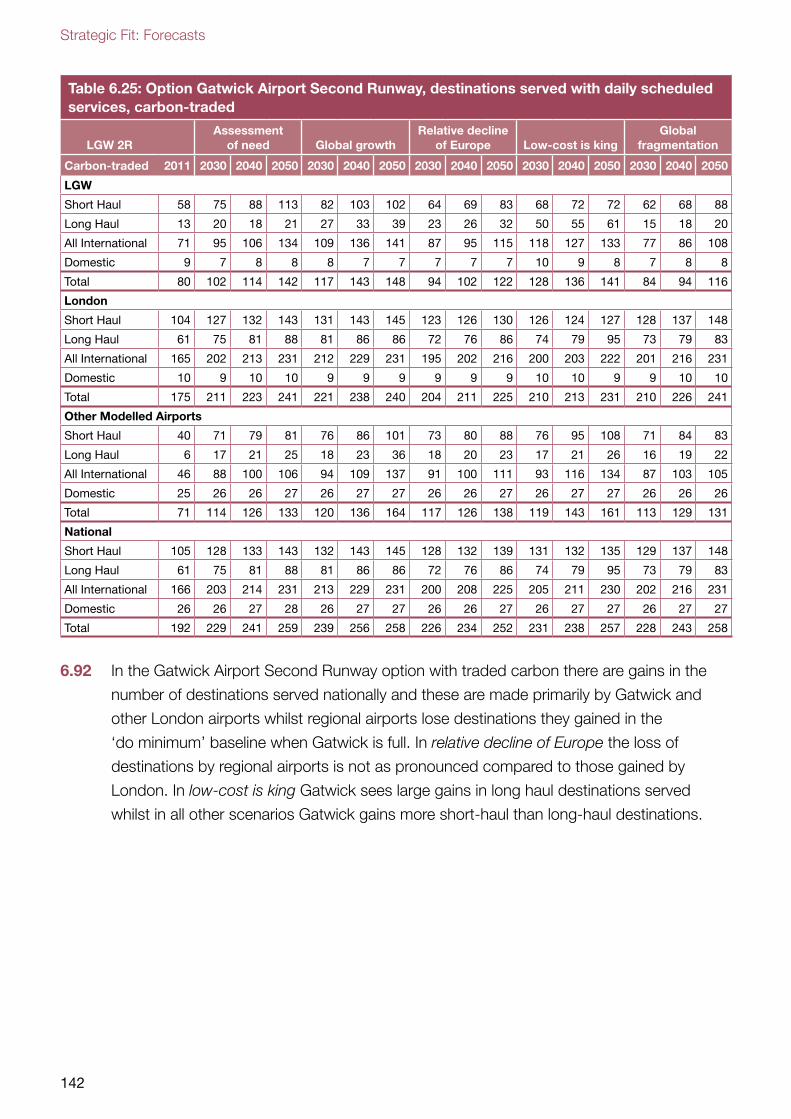
Strategic Fit: Forecasts
142
Table 6.25: Option Gatwick Airport Second Runway, destinations served with daily scheduled services, carbon-traded
LGW 2RAssessment
of need Global growthRelative decline
of Europe Low-cost is kingGlobal
fragmentation
Carbon-traded 2011 2030 2040 2050 2030 2040 2050 2030 2040 2050 2030 2040 2050 2030 2040 2050
LGW
Short Haul 58 75 88 113 82 103 102 64 69 83 68 72 72 62 68 88
Long Haul 13 20 18 21 27 33 39 23 26 32 50 55 61 15 18 20
All International 71 95 106 134 109 136 141 87 95 115 118 127 133 77 86 108
Domestic 9 7 8 8 8 7 7 7 7 7 10 9 8 7 8 8
Total 80 102 114 142 117 143 148 94 102 122 128 136 141 84 94 116
London
Short Haul 104 127 132 143 131 143 145 123 126 130 126 124 127 128 137 148
Long Haul 61 75 81 88 81 86 86 72 76 86 74 79 95 73 79 83
All International 165 202 213 231 212 229 231 195 202 216 200 203 222 201 216 231
Domestic 10 9 10 10 9 9 9 9 9 9 10 10 9 9 10 10
Total 175 211 223 241 221 238 240 204 211 225 210 213 231 210 226 241
Other Modelled Airports
Short Haul 40 71 79 81 76 86 101 73 80 88 76 95 108 71 84 83
Long Haul 6 17 21 25 18 23 36 18 20 23 17 21 26 16 19 22
All International 46 88 100 106 94 109 137 91 100 111 93 116 134 87 103 105
Domestic 25 26 26 27 26 27 27 26 26 27 26 27 27 26 26 26
Total 71 114 126 133 120 136 164 117 126 138 119 143 161 113 129 131
National
Short Haul 105 128 133 143 132 143 145 128 132 139 131 132 135 129 137 148
Long Haul 61 75 81 88 81 86 86 72 76 86 74 79 95 73 79 83
All International 166 203 214 231 213 229 231 200 208 225 205 211 230 202 216 231
Domestic 26 26 27 28 26 27 27 26 26 27 26 27 27 26 27 27
Total 192 229 241 259 239 256 258 226 234 252 231 238 257 228 243 258
6.92 In the Gatwick Airport Second Runway option with traded carbon there are gains in the
number of destinations served nationally and these are made primarily by Gatwick and
other London airports whilst regional airports lose destinations they gained in the
‘do minimum’ baseline when Gatwick is full. In relative decline of Europe the loss of
destinations by regional airports is not as pronounced compared to those gained by
London. In low-cost is king Gatwick sees large gains in long haul destinations served
whilst in all other scenarios Gatwick gains more short-haul than long-haul destinations.
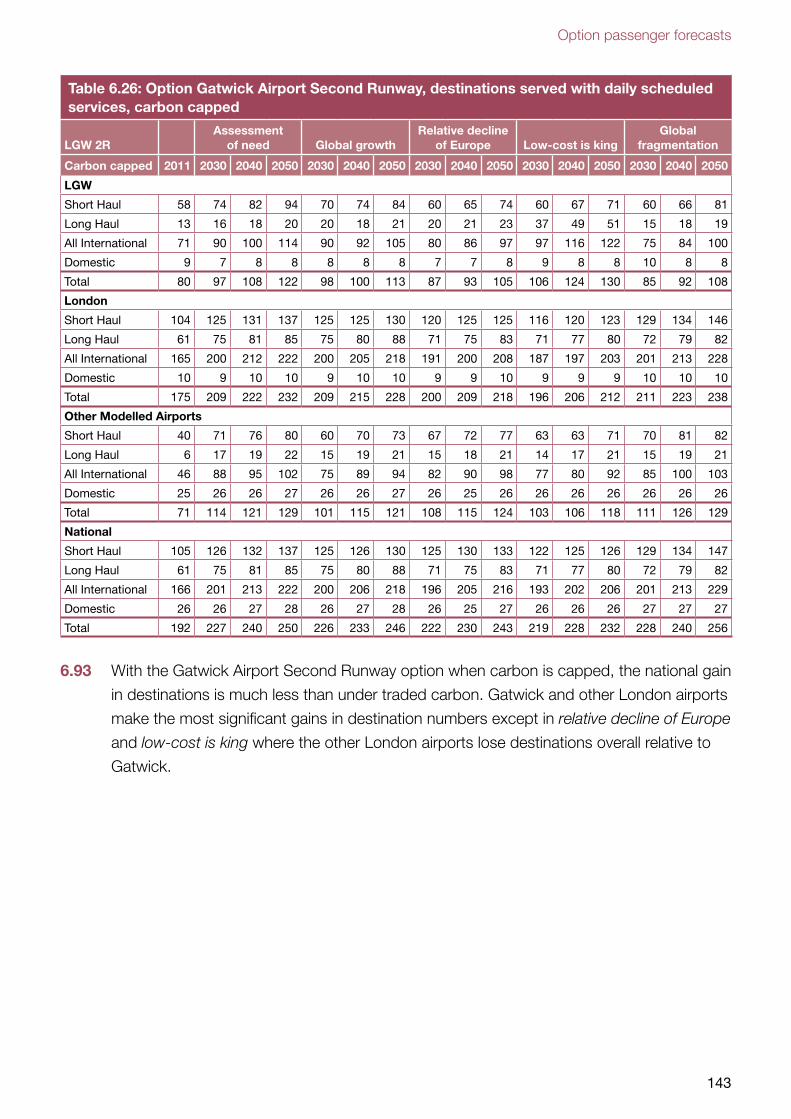
Option passenger forecasts
143
Table 6.26: Option Gatwick Airport Second Runway, destinations served with daily scheduled services, carbon capped
LGW 2RAssessment
of need Global growthRelative decline
of Europe Low-cost is kingGlobal
fragmentation
Carbon capped 2011 2030 2040 2050 2030 2040 2050 2030 2040 2050 2030 2040 2050 2030 2040 2050
LGW
Short Haul 58 74 82 94 70 74 84 60 65 74 60 67 71 60 66 81
Long Haul 13 16 18 20 20 18 21 20 21 23 37 49 51 15 18 19
All International 71 90 100 114 90 92 105 80 86 97 97 116 122 75 84 100
Domestic 9 7 8 8 8 8 8 7 7 8 9 8 8 10 8 8
Total 80 97 108 122 98 100 113 87 93 105 106 124 130 85 92 108
London
Short Haul 104 125 131 137 125 125 130 120 125 125 116 120 123 129 134 146
Long Haul 61 75 81 85 75 80 88 71 75 83 71 77 80 72 79 82
All International 165 200 212 222 200 205 218 191 200 208 187 197 203 201 213 228
Domestic 10 9 10 10 9 10 10 9 9 10 9 9 9 10 10 10
Total 175 209 222 232 209 215 228 200 209 218 196 206 212 211 223 238
Other Modelled Airports
Short Haul 40 71 76 80 60 70 73 67 72 77 63 63 71 70 81 82
Long Haul 6 17 19 22 15 19 21 15 18 21 14 17 21 15 19 21
All International 46 88 95 102 75 89 94 82 90 98 77 80 92 85 100 103
Domestic 25 26 26 27 26 26 27 26 25 26 26 26 26 26 26 26
Total 71 114 121 129 101 115 121 108 115 124 103 106 118 111 126 129
National
Short Haul 105 126 132 137 125 126 130 125 130 133 122 125 126 129 134 147
Long Haul 61 75 81 85 75 80 88 71 75 83 71 77 80 72 79 82
All International 166 201 213 222 200 206 218 196 205 216 193 202 206 201 213 229
Domestic 26 26 27 28 26 27 28 26 25 27 26 26 26 27 27 27
Total 192 227 240 250 226 233 246 222 230 243 219 228 232 228 240 256
6.93 With the Gatwick Airport Second Runway option when carbon is capped, the national gain
in destinations is much less than under traded carbon. Gatwick and other London airports
make the most significant gains in destination numbers except in relative decline of Europe
and low-cost is king where the other London airports lose destinations overall relative to
Gatwick.
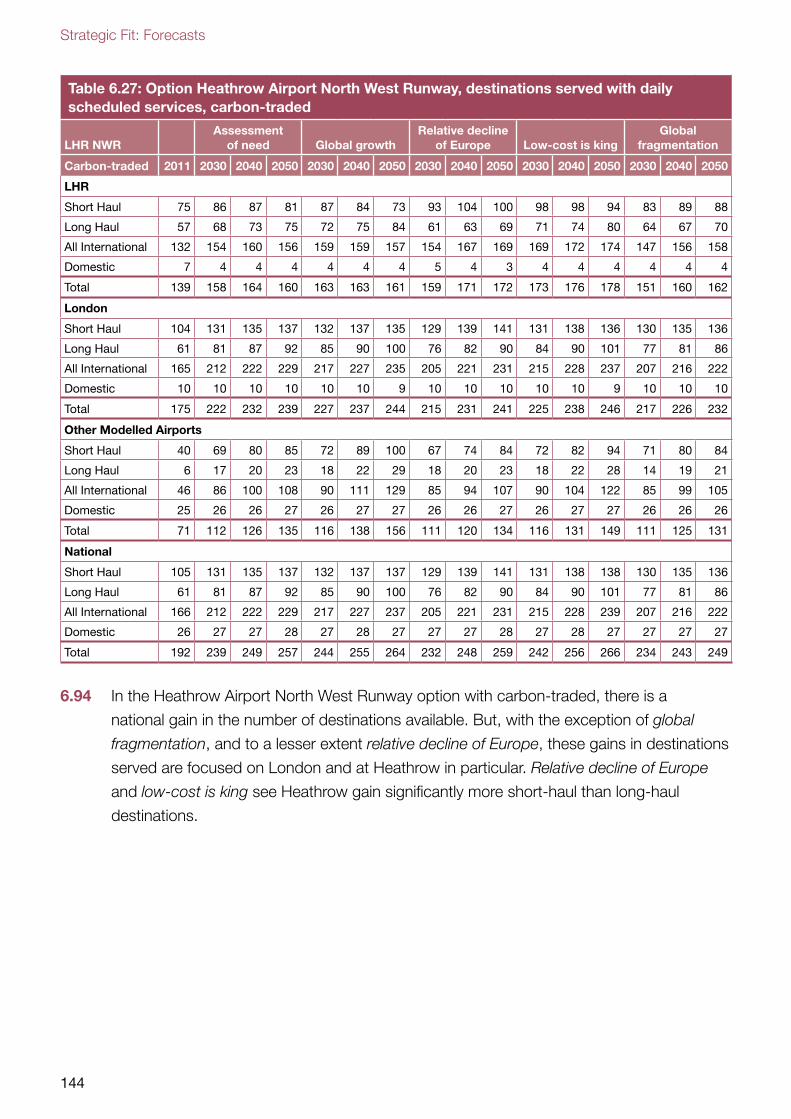
Strategic Fit: Forecasts
144
Table 6.27: Option Heathrow Airport North West Runway, destinations served with daily scheduled services, carbon-traded
LHR NWRAssessment
of need Global growthRelative decline
of Europe Low-cost is kingGlobal
fragmentation
Carbon-traded 2011 2030 2040 2050 2030 2040 2050 2030 2040 2050 2030 2040 2050 2030 2040 2050
LHR
Short Haul 75 86 87 81 87 84 73 93 104 100 98 98 94 83 89 88
Long Haul 57 68 73 75 72 75 84 61 63 69 71 74 80 64 67 70
All International 132 154 160 156 159 159 157 154 167 169 169 172 174 147 156 158
Domestic 7 4 4 4 4 4 4 5 4 3 4 4 4 4 4 4
Total 139 158 164 160 163 163 161 159 171 172 173 176 178 151 160 162
London
Short Haul 104 131 135 137 132 137 135 129 139 141 131 138 136 130 135 136
Long Haul 61 81 87 92 85 90 100 76 82 90 84 90 101 77 81 86
All International 165 212 222 229 217 227 235 205 221 231 215 228 237 207 216 222
Domestic 10 10 10 10 10 10 9 10 10 10 10 10 9 10 10 10
Total 175 222 232 239 227 237 244 215 231 241 225 238 246 217 226 232
Other Modelled Airports
Short Haul 40 69 80 85 72 89 100 67 74 84 72 82 94 71 80 84
Long Haul 6 17 20 23 18 22 29 18 20 23 18 22 28 14 19 21
All International 46 86 100 108 90 111 129 85 94 107 90 104 122 85 99 105
Domestic 25 26 26 27 26 27 27 26 26 27 26 27 27 26 26 26
Total 71 112 126 135 116 138 156 111 120 134 116 131 149 111 125 131
National
Short Haul 105 131 135 137 132 137 137 129 139 141 131 138 138 130 135 136
Long Haul 61 81 87 92 85 90 100 76 82 90 84 90 101 77 81 86
All International 166 212 222 229 217 227 237 205 221 231 215 228 239 207 216 222
Domestic 26 27 27 28 27 28 27 27 27 28 27 28 27 27 27 27
Total 192 239 249 257 244 255 264 232 248 259 242 256 266 234 243 249
6.94 In the Heathrow Airport North West Runway option with carbon-traded, there is a
national gain in the number of destinations available. But, with the exception of global
fragmentation, and to a lesser extent relative decline of Europe, these gains in destinations
served are focused on London and at Heathrow in particular. Relative decline of Europe
and low-cost is king see Heathrow gain significantly more short-haul than long-haul
destinations.
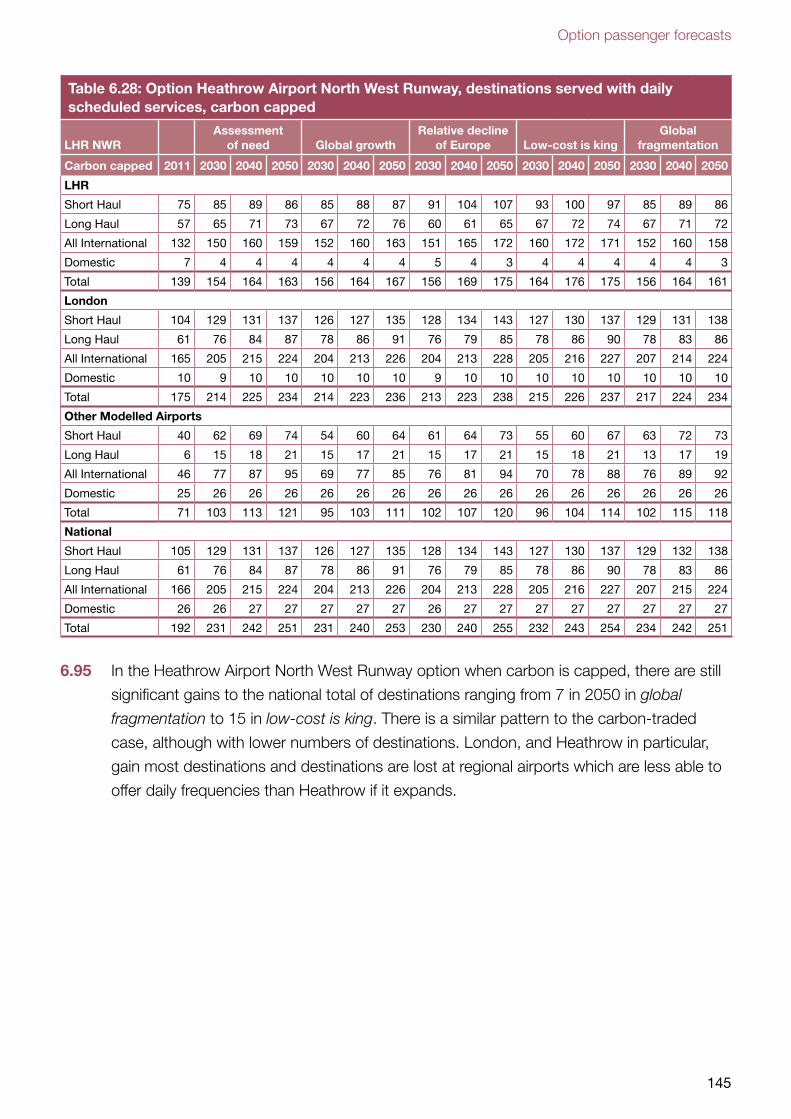
Option passenger forecasts
145
Table 6.28: Option Heathrow Airport North West Runway, destinations served with daily scheduled services, carbon capped
LHR NWRAssessment
of need Global growthRelative decline
of Europe Low-cost is kingGlobal
fragmentation
Carbon capped 2011 2030 2040 2050 2030 2040 2050 2030 2040 2050 2030 2040 2050 2030 2040 2050
LHR
Short Haul 75 85 89 86 85 88 87 91 104 107 93 100 97 85 89 86
Long Haul 57 65 71 73 67 72 76 60 61 65 67 72 74 67 71 72
All International 132 150 160 159 152 160 163 151 165 172 160 172 171 152 160 158
Domestic 7 4 4 4 4 4 4 5 4 3 4 4 4 4 4 3
Total 139 154 164 163 156 164 167 156 169 175 164 176 175 156 164 161
London
Short Haul 104 129 131 137 126 127 135 128 134 143 127 130 137 129 131 138
Long Haul 61 76 84 87 78 86 91 76 79 85 78 86 90 78 83 86
All International 165 205 215 224 204 213 226 204 213 228 205 216 227 207 214 224
Domestic 10 9 10 10 10 10 10 9 10 10 10 10 10 10 10 10
Total 175 214 225 234 214 223 236 213 223 238 215 226 237 217 224 234
Other Modelled Airports
Short Haul 40 62 69 74 54 60 64 61 64 73 55 60 67 63 72 73
Long Haul 6 15 18 21 15 17 21 15 17 21 15 18 21 13 17 19
All International 46 77 87 95 69 77 85 76 81 94 70 78 88 76 89 92
Domestic 25 26 26 26 26 26 26 26 26 26 26 26 26 26 26 26
Total 71 103 113 121 95 103 111 102 107 120 96 104 114 102 115 118
National
Short Haul 105 129 131 137 126 127 135 128 134 143 127 130 137 129 132 138
Long Haul 61 76 84 87 78 86 91 76 79 85 78 86 90 78 83 86
All International 166 205 215 224 204 213 226 204 213 228 205 216 227 207 215 224
Domestic 26 26 27 27 27 27 27 26 27 27 27 27 27 27 27 27
Total 192 231 242 251 231 240 253 230 240 255 232 243 254 234 242 251
6.95 In the Heathrow Airport North West Runway option when carbon is capped, there are still
significant gains to the national total of destinations ranging from 7 in 2050 in global
fragmentation to 15 in low-cost is king. There is a similar pattern to the carbon-traded
case, although with lower numbers of destinations. London, and Heathrow in particular,
gain most destinations and destinations are lost at regional airports which are less able to
offer daily frequencies than Heathrow if it expands.
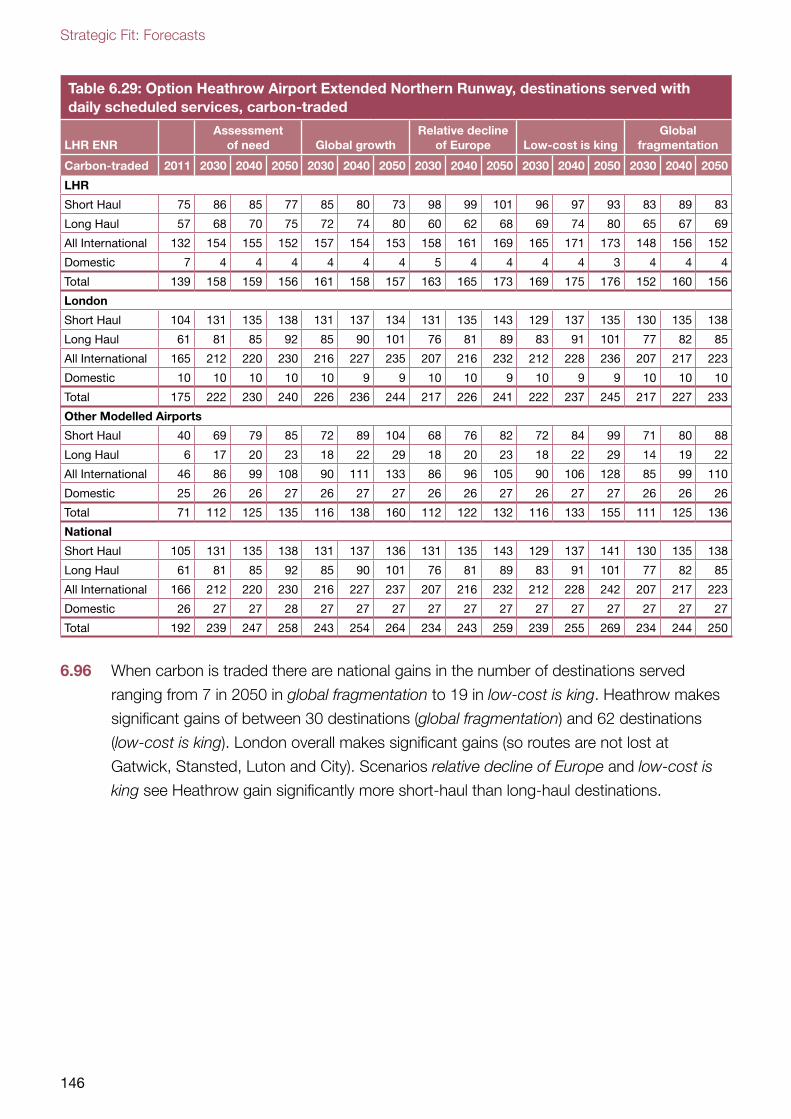
Strategic Fit: Forecasts
146
Table 6.29: Option Heathrow Airport Extended Northern Runway, destinations served with daily scheduled services, carbon-traded
LHR ENRAssessment
of need Global growthRelative decline
of Europe Low-cost is kingGlobal
fragmentation
Carbon-traded 2011 2030 2040 2050 2030 2040 2050 2030 2040 2050 2030 2040 2050 2030 2040 2050
LHR
Short Haul 75 86 85 77 85 80 73 98 99 101 96 97 93 83 89 83
Long Haul 57 68 70 75 72 74 80 60 62 68 69 74 80 65 67 69
All International 132 154 155 152 157 154 153 158 161 169 165 171 173 148 156 152
Domestic 7 4 4 4 4 4 4 5 4 4 4 4 3 4 4 4
Total 139 158 159 156 161 158 157 163 165 173 169 175 176 152 160 156
London
Short Haul 104 131 135 138 131 137 134 131 135 143 129 137 135 130 135 138
Long Haul 61 81 85 92 85 90 101 76 81 89 83 91 101 77 82 85
All International 165 212 220 230 216 227 235 207 216 232 212 228 236 207 217 223
Domestic 10 10 10 10 10 9 9 10 10 9 10 9 9 10 10 10
Total 175 222 230 240 226 236 244 217 226 241 222 237 245 217 227 233
Other Modelled Airports
Short Haul 40 69 79 85 72 89 104 68 76 82 72 84 99 71 80 88
Long Haul 6 17 20 23 18 22 29 18 20 23 18 22 29 14 19 22
All International 46 86 99 108 90 111 133 86 96 105 90 106 128 85 99 110
Domestic 25 26 26 27 26 27 27 26 26 27 26 27 27 26 26 26
Total 71 112 125 135 116 138 160 112 122 132 116 133 155 111 125 136
National
Short Haul 105 131 135 138 131 137 136 131 135 143 129 137 141 130 135 138
Long Haul 61 81 85 92 85 90 101 76 81 89 83 91 101 77 82 85
All International 166 212 220 230 216 227 237 207 216 232 212 228 242 207 217 223
Domestic 26 27 27 28 27 27 27 27 27 27 27 27 27 27 27 27
Total 192 239 247 258 243 254 264 234 243 259 239 255 269 234 244 250
6.96 When carbon is traded there are national gains in the number of destinations served
ranging from 7 in 2050 in global fragmentation to 19 in low-cost is king. Heathrow makes
significant gains of between 30 destinations (global fragmentation) and 62 destinations
(low-cost is king). London overall makes significant gains (so routes are not lost at
Gatwick, Stansted, Luton and City). Scenarios relative decline of Europe and low-cost is
king see Heathrow gain significantly more short-haul than long-haul destinations.
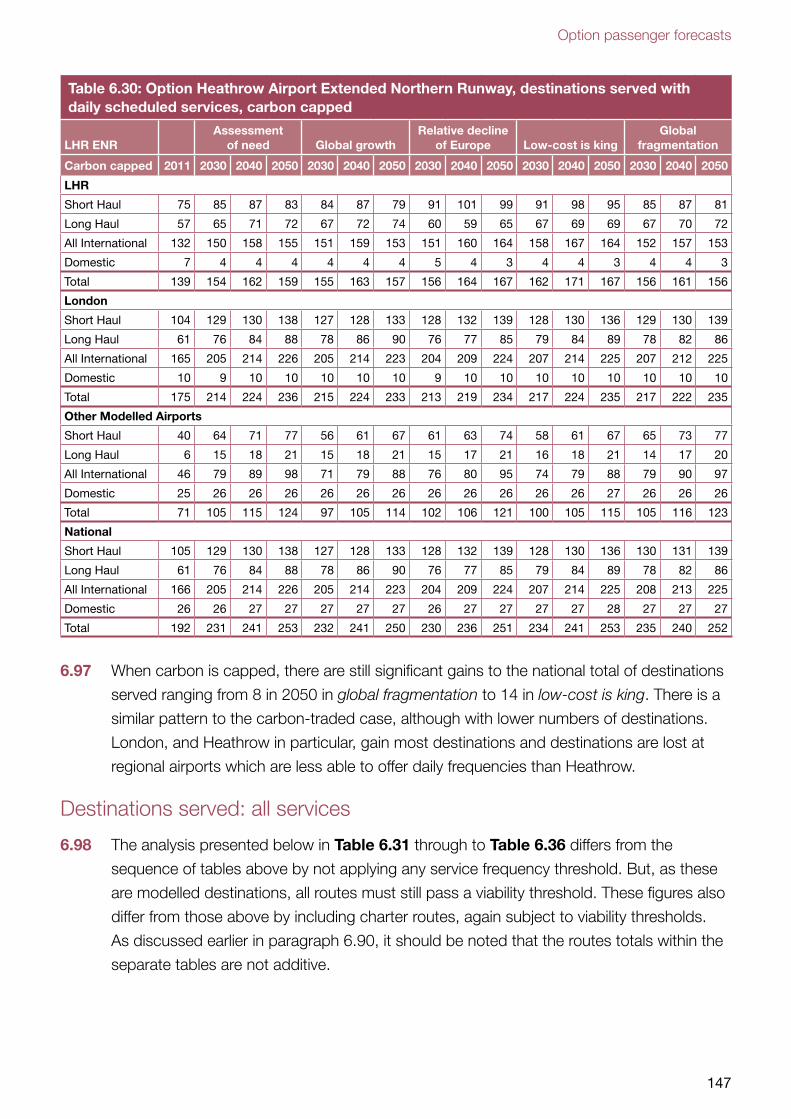
Option passenger forecasts
147
Table 6.30: Option Heathrow Airport Extended Northern Runway, destinations served with daily scheduled services, carbon capped
LHR ENRAssessment
of need Global growthRelative decline
of Europe Low-cost is kingGlobal
fragmentation
Carbon capped 2011 2030 2040 2050 2030 2040 2050 2030 2040 2050 2030 2040 2050 2030 2040 2050
LHR
Short Haul 75 85 87 83 84 87 79 91 101 99 91 98 95 85 87 81
Long Haul 57 65 71 72 67 72 74 60 59 65 67 69 69 67 70 72
All International 132 150 158 155 151 159 153 151 160 164 158 167 164 152 157 153
Domestic 7 4 4 4 4 4 4 5 4 3 4 4 3 4 4 3
Total 139 154 162 159 155 163 157 156 164 167 162 171 167 156 161 156
London
Short Haul 104 129 130 138 127 128 133 128 132 139 128 130 136 129 130 139
Long Haul 61 76 84 88 78 86 90 76 77 85 79 84 89 78 82 86
All International 165 205 214 226 205 214 223 204 209 224 207 214 225 207 212 225
Domestic 10 9 10 10 10 10 10 9 10 10 10 10 10 10 10 10
Total 175 214 224 236 215 224 233 213 219 234 217 224 235 217 222 235
Other Modelled Airports
Short Haul 40 64 71 77 56 61 67 61 63 74 58 61 67 65 73 77
Long Haul 6 15 18 21 15 18 21 15 17 21 16 18 21 14 17 20
All International 46 79 89 98 71 79 88 76 80 95 74 79 88 79 90 97
Domestic 25 26 26 26 26 26 26 26 26 26 26 26 27 26 26 26
Total 71 105 115 124 97 105 114 102 106 121 100 105 115 105 116 123
National
Short Haul 105 129 130 138 127 128 133 128 132 139 128 130 136 130 131 139
Long Haul 61 76 84 88 78 86 90 76 77 85 79 84 89 78 82 86
All International 166 205 214 226 205 214 223 204 209 224 207 214 225 208 213 225
Domestic 26 26 27 27 27 27 27 26 27 27 27 27 28 27 27 27
Total 192 231 241 253 232 241 250 230 236 251 234 241 253 235 240 252
6.97 When carbon is capped, there are still significant gains to the national total of destinations
served ranging from 8 in 2050 in global fragmentation to 14 in low-cost is king. There is a
similar pattern to the carbon-traded case, although with lower numbers of destinations.
London, and Heathrow in particular, gain most destinations and destinations are lost at
regional airports which are less able to offer daily frequencies than Heathrow.
Destinations served: all services
6.98 The analysis presented below in Table 6.31 through to Table 6.36 differs from the
sequence of tables above by not applying any service frequency threshold. But, as these
are modelled destinations, all routes must still pass a viability threshold. These figures also
differ from those above by including charter routes, again subject to viability thresholds.
As discussed earlier in paragraph 6.90, it should be noted that the routes totals within the
separate tables are not additive.
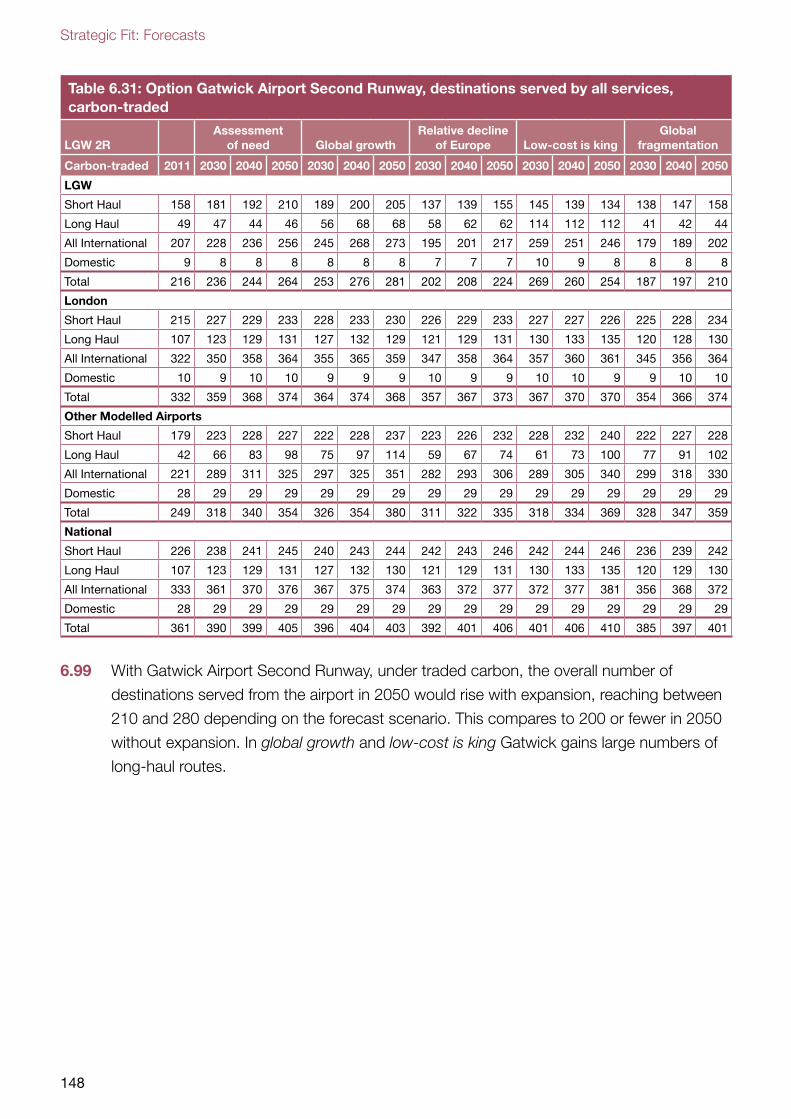
Strategic Fit: Forecasts
148
Table 6.31: Option Gatwick Airport Second Runway, destinations served by all services, carbon-traded
LGW 2RAssessment
of need Global growthRelative decline
of Europe Low-cost is kingGlobal
fragmentation
Carbon-traded 2011 2030 2040 2050 2030 2040 2050 2030 2040 2050 2030 2040 2050 2030 2040 2050
LGW
Short Haul 158 181 192 210 189 200 205 137 139 155 145 139 134 138 147 158
Long Haul 49 47 44 46 56 68 68 58 62 62 114 112 112 41 42 44
All International 207 228 236 256 245 268 273 195 201 217 259 251 246 179 189 202
Domestic 9 8 8 8 8 8 8 7 7 7 10 9 8 8 8 8
Total 216 236 244 264 253 276 281 202 208 224 269 260 254 187 197 210
London
Short Haul 215 227 229 233 228 233 230 226 229 233 227 227 226 225 228 234
Long Haul 107 123 129 131 127 132 129 121 129 131 130 133 135 120 128 130
All International 322 350 358 364 355 365 359 347 358 364 357 360 361 345 356 364
Domestic 10 9 10 10 9 9 9 10 9 9 10 10 9 9 10 10
Total 332 359 368 374 364 374 368 357 367 373 367 370 370 354 366 374
Other Modelled Airports
Short Haul 179 223 228 227 222 228 237 223 226 232 228 232 240 222 227 228
Long Haul 42 66 83 98 75 97 114 59 67 74 61 73 100 77 91 102
All International 221 289 311 325 297 325 351 282 293 306 289 305 340 299 318 330
Domestic 28 29 29 29 29 29 29 29 29 29 29 29 29 29 29 29
Total 249 318 340 354 326 354 380 311 322 335 318 334 369 328 347 359
National
Short Haul 226 238 241 245 240 243 244 242 243 246 242 244 246 236 239 242
Long Haul 107 123 129 131 127 132 130 121 129 131 130 133 135 120 129 130
All International 333 361 370 376 367 375 374 363 372 377 372 377 381 356 368 372
Domestic 28 29 29 29 29 29 29 29 29 29 29 29 29 29 29 29
Total 361 390 399 405 396 404 403 392 401 406 401 406 410 385 397 401
6.99 With Gatwick Airport Second Runway, under traded carbon, the overall number of
destinations served from the airport in 2050 would rise with expansion, reaching between
210 and 280 depending on the forecast scenario. This compares to 200 or fewer in 2050
without expansion. In global growth and low-cost is king Gatwick gains large numbers of
long-haul routes.
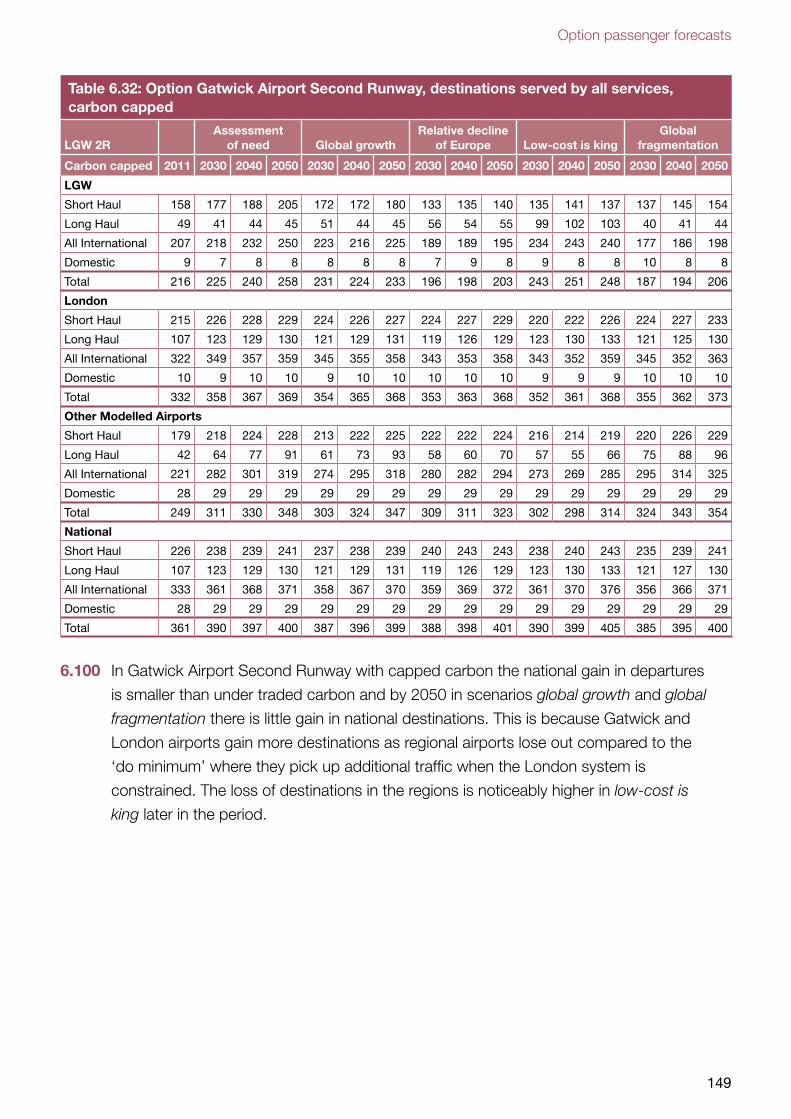
Option passenger forecasts
149
Table 6.32: Option Gatwick Airport Second Runway, destinations served by all services, carbon capped
LGW 2RAssessment
of need Global growthRelative decline
of Europe Low-cost is kingGlobal
fragmentation
Carbon capped 2011 2030 2040 2050 2030 2040 2050 2030 2040 2050 2030 2040 2050 2030 2040 2050
LGW
Short Haul 158 177 188 205 172 172 180 133 135 140 135 141 137 137 145 154
Long Haul 49 41 44 45 51 44 45 56 54 55 99 102 103 40 41 44
All International 207 218 232 250 223 216 225 189 189 195 234 243 240 177 186 198
Domestic 9 7 8 8 8 8 8 7 9 8 9 8 8 10 8 8
Total 216 225 240 258 231 224 233 196 198 203 243 251 248 187 194 206
London
Short Haul 215 226 228 229 224 226 227 224 227 229 220 222 226 224 227 233
Long Haul 107 123 129 130 121 129 131 119 126 129 123 130 133 121 125 130
All International 322 349 357 359 345 355 358 343 353 358 343 352 359 345 352 363
Domestic 10 9 10 10 9 10 10 10 10 10 9 9 9 10 10 10
Total 332 358 367 369 354 365 368 353 363 368 352 361 368 355 362 373
Other Modelled Airports
Short Haul 179 218 224 228 213 222 225 222 222 224 216 214 219 220 226 229
Long Haul 42 64 77 91 61 73 93 58 60 70 57 55 66 75 88 96
All International 221 282 301 319 274 295 318 280 282 294 273 269 285 295 314 325
Domestic 28 29 29 29 29 29 29 29 29 29 29 29 29 29 29 29
Total 249 311 330 348 303 324 347 309 311 323 302 298 314 324 343 354
National
Short Haul 226 238 239 241 237 238 239 240 243 243 238 240 243 235 239 241
Long Haul 107 123 129 130 121 129 131 119 126 129 123 130 133 121 127 130
All International 333 361 368 371 358 367 370 359 369 372 361 370 376 356 366 371
Domestic 28 29 29 29 29 29 29 29 29 29 29 29 29 29 29 29
Total 361 390 397 400 387 396 399 388 398 401 390 399 405 385 395 400
6.100 In Gatwick Airport Second Runway with capped carbon the national gain in departures
is smaller than under traded carbon and by 2050 in scenarios global growth and global
fragmentation there is little gain in national destinations. This is because Gatwick and
London airports gain more destinations as regional airports lose out compared to the
‘do minimum’ where they pick up additional traffic when the London system is
constrained. The loss of destinations in the regions is noticeably higher in low-cost is
king later in the period.
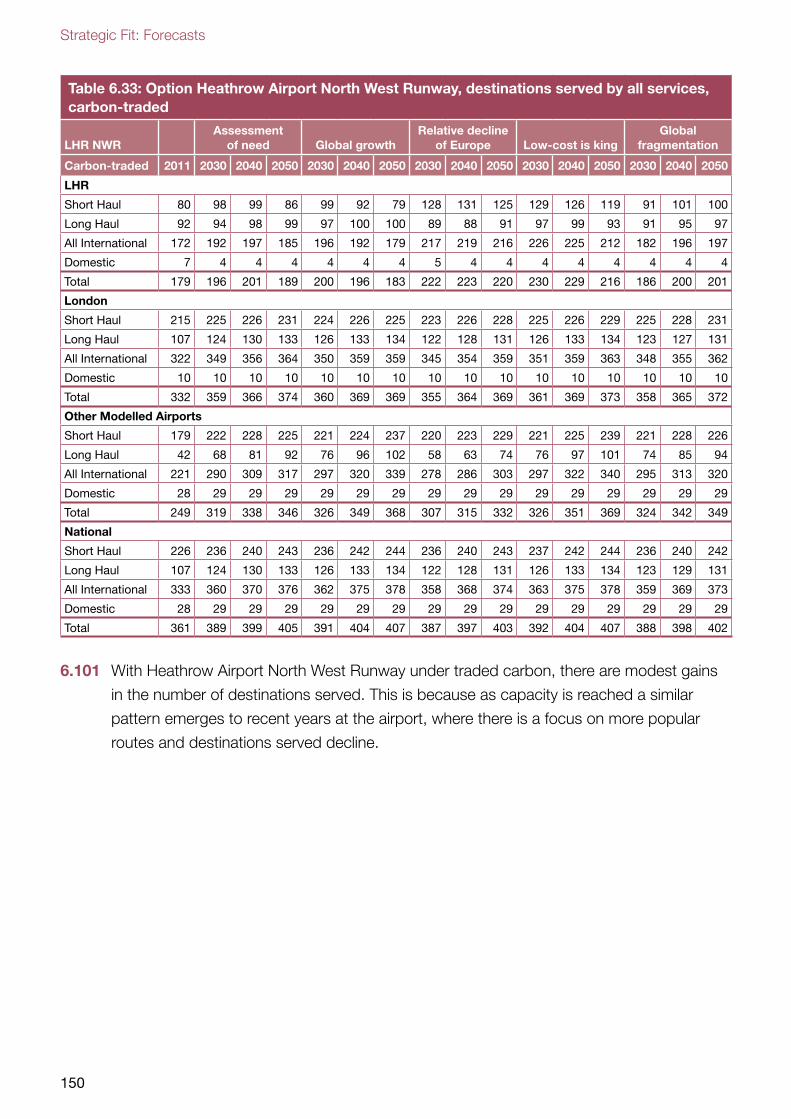
Strategic Fit: Forecasts
150
Table 6.33: Option Heathrow Airport North West Runway, destinations served by all services, carbon-traded
LHR NWRAssessment
of need Global growthRelative decline
of Europe Low-cost is kingGlobal
fragmentation
Carbon-traded 2011 2030 2040 2050 2030 2040 2050 2030 2040 2050 2030 2040 2050 2030 2040 2050
LHR
Short Haul 80 98 99 86 99 92 79 128 131 125 129 126 119 91 101 100
Long Haul 92 94 98 99 97 100 100 89 88 91 97 99 93 91 95 97
All International 172 192 197 185 196 192 179 217 219 216 226 225 212 182 196 197
Domestic 7 4 4 4 4 4 4 5 4 4 4 4 4 4 4 4
Total 179 196 201 189 200 196 183 222 223 220 230 229 216 186 200 201
London
Short Haul 215 225 226 231 224 226 225 223 226 228 225 226 229 225 228 231
Long Haul 107 124 130 133 126 133 134 122 128 131 126 133 134 123 127 131
All International 322 349 356 364 350 359 359 345 354 359 351 359 363 348 355 362
Domestic 10 10 10 10 10 10 10 10 10 10 10 10 10 10 10 10
Total 332 359 366 374 360 369 369 355 364 369 361 369 373 358 365 372
Other Modelled Airports
Short Haul 179 222 228 225 221 224 237 220 223 229 221 225 239 221 228 226
Long Haul 42 68 81 92 76 96 102 58 63 74 76 97 101 74 85 94
All International 221 290 309 317 297 320 339 278 286 303 297 322 340 295 313 320
Domestic 28 29 29 29 29 29 29 29 29 29 29 29 29 29 29 29
Total 249 319 338 346 326 349 368 307 315 332 326 351 369 324 342 349
National
Short Haul 226 236 240 243 236 242 244 236 240 243 237 242 244 236 240 242
Long Haul 107 124 130 133 126 133 134 122 128 131 126 133 134 123 129 131
All International 333 360 370 376 362 375 378 358 368 374 363 375 378 359 369 373
Domestic 28 29 29 29 29 29 29 29 29 29 29 29 29 29 29 29
Total 361 389 399 405 391 404 407 387 397 403 392 404 407 388 398 402
6.101 With Heathrow Airport North West Runway under traded carbon, there are modest gains
in the number of destinations served. This is because as capacity is reached a similar
pattern emerges to recent years at the airport, where there is a focus on more popular
routes and destinations served decline.
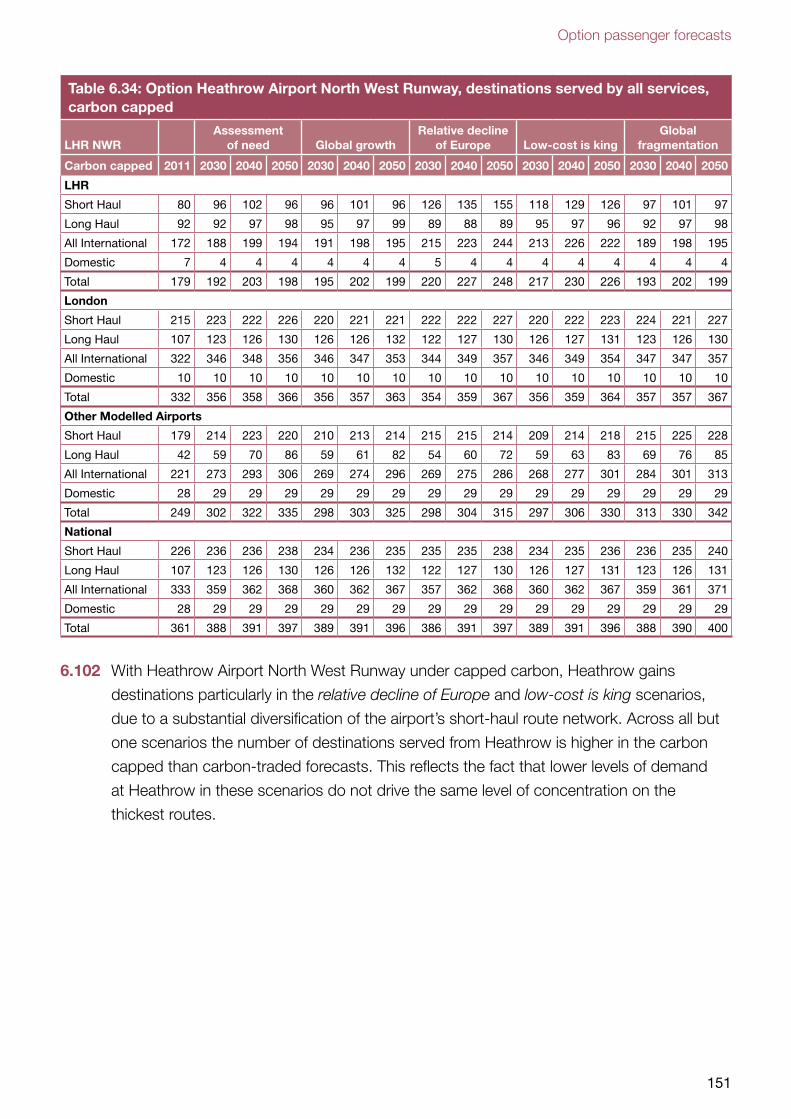
Option passenger forecasts
151
Table 6.34: Option Heathrow Airport North West Runway, destinations served by all services, carbon capped
LHR NWRAssessment
of need Global growthRelative decline
of Europe Low-cost is kingGlobal
fragmentation
Carbon capped 2011 2030 2040 2050 2030 2040 2050 2030 2040 2050 2030 2040 2050 2030 2040 2050
LHR
Short Haul 80 96 102 96 96 101 96 126 135 155 118 129 126 97 101 97
Long Haul 92 92 97 98 95 97 99 89 88 89 95 97 96 92 97 98
All International 172 188 199 194 191 198 195 215 223 244 213 226 222 189 198 195
Domestic 7 4 4 4 4 4 4 5 4 4 4 4 4 4 4 4
Total 179 192 203 198 195 202 199 220 227 248 217 230 226 193 202 199
London
Short Haul 215 223 222 226 220 221 221 222 222 227 220 222 223 224 221 227
Long Haul 107 123 126 130 126 126 132 122 127 130 126 127 131 123 126 130
All International 322 346 348 356 346 347 353 344 349 357 346 349 354 347 347 357
Domestic 10 10 10 10 10 10 10 10 10 10 10 10 10 10 10 10
Total 332 356 358 366 356 357 363 354 359 367 356 359 364 357 357 367
Other Modelled Airports
Short Haul 179 214 223 220 210 213 214 215 215 214 209 214 218 215 225 228
Long Haul 42 59 70 86 59 61 82 54 60 72 59 63 83 69 76 85
All International 221 273 293 306 269 274 296 269 275 286 268 277 301 284 301 313
Domestic 28 29 29 29 29 29 29 29 29 29 29 29 29 29 29 29
Total 249 302 322 335 298 303 325 298 304 315 297 306 330 313 330 342
National
Short Haul 226 236 236 238 234 236 235 235 235 238 234 235 236 236 235 240
Long Haul 107 123 126 130 126 126 132 122 127 130 126 127 131 123 126 131
All International 333 359 362 368 360 362 367 357 362 368 360 362 367 359 361 371
Domestic 28 29 29 29 29 29 29 29 29 29 29 29 29 29 29 29
Total 361 388 391 397 389 391 396 386 391 397 389 391 396 388 390 400
6.102 With Heathrow Airport North West Runway under capped carbon, Heathrow gains
destinations particularly in the relative decline of Europe and low-cost is king scenarios,
due to a substantial diversification of the airport’s short-haul route network. Across all but
one scenarios the number of destinations served from Heathrow is higher in the carbon
capped than carbon-traded forecasts. This reflects the fact that lower levels of demand
at Heathrow in these scenarios do not drive the same level of concentration on the
thickest routes.
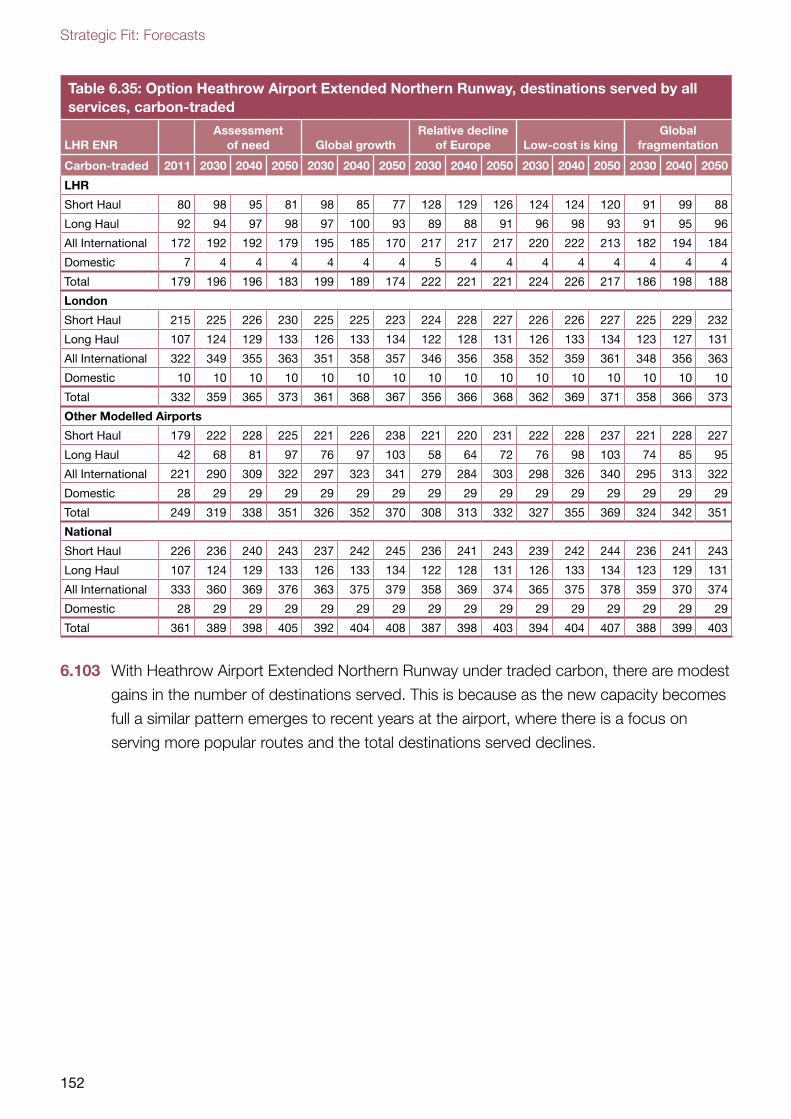
Strategic Fit: Forecasts
152
Table 6.35: Option Heathrow Airport Extended Northern Runway, destinations served by all services, carbon-traded
LHR ENRAssessment
of need Global growthRelative decline
of Europe Low-cost is kingGlobal
fragmentation
Carbon-traded 2011 2030 2040 2050 2030 2040 2050 2030 2040 2050 2030 2040 2050 2030 2040 2050
LHR
Short Haul 80 98 95 81 98 85 77 128 129 126 124 124 120 91 99 88
Long Haul 92 94 97 98 97 100 93 89 88 91 96 98 93 91 95 96
All International 172 192 192 179 195 185 170 217 217 217 220 222 213 182 194 184
Domestic 7 4 4 4 4 4 4 5 4 4 4 4 4 4 4 4
Total 179 196 196 183 199 189 174 222 221 221 224 226 217 186 198 188
London
Short Haul 215 225 226 230 225 225 223 224 228 227 226 226 227 225 229 232
Long Haul 107 124 129 133 126 133 134 122 128 131 126 133 134 123 127 131
All International 322 349 355 363 351 358 357 346 356 358 352 359 361 348 356 363
Domestic 10 10 10 10 10 10 10 10 10 10 10 10 10 10 10 10
Total 332 359 365 373 361 368 367 356 366 368 362 369 371 358 366 373
Other Modelled Airports
Short Haul 179 222 228 225 221 226 238 221 220 231 222 228 237 221 228 227
Long Haul 42 68 81 97 76 97 103 58 64 72 76 98 103 74 85 95
All International 221 290 309 322 297 323 341 279 284 303 298 326 340 295 313 322
Domestic 28 29 29 29 29 29 29 29 29 29 29 29 29 29 29 29
Total 249 319 338 351 326 352 370 308 313 332 327 355 369 324 342 351
National
Short Haul 226 236 240 243 237 242 245 236 241 243 239 242 244 236 241 243
Long Haul 107 124 129 133 126 133 134 122 128 131 126 133 134 123 129 131
All International 333 360 369 376 363 375 379 358 369 374 365 375 378 359 370 374
Domestic 28 29 29 29 29 29 29 29 29 29 29 29 29 29 29 29
Total 361 389 398 405 392 404 408 387 398 403 394 404 407 388 399 403
6.103 With Heathrow Airport Extended Northern Runway under traded carbon, there are modest
gains in the number of destinations served. This is because as the new capacity becomes
full a similar pattern emerges to recent years at the airport, where there is a focus on
serving more popular routes and the total destinations served declines.
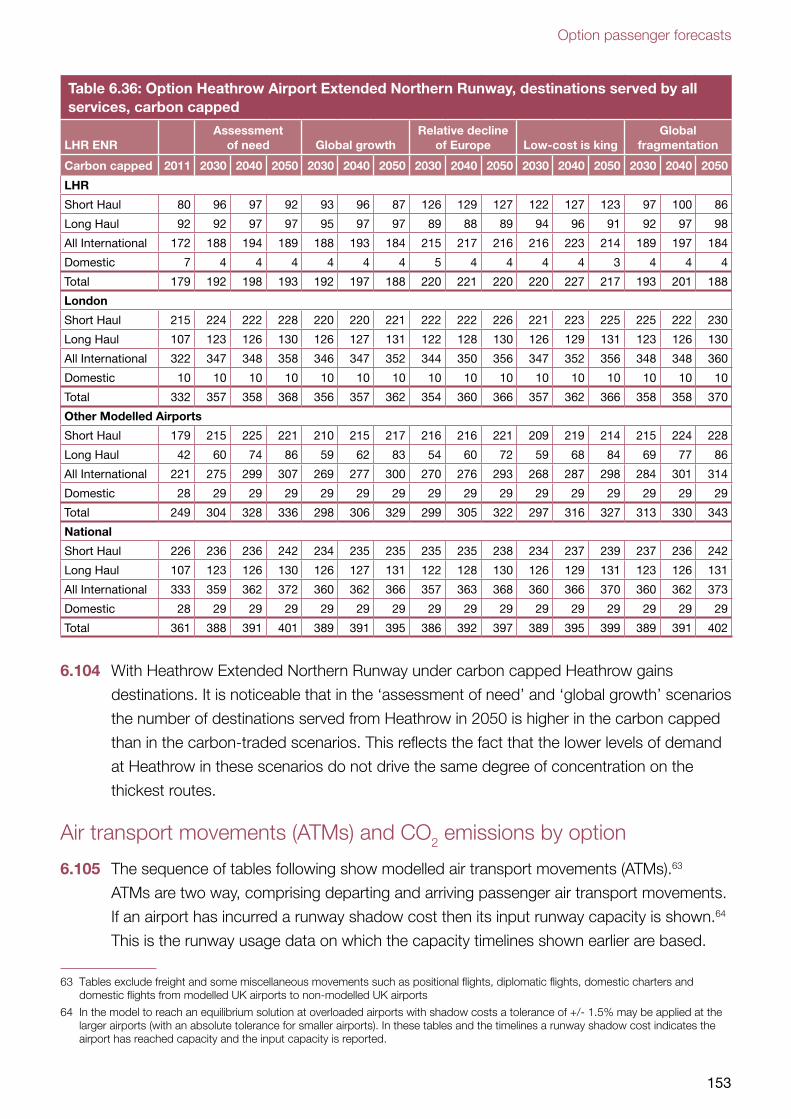
Option passenger forecasts
153
Table 6.36: Option Heathrow Airport Extended Northern Runway, destinations served by all services, carbon capped
LHR ENRAssessment
of need Global growthRelative decline
of Europe Low-cost is kingGlobal
fragmentation
Carbon capped 2011 2030 2040 2050 2030 2040 2050 2030 2040 2050 2030 2040 2050 2030 2040 2050
LHR
Short Haul 80 96 97 92 93 96 87 126 129 127 122 127 123 97 100 86
Long Haul 92 92 97 97 95 97 97 89 88 89 94 96 91 92 97 98
All International 172 188 194 189 188 193 184 215 217 216 216 223 214 189 197 184
Domestic 7 4 4 4 4 4 4 5 4 4 4 4 3 4 4 4
Total 179 192 198 193 192 197 188 220 221 220 220 227 217 193 201 188
London
Short Haul 215 224 222 228 220 220 221 222 222 226 221 223 225 225 222 230
Long Haul 107 123 126 130 126 127 131 122 128 130 126 129 131 123 126 130
All International 322 347 348 358 346 347 352 344 350 356 347 352 356 348 348 360
Domestic 10 10 10 10 10 10 10 10 10 10 10 10 10 10 10 10
Total 332 357 358 368 356 357 362 354 360 366 357 362 366 358 358 370
Other Modelled Airports
Short Haul 179 215 225 221 210 215 217 216 216 221 209 219 214 215 224 228
Long Haul 42 60 74 86 59 62 83 54 60 72 59 68 84 69 77 86
All International 221 275 299 307 269 277 300 270 276 293 268 287 298 284 301 314
Domestic 28 29 29 29 29 29 29 29 29 29 29 29 29 29 29 29
Total 249 304 328 336 298 306 329 299 305 322 297 316 327 313 330 343
National
Short Haul 226 236 236 242 234 235 235 235 235 238 234 237 239 237 236 242
Long Haul 107 123 126 130 126 127 131 122 128 130 126 129 131 123 126 131
All International 333 359 362 372 360 362 366 357 363 368 360 366 370 360 362 373
Domestic 28 29 29 29 29 29 29 29 29 29 29 29 29 29 29 29
Total 361 388 391 401 389 391 395 386 392 397 389 395 399 389 391 402
6.104 With Heathrow Extended Northern Runway under carbon capped Heathrow gains
destinations. It is noticeable that in the ‘assessment of need’ and ‘global growth’ scenarios
the number of destinations served from Heathrow in 2050 is higher in the carbon capped
than in the carbon-traded scenarios. This reflects the fact that the lower levels of demand
at Heathrow in these scenarios do not drive the same degree of concentration on the
thickest routes.
Air transport movements (ATMs) and CO2 emissions by option
6.105 The sequence of tables following show modelled air transport movements (ATMs).63
ATMs are two way, comprising departing and arriving passenger air transport movements.
If an airport has incurred a runway shadow cost then its input runway capacity is shown.64
This is the runway usage data on which the capacity timelines shown earlier are based.
63 Tables exclude freight and some miscellaneous movements such as positional flights, diplomatic flights, domestic charters and domestic flights from modelled UK airports to non-modelled UK airports
64 In the model to reach an equilibrium solution at overloaded airports with shadow costs a tolerance of +/- 1.5% may be applied at the larger airports (with an absolute tolerance for smaller airports). In these tables and the timelines a runway shadow cost indicates the airport has reached capacity and the input capacity is reported.
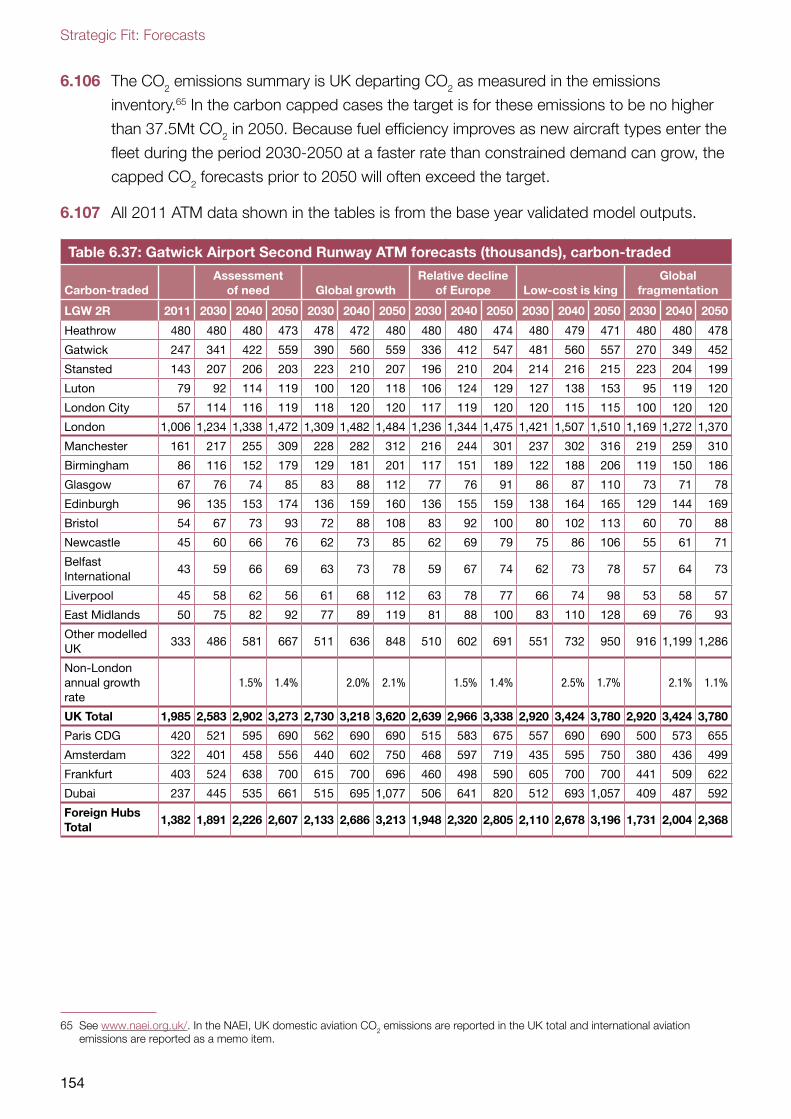
Strategic Fit: Forecasts
154
6.106 The CO2 emissions summary is UK departing CO2 as measured in the emissions
inventory.65 In the carbon capped cases the target is for these emissions to be no higher
than 37.5Mt CO2 in 2050. Because fuel efficiency improves as new aircraft types enter the
fleet during the period 2030-2050 at a faster rate than constrained demand can grow, the
capped CO2 forecasts prior to 2050 will often exceed the target.
6.107 All 2011 ATM data shown in the tables is from the base year validated model outputs.
Table 6.37: Gatwick Airport Second Runway ATM forecasts (thousands), carbon-traded
Carbon-tradedAssessment
of need Global growthRelative decline
of Europe Low-cost is kingGlobal
fragmentation
LGW 2R 2011 2030 2040 2050 2030 2040 2050 2030 2040 2050 2030 2040 2050 2030 2040 2050
Heathrow 480 480 480 473 478 472 480 480 480 474 480 479 471 480 480 478
Gatwick 247 341 422 559 390 560 559 336 412 547 481 560 557 270 349 452
Stansted 143 207 206 203 223 210 207 196 210 204 214 216 215 223 204 199
Luton 79 92 114 119 100 120 118 106 124 129 127 138 153 95 119 120
London City 57 114 116 119 118 120 120 117 119 120 120 115 115 100 120 120
London 1,006 1,234 1,338 1,472 1,309 1,482 1,484 1,236 1,344 1,475 1,421 1,507 1,510 1,169 1,272 1,370
Manchester 161 217 255 309 228 282 312 216 244 301 237 302 316 219 259 310
Birmingham 86 116 152 179 129 181 201 117 151 189 122 188 206 119 150 186
Glasgow 67 76 74 85 83 88 112 77 76 91 86 87 110 73 71 78
Edinburgh 96 135 153 174 136 159 160 136 155 159 138 164 165 129 144 169
Bristol 54 67 73 93 72 88 108 83 92 100 80 102 113 60 70 88
Newcastle 45 60 66 76 62 73 85 62 69 79 75 86 106 55 61 71
Belfast International
43 59 66 69 63 73 78 59 67 74 62 73 78 57 64 73
Liverpool 45 58 62 56 61 68 112 63 78 77 66 74 98 53 58 57
East Midlands 50 75 82 92 77 89 119 81 88 100 83 110 128 69 76 93
Other modelled UK
333 486 581 667 511 636 848 510 602 691 551 732 950 916 1,199 1,286
Non-London annual growth rate
1.5% 1.4% 2.0% 2.1% 1.5% 1.4% 2.5% 1.7% 2.1% 1.1%
UK Total 1,985 2,583 2,902 3,273 2,730 3,218 3,620 2,639 2,966 3,338 2,920 3,424 3,780 2,920 3,424 3,780
Paris CDG 420 521 595 690 562 690 690 515 583 675 557 690 690 500 573 655
Amsterdam 322 401 458 556 440 602 750 468 597 719 435 595 750 380 436 499
Frankfurt 403 524 638 700 615 700 696 460 498 590 605 700 700 441 509 622
Dubai 237 445 535 661 515 695 1,077 506 641 820 512 693 1,057 409 487 592
Foreign Hubs Total
1,382 1,891 2,226 2,607 2,133 2,686 3,213 1,948 2,320 2,805 2,110 2,678 3,196 1,731 2,004 2,368
65 See www.naei.org.uk/. In the NAEI, UK domestic aviation CO2 emissions are reported in the UK total and international aviation emissions are reported as a memo item.
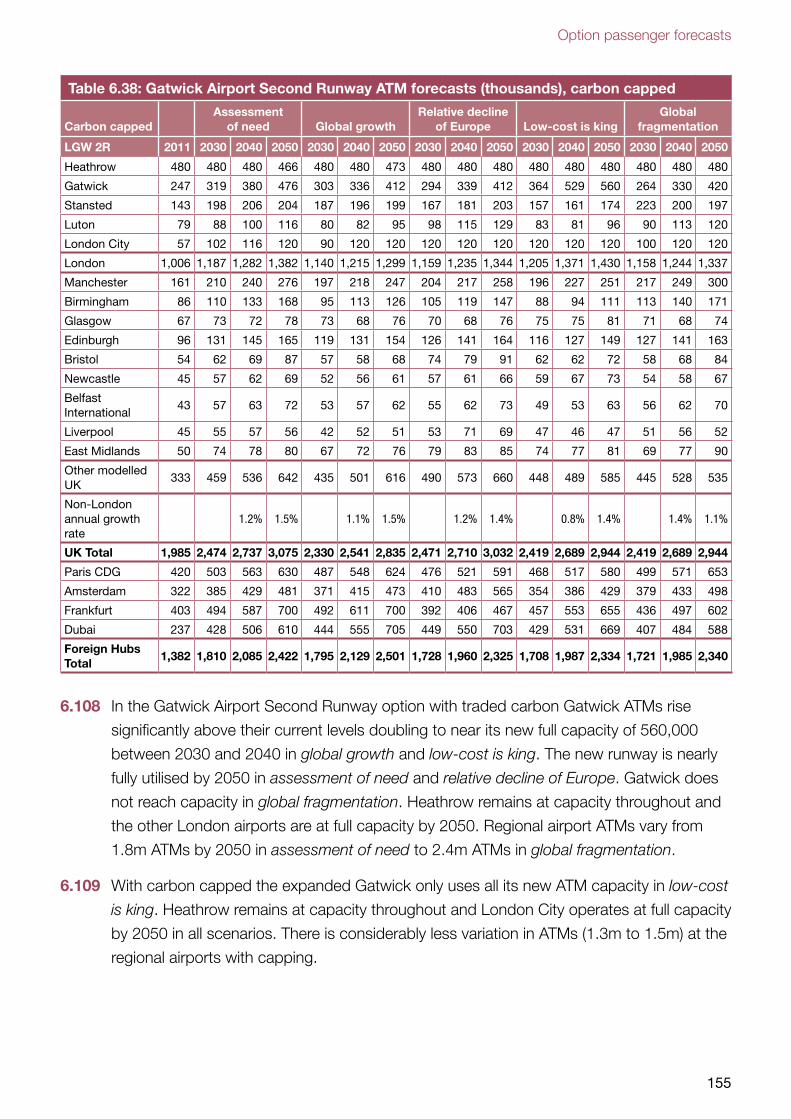
Option passenger forecasts
155
Table 6.38: Gatwick Airport Second Runway ATM forecasts (thousands), carbon capped
Carbon cappedAssessment
of need Global growthRelative decline
of Europe Low-cost is kingGlobal
fragmentation
LGW 2R 2011 2030 2040 2050 2030 2040 2050 2030 2040 2050 2030 2040 2050 2030 2040 2050
Heathrow 480 480 480 466 480 480 473 480 480 480 480 480 480 480 480 480
Gatwick 247 319 380 476 303 336 412 294 339 412 364 529 560 264 330 420
Stansted 143 198 206 204 187 196 199 167 181 203 157 161 174 223 200 197
Luton 79 88 100 116 80 82 95 98 115 129 83 81 96 90 113 120
London City 57 102 116 120 90 120 120 120 120 120 120 120 120 100 120 120
London 1,006 1,187 1,282 1,382 1,140 1,215 1,299 1,159 1,235 1,344 1,205 1,371 1,430 1,158 1,244 1,337
Manchester 161 210 240 276 197 218 247 204 217 258 196 227 251 217 249 300
Birmingham 86 110 133 168 95 113 126 105 119 147 88 94 111 113 140 171
Glasgow 67 73 72 78 73 68 76 70 68 76 75 75 81 71 68 74
Edinburgh 96 131 145 165 119 131 154 126 141 164 116 127 149 127 141 163
Bristol 54 62 69 87 57 58 68 74 79 91 62 62 72 58 68 84
Newcastle 45 57 62 69 52 56 61 57 61 66 59 67 73 54 58 67
Belfast International
43 57 63 72 53 57 62 55 62 73 49 53 63 56 62 70
Liverpool 45 55 57 56 42 52 51 53 71 69 47 46 47 51 56 52
East Midlands 50 74 78 80 67 72 76 79 83 85 74 77 81 69 77 90
Other modelled UK
333 459 536 642 435 501 616 490 573 660 448 489 585 445 528 535
Non-London annual growth rate
1.2% 1.5% 1.1% 1.5% 1.2% 1.4% 0.8% 1.4% 1.4% 1.1%
UK Total 1,985 2,474 2,737 3,075 2,330 2,541 2,835 2,471 2,710 3,032 2,419 2,689 2,944 2,419 2,689 2,944
Paris CDG 420 503 563 630 487 548 624 476 521 591 468 517 580 499 571 653
Amsterdam 322 385 429 481 371 415 473 410 483 565 354 386 429 379 433 498
Frankfurt 403 494 587 700 492 611 700 392 406 467 457 553 655 436 497 602
Dubai 237 428 506 610 444 555 705 449 550 703 429 531 669 407 484 588
Foreign Hubs Total
1,382 1,810 2,085 2,422 1,795 2,129 2,501 1,728 1,960 2,325 1,708 1,987 2,334 1,721 1,985 2,340
6.108 In the Gatwick Airport Second Runway option with traded carbon Gatwick ATMs rise
significantly above their current levels doubling to near its new full capacity of 560,000
between 2030 and 2040 in global growth and low-cost is king. The new runway is nearly
fully utilised by 2050 in assessment of need and relative decline of Europe. Gatwick does
not reach capacity in global fragmentation. Heathrow remains at capacity throughout and
the other London airports are at full capacity by 2050. Regional airport ATMs vary from
1.8m ATMs by 2050 in assessment of need to 2.4m ATMs in global fragmentation.
6.109 With carbon capped the expanded Gatwick only uses all its new ATM capacity in low-cost
is king. Heathrow remains at capacity throughout and London City operates at full capacity
by 2050 in all scenarios. There is considerably less variation in ATMs (1.3m to 1.5m) at the
regional airports with capping.
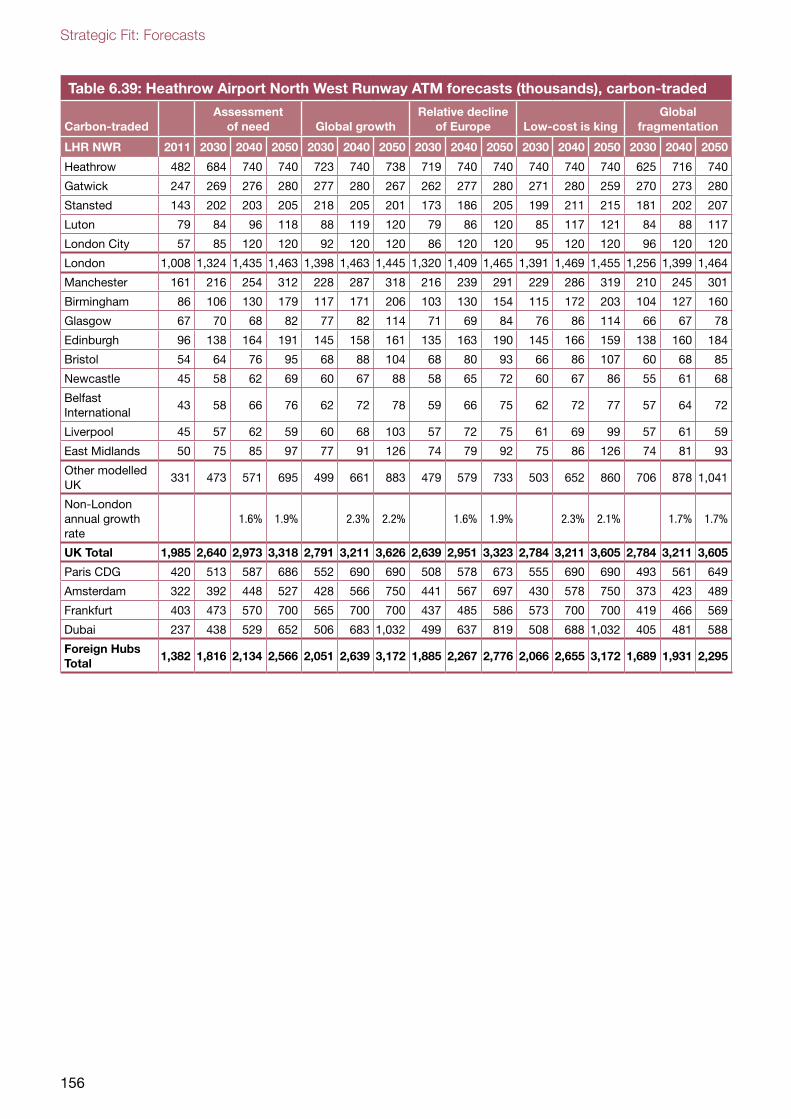
Strategic Fit: Forecasts
156
Table 6.39: Heathrow Airport North West Runway ATM forecasts (thousands), carbon-traded
Carbon-tradedAssessment
of need Global growthRelative decline
of Europe Low-cost is kingGlobal
fragmentation
LHR NWR 2011 2030 2040 2050 2030 2040 2050 2030 2040 2050 2030 2040 2050 2030 2040 2050
Heathrow 482 684 740 740 723 740 738 719 740 740 740 740 740 625 716 740
Gatwick 247 269 276 280 277 280 267 262 277 280 271 280 259 270 273 280
Stansted 143 202 203 205 218 205 201 173 186 205 199 211 215 181 202 207
Luton 79 84 96 118 88 119 120 79 86 120 85 117 121 84 88 117
London City 57 85 120 120 92 120 120 86 120 120 95 120 120 96 120 120
London 1,008 1,324 1,435 1,463 1,398 1,463 1,445 1,320 1,409 1,465 1,391 1,469 1,455 1,256 1,399 1,464
Manchester 161 216 254 312 228 287 318 216 239 291 229 286 319 210 245 301
Birmingham 86 106 130 179 117 171 206 103 130 154 115 172 203 104 127 160
Glasgow 67 70 68 82 77 82 114 71 69 84 76 86 114 66 67 78
Edinburgh 96 138 164 191 145 158 161 135 163 190 145 166 159 138 160 184
Bristol 54 64 76 95 68 88 104 68 80 93 66 86 107 60 68 85
Newcastle 45 58 62 69 60 67 88 58 65 72 60 67 86 55 61 68
Belfast International
43 58 66 76 62 72 78 59 66 75 62 72 77 57 64 72
Liverpool 45 57 62 59 60 68 103 57 72 75 61 69 99 57 61 59
East Midlands 50 75 85 97 77 91 126 74 79 92 75 86 126 74 81 93
Other modelled UK
331 473 571 695 499 661 883 479 579 733 503 652 860 706 878 1,041
Non-London annual growth rate
1.6% 1.9% 2.3% 2.2% 1.6% 1.9% 2.3% 2.1% 1.7% 1.7%
UK Total 1,985 2,640 2,973 3,318 2,791 3,211 3,626 2,639 2,951 3,323 2,784 3,211 3,605 2,784 3,211 3,605
Paris CDG 420 513 587 686 552 690 690 508 578 673 555 690 690 493 561 649
Amsterdam 322 392 448 527 428 566 750 441 567 697 430 578 750 373 423 489
Frankfurt 403 473 570 700 565 700 700 437 485 586 573 700 700 419 466 569
Dubai 237 438 529 652 506 683 1,032 499 637 819 508 688 1,032 405 481 588
Foreign Hubs Total
1,382 1,816 2,134 2,566 2,051 2,639 3,172 1,885 2,267 2,776 2,066 2,655 3,172 1,689 1,931 2,295
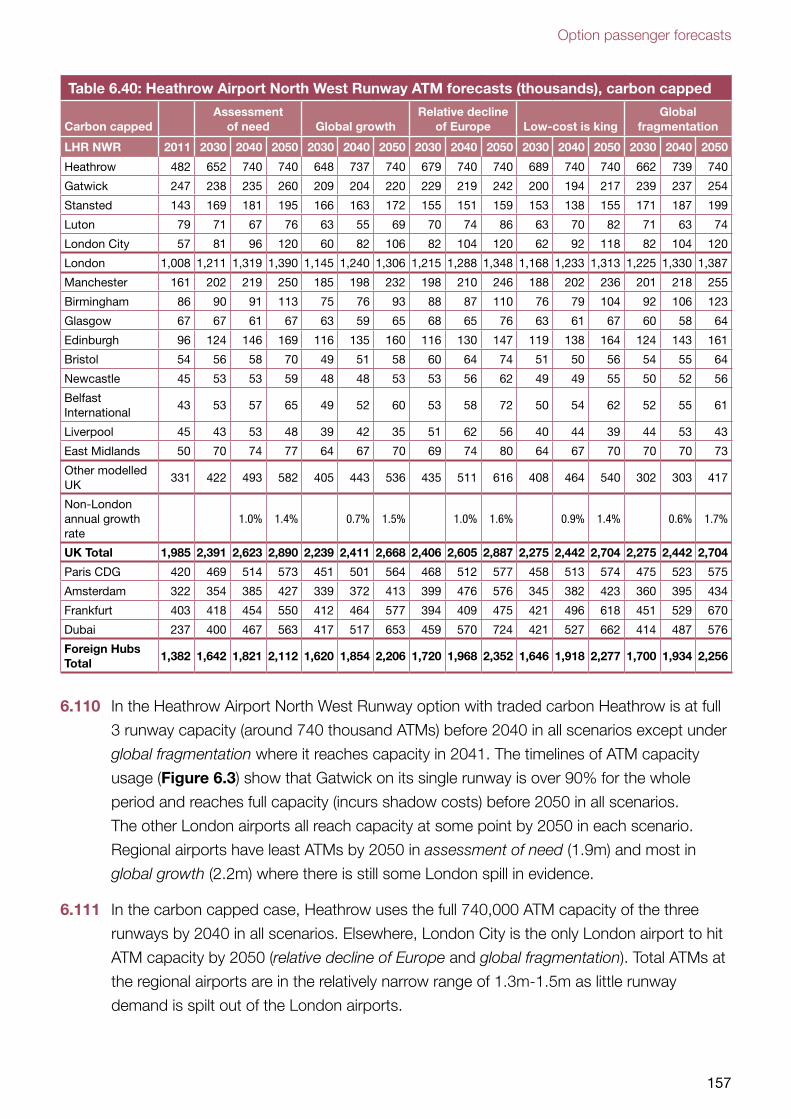
Option passenger forecasts
157
Table 6.40: Heathrow Airport North West Runway ATM forecasts (thousands), carbon capped
Carbon cappedAssessment
of need Global growthRelative decline
of Europe Low-cost is kingGlobal
fragmentation
LHR NWR 2011 2030 2040 2050 2030 2040 2050 2030 2040 2050 2030 2040 2050 2030 2040 2050
Heathrow 482 652 740 740 648 737 740 679 740 740 689 740 740 662 739 740
Gatwick 247 238 235 260 209 204 220 229 219 242 200 194 217 239 237 254
Stansted 143 169 181 195 166 163 172 155 151 159 153 138 155 171 187 199
Luton 79 71 67 76 63 55 69 70 74 86 63 70 82 71 63 74
London City 57 81 96 120 60 82 106 82 104 120 62 92 118 82 104 120
London 1,008 1,211 1,319 1,390 1,145 1,240 1,306 1,215 1,288 1,348 1,168 1,233 1,313 1,225 1,330 1,387
Manchester 161 202 219 250 185 198 232 198 210 246 188 202 236 201 218 255
Birmingham 86 90 91 113 75 76 93 88 87 110 76 79 104 92 106 123
Glasgow 67 67 61 67 63 59 65 68 65 76 63 61 67 60 58 64
Edinburgh 96 124 146 169 116 135 160 116 130 147 119 138 164 124 143 161
Bristol 54 56 58 70 49 51 58 60 64 74 51 50 56 54 55 64
Newcastle 45 53 53 59 48 48 53 53 56 62 49 49 55 50 52 56
Belfast International
43 53 57 65 49 52 60 53 58 72 50 54 62 52 55 61
Liverpool 45 43 53 48 39 42 35 51 62 56 40 44 39 44 53 43
East Midlands 50 70 74 77 64 67 70 69 74 80 64 67 70 70 70 73
Other modelled UK
331 422 493 582 405 443 536 435 511 616 408 464 540 302 303 417
Non-London annual growth rate
1.0% 1.4% 0.7% 1.5% 1.0% 1.6% 0.9% 1.4% 0.6% 1.7%
UK Total 1,985 2,391 2,623 2,890 2,239 2,411 2,668 2,406 2,605 2,887 2,275 2,442 2,704 2,275 2,442 2,704
Paris CDG 420 469 514 573 451 501 564 468 512 577 458 513 574 475 523 575
Amsterdam 322 354 385 427 339 372 413 399 476 576 345 382 423 360 395 434
Frankfurt 403 418 454 550 412 464 577 394 409 475 421 496 618 451 529 670
Dubai 237 400 467 563 417 517 653 459 570 724 421 527 662 414 487 576
Foreign Hubs Total
1,382 1,642 1,821 2,112 1,620 1,854 2,206 1,720 1,968 2,352 1,646 1,918 2,277 1,700 1,934 2,256
6.110 In the Heathrow Airport North West Runway option with traded carbon Heathrow is at full
3 runway capacity (around 740 thousand ATMs) before 2040 in all scenarios except under
global fragmentation where it reaches capacity in 2041. The timelines of ATM capacity
usage (Figure 6.3) show that Gatwick on its single runway is over 90% for the whole
period and reaches full capacity (incurs shadow costs) before 2050 in all scenarios.
The other London airports all reach capacity at some point by 2050 in each scenario.
Regional airports have least ATMs by 2050 in assessment of need (1.9m) and most in
global growth (2.2m) where there is still some London spill in evidence.
6.111 In the carbon capped case, Heathrow uses the full 740,000 ATM capacity of the three
runways by 2040 in all scenarios. Elsewhere, London City is the only London airport to hit
ATM capacity by 2050 (relative decline of Europe and global fragmentation). Total ATMs at
the regional airports are in the relatively narrow range of 1.3m-1.5m as little runway
demand is spilt out of the London airports.
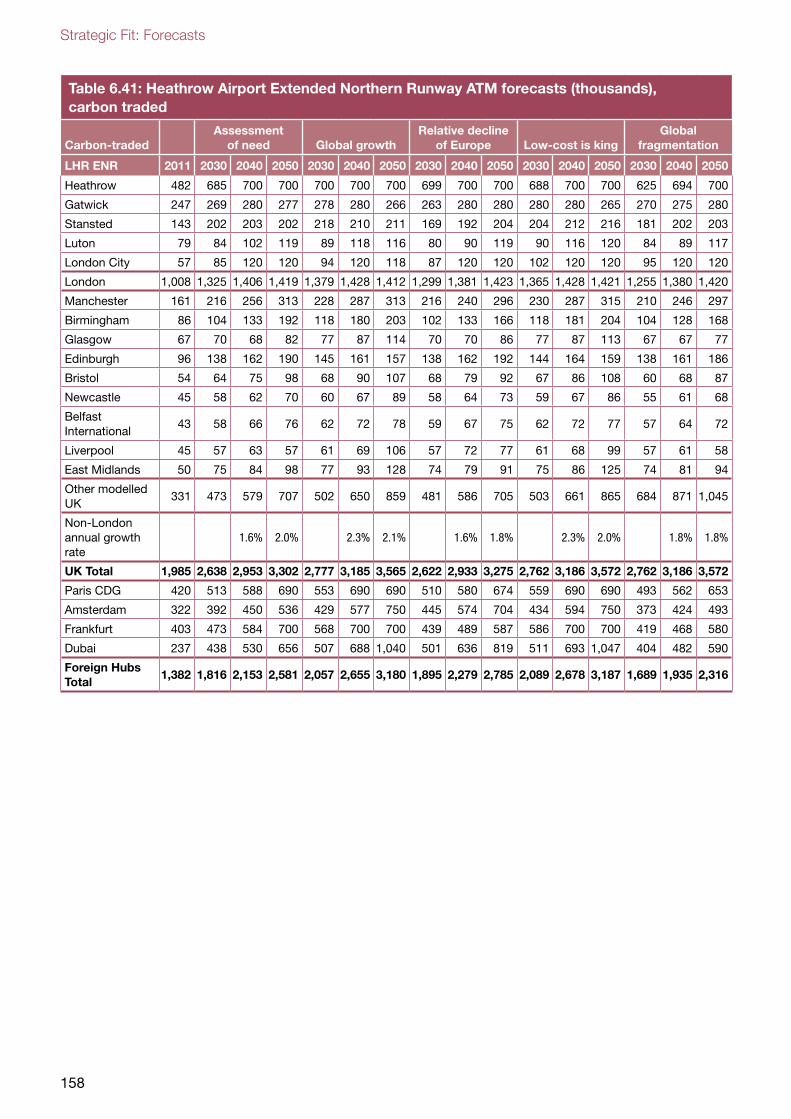
Strategic Fit: Forecasts
158
Table 6.41: Heathrow Airport Extended Northern Runway ATM forecasts (thousands), carbon traded
Carbon-tradedAssessment
of need Global growthRelative decline
of Europe Low-cost is kingGlobal
fragmentation
LHR ENR 2011 2030 2040 2050 2030 2040 2050 2030 2040 2050 2030 2040 2050 2030 2040 2050
Heathrow 482 685 700 700 700 700 700 699 700 700 688 700 700 625 694 700
Gatwick 247 269 280 277 278 280 266 263 280 280 280 280 265 270 275 280
Stansted 143 202 203 202 218 210 211 169 192 204 204 212 216 181 202 203
Luton 79 84 102 119 89 118 116 80 90 119 90 116 120 84 89 117
London City 57 85 120 120 94 120 118 87 120 120 102 120 120 95 120 120
London 1,008 1,325 1,406 1,419 1,379 1,428 1,412 1,299 1,381 1,423 1,365 1,428 1,421 1,255 1,380 1,420
Manchester 161 216 256 313 228 287 313 216 240 296 230 287 315 210 246 297
Birmingham 86 104 133 192 118 180 203 102 133 166 118 181 204 104 128 168
Glasgow 67 70 68 82 77 87 114 70 70 86 77 87 113 67 67 77
Edinburgh 96 138 162 190 145 161 157 138 162 192 144 164 159 138 161 186
Bristol 54 64 75 98 68 90 107 68 79 92 67 86 108 60 68 87
Newcastle 45 58 62 70 60 67 89 58 64 73 59 67 86 55 61 68
Belfast International
43 58 66 76 62 72 78 59 67 75 62 72 77 57 64 72
Liverpool 45 57 63 57 61 69 106 57 72 77 61 68 99 57 61 58
East Midlands 50 75 84 98 77 93 128 74 79 91 75 86 125 74 81 94
Other modelled UK
331 473 579 707 502 650 859 481 586 705 503 661 865 684 871 1,045
Non-London annual growth rate
1.6% 2.0% 2.3% 2.1% 1.6% 1.8% 2.3% 2.0% 1.8% 1.8%
UK Total 1,985 2,638 2,953 3,302 2,777 3,185 3,565 2,622 2,933 3,275 2,762 3,186 3,572 2,762 3,186 3,572
Paris CDG 420 513 588 690 553 690 690 510 580 674 559 690 690 493 562 653
Amsterdam 322 392 450 536 429 577 750 445 574 704 434 594 750 373 424 493
Frankfurt 403 473 584 700 568 700 700 439 489 587 586 700 700 419 468 580
Dubai 237 438 530 656 507 688 1,040 501 636 819 511 693 1,047 404 482 590
Foreign Hubs Total
1,382 1,816 2,153 2,581 2,057 2,655 3,180 1,895 2,279 2,785 2,089 2,678 3,187 1,689 1,935 2,316
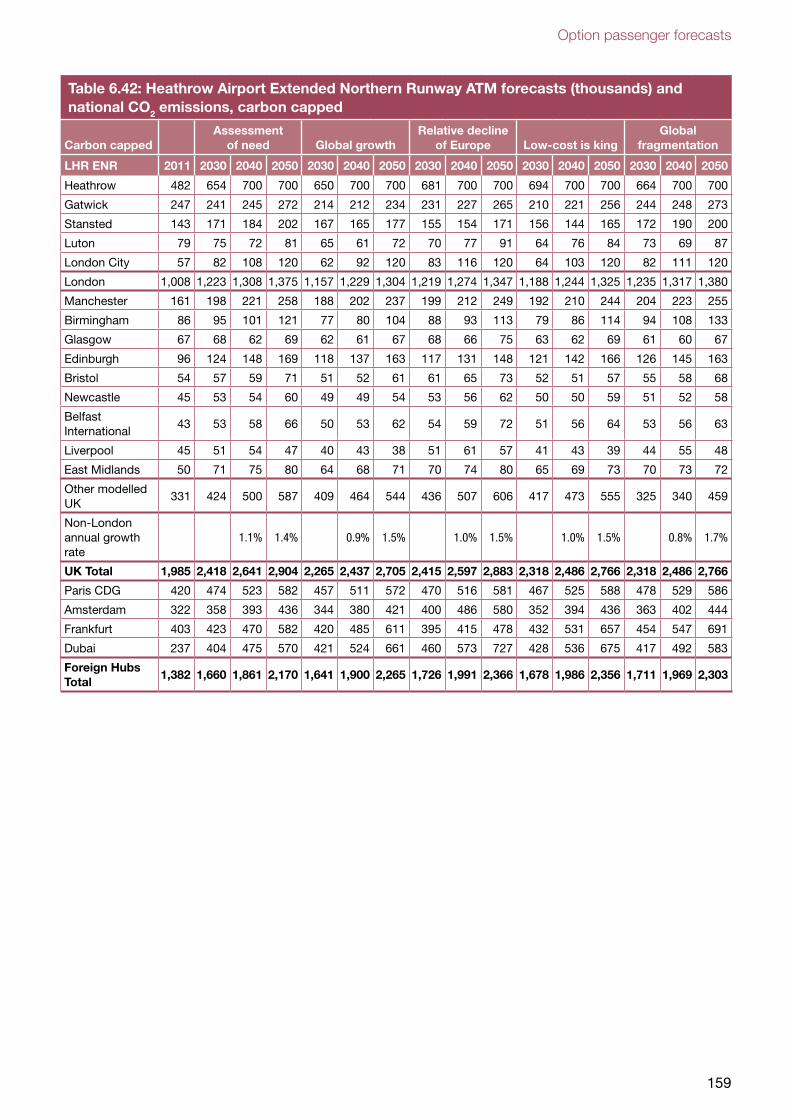
Option passenger forecasts
159
Table 6.42: Heathrow Airport Extended Northern Runway ATM forecasts (thousands) and national CO2 emissions, carbon capped
Carbon cappedAssessment
of need Global growthRelative decline
of Europe Low-cost is kingGlobal
fragmentation
LHR ENR 2011 2030 2040 2050 2030 2040 2050 2030 2040 2050 2030 2040 2050 2030 2040 2050
Heathrow 482 654 700 700 650 700 700 681 700 700 694 700 700 664 700 700
Gatwick 247 241 245 272 214 212 234 231 227 265 210 221 256 244 248 273
Stansted 143 171 184 202 167 165 177 155 154 171 156 144 165 172 190 200
Luton 79 75 72 81 65 61 72 70 77 91 64 76 84 73 69 87
London City 57 82 108 120 62 92 120 83 116 120 64 103 120 82 111 120
London 1,008 1,223 1,308 1,375 1,157 1,229 1,304 1,219 1,274 1,347 1,188 1,244 1,325 1,235 1,317 1,380
Manchester 161 198 221 258 188 202 237 199 212 249 192 210 244 204 223 255
Birmingham 86 95 101 121 77 80 104 88 93 113 79 86 114 94 108 133
Glasgow 67 68 62 69 62 61 67 68 66 75 63 62 69 61 60 67
Edinburgh 96 124 148 169 118 137 163 117 131 148 121 142 166 126 145 163
Bristol 54 57 59 71 51 52 61 61 65 73 52 51 57 55 58 68
Newcastle 45 53 54 60 49 49 54 53 56 62 50 50 59 51 52 58
Belfast International
43 53 58 66 50 53 62 54 59 72 51 56 64 53 56 63
Liverpool 45 51 54 47 40 43 38 51 61 57 41 43 39 44 55 48
East Midlands 50 71 75 80 64 68 71 70 74 80 65 69 73 70 73 72
Other modelled UK
331 424 500 587 409 464 544 436 507 606 417 473 555 325 340 459
Non-London annual growth rate
1.1% 1.4% 0.9% 1.5% 1.0% 1.5% 1.0% 1.5% 0.8% 1.7%
UK Total 1,985 2,418 2,641 2,904 2,265 2,437 2,705 2,415 2,597 2,883 2,318 2,486 2,766 2,318 2,486 2,766
Paris CDG 420 474 523 582 457 511 572 470 516 581 467 525 588 478 529 586
Amsterdam 322 358 393 436 344 380 421 400 486 580 352 394 436 363 402 444
Frankfurt 403 423 470 582 420 485 611 395 415 478 432 531 657 454 547 691
Dubai 237 404 475 570 421 524 661 460 573 727 428 536 675 417 492 583
Foreign Hubs Total
1,382 1,660 1,861 2,170 1,641 1,900 2,265 1,726 1,991 2,366 1,678 1,986 2,356 1,711 1,969 2,303
Strategic Fit: Forecasts
160
6.112 In the Heathrow Airport Extended Northern Runway option with traded carbon, Heathrow
is at full capacity (700 thousand ATMs) before 2040 in all scenarios. The timelines of ATM
capacity usage (Figure 6.5) show that the single runway Gatwick reaches capacity in all
scenarios between 2030 and 2040. All the other London airports reach capacity at some
point by 2050 in each scenario. Regional airports in 2050 have least ATMs in relative
decline of Europe (1.9m) and most in global growth (2.2m) where there is still London spill
in evidence.
6.113 In the carbon capped case, Heathrow uses the full 700,000 ATM capacity of the Heathrow
Airport Extended Northern Runway option by 2040 in all scenarios. London City with its
short-haul network reaches ATM capacity by 2050 (relative decline of Europe and global
fragmentation). The other London airports have some ATM capacity, although Stansted’s
terminal is full by 2050. Total ATMs at the regional airports are in the narrow range of
1.4m-1.5m as little runway demand is spilt out of the London airports.
6.114 The passenger and seat-kilometres outputs in the sequence of tables below are two-way
and arguably provide a more precise driver of the emissions forecasts than simple
numbers of ATMs. Passenger-kilometres, seats and seat-kilometres are presented both in
total for each capacity option, carbon-traded and carbon capped. The base forecasts of
these outputs (as presented in Table 5.13 and Table 5.14 in the previous chapter) are
then subtracted to show the net change attributable to each capacity option. All these
forecasts are national, not airport specific totals.
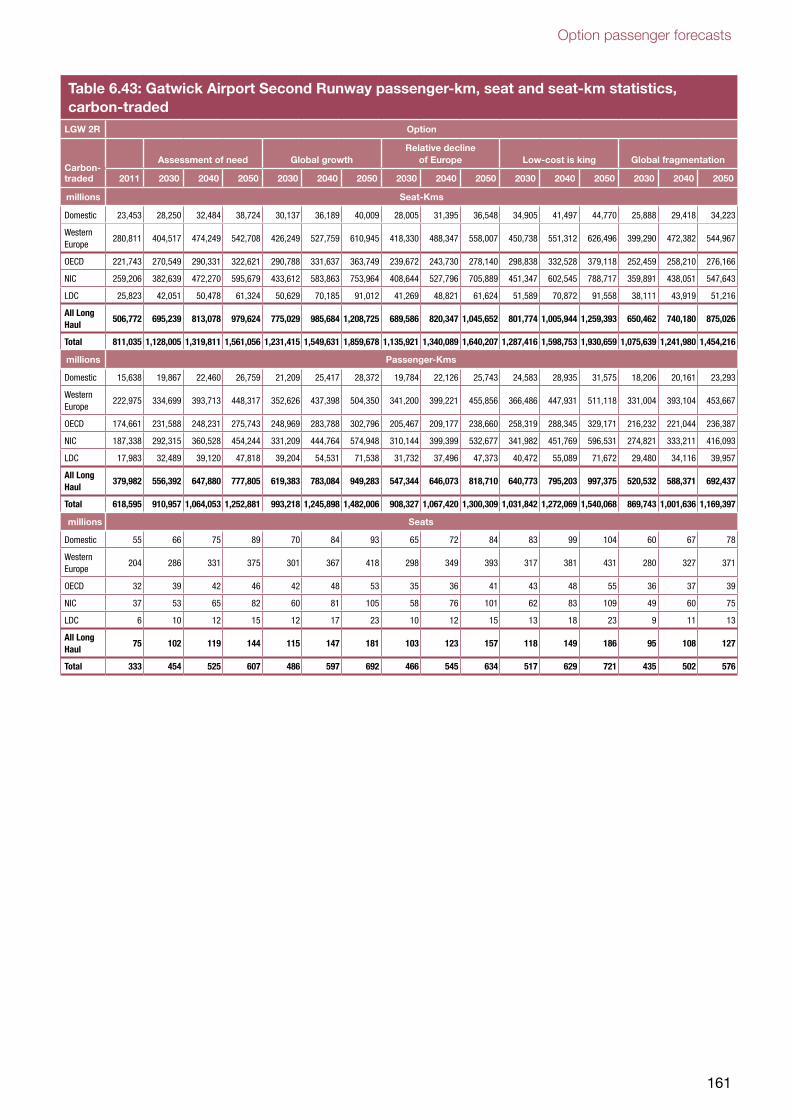
Option passenger forecasts
161
Table 6.43: Gatwick Airport Second Runway passenger-km, seat and seat-km statistics, carbon-traded
LGW 2R Option
Carbon-traded
Assessment of need Global growthRelative decline
of Europe Low-cost is king Global fragmentation
2011 2030 2040 2050 2030 2040 2050 2030 2040 2050 2030 2040 2050 2030 2040 2050
millions Seat-Kms
Domestic 23,453 28,250 32,484 38,724 30,137 36,189 40,009 28,005 31,395 36,548 34,905 41,497 44,770 25,888 29,418 34,223
Western Europe
280,811 404,517 474,249 542,708 426,249 527,759 610,945 418,330 488,347 558,007 450,738 551,312 626,496 399,290 472,382 544,967
OECD 221,743 270,549 290,331 322,621 290,788 331,637 363,749 239,672 243,730 278,140 298,838 332,528 379,118 252,459 258,210 276,166
NIC 259,206 382,639 472,270 595,679 433,612 583,863 753,964 408,644 527,796 705,889 451,347 602,545 788,717 359,891 438,051 547,643
LDC 25,823 42,051 50,478 61,324 50,629 70,185 91,012 41,269 48,821 61,624 51,589 70,872 91,558 38,111 43,919 51,216
All Long Haul
506,772 695,239 813,078 979,624 775,029 985,684 1,208,725 689,586 820,347 1,045,652 801,774 1,005,944 1,259,393 650,462 740,180 875,026
Total 811,035 1,128,005 1,319,811 1,561,056 1,231,415 1,549,631 1,859,678 1,135,921 1,340,089 1,640,207 1,287,416 1,598,753 1,930,659 1,075,639 1,241,980 1,454,216
millions Passenger-Kms
Domestic 15,638 19,867 22,460 26,759 21,209 25,417 28,372 19,784 22,126 25,743 24,583 28,935 31,575 18,206 20,161 23,293
Western Europe
222,975 334,699 393,713 448,317 352,626 437,398 504,350 341,200 399,221 455,856 366,486 447,931 511,118 331,004 393,104 453,667
OECD 174,661 231,588 248,231 275,743 248,969 283,788 302,796 205,467 209,177 238,660 258,319 288,345 329,171 216,232 221,044 236,387
NIC 187,338 292,315 360,528 454,244 331,209 444,764 574,948 310,144 399,399 532,677 341,982 451,769 596,531 274,821 333,211 416,093
LDC 17,983 32,489 39,120 47,818 39,204 54,531 71,538 31,732 37,496 47,373 40,472 55,089 71,672 29,480 34,116 39,957
All Long Haul
379,982 556,392 647,880 777,805 619,383 783,084 949,283 547,344 646,073 818,710 640,773 795,203 997,375 520,532 588,371 692,437
Total 618,595 910,957 1,064,053 1,252,881 993,218 1,245,898 1,482,006 908,327 1,067,420 1,300,309 1,031,842 1,272,069 1,540,068 869,743 1,001,636 1,169,397
millions Seats
Domestic 55 66 75 89 70 84 93 65 72 84 83 99 104 60 67 78
Western Europe
204 286 331 375 301 367 418 298 349 393 317 381 431 280 327 371
OECD 32 39 42 46 42 48 53 35 36 41 43 48 55 36 37 39
NIC 37 53 65 82 60 81 105 58 76 101 62 83 109 49 60 75
LDC 6 10 12 15 12 17 23 10 12 15 13 18 23 9 11 13
All Long Haul
75 102 119 144 115 147 181 103 123 157 118 149 186 95 108 127
Total 333 454 525 607 486 597 692 466 545 634 517 629 721 435 502 576
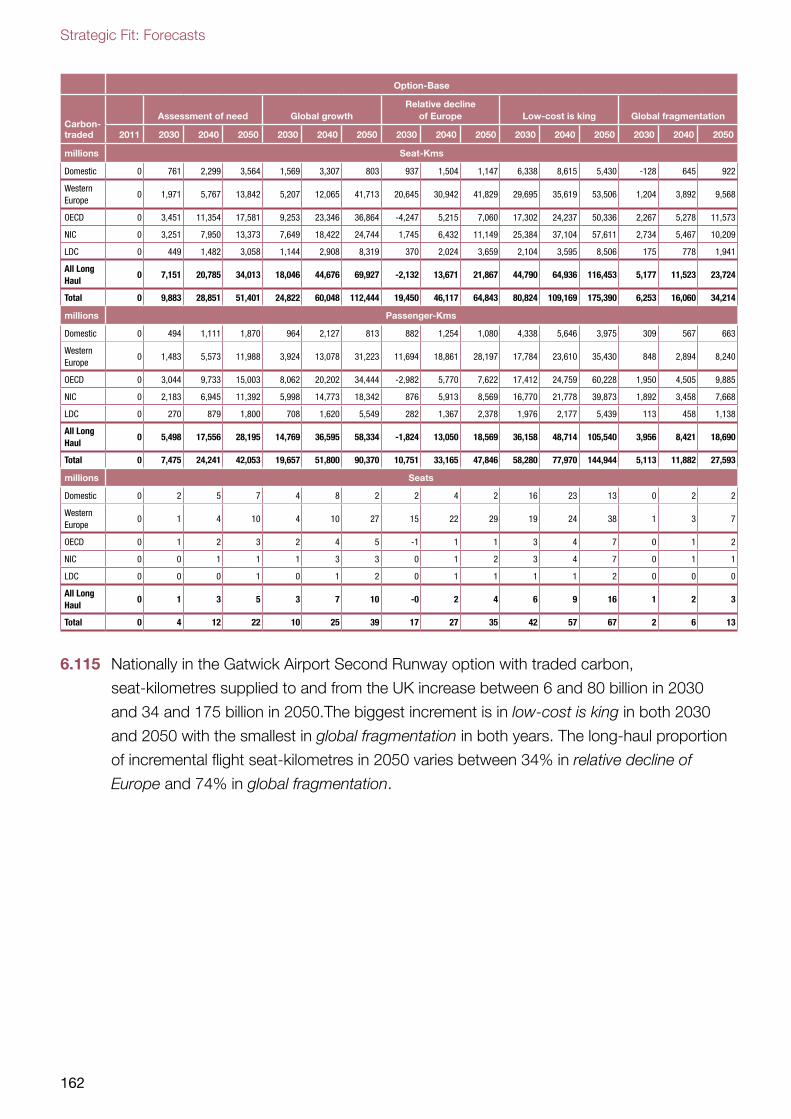
Strategic Fit: Forecasts
162
Option-Base
Carbon-traded
Assessment of need Global growthRelative decline
of Europe Low-cost is king Global fragmentation
2011 2030 2040 2050 2030 2040 2050 2030 2040 2050 2030 2040 2050 2030 2040 2050
millions Seat-Kms
Domestic 0 761 2,299 3,564 1,569 3,307 803 937 1,504 1,147 6,338 8,615 5,430 -128 645 922
Western Europe
0 1,971 5,767 13,842 5,207 12,065 41,713 20,645 30,942 41,829 29,695 35,619 53,506 1,204 3,892 9,568
OECD 0 3,451 11,354 17,581 9,253 23,346 36,864 -4,247 5,215 7,060 17,302 24,237 50,336 2,267 5,278 11,573
NIC 0 3,251 7,950 13,373 7,649 18,422 24,744 1,745 6,432 11,149 25,384 37,104 57,611 2,734 5,467 10,209
LDC 0 449 1,482 3,058 1,144 2,908 8,319 370 2,024 3,659 2,104 3,595 8,506 175 778 1,941
All Long Haul
0 7,151 20,785 34,013 18,046 44,676 69,927 -2,132 13,671 21,867 44,790 64,936 116,453 5,177 11,523 23,724
Total 0 9,883 28,851 51,401 24,822 60,048 112,444 19,450 46,117 64,843 80,824 109,169 175,390 6,253 16,060 34,214
millions Passenger-Kms
Domestic 0 494 1,111 1,870 964 2,127 813 882 1,254 1,080 4,338 5,646 3,975 309 567 663
Western Europe
0 1,483 5,573 11,988 3,924 13,078 31,223 11,694 18,861 28,197 17,784 23,610 35,430 848 2,894 8,240
OECD 0 3,044 9,733 15,003 8,062 20,202 34,444 -2,982 5,770 7,622 17,412 24,759 60,228 1,950 4,505 9,885
NIC 0 2,183 6,945 11,392 5,998 14,773 18,342 876 5,913 8,569 16,770 21,778 39,873 1,892 3,458 7,668
LDC 0 270 879 1,800 708 1,620 5,549 282 1,367 2,378 1,976 2,177 5,439 113 458 1,138
All Long Haul
0 5,498 17,556 28,195 14,769 36,595 58,334 -1,824 13,050 18,569 36,158 48,714 105,540 3,956 8,421 18,690
Total 0 7,475 24,241 42,053 19,657 51,800 90,370 10,751 33,165 47,846 58,280 77,970 144,944 5,113 11,882 27,593
millions Seats
Domestic 0 2 5 7 4 8 2 2 4 2 16 23 13 0 2 2
Western Europe
0 1 4 10 4 10 27 15 22 29 19 24 38 1 3 7
OECD 0 1 2 3 2 4 5 -1 1 1 3 4 7 0 1 2
NIC 0 0 1 1 1 3 3 0 1 2 3 4 7 0 1 1
LDC 0 0 0 1 0 1 2 0 1 1 1 1 2 0 0 0
All Long Haul
0 1 3 5 3 7 10 -0 2 4 6 9 16 1 2 3
Total 0 4 12 22 10 25 39 17 27 35 42 57 67 2 6 13
6.115 Nationally in the Gatwick Airport Second Runway option with traded carbon,
seat-kilometres supplied to and from the UK increase between 6 and 80 billion in 2030
and 34 and 175 billion in 2050.The biggest increment is in low-cost is king in both 2030
and 2050 with the smallest in global fragmentation in both years. The long-haul proportion
of incremental flight seat-kilometres in 2050 varies between 34% in relative decline of
Europe and 74% in global fragmentation.
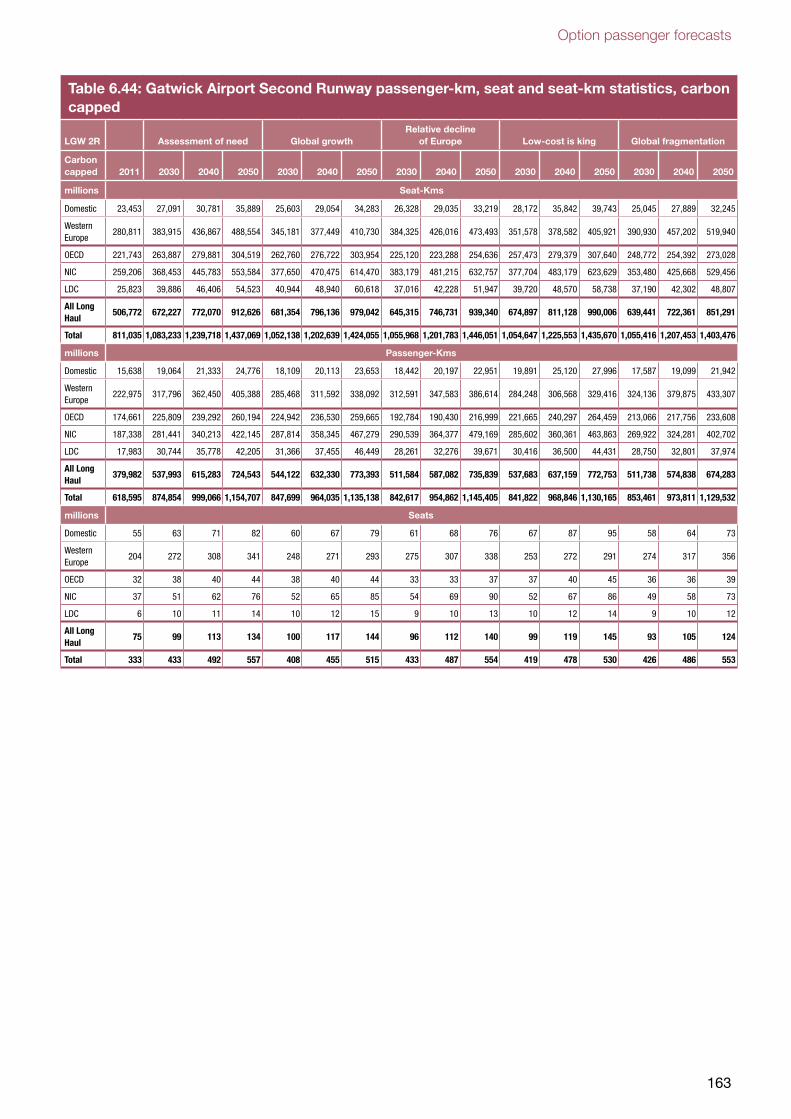
Option passenger forecasts
163
Table 6.44: Gatwick Airport Second Runway passenger-km, seat and seat-km statistics, carbon capped
LGW 2R Assessment of need Global growthRelative decline
of Europe Low-cost is king Global fragmentation
Carbon capped 2011 2030 2040 2050 2030 2040 2050 2030 2040 2050 2030 2040 2050 2030 2040 2050
millions Seat-Kms
Domestic 23,453 27,091 30,781 35,889 25,603 29,054 34,283 26,328 29,035 33,219 28,172 35,842 39,743 25,045 27,889 32,245
Western Europe
280,811 383,915 436,867 488,554 345,181 377,449 410,730 384,325 426,016 473,493 351,578 378,582 405,921 390,930 457,202 519,940
OECD 221,743 263,887 279,881 304,519 262,760 276,722 303,954 225,120 223,288 254,636 257,473 279,379 307,640 248,772 254,392 273,028
NIC 259,206 368,453 445,783 553,584 377,650 470,475 614,470 383,179 481,215 632,757 377,704 483,179 623,629 353,480 425,668 529,456
LDC 25,823 39,886 46,406 54,523 40,944 48,940 60,618 37,016 42,228 51,947 39,720 48,570 58,738 37,190 42,302 48,807
All Long Haul
506,772 672,227 772,070 912,626 681,354 796,136 979,042 645,315 746,731 939,340 674,897 811,128 990,006 639,441 722,361 851,291
Total 811,035 1,083,233 1,239,718 1,437,069 1,052,138 1,202,639 1,424,055 1,055,968 1,201,783 1,446,051 1,054,647 1,225,553 1,435,670 1,055,416 1,207,453 1,403,476
millions Passenger-Kms
Domestic 15,638 19,064 21,333 24,776 18,109 20,113 23,653 18,442 20,197 22,951 19,891 25,120 27,996 17,587 19,099 21,942
Western Europe
222,975 317,796 362,450 405,388 285,468 311,592 338,092 312,591 347,583 386,614 284,248 306,568 329,416 324,136 379,875 433,307
OECD 174,661 225,809 239,292 260,194 224,942 236,530 259,665 192,784 190,430 216,999 221,665 240,297 264,459 213,066 217,756 233,608
NIC 187,338 281,441 340,213 422,145 287,814 358,345 467,279 290,539 364,377 479,169 285,602 360,361 463,863 269,922 324,281 402,702
LDC 17,983 30,744 35,778 42,205 31,366 37,455 46,449 28,261 32,276 39,671 30,416 36,500 44,431 28,750 32,801 37,974
All Long Haul
379,982 537,993 615,283 724,543 544,122 632,330 773,393 511,584 587,082 735,839 537,683 637,159 772,753 511,738 574,838 674,283
Total 618,595 874,854 999,066 1,154,707 847,699 964,035 1,135,138 842,617 954,862 1,145,405 841,822 968,846 1,130,165 853,461 973,811 1,129,532
millions Seats
Domestic 55 63 71 82 60 67 79 61 68 76 67 87 95 58 64 73
Western Europe
204 272 308 341 248 271 293 275 307 338 253 272 291 274 317 356
OECD 32 38 40 44 38 40 44 33 33 37 37 40 45 36 36 39
NIC 37 51 62 76 52 65 85 54 69 90 52 67 86 49 58 73
LDC 6 10 11 14 10 12 15 9 10 13 10 12 14 9 10 12
All Long Haul
75 99 113 134 100 117 144 96 112 140 99 119 145 93 105 124
Total 333 433 492 557 408 455 515 433 487 554 419 478 530 426 486 553
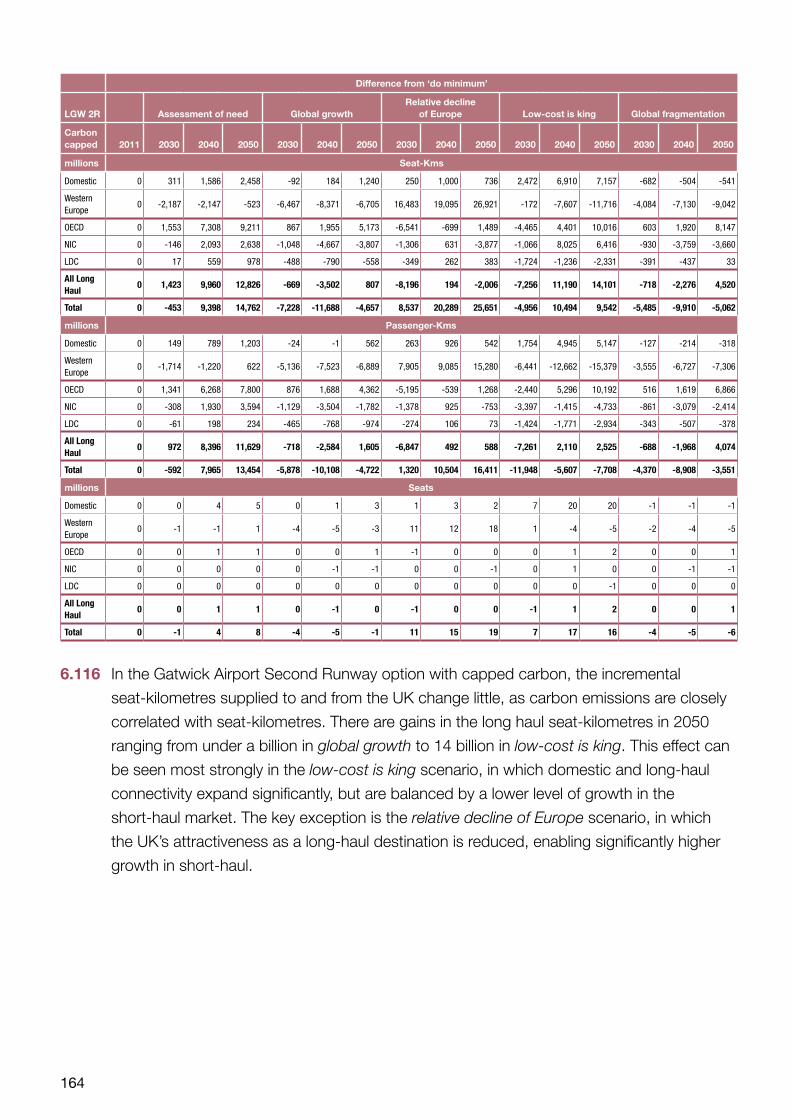
164
Difference from ‘do minimum’
LGW 2R Assessment of need Global growthRelative decline
of Europe Low-cost is king Global fragmentation
Carbon capped 2011 2030 2040 2050 2030 2040 2050 2030 2040 2050 2030 2040 2050 2030 2040 2050
millions Seat-Kms
Domestic 0 311 1,586 2,458 -92 184 1,240 250 1,000 736 2,472 6,910 7,157 -682 -504 -541
Western Europe
0 -2,187 -2,147 -523 -6,467 -8,371 -6,705 16,483 19,095 26,921 -172 -7,607 -11,716 -4,084 -7,130 -9,042
OECD 0 1,553 7,308 9,211 867 1,955 5,173 -6,541 -699 1,489 -4,465 4,401 10,016 603 1,920 8,147
NIC 0 -146 2,093 2,638 -1,048 -4,667 -3,807 -1,306 631 -3,877 -1,066 8,025 6,416 -930 -3,759 -3,660
LDC 0 17 559 978 -488 -790 -558 -349 262 383 -1,724 -1,236 -2,331 -391 -437 33
All Long Haul
0 1,423 9,960 12,826 -669 -3,502 807 -8,196 194 -2,006 -7,256 11,190 14,101 -718 -2,276 4,520
Total 0 -453 9,398 14,762 -7,228 -11,688 -4,657 8,537 20,289 25,651 -4,956 10,494 9,542 -5,485 -9,910 -5,062
millions Passenger-Kms
Domestic 0 149 789 1,203 -24 -1 562 263 926 542 1,754 4,945 5,147 -127 -214 -318
Western Europe
0 -1,714 -1,220 622 -5,136 -7,523 -6,889 7,905 9,085 15,280 -6,441 -12,662 -15,379 -3,555 -6,727 -7,306
OECD 0 1,341 6,268 7,800 876 1,688 4,362 -5,195 -539 1,268 -2,440 5,296 10,192 516 1,619 6,866
NIC 0 -308 1,930 3,594 -1,129 -3,504 -1,782 -1,378 925 -753 -3,397 -1,415 -4,733 -861 -3,079 -2,414
LDC 0 -61 198 234 -465 -768 -974 -274 106 73 -1,424 -1,771 -2,934 -343 -507 -378
All Long Haul
0 972 8,396 11,629 -718 -2,584 1,605 -6,847 492 588 -7,261 2,110 2,525 -688 -1,968 4,074
Total 0 -592 7,965 13,454 -5,878 -10,108 -4,722 1,320 10,504 16,411 -11,948 -5,607 -7,708 -4,370 -8,908 -3,551
millions Seats
Domestic 0 0 4 5 0 1 3 1 3 2 7 20 20 -1 -1 -1
Western Europe
0 -1 -1 1 -4 -5 -3 11 12 18 1 -4 -5 -2 -4 -5
OECD 0 0 1 1 0 0 1 -1 0 0 0 1 2 0 0 1
NIC 0 0 0 0 0 -1 -1 0 0 -1 0 1 0 0 -1 -1
LDC 0 0 0 0 0 0 0 0 0 0 0 0 -1 0 0 0
All Long Haul
0 0 1 1 0 -1 0 -1 0 0 -1 1 2 0 0 1
Total 0 -1 4 8 -4 -5 -1 11 15 19 7 17 16 -4 -5 -6
6.116 In the Gatwick Airport Second Runway option with capped carbon, the incremental
seat-kilometres supplied to and from the UK change little, as carbon emissions are closely
correlated with seat-kilometres. There are gains in the long haul seat-kilometres in 2050
ranging from under a billion in global growth to 14 billion in low-cost is king. This effect can
be seen most strongly in the low-cost is king scenario, in which domestic and long-haul
connectivity expand significantly, but are balanced by a lower level of growth in the
short-haul market. The key exception is the relative decline of Europe scenario, in which
the UK’s attractiveness as a long-haul destination is reduced, enabling significantly higher
growth in short-haul.
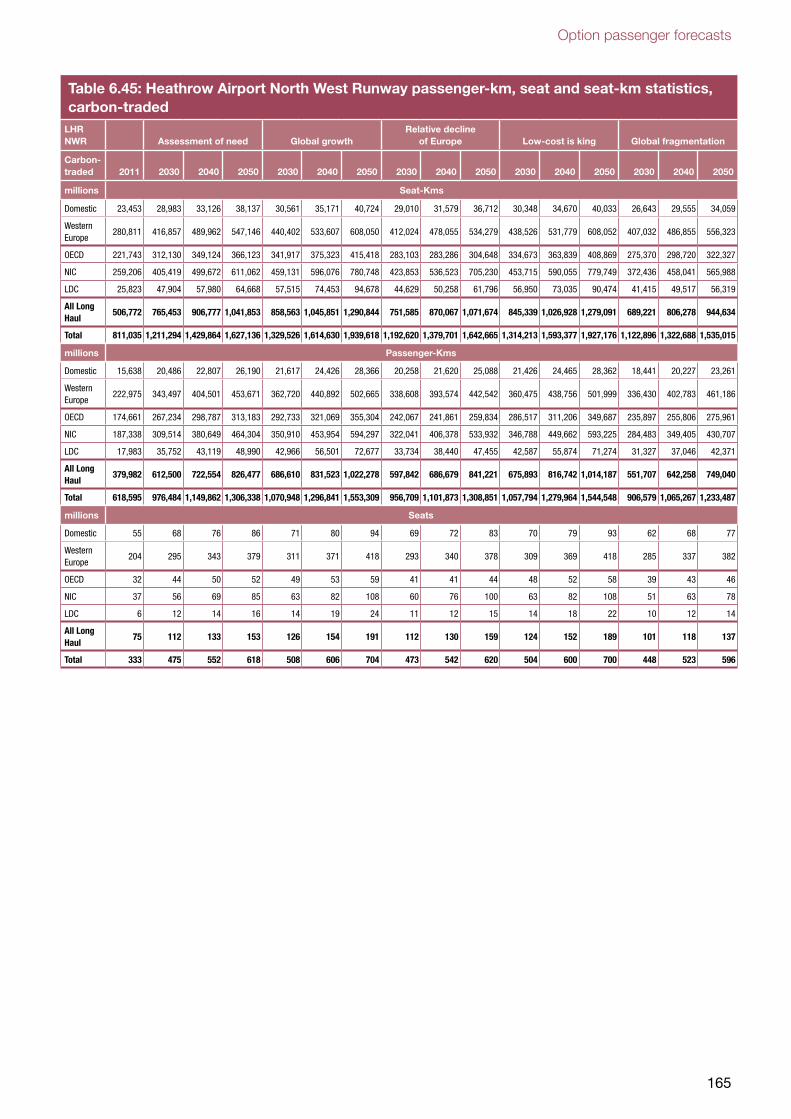
Option passenger forecasts
165
Table 6.45: Heathrow Airport North West Runway passenger-km, seat and seat-km statistics, carbon-traded
LHR NWR Assessment of need Global growth
Relative decline of Europe Low-cost is king Global fragmentation
Carbon-traded 2011 2030 2040 2050 2030 2040 2050 2030 2040 2050 2030 2040 2050 2030 2040 2050
millions Seat-Kms
Domestic 23,453 28,983 33,126 38,137 30,561 35,171 40,724 29,010 31,579 36,712 30,348 34,670 40,033 26,643 29,555 34,059
Western Europe
280,811 416,857 489,962 547,146 440,402 533,607 608,050 412,024 478,055 534,279 438,526 531,779 608,052 407,032 486,855 556,323
OECD 221,743 312,130 349,124 366,123 341,917 375,323 415,418 283,103 283,286 304,648 334,673 363,839 408,869 275,370 298,720 322,327
NIC 259,206 405,419 499,672 611,062 459,131 596,076 780,748 423,853 536,523 705,230 453,715 590,055 779,749 372,436 458,041 565,988
LDC 25,823 47,904 57,980 64,668 57,515 74,453 94,678 44,629 50,258 61,796 56,950 73,035 90,474 41,415 49,517 56,319
All Long Haul
506,772 765,453 906,777 1,041,853 858,563 1,045,851 1,290,844 751,585 870,067 1,071,674 845,339 1,026,928 1,279,091 689,221 806,278 944,634
Total 811,035 1,211,294 1,429,864 1,627,136 1,329,526 1,614,630 1,939,618 1,192,620 1,379,701 1,642,665 1,314,213 1,593,377 1,927,176 1,122,896 1,322,688 1,535,015
millions Passenger-Kms
Domestic 15,638 20,486 22,807 26,190 21,617 24,426 28,366 20,258 21,620 25,088 21,426 24,465 28,362 18,441 20,227 23,261
Western Europe
222,975 343,497 404,501 453,671 362,720 440,892 502,665 338,608 393,574 442,542 360,475 438,756 501,999 336,430 402,783 461,186
OECD 174,661 267,234 298,787 313,183 292,733 321,069 355,304 242,067 241,861 259,834 286,517 311,206 349,687 235,897 255,806 275,961
NIC 187,338 309,514 380,649 464,304 350,910 453,954 594,297 322,041 406,378 533,932 346,788 449,662 593,225 284,483 349,405 430,707
LDC 17,983 35,752 43,119 48,990 42,966 56,501 72,677 33,734 38,440 47,455 42,587 55,874 71,274 31,327 37,046 42,371
All Long Haul
379,982 612,500 722,554 826,477 686,610 831,523 1,022,278 597,842 686,679 841,221 675,893 816,742 1,014,187 551,707 642,258 749,040
Total 618,595 976,484 1,149,862 1,306,338 1,070,948 1,296,841 1,553,309 956,709 1,101,873 1,308,851 1,057,794 1,279,964 1,544,548 906,579 1,065,267 1,233,487
millions Seats
Domestic 55 68 76 86 71 80 94 69 72 83 70 79 93 62 68 77
Western Europe
204 295 343 379 311 371 418 293 340 378 309 369 418 285 337 382
OECD 32 44 50 52 49 53 59 41 41 44 48 52 58 39 43 46
NIC 37 56 69 85 63 82 108 60 76 100 63 82 108 51 63 78
LDC 6 12 14 16 14 19 24 11 12 15 14 18 22 10 12 14
All Long Haul
75 112 133 153 126 154 191 112 130 159 124 152 189 101 118 137
Total 333 475 552 618 508 606 704 473 542 620 504 600 700 448 523 596
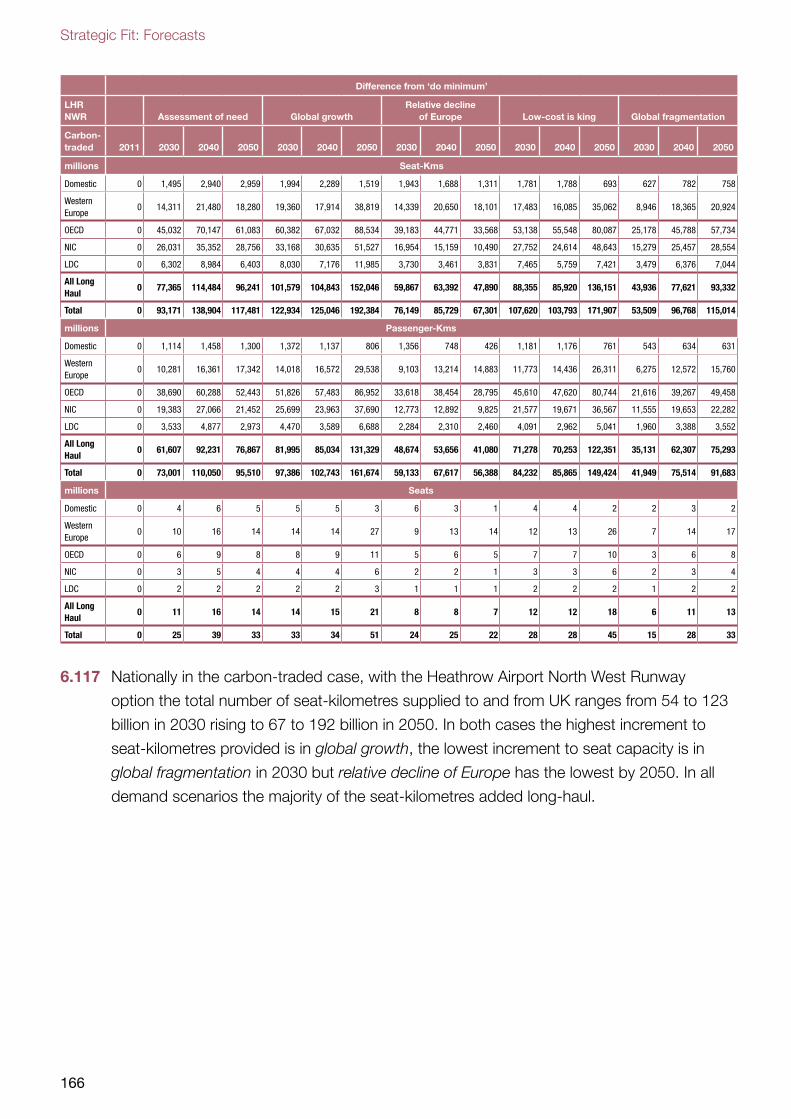
Strategic Fit: Forecasts
166
Difference from ‘do minimum’
LHR NWR Assessment of need Global growth
Relative decline of Europe Low-cost is king Global fragmentation
Carbon-traded 2011 2030 2040 2050 2030 2040 2050 2030 2040 2050 2030 2040 2050 2030 2040 2050
millions Seat-Kms
Domestic 0 1,495 2,940 2,959 1,994 2,289 1,519 1,943 1,688 1,311 1,781 1,788 693 627 782 758
Western Europe
0 14,311 21,480 18,280 19,360 17,914 38,819 14,339 20,650 18,101 17,483 16,085 35,062 8,946 18,365 20,924
OECD 0 45,032 70,147 61,083 60,382 67,032 88,534 39,183 44,771 33,568 53,138 55,548 80,087 25,178 45,788 57,734
NIC 0 26,031 35,352 28,756 33,168 30,635 51,527 16,954 15,159 10,490 27,752 24,614 48,643 15,279 25,457 28,554
LDC 0 6,302 8,984 6,403 8,030 7,176 11,985 3,730 3,461 3,831 7,465 5,759 7,421 3,479 6,376 7,044
All Long Haul
0 77,365 114,484 96,241 101,579 104,843 152,046 59,867 63,392 47,890 88,355 85,920 136,151 43,936 77,621 93,332
Total 0 93,171 138,904 117,481 122,934 125,046 192,384 76,149 85,729 67,301 107,620 103,793 171,907 53,509 96,768 115,014
millions Passenger-Kms
Domestic 0 1,114 1,458 1,300 1,372 1,137 806 1,356 748 426 1,181 1,176 761 543 634 631
Western Europe
0 10,281 16,361 17,342 14,018 16,572 29,538 9,103 13,214 14,883 11,773 14,436 26,311 6,275 12,572 15,760
OECD 0 38,690 60,288 52,443 51,826 57,483 86,952 33,618 38,454 28,795 45,610 47,620 80,744 21,616 39,267 49,458
NIC 0 19,383 27,066 21,452 25,699 23,963 37,690 12,773 12,892 9,825 21,577 19,671 36,567 11,555 19,653 22,282
LDC 0 3,533 4,877 2,973 4,470 3,589 6,688 2,284 2,310 2,460 4,091 2,962 5,041 1,960 3,388 3,552
All Long Haul
0 61,607 92,231 76,867 81,995 85,034 131,329 48,674 53,656 41,080 71,278 70,253 122,351 35,131 62,307 75,293
Total 0 73,001 110,050 95,510 97,386 102,743 161,674 59,133 67,617 56,388 84,232 85,865 149,424 41,949 75,514 91,683
millions Seats
Domestic 0 4 6 5 5 5 3 6 3 1 4 4 2 2 3 2
Western Europe
0 10 16 14 14 14 27 9 13 14 12 13 26 7 14 17
OECD 0 6 9 8 8 9 11 5 6 5 7 7 10 3 6 8
NIC 0 3 5 4 4 4 6 2 2 1 3 3 6 2 3 4
LDC 0 2 2 2 2 2 3 1 1 1 2 2 2 1 2 2
All Long Haul
0 11 16 14 14 15 21 8 8 7 12 12 18 6 11 13
Total 0 25 39 33 33 34 51 24 25 22 28 28 45 15 28 33
6.117 Nationally in the carbon-traded case, with the Heathrow Airport North West Runway
option the total number of seat-kilometres supplied to and from UK ranges from 54 to 123
billion in 2030 rising to 67 to 192 billion in 2050. In both cases the highest increment to
seat-kilometres provided is in global growth, the lowest increment to seat capacity is in
global fragmentation in 2030 but relative decline of Europe has the lowest by 2050. In all
demand scenarios the majority of the seat-kilometres added long-haul.
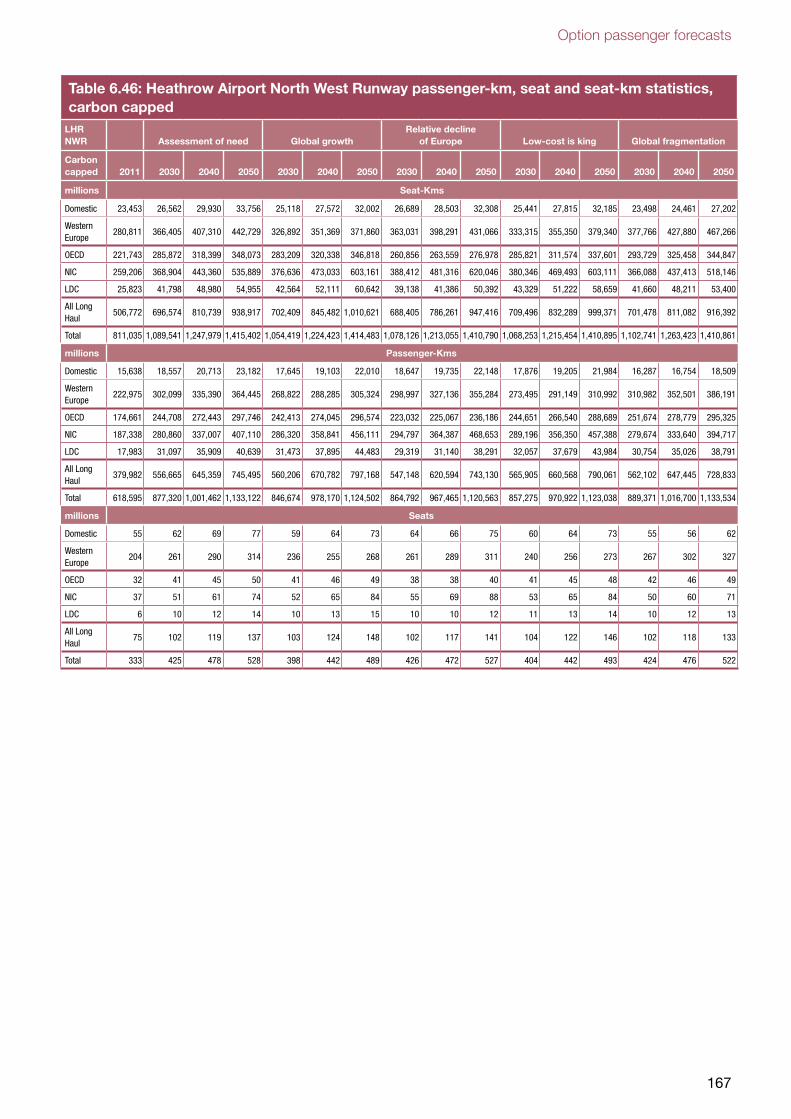
Option passenger forecasts
167
Table 6.46: Heathrow Airport North West Runway passenger-km, seat and seat-km statistics, carbon capped
LHR NWR Assessment of need Global growth
Relative decline of Europe Low-cost is king Global fragmentation
Carbon capped 2011 2030 2040 2050 2030 2040 2050 2030 2040 2050 2030 2040 2050 2030 2040 2050
millions Seat-Kms
Domestic 23,453 26,562 29,930 33,756 25,118 27,572 32,002 26,689 28,503 32,308 25,441 27,815 32,185 23,498 24,461 27,202
Western Europe
280,811 366,405 407,310 442,729 326,892 351,369 371,860 363,031 398,291 431,066 333,315 355,350 379,340 377,766 427,880 467,266
OECD 221,743 285,872 318,399 348,073 283,209 320,338 346,818 260,856 263,559 276,978 285,821 311,574 337,601 293,729 325,458 344,847
NIC 259,206 368,904 443,360 535,889 376,636 473,033 603,161 388,412 481,316 620,046 380,346 469,493 603,111 366,088 437,413 518,146
LDC 25,823 41,798 48,980 54,955 42,564 52,111 60,642 39,138 41,386 50,392 43,329 51,222 58,659 41,660 48,211 53,400
All Long Haul
506,772 696,574 810,739 938,917 702,409 845,482 1,010,621 688,405 786,261 947,416 709,496 832,289 999,371 701,478 811,082 916,392
Total 811,035 1,089,541 1,247,979 1,415,402 1,054,419 1,224,423 1,414,483 1,078,126 1,213,055 1,410,790 1,068,253 1,215,454 1,410,895 1,102,741 1,263,423 1,410,861
millions Passenger-Kms
Domestic 15,638 18,557 20,713 23,182 17,645 19,103 22,010 18,647 19,735 22,148 17,876 19,205 21,984 16,287 16,754 18,509
Western Europe
222,975 302,099 335,390 364,445 268,822 288,285 305,324 298,997 327,136 355,284 273,495 291,149 310,992 310,982 352,501 386,191
OECD 174,661 244,708 272,443 297,746 242,413 274,045 296,574 223,032 225,067 236,186 244,651 266,540 288,689 251,674 278,779 295,325
NIC 187,338 280,860 337,007 407,110 286,320 358,841 456,111 294,797 364,387 468,653 289,196 356,350 457,388 279,674 333,640 394,717
LDC 17,983 31,097 35,909 40,639 31,473 37,895 44,483 29,319 31,140 38,291 32,057 37,679 43,984 30,754 35,026 38,791
All Long Haul
379,982 556,665 645,359 745,495 560,206 670,782 797,168 547,148 620,594 743,130 565,905 660,568 790,061 562,102 647,445 728,833
Total 618,595 877,320 1,001,462 1,133,122 846,674 978,170 1,124,502 864,792 967,465 1,120,563 857,275 970,922 1,123,038 889,371 1,016,700 1,133,534
millions Seats
Domestic 55 62 69 77 59 64 73 64 66 75 60 64 73 55 56 62
Western Europe
204 261 290 314 236 255 268 261 289 311 240 256 273 267 302 327
OECD 32 41 45 50 41 46 49 38 38 40 41 45 48 42 46 49
NIC 37 51 61 74 52 65 84 55 69 88 53 65 84 50 60 71
LDC 6 10 12 14 10 13 15 10 10 12 11 13 14 10 12 13
All Long Haul
75 102 119 137 103 124 148 102 117 141 104 122 146 102 118 133
Total 333 425 478 528 398 442 489 426 472 527 404 442 493 424 476 522
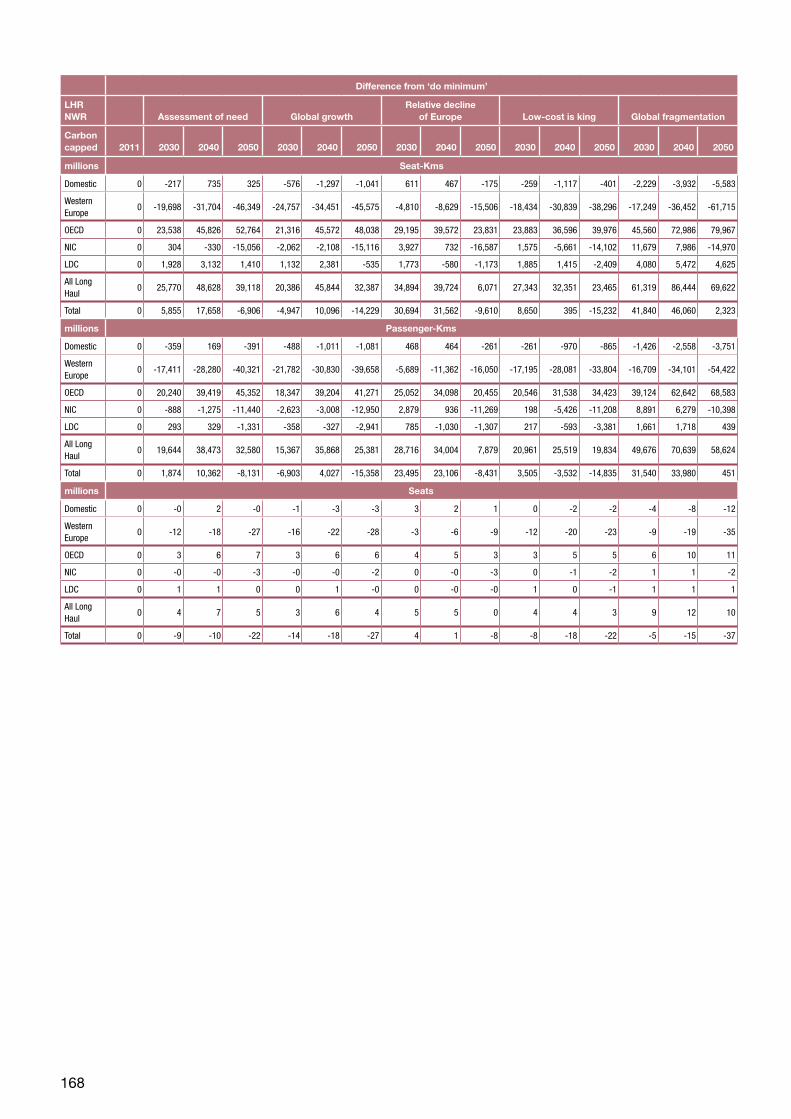
168
Difference from ‘do minimum’
LHR NWR Assessment of need Global growth
Relative decline of Europe Low-cost is king Global fragmentation
Carbon capped 2011 2030 2040 2050 2030 2040 2050 2030 2040 2050 2030 2040 2050 2030 2040 2050
millions Seat-Kms
Domestic 0 -217 735 325 -576 -1,297 -1,041 611 467 -175 -259 -1,117 -401 -2,229 -3,932 -5,583
Western Europe
0 -19,698 -31,704 -46,349 -24,757 -34,451 -45,575 -4,810 -8,629 -15,506 -18,434 -30,839 -38,296 -17,249 -36,452 -61,715
OECD 0 23,538 45,826 52,764 21,316 45,572 48,038 29,195 39,572 23,831 23,883 36,596 39,976 45,560 72,986 79,967
NIC 0 304 -330 -15,056 -2,062 -2,108 -15,116 3,927 732 -16,587 1,575 -5,661 -14,102 11,679 7,986 -14,970
LDC 0 1,928 3,132 1,410 1,132 2,381 -535 1,773 -580 -1,173 1,885 1,415 -2,409 4,080 5,472 4,625
All Long Haul
0 25,770 48,628 39,118 20,386 45,844 32,387 34,894 39,724 6,071 27,343 32,351 23,465 61,319 86,444 69,622
Total 0 5,855 17,658 -6,906 -4,947 10,096 -14,229 30,694 31,562 -9,610 8,650 395 -15,232 41,840 46,060 2,323
millions Passenger-Kms
Domestic 0 -359 169 -391 -488 -1,011 -1,081 468 464 -261 -261 -970 -865 -1,426 -2,558 -3,751
Western Europe
0 -17,411 -28,280 -40,321 -21,782 -30,830 -39,658 -5,689 -11,362 -16,050 -17,195 -28,081 -33,804 -16,709 -34,101 -54,422
OECD 0 20,240 39,419 45,352 18,347 39,204 41,271 25,052 34,098 20,455 20,546 31,538 34,423 39,124 62,642 68,583
NIC 0 -888 -1,275 -11,440 -2,623 -3,008 -12,950 2,879 936 -11,269 198 -5,426 -11,208 8,891 6,279 -10,398
LDC 0 293 329 -1,331 -358 -327 -2,941 785 -1,030 -1,307 217 -593 -3,381 1,661 1,718 439
All Long Haul
0 19,644 38,473 32,580 15,367 35,868 25,381 28,716 34,004 7,879 20,961 25,519 19,834 49,676 70,639 58,624
Total 0 1,874 10,362 -8,131 -6,903 4,027 -15,358 23,495 23,106 -8,431 3,505 -3,532 -14,835 31,540 33,980 451
millions Seats
Domestic 0 -0 2 -0 -1 -3 -3 3 2 1 0 -2 -2 -4 -8 -12
Western Europe
0 -12 -18 -27 -16 -22 -28 -3 -6 -9 -12 -20 -23 -9 -19 -35
OECD 0 3 6 7 3 6 6 4 5 3 3 5 5 6 10 11
NIC 0 -0 -0 -3 -0 -0 -2 0 -0 -3 0 -1 -2 1 1 -2
LDC 0 1 1 0 0 1 -0 0 -0 -0 1 0 -1 1 1 1
All Long Haul
0 4 7 5 3 6 4 5 5 0 4 4 3 9 12 10
Total 0 -9 -10 -22 -14 -18 -27 4 1 -8 -8 -18 -22 -5 -15 -37
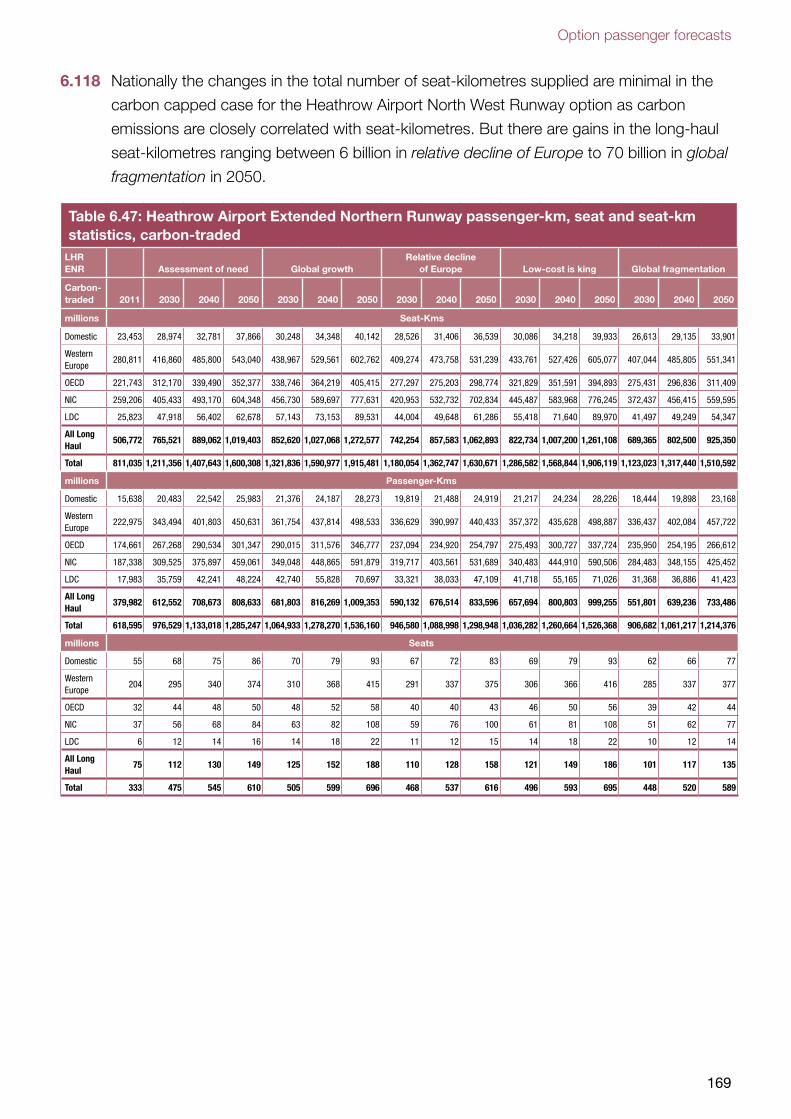
Option passenger forecasts
169
6.118 Nationally the changes in the total number of seat-kilometres supplied are minimal in the
carbon capped case for the Heathrow Airport North West Runway option as carbon
emissions are closely correlated with seat-kilometres. But there are gains in the long-haul
seat-kilometres ranging between 6 billion in relative decline of Europe to 70 billion in global
fragmentation in 2050.
Table 6.47: Heathrow Airport Extended Northern Runway passenger-km, seat and seat-km statistics, carbon-traded
LHR ENR Assessment of need Global growth
Relative decline of Europe Low-cost is king Global fragmentation
Carbon-traded 2011 2030 2040 2050 2030 2040 2050 2030 2040 2050 2030 2040 2050 2030 2040 2050
millions Seat-Kms
Domestic 23,453 28,974 32,781 37,866 30,248 34,348 40,142 28,526 31,406 36,539 30,086 34,218 39,933 26,613 29,135 33,901
Western Europe
280,811 416,860 485,800 543,040 438,967 529,561 602,762 409,274 473,758 531,239 433,761 527,426 605,077 407,044 485,805 551,341
OECD 221,743 312,170 339,490 352,377 338,746 364,219 405,415 277,297 275,203 298,774 321,829 351,591 394,893 275,431 296,836 311,409
NIC 259,206 405,433 493,170 604,348 456,730 589,697 777,631 420,953 532,732 702,834 445,487 583,968 776,245 372,437 456,415 559,595
LDC 25,823 47,918 56,402 62,678 57,143 73,153 89,531 44,004 49,648 61,286 55,418 71,640 89,970 41,497 49,249 54,347
All Long Haul
506,772 765,521 889,062 1,019,403 852,620 1,027,068 1,272,577 742,254 857,583 1,062,893 822,734 1,007,200 1,261,108 689,365 802,500 925,350
Total 811,035 1,211,356 1,407,643 1,600,308 1,321,836 1,590,977 1,915,481 1,180,054 1,362,747 1,630,671 1,286,582 1,568,844 1,906,119 1,123,023 1,317,440 1,510,592
millions Passenger-Kms
Domestic 15,638 20,483 22,542 25,983 21,376 24,187 28,273 19,819 21,488 24,919 21,217 24,234 28,226 18,444 19,898 23,168
Western Europe
222,975 343,494 401,803 450,631 361,754 437,814 498,533 336,629 390,997 440,433 357,372 435,628 498,887 336,437 402,084 457,722
OECD 174,661 267,268 290,534 301,347 290,015 311,576 346,777 237,094 234,920 254,797 275,493 300,727 337,724 235,950 254,195 266,612
NIC 187,338 309,525 375,897 459,061 349,048 448,865 591,879 319,717 403,561 531,689 340,483 444,910 590,506 284,483 348,155 425,452
LDC 17,983 35,759 42,241 48,224 42,740 55,828 70,697 33,321 38,033 47,109 41,718 55,165 71,026 31,368 36,886 41,423
All Long Haul
379,982 612,552 708,673 808,633 681,803 816,269 1,009,353 590,132 676,514 833,596 657,694 800,803 999,255 551,801 639,236 733,486
Total 618,595 976,529 1,133,018 1,285,247 1,064,933 1,278,270 1,536,160 946,580 1,088,998 1,298,948 1,036,282 1,260,664 1,526,368 906,682 1,061,217 1,214,376
millions Seats
Domestic 55 68 75 86 70 79 93 67 72 83 69 79 93 62 66 77
Western Europe
204 295 340 374 310 368 415 291 337 375 306 366 416 285 337 377
OECD 32 44 48 50 48 52 58 40 40 43 46 50 56 39 42 44
NIC 37 56 68 84 63 82 108 59 76 100 61 81 108 51 62 77
LDC 6 12 14 16 14 18 22 11 12 15 14 18 22 10 12 14
All Long Haul
75 112 130 149 125 152 188 110 128 158 121 149 186 101 117 135
Total 333 475 545 610 505 599 696 468 537 616 496 593 695 448 520 589
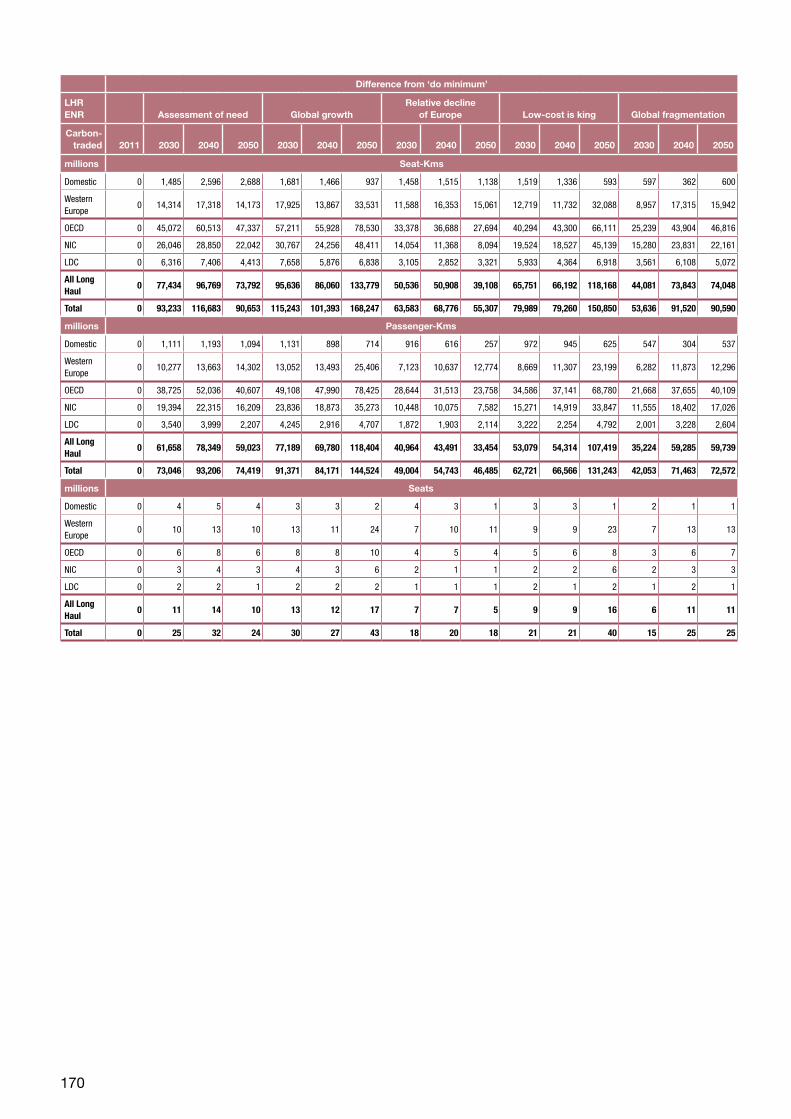
170
Difference from ‘do minimum’
LHR ENR Assessment of need Global growth
Relative decline of Europe Low-cost is king Global fragmentation
Carbon-traded 2011 2030 2040 2050 2030 2040 2050 2030 2040 2050 2030 2040 2050 2030 2040 2050
millions Seat-Kms
Domestic 0 1,485 2,596 2,688 1,681 1,466 937 1,458 1,515 1,138 1,519 1,336 593 597 362 600
Western Europe
0 14,314 17,318 14,173 17,925 13,867 33,531 11,588 16,353 15,061 12,719 11,732 32,088 8,957 17,315 15,942
OECD 0 45,072 60,513 47,337 57,211 55,928 78,530 33,378 36,688 27,694 40,294 43,300 66,111 25,239 43,904 46,816
NIC 0 26,046 28,850 22,042 30,767 24,256 48,411 14,054 11,368 8,094 19,524 18,527 45,139 15,280 23,831 22,161
LDC 0 6,316 7,406 4,413 7,658 5,876 6,838 3,105 2,852 3,321 5,933 4,364 6,918 3,561 6,108 5,072
All Long Haul
0 77,434 96,769 73,792 95,636 86,060 133,779 50,536 50,908 39,108 65,751 66,192 118,168 44,081 73,843 74,048
Total 0 93,233 116,683 90,653 115,243 101,393 168,247 63,583 68,776 55,307 79,989 79,260 150,850 53,636 91,520 90,590
millions Passenger-Kms
Domestic 0 1,111 1,193 1,094 1,131 898 714 916 616 257 972 945 625 547 304 537
Western Europe
0 10,277 13,663 14,302 13,052 13,493 25,406 7,123 10,637 12,774 8,669 11,307 23,199 6,282 11,873 12,296
OECD 0 38,725 52,036 40,607 49,108 47,990 78,425 28,644 31,513 23,758 34,586 37,141 68,780 21,668 37,655 40,109
NIC 0 19,394 22,315 16,209 23,836 18,873 35,273 10,448 10,075 7,582 15,271 14,919 33,847 11,555 18,402 17,026
LDC 0 3,540 3,999 2,207 4,245 2,916 4,707 1,872 1,903 2,114 3,222 2,254 4,792 2,001 3,228 2,604
All Long Haul
0 61,658 78,349 59,023 77,189 69,780 118,404 40,964 43,491 33,454 53,079 54,314 107,419 35,224 59,285 59,739
Total 0 73,046 93,206 74,419 91,371 84,171 144,524 49,004 54,743 46,485 62,721 66,566 131,243 42,053 71,463 72,572
millions Seats
Domestic 0 4 5 4 3 3 2 4 3 1 3 3 1 2 1 1
Western Europe
0 10 13 10 13 11 24 7 10 11 9 9 23 7 13 13
OECD 0 6 8 6 8 8 10 4 5 4 5 6 8 3 6 7
NIC 0 3 4 3 4 3 6 2 1 1 2 2 6 2 3 3
LDC 0 2 2 1 2 2 2 1 1 1 2 1 2 1 2 1
All Long Haul
0 11 14 10 13 12 17 7 7 5 9 9 16 6 11 11
Total 0 25 32 24 30 27 43 18 20 18 21 21 40 15 25 25
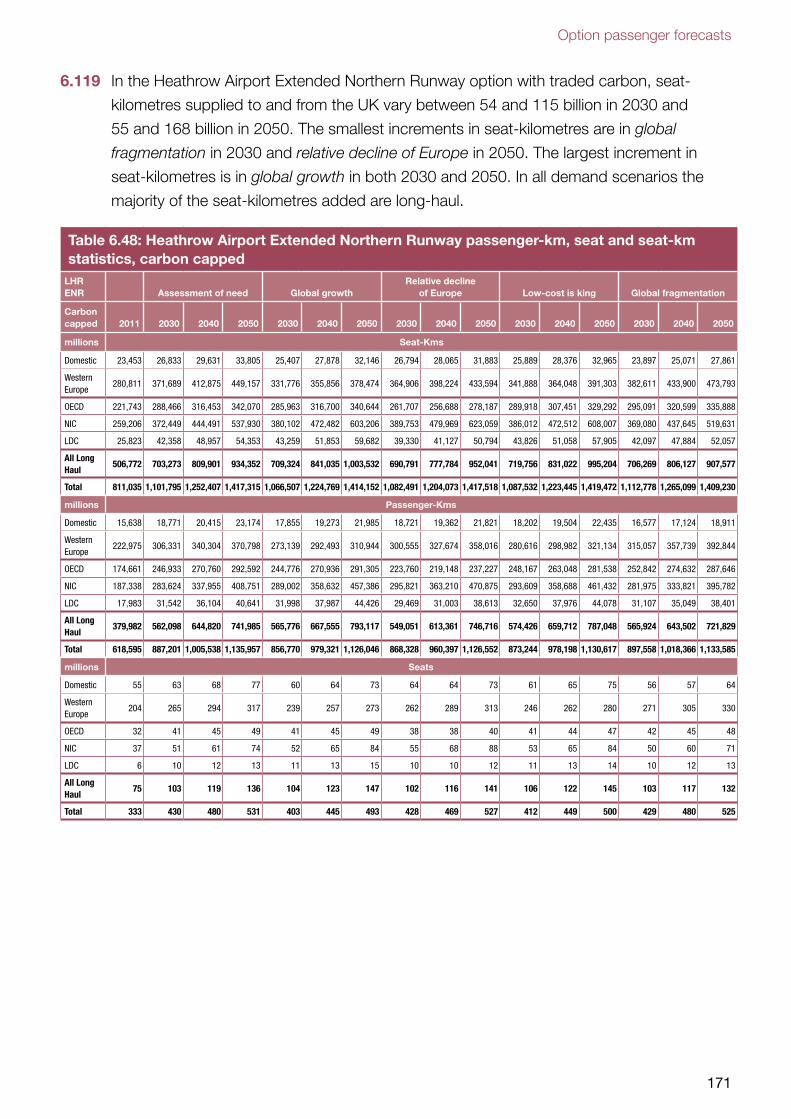
Option passenger forecasts
171
6.119 In the Heathrow Airport Extended Northern Runway option with traded carbon, seat-
kilometres supplied to and from the UK vary between 54 and 115 billion in 2030 and
55 and 168 billion in 2050. The smallest increments in seat-kilometres are in global
fragmentation in 2030 and relative decline of Europe in 2050. The largest increment in
seat-kilometres is in global growth in both 2030 and 2050. In all demand scenarios the
majority of the seat-kilometres added are long-haul.
Table 6.48: Heathrow Airport Extended Northern Runway passenger-km, seat and seat-km statistics, carbon capped
LHR ENR Assessment of need Global growth
Relative decline of Europe Low-cost is king Global fragmentation
Carbon capped 2011 2030 2040 2050 2030 2040 2050 2030 2040 2050 2030 2040 2050 2030 2040 2050
millions Seat-Kms
Domestic 23,453 26,833 29,631 33,805 25,407 27,878 32,146 26,794 28,065 31,883 25,889 28,376 32,965 23,897 25,071 27,861
Western Europe
280,811 371,689 412,875 449,157 331,776 355,856 378,474 364,906 398,224 433,594 341,888 364,048 391,303 382,611 433,900 473,793
OECD 221,743 288,466 316,453 342,070 285,963 316,700 340,644 261,707 256,688 278,187 289,918 307,451 329,292 295,091 320,599 335,888
NIC 259,206 372,449 444,491 537,930 380,102 472,482 603,206 389,753 479,969 623,059 386,012 472,512 608,007 369,080 437,645 519,631
LDC 25,823 42,358 48,957 54,353 43,259 51,853 59,682 39,330 41,127 50,794 43,826 51,058 57,905 42,097 47,884 52,057
All Long Haul
506,772 703,273 809,901 934,352 709,324 841,035 1,003,532 690,791 777,784 952,041 719,756 831,022 995,204 706,269 806,127 907,577
Total 811,035 1,101,795 1,252,407 1,417,315 1,066,507 1,224,769 1,414,152 1,082,491 1,204,073 1,417,518 1,087,532 1,223,445 1,419,472 1,112,778 1,265,099 1,409,230
millions Passenger-Kms
Domestic 15,638 18,771 20,415 23,174 17,855 19,273 21,985 18,721 19,362 21,821 18,202 19,504 22,435 16,577 17,124 18,911
Western Europe
222,975 306,331 340,304 370,798 273,139 292,493 310,944 300,555 327,674 358,016 280,616 298,982 321,134 315,057 357,739 392,844
OECD 174,661 246,933 270,760 292,592 244,776 270,936 291,305 223,760 219,148 237,227 248,167 263,048 281,538 252,842 274,632 287,646
NIC 187,338 283,624 337,955 408,751 289,002 358,632 457,386 295,821 363,210 470,875 293,609 358,688 461,432 281,975 333,821 395,782
LDC 17,983 31,542 36,104 40,641 31,998 37,987 44,426 29,469 31,003 38,613 32,650 37,976 44,078 31,107 35,049 38,401
All Long Haul
379,982 562,098 644,820 741,985 565,776 667,555 793,117 549,051 613,361 746,716 574,426 659,712 787,048 565,924 643,502 721,829
Total 618,595 887,201 1,005,538 1,135,957 856,770 979,321 1,126,046 868,328 960,397 1,126,552 873,244 978,198 1,130,617 897,558 1,018,366 1,133,585
millions Seats
Domestic 55 63 68 77 60 64 73 64 64 73 61 65 75 56 57 64
Western Europe
204 265 294 317 239 257 273 262 289 313 246 262 280 271 305 330
OECD 32 41 45 49 41 45 49 38 38 40 41 44 47 42 45 48
NIC 37 51 61 74 52 65 84 55 68 88 53 65 84 50 60 71
LDC 6 10 12 13 11 13 15 10 10 12 11 13 14 10 12 13
All Long Haul
75 103 119 136 104 123 147 102 116 141 106 122 145 103 117 132
Total 333 430 480 531 403 445 493 428 469 527 412 449 500 429 480 525
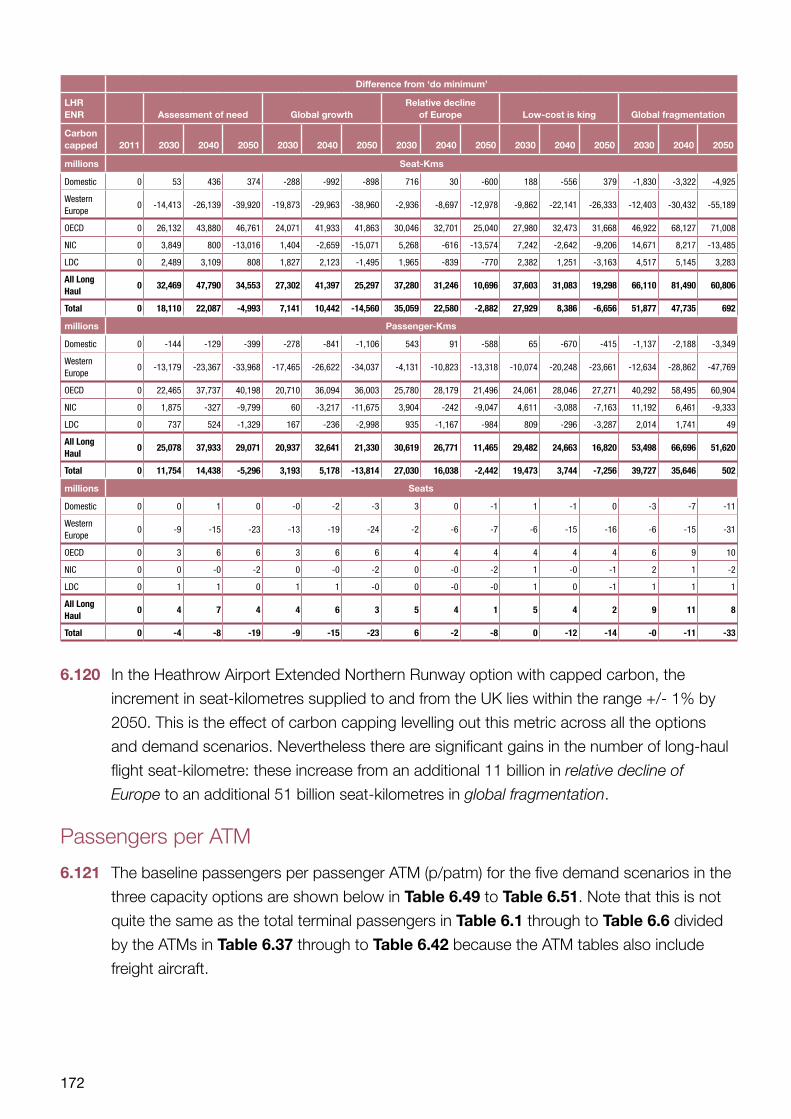
172
Difference from ‘do minimum’
LHR ENR Assessment of need Global growth
Relative decline of Europe Low-cost is king Global fragmentation
Carbon capped 2011 2030 2040 2050 2030 2040 2050 2030 2040 2050 2030 2040 2050 2030 2040 2050
millions Seat-Kms
Domestic 0 53 436 374 -288 -992 -898 716 30 -600 188 -556 379 -1,830 -3,322 -4,925
Western Europe
0 -14,413 -26,139 -39,920 -19,873 -29,963 -38,960 -2,936 -8,697 -12,978 -9,862 -22,141 -26,333 -12,403 -30,432 -55,189
OECD 0 26,132 43,880 46,761 24,071 41,933 41,863 30,046 32,701 25,040 27,980 32,473 31,668 46,922 68,127 71,008
NIC 0 3,849 800 -13,016 1,404 -2,659 -15,071 5,268 -616 -13,574 7,242 -2,642 -9,206 14,671 8,217 -13,485
LDC 0 2,489 3,109 808 1,827 2,123 -1,495 1,965 -839 -770 2,382 1,251 -3,163 4,517 5,145 3,283
All Long Haul
0 32,469 47,790 34,553 27,302 41,397 25,297 37,280 31,246 10,696 37,603 31,083 19,298 66,110 81,490 60,806
Total 0 18,110 22,087 -4,993 7,141 10,442 -14,560 35,059 22,580 -2,882 27,929 8,386 -6,656 51,877 47,735 692
millions Passenger-Kms
Domestic 0 -144 -129 -399 -278 -841 -1,106 543 91 -588 65 -670 -415 -1,137 -2,188 -3,349
Western Europe
0 -13,179 -23,367 -33,968 -17,465 -26,622 -34,037 -4,131 -10,823 -13,318 -10,074 -20,248 -23,661 -12,634 -28,862 -47,769
OECD 0 22,465 37,737 40,198 20,710 36,094 36,003 25,780 28,179 21,496 24,061 28,046 27,271 40,292 58,495 60,904
NIC 0 1,875 -327 -9,799 60 -3,217 -11,675 3,904 -242 -9,047 4,611 -3,088 -7,163 11,192 6,461 -9,333
LDC 0 737 524 -1,329 167 -236 -2,998 935 -1,167 -984 809 -296 -3,287 2,014 1,741 49
All Long Haul
0 25,078 37,933 29,071 20,937 32,641 21,330 30,619 26,771 11,465 29,482 24,663 16,820 53,498 66,696 51,620
Total 0 11,754 14,438 -5,296 3,193 5,178 -13,814 27,030 16,038 -2,442 19,473 3,744 -7,256 39,727 35,646 502
millions Seats
Domestic 0 0 1 0 -0 -2 -3 3 0 -1 1 -1 0 -3 -7 -11
Western Europe
0 -9 -15 -23 -13 -19 -24 -2 -6 -7 -6 -15 -16 -6 -15 -31
OECD 0 3 6 6 3 6 6 4 4 4 4 4 4 6 9 10
NIC 0 0 -0 -2 0 -0 -2 0 -0 -2 1 -0 -1 2 1 -2
LDC 0 1 1 0 1 1 -0 0 -0 -0 1 0 -1 1 1 1
All Long Haul
0 4 7 4 4 6 3 5 4 1 5 4 2 9 11 8
Total 0 -4 -8 -19 -9 -15 -23 6 -2 -8 0 -12 -14 -0 -11 -33
6.120 In the Heathrow Airport Extended Northern Runway option with capped carbon, the
increment in seat-kilometres supplied to and from the UK lies within the range +/- 1% by
2050. This is the effect of carbon capping levelling out this metric across all the options
and demand scenarios. Nevertheless there are significant gains in the number of long-haul
flight seat-kilometre: these increase from an additional 11 billion in relative decline of
Europe to an additional 51 billion seat-kilometres in global fragmentation.
Passengers per ATM
6.121 The baseline passengers per passenger ATM (p/patm) for the five demand scenarios in the
three capacity options are shown below in Table 6.49 to Table 6.51. Note that this is not
quite the same as the total terminal passengers in Table 6.1 through to Table 6.6 divided
by the ATMs in Table 6.37 through to Table 6.42 because the ATM tables also include
freight aircraft.
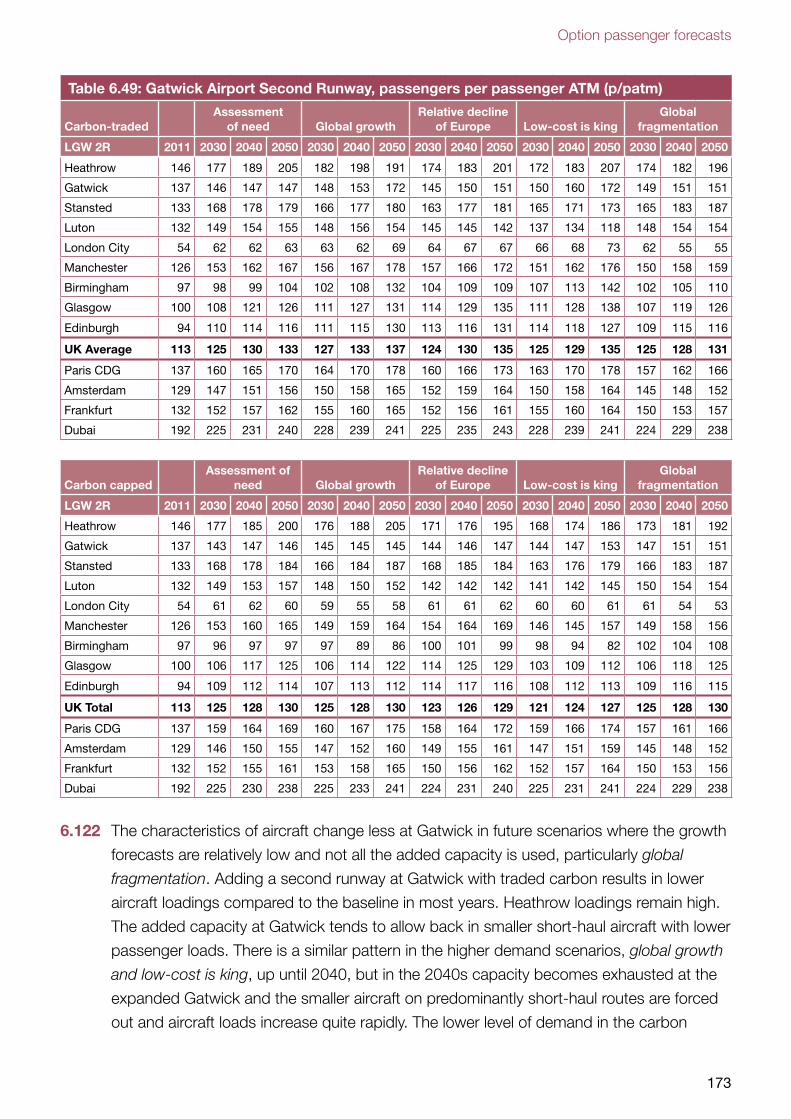
Option passenger forecasts
173
Table 6.49: Gatwick Airport Second Runway, passengers per passenger ATM (p/patm)
Carbon-tradedAssessment
of need Global growthRelative decline
of Europe Low-cost is kingGlobal
fragmentation
LGW 2R 2011 2030 2040 2050 2030 2040 2050 2030 2040 2050 2030 2040 2050 2030 2040 2050
Heathrow 146 177 189 205 182 198 191 174 183 201 172 183 207 174 182 196
Gatwick 137 146 147 147 148 153 172 145 150 151 150 160 172 149 151 151
Stansted 133 168 178 179 166 177 180 163 177 181 165 171 173 165 183 187
Luton 132 149 154 155 148 156 154 145 145 142 137 134 118 148 154 154
London City 54 62 62 63 63 62 69 64 67 67 66 68 73 62 55 55
Manchester 126 153 162 167 156 167 178 157 166 172 151 162 176 150 158 159
Birmingham 97 98 99 104 102 108 132 104 109 109 107 113 142 102 105 110
Glasgow 100 108 121 126 111 127 131 114 129 135 111 128 138 107 119 126
Edinburgh 94 110 114 116 111 115 130 113 116 131 114 118 127 109 115 116
UK Average 113 125 130 133 127 133 137 124 130 135 125 129 135 125 128 131
Paris CDG 137 160 165 170 164 170 178 160 166 173 163 170 178 157 162 166
Amsterdam 129 147 151 156 150 158 165 152 159 164 150 158 164 145 148 152
Frankfurt 132 152 157 162 155 160 165 152 156 161 155 160 164 150 153 157
Dubai 192 225 231 240 228 239 241 225 235 243 228 239 241 224 229 238
Carbon cappedAssessment of
need Global growthRelative decline
of Europe Low-cost is kingGlobal
fragmentation
LGW 2R 2011 2030 2040 2050 2030 2040 2050 2030 2040 2050 2030 2040 2050 2030 2040 2050
Heathrow 146 177 185 200 176 188 205 171 176 195 168 174 186 173 181 192
Gatwick 137 143 147 146 145 145 145 144 146 147 144 147 153 147 151 151
Stansted 133 168 178 184 166 184 187 168 185 184 163 176 179 166 183 187
Luton 132 149 153 157 148 150 152 142 142 142 141 142 145 150 154 154
London City 54 61 62 60 59 55 58 61 61 62 60 60 61 61 54 53
Manchester 126 153 160 165 149 159 164 154 164 169 146 145 157 149 158 156
Birmingham 97 96 97 97 97 89 86 100 101 99 98 94 82 102 104 108
Glasgow 100 106 117 125 106 114 122 114 125 129 103 109 112 106 118 125
Edinburgh 94 109 112 114 107 113 112 114 117 116 108 112 113 109 116 115
UK Total 113 125 128 130 125 128 130 123 126 129 121 124 127 125 128 130
Paris CDG 137 159 164 169 160 167 175 158 164 172 159 166 174 157 161 166
Amsterdam 129 146 150 155 147 152 160 149 155 161 147 151 159 145 148 152
Frankfurt 132 152 155 161 153 158 165 150 156 162 152 157 164 150 153 156
Dubai 192 225 230 238 225 233 241 224 231 240 225 231 241 224 229 238
6.122 The characteristics of aircraft change less at Gatwick in future scenarios where the growth
forecasts are relatively low and not all the added capacity is used, particularly global
fragmentation. Adding a second runway at Gatwick with traded carbon results in lower
aircraft loadings compared to the baseline in most years. Heathrow loadings remain high.
The added capacity at Gatwick tends to allow back in smaller short-haul aircraft with lower
passenger loads. There is a similar pattern in the higher demand scenarios, global growth
and low-cost is king, up until 2040, but in the 2040s capacity becomes exhausted at the
expanded Gatwick and the smaller aircraft on predominantly short-haul routes are forced
out and aircraft loads increase quite rapidly. The lower level of demand in the carbon
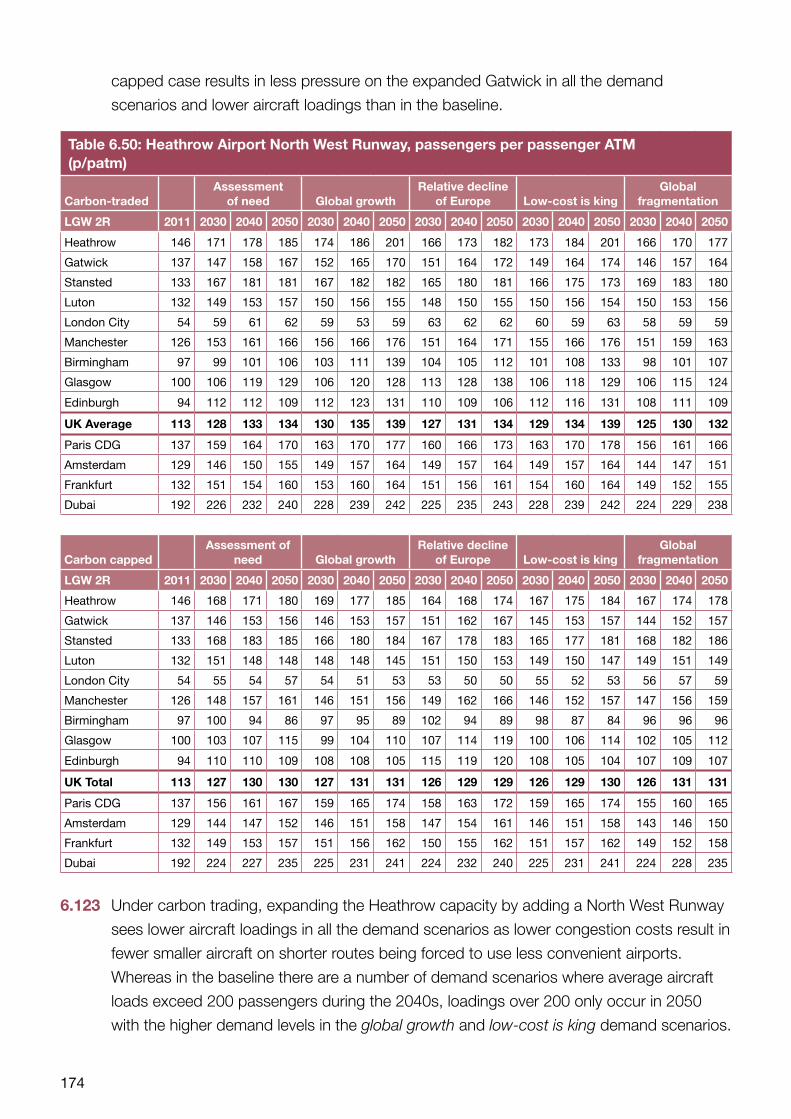
174
capped case results in less pressure on the expanded Gatwick in all the demand
scenarios and lower aircraft loadings than in the baseline.
Table 6.50: Heathrow Airport North West Runway, passengers per passenger ATM (p/patm)
Carbon-tradedAssessment
of need Global growthRelative decline
of Europe Low-cost is kingGlobal
fragmentation
LGW 2R 2011 2030 2040 2050 2030 2040 2050 2030 2040 2050 2030 2040 2050 2030 2040 2050
Heathrow 146 171 178 185 174 186 201 166 173 182 173 184 201 166 170 177
Gatwick 137 147 158 167 152 165 170 151 164 172 149 164 174 146 157 164
Stansted 133 167 181 181 167 182 182 165 180 181 166 175 173 169 183 180
Luton 132 149 153 157 150 156 155 148 150 155 150 156 154 150 153 156
London City 54 59 61 62 59 53 59 63 62 62 60 59 63 58 59 59
Manchester 126 153 161 166 156 166 176 151 164 171 155 166 176 151 159 163
Birmingham 97 99 101 106 103 111 139 104 105 112 101 108 133 98 101 107
Glasgow 100 106 119 129 106 120 128 113 128 138 106 118 129 106 115 124
Edinburgh 94 112 112 109 112 123 131 110 109 106 112 116 131 108 111 109
UK Average 113 128 133 134 130 135 139 127 131 134 129 134 139 125 130 132
Paris CDG 137 159 164 170 163 170 177 160 166 173 163 170 178 156 161 166
Amsterdam 129 146 150 155 149 157 164 149 157 164 149 157 164 144 147 151
Frankfurt 132 151 154 160 153 160 164 151 156 161 154 160 164 149 152 155
Dubai 192 226 232 240 228 239 242 225 235 243 228 239 242 224 229 238
Carbon cappedAssessment of
need Global growthRelative decline
of Europe Low-cost is kingGlobal
fragmentation
LGW 2R 2011 2030 2040 2050 2030 2040 2050 2030 2040 2050 2030 2040 2050 2030 2040 2050
Heathrow 146 168 171 180 169 177 185 164 168 174 167 175 184 167 174 178
Gatwick 137 146 153 156 146 153 157 151 162 167 145 153 157 144 152 157
Stansted 133 168 183 185 166 180 184 167 178 183 165 177 181 168 182 186
Luton 132 151 148 148 148 148 145 151 150 153 149 150 147 149 151 149
London City 54 55 54 57 54 51 53 53 50 50 55 52 53 56 57 59
Manchester 126 148 157 161 146 151 156 149 162 166 146 152 157 147 156 159
Birmingham 97 100 94 86 97 95 89 102 94 89 98 87 84 96 96 96
Glasgow 100 103 107 115 99 104 110 107 114 119 100 106 114 102 105 112
Edinburgh 94 110 110 109 108 108 105 115 119 120 108 105 104 107 109 107
UK Total 113 127 130 130 127 131 131 126 129 129 126 129 130 126 131 131
Paris CDG 137 156 161 167 159 165 174 158 163 172 159 165 174 155 160 165
Amsterdam 129 144 147 152 146 151 158 147 154 161 146 151 158 143 146 150
Frankfurt 132 149 153 157 151 156 162 150 155 162 151 157 162 149 152 158
Dubai 192 224 227 235 225 231 241 224 232 240 225 231 241 224 228 235
6.123 Under carbon trading, expanding the Heathrow capacity by adding a North West Runway
sees lower aircraft loadings in all the demand scenarios as lower congestion costs result in
fewer smaller aircraft on shorter routes being forced to use less convenient airports.
Whereas in the baseline there are a number of demand scenarios where average aircraft
loads exceed 200 passengers during the 2040s, loadings over 200 only occur in 2050
with the higher demand levels in the global growth and low-cost is king demand scenarios.
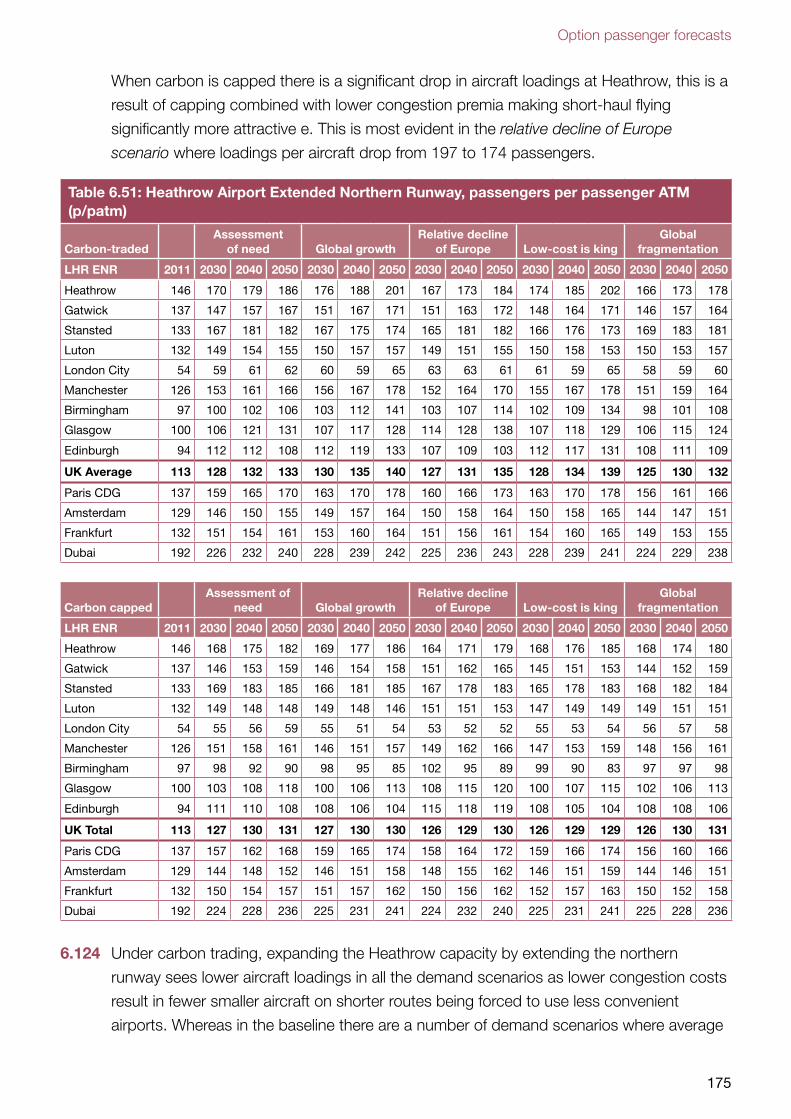
Option passenger forecasts
175
When carbon is capped there is a significant drop in aircraft loadings at Heathrow, this is a
result of capping combined with lower congestion premia making short-haul flying
significantly more attractive e. This is most evident in the relative decline of Europe
scenario where loadings per aircraft drop from 197 to 174 passengers.
Table 6.51: Heathrow Airport Extended Northern Runway, passengers per passenger ATM (p/patm)
Carbon-tradedAssessment
of need Global growthRelative decline
of Europe Low-cost is kingGlobal
fragmentation
LHR ENR 2011 2030 2040 2050 2030 2040 2050 2030 2040 2050 2030 2040 2050 2030 2040 2050
Heathrow 146 170 179 186 176 188 201 167 173 184 174 185 202 166 173 178
Gatwick 137 147 157 167 151 167 171 151 163 172 148 164 171 146 157 164
Stansted 133 167 181 182 167 175 174 165 181 182 166 176 173 169 183 181
Luton 132 149 154 155 150 157 157 149 151 155 150 158 153 150 153 157
London City 54 59 61 62 60 59 65 63 63 61 61 59 65 58 59 60
Manchester 126 153 161 166 156 167 178 152 164 170 155 167 178 151 159 164
Birmingham 97 100 102 106 103 112 141 103 107 114 102 109 134 98 101 108
Glasgow 100 106 121 131 107 117 128 114 128 138 107 118 129 106 115 124
Edinburgh 94 112 112 108 112 119 133 107 109 103 112 117 131 108 111 109
UK Average 113 128 132 133 130 135 140 127 131 135 128 134 139 125 130 132
Paris CDG 137 159 165 170 163 170 178 160 166 173 163 170 178 156 161 166
Amsterdam 129 146 150 155 149 157 164 150 158 164 150 158 165 144 147 151
Frankfurt 132 151 154 161 153 160 164 151 156 161 154 160 165 149 153 155
Dubai 192 226 232 240 228 239 242 225 236 243 228 239 241 224 229 238
Carbon cappedAssessment of
need Global growthRelative decline
of Europe Low-cost is kingGlobal
fragmentation
LHR ENR 2011 2030 2040 2050 2030 2040 2050 2030 2040 2050 2030 2040 2050 2030 2040 2050
Heathrow 146 168 175 182 169 177 186 164 171 179 168 176 185 168 174 180
Gatwick 137 146 153 159 146 154 158 151 162 165 145 151 153 144 152 159
Stansted 133 169 183 185 166 181 185 167 178 183 165 178 183 168 182 184
Luton 132 149 148 148 149 148 146 151 151 153 147 149 149 149 151 151
London City 54 55 56 59 55 51 54 53 52 52 55 53 54 56 57 58
Manchester 126 151 158 161 146 151 157 149 162 166 147 153 159 148 156 161
Birmingham 97 98 92 90 98 95 85 102 95 89 99 90 83 97 97 98
Glasgow 100 103 108 118 100 106 113 108 115 120 100 107 115 102 106 113
Edinburgh 94 111 110 108 108 106 104 115 118 119 108 105 104 108 108 106
UK Total 113 127 130 131 127 130 130 126 129 130 126 129 129 126 130 131
Paris CDG 137 157 162 168 159 165 174 158 164 172 159 166 174 156 160 166
Amsterdam 129 144 148 152 146 151 158 148 155 162 146 151 159 144 146 151
Frankfurt 132 150 154 157 151 157 162 150 156 162 152 157 163 150 152 158
Dubai 192 224 228 236 225 231 241 224 232 240 225 231 241 225 228 236
6.124 Under carbon trading, expanding the Heathrow capacity by extending the northern
runway sees lower aircraft loadings in all the demand scenarios as lower congestion costs
result in fewer smaller aircraft on shorter routes being forced to use less convenient
airports. Whereas in the baseline there are a number of demand scenarios where average
176
aircraft loads exceed 200 passengers during the 2040s, loadings over 200 only occur in
2050 with the higher demand levels in the global growth and low-cost is king demand
scenarios. When carbon is capped there is a significant drop in aircraft loadings at
Heathrow, this is a result of capping combined with lower congestion premia making
short-haul flying significantly more attractive. This is most evident in the low-cost is king
scenario which seems some low cost airlines gaining a foothold at Heathrow where
loadings per aircraft drop from 205 to 185 passengers.
CO2 emissions by option
6.125 Chapter 4 describes the Commission’s approach to modelling the carbon-traded and
carbon capped emissions cases. That chapter also reports the CO2 emissions for the
baseline of no new runway capacity for each demand scenario. These figures show the
emissions for each runway capacity development option over the full modelled period.
6.126 With the Gatwick Airport Second Runway option Figure 6.7 shows that without capping,
national emissions are highest at 51MtCO2 in 2050 in low-cost is king and with 49MtCO2
in global growth. In the other demand scenarios national emissions range between
39MtCO2e and 44MtCO2e when capacity is added at Gatwick.
6.127 If these emissions were not accounted for as part of a liberal global carbon market (as
envisaged in this forecasting approach) and needed to be accommodated within any UK
specific target this would see aviation emissions account for a larger share of the total and
require commensurate reductions elsewhere in the economy.
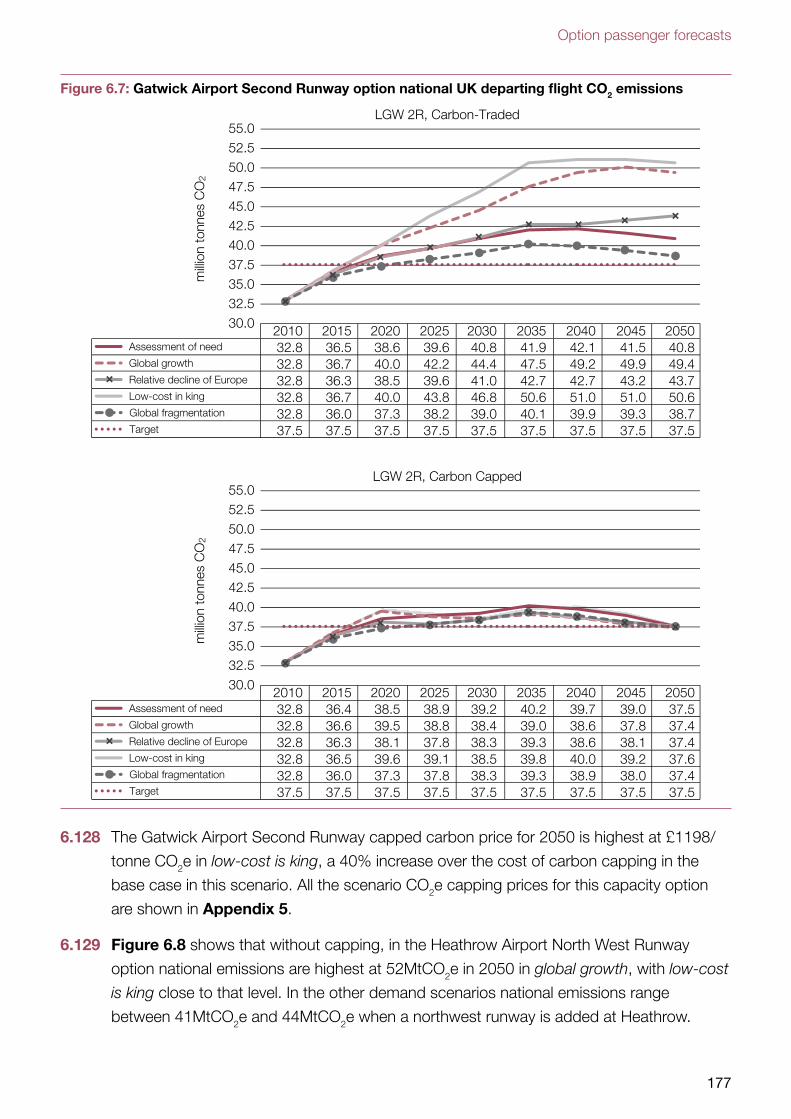
Option passenger forecasts
177
Figure 6.7: Gatwick Airport Second Runway option national UK departing flight CO2 emissions
Assessment of need
Global growth
Relative decline of Europe
Low-cost in king
Global fragmentation
Target
30.032.535.037.540.042.545.047.550.052.555.0
milli
on to
nnes
CO
2
LGW 2R, Carbon-Traded
Assessment of need
Global growth
Relative decline of Europe
Low-cost in king
Global fragmentation
Target
30.032.535.037.540.042.545.047.550.052.555.0
milli
on to
nnes
CO
2
LGW 2R, Carbon Capped
2010 2015 2020 2025 2030 2035 2040 2045 2050 32.8 36.5 38.6 39.6 40.8 41.9 42.1 41.5 40.8 32.8 36.7 40.0 42.2 44.4 47.5 49.2 49.9 49.4 32.8 36.3 38.5 39.6 41.0 42.7 42.7 43.2 43.7 32.8 36.7 40.0 43.8 46.8 50.6 51.0 51.0 50.6 32.8 36.0 37.3 38.2 39.0 40.1 39.9 39.3 38.7 37.5 37.5 37.5 37.5 37.5 37.5 37.5 37.5 37.5
2010 2015 2020 2025 2030 2035 2040 2045 2050 32.8 36.4 38.5 38.9 39.2 40.2 39.7 39.0 37.5 32.8 36.6 39.5 38.8 38.4 39.0 38.6 37.8 37.4 32.8 36.3 38.1 37.8 38.3 39.3 38.6 38.1 37.4 32.8 36.5 39.6 39.1 38.5 39.8 40.0 39.2 37.6 32.8 36.0 37.3 37.8 38.3 39.3 38.9 38.0 37.4 37.5 37.5 37.5 37.5 37.5 37.5 37.5 37.5 37.5
6.128 The Gatwick Airport Second Runway capped carbon price for 2050 is highest at £1198/
tonne CO2e in low-cost is king, a 40% increase over the cost of carbon capping in the
base case in this scenario. All the scenario CO2e capping prices for this capacity option
are shown in Appendix 5.
6.129 Figure 6.8 shows that without capping, in the Heathrow Airport North West Runway
option national emissions are highest at 52MtCO2e in 2050 in global growth, with low-cost
is king close to that level. In the other demand scenarios national emissions range
between 41MtCO2e and 44MtCO2e when a northwest runway is added at Heathrow.
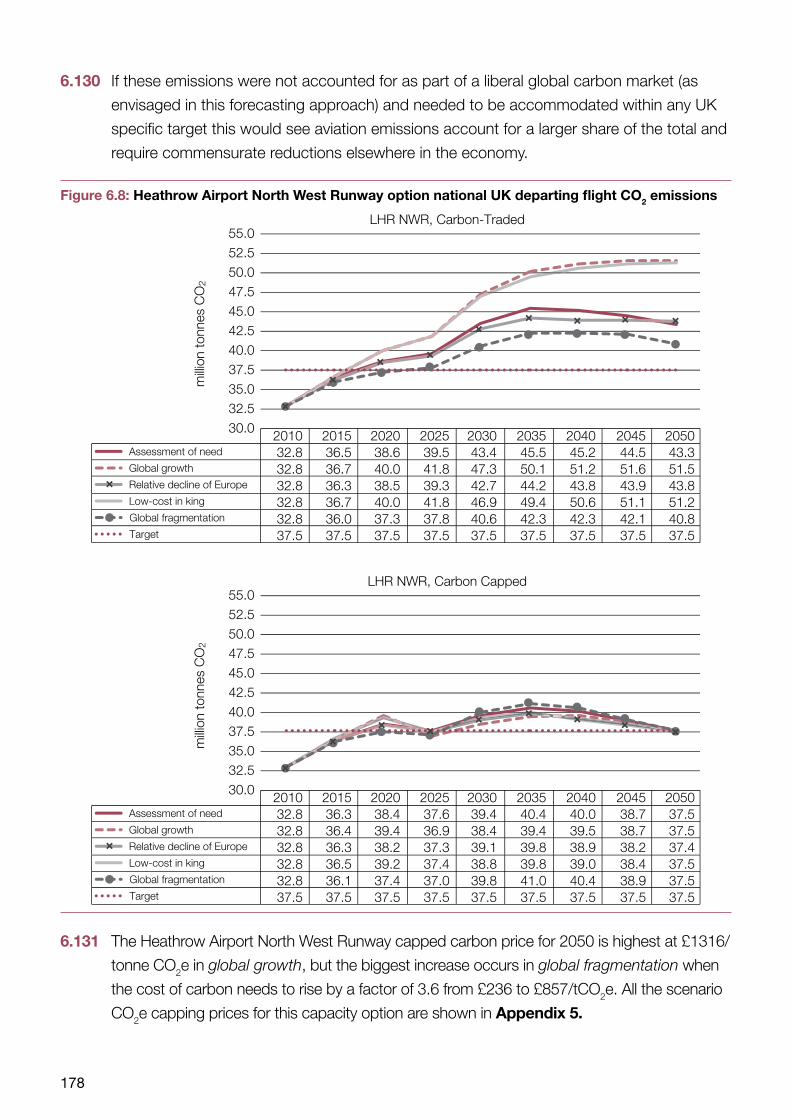
178
6.130 If these emissions were not accounted for as part of a liberal global carbon market (as
envisaged in this forecasting approach) and needed to be accommodated within any UK
specific target this would see aviation emissions account for a larger share of the total and
require commensurate reductions elsewhere in the economy.
Figure 6.8: Heathrow Airport North West Runway option national UK departing flight CO2 emissions
Assessment of need
Global growth
Relative decline of Europe
Low-cost in king
Global fragmentation
Target
30.032.535.037.540.042.545.047.550.052.555.0
milli
on to
nnes
CO
2
LHR NWR, Carbon-Traded
Assessment of need
Global growth
Relative decline of Europe
Low-cost in king
Global fragmentation
Target
30.032.535.037.540.042.545.047.550.052.555.0
milli
on to
nnes
CO
2
LHR NWR, Carbon Capped
2010 2015 2020 2025 2030 2035 2040 2045 2050 32.8 36.5 38.6 39.5 43.4 45.5 45.2 44.5 43.3 32.8 36.7 40.0 41.8 47.3 50.1 51.2 51.6 51.5 32.8 36.3 38.5 39.3 42.7 44.2 43.8 43.9 43.8 32.8 36.7 40.0 41.8 46.9 49.4 50.6 51.1 51.2 32.8 36.0 37.3 37.8 40.6 42.3 42.3 42.1 40.8 37.5 37.5 37.5 37.5 37.5 37.5 37.5 37.5 37.5
2010 2015 2020 2025 2030 2035 2040 2045 2050 32.8 36.3 38.4 37.6 39.4 40.4 40.0 38.7 37.5 32.8 36.4 39.4 36.9 38.4 39.4 39.5 38.7 37.5 32.8 36.3 38.2 37.3 39.1 39.8 38.9 38.2 37.4 32.8 36.5 39.2 37.4 38.8 39.8 39.0 38.4 37.5 32.8 36.1 37.4 37.0 39.8 41.0 40.4 38.9 37.5 37.5 37.5 37.5 37.5 37.5 37.5 37.5 37.5 37.5
6.131 The Heathrow Airport North West Runway capped carbon price for 2050 is highest at £1316/
tonne CO2e in global growth, but the biggest increase occurs in global fragmentation when
the cost of carbon needs to rise by a factor of 3.6 from £236 to £857/tCO2e. All the scenario
CO2e capping prices for this capacity option are shown in Appendix 5.
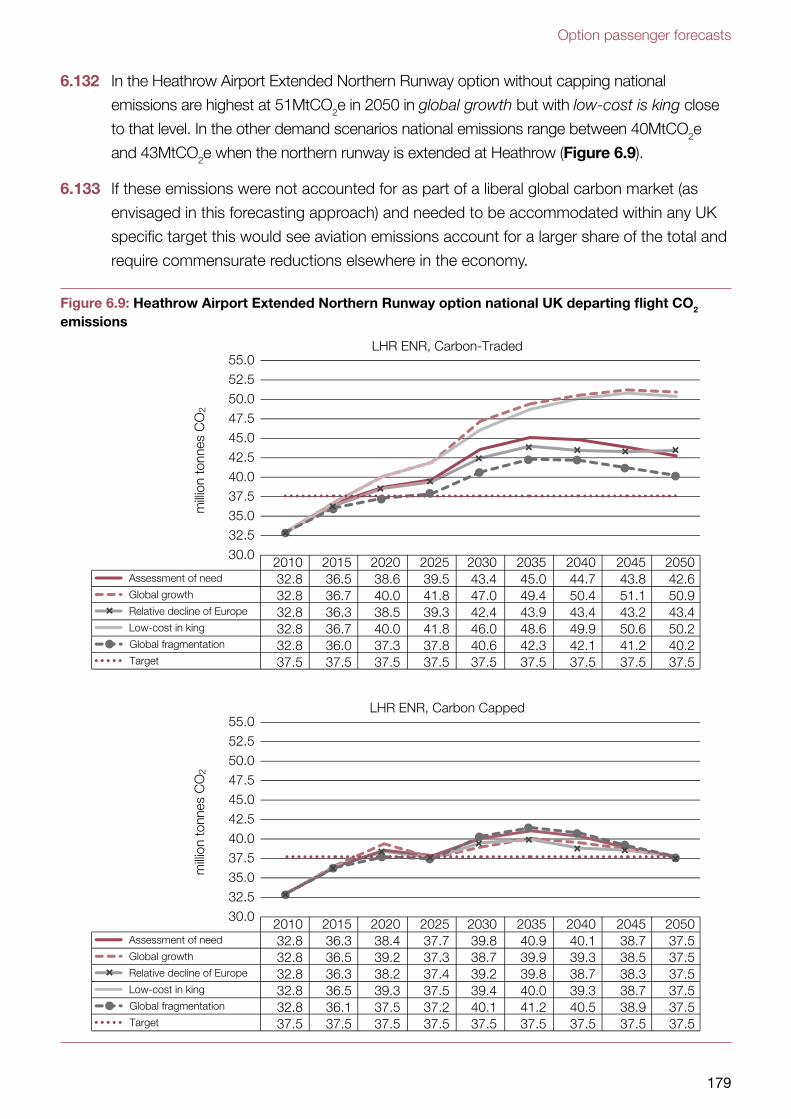
Option passenger forecasts
179
6.132 In the Heathrow Airport Extended Northern Runway option without capping national
emissions are highest at 51MtCO2e in 2050 in global growth but with low-cost is king close
to that level. In the other demand scenarios national emissions range between 40MtCO2e
and 43MtCO2e when the northern runway is extended at Heathrow (Figure 6.9).
6.133 If these emissions were not accounted for as part of a liberal global carbon market (as
envisaged in this forecasting approach) and needed to be accommodated within any UK
specific target this would see aviation emissions account for a larger share of the total and
require commensurate reductions elsewhere in the economy.
Figure 6.9: Heathrow Airport Extended Northern Runway option national UK departing flight CO2 emissions
Assessment of need
Global growth
Relative decline of Europe
Low-cost in king
Global fragmentation
Target
30.032.535.037.540.042.545.047.550.052.555.0
milli
on to
nnes
CO
2
LHR ENR, Carbon-Traded
Assessment of need
Global growth
Relative decline of Europe
Low-cost in king
Global fragmentation
Target
30.032.535.037.540.042.545.047.550.052.555.0
milli
on to
nnes
CO
2
LHR ENR, Carbon Capped
2010 2015 2020 2025 2030 2035 2040 2045 2050 32.8 36.5 38.6 39.5 43.4 45.0 44.7 43.8 42.6 32.8 36.7 40.0 41.8 47.0 49.4 50.4 51.1 50.9 32.8 36.3 38.5 39.3 42.4 43.9 43.4 43.2 43.4 32.8 36.7 40.0 41.8 46.0 48.6 49.9 50.6 50.2 32.8 36.0 37.3 37.8 40.6 42.3 42.1 41.2 40.2 37.5 37.5 37.5 37.5 37.5 37.5 37.5 37.5 37.5
2010 2015 2020 2025 2030 2035 2040 2045 2050 32.8 36.3 38.4 37.7 39.8 40.9 40.1 38.7 37.5 32.8 36.5 39.2 37.3 38.7 39.9 39.3 38.5 37.5 32.8 36.3 38.2 37.4 39.2 39.8 38.7 38.3 37.5 32.8 36.5 39.3 37.5 39.4 40.0 39.3 38.7 37.5 32.8 36.1 37.5 37.2 40.1 41.2 40.5 38.9 37.5 37.5 37.5 37.5 37.5 37.5 37.5 37.5 37.5 37.5
180
6.134 For the Heathrow Airport Extended Northern Runway option, the capped carbon price for
2050 is highest at £1236/tonne CO2e in global growth, but the biggest increase occurs in
global fragmentation when the cost of carbon needs to rise by a factor of 3.2 from £236 to
£758/tCO2e. All the scenario CO2e capping prices for this capacity option are shown in
Appendix 5.
Catchment areas
6.135 Chapter 2 describes how the passenger to airport allocation model represents how
passengers in each district choose between available airports primarily on the basis of
their costs of getting to each airport (future surface access costs) and the availability of air
services to the desired destination at each airport (frequency costs). This methodology
captures the complex overlapping of airport catchments. In practice different passengers
in particular districts choose different airports for the same journey depending on personal
preferences. This allocation methodology also captures the dynamics of catchments
varying district by district as airports become full or gain extra capacity. For the baseline
case of no additional runway capacity, Chapter 5 contains maps which show the
modelled catchments of 8 airports in 2030. Appendix 4 shows catchment area maps for
2030 for Gatwick and Heathrow for capacity development options.
Sensitivity Tests
181
7. Sensitivity Tests
7.1 This chapter sets out the Commission’s work on sensitivities to test the impact on the
assessment of need demand scenario forecasts if:
1. There were no international-to-international transfer passengers (I to Is).
2. There was no carbon price applied to fares.
3. Additional runway capacity was phased in for the Heathrow Airport North West
Runway option.
4. Heathrow Airport North West Runway surface access assumptions were applied in the
Heathrow Airport Extended Northern Runway option.
5. Lower capacity assumptions were assumed in the Heathrow Airport Extended
Northern Runway option.
6. The high DECC carbon prices were applied.
7.2 The modelling assumptions underpinning results of these model runs and how they
compare with the assessment of need results are described below.
No international-to-international transfer passengers
7.3 This sensitivity test measures the impact of international-to-international transfer
passengers under the assessment of need demand scenario in terms of both total
passenger throughput and connectivity in terms of destinations served by airport and
region. It is assumed that there are no international-international interliners at any of the
modelled airports. All other assumptions were identical to those in the assessment of need
scenario. The runs were made for all airport development options under both the carbon
capped and traded cases.
Total passengers
7.4 Removing international-to-international transfer passengers makes a significant difference
to demand. In the base year of 2011 some 24 million terminal passengers are removed
from the total UK demand and 94 million from the total hub demand. By 2050 in the
carbon-traded case demand at the hubs is reduced by over 150 million terminal
passengers and by just over 115 million in the carbon capped case.
7.5 In the baseline removing the international-to-international transfer passengers means that
Heathrow is not full until 2030 in the carbon-traded case and 2032 in the carbon capped
case. Once Heathrow is full the shadow costs remain lower throughout the modelled
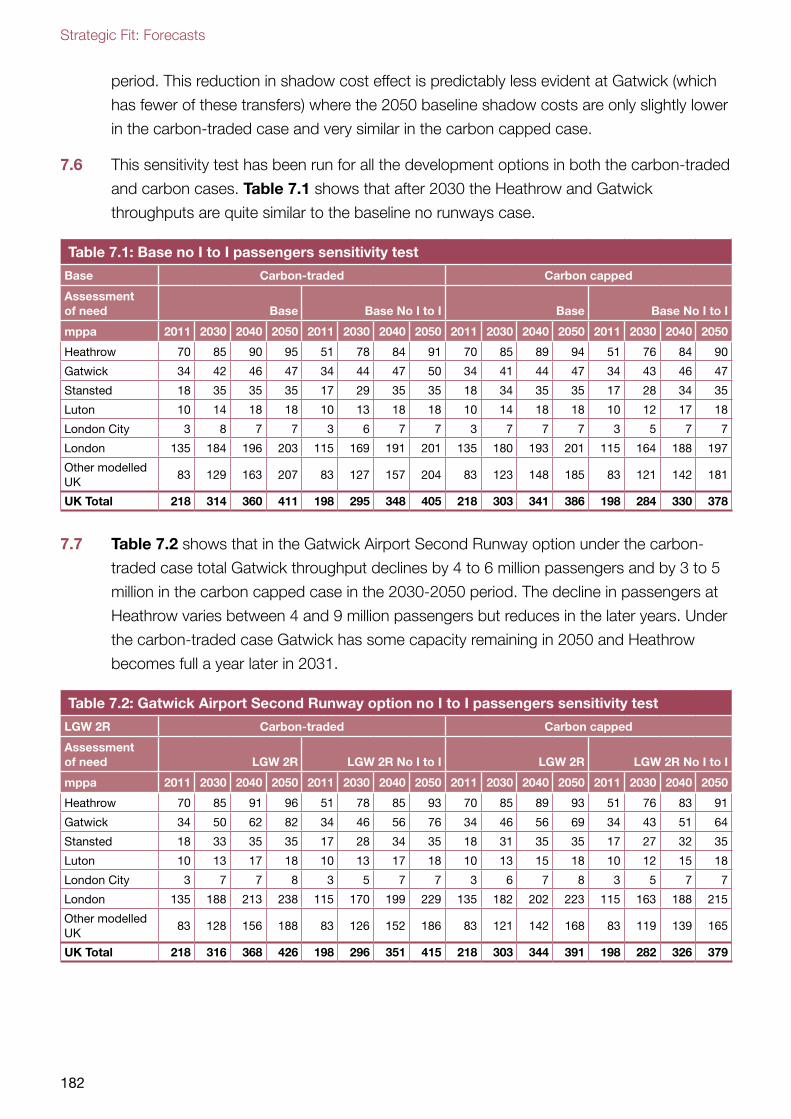
Strategic Fit: Forecasts
182
period. This reduction in shadow cost effect is predictably less evident at Gatwick (which
has fewer of these transfers) where the 2050 baseline shadow costs are only slightly lower
in the carbon-traded case and very similar in the carbon capped case.
7.6 This sensitivity test has been run for all the development options in both the carbon-traded
and carbon cases. Table 7.1 shows that after 2030 the Heathrow and Gatwick
throughputs are quite similar to the baseline no runways case.
Table 7.1: Base no I to I passengers sensitivity test
Base Carbon-traded Carbon capped
Assessment of need Base Base No I to I Base Base No I to I
mppa 2011 2030 2040 2050 2011 2030 2040 2050 2011 2030 2040 2050 2011 2030 2040 2050
Heathrow 70 85 90 95 51 78 84 91 70 85 89 94 51 76 84 90
Gatwick 34 42 46 47 34 44 47 50 34 41 44 47 34 43 46 47
Stansted 18 35 35 35 17 29 35 35 18 34 35 35 17 28 34 35
Luton 10 14 18 18 10 13 18 18 10 14 18 18 10 12 17 18
London City 3 8 7 7 3 6 7 7 3 7 7 7 3 5 7 7
London 135 184 196 203 115 169 191 201 135 180 193 201 115 164 188 197
Other modelled UK
83 129 163 207 83 127 157 204 83 123 148 185 83 121 142 181
UK Total 218 314 360 411 198 295 348 405 218 303 341 386 198 284 330 378
7.7 Table 7.2 shows that in the Gatwick Airport Second Runway option under the carbon-
traded case total Gatwick throughput declines by 4 to 6 million passengers and by 3 to 5
million in the carbon capped case in the 2030-2050 period. The decline in passengers at
Heathrow varies between 4 and 9 million passengers but reduces in the later years. Under
the carbon-traded case Gatwick has some capacity remaining in 2050 and Heathrow
becomes full a year later in 2031.
Table 7.2: Gatwick Airport Second Runway option no I to I passengers sensitivity test
LGW 2R Carbon-traded Carbon capped
Assessment of need LGW 2R LGW 2R No I to I LGW 2R LGW 2R No I to I
mppa 2011 2030 2040 2050 2011 2030 2040 2050 2011 2030 2040 2050 2011 2030 2040 2050
Heathrow 70 85 91 96 51 78 85 93 70 85 89 93 51 76 83 91
Gatwick 34 50 62 82 34 46 56 76 34 46 56 69 34 43 51 64
Stansted 18 33 35 35 17 28 34 35 18 31 35 35 17 27 32 35
Luton 10 13 17 18 10 13 17 18 10 13 15 18 10 12 15 18
London City 3 7 7 8 3 5 7 7 3 6 7 8 3 5 7 7
London 135 188 213 238 115 170 199 229 135 182 202 223 115 163 188 215
Other modelled UK
83 128 156 188 83 126 152 186 83 121 142 168 83 119 139 165
UK Total 218 316 368 426 198 296 351 415 218 303 344 391 198 282 326 379
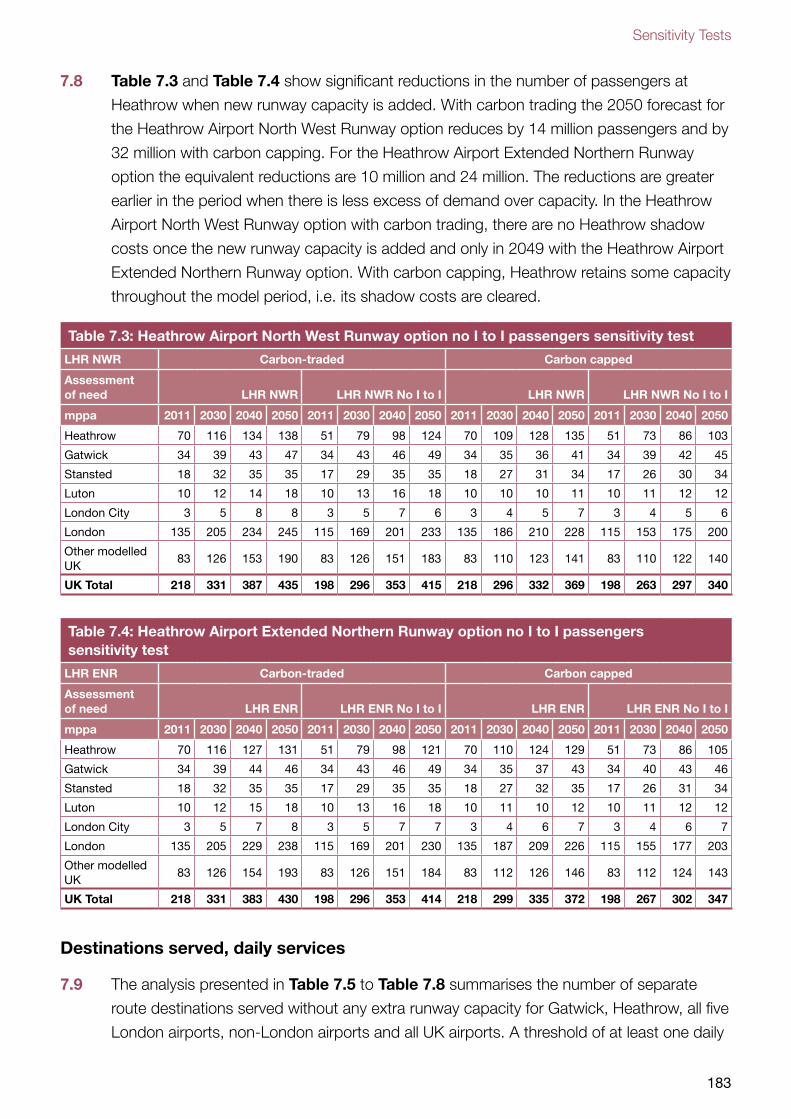
Sensitivity Tests
183
7.8 Table 7.3 and Table 7.4 show significant reductions in the number of passengers at
Heathrow when new runway capacity is added. With carbon trading the 2050 forecast for
the Heathrow Airport North West Runway option reduces by 14 million passengers and by
32 million with carbon capping. For the Heathrow Airport Extended Northern Runway
option the equivalent reductions are 10 million and 24 million. The reductions are greater
earlier in the period when there is less excess of demand over capacity. In the Heathrow
Airport North West Runway option with carbon trading, there are no Heathrow shadow
costs once the new runway capacity is added and only in 2049 with the Heathrow Airport
Extended Northern Runway option. With carbon capping, Heathrow retains some capacity
throughout the model period, i.e. its shadow costs are cleared.
Table 7.3: Heathrow Airport North West Runway option no I to I passengers sensitivity test
LHR NWR Carbon-traded Carbon capped
Assessment of need LHR NWR LHR NWR No I to I LHR NWR LHR NWR No I to I
mppa 2011 2030 2040 2050 2011 2030 2040 2050 2011 2030 2040 2050 2011 2030 2040 2050
Heathrow 70 116 134 138 51 79 98 124 70 109 128 135 51 73 86 103
Gatwick 34 39 43 47 34 43 46 49 34 35 36 41 34 39 42 45
Stansted 18 32 35 35 17 29 35 35 18 27 31 34 17 26 30 34
Luton 10 12 14 18 10 13 16 18 10 10 10 11 10 11 12 12
London City 3 5 8 8 3 5 7 6 3 4 5 7 3 4 5 6
London 135 205 234 245 115 169 201 233 135 186 210 228 115 153 175 200
Other modelled UK
83 126 153 190 83 126 151 183 83 110 123 141 83 110 122 140
UK Total 218 331 387 435 198 296 353 415 218 296 332 369 198 263 297 340
Table 7.4: Heathrow Airport Extended Northern Runway option no I to I passengers sensitivity test
LHR ENR Carbon-traded Carbon capped
Assessment of need LHR ENR LHR ENR No I to I LHR ENR LHR ENR No I to I
mppa 2011 2030 2040 2050 2011 2030 2040 2050 2011 2030 2040 2050 2011 2030 2040 2050
Heathrow 70 116 127 131 51 79 98 121 70 110 124 129 51 73 86 105
Gatwick 34 39 44 46 34 43 46 49 34 35 37 43 34 40 43 46
Stansted 18 32 35 35 17 29 35 35 18 27 32 35 17 26 31 34
Luton 10 12 15 18 10 13 16 18 10 11 10 12 10 11 12 12
London City 3 5 7 8 3 5 7 7 3 4 6 7 3 4 6 7
London 135 205 229 238 115 169 201 230 135 187 209 226 115 155 177 203
Other modelled UK
83 126 154 193 83 126 151 184 83 112 126 146 83 112 124 143
UK Total 218 331 383 430 198 296 353 414 218 299 335 372 198 267 302 347
Destinations served, daily services
7.9 The analysis presented in Table 7.5 to Table 7.8 summarises the number of separate
route destinations served without any extra runway capacity for Gatwick, Heathrow, all five
London airports, non-London airports and all UK airports. A threshold of at least one daily
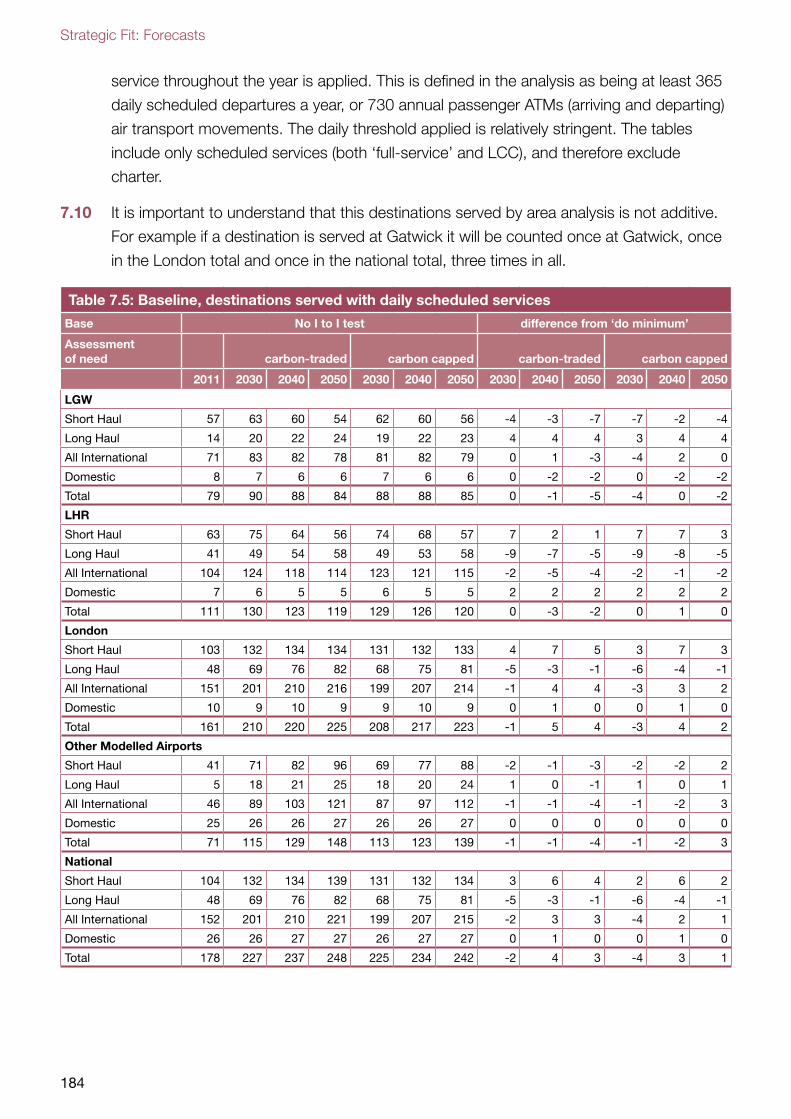
Strategic Fit: Forecasts
184
service throughout the year is applied. This is defined in the analysis as being at least 365
daily scheduled departures a year, or 730 annual passenger ATMs (arriving and departing)
air transport movements. The daily threshold applied is relatively stringent. The tables
include only scheduled services (both ‘full-service’ and LCC), and therefore exclude
charter.
7.10 It is important to understand that this destinations served by area analysis is not additive.
For example if a destination is served at Gatwick it will be counted once at Gatwick, once
in the London total and once in the national total, three times in all.
Table 7.5: Baseline, destinations served with daily scheduled services
Base No I to I test difference from ‘do minimum’
Assessment of need carbon-traded carbon capped carbon-traded carbon capped
2011 2030 2040 2050 2030 2040 2050 2030 2040 2050 2030 2040 2050
LGW
Short Haul 57 63 60 54 62 60 56 -4 -3 -7 -7 -2 -4
Long Haul 14 20 22 24 19 22 23 4 4 4 3 4 4
All International 71 83 82 78 81 82 79 0 1 -3 -4 2 0
Domestic 8 7 6 6 7 6 6 0 -2 -2 0 -2 -2
Total 79 90 88 84 88 88 85 0 -1 -5 -4 0 -2
LHR
Short Haul 63 75 64 56 74 68 57 7 2 1 7 7 3
Long Haul 41 49 54 58 49 53 58 -9 -7 -5 -9 -8 -5
All International 104 124 118 114 123 121 115 -2 -5 -4 -2 -1 -2
Domestic 7 6 5 5 6 5 5 2 2 2 2 2 2
Total 111 130 123 119 129 126 120 0 -3 -2 0 1 0
London
Short Haul 103 132 134 134 131 132 133 4 7 5 3 7 3
Long Haul 48 69 76 82 68 75 81 -5 -3 -1 -6 -4 -1
All International 151 201 210 216 199 207 214 -1 4 4 -3 3 2
Domestic 10 9 10 9 9 10 9 0 1 0 0 1 0
Total 161 210 220 225 208 217 223 -1 5 4 -3 4 2
Other Modelled Airports
Short Haul 41 71 82 96 69 77 88 -2 -1 -3 -2 -2 2
Long Haul 5 18 21 25 18 20 24 1 0 -1 1 0 1
All International 46 89 103 121 87 97 112 -1 -1 -4 -1 -2 3
Domestic 25 26 26 27 26 26 27 0 0 0 0 0 0
Total 71 115 129 148 113 123 139 -1 -1 -4 -1 -2 3
National
Short Haul 104 132 134 139 131 132 134 3 6 4 2 6 2
Long Haul 48 69 76 82 68 75 81 -5 -3 -1 -6 -4 -1
All International 152 201 210 221 199 207 215 -2 3 3 -4 2 1
Domestic 26 26 27 27 26 27 27 0 1 0 0 1 0
Total 178 227 237 248 225 234 242 -2 4 3 -4 3 1
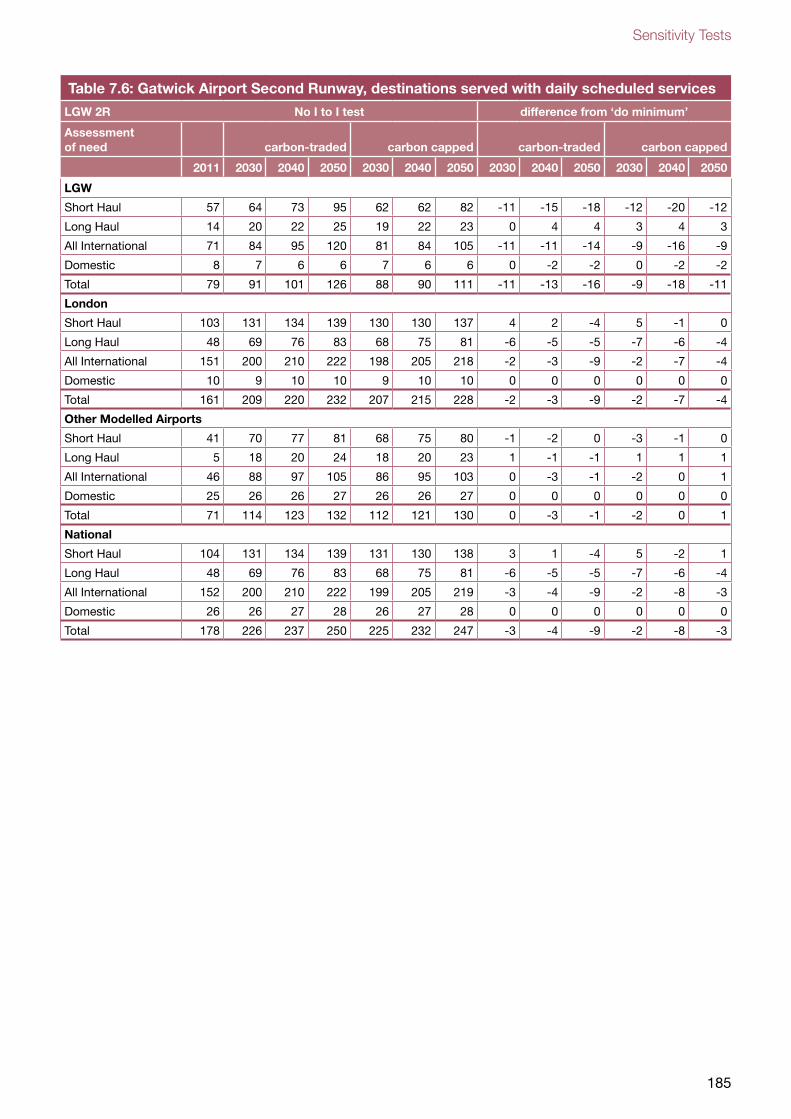
Sensitivity Tests
185
Table 7.6: Gatwick Airport Second Runway, destinations served with daily scheduled services
LGW 2R No I to I test difference from ‘do minimum’
Assessment of need carbon-traded carbon capped carbon-traded carbon capped
2011 2030 2040 2050 2030 2040 2050 2030 2040 2050 2030 2040 2050
LGW
Short Haul 57 64 73 95 62 62 82 -11 -15 -18 -12 -20 -12
Long Haul 14 20 22 25 19 22 23 0 4 4 3 4 3
All International 71 84 95 120 81 84 105 -11 -11 -14 -9 -16 -9
Domestic 8 7 6 6 7 6 6 0 -2 -2 0 -2 -2
Total 79 91 101 126 88 90 111 -11 -13 -16 -9 -18 -11
London
Short Haul 103 131 134 139 130 130 137 4 2 -4 5 -1 0
Long Haul 48 69 76 83 68 75 81 -6 -5 -5 -7 -6 -4
All International 151 200 210 222 198 205 218 -2 -3 -9 -2 -7 -4
Domestic 10 9 10 10 9 10 10 0 0 0 0 0 0
Total 161 209 220 232 207 215 228 -2 -3 -9 -2 -7 -4
Other Modelled Airports
Short Haul 41 70 77 81 68 75 80 -1 -2 0 -3 -1 0
Long Haul 5 18 20 24 18 20 23 1 -1 -1 1 1 1
All International 46 88 97 105 86 95 103 0 -3 -1 -2 0 1
Domestic 25 26 26 27 26 26 27 0 0 0 0 0 0
Total 71 114 123 132 112 121 130 0 -3 -1 -2 0 1
National
Short Haul 104 131 134 139 131 130 138 3 1 -4 5 -2 1
Long Haul 48 69 76 83 68 75 81 -6 -5 -5 -7 -6 -4
All International 152 200 210 222 199 205 219 -3 -4 -9 -2 -8 -3
Domestic 26 26 27 28 26 27 28 0 0 0 0 0 0
Total 178 226 237 250 225 232 247 -3 -4 -9 -2 -8 -3
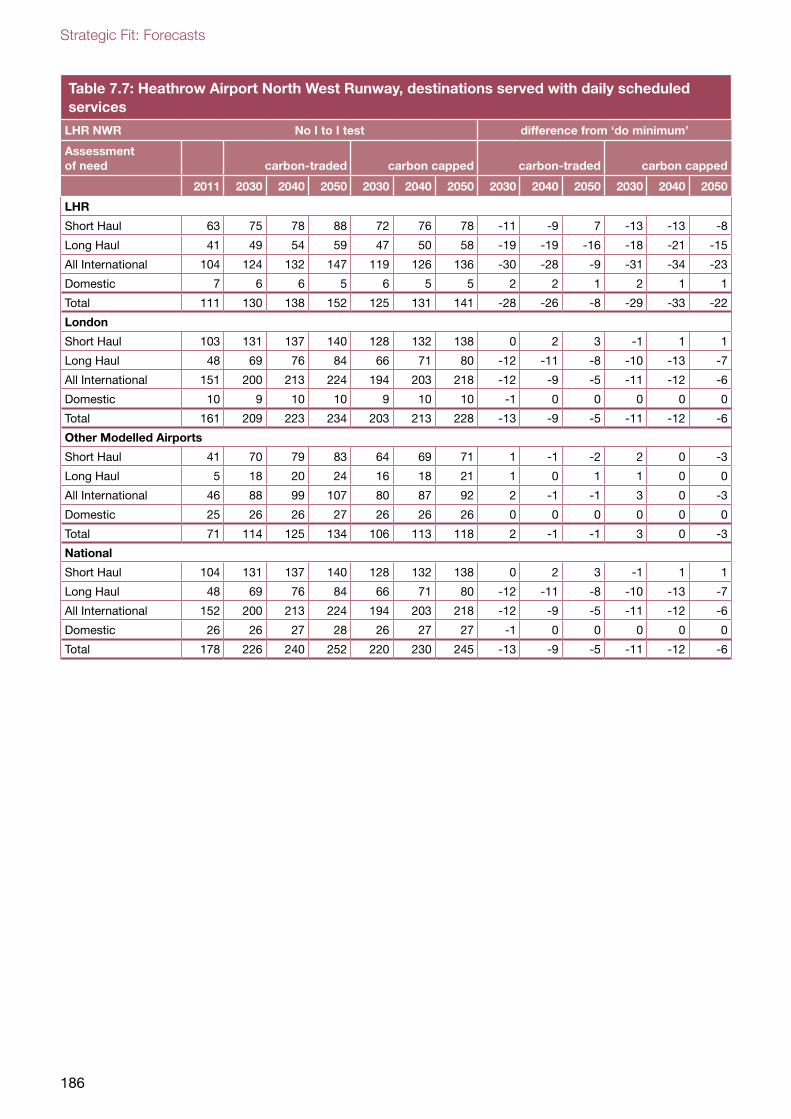
Strategic Fit: Forecasts
186
Table 7.7: Heathrow Airport North West Runway, destinations served with daily scheduled services
LHR NWR No I to I test difference from ‘do minimum’
Assessment of need carbon-traded carbon capped carbon-traded carbon capped
2011 2030 2040 2050 2030 2040 2050 2030 2040 2050 2030 2040 2050
LHR
Short Haul 63 75 78 88 72 76 78 -11 -9 7 -13 -13 -8
Long Haul 41 49 54 59 47 50 58 -19 -19 -16 -18 -21 -15
All International 104 124 132 147 119 126 136 -30 -28 -9 -31 -34 -23
Domestic 7 6 6 5 6 5 5 2 2 1 2 1 1
Total 111 130 138 152 125 131 141 -28 -26 -8 -29 -33 -22
London
Short Haul 103 131 137 140 128 132 138 0 2 3 -1 1 1
Long Haul 48 69 76 84 66 71 80 -12 -11 -8 -10 -13 -7
All International 151 200 213 224 194 203 218 -12 -9 -5 -11 -12 -6
Domestic 10 9 10 10 9 10 10 -1 0 0 0 0 0
Total 161 209 223 234 203 213 228 -13 -9 -5 -11 -12 -6
Other Modelled Airports
Short Haul 41 70 79 83 64 69 71 1 -1 -2 2 0 -3
Long Haul 5 18 20 24 16 18 21 1 0 1 1 0 0
All International 46 88 99 107 80 87 92 2 -1 -1 3 0 -3
Domestic 25 26 26 27 26 26 26 0 0 0 0 0 0
Total 71 114 125 134 106 113 118 2 -1 -1 3 0 -3
National
Short Haul 104 131 137 140 128 132 138 0 2 3 -1 1 1
Long Haul 48 69 76 84 66 71 80 -12 -11 -8 -10 -13 -7
All International 152 200 213 224 194 203 218 -12 -9 -5 -11 -12 -6
Domestic 26 26 27 28 26 27 27 -1 0 0 0 0 0
Total 178 226 240 252 220 230 245 -13 -9 -5 -11 -12 -6
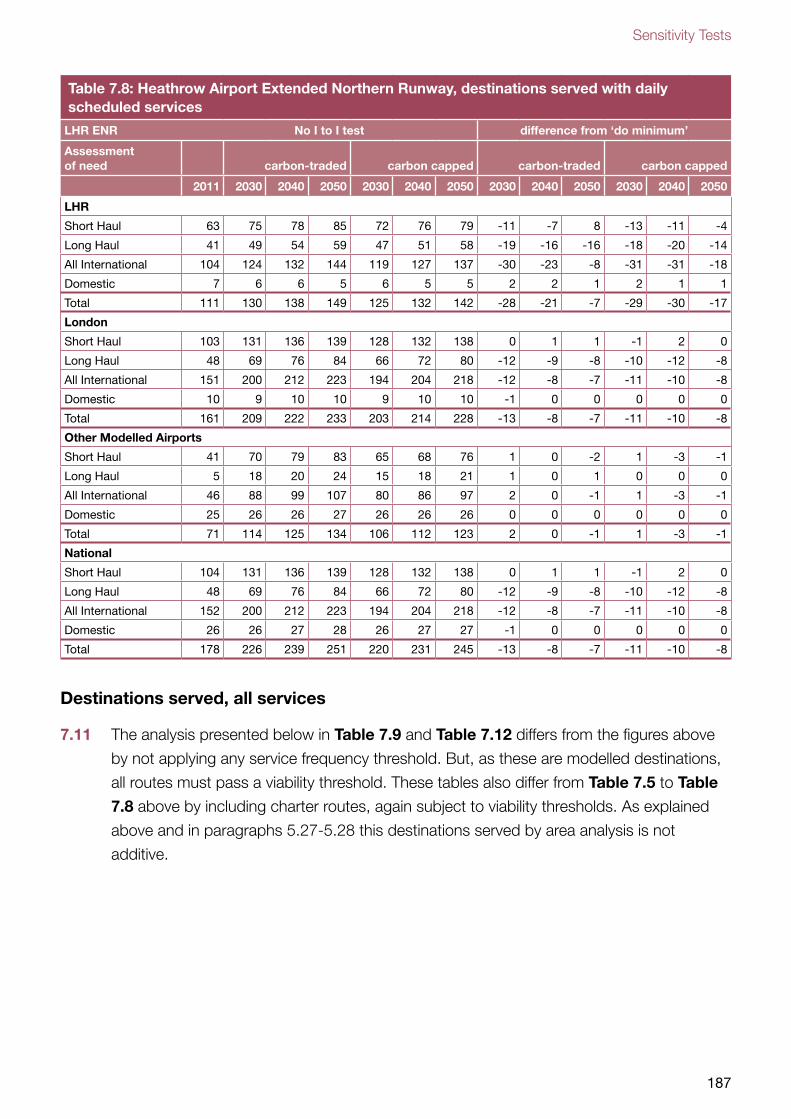
Sensitivity Tests
187
Table 7.8: Heathrow Airport Extended Northern Runway, destinations served with daily scheduled services
LHR ENR No I to I test difference from ‘do minimum’
Assessment of need carbon-traded carbon capped carbon-traded carbon capped
2011 2030 2040 2050 2030 2040 2050 2030 2040 2050 2030 2040 2050
LHR
Short Haul 63 75 78 85 72 76 79 -11 -7 8 -13 -11 -4
Long Haul 41 49 54 59 47 51 58 -19 -16 -16 -18 -20 -14
All International 104 124 132 144 119 127 137 -30 -23 -8 -31 -31 -18
Domestic 7 6 6 5 6 5 5 2 2 1 2 1 1
Total 111 130 138 149 125 132 142 -28 -21 -7 -29 -30 -17
London
Short Haul 103 131 136 139 128 132 138 0 1 1 -1 2 0
Long Haul 48 69 76 84 66 72 80 -12 -9 -8 -10 -12 -8
All International 151 200 212 223 194 204 218 -12 -8 -7 -11 -10 -8
Domestic 10 9 10 10 9 10 10 -1 0 0 0 0 0
Total 161 209 222 233 203 214 228 -13 -8 -7 -11 -10 -8
Other Modelled Airports
Short Haul 41 70 79 83 65 68 76 1 0 -2 1 -3 -1
Long Haul 5 18 20 24 15 18 21 1 0 1 0 0 0
All International 46 88 99 107 80 86 97 2 0 -1 1 -3 -1
Domestic 25 26 26 27 26 26 26 0 0 0 0 0 0
Total 71 114 125 134 106 112 123 2 0 -1 1 -3 -1
National
Short Haul 104 131 136 139 128 132 138 0 1 1 -1 2 0
Long Haul 48 69 76 84 66 72 80 -12 -9 -8 -10 -12 -8
All International 152 200 212 223 194 204 218 -12 -8 -7 -11 -10 -8
Domestic 26 26 27 28 26 27 27 -1 0 0 0 0 0
Total 178 226 239 251 220 231 245 -13 -8 -7 -11 -10 -8
Destinations served, all services
7.11 The analysis presented below in Table 7.9 and Table 7.12 differs from the figures above
by not applying any service frequency threshold. But, as these are modelled destinations,
all routes must pass a viability threshold. These tables also differ from Table 7.5 to Table
7.8 above by including charter routes, again subject to viability thresholds. As explained
above and in paragraphs 5.27-5.28 this destinations served by area analysis is not
additive.
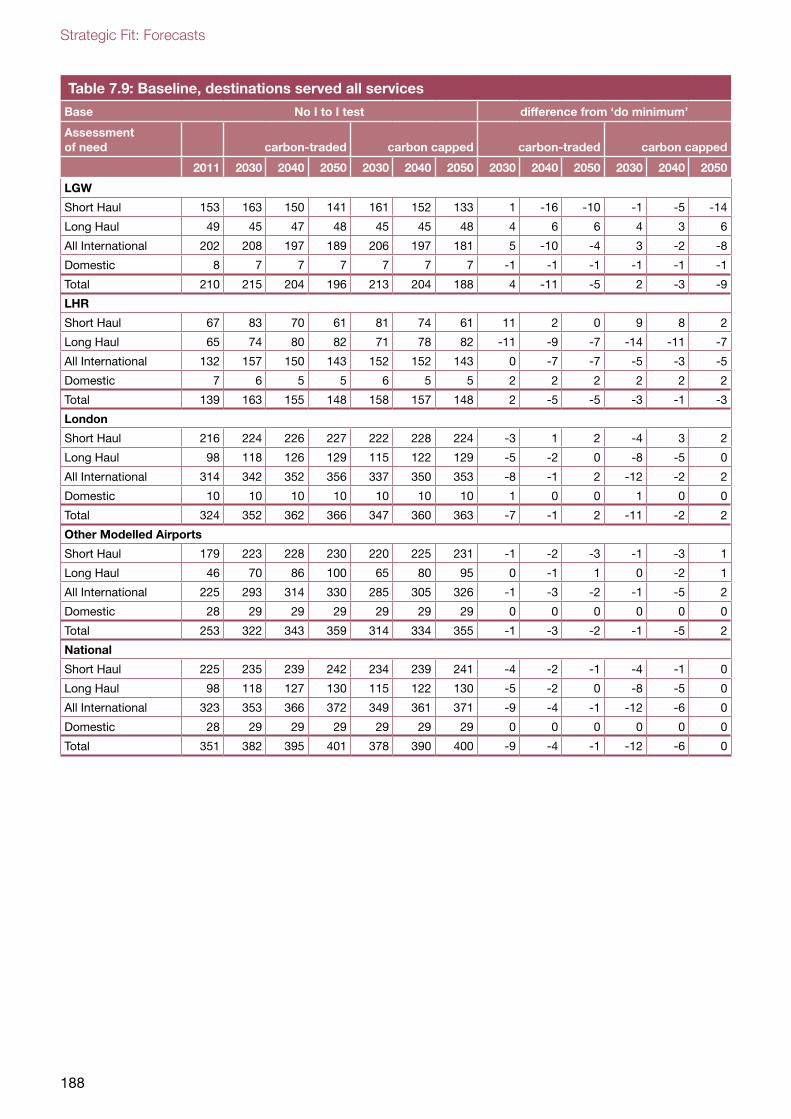
Strategic Fit: Forecasts
188
Table 7.9: Baseline, destinations served all services
Base No I to I test difference from ‘do minimum’
Assessment of need carbon-traded carbon capped carbon-traded carbon capped
2011 2030 2040 2050 2030 2040 2050 2030 2040 2050 2030 2040 2050
LGW
Short Haul 153 163 150 141 161 152 133 1 -16 -10 -1 -5 -14
Long Haul 49 45 47 48 45 45 48 4 6 6 4 3 6
All International 202 208 197 189 206 197 181 5 -10 -4 3 -2 -8
Domestic 8 7 7 7 7 7 7 -1 -1 -1 -1 -1 -1
Total 210 215 204 196 213 204 188 4 -11 -5 2 -3 -9
LHR
Short Haul 67 83 70 61 81 74 61 11 2 0 9 8 2
Long Haul 65 74 80 82 71 78 82 -11 -9 -7 -14 -11 -7
All International 132 157 150 143 152 152 143 0 -7 -7 -5 -3 -5
Domestic 7 6 5 5 6 5 5 2 2 2 2 2 2
Total 139 163 155 148 158 157 148 2 -5 -5 -3 -1 -3
London
Short Haul 216 224 226 227 222 228 224 -3 1 2 -4 3 2
Long Haul 98 118 126 129 115 122 129 -5 -2 0 -8 -5 0
All International 314 342 352 356 337 350 353 -8 -1 2 -12 -2 2
Domestic 10 10 10 10 10 10 10 1 0 0 1 0 0
Total 324 352 362 366 347 360 363 -7 -1 2 -11 -2 2
Other Modelled Airports
Short Haul 179 223 228 230 220 225 231 -1 -2 -3 -1 -3 1
Long Haul 46 70 86 100 65 80 95 0 -1 1 0 -2 1
All International 225 293 314 330 285 305 326 -1 -3 -2 -1 -5 2
Domestic 28 29 29 29 29 29 29 0 0 0 0 0 0
Total 253 322 343 359 314 334 355 -1 -3 -2 -1 -5 2
National
Short Haul 225 235 239 242 234 239 241 -4 -2 -1 -4 -1 0
Long Haul 98 118 127 130 115 122 130 -5 -2 0 -8 -5 0
All International 323 353 366 372 349 361 371 -9 -4 -1 -12 -6 0
Domestic 28 29 29 29 29 29 29 0 0 0 0 0 0
Total 351 382 395 401 378 390 400 -9 -4 -1 -12 -6 0
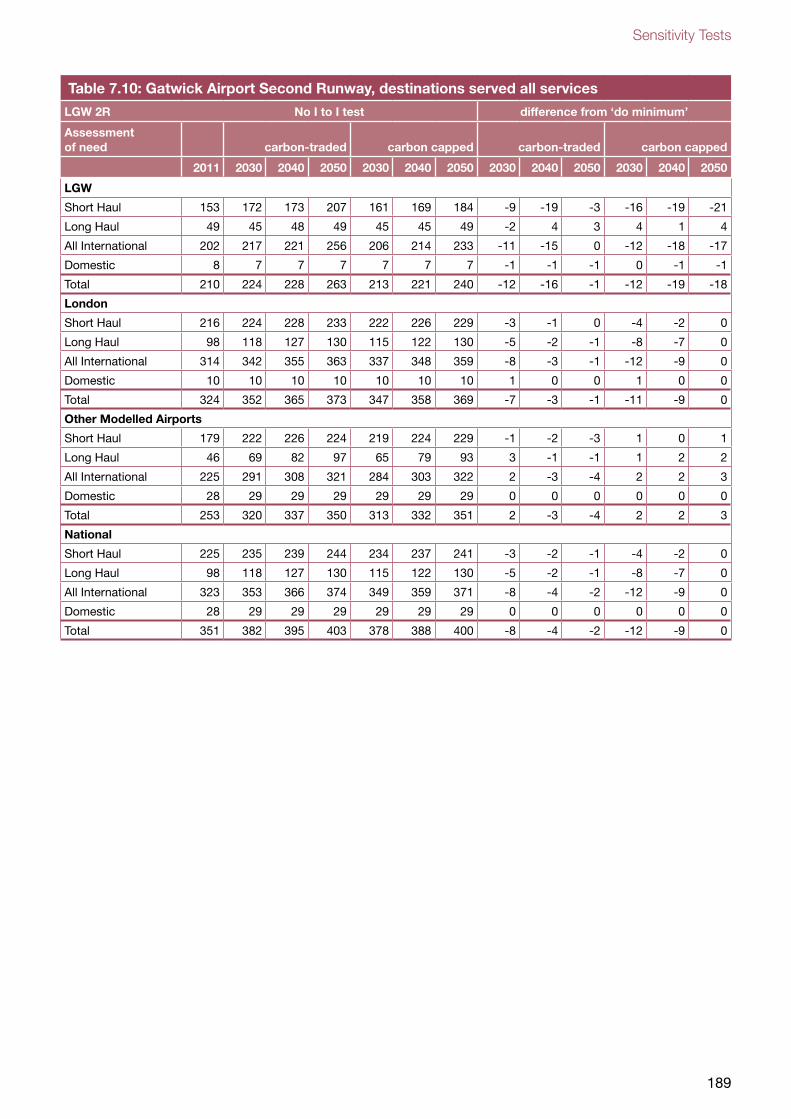
Sensitivity Tests
189
Table 7.10: Gatwick Airport Second Runway, destinations served all services
LGW 2R No I to I test difference from ‘do minimum’
Assessment of need carbon-traded carbon capped carbon-traded carbon capped
2011 2030 2040 2050 2030 2040 2050 2030 2040 2050 2030 2040 2050
LGW
Short Haul 153 172 173 207 161 169 184 -9 -19 -3 -16 -19 -21
Long Haul 49 45 48 49 45 45 49 -2 4 3 4 1 4
All International 202 217 221 256 206 214 233 -11 -15 0 -12 -18 -17
Domestic 8 7 7 7 7 7 7 -1 -1 -1 0 -1 -1
Total 210 224 228 263 213 221 240 -12 -16 -1 -12 -19 -18
London
Short Haul 216 224 228 233 222 226 229 -3 -1 0 -4 -2 0
Long Haul 98 118 127 130 115 122 130 -5 -2 -1 -8 -7 0
All International 314 342 355 363 337 348 359 -8 -3 -1 -12 -9 0
Domestic 10 10 10 10 10 10 10 1 0 0 1 0 0
Total 324 352 365 373 347 358 369 -7 -3 -1 -11 -9 0
Other Modelled Airports
Short Haul 179 222 226 224 219 224 229 -1 -2 -3 1 0 1
Long Haul 46 69 82 97 65 79 93 3 -1 -1 1 2 2
All International 225 291 308 321 284 303 322 2 -3 -4 2 2 3
Domestic 28 29 29 29 29 29 29 0 0 0 0 0 0
Total 253 320 337 350 313 332 351 2 -3 -4 2 2 3
National
Short Haul 225 235 239 244 234 237 241 -3 -2 -1 -4 -2 0
Long Haul 98 118 127 130 115 122 130 -5 -2 -1 -8 -7 0
All International 323 353 366 374 349 359 371 -8 -4 -2 -12 -9 0
Domestic 28 29 29 29 29 29 29 0 0 0 0 0 0
Total 351 382 395 403 378 388 400 -8 -4 -2 -12 -9 0

Strategic Fit: Forecasts
190
Table 7.11: Heathrow Airport North West Runway, destinations served all services
LHR NWR No I to I test difference from ‘do minimum’
Assessment of need carbon-traded carbon capped carbon-traded carbon capped
2011 2030 2040 2050 2030 2040 2050 2030 2040 2050 2030 2040 2050
LHR
Short Haul 67 84 87 101 81 84 90 -14 -12 15 -15 -18 -6
Long Haul 65 74 80 82 70 77 82 -20 -18 -17 -22 -20 -16
All International 132 158 167 183 151 161 172 -34 -30 -2 -37 -38 -22
Domestic 7 6 6 5 6 5 5 2 2 1 2 1 1
Total 139 164 173 188 157 166 177 -32 -28 -1 -35 -37 -21
London
Short Haul 216 223 226 231 222 222 225 -2 0 0 -1 0 -1
Long Haul 98 118 127 129 114 121 129 -6 -3 -4 -9 -5 -1
All International 314 341 353 360 336 343 354 -8 -3 -4 -10 -5 -2
Domestic 10 10 10 10 10 10 10 0 0 0 0 0 0
Total 324 351 363 370 346 353 364 -8 -3 -4 -10 -5 -2
Other Modelled Airports
Short Haul 179 223 226 228 214 222 227 1 -2 3 0 -1 7
Long Haul 46 70 82 93 60 74 87 2 1 1 1 4 1
All International 225 293 308 321 274 296 314 3 -1 4 1 3 8
Domestic 28 29 29 29 29 29 29 0 0 0 0 0 0
Total 253 322 337 350 303 325 343 3 -1 4 1 3 8
National
Short Haul 225 234 237 240 234 234 235 -2 -3 -3 -2 -2 -3
Long Haul 98 118 127 130 114 121 129 -6 -3 -3 -9 -5 -1
All International 323 352 364 370 348 355 364 -8 -6 -6 -11 -7 -4
Domestic 28 29 29 29 29 29 29 0 0 0 0 0 0
Total 351 381 393 399 377 384 393 -8 -6 -6 -11 -7 -4
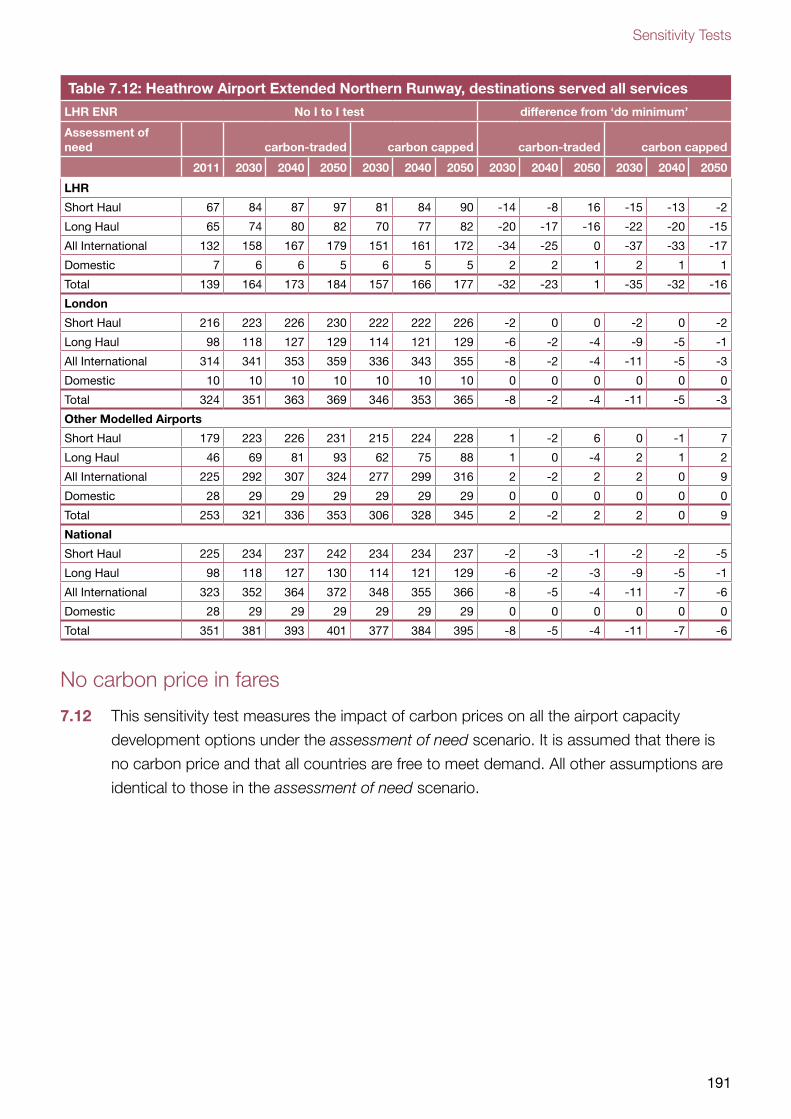
Sensitivity Tests
191
Table 7.12: Heathrow Airport Extended Northern Runway, destinations served all services
LHR ENR No I to I test difference from ‘do minimum’
Assessment of need carbon-traded carbon capped carbon-traded carbon capped
2011 2030 2040 2050 2030 2040 2050 2030 2040 2050 2030 2040 2050
LHR
Short Haul 67 84 87 97 81 84 90 -14 -8 16 -15 -13 -2
Long Haul 65 74 80 82 70 77 82 -20 -17 -16 -22 -20 -15
All International 132 158 167 179 151 161 172 -34 -25 0 -37 -33 -17
Domestic 7 6 6 5 6 5 5 2 2 1 2 1 1
Total 139 164 173 184 157 166 177 -32 -23 1 -35 -32 -16
London
Short Haul 216 223 226 230 222 222 226 -2 0 0 -2 0 -2
Long Haul 98 118 127 129 114 121 129 -6 -2 -4 -9 -5 -1
All International 314 341 353 359 336 343 355 -8 -2 -4 -11 -5 -3
Domestic 10 10 10 10 10 10 10 0 0 0 0 0 0
Total 324 351 363 369 346 353 365 -8 -2 -4 -11 -5 -3
Other Modelled Airports
Short Haul 179 223 226 231 215 224 228 1 -2 6 0 -1 7
Long Haul 46 69 81 93 62 75 88 1 0 -4 2 1 2
All International 225 292 307 324 277 299 316 2 -2 2 2 0 9
Domestic 28 29 29 29 29 29 29 0 0 0 0 0 0
Total 253 321 336 353 306 328 345 2 -2 2 2 0 9
National
Short Haul 225 234 237 242 234 234 237 -2 -3 -1 -2 -2 -5
Long Haul 98 118 127 130 114 121 129 -6 -2 -3 -9 -5 -1
All International 323 352 364 372 348 355 366 -8 -5 -4 -11 -7 -6
Domestic 28 29 29 29 29 29 29 0 0 0 0 0 0
Total 351 381 393 401 377 384 395 -8 -5 -4 -11 -7 -6
No carbon price in fares
7.12 This sensitivity test measures the impact of carbon prices on all the airport capacity
development options under the assessment of need scenario. It is assumed that there is
no carbon price and that all countries are free to meet demand. All other assumptions are
identical to those in the assessment of need scenario.
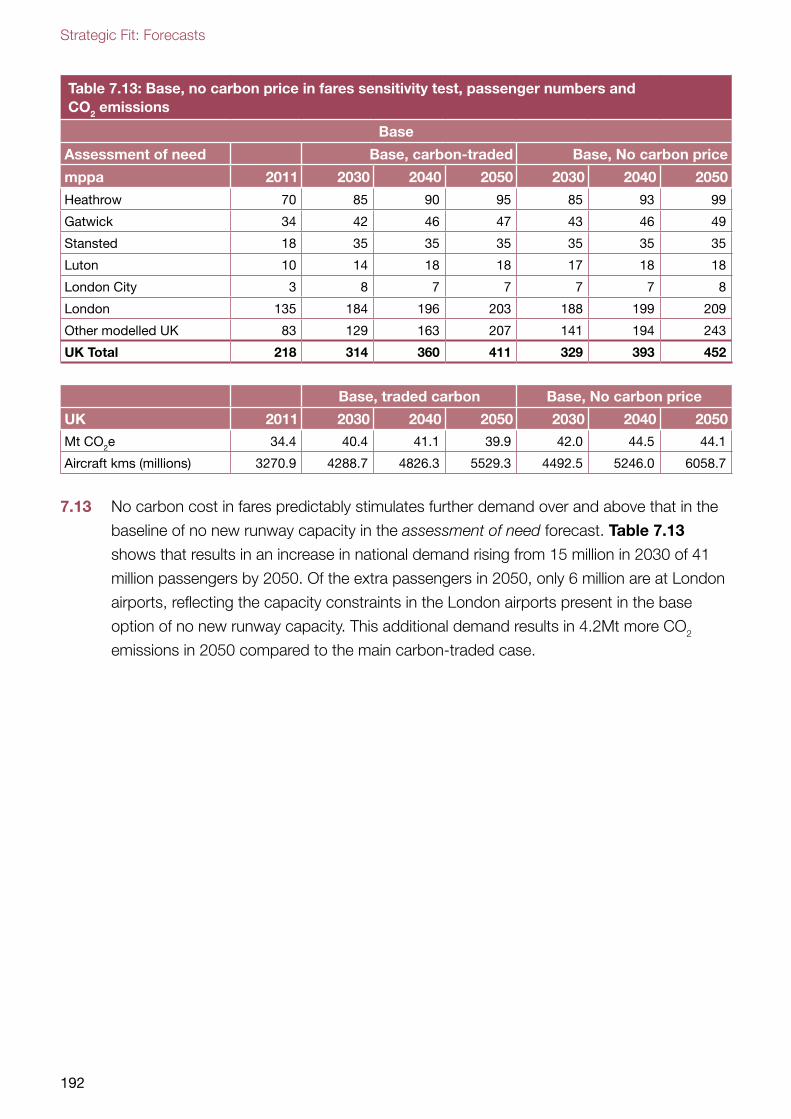
Strategic Fit: Forecasts
192
Table 7.13: Base, no carbon price in fares sensitivity test, passenger numbers and CO2 emissions
Base
Assessment of need Base, carbon-traded Base, No carbon price
mppa 2011 2030 2040 2050 2030 2040 2050
Heathrow 70 85 90 95 85 93 99
Gatwick 34 42 46 47 43 46 49
Stansted 18 35 35 35 35 35 35
Luton 10 14 18 18 17 18 18
London City 3 8 7 7 7 7 8
London 135 184 196 203 188 199 209
Other modelled UK 83 129 163 207 141 194 243
UK Total 218 314 360 411 329 393 452
Base, traded carbon Base, No carbon price
UK 2011 2030 2040 2050 2030 2040 2050
Mt CO2e 34.4 40.4 41.1 39.9 42.0 44.5 44.1
Aircraft kms (millions) 3270.9 4288.7 4826.3 5529.3 4492.5 5246.0 6058.7
7.13 No carbon cost in fares predictably stimulates further demand over and above that in the
baseline of no new runway capacity in the assessment of need forecast. Table 7.13
shows that results in an increase in national demand rising from 15 million in 2030 of 41
million passengers by 2050. Of the extra passengers in 2050, only 6 million are at London
airports, reflecting the capacity constraints in the London airports present in the base
option of no new runway capacity. This additional demand results in 4.2Mt more CO2
emissions in 2050 compared to the main carbon-traded case.
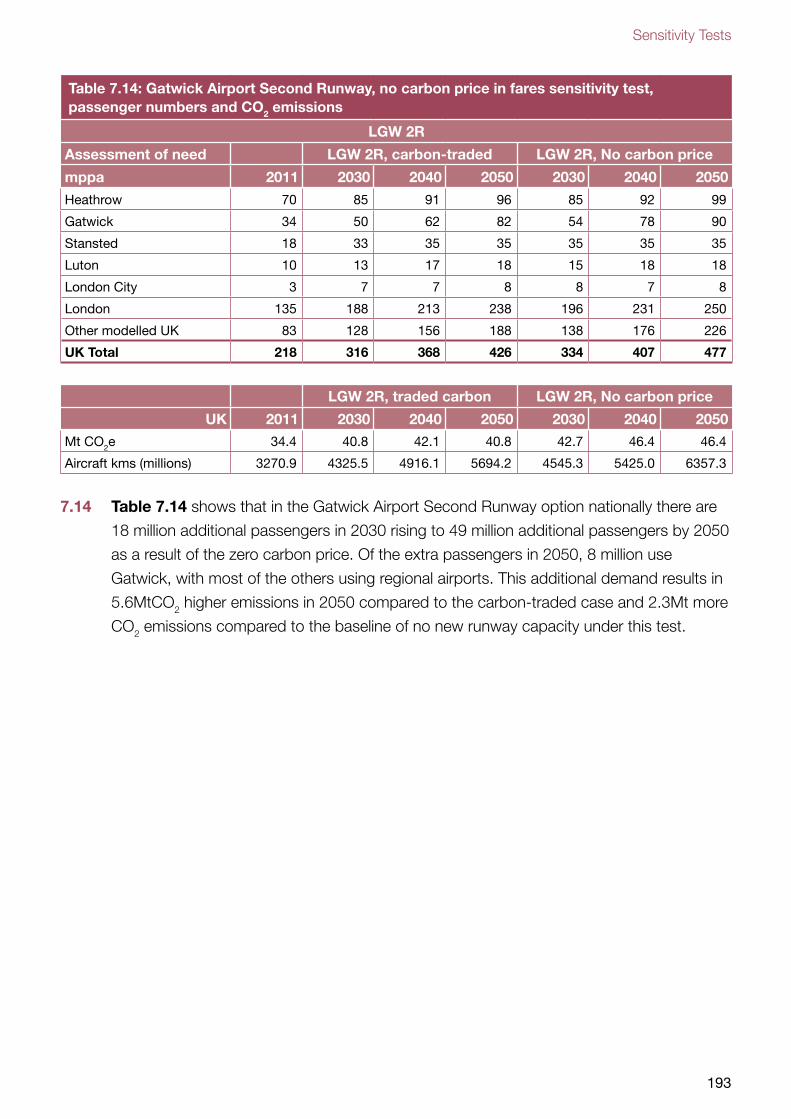
Sensitivity Tests
193
Table 7.14: Gatwick Airport Second Runway, no carbon price in fares sensitivity test, passenger numbers and CO2 emissions
LGW 2R
Assessment of need LGW 2R, carbon-traded LGW 2R, No carbon price
mppa 2011 2030 2040 2050 2030 2040 2050
Heathrow 70 85 91 96 85 92 99
Gatwick 34 50 62 82 54 78 90
Stansted 18 33 35 35 35 35 35
Luton 10 13 17 18 15 18 18
London City 3 7 7 8 8 7 8
London 135 188 213 238 196 231 250
Other modelled UK 83 128 156 188 138 176 226
UK Total 218 316 368 426 334 407 477
LGW 2R, traded carbon LGW 2R, No carbon price
UK 2011 2030 2040 2050 2030 2040 2050
Mt CO2e 34.4 40.8 42.1 40.8 42.7 46.4 46.4
Aircraft kms (millions) 3270.9 4325.5 4916.1 5694.2 4545.3 5425.0 6357.3
7.14 Table 7.14 shows that in the Gatwick Airport Second Runway option nationally there are
18 million additional passengers in 2030 rising to 49 million additional passengers by 2050
as a result of the zero carbon price. Of the extra passengers in 2050, 8 million use
Gatwick, with most of the others using regional airports. This additional demand results in
5.6MtCO2 higher emissions in 2050 compared to the carbon-traded case and 2.3Mt more
CO2 emissions compared to the baseline of no new runway capacity under this test.
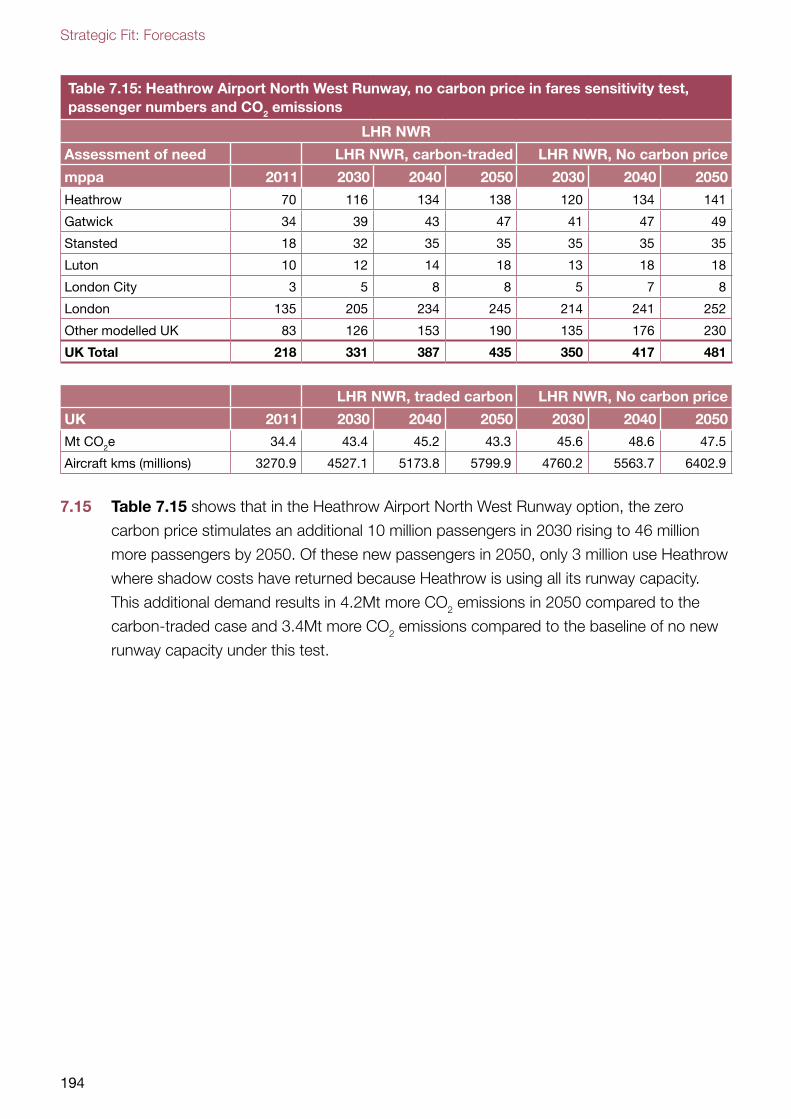
Strategic Fit: Forecasts
194
Table 7.15: Heathrow Airport North West Runway, no carbon price in fares sensitivity test, passenger numbers and CO2 emissions
LHR NWR
Assessment of need LHR NWR, carbon-traded LHR NWR, No carbon price
mppa 2011 2030 2040 2050 2030 2040 2050
Heathrow 70 116 134 138 120 134 141
Gatwick 34 39 43 47 41 47 49
Stansted 18 32 35 35 35 35 35
Luton 10 12 14 18 13 18 18
London City 3 5 8 8 5 7 8
London 135 205 234 245 214 241 252
Other modelled UK 83 126 153 190 135 176 230
UK Total 218 331 387 435 350 417 481
LHR NWR, traded carbon LHR NWR, No carbon price
UK 2011 2030 2040 2050 2030 2040 2050
Mt CO2e 34.4 43.4 45.2 43.3 45.6 48.6 47.5
Aircraft kms (millions) 3270.9 4527.1 5173.8 5799.9 4760.2 5563.7 6402.9
7.15 Table 7.15 shows that in the Heathrow Airport North West Runway option, the zero
carbon price stimulates an additional 10 million passengers in 2030 rising to 46 million
more passengers by 2050. Of these new passengers in 2050, only 3 million use Heathrow
where shadow costs have returned because Heathrow is using all its runway capacity.
This additional demand results in 4.2Mt more CO2 emissions in 2050 compared to the
carbon-traded case and 3.4Mt more CO2 emissions compared to the baseline of no new
runway capacity under this test.
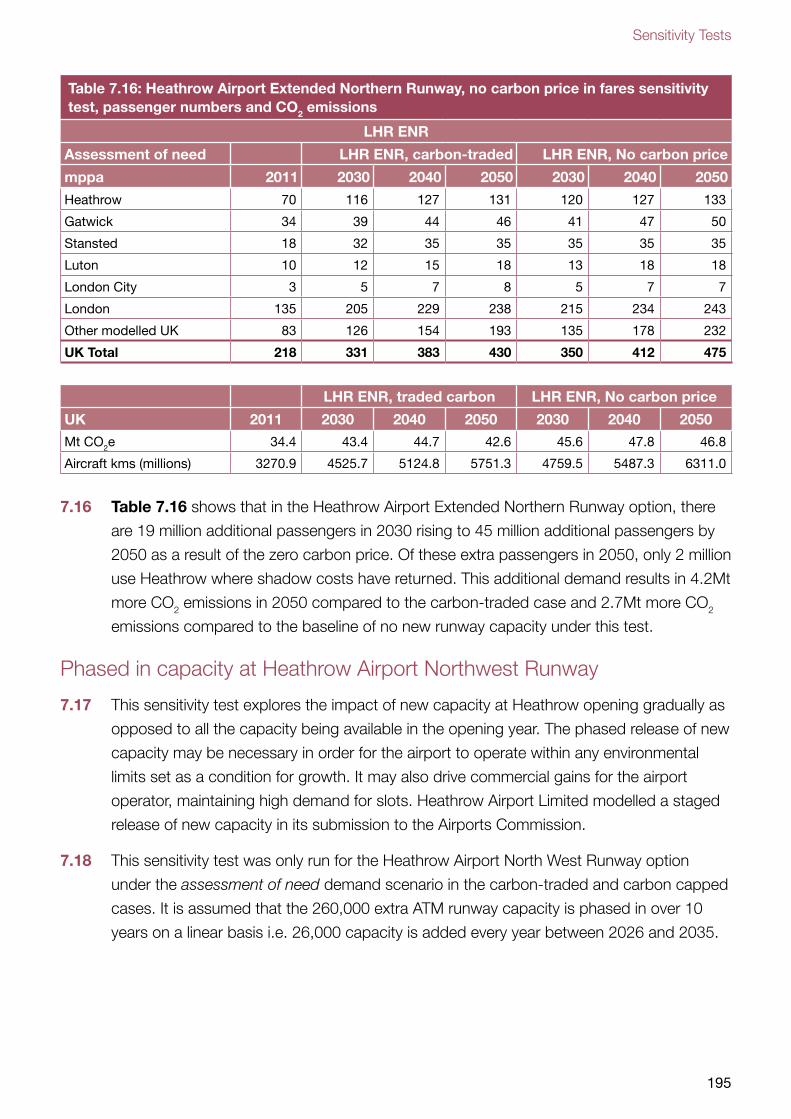
Sensitivity Tests
195
Table 7.16: Heathrow Airport Extended Northern Runway, no carbon price in fares sensitivity test, passenger numbers and CO2 emissions
LHR ENR
Assessment of need LHR ENR, carbon-traded LHR ENR, No carbon price
mppa 2011 2030 2040 2050 2030 2040 2050
Heathrow 70 116 127 131 120 127 133
Gatwick 34 39 44 46 41 47 50
Stansted 18 32 35 35 35 35 35
Luton 10 12 15 18 13 18 18
London City 3 5 7 8 5 7 7
London 135 205 229 238 215 234 243
Other modelled UK 83 126 154 193 135 178 232
UK Total 218 331 383 430 350 412 475
LHR ENR, traded carbon LHR ENR, No carbon price
UK 2011 2030 2040 2050 2030 2040 2050
Mt CO2e 34.4 43.4 44.7 42.6 45.6 47.8 46.8
Aircraft kms (millions) 3270.9 4525.7 5124.8 5751.3 4759.5 5487.3 6311.0
7.16 Table 7.16 shows that in the Heathrow Airport Extended Northern Runway option, there
are 19 million additional passengers in 2030 rising to 45 million additional passengers by
2050 as a result of the zero carbon price. Of these extra passengers in 2050, only 2 million
use Heathrow where shadow costs have returned. This additional demand results in 4.2Mt
more CO2 emissions in 2050 compared to the carbon-traded case and 2.7Mt more CO2
emissions compared to the baseline of no new runway capacity under this test.
Phased in capacity at Heathrow Airport Northwest Runway
7.17 This sensitivity test explores the impact of new capacity at Heathrow opening gradually as
opposed to all the capacity being available in the opening year. The phased release of new
capacity may be necessary in order for the airport to operate within any environmental
limits set as a condition for growth. It may also drive commercial gains for the airport
operator, maintaining high demand for slots. Heathrow Airport Limited modelled a staged
release of new capacity in its submission to the Airports Commission.
7.18 This sensitivity test was only run for the Heathrow Airport North West Runway option
under the assessment of need demand scenario in the carbon-traded and carbon capped
cases. It is assumed that the 260,000 extra ATM runway capacity is phased in over 10
years on a linear basis i.e. 26,000 capacity is added every year between 2026 and 2035.
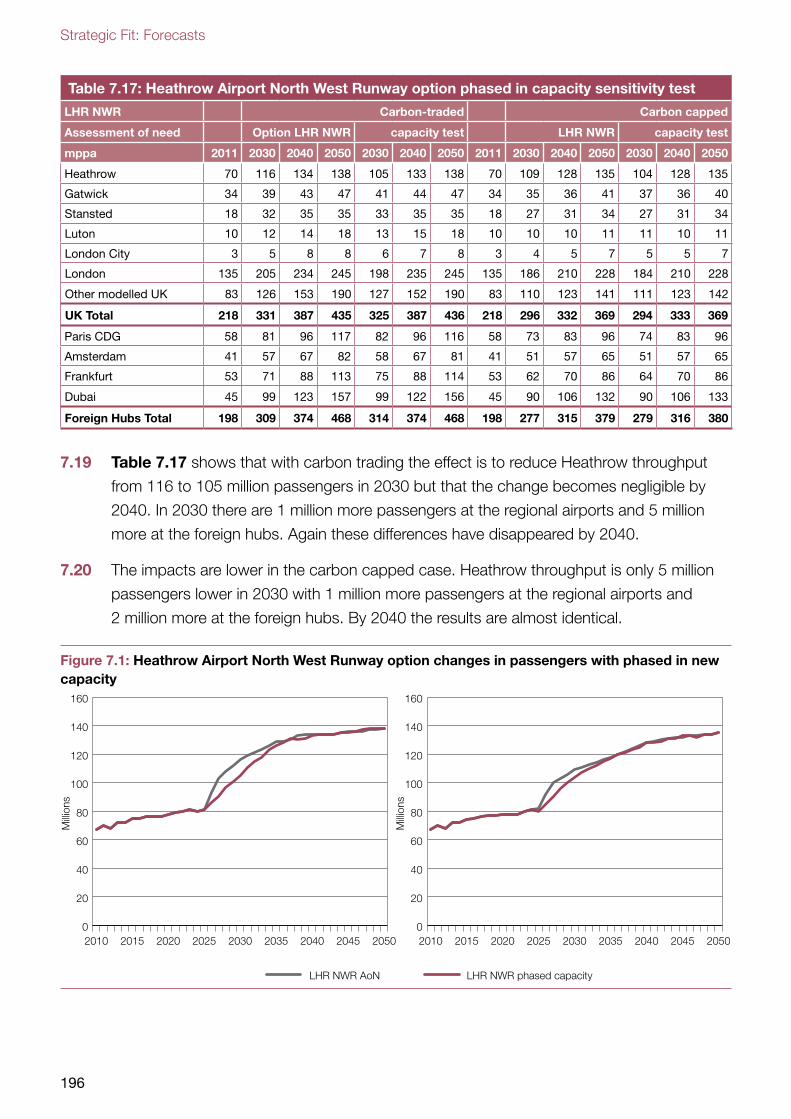
Strategic Fit: Forecasts
196
Table 7.17: Heathrow Airport North West Runway option phased in capacity sensitivity test
LHR NWR Carbon-traded Carbon capped
Assessment of need Option LHR NWR capacity test LHR NWR capacity test
mppa 2011 2030 2040 2050 2030 2040 2050 2011 2030 2040 2050 2030 2040 2050
Heathrow 70 116 134 138 105 133 138 70 109 128 135 104 128 135
Gatwick 34 39 43 47 41 44 47 34 35 36 41 37 36 40
Stansted 18 32 35 35 33 35 35 18 27 31 34 27 31 34
Luton 10 12 14 18 13 15 18 10 10 10 11 11 10 11
London City 3 5 8 8 6 7 8 3 4 5 7 5 5 7
London 135 205 234 245 198 235 245 135 186 210 228 184 210 228
Other modelled UK 83 126 153 190 127 152 190 83 110 123 141 111 123 142
UK Total 218 331 387 435 325 387 436 218 296 332 369 294 333 369
Paris CDG 58 81 96 117 82 96 116 58 73 83 96 74 83 96
Amsterdam 41 57 67 82 58 67 81 41 51 57 65 51 57 65
Frankfurt 53 71 88 113 75 88 114 53 62 70 86 64 70 86
Dubai 45 99 123 157 99 122 156 45 90 106 132 90 106 133
Foreign Hubs Total 198 309 374 468 314 374 468 198 277 315 379 279 316 380
7.19 Table 7.17 shows that with carbon trading the effect is to reduce Heathrow throughput
from 116 to 105 million passengers in 2030 but that the change becomes negligible by
2040. In 2030 there are 1 million more passengers at the regional airports and 5 million
more at the foreign hubs. Again these differences have disappeared by 2040.
7.20 The impacts are lower in the carbon capped case. Heathrow throughput is only 5 million
passengers lower in 2030 with 1 million more passengers at the regional airports and
2 million more at the foreign hubs. By 2040 the results are almost identical.
Figure 7.1: Heathrow Airport North West Runway option changes in passengers with phased in new capacity
0
20
40
60
80
100
120
140
160
205020452040203520302025202020152010
LHR NWR AoN
Milli
ons
0
20
40
60
80
100
120
140
160
205020452040203520302025202020152010
Milli
ons
LHR NWR phased capacity
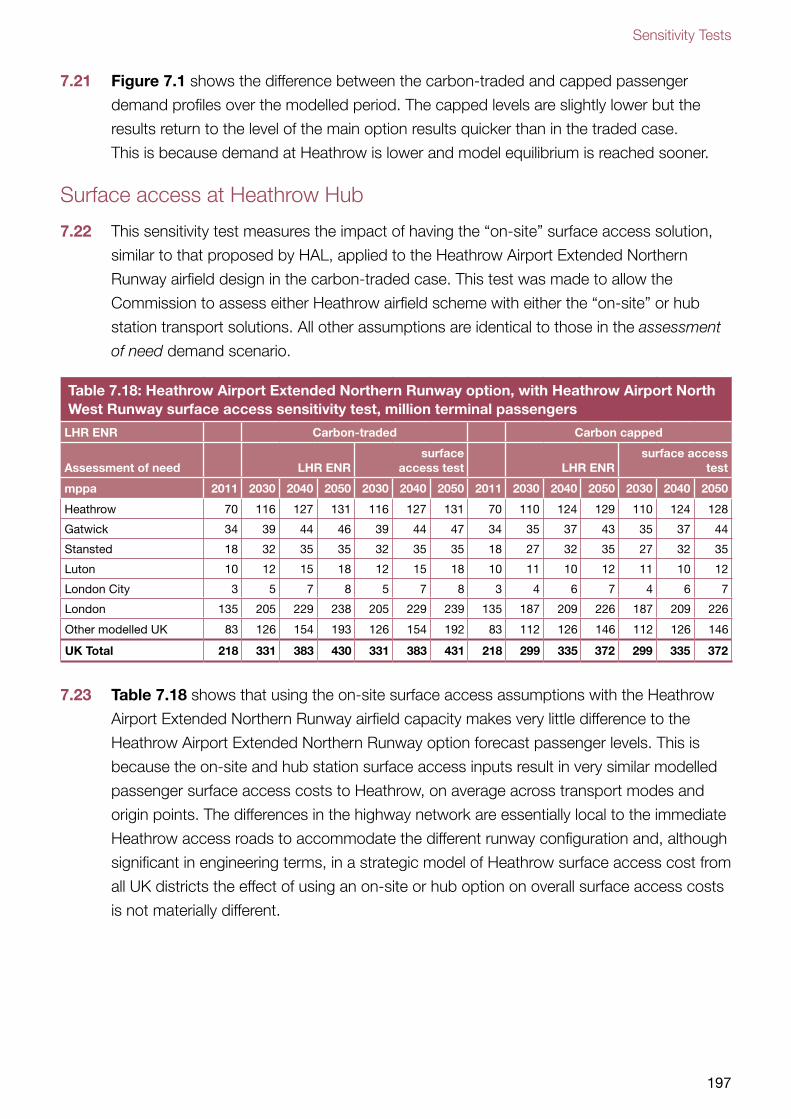
Sensitivity Tests
197
7.21 Figure 7.1 shows the difference between the carbon-traded and capped passenger
demand profiles over the modelled period. The capped levels are slightly lower but the
results return to the level of the main option results quicker than in the traded case.
This is because demand at Heathrow is lower and model equilibrium is reached sooner.
Surface access at Heathrow Hub
7.22 This sensitivity test measures the impact of having the “on-site” surface access solution,
similar to that proposed by HAL, applied to the Heathrow Airport Extended Northern
Runway airfield design in the carbon-traded case. This test was made to allow the
Commission to assess either Heathrow airfield scheme with either the “on-site” or hub
station transport solutions. All other assumptions are identical to those in the assessment
of need demand scenario.
Table 7.18: Heathrow Airport Extended Northern Runway option, with Heathrow Airport North West Runway surface access sensitivity test, million terminal passengers
LHR ENR Carbon-traded Carbon capped
Assessment of need LHR ENRsurface
access test LHR ENRsurface access
test
mppa 2011 2030 2040 2050 2030 2040 2050 2011 2030 2040 2050 2030 2040 2050
Heathrow 70 116 127 131 116 127 131 70 110 124 129 110 124 128
Gatwick 34 39 44 46 39 44 47 34 35 37 43 35 37 44
Stansted 18 32 35 35 32 35 35 18 27 32 35 27 32 35
Luton 10 12 15 18 12 15 18 10 11 10 12 11 10 12
London City 3 5 7 8 5 7 8 3 4 6 7 4 6 7
London 135 205 229 238 205 229 239 135 187 209 226 187 209 226
Other modelled UK 83 126 154 193 126 154 192 83 112 126 146 112 126 146
UK Total 218 331 383 430 331 383 431 218 299 335 372 299 335 372
7.23 Table 7.18 shows that using the on-site surface access assumptions with the Heathrow
Airport Extended Northern Runway airfield capacity makes very little difference to the
Heathrow Airport Extended Northern Runway option forecast passenger levels. This is
because the on-site and hub station surface access inputs result in very similar modelled
passenger surface access costs to Heathrow, on average across transport modes and
origin points. The differences in the highway network are essentially local to the immediate
Heathrow access roads to accommodate the different runway configuration and, although
significant in engineering terms, in a strategic model of Heathrow surface access cost from
all UK districts the effect of using an on-site or hub option on overall surface access costs
is not materially different.
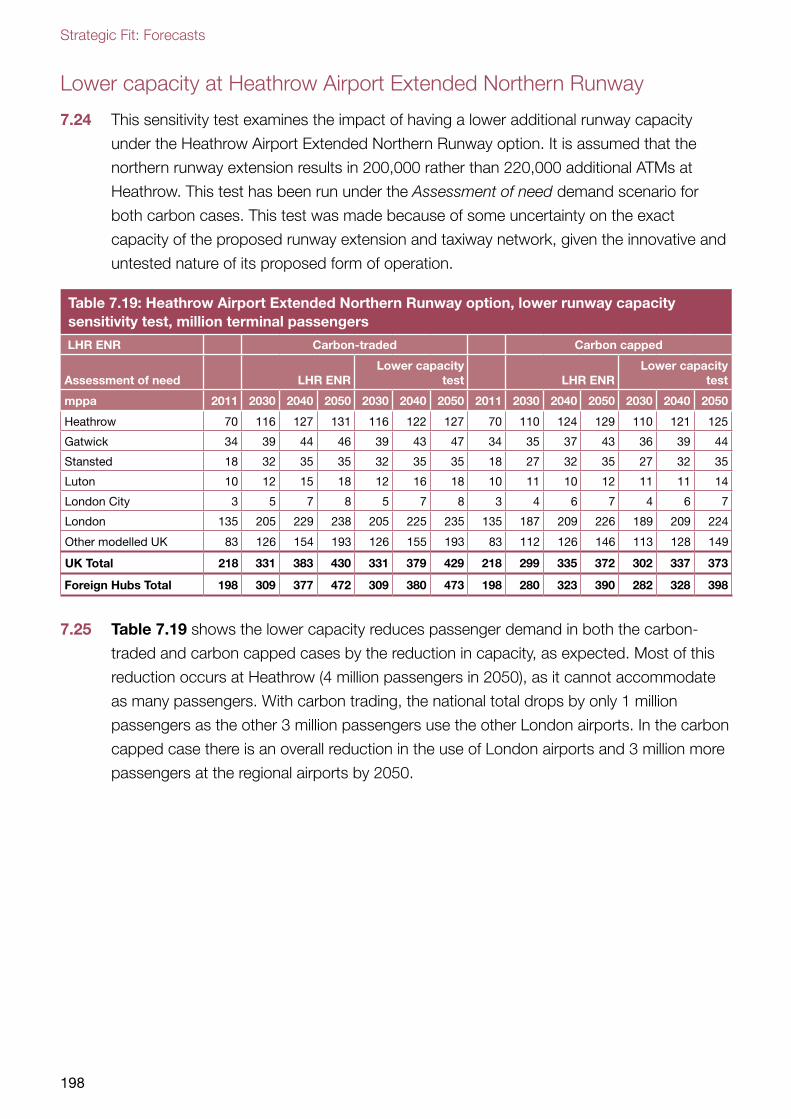
Strategic Fit: Forecasts
198
Lower capacity at Heathrow Airport Extended Northern Runway
7.24 This sensitivity test examines the impact of having a lower additional runway capacity
under the Heathrow Airport Extended Northern Runway option. It is assumed that the
northern runway extension results in 200,000 rather than 220,000 additional ATMs at
Heathrow. This test has been run under the Assessment of need demand scenario for
both carbon cases. This test was made because of some uncertainty on the exact
capacity of the proposed runway extension and taxiway network, given the innovative and
untested nature of its proposed form of operation.
Table 7.19: Heathrow Airport Extended Northern Runway option, lower runway capacity sensitivity test, million terminal passengers
LHR ENR Carbon-traded Carbon capped
Assessment of need LHR ENRLower capacity
test LHR ENRLower capacity
test
mppa 2011 2030 2040 2050 2030 2040 2050 2011 2030 2040 2050 2030 2040 2050
Heathrow 70 116 127 131 116 122 127 70 110 124 129 110 121 125
Gatwick 34 39 44 46 39 43 47 34 35 37 43 36 39 44
Stansted 18 32 35 35 32 35 35 18 27 32 35 27 32 35
Luton 10 12 15 18 12 16 18 10 11 10 12 11 11 14
London City 3 5 7 8 5 7 8 3 4 6 7 4 6 7
London 135 205 229 238 205 225 235 135 187 209 226 189 209 224
Other modelled UK 83 126 154 193 126 155 193 83 112 126 146 113 128 149
UK Total 218 331 383 430 331 379 429 218 299 335 372 302 337 373
Foreign Hubs Total 198 309 377 472 309 380 473 198 280 323 390 282 328 398
7.25 Table 7.19 shows the lower capacity reduces passenger demand in both the carbon-
traded and carbon capped cases by the reduction in capacity, as expected. Most of this
reduction occurs at Heathrow (4 million passengers in 2050), as it cannot accommodate
as many passengers. With carbon trading, the national total drops by only 1 million
passengers as the other 3 million passengers use the other London airports. In the carbon
capped case there is an overall reduction in the use of London airports and 3 million more
passengers at the regional airports by 2050.
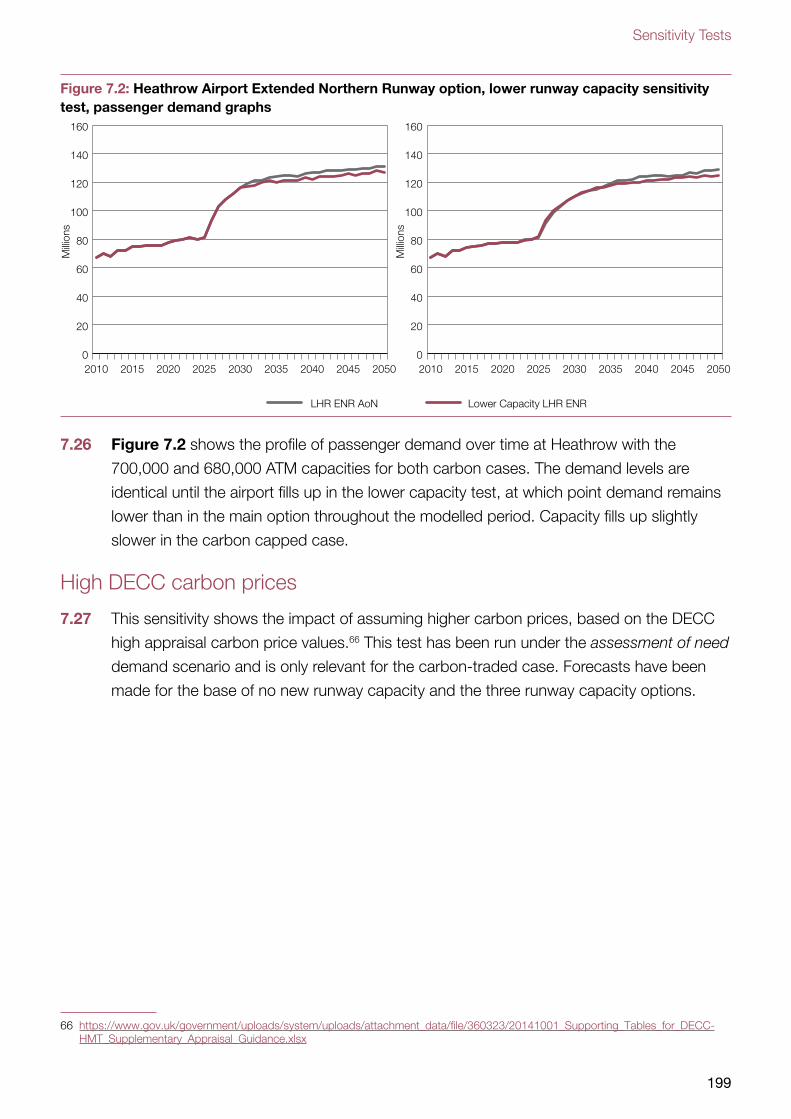
Sensitivity Tests
199
0
20
40
60
80
100
120
140
160
205020452040203520302025202020152010
LHR ENR AoN
Milli
ons
0
20
40
60
80
100
120
140
160
205020452040203520302025202020152010
Milli
ons
Lower Capacity LHR ENR
Figure 7.2: Heathrow Airport Extended Northern Runway option, lower runway capacity sensitivity test, passenger demand graphs
7.26 Figure 7.2 shows the profile of passenger demand over time at Heathrow with the
700,000 and 680,000 ATM capacities for both carbon cases. The demand levels are
identical until the airport fills up in the lower capacity test, at which point demand remains
lower than in the main option throughout the modelled period. Capacity fills up slightly
slower in the carbon capped case.
High DECC carbon prices
7.27 This sensitivity shows the impact of assuming higher carbon prices, based on the DECC
high appraisal carbon price values.66 This test has been run under the assessment of need
demand scenario and is only relevant for the carbon-traded case. Forecasts have been
made for the base of no new runway capacity and the three runway capacity options.
66 https://www.gov.uk/government/uploads/system/uploads/attachment_data/file/360323/20141001_Supporting_Tables_for_DECC-HMT_Supplementary_Appraisal_Guidance.xlsx
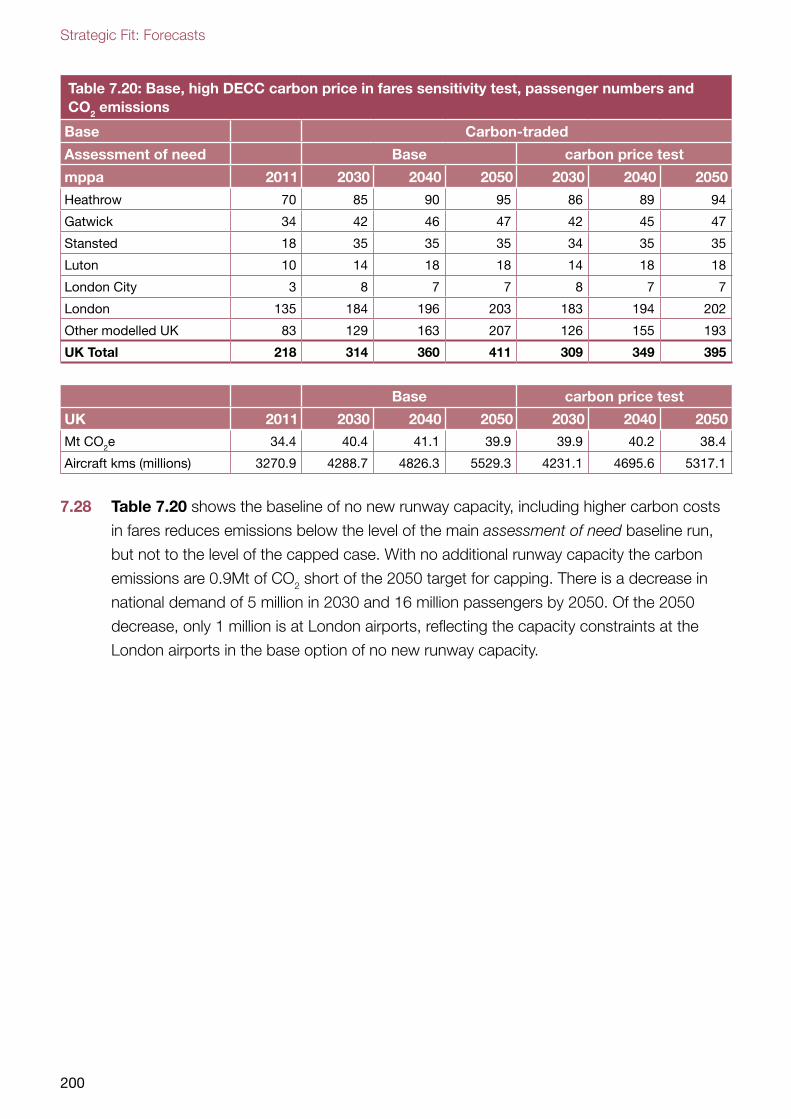
Strategic Fit: Forecasts
200
Table 7.20: Base, high DECC carbon price in fares sensitivity test, passenger numbers and CO2 emissions
Base Carbon-traded
Assessment of need Base carbon price test
mppa 2011 2030 2040 2050 2030 2040 2050
Heathrow 70 85 90 95 86 89 94
Gatwick 34 42 46 47 42 45 47
Stansted 18 35 35 35 34 35 35
Luton 10 14 18 18 14 18 18
London City 3 8 7 7 8 7 7
London 135 184 196 203 183 194 202
Other modelled UK 83 129 163 207 126 155 193
UK Total 218 314 360 411 309 349 395
Base carbon price test
UK 2011 2030 2040 2050 2030 2040 2050
Mt CO2e 34.4 40.4 41.1 39.9 39.9 40.2 38.4
Aircraft kms (millions) 3270.9 4288.7 4826.3 5529.3 4231.1 4695.6 5317.1
7.28 Table 7.20 shows the baseline of no new runway capacity, including higher carbon costs
in fares reduces emissions below the level of the main assessment of need baseline run,
but not to the level of the capped case. With no additional runway capacity the carbon
emissions are 0.9Mt of CO2 short of the 2050 target for capping. There is a decrease in
national demand of 5 million in 2030 and 16 million passengers by 2050. Of the 2050
decrease, only 1 million is at London airports, reflecting the capacity constraints at the
London airports in the base option of no new runway capacity.
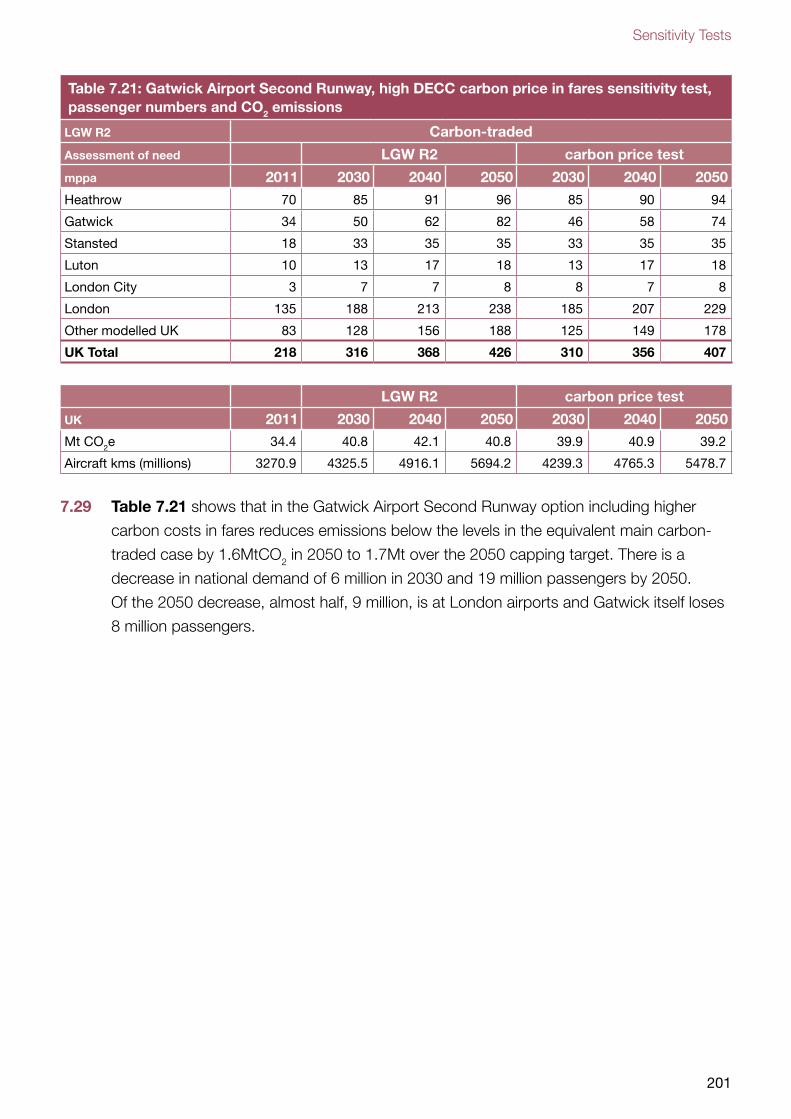
Sensitivity Tests
201
Table 7.21: Gatwick Airport Second Runway, high DECC carbon price in fares sensitivity test, passenger numbers and CO2 emissions
LGW R2 Carbon-traded
Assessment of need LGW R2 carbon price test
mppa 2011 2030 2040 2050 2030 2040 2050
Heathrow 70 85 91 96 85 90 94
Gatwick 34 50 62 82 46 58 74
Stansted 18 33 35 35 33 35 35
Luton 10 13 17 18 13 17 18
London City 3 7 7 8 8 7 8
London 135 188 213 238 185 207 229
Other modelled UK 83 128 156 188 125 149 178
UK Total 218 316 368 426 310 356 407
LGW R2 carbon price test
UK 2011 2030 2040 2050 2030 2040 2050Mt CO2e 34.4 40.8 42.1 40.8 39.9 40.9 39.2
Aircraft kms (millions) 3270.9 4325.5 4916.1 5694.2 4239.3 4765.3 5478.7
7.29 Table 7.21 shows that in the Gatwick Airport Second Runway option including higher
carbon costs in fares reduces emissions below the levels in the equivalent main carbon-
traded case by 1.6MtCO2 in 2050 to 1.7Mt over the 2050 capping target. There is a
decrease in national demand of 6 million in 2030 and 19 million passengers by 2050.
Of the 2050 decrease, almost half, 9 million, is at London airports and Gatwick itself loses
8 million passengers.
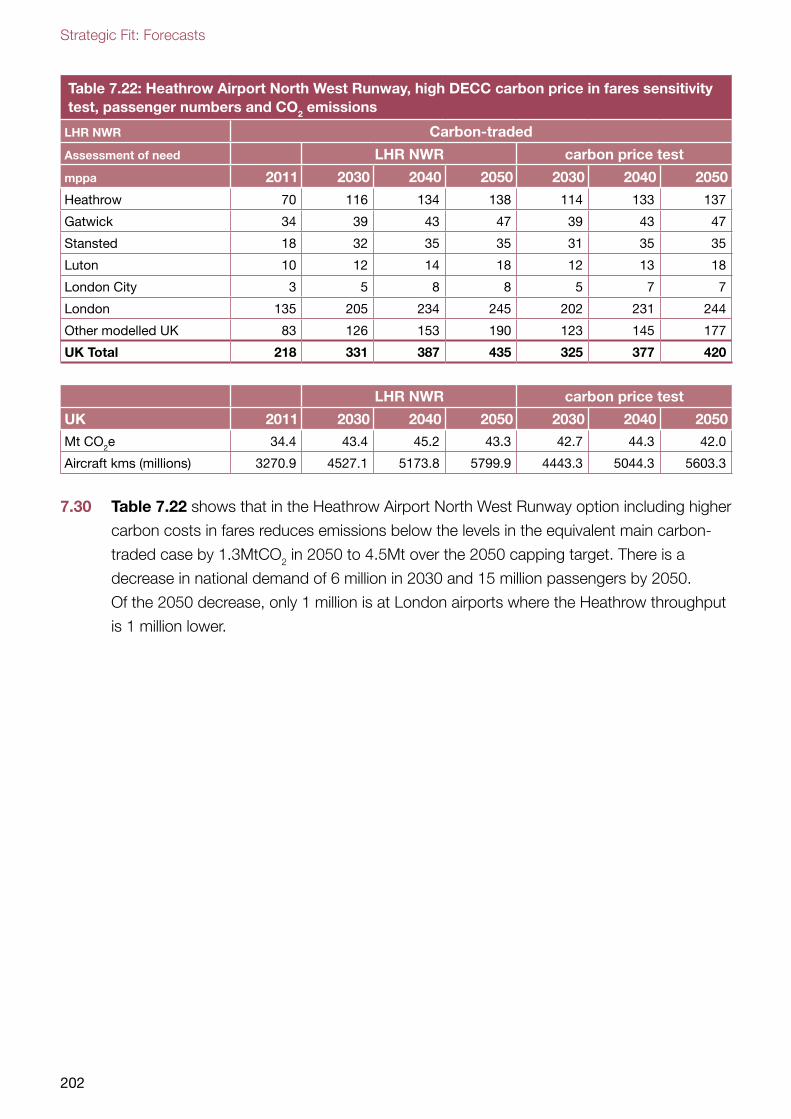
Strategic Fit: Forecasts
202
Table 7.22: Heathrow Airport North West Runway, high DECC carbon price in fares sensitivity test, passenger numbers and CO2 emissions
LHR NWR Carbon-traded
Assessment of need LHR NWR carbon price test
mppa 2011 2030 2040 2050 2030 2040 2050
Heathrow 70 116 134 138 114 133 137
Gatwick 34 39 43 47 39 43 47
Stansted 18 32 35 35 31 35 35
Luton 10 12 14 18 12 13 18
London City 3 5 8 8 5 7 7
London 135 205 234 245 202 231 244
Other modelled UK 83 126 153 190 123 145 177
UK Total 218 331 387 435 325 377 420
LHR NWR carbon price test
UK 2011 2030 2040 2050 2030 2040 2050
Mt CO2e 34.4 43.4 45.2 43.3 42.7 44.3 42.0
Aircraft kms (millions) 3270.9 4527.1 5173.8 5799.9 4443.3 5044.3 5603.3
7.30 Table 7.22 shows that in the Heathrow Airport North West Runway option including higher
carbon costs in fares reduces emissions below the levels in the equivalent main carbon-
traded case by 1.3MtCO2 in 2050 to 4.5Mt over the 2050 capping target. There is a
decrease in national demand of 6 million in 2030 and 15 million passengers by 2050.
Of the 2050 decrease, only 1 million is at London airports where the Heathrow throughput
is 1 million lower.
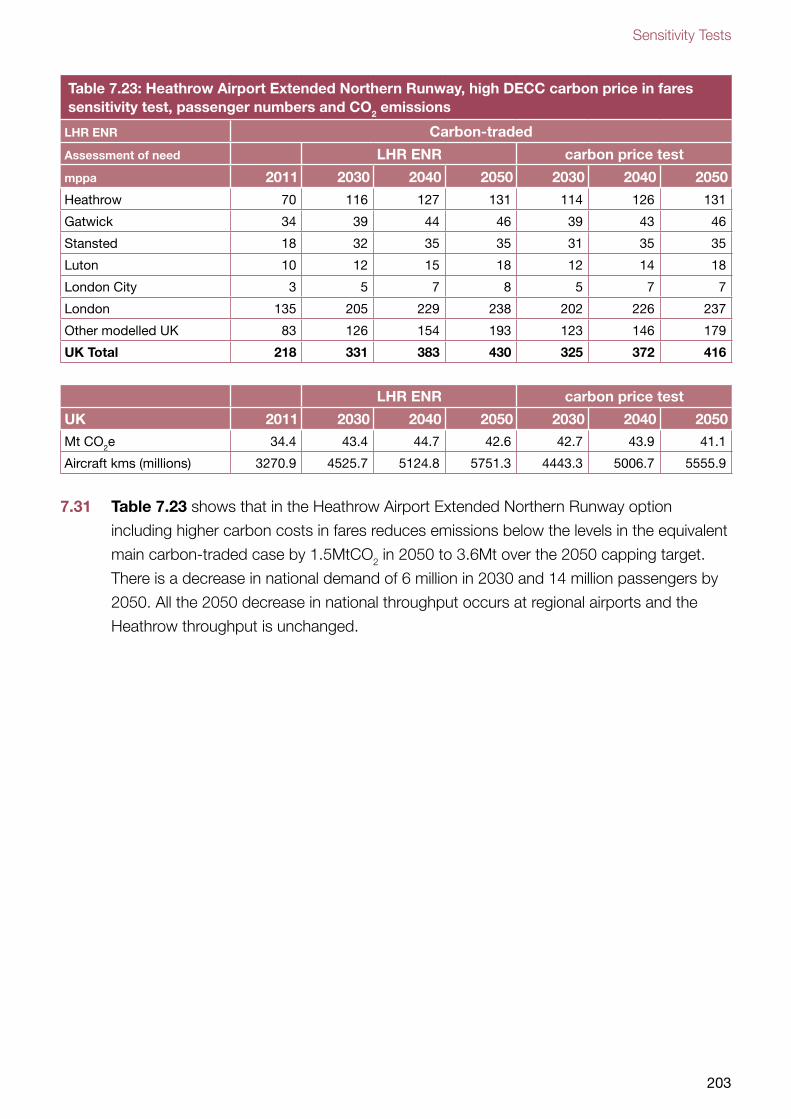
Sensitivity Tests
203
Table 7.23: Heathrow Airport Extended Northern Runway, high DECC carbon price in fares sensitivity test, passenger numbers and CO2 emissions
LHR ENR Carbon-traded
Assessment of need LHR ENR carbon price test
mppa 2011 2030 2040 2050 2030 2040 2050
Heathrow 70 116 127 131 114 126 131
Gatwick 34 39 44 46 39 43 46
Stansted 18 32 35 35 31 35 35
Luton 10 12 15 18 12 14 18
London City 3 5 7 8 5 7 7
London 135 205 229 238 202 226 237
Other modelled UK 83 126 154 193 123 146 179
UK Total 218 331 383 430 325 372 416
LHR ENR carbon price test
UK 2011 2030 2040 2050 2030 2040 2050
Mt CO2e 34.4 43.4 44.7 42.6 42.7 43.9 41.1
Aircraft kms (millions) 3270.9 4525.7 5124.8 5751.3 4443.3 5006.7 5555.9
7.31 Table 7.23 shows that in the Heathrow Airport Extended Northern Runway option
including higher carbon costs in fares reduces emissions below the levels in the equivalent
main carbon-traded case by 1.5MtCO2 in 2050 to 3.6Mt over the 2050 capping target.
There is a decrease in national demand of 6 million in 2030 and 14 million passengers by
2050. All the 2050 decrease in national throughput occurs at regional airports and the
Heathrow throughput is unchanged.
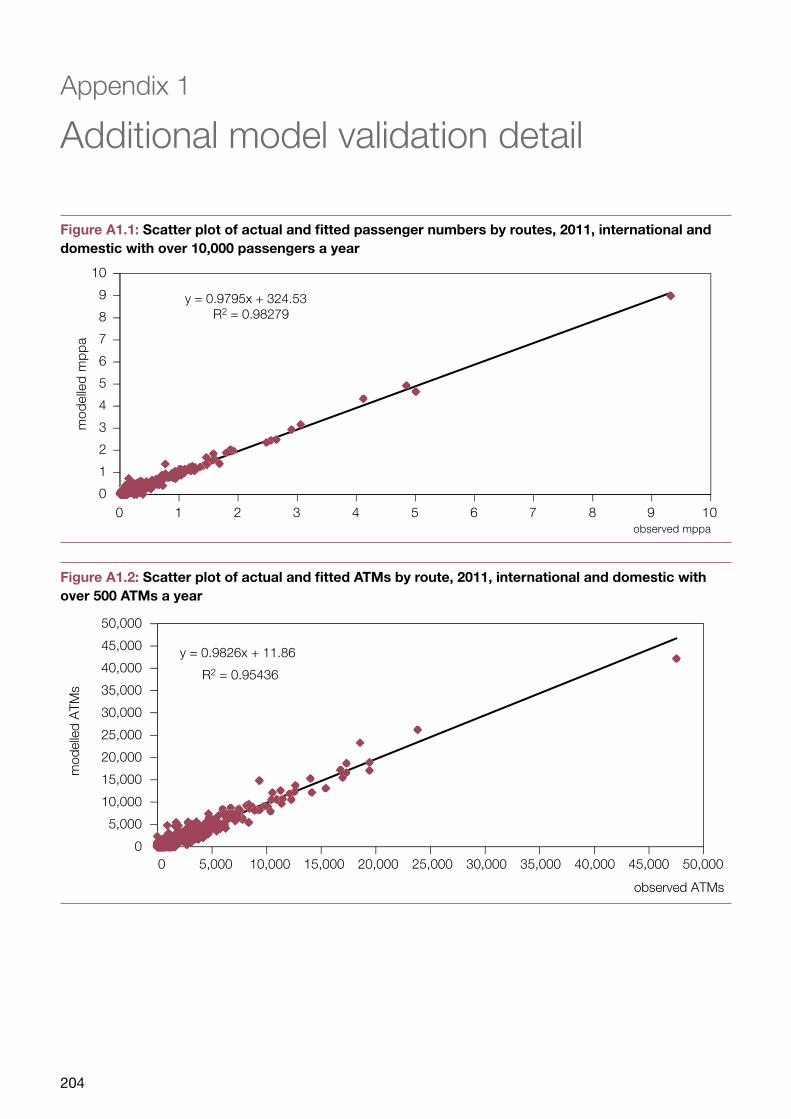
Strategic Fit: Forecasts
204
0
1
2
3
4
5
6
7
8
9
10
0 1 2 3 4 5 6 7 8 9 10
mod
elle
d m
pp
a
observed mppa
Figure A1.2: Scatter plot of actual and fitted ATMs by route, 2011, international and domestic with over 500 ATMs a year
0
5,000
10,000
15,000
20,000
25,000
30,000
35,000
40,000
45,000
50,000
0 5,000 10,000 15,000 20,000 25,000 30,000 35,000 40,000 45,000 50,000
observed ATMs
mod
elle
d A
TMs
Appendix 1
Additional model validation detail
Figure A1.1: Scatter plot of actual and fitted passenger numbers by routes, 2011, international and domestic with over 10,000 passengers a year
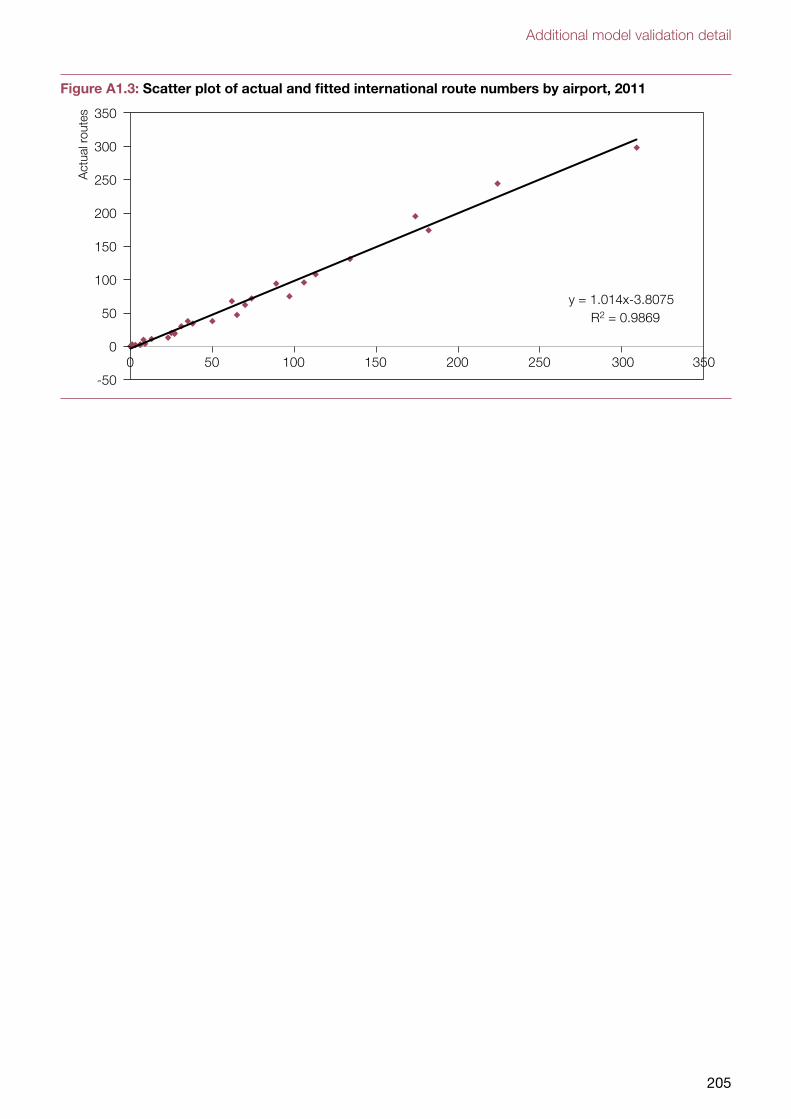
Additional model validation detail
205
-50
0
50
100
150
200
250
300
350
0 50 100 150 200 250 300 350
Actu
al ro
utes
Figure A1.3: Scatter plot of actual and fitted international route numbers by airport, 2011
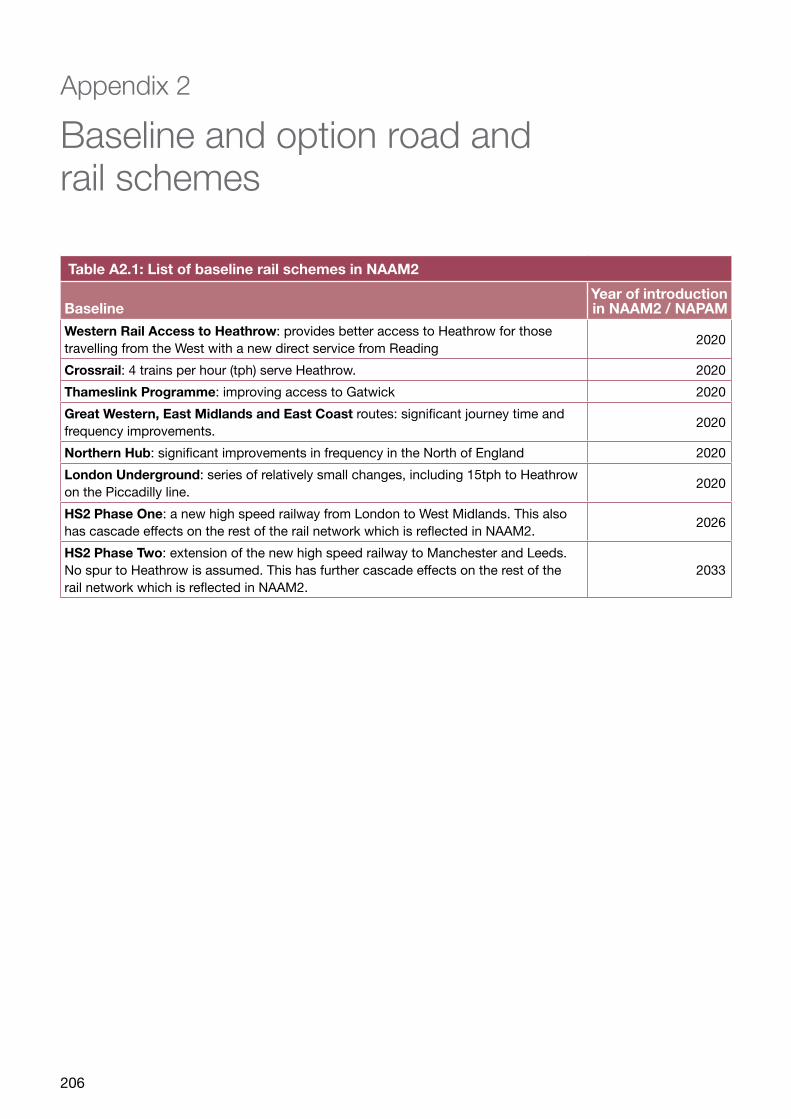
Strategic Fit: Forecasts
206
Appendix 2
Baseline and option road and rail schemes
Table A2.1: List of baseline rail schemes in NAAM2
BaselineYear of introduction in NAAM2 / NAPAM
Western Rail Access to Heathrow: provides better access to Heathrow for those travelling from the West with a new direct service from Reading
2020
Crossrail: 4 trains per hour (tph) serve Heathrow. 2020
Thameslink Programme: improving access to Gatwick 2020
Great Western, East Midlands and East Coast routes: significant journey time and frequency improvements.
2020
Northern Hub: significant improvements in frequency in the North of England 2020
London Underground: series of relatively small changes, including 15tph to Heathrow on the Piccadilly line.
2020
HS2 Phase One: a new high speed railway from London to West Midlands. This also has cascade effects on the rest of the rail network which is reflected in NAAM2.
2026
HS2 Phase Two: extension of the new high speed railway to Manchester and Leeds. No spur to Heathrow is assumed. This has further cascade effects on the rest of the rail network which is reflected in NAAM2.
2033
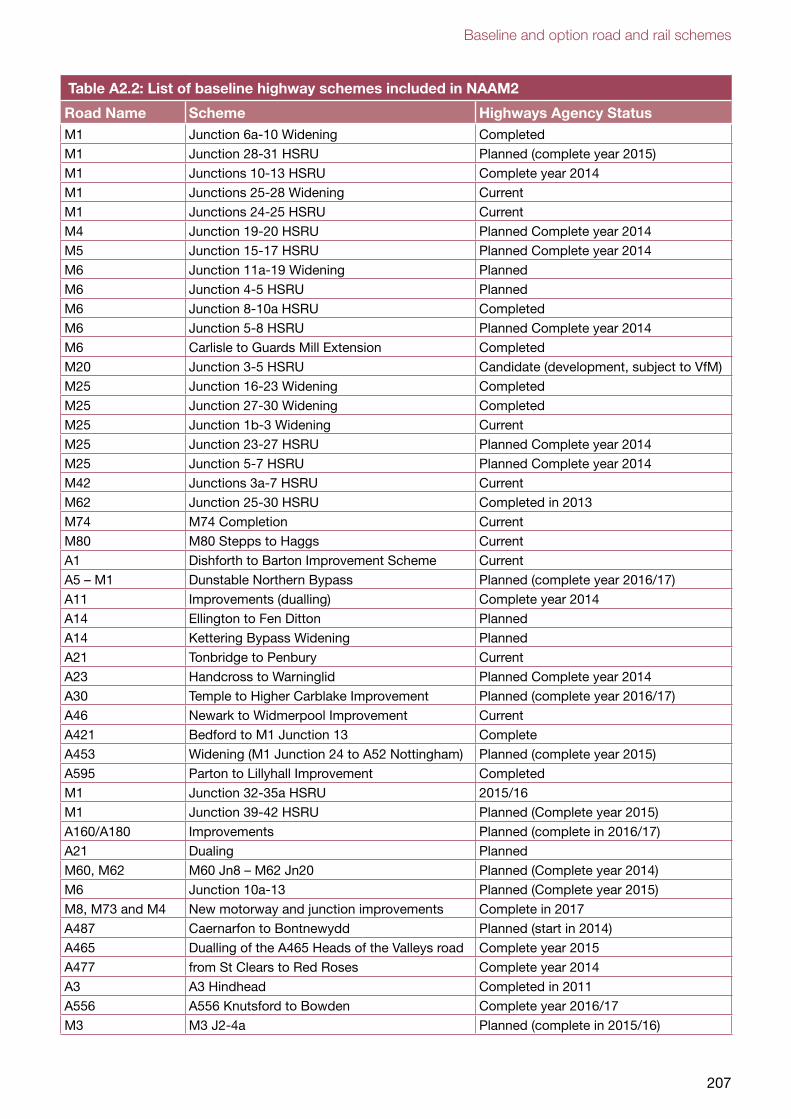
Baseline and option road and rail schemes
207
Table A2.2: List of baseline highway schemes included in NAAM2
Road Name Scheme Highways Agency StatusM1 Junction 6a-10 Widening Completed
M1 Junction 28-31 HSRU Planned (complete year 2015)
M1 Junctions 10-13 HSRU Complete year 2014
M1 Junctions 25-28 Widening Current
M1 Junctions 24-25 HSRU Current
M4 Junction 19-20 HSRU Planned Complete year 2014
M5 Junction 15-17 HSRU Planned Complete year 2014
M6 Junction 11a-19 Widening Planned
M6 Junction 4-5 HSRU Planned
M6 Junction 8-10a HSRU Completed
M6 Junction 5-8 HSRU Planned Complete year 2014
M6 Carlisle to Guards Mill Extension Completed
M20 Junction 3-5 HSRU Candidate (development, subject to VfM)
M25 Junction 16-23 Widening Completed
M25 Junction 27-30 Widening Completed
M25 Junction 1b-3 Widening Current
M25 Junction 23-27 HSRU Planned Complete year 2014
M25 Junction 5-7 HSRU Planned Complete year 2014
M42 Junctions 3a-7 HSRU Current
M62 Junction 25-30 HSRU Completed in 2013
M74 M74 Completion Current
M80 M80 Stepps to Haggs Current
A1 Dishforth to Barton Improvement Scheme Current
A5 – M1 Dunstable Northern Bypass Planned (complete year 2016/17)
A11 Improvements (dualling) Complete year 2014
A14 Ellington to Fen Ditton Planned
A14 Kettering Bypass Widening Planned
A21 Tonbridge to Penbury Current
A23 Handcross to Warninglid Planned Complete year 2014
A30 Temple to Higher Carblake Improvement Planned (complete year 2016/17)
A46 Newark to Widmerpool Improvement Current
A421 Bedford to M1 Junction 13 Complete
A453 Widening (M1 Junction 24 to A52 Nottingham) Planned (complete year 2015)
A595 Parton to Lillyhall Improvement Completed
M1 Junction 32-35a HSRU 2015/16
M1 Junction 39-42 HSRU Planned (Complete year 2015)
A160/A180 Improvements Planned (complete in 2016/17)
A21 Dualing Planned
M60, M62 M60 Jn8 – M62 Jn20 Planned (Complete year 2014)
M6 Junction 10a-13 Planned (Complete year 2015)
M8, M73 and M4 New motorway and junction improvements Complete in 2017
A487 Caernarfon to Bontnewydd Planned (start in 2014)
A465 Dualling of the A465 Heads of the Valleys road Complete year 2015
A477 from St Clears to Red Roses Complete year 2014
A3 A3 Hindhead Completed in 2011
A556 A556 Knutsford to Bowden Complete year 2016/17
M3 M3 J2-4a Planned (complete in 2015/16)
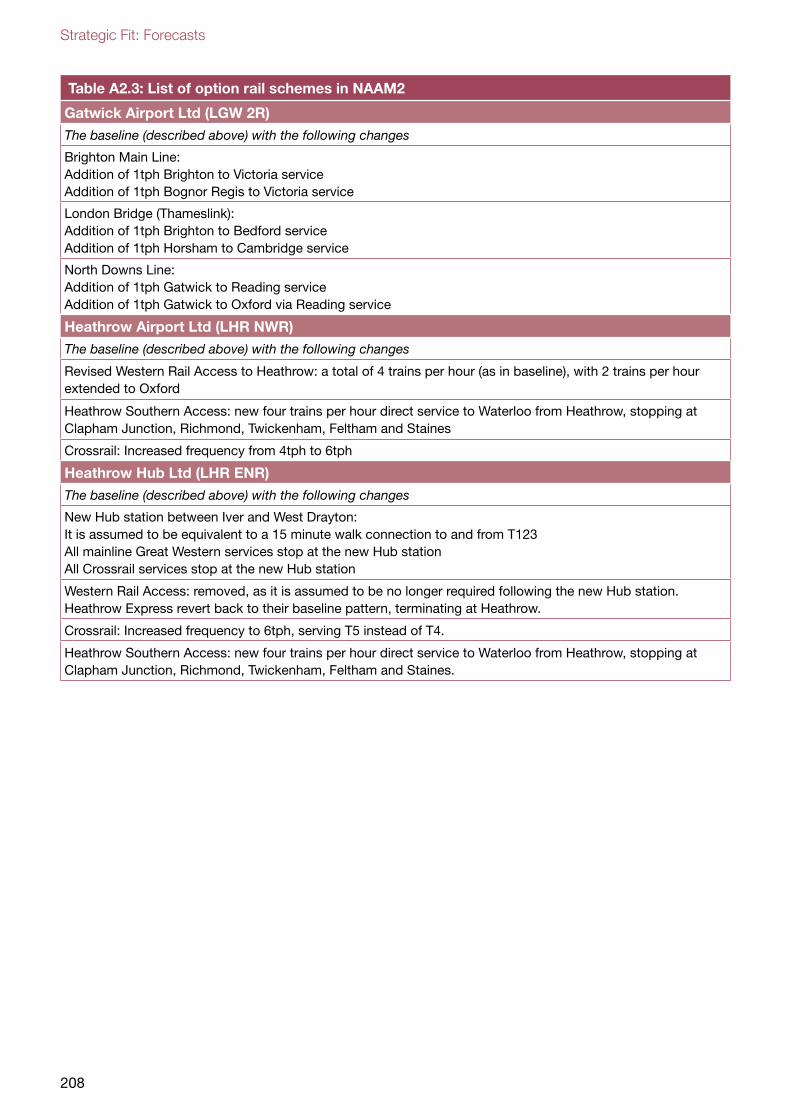
Strategic Fit: Forecasts
208
Table A2.3: List of option rail schemes in NAAM2
Gatwick Airport Ltd (LGW 2R)The baseline (described above) with the following changes
Brighton Main Line: Addition of 1tph Brighton to Victoria service Addition of 1tph Bognor Regis to Victoria service
London Bridge (Thameslink): Addition of 1tph Brighton to Bedford service Addition of 1tph Horsham to Cambridge service
North Downs Line: Addition of 1tph Gatwick to Reading service Addition of 1tph Gatwick to Oxford via Reading service
Heathrow Airport Ltd (LHR NWR)The baseline (described above) with the following changes
Revised Western Rail Access to Heathrow: a total of 4 trains per hour (as in baseline), with 2 trains per hour extended to Oxford
Heathrow Southern Access: new four trains per hour direct service to Waterloo from Heathrow, stopping at Clapham Junction, Richmond, Twickenham, Feltham and Staines
Crossrail: Increased frequency from 4tph to 6tph
Heathrow Hub Ltd (LHR ENR)The baseline (described above) with the following changes
New Hub station between Iver and West Drayton: It is assumed to be equivalent to a 15 minute walk connection to and from T123 All mainline Great Western services stop at the new Hub station All Crossrail services stop at the new Hub station
Western Rail Access: removed, as it is assumed to be no longer required following the new Hub station. Heathrow Express revert back to their baseline pattern, terminating at Heathrow.
Crossrail: Increased frequency to 6tph, serving T5 instead of T4.
Heathrow Southern Access: new four trains per hour direct service to Waterloo from Heathrow, stopping at Clapham Junction, Richmond, Twickenham, Feltham and Staines.
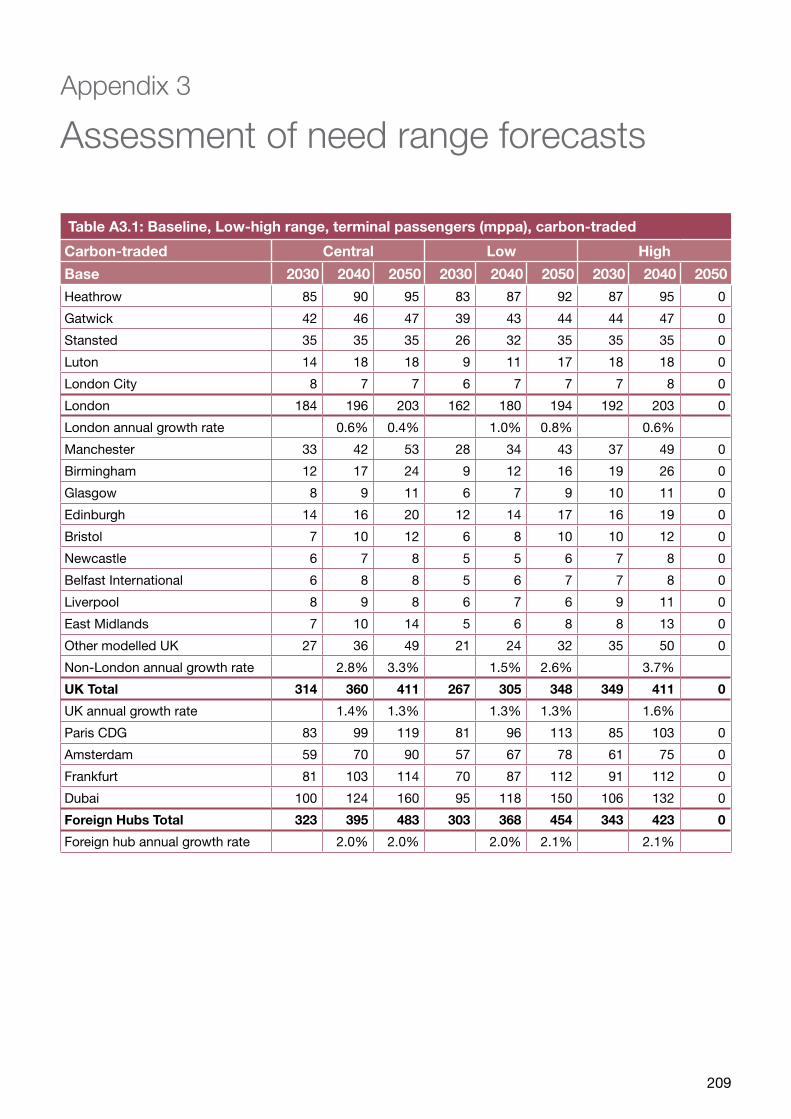
Assessment of need range forecasts
209
Appendix 3
Assessment of need range forecasts
Table A3.1: Baseline, Low-high range, terminal passengers (mppa), carbon-traded
Carbon-traded Central Low High
Base 2030 2040 2050 2030 2040 2050 2030 2040 2050
Heathrow 85 90 95 83 87 92 87 95 0
Gatwick 42 46 47 39 43 44 44 47 0
Stansted 35 35 35 26 32 35 35 35 0
Luton 14 18 18 9 11 17 18 18 0
London City 8 7 7 6 7 7 7 8 0
London 184 196 203 162 180 194 192 203 0
London annual growth rate 0.6% 0.4% 1.0% 0.8% 0.6%
Manchester 33 42 53 28 34 43 37 49 0
Birmingham 12 17 24 9 12 16 19 26 0
Glasgow 8 9 11 6 7 9 10 11 0
Edinburgh 14 16 20 12 14 17 16 19 0
Bristol 7 10 12 6 8 10 10 12 0
Newcastle 6 7 8 5 5 6 7 8 0
Belfast International 6 8 8 5 6 7 7 8 0
Liverpool 8 9 8 6 7 6 9 11 0
East Midlands 7 10 14 5 6 8 8 13 0
Other modelled UK 27 36 49 21 24 32 35 50 0
Non-London annual growth rate 2.8% 3.3% 1.5% 2.6% 3.7%
UK Total 314 360 411 267 305 348 349 411 0
UK annual growth rate 1.4% 1.3% 1.3% 1.3% 1.6%
Paris CDG 83 99 119 81 96 113 85 103 0
Amsterdam 59 70 90 57 67 78 61 75 0
Frankfurt 81 103 114 70 87 112 91 112 0
Dubai 100 124 160 95 118 150 106 132 0
Foreign Hubs Total 323 395 483 303 368 454 343 423 0
Foreign hub annual growth rate 2.0% 2.0% 2.0% 2.1% 2.1%
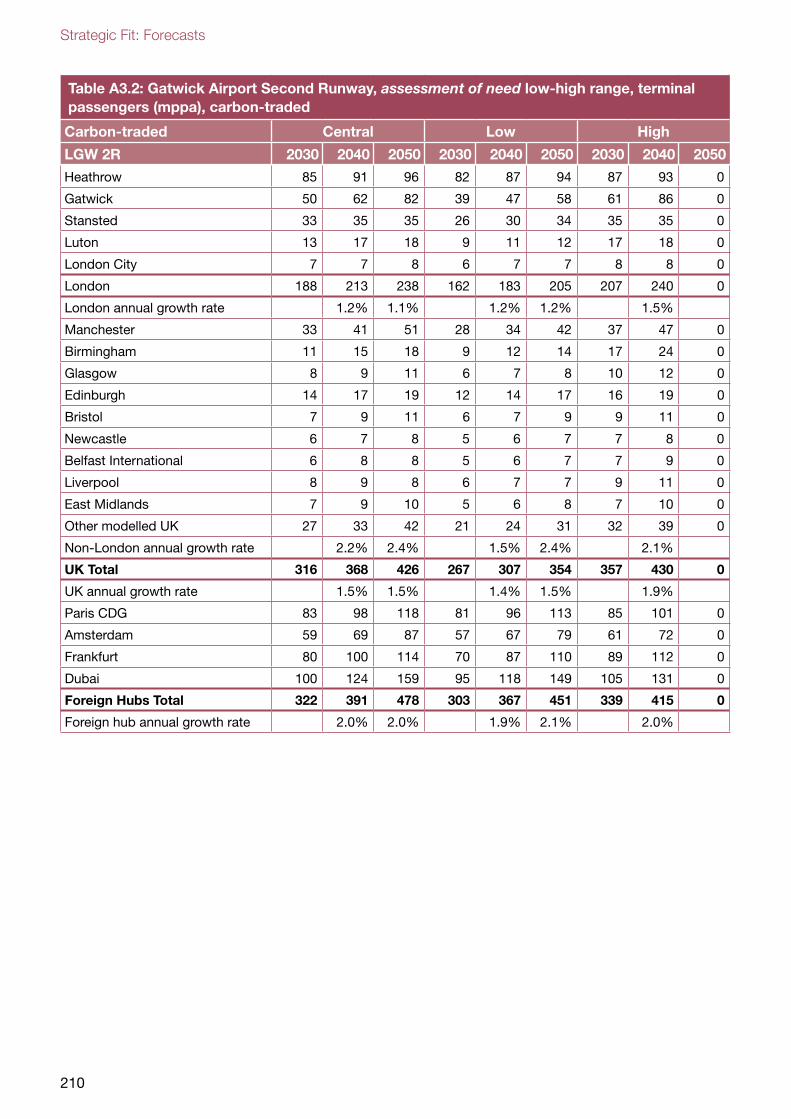
Strategic Fit: Forecasts
210
Table A3.2: Gatwick Airport Second Runway, assessment of need low-high range, terminal passengers (mppa), carbon-traded
Carbon-traded Central Low High
LGW 2R 2030 2040 2050 2030 2040 2050 2030 2040 2050
Heathrow 85 91 96 82 87 94 87 93 0
Gatwick 50 62 82 39 47 58 61 86 0
Stansted 33 35 35 26 30 34 35 35 0
Luton 13 17 18 9 11 12 17 18 0
London City 7 7 8 6 7 7 8 8 0
London 188 213 238 162 183 205 207 240 0
London annual growth rate 1.2% 1.1% 1.2% 1.2% 1.5%
Manchester 33 41 51 28 34 42 37 47 0
Birmingham 11 15 18 9 12 14 17 24 0
Glasgow 8 9 11 6 7 8 10 12 0
Edinburgh 14 17 19 12 14 17 16 19 0
Bristol 7 9 11 6 7 9 9 11 0
Newcastle 6 7 8 5 6 7 7 8 0
Belfast International 6 8 8 5 6 7 7 9 0
Liverpool 8 9 8 6 7 7 9 11 0
East Midlands 7 9 10 5 6 8 7 10 0
Other modelled UK 27 33 42 21 24 31 32 39 0
Non-London annual growth rate 2.2% 2.4% 1.5% 2.4% 2.1%
UK Total 316 368 426 267 307 354 357 430 0
UK annual growth rate 1.5% 1.5% 1.4% 1.5% 1.9%
Paris CDG 83 98 118 81 96 113 85 101 0
Amsterdam 59 69 87 57 67 79 61 72 0
Frankfurt 80 100 114 70 87 110 89 112 0
Dubai 100 124 159 95 118 149 105 131 0
Foreign Hubs Total 322 391 478 303 367 451 339 415 0
Foreign hub annual growth rate 2.0% 2.0% 1.9% 2.1% 2.0%
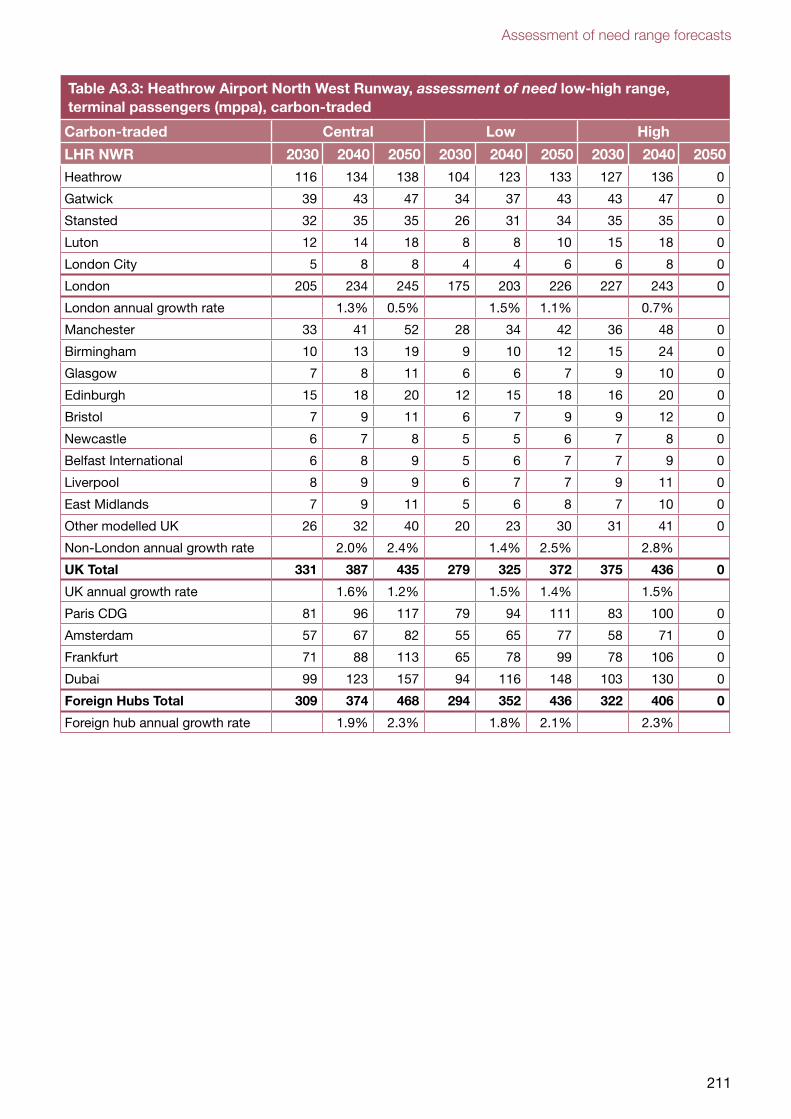
Assessment of need range forecasts
211
Table A3.3: Heathrow Airport North West Runway, assessment of need low-high range, terminal passengers (mppa), carbon-traded
Carbon-traded Central Low High
LHR NWR 2030 2040 2050 2030 2040 2050 2030 2040 2050
Heathrow 116 134 138 104 123 133 127 136 0
Gatwick 39 43 47 34 37 43 43 47 0
Stansted 32 35 35 26 31 34 35 35 0
Luton 12 14 18 8 8 10 15 18 0
London City 5 8 8 4 4 6 6 8 0
London 205 234 245 175 203 226 227 243 0
London annual growth rate 1.3% 0.5% 1.5% 1.1% 0.7%
Manchester 33 41 52 28 34 42 36 48 0
Birmingham 10 13 19 9 10 12 15 24 0
Glasgow 7 8 11 6 6 7 9 10 0
Edinburgh 15 18 20 12 15 18 16 20 0
Bristol 7 9 11 6 7 9 9 12 0
Newcastle 6 7 8 5 5 6 7 8 0
Belfast International 6 8 9 5 6 7 7 9 0
Liverpool 8 9 9 6 7 7 9 11 0
East Midlands 7 9 11 5 6 8 7 10 0
Other modelled UK 26 32 40 20 23 30 31 41 0
Non-London annual growth rate 2.0% 2.4% 1.4% 2.5% 2.8%
UK Total 331 387 435 279 325 372 375 436 0
UK annual growth rate 1.6% 1.2% 1.5% 1.4% 1.5%
Paris CDG 81 96 117 79 94 111 83 100 0
Amsterdam 57 67 82 55 65 77 58 71 0
Frankfurt 71 88 113 65 78 99 78 106 0
Dubai 99 123 157 94 116 148 103 130 0
Foreign Hubs Total 309 374 468 294 352 436 322 406 0
Foreign hub annual growth rate 1.9% 2.3% 1.8% 2.1% 2.3%
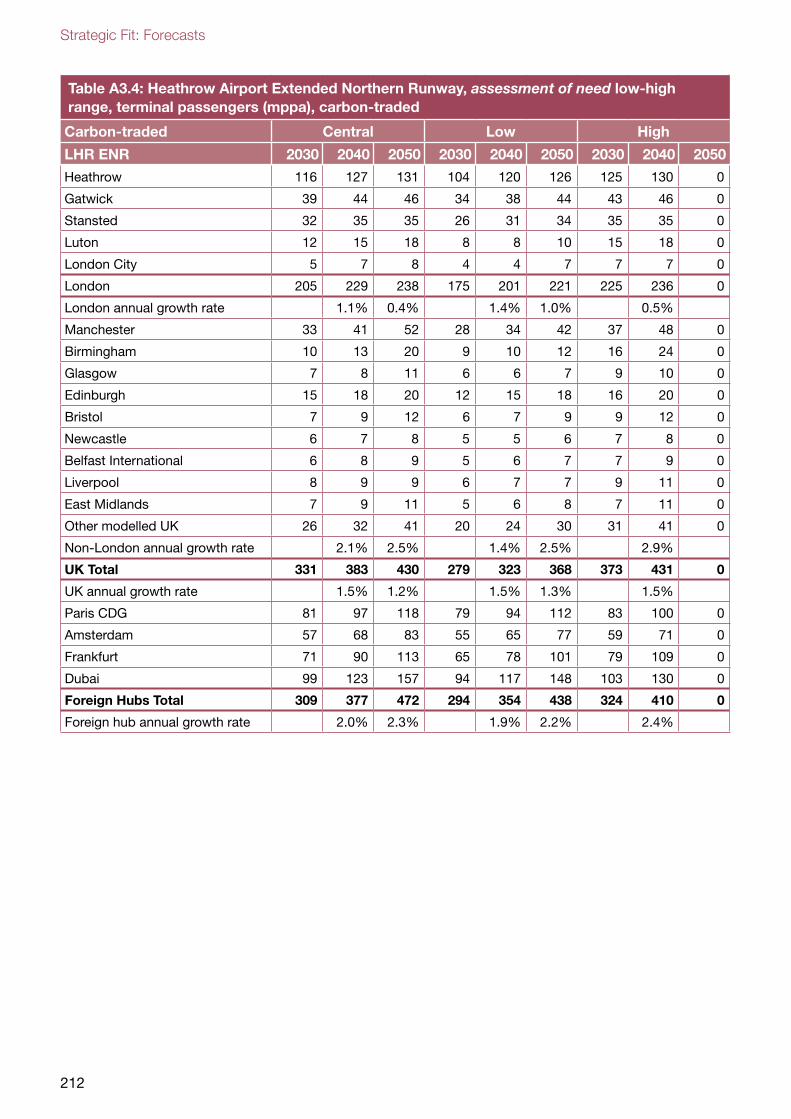
Strategic Fit: Forecasts
212
Table A3.4: Heathrow Airport Extended Northern Runway, assessment of need low-high range, terminal passengers (mppa), carbon-traded
Carbon-traded Central Low High
LHR ENR 2030 2040 2050 2030 2040 2050 2030 2040 2050
Heathrow 116 127 131 104 120 126 125 130 0
Gatwick 39 44 46 34 38 44 43 46 0
Stansted 32 35 35 26 31 34 35 35 0
Luton 12 15 18 8 8 10 15 18 0
London City 5 7 8 4 4 7 7 7 0
London 205 229 238 175 201 221 225 236 0
London annual growth rate 1.1% 0.4% 1.4% 1.0% 0.5%
Manchester 33 41 52 28 34 42 37 48 0
Birmingham 10 13 20 9 10 12 16 24 0
Glasgow 7 8 11 6 6 7 9 10 0
Edinburgh 15 18 20 12 15 18 16 20 0
Bristol 7 9 12 6 7 9 9 12 0
Newcastle 6 7 8 5 5 6 7 8 0
Belfast International 6 8 9 5 6 7 7 9 0
Liverpool 8 9 9 6 7 7 9 11 0
East Midlands 7 9 11 5 6 8 7 11 0
Other modelled UK 26 32 41 20 24 30 31 41 0
Non-London annual growth rate 2.1% 2.5% 1.4% 2.5% 2.9%
UK Total 331 383 430 279 323 368 373 431 0
UK annual growth rate 1.5% 1.2% 1.5% 1.3% 1.5%
Paris CDG 81 97 118 79 94 112 83 100 0
Amsterdam 57 68 83 55 65 77 59 71 0
Frankfurt 71 90 113 65 78 101 79 109 0
Dubai 99 123 157 94 117 148 103 130 0
Foreign Hubs Total 309 377 472 294 354 438 324 410 0
Foreign hub annual growth rate 2.0% 2.3% 1.9% 2.2% 2.4%
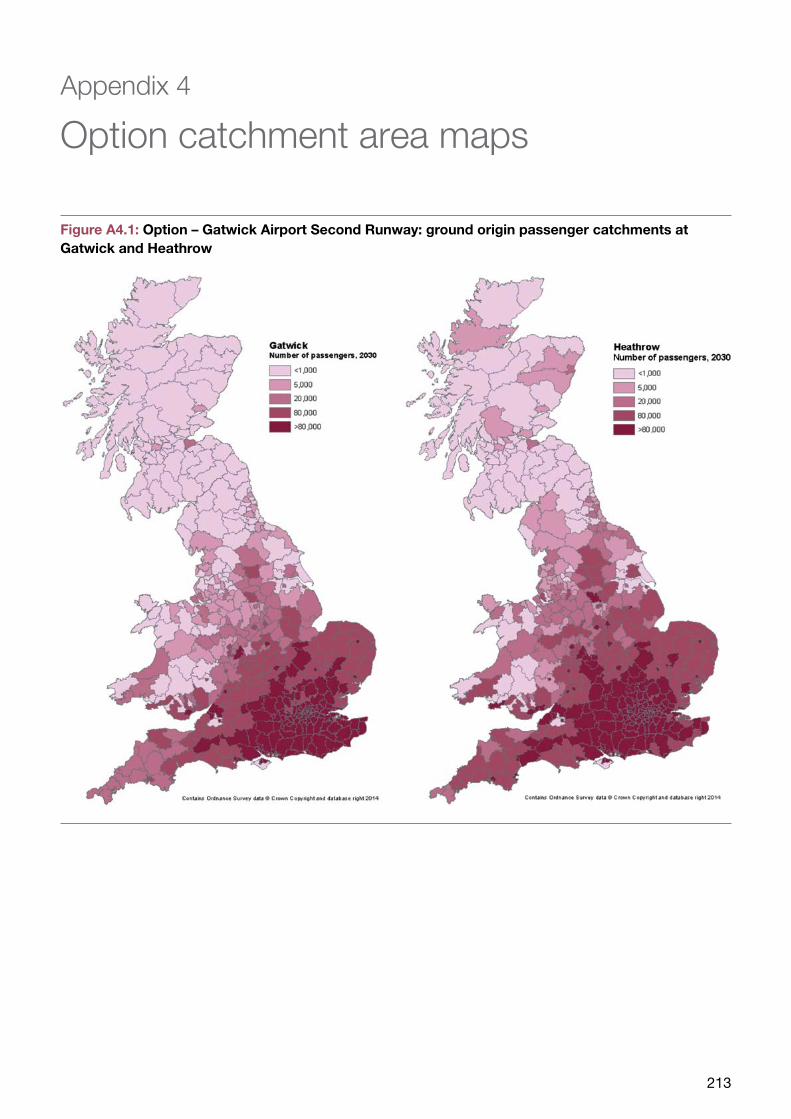
Option catchment area maps
213
Appendix 4
Option catchment area maps
Figure A4.1: Option – Gatwick Airport Second Runway: ground origin passenger catchments at Gatwick and Heathrow
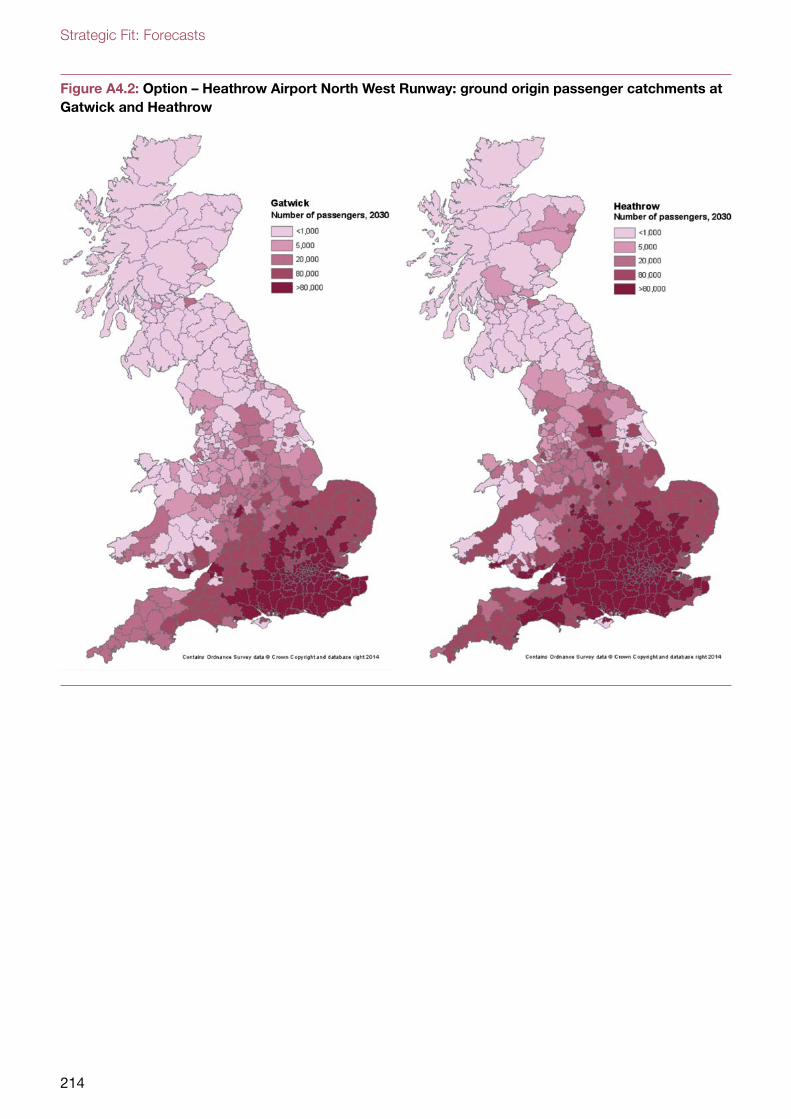
Strategic Fit: Forecasts
214
Figure A4.2: Option – Heathrow Airport North West Runway: ground origin passenger catchments at Gatwick and Heathrow
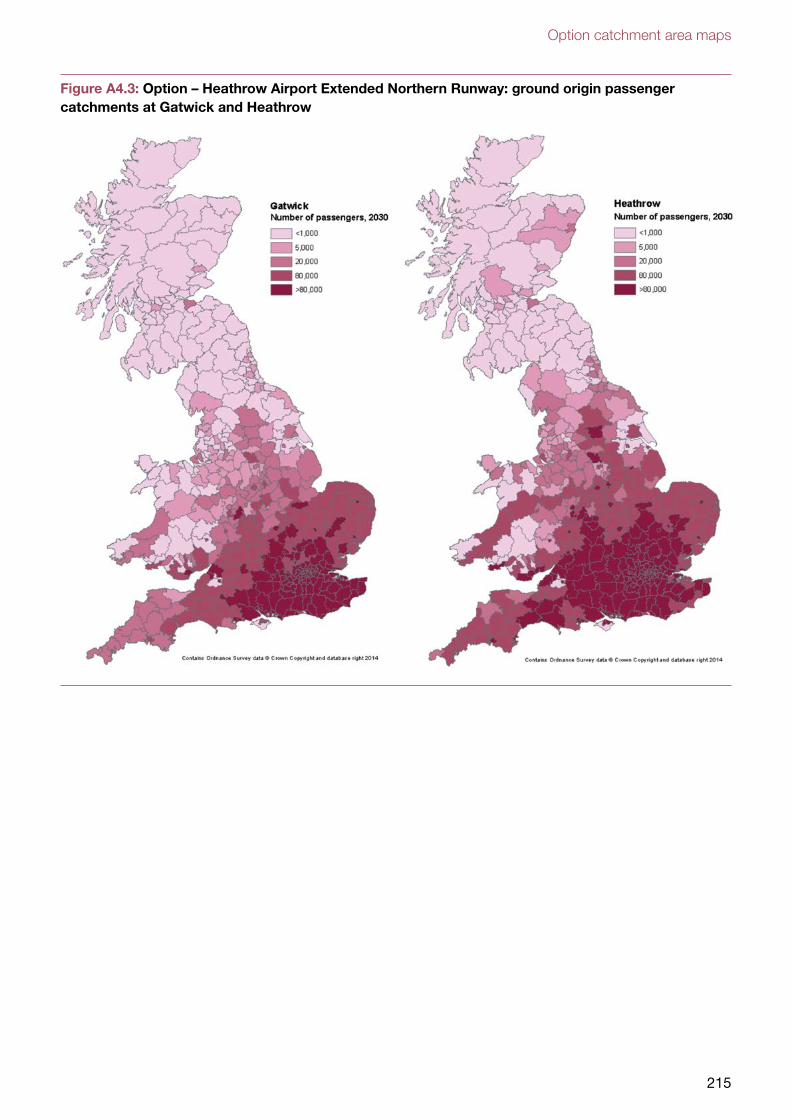
Option catchment area maps
215
Figure A4.3: Option – Heathrow Airport Extended Northern Runway: ground origin passenger catchments at Gatwick and Heathrow
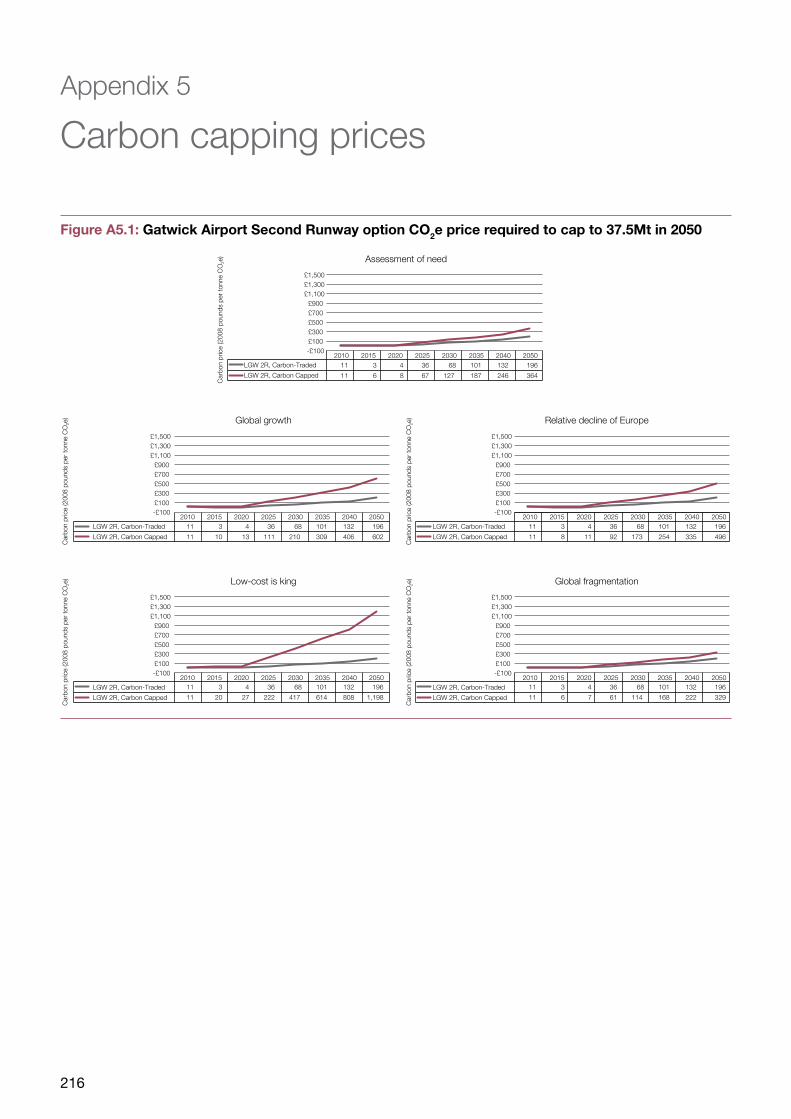
Strategic Fit: Forecasts
216
Appendix 5
Carbon capping prices
Figure A5.1: Gatwick Airport Second Runway option CO2e price required to cap to 37.5Mt in 2050
11 3 4 36 68 101 132 196
11 10 13 111 210 309 406 602
11 3 4 36 68 101 132 196
11 8 11 92 173 254 335 496
11 3 4 36 68 101 132 196
11 20 27 222 417 614 808 1,198
11 3 4 36 68 101 132 196
11 6 7 61 114 168 222 329
11 3 4 36 68 101 132 196
11 6 8 67 127 187 246 364
2010 2015 2020 2025 2030 2035 2040 2050LGW 2R, Carbon-Traded
LGW 2R, Carbon Capped
-£100£100£300£500£700£900
£1,100£1,300£1,500
Car
bon
pric
e (2
008
poun
ds p
er to
nne
CO
2e)
2010 2015 2020 2025 2030 2035 2040 2050LGW 2R, Carbon-Traded
LGW 2R, Carbon Capped
-£100£100£300£500£700£900
£1,100£1,300£1,500
Car
bon
pric
e (2
008
poun
ds p
er to
nne
CO
2e)
2010 2015 2020 2025 2030 2035 2040 2050LGW 2R, Carbon-Traded
LGW 2R, Carbon Capped
-£100£100£300£500£700£900
£1,100£1,300£1,500
Car
bon
pric
e (2
008
poun
ds p
er to
nne
CO
2e)
2010 2015 2020 2025 2030 2035 2040 2050LGW 2R, Carbon-Traded
LGW 2R, Carbon Capped
-£100£100£300£500£700£900
£1,100£1,300£1,500
Car
bon
pric
e (2
008
poun
ds p
er to
nne
CO
2e)
2010 2015 2020 2025 2030 2035 2040 2050LGW 2R, Carbon-Traded
LGW 2R, Carbon Capped
-£100£100£300£500£700£900
£1,100£1,300£1,500
Car
bon
pric
e (2
008
poun
ds p
er to
nne
CO
2e)
Assessment of need
Global growth Relative decline of Europe
Low-cost is king Global fragmentation
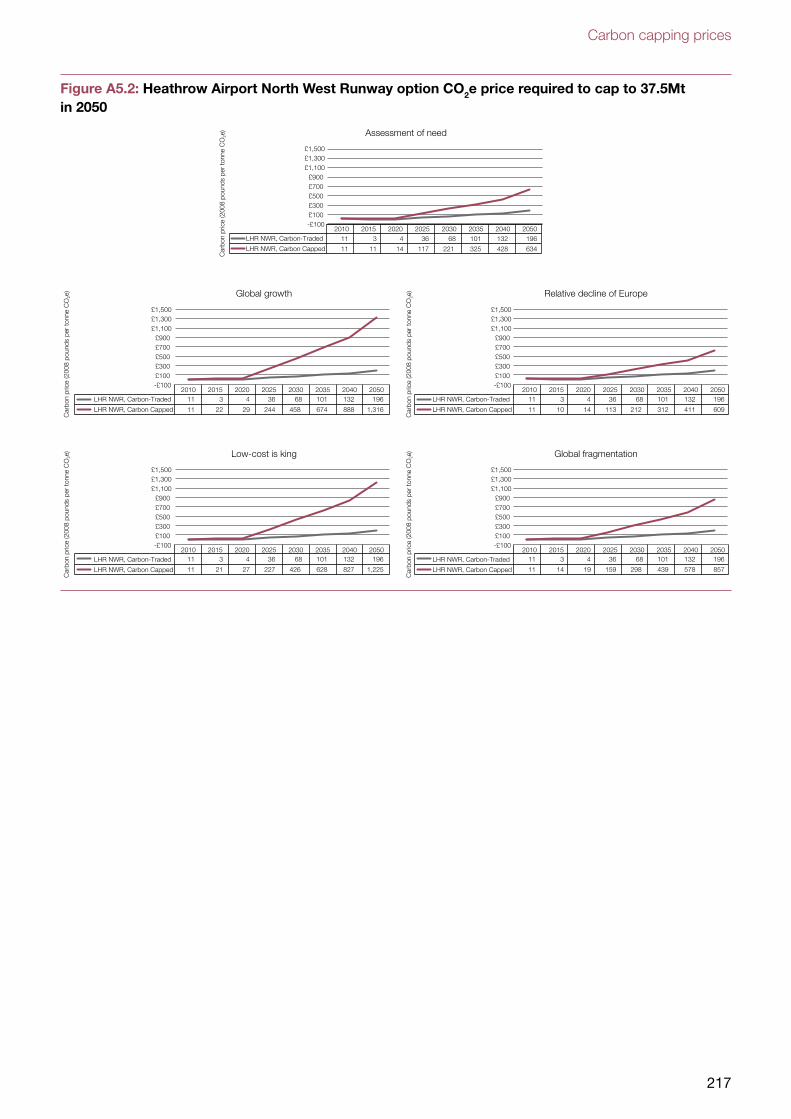
Carbon capping prices
217
Figure A5.2: Heathrow Airport North West Runway option CO2e price required to cap to 37.5Mt in 2050
11 3 4 36 68 101 132 196
11 22 29 244 458 674 888 1,316
11 3 4 36 68 101 132 196
11 10 14 113 212 312 411 609
11 3 4 36 68 101 132 196
11 21 27 227 426 628 827 1,225
11 3 4 36 68 101 132 196
11 14 19 159 298 439 578 857
11 3 4 36 68 101 132 196
11 11 14 117 221 325 428 634
2010 2015 2020 2025 2030 2035 2040 2050LHR NWR, Carbon-Traded
LHR NWR, Carbon Capped
-£100£100£300£500£700£900
£1,100£1,300£1,500
Car
bon
pric
e (2
008
poun
ds p
er to
nne
CO
2e)
2010 2015 2020 2025 2030 2035 2040 2050LHR NWR, Carbon-Traded
LHR NWR, Carbon Capped
-£100£100£300£500£700£900
£1,100£1,300£1,500
Car
bon
pric
e (2
008
poun
ds p
er to
nne
CO
2e)
2010 2015 2020 2025 2030 2035 2040 2050LHR NWR, Carbon-Traded
LHR NWR, Carbon Capped
-£100£100£300£500£700£900
£1,100£1,300£1,500
Car
bon
pric
e (2
008
poun
ds p
er to
nne
CO
2e)
2010 2015 2020 2025 2030 2035 2040 2050LHR NWR, Carbon-Traded
LHR NWR, Carbon Capped
-£100£100£300£500£700£900
£1,100£1,300£1,500
Car
bon
pric
e (2
008
poun
ds p
er to
nne
CO
2e)
2010 2015 2020 2025 2030 2035 2040 2050LHR NWR, Carbon-Traded
LHR NWR, Carbon Capped
-£100£100£300£500£700£900
£1,100£1,300£1,500
Car
bon
pric
e (2
008
poun
ds p
er to
nne
CO
2e)
Assessment of need
Global growth Relative decline of Europe
Low-cost is king Global fragmentation
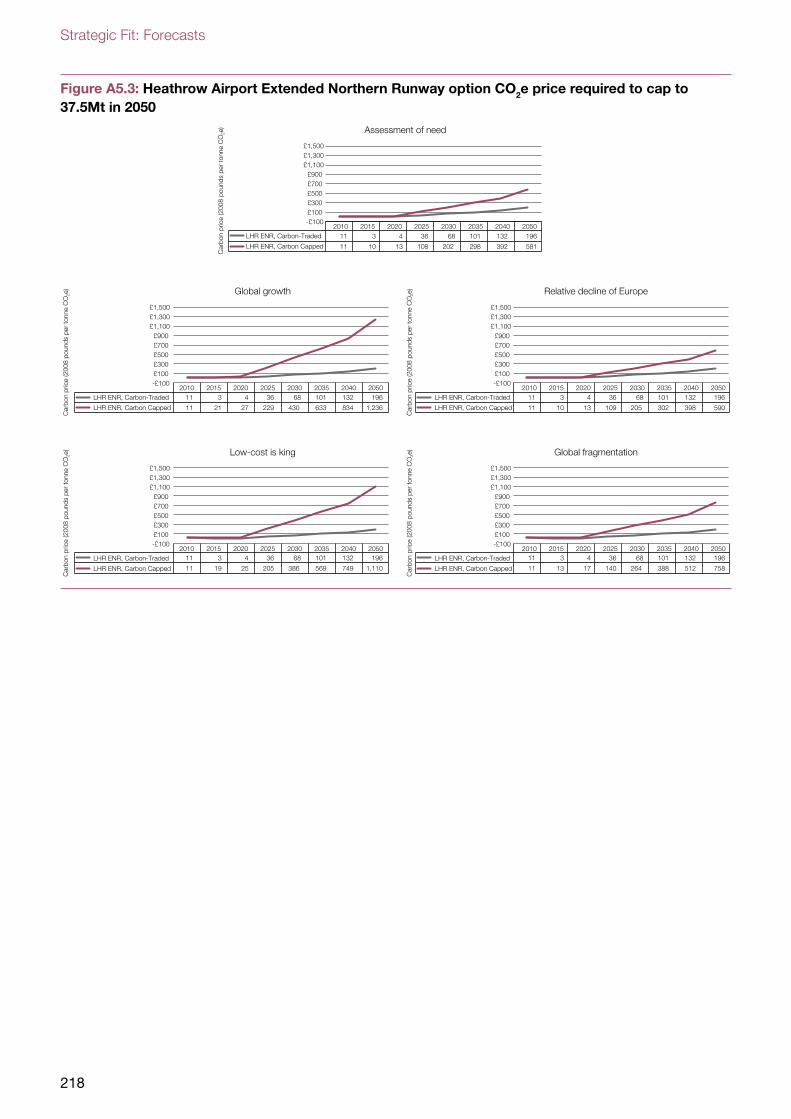
Strategic Fit: Forecasts
218
11 3 4 36 68 101 132 196
11 21 27 229 430 633 834 1,236
11 3 4 36 68 101 132 196
11 10 13 109 205 302 398 590
11 3 4 36 68 101 132 196
11 19 25 205 386 569 749 1,110
11 3 4 36 68 101 132 196
11 13 17 140 264 388 512 758
11 3 4 36 68 101 132 196
11 10 13 108 202 298 392 581
2010 2015 2020 2025 2030 2035 2040 2050LHR ENR, Carbon-Traded
LHR ENR, Carbon Capped
-£100£100£300£500£700£900
£1,100£1,300£1,500
Car
bon
pric
e (2
008
poun
ds p
er to
nne
CO
2e)
2010 2015 2020 2025 2030 2035 2040 2050LHR ENR, Carbon-Traded
LHR ENR, Carbon Capped
-£100£100£300£500£700£900
£1,100£1,300£1,500
Car
bon
pric
e (2
008
poun
ds p
er to
nne
CO
2e)
2010 2015 2020 2025 2030 2035 2040 2050LHR ENR, Carbon-Traded
LHR ENR, Carbon Capped
-£100£100£300£500£700£900
£1,100£1,300£1,500
Car
bon
pric
e (2
008
poun
ds p
er to
nne
CO
2e)
2010 2015 2020 2025 2030 2035 2040 2050LHR ENR, Carbon-Traded
LHR ENR, Carbon Capped
-£100£100£300£500£700£900
£1,100£1,300£1,500
Car
bon
pric
e (2
008
poun
ds p
er to
nne
CO
2e)
2010 2015 2020 2025 2030 2035 2040 2050LHR ENR, Carbon-Traded
LHR ENR, Carbon Capped
-£100£100£300£500£700£900
£1,100£1,300£1,500
Car
bon
pric
e (2
008
poun
ds p
er to
nne
CO
2e)
Assessment of need
Global growth Relative decline of Europe
Low-cost is king Global fragmentation
Figure A5.3: Heathrow Airport Extended Northern Runway option CO2e price required to cap to 37.5Mt in 2050

Contact Information
Website: www.gov.uk/government/organisations/airports-commission Email: [email protected]


![Constructing the Future [HS2]](https://img.pdfslide.net/doc/110x75/55b87f1ebb61ebfb7e8b463d/constructing-the-future-hs2.jpg)