Embed Size (px)
Citation preview
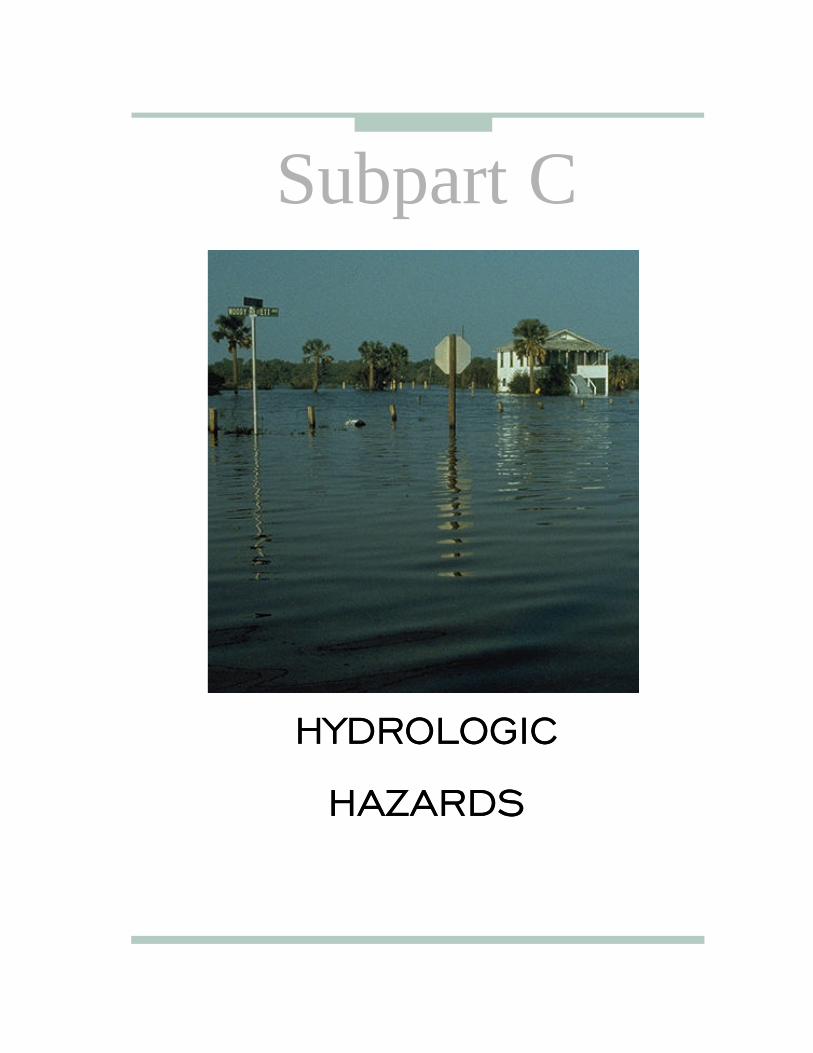
HYDROLOGIC
HAZARDS
Subpart C
HYDROLOGIC
HAZARDS

NATURAL HAZARDS132 NATURAL HAZARDS
HYDROLOGIC HAZARDS
Introduction
HYDROLOGIC HAZARDS 133
Introduction
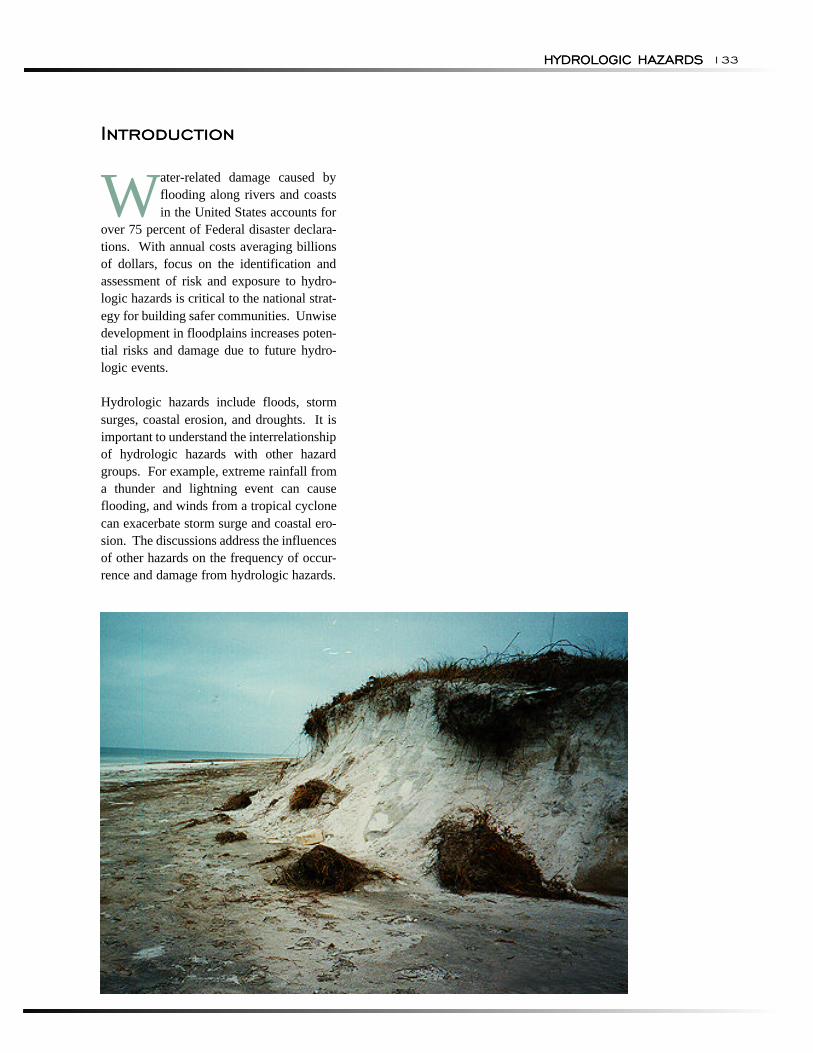
Water-related damage caused by flooding along rivers and coasts in the United States accounts for
over 75 percent of Federal disaster declarations. With annual costs averaging billions of dollars, focus on the identification and assessment of risk and exposure to hydro-logic hazards is critical to the national strategy for building safer communities. Unwise development in floodplains increases potential risks and damage due to future hydro-logic events.
Hydrologic hazards include floods, storm surges, coastal erosion, and droughts. It is important to understand the interrelationship of hydrologic hazards with other hazard groups. For example, extreme rainfall from a thunder and lightning event can cause flooding, and winds from a tropical cyclone can exacerbate storm surge and coastal erosion. The discussions address the influences of other hazards on the frequency of occurrence and damage from hydrologic hazards.

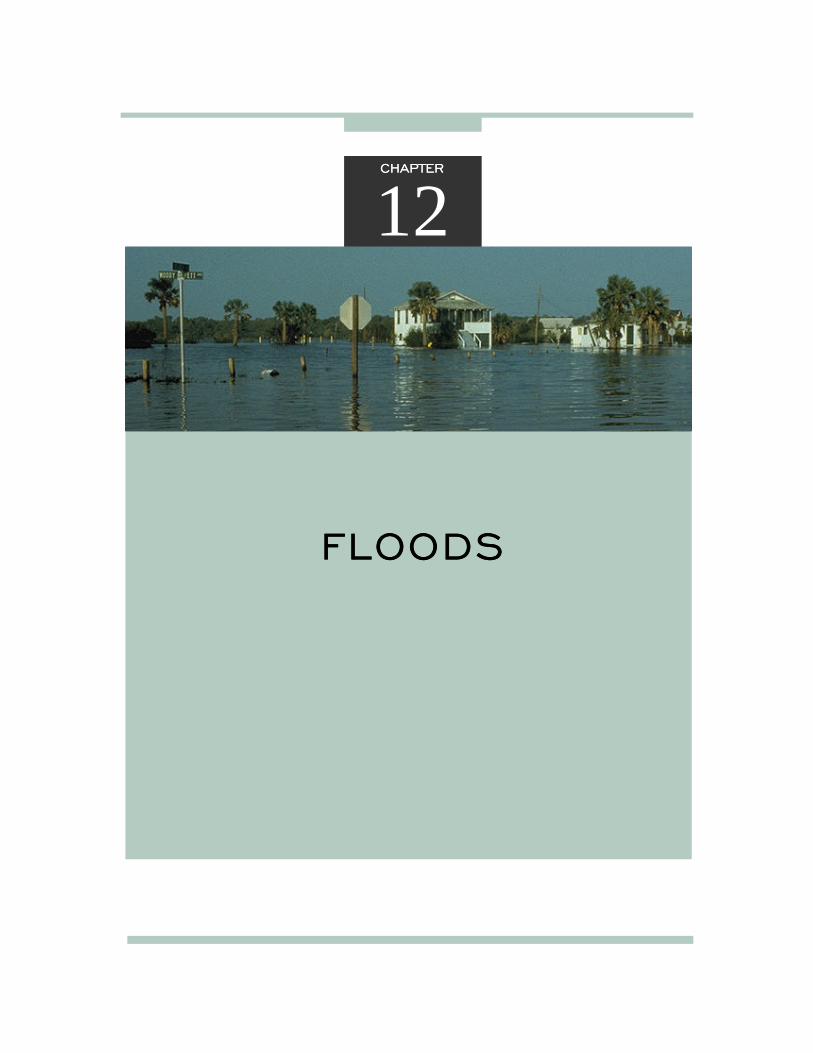
CHAPTERCHAPTER
12
FLOODSFLOODS
NATURAL HAZARDS:
Chapter Summary
HYDROLOGIC HAZARDS136 NATURAL HAZARDS: HYDROLOGIC HAZARDS
Chapter Summary
Hundreds of floods occur each year in the United States, including overbank flooding of rivers and streams and shoreline inundation along lakes and
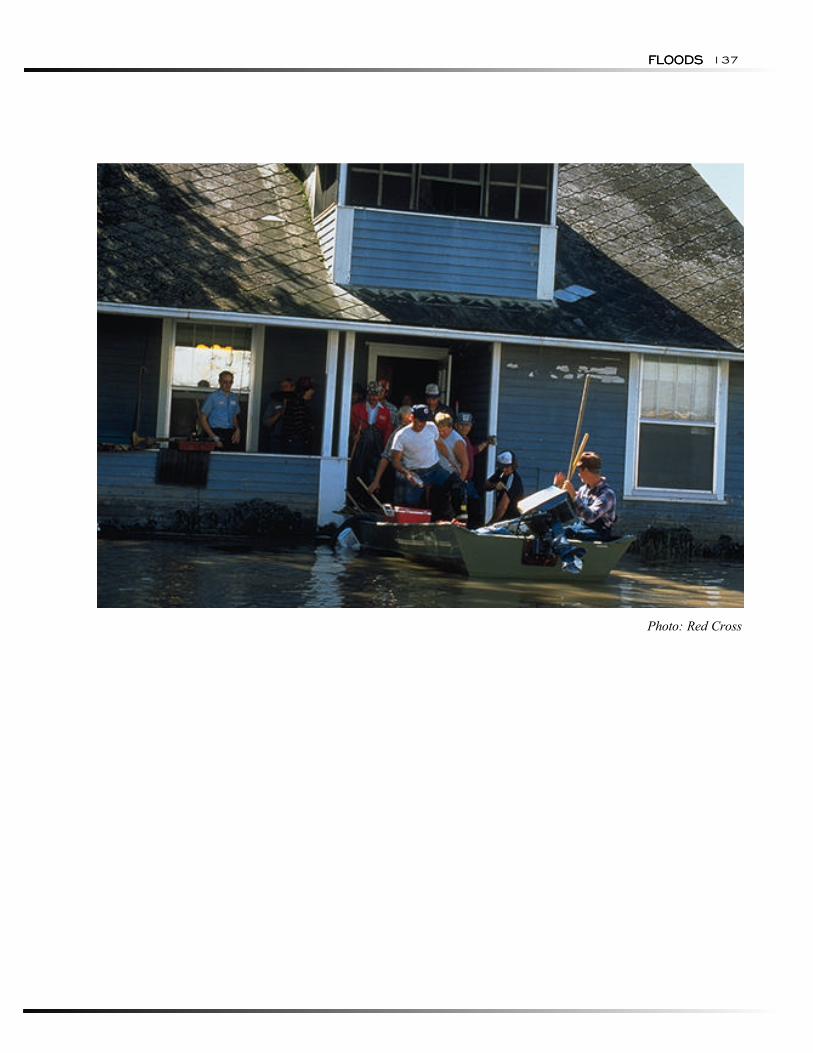
coasts. Flooding typically results from large-scale weather systems generating prolonged rainfall or on-shore winds. Other causes of flooding include locally intense thunderstorms, snowmelt, ice jams, and dam failures. Flash floods, which are characterized by rapid on-set and high velocity waters, carry large amounts of debris. Floods are capable of undermining buildings and bridges, eroding shorelines and riverbanks, tearing out trees, washing out access routes, and causing loss of life and injuries.
Floods occur in all 50 States and in the U.S. territories. FEMA estimates that over 9 million households and $390 billion in property are at risk from flooding. The States with the greatest exposure to this hazard (based on a composite risk score that accounts for floodplain area and number and value of households) are Florida, California, Texas, Louisiana, and New Jersey. While the number of deaths remained fairly constant at an annual average of 125 people per 200 million population, property damage for the period from 1951 to 1985 escalated to roughly $2.15 billion a year.
The costliest flood disaster in U.S. history was the 1993 event in the Upper Mississippi River Basin which affected nine Midwestern States. As many as 47 people lost their lives, and damage totaled an estimated $12 to 16 billion, including agricultural losses.
The National Flood Insurance Program (NFIP), administered by FEMA, has been the most dominant influence on floodplain management during the past 25 years. In addition to providing affordable flood insurance, FEMA per-forms flood-risk studies and prepares maps of flood hazard areas. Communities that join the NFIP agree to manage designated special flood hazard areas to minimize future damage through zoning and building standards.
In addition to land-use planning and codes applicable to new development, mitigation measures include structural and non-structural measures to address susceptibility of development that pre-dates the NFIP. An important element of U.S. efforts to improve preparedness and reduce flood damage involves flood warnings and forecasts by the National Weather Service and others.
FLOODSFLOODS 137
Photo: Red Cross
NATURAL HAZARDS:
HAZARD IDENTIFICATION
Riverine Flooding.
Flash Floods.
Alluvial Fan Floods.
HYDROLOGIC HAZARDS138 NATURAL HAZARDS: HYDROLOGIC HAZARDS
HAZARD IDENTIFICATION
Flooding is defined as the accumulation of water within a water body and the overflow of excess water onto adjacent floodplain lands. The floodplain is the land adjoining the channel of a river, stream, ocean, lake, or other watercourse or water body that is susceptible to flooding.
According to the Federal Interagency Floodplain Management Task Force, flooding in the United States can be separated into several types (L.R. Johnson Associates, FIA-18, 1992):
• Riverine flooding, including overflow from a river channel, flash floods, alluvial fan floods, and ice-jam floods.
• Riverine flooding includes dam-break floods (Chapter 20);
• Local drainage or high groundwater levels;
• Fluctuating lake levels;
• Coastal flooding, including storm surges (Chapter 13) and tsunamis (Chapter 17);
• Debris flows (Chapter 9); and
• Subsidence (Chapter 10).
Riverine Flooding. Overbank flooding of rivers and streams is the most common type of flood event. Riverine floodplains range from narrow, confined channels in the steep valleys of hilly and mountainous areas, and wide, flat areas in the Plains States and low-lying coastal regions. The volume of water in the floodplain is a function of the size of the contributing watershed and topographic characteristics such as watershed shape and slope, and climatic and land-use characteristics.
In steep, narrow valleys, flooding usually occurs quickly, is of short duration, and floodwaters are likely to be rapid and deep. In relatively flat floodplains, areas may remain inundated for days or even weeks, but floodwaters are typically slow-moving and relatively shallow, and may accumulate over long periods of time.
Flooding in large rivers usually results from large-scale weather systems that generate prolonged rainfall over wide areas. These same weather systems may cause flooding in hundreds of smaller basins that drain to major rivers. Small rivers and streams are susceptible to flooding from more localized weather systems that cause intense rainfall over small areas. In some parts of
the Northern and Western States, annual spring floods result from snowmelt, and the extent of flooding depends on the depth of winter snowpack and spring weather patterns.
There is often no sharp distinction between riverine floods, flash floods, alluvial fan floods, ice-jam floods, and dam-break floods that occur due to structural failures or overtopping of embankments during flood events. Nevertheless, these types of floods are widely recognized and helpful in considering not only the range of flood risk but also appropriate responses.
Flash Floods. "Flash flood" is a term widely used by flood experts and the general population. However, there is no single definition, and a clear means to separate flash floods from the rest of the spectrum of riverine floods does not exist.
Flash floods are characterized by a rapid rise in water level, high velocity, and large amounts of debris. They are capable of tearing out trees, undermining buildings and bridges, and scouring new channels. Major factors in flash flooding are the intensity and duration of rain-fall and the steepness of watershed and stream gradients. The amount of watershed vegetation, the natural and artificial flood storage areas, and the configuration of the stream bed and floodplain are also important.
Flash floods may result from the failure of a dam or the sudden breakup of an ice jam. Both can cause the release of a large volume of water in a short period of time. Flash flooding in urban areas is an increasingly serious problem due to removal of vegetation, paving and replacement of ground cover by impermeable surfaces that increase runoff, and construction of drainage systems that increase the speed of runoff.
Alluvial Fan Floods. Alluvial fans are deposits of rock and soil that have eroded from mountainsides and accumulated on valley floors in a fan-shaped pattern. The deposits are narrow and steep at the head of the fan, broadening as they spread out onto the valley floor. As rain runs off steep valley walls, it gains velocity, carrying large boulders and other debris. When the debris fills channels on the fan, floodwaters spill out and cut new channels. The process is then repeated, resulting in shifting channels and combined erosion and flooding problems over a large area (FEMA 165, 1989). Alluvial fan flooding is most prevalent in the arid Western States.
Alluvial fan floods can cause greater damage than typical riverine flooding because of the high velocity of flow, the amount of debris carried, and the broad area
FLOODS
Ice Jam Floods.
Dam Break Floods.
Local Drainage or High Groundwater Levels.
Fluctuating Lake Levels.
RISK ASSESSMENT
FLOODS 139
affected. Floodwaters typically move at velocities of 15 to 30 ft/s (5 to 10 m/s) due to steep slopes and lack of vegetation (L.R. Johnson Associates, FIA-18, 1992).
Human activities often exacerbate flooding and erosion problems on alluvial fans. Roads act as drainage channels, carrying high-velocity flows to lower portions of the fan, while fill, leveling, grading, and structures can alter flows patterns (FEMA 116, 1987).
Ice Jam Floods. Flooding caused by ice jams is similar to flash flooding. Ice jam formation causes a rapid rise of water at the jam and extending upstream. Failure or release of the jam causes sudden flooding down-stream.
The formation of ice jams depends on the weather and physical conditions in river channels. Ice jams are most likely to occur where the channel slope naturally decreases, where culverts freeze solid, at headwaters of reservoirs, at natural channel constrictions such as bends and bridges, and along shallows where channels may freeze solid (FEMA 116, 1987).
Ice jam floods can occur during fall freeze-up from the formation of frazil ice, during midwinter periods when stream channels freeze solid forming anchor ice, and during spring breakup when rising water levels from snowmelt or rainfall break existing ice cover into large floating masses that lodge at bridges and other constrictions. Damage from ice jam flooding usually exceeds that caused by open water flooding. Flood elevations are usually higher than predicted for free-flow conditions and water levels may change rapidly. Additional physical damage is caused by the force of ice impacting buildings and other structures (FEMA 116, 1987).
Dam Break Floods. Dam failures can occur as a result of structural failures, such as progressive erosion of an embankment or overtopping and breaching by a severe flood. Earthquakes may weaken dams. Disastrous floods caused by dam failures, although not in the category of natural hazards, have caused great loss of life and property damage, primarily due to their unexpected nature and high velocity floodwater. A more detailed discussion of the effects of dam failures is in Chapter 20.
Local Drainage or High Groundwater Levels. Locally heavy precipitation may produce flooding in areas other than delineated floodplains or along recognizable drainage channels. If local conditions cannot accommodate intense precipitation through a combination of infiltration and surface runoff, water may accumulate and cause flooding problems. During winter
and spring, frozen ground and accumulations of snow may contribute to inadequate drainage and localized ponding. Flooding problems of this nature generally occur in areas with flat gradients, and generally increase with urbanization which speeds the accumulation of floodwaters because of impervious areas. Shallow sheet flooding may result unless channels have been improved to account for increased flows.
High groundwater levels may be of concern and can cause problems even where there is no surface flooding. Basements are susceptible to high groundwater levels. Seasonally high groundwater is common in many areas, while in others high groundwater occurs only after long periods of above-average precipitation.
Fluctuating Lake Levels. Water levels in U.S. lakes can fluctuate on a short-term, seasonal basis, or on a long-term basis over periods of months or years. Heavy seasonal rainfall can cause high lake levels for short periods of time, and snowmelt can result in higher spring levels. Long-term fluctuations are a less-recognized phenomenon that can cause high water and subsequent flooding problems lasting for years or even decades.
While all lakes may experience fluctuations, water levels tend to vary the most in lakes that are completely landlocked or have inadequate outlets for maintaining a balance between inflow and outflow. These lakes, commonly referred to as closed-basin lakes, are particularly susceptible to dramatic fluctuations in water levels over long periods of time, as much as 5 to 15 ft (1 to 3 m).
The Great Salt Lake in Utah, the Salton Sea in California, and Devils Lake in North Dakota are notable closed-basin lakes. The Great Lakes are examples of lakes with inadequate outlets under extreme high water conditions. The "playa" or drainage lakes in the Western and Southwestern States, and sinkhole lakes in Florida, are subject to long-term fluctuations that are similar to closed-basin lakes.
RISK ASSESSMENT
For many years, the Federal Government has provided guidance and has been involved in risk assessment of flood hazards. By the early 1960s, the Tennessee Valley Authority (TVA) and the U.S. Army Corps of Engineers (USACE) were involved heavily in flood-plain management studies. Recognizing the need for standardization among Federal, State and local agencies, they agreed on the 100-year, or 1-percent-annual-chance, flood as the standard for floodplain management purposes (FEMA, 1983).
NATURAL HAZARDS:
Probability and Frequency
HYDROLOGIC HAZARDS140 NATURAL HAZARDS: HYDROLOGIC HAZARDS
The NFIP was authorized by the U.S. Congress with the enactment of the National Flood Insurance Act of 1968. Under the NFIP, flood insurance is made available at rates that are intended to be affordable in return for community adoption of ordinances to regulate development in mapped flood hazard areas. The U.S. Department of Housing and Urban Development (HUD) was designated to administer the program.
HUD convened a group of experts to advise on the best standards for risk assessment and management. The group recommended the 100-year, or "base" flood standard, which was adopted for the NFIP. The 100-year, or 1-percent-annual-chance event, was deemed to represent a degree of risk and damage worth protecting against, but was not considered to impose stringent requirements or burdens of excessive cost on property owners (FEMA, 1983).
During hearings prior to passage of the Flood Disaster Protection Act of 1973, the Senate Committee on Banking, Housing, and Urban Affairs heard arguments on both sides of the issue regarding the appropriateness of the 100-year flood standard. Several witnesses advocated a proposal to apply a lesser standard, and some recommended the use of the greatest flood of record.
HUD pointed out that the 100-year flood represents a compromise between minor floods and the greatest flood likely to occur in a given area, that the highest recorded flood level reflects what has happened rather than what could happen, and that in many cases the 100-year flood level is less than the flood of record. After considering the statements of all interested par-ties, the Senate Committee concluded that the 100-year flood standard was reasonable and consistent with national objectives for reducing flood losses (FEMA, 1983).
The 1-percent-annual-chance flood and the associated floodplain have been widely adopted as the common design and regulatory standard in the United States. The 1-percent-annual-chance flood was established formally as a standard for use by Federal agencies with the issuance of Executive Order for Floodplain Management, E.O. 11988, in 1977 (L.R. Johnson Associates, FIA-18, 1992). At the request of the Office of Management and Budget, in 1982 FEMA reviewed the appropriateness of the standard and recommended that it be retained and used as the minimum for flood hazard reduction actions (FEMA, 1983).
Probability and Frequency
Released in 1966, House Document No. 465, A Unified National Program for Managing Flood Losses, provid
ed the impetus for the development of a uniform technique for determining flood flow frequency, and for a national floodplain management program. The U.S. Water Resources Council (USWRC) was directed to develop accurate and consistent procedures for flood flow frequency analyses.
In 1967, USWRC published Bulletin 15, A Uniform Technique for Determining Flood Flow Frequencies,(USWRC, 1967; Benson, 1967). The techniques presented were adopted by USWRC for use in all Federal planning involving water and related land resources. USWRC recommended that State and local governments and private organizations use the same techniques. The techniques included the fitting of the Pearson Type III frequency distribution to the logarithms of recorded annual peak flows to determine floods of different probability and frequency.
Bulletin 15 was updated several times: Bulletin 17 (USWRC, 1976), Bulletin 17A (USWRC, 1977a), and Bulletin 17B (USWRC, 1981). Editorial corrections were made to Bulletin 17B in 1982, and it was republished by the Interagency Advisory Committee on Water Data (IACWD) when the USWRC was disbanded in 1982. Thomas (1985) provided a description of the development of Bulletin 17 and subsequent revisions.
Bulletin 17B (IACWD, 1982) is used by practically all government agencies undertaking flood flow frequency and floodplain mapping studies. The guidelines include the addition of analytical procedures for identifying and adjusting for low and high outliers, incorporating historic information, and weighting station and generalized skew.
For streams with recorded annual peak flows, the 10-, 2-, 1- and 0.2-percent-annual-chance (10-, 50-, 100-, and 500-year) floods are determined using Bulletin 17B procedures. The flood discharges are used in evaluating flood hazards for the NFIP, with the 1-percent-annual-chance flood used as the base flood for regulatory purposes. At least 10 years of recorded annual peak flows are needed for frequency analysis (IACWD, 1982). For streams where there are no recorded annual peak flows, the 10-, 2-, 1-, and 0.2-percent-annual-chance floods are estimated by regional regression equations based on watershed and climatic characteristics or watershed models (FEMA 37, 1995).
The water depths and areas inundated by the 1- and 0.2-percent annual chance floods are determined through the use of hydraulic models that reflect topographic characteristics. Most often, a one-dimensional, steady-state model (a step-backwater model) is used to convert
FLOODSFLOODS 141
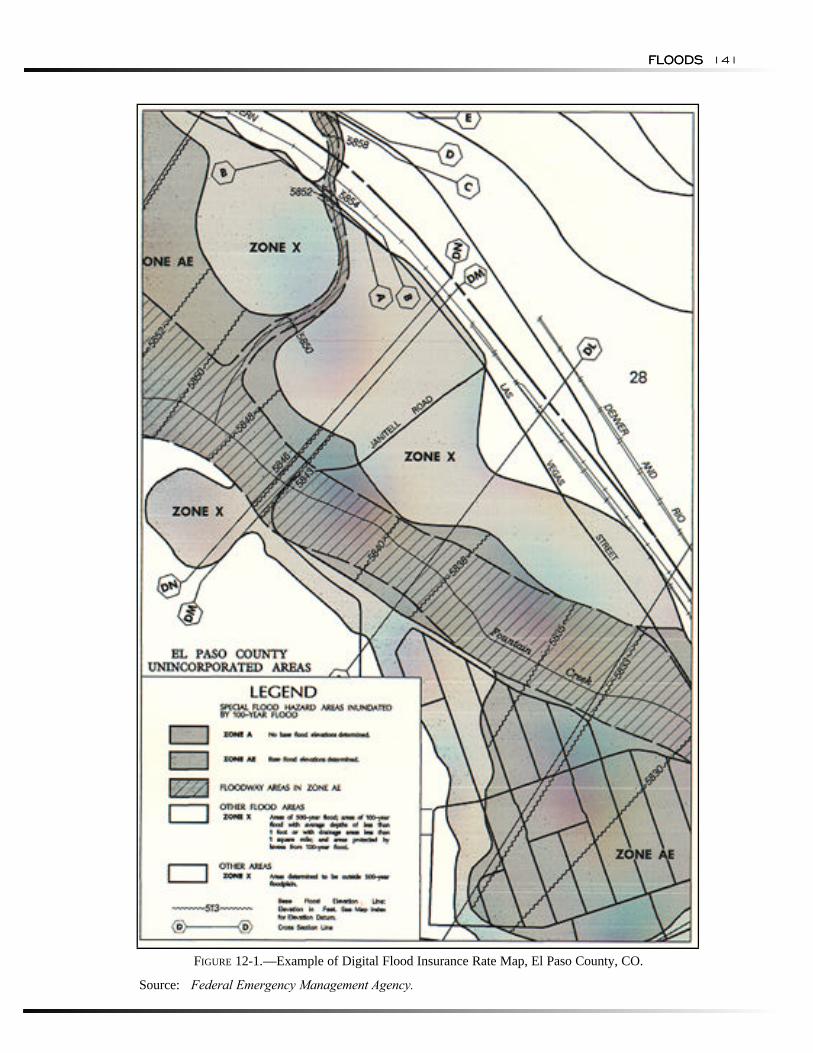
FIGURE 12-1.—Example of Digital Flood Insurance Rate Map, El Paso County, CO.
Source: Federal Emergency Management Agency.
NATURAL HAZARDS:
Exposure
HYDROLOGIC HAZARDS142 NATURAL HAZARDS: HYDROLOGIC HAZARDS
flood discharges to water surface elevations. Occasionally, more complex one-dimensional, unsteady-state models, two-dimensional models, or sediment-transport models are used. FEMA provides guidelines to compute flood discharges and to convert them to water surface elevations using hydraulic models (FEMA 37, 1995).
Computed water surface elevations are combined with topographic mapping data to develop flood hazard maps, termed Flood Insurance Rate Maps (FIRMs). FIRMs are produced using traditional cartographic practices and digital techniques. An example of a FIRM panel, adapted from the digital map for El Paso County, CO and Incorporated Areas, is shown in Figure 12-1. The FIRM illustrates:
• Areas inundated by the 1-percent-annual-chance flood where water surface elevations or water depths are computed by hydraulic models (Zone AE);
• Areas inundated by the 1-percent-annual-chance flood for which flood elevations are not determined by hydraulic models (Zone A)
• Floodway areas (cross-hatched areas);
• Elevations of the 1-percent-annual-chance flood, also known as base flood elevations;
• Areas inundated by the 0.2-percent-annual-chance flood, areas of the 1-percent-annual-chance flood with average depths of less than 1 foot or with drainage areas less than 1 square mile, and areas protected by levees from the 1-percent-annual-chance flood;
• Areas outside the 0.2-percent-annual-chance flood (Zone X); and
• Locations of cross sections used to develop the hydraulic model.
The floodway is defined as the channel of a river or other watercourse and the adjacent land areas that must be reserved in order to discharge the 1-percent-annual-chance flood without cumulatively increasing the water surface elevation by more than a designated height, usually 1.0 ft (0.3 m). Floodway development is regulated to strict standards, and the delineation should be retained by the community whenever possible.
The inundation areas for Zone A generally are deter-mined by approximate study methods such as depth-frequency relations, normal-depth or slope-conveyance computations, reduced number of cross sections in a step-backwater model, or inundation patterns of histor
ical floods that approximate the 1-percent-annual chance flood (Cobb, 1985). Base flood elevations are not provided in Zone A.
FIRMs provide information on areas subject to flooding. They are used to guide future development away from flood-prone areas and to regulate development that is proposed to occur within such areas. FIRMs are used by insurance agents to assign flood insurance rates.
Exposure
Floods occur in all 50 States and the U.S. territories. Several studies estimate the land area subject to flooding in the United States (USWRC, 1977b; SCS, 1982; Donnelley, 1987). In a refinement of the 1987 Donnelley study, FEMA estimated that over 146,000
mi2 (236,000 km2), or more than 4 percent of the total area of the 50 States and the District of Columbia, are in the 1-percent-annual-chance floodplain.
FEMA indicated that the States with the most land area subject to flooding by the 1-percent-annual-chance flood are Texas, Louisiana, Florida, and Arkansas. In terms of percentage of a State's total land area, the States with the most flood-prone lands are Louisiana, Florida, Arkansas, and Mississippi. These figures are based on an examination of approximately 17,500 communities that have FIRMs (Donnelley, 1987). Therefore, the data are limited by the extent of flood-plain mapping within each State. The floodplain acreages do not include remote areas for which NFIP maps are not printed, most floodplains with drainage areas less than 1 mi2, and areas subject to flooding from local drainage.
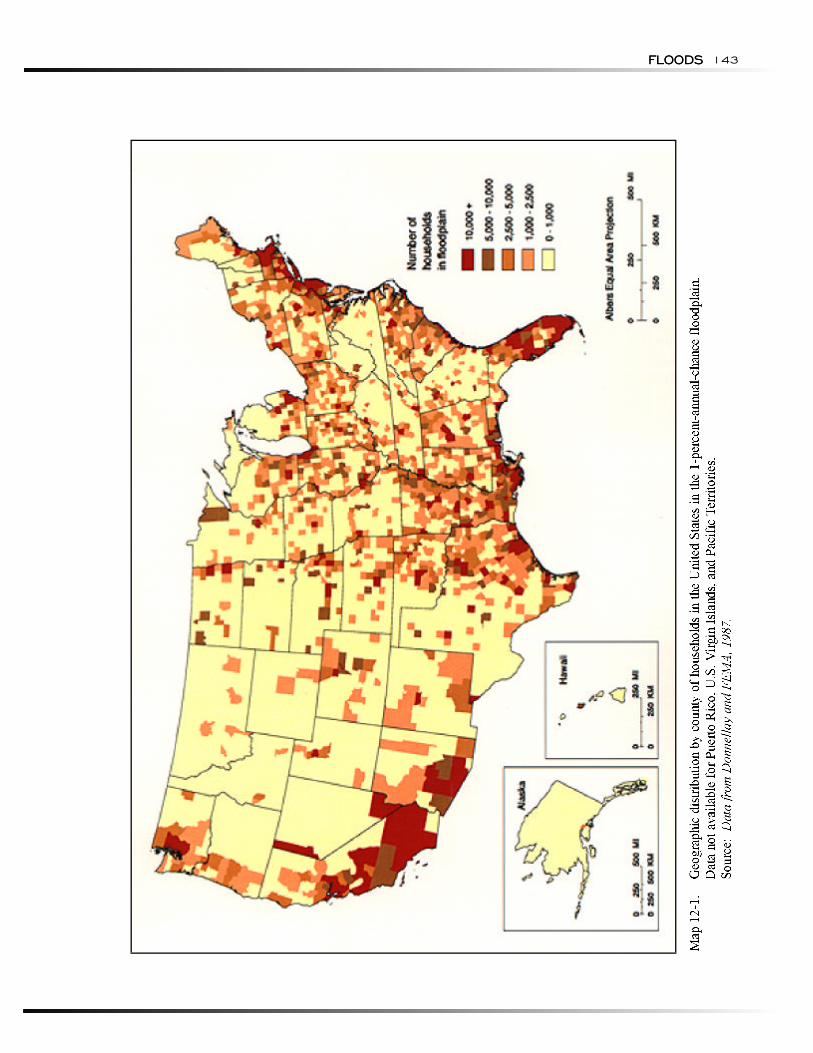
Using the 1987 Donnelley study, FEMA concluded that over 9 million households and $390 billion in property are at risk from the 1-percent-annual-chance flood. Based on a composite risk score accounting for flood-plain area and the number and value of households, Florida ranked as the State with the highest risk, followed by California, Texas, Louisiana, and New Jersey. Map 12-1 shows the estimated distribution by county of households in the 1-percent-annual-chance annual floodplain.
The Federal Insurance Administration reported at the end of 1994 that 18,561 of over 20,000 flood-prone communities were participating in the National Flood Insurance Program and administering floodplain management ordinances. In those communities, over 2.8 million flood insurance policies were in effect, providing financial protection in the event of flood damage.
FLOODSFLOODS 143
NATURAL HAZARDS:
Consequences
RESEARCH, DATA COLLECTION, ANDMONITORING ACTIVITIES
Flood Frequency Research.
Flood Warnings and Forecasts.
HYDROLOGIC HAZARDS144 NATURAL HAZARDS: HYDROLOGIC HAZARDS
Consequences
Reasonably good information is available for the great floods that have caused serious loss of life or major property damage. However, equivalent information frequently is not available for the multitude of smaller flood events that occur each year but that do not prompt Federal response.
Interpretation of flood loss data is difficult, and estimates are not necessarily comparable due to differences in reporting flood losses and in adjusting dollar amounts to reflect changes in monetary values, as well as other problems in coordinating data sources (e.g., Federal versus non-Federal outlays). The most comprehensive source of annual flood loss data is prepared by NWS.
Flash floods pose more significant safety risks than other riverine floods because of the rapid onset, the high velocity of water, the potential for channel scour, and the debris load. In addition, more than one flood crest may result from a series of fast moving storms. Sudden destruction of structures and washout of access routes may result in loss of life. A high percentage of flood-related deaths are caused by motorists who underestimate the depth and velocity of floodwaters and attempt to cross swollen streams (FEMA 116, 1987).
Since 1902, NWS has compiled annual estimates of the number of lives lost and flood damage, excluding losses to agriculture. To provide data to the U.S. Congress by January of each year, the NWS damage estimates are produced immediately after the close of the Federal fiscal year on September 30 and are not revised to reflect damage figures for floods that occurred close to that date, or information that may be more accurate or complete. Despite known problems with the NWS data, they provide the most complete and consistent information over the longest period of record. While detailed analysis may be misleading, gross trend analyses are considered to be reasonably accurate.
Examination of flood-related deaths recorded by NWS does not indicate a trend once the numbers are adjusted for population changes. For the period from 1916 to 1989, the adjusted average annual deaths (per 200 mil-lion population) is 125. During the 25-year period from 1916 through 1940, there was an adjusted average of 154 deaths per year; during the period from 1941 through 1965, the average was 86; and during the period from 1966 through 1985, the average was 145. Given the impact on number of deaths that one or two catastrophic events can produce, there is no indication that flood-related deaths are increasing or decreasing on a per capita basis (L.R. Johnson Associates, FIA-18, 1992).
For the period 1916 to 1989, there has been a definite increase in flood damage. With adjustment for population and inflation, the average annual damage was $902 million for the 1916-to-1950 period, and $2.15 billion for the 1951-to-1985 period. In other words, annual flood damage was almost 2.5 times more during the latter period.
The most costly flood disasters in U.S. history were the 1993 floods in the Upper Mississippi River Basin. They were caused by a series of storms from April to September and affected parts of nine Midwestern States. The damage was estimated to be between $12 and $16 billion, with 38 to 47 flood-related deaths. Between $4 and $5 billion of the total damage is attributed to agricultural losses in upland areas (Interagency Floodplain Management Review Committee, 1994).
RESEARCH, DATA COLLECTION, AND MONITORING ACTIVITIES
Flood Frequency Research. Considerable research has been devoted to investigating the most appropriate frequency distribution and fitting method for flood-frequency analyses (Stedinger and others, 1993). Different frequency distributions and fitting methods have been suggested as superior to the Pearson Type III frequency distribution, which has been used widely for many years.
Thomas and others (1995) summarize the commonly-used frequency distributions and fitting methods and compare frequency estimates for flood data in the United States and Japan. They concluded that there are differences in the estimates yielded by various methods, but the differences are generally less than 20 percent.
From 1985 to 1987, the Interagency Committee on Water Data conducted a survey of all Federal agencies to identify problems or deficiencies in the Bulletin 17B guidelines. The results indicated that Bulletin 17B techniques are generally sound, that no substantial problems had been identified that could not be resolved by means included in the guidelines, and that no clearly superior alternative had emerged (Thomas, 1992). The survey did find that problems are sometimes encountered, and it was recommended that a new work group be formed to provide supplemental guidance to solve the problems.
Flood Warnings and Forecasts. Important elements in the U.S. program to reduce flood damage include flood warnings and forecasts. Timely warnings and forecasts save lives and aid disaster preparedness, which decreases property damage by an estimated $1 billion annually (Mason and Weiger, 1995).
FLOODS
MITIGATION APPROACHES
Modify susceptibility to flood damage and disruption
Modify flooding
Modify the impacts of flooding
Manage natural and cultural resources
RECOMMENDATIONS
FLOODS 145
NWS is the Federal agency responsible for weather forecasting and warning, and is charged by law with issuing river forecasts and warnings. USGS operates and maintains more than 85 percent of stream-gaging stations nationwide, including 98 percent of gages used for real-time forecasting. The USGS network comprises approximately 7,300 stations dispersed throughout the United States, 4,200 of which are equipped with earth-satellite radios to provide real-time communications. NWS uses data from 3,971 stations to forecast river depth and flow conditions at 4,017 forecast-service locations on major rivers and small streams in urban areas (Mason and Weiger, 1995).
New radar technologies, improved river forecast models, computer visualization, automated data transmission, and improved data collection techniques hold significant promise for improving the timeliness and accuracy of flood forecasts and warnings. However, ground-based verification of river discharges and rain-fall will still be needed when new technologies are in place. Recent federal budget reductions have led to elimination of many USGS stream gages, causing concern that the timeliness and accuracy of flood forecasts and warnings may be impaired. Lack of records for hydrologically significant events may jeopardize frequency analyses in the future.
MITIGATION APPROACHES
A Federal Interagency Floodplain Management Task Force report (L.R. Johnson Associates, FIA-18, 1992) described four basic strategies for floodplain management: modify susceptibility to flood damage and disruption; modify flooding; modify the impacts of flooding; and manage natural and cultural resources. Specific activities to meet these strategies are identified below.
Modify susceptibility to flood damage and disruption
• Acquisition and demolition, and relocation of proper-ties in flood-prone areas
• Floodplain regulations and building codes
• Development and redevelopment policies
• Floodproofing and elevation-in-place
• Disaster preparedness and response plans
• Flood forecasting and warning systems
Modify flooding
• Construction of dams and reservoirs
• Construction of dikes, levees, and floodwalls
• Channel alterations
• High flow diversions and spillways
• Land treatment measures
Modify the impacts of flooding
• Information and education
• Flood insurance
• Tax adjustments
• Flood emergency measures
• Disaster assistance
• Post-flood recovery
Manage natural and cultural resources
• Preservation and restoration strategies
• Regulations to protect floodplain natural and cultural resources
• Development and redevelopment policies and programs
• Information and education
• Tax adjustments
• Administrative measures
RECOMMENDATIONS
Recommendations for improving floodplain management are included in the report of the Interagency Floodplain Management Review Committee (1994) and the report by Galloway (1995). The recommendations can be grouped in major categories:
• Improve coordination of Federal, State, tribal, and local responsibilities for floodplain management, including the reactivation of the Water Resources Council or a comparable over-sight organization;
• Increase post-disaster flexibility for land acquisition programs, and increase environmental attention in
NATURAL HAZARDS:
BIBLIOGRAPHY AND REFERENCES
HYDROLOGIC HAZARDS146 NATURAL HAZARDS: HYDROLOGIC HAZARDS
Federal operation and maintenance and disaster recovery activities;
• Enhance the efficiency and effectiveness of the NFIP by improving the marketing of flood insurance, reducing the amount of post-disaster support for those who choose not to buy insurance, and providing mitigation insurance to cover the cost of elevating, demolishing, or relocating substantially damaged buildings;
• Reduce exposure to flood damage of those in the floodplain by considering permanent evacuation of flood-prone areas, flood warning, floodproofing, creation of additional natural and artificial storage, and adequately sized and maintained levees;
• Require periodic review of completed flood control projects to ensure they continue to meet intended purposes;
• Assign USACE the principal responsibility for repair, rehabilitation, and construction of levees under Federal programs;
• Ensure proper siting, construction, and maintenance of non-Federal levees by States, local jurisdictions, private entities, and tribes;
• Capitalize on successes in pre-disaster, response, recovery, and mitigation efforts during and following the 1993 flood;
• Provide timely gathering and dissemination of the critical water resources information needed for flood-plain management and disaster operations by establishing an information clearinghouse at USGS; and
• Exploit science and technology to support monitoring, analysis, modeling, and the development of decision-support systems and Geographic Information System applications for floodplain activities.
BIBLIOGRAPHY AND REFERENCES
Benson, M.A. 1967. "Uniform Flood-Frequency Estimating Methods for Federal Agencies." Water Resources Research. U.S. Geological Survey. Vol. 4, No 5, pp. 891-908.
Cobb, E.D. 1985. Evaluation of Streams in Selected Communities for the Application of Limited Detail Study Methods for Flood-Insurance Studies. U.S. Geological Survey Water Resources Investigations 85-4098.
Dracup, J.A., E.D.H. Cheng, J.M. Nigg, and T.A. Schroeder. 1991. Natural Disaster Studies Volume One: The New Year's Eve Flood on Oahu, Hawaii— December 31, 1987-January 1, 1988. National Research Council, Committee on Natural Disasters, Division of Natural Hazard Mitigation, Commission on Engineering and Technical Systems.
Donnelley Marketing Information Services. 1987. System Update Report. (Prepared for FEMA.)
Federal Emergency Management Agency. 1983. The 100-Year Base Flood Standard and the Floodplain Management Executive Order: A Review Prepared for the Office of Management and Budget. Washington, DC: U.S. Government Printing Office.
Federal Emergency Management Agency. 1987. Reducing Losses in High Risk Areas: A Guidebook for Local Officials. FEMA 116. Washington, DC: U.S. Government Printing Office.
Federal Emergency Management Agency. 1989. Alluvial Fans: Hazards and Management. FEMA 165. Washington, DC: U.S. Government Printing Office.
Federal Emergency Management Agency. 1995. Flood Insurance Study Guidelines and Specifications for Study Contractors. FEMA 37. Washington, DC: U.S. Government Printing Office.
Galloway, G.E. 1995. "New Directions in Floodplain Management." Water Resources Bulletin. American Water Resources Association. Vol. 31, No. 3, pp. 351-357.
Interagency Advisory Committee on Water Data. 1982. Guidelines for Determining Flood Flow Frequency. Bulletin 17B of the Hydrology Subcommittee, Department of Interior, U.S. Geological Survey, Office of Water Data Coordination. Reston, VA.
Interagency Floodplain Management Review Committee. 1994. Sharing the Challenge: Floodplain Management into the 21st Century. Administration Floodplain Management Task Force. Washington DC.
L.R. Johnson Associates. 1992. Floodplain Management in the United States: An Assessment Report. Vol. 2; Full Report. Federal Interagency Floodplain Management Task Force, FIA-18.
FLOODSFLOODS 147
Mason, R.R., and B.A. Weiger. 1995. Stream Gaging and Flood Forecasting. U.S. Geological Survey Fact Sheet 209-95.
Stedinger, J.R., R.M. Vogel, and E. Foufoula-Georgiou. 1993. "Frequency Analysis of Extreme Events." Handbook of Hydrology. (D. Maidment, Ed.) New York, NY: McGraw-Hill Book Co.
Thomas, W.O., Jr. 1985. "A Uniform Technique for Flood Frequency Analysis." Journal of Water Resources Planning and Management. American Society of Civil Engineers. Vol. 111, No. 3, pp. 321-337.
Thomas, W.O., Jr. 1992. Status of At-Site Flood-Frequency Analysis Among Federal Agencies. Transportation Research Record No. 1350, Transportation Research Board, National Research Council. Washington, DC: National Academy Press.
Thomas, W.O., Jr., M. Kuriki, and T. Suetsugi. 1995. "An Evaluation of Frequency Distributions and Fitting Methods for Flood Hazard Analysis." Proceedings of the Third PWRI-USGS Workshop on Hydrology, Water Resources and Global Climate Change. Public Works Research Institute of Japan. Technical Memorandum No. 3373, pp. 119-166.
U.S. Department of Agriculture, Soil Conservation Service. 1982. Basic Statistics, 1977 National Resources Inventory. Bulletin No. 686. Iowa State University Statistical Laboratory.
U.S. Water Resources Council. December 1967. A Uniform Technique for Determining Flood Flow Frequency. Hydrology Committee, Bulletin No. 15, Washington, DC.
U.S. Water Resources Council. 1976a. Guidelines for Determining Flood Flow Frequency. Bulletin 17. Washington, DC: U.S. Government Printing Office.
U.S. Water Resources Council. 1976b. A Unified National Program for Flood Plain Management. Washington, DC: U.S. Government Printing Office.
U.S. Water Resources Council. 1977a. Guidelines for Determining Flood Flow Frequency. Bulletin 17A. Washington, DC: U.S. Government Printing Office.
U.S. Water Resources Council. 1977b. Estimated Flood Damages. Appendix B: Nationwide Analysis Report. Washington, DC: U.S. Government Printing Office.
U.S. Water Resources Council. 1981. Guidelines for Determining Flood Flow Frequency. Bulletin 17B. Washington, DC: U.S. Government Printing Office.

CHAPTERCHAPTER
13
STORMSTORM SURGESSURGES
NATURAL HAZARDS:
Chapter Summary
HYDROLOGIC HAZARDS150 NATURAL HAZARDS: HYDROLOGIC HAZARDS
Chapter Summary
Storm surges associated with extratropical cyclones (nor'easters) in the North Atlantic Ocean and the Gulf of Mexico, and severe winter low-pressure
systems in the North Pacific Ocean and the Gulf of Alaska are responsible for coastal flooding and erosion. The storms that generate the large waves of coastal surges can develop year-round, but they are most frequent from late fall to early spring. Hurricanes, and other tropical cyclones, also generate storm surges (Chapter 1).
The effects of storm surges were included in more than two dozen Federal disaster declarations during the past 20 years. Those declarations also included the concurrent effects of severe winds, erosion, and rainfall flooding.
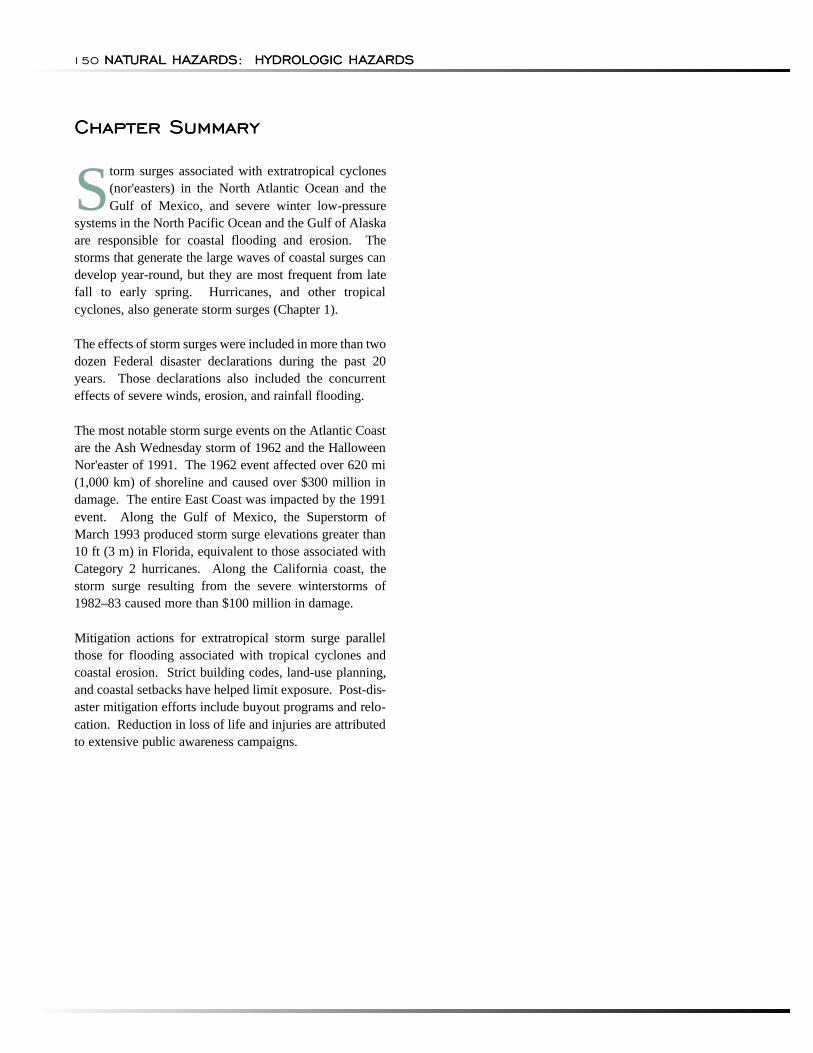
The most notable storm surge events on the Atlantic Coast are the Ash Wednesday storm of 1962 and the Halloween Nor'easter of 1991. The 1962 event affected over 620 mi (1,000 km) of shoreline and caused over $300 million in damage. The entire East Coast was impacted by the 1991 event. Along the Gulf of Mexico, the Superstorm of March 1993 produced storm surge elevations greater than 10 ft (3 m) in Florida, equivalent to those associated with Category 2 hurricanes. Along the California coast, the storm surge resulting from the severe winterstorms of 1982–83 caused more than $100 million in damage.
Mitigation actions for extratropical storm surge parallel those for flooding associated with tropical cyclones and coastal erosion. Strict building codes, land-use planning, and coastal setbacks have helped limit exposure. Post-disaster mitigation efforts include buyout programs and relocation. Reduction in loss of life and injuries are attributed to extensive public awareness campaigns.
STORM SURGESSTORM SURGES 151
NATURAL HAZARDS:
HAZARD IDENTIFICATION
HYDROLOGIC HAZARDS152 NATURAL HAZARDS: HYDROLOGIC HAZARDS
HAZARD IDENTIFICATION
Storm surges occur when the water level of a tidally influenced body of water increases above the normal astronomical high tide. Storm surges commonly occur with coastal storms caused by massive low-pressure systems with cyclonic flows that are typical of tropical cyclones, nor'easters, and severe winterstorms. Other factors influencing storm intensity are listed in Table 13-1. Storm surges generated by coastal storms are con-trolled by four factors (Coch 1995), described below.
• The more intense storms have higher wind speeds that drive greater amounts of water across the shallow continental shelf, thereby increasing the volume and elevation of water pushed up against the coast. In areas with mild slopes and shallow depths, the resulting flooding can reach greater heights.
• The low barometric pressures experienced during coastal storms cause the water surface to rise, increasing the height of storm surges.
• Storms landfalling during peak astronomical tides have higher surge heights and more extensive flood inundation limits.
• Coastal shoreline configurations with concave features or narrowing bays create a resonance within the area as a result of the winds forcing in water, elevating the surface of the water higher than experienced along adjacent areas of open coast.
Although low-pressure systems and coastal storms can develop year-round, the most frequent and severe non-tropical low-pressure systems and nor'easters affecting the United States occur from late fall to early spring (Coch, 1995). The long duration, long fetch, and large area of circulation of nor'easters and severe winter-storms can affect many geographic areas and inflict damage to the shoreline along numerous coastal reaches over several days.
Storm surges inundate coastal floodplains by dune overwash, tidal elevation rise in inland bays and harbors, and backwater flooding through coastal river mouths. Severe winds associated with low-pressure
TABLE 13-1.—Factors influencing the severity of coastal storms
Factor Effect
Wind Velocity The higher the wind velocity the greater the damage.
Storm Surge Height The higher the storm surge the greater the damage.
Coastal Shape Concave shoreline sections sustain more damage because the water is driven into a confined area by the advancing storm, thus increasing storm surge height and storm surge flooding.
Storm Center Velocity The slower the storm moves, the greater the damage. The worst possible situation is a storm that stalls along a coast, through several high tides.
Nature of Coast Rocky coasts are least disturbed. Cliff sedimentary coasts can retreat by slumping or rockfalls, but damage is most severe on low-lying island barrier island shorelines because they are easily overwashed by storm waves and storm surges.
Previous Storm Damage A coast weakened by even a minor previous storm will be subject to proportionally greater damage in a subsequent storm.
Human Activity With increased development, property damage increases and more floating debris becomes available to knock down other structures.
Source: Coch, 1995
STORM SURGES
RISK ASSESSMENT
Probability and Frequency
STORM SURGES 153
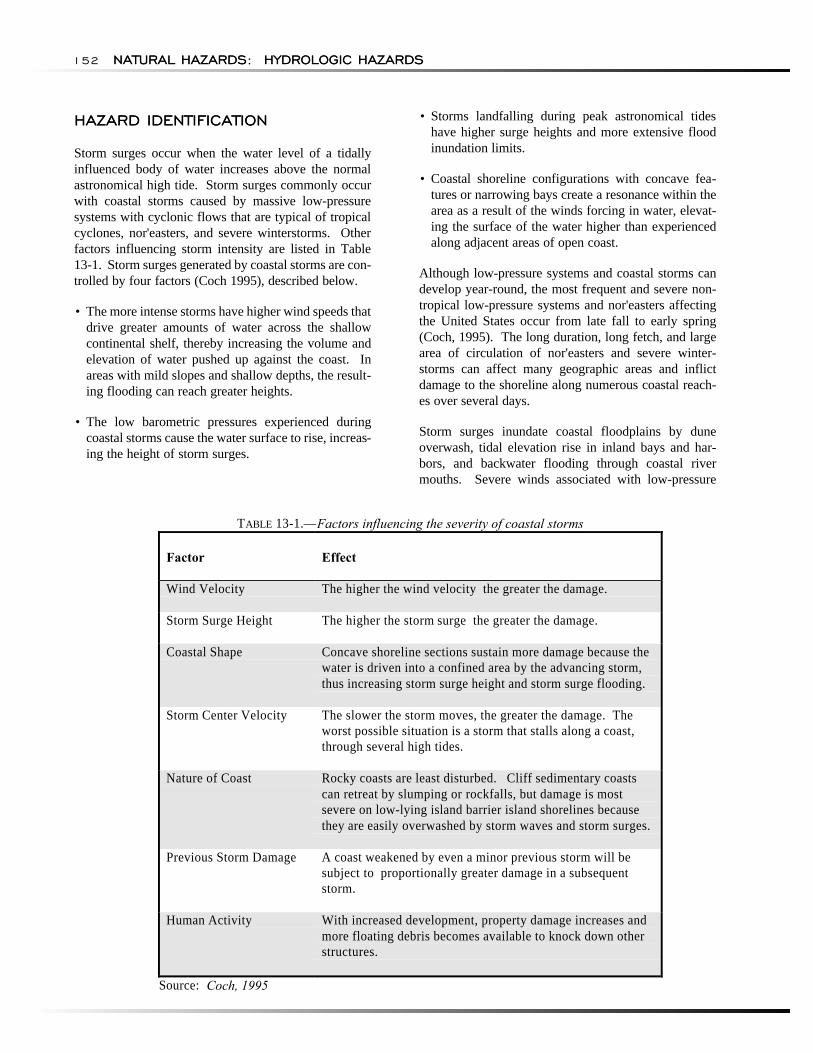
Map 13-1. Expected storm surge elevations with a 10-year recurrence interval. Data not available for Great Lakes region, Hawaii, Puerto Rico, U.S. Virgin Islands, and Pacific Territories Source: Data from Anders and others, 1989.
systems cause increases in tide levels and water-surface elevations due to setup, a stillwater component of the storm event. Storm systems also generate large waves that run up and flood coastal beaches. The combined effects create storm surges that affect the beach, dunes, and adjacent low-lying floodplains. Shallow offshore depths can cause storm-driven waves and tides to pile up against the shoreline and inside bays.
Storm surge flooding has reduced impacts in areas with steep coastal relief and terrain, deep offshore bathymetry, or large inland bays. Steep terrain at coastal bluffs reduces the volume and elevation of water pushed up against the shore, preventing flooding and reflecting potentially damaging wave energy. In addition, deep water along offshore troughs or canyons may cause wave heights to increase rapidly when approaching the shoreline, however the surge is lessened because the water levels will not pile up against the shoreline as dramatically as in other coastal areas.
Areas with large inland bays and numerous outlets to the ocean have pressure release valves for floodwaters returning to the open ocean after storms pass, allowing attenuation of the water surface rise and the absorption and storage of overwash and inland floodwaters during the storm event.
RISK ASSESSMENT
The storm surge levels associated with nor'easters, winter low-pressure systems, and other coastal storms with extreme tides and waves have been analyzed in numerous FEMA Flood Insurance Studies along the Atlantic and Pacific coasts. The information has been used to identify the coastal high hazard areas in addition to those influenced by tropical cyclone flooding.
Probability and Frequency
The most common reference to a return period for storm surges has been the elevation of the coastal flood having a 1-percent chance of being equaled or exceeded in any given year, also known as the 100-year flood. The 1-percent-annual-chance flood is derived from statistical hydrologic analyses to establish stage-frequency relationships of water surface elevations based on historical data.
Detailed hydraulic analyses include establishing the relationship of tide levels with wave heights and wave runup, or generation of synthetic populations of storm surge data based on hydrodynamic models. The storm surge inundation limits for the 1-percent-annual-chance coastal flood event are a function of the combined influ-
NATURAL HAZARDS:
Exposure
HYDROLOGIC HAZARDS154 NATURAL HAZARDS: HYDROLOGIC HAZARDS
ence of the water surface elevation rise and accompanying wave heights and wave runup along the coastline.
In a study performed by the Coastal Engineering Research Center (CERC) and the University of Virginia, which was included in the 1989 USGS report and mapping (Anders and others, 1989), storm surges with a 10-year recurrence interval from all types of coastal low-pressure systems (extratropical, tropical, and winterstorms) were included in a coastal hazard assessment (Map 13-1).
The risk of storm surge elevations higher than 7 ft (2 m) exists along certain coastal segments of Oregon, Washington, and Alaska, and in every coastal State from Texas to New Jersey. Due to lack of data, the 1989 USGS report did not address the Great Lakes region, portions of the Alaskan coast, and the coasts of California, Hawaii, Puerto Rico, U.S. Virgin Islands, and the Pacific territories.
The University of Virginia/CERC assessment, included in the 1989 USGS report and mapping, concluded that the surge associated with storms of longer recurrence intervals would result in more storm surge flooding, higher water levels, larger waves, and an increased likelihood of dune overwash, wave damage, and possible breaching of barrier islands.
Bluff collapse, typically triggered by undercutting due to erosive waves, is a significant hazard along portions of the shorelines of California, Oregon, Washington, and around the Great Lakes.
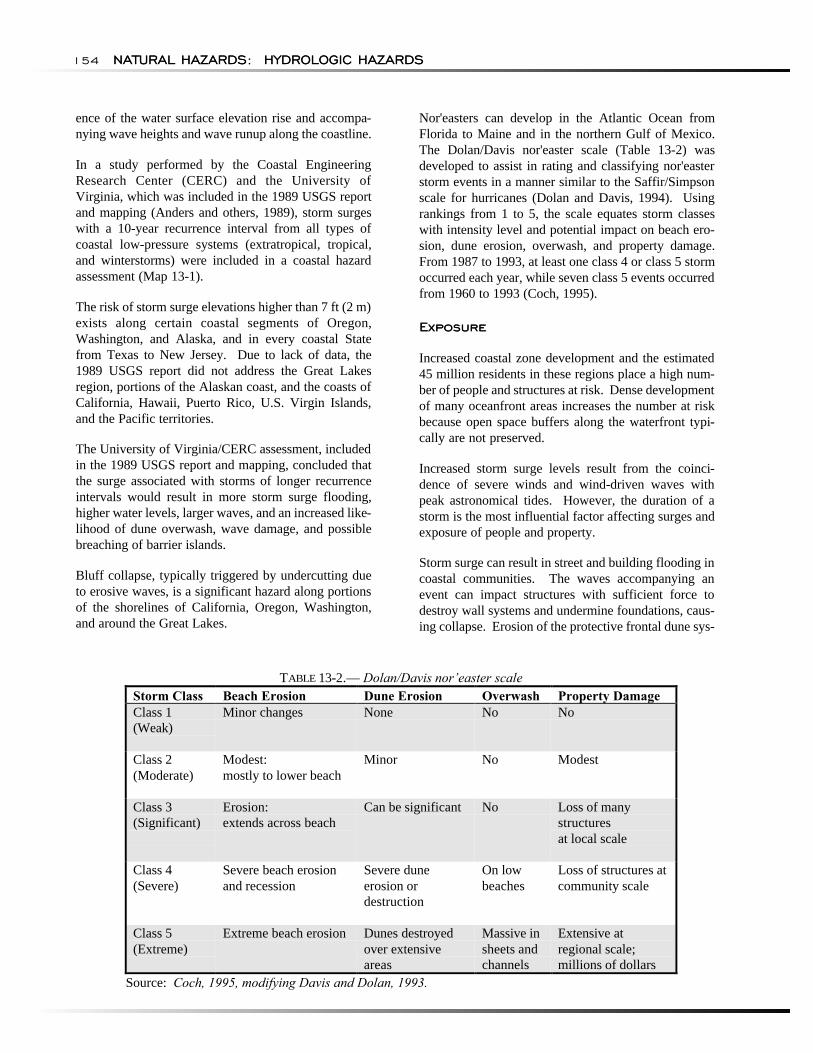
Nor'easters can develop in the Atlantic Ocean from Florida to Maine and in the northern Gulf of Mexico. The Dolan/Davis nor'easter scale (Table 13-2) was developed to assist in rating and classifying nor'easter storm events in a manner similar to the Saffir/Simpson scale for hurricanes (Dolan and Davis, 1994). Using rankings from 1 to 5, the scale equates storm classes with intensity level and potential impact on beach erosion, dune erosion, overwash, and property damage. From 1987 to 1993, at least one class 4 or class 5 storm occurred each year, while seven class 5 events occurred from 1960 to 1993 (Coch, 1995).
Exposure
Increased coastal zone development and the estimated 45 million residents in these regions place a high number of people and structures at risk. Dense development of many oceanfront areas increases the number at risk because open space buffers along the waterfront typically are not preserved.
Increased storm surge levels result from the coincidence of severe winds and wind-driven waves with peak astronomical tides. However, the duration of a storm is the most influential factor affecting surges and exposure of people and property.
Storm surge can result in street and building flooding in coastal communities. The waves accompanying an event can impact structures with sufficient force to destroy wall systems and undermine foundations, causing collapse. Erosion of the protective frontal dune sys-
TABLE 13-2.— Dolan/Davis nor’easter scale Storm Class Beach Erosion Dune Erosion Overwash Property Damage Class 1 (Weak)
Minor changes None No No
Class 2 (Moderate)
Modest: mostly to lower beach
Minor No Modest
Class 3 (Significant)
Erosion: extends across beach
Can be significant No Loss of many structures at local scale
Class 4 (Severe)
Severe beach erosion and recession
Severe dune erosion or destruction
On low beaches
Loss of structures at community scale
Class 5 (Extreme)
Extreme beach erosion Dunes destroyed over extensive areas
Massive in sheets and channels
Extensive at regional scale; millions of dollars
Source: Coch, 1995, modifying Davis and Dolan, 1993.
STORM SURGES
Consequences
RESEARCH, DATA COLLECTION, ANDMONITORING ACTIVITIES
MITIGATION APPROACHES
STORM SURGES 155
tem by waves and overwash may expose buildings and structures to high velocity floodflows, interior flooding, foundation scour, and other damage.
Consequences
The effects of storm surge from coastal storms were included in more than two dozen Federal disaster declarations during the past 20 years. The declarations were not based specifically on storm surges, but included concurrent effects from severe winds, erosion, and rainfall flooding. In the Atlantic Ocean and Gulf of Mexico, 9 out of every 10 fatalities from a tropical cyclone result from drowning caused by storm surge flooding (Hebert and others, 1995).
Although severe coastal storms do not occur each year, several notable non-tropical storm surge events have occurred since 1960. The most significant in the Atlantic Ocean were the Ash Wednesday storm of 1962, which affected over 620 mi (1,000 km) of shoreline over four high tides and caused over $300 million in damage, and the Halloween Nor'easter of 1991, which caused severe flooding and coastal erosion along the entire East Coast.
In the Gulf of Mexico, the Superstorm of March 1993 generated storm surge elevations greater than 10 ft (3 m) north of Tampa, FL. These elevations are equivalent to those expected from Category 2 hurricanes.
Storm surges and waves generated by the California winter storms of 1982–83 caused coastal beach and bluff erosion from San Diego to San Francisco, resulting in damage to structures and property in excess of $100 million (Dean and others, 1984). Erosion of bluffs is a significant hazard along the shorelines of California, Oregon, Washington, and around the Great Lakes.
RESEARCH, DATA COLLECTION, AND MONITORING ACTIVITIES
Studies of storm surge flooding effects caused by hurricanes and typhoons are conducted by the NWS's National Hurricane Center and Joint Typhoon Warning Center. The National Hurricane Center uses the SLOSH model to determine the coastal flood potential along the coasts of Gulf of Mexico and Atlantic Ocean.
The University of Virginia/CERC study included in the 1989 USGS report and mapping presented an assessment of storm surge risk (Anders and others, 1989). The study and mapping cover overall coastal hazards along the shorelines of the United States, including
Alaska and Hawaii, but excluding the Great Lakes. Similar assessments of the Great Lakes coastal hazards will be undertaken in the near future.
The Dolan/Davis classification system for nor'easters rates storms based on a "storm power index," with the power defined as the maximum deep-water significant wave height squared, times the storm duration (Dolan and Davis, 1994). The classification system was developed from measured storm data for nor'easters from 1943 to 1984 and recently was updated to 1992. Data continue to be collected.
MITIGATION APPROACHES
The primary tools for mitigating the effects of storm surge flooding for all types of coastal storms focus on public safety and structures. Loss of life has been reduced significantly through extensive public awareness campaigns and implementation of evacuation plans during impending emergencies. The influx of coastal residents who are unaware of storm surge hazards requires that such programs be continued.
Regional hurricane evacuation planning efforts have been successful in alerting residents to the dangers of storm surge flooding and acknowledging the importance of evacuation of low-lying coastal floodplains. These plans also may support response to non-tropical storms.
Structural damage mitigation has been most successful where strict building codes for high wind and flood-prone areas have been adopted and enforced. Coastal setback and regulatory programs have helped limit exposure for some of the more recent developments near high risk coastal areas. During the past 25 years, intense development occurred so rapidly along the oceanfront and adjacent coastal floodplains that regulatory programs may not have been in place to control the type and nature of structures needed to resist storm surges.
Post-disaster mitigation efforts include more stringent building codes, buyout programs, relocation, elevation of structures, improved open-space preservation, and land-use planning.
Along selected reaches, beach nourishment and dune construction have been used as short-term measures to prevent storm surge flooding and to protect upland property. Such projects replenish depleted sand sup-plies and rebuild dunes to maintain a buffer zone between developed properties and the ocean.
NATURAL HAZARDS:
RECOMMENDATIONS
BIBLIOGRAPHY AND REFERENCES
HYDROLOGIC HAZARDS156 NATURAL HAZARDS: HYDROLOGIC HAZARDS
RECOMMENDATIONS
The recommendations to reduce the impact of, and exposure to, storm surge hazards are related to those presented in chapters on tropical cyclones and coastal erosion. Refinement of hazard identification models and methods, increased public education and awareness, installation of flood warning systems, additional land-use regulations, and modified building codes will be beneficial.
BIBLIOGRAPHY AND REFERENCES
Anders, F., S. Kimball, and R. Dolan. 1989. Coastal Hazards: National Atlas of the United States. Map. U.S. Geological Survey.
Byrant, E. 1991. Natural Disasters. New York, NY: Cambridge University Press.
Coch, N.K. 1995. GEOHAZARDS: Natural and Human. Upper Saddle River, NJ: Prentice Hall.
Daniels, R.C., V.N. Gornitz, A.J. Mehta, S.C. Lee, and R.M. Cushman. 1992. Adapting to Sea-Level Rise in the U.S. Southeast: The Influence of Built Infrastructure and Biophysical. Oak Ridge National Laboratory, Environmental Sciences Division, Publication No. 3915.
Davis, R.E., and R. Dolan. 1993. "Nor'easters." American Scientist. Vol. 81, pp. 428.
Dolan, R., and R.E. Davis. 1994. "Coastal Storm Hazards." Journal of Coastal Research, Special Issue No. 12. Coastal Hazards: Perception, Susceptibility and Mitigation. The Coastal Education and Research Foundation, Inc.
Federal Emergency Management Agency, Federal Insurance Administration, Office of Risk Assessment. 1989. Erosion Rate Data Study Plan. Washington, DC.
Federal Emergency Management Agency, Federal Insurance Administration. 1991. Projected Impact of Relative Sea Level Rise on the National Flood Insurance Program. Washington, DC.
Federal Emergency Management Agency, Federal Insurance Administration. 1994. Mitigation of Flood and Erosion Damage to Residential Buildings in Coastal Areas. Washington, DC.
Finkl, C.W., Jr. (Ed.). 1994. Journal of Coastal Research, Special Issue No. 12. Coastal Hazards: Perception, Susceptibility and Mitigation. The Coastal Education and Research Foundation, Inc.
Gornitz, V.N., R.C. Daniels, T.W. White and K.R. Birdwell. 1994. "The Development of a Coastal Risk Assessment Database: Vulnerability to Sea-Level Rise in the U.S. Southeast." Journal of Coastal Research Special Issue No. 12. Coastal Hazards: Perception, Susceptibility and Mitigation. The Coastal Education and Research Foundation, Inc.
Gornitz, V.M., T.W. White, and R.C. Daniels (Eds.) 1994. A Coastal Hazards Data Base for the U.S. Gulf Coast. Oak Ridge National Laboratory, Environmental Sciences Division, Publication No. 4101.
Gornitz, V.M., and T.W. White. 1992. A Coastal Hazards Data Base for the U.S. East Coast. Oak Ridge National Laboratory, Environmental Sciences Division, Publication No. 3913.
Griggs, G.B., J.E. Pepper, and M.E. Jordan. 1992. California's Coastal Hazards: A Critical Assessment of Existing Land-Use Policies and Practices. California Policy Seminar Research Report. Santa Cruz, CA: University of California.
Hebert, P.J., J.D. Jarrell, and M. Mayfield. 1995. "The Deadliest, Costliest, and Most Intense United States Hurricanes of This Century (And Other Frequently Requested Hurricane Facts)." Proceedings for 17th Annual National Hurricane Conference, April 11-14, 1995, Atlantic City, New Jersey. National Oceanic and Atmospheric Administration, National Weather Service.
National Academy of Sciences. 1994. Natural Disaster Studies Volume Six, Hurricane Hugo: Puerto Rico, the U.S. Virgin Islands, and South Carolina— September 17-22, 1989. Washington, DC: National Academy of Sciences/National Research Council, Committee on Natural Disasters, Board on Natural Disasters, Commission on Engineering and Technical Systems, Commission on Geosciences, Environment, and Resources.
National Oceanic and Atmospheric Administration, National Weather Service. 1993. Natural Disaster Survey Report: Hurricane Andrew—South Florida and Louisiana—August 23-26, 1992.
STORM SURGESSTORM SURGES 157
National Oceanic and Atmospheric Administration, National Weather Service. 1993. Natural Disaster Survey Report: Hurricane Iniki—September 6-13, 1992.
National Oceanic and Atmospheric Administration, National Weather Service. 1992. Natural Disaster Survey Report: The Halloween Nor'easter of 1991 East Coast of the United States...Maine to Florida and Puerto Rico—October 28 to November 1, 1991.
National Oceanic and Atmospheric Administration, National Weather Service. 1994. Natural Disaster Survey Report: Superstorm of March 1993, March 12-14, 1993.
Oregon Sea Grant. 1994. Improving Natural Hazards Management on the Oregon Coast: Recommendations of the Coastal Natural Hazards Policy Working Group. Report No. ORESU-T-94-002. Corvallis, OR: Oregon State University.
Palm, R.I., and M.E. Hodgson. 1993. Natural Hazards in Puerto Rico: Attitudes, Experience, and Behavior of Homeowners. Program on Environment and Behavior, Monograph No. 55. Natural Hazards Research and Applications Informations Center. Boulder, CO: University of Colorado.

CHAPTERCHAPTER
14
COASTALCOASTAL EROSIONEROSION
NATURAL HAZARDS:
Chapter Summary
HYDROLOGIC HAZARDS160 NATURAL HAZARDS: HYDROLOGIC HAZARDS
Chapter Summary
Coastal erosion affects every coastal State and territory in the United States. According to a 1971 USACE study, the only comprehensive assessment
of the problem, approximately 20,500 mi (33,000 km) of the 84,240 mi (132,350 km) of U.S. shoreline experience "significant" erosion, while 2,700 mi (4,350 km) are subject to "critical" erosion.
Coastal erosion is measured as the rate of change in the position or horizontal displacement of a shoreline over a period of time. It is generally associated with storm surges, hurricanes, windstorms, and flooding hazards, and may be exacerbated by human activities such as boat wakes, shoreline hardening, and dredging.
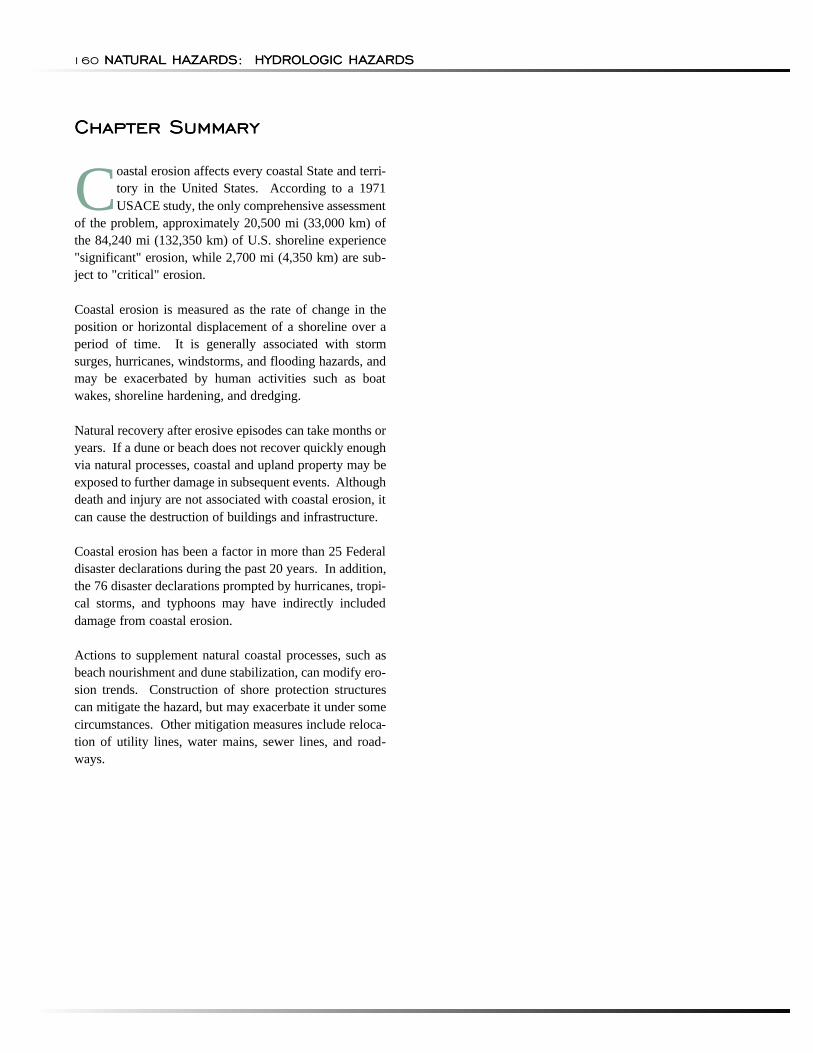
Natural recovery after erosive episodes can take months or years. If a dune or beach does not recover quickly enough via natural processes, coastal and upland property may be exposed to further damage in subsequent events. Although death and injury are not associated with coastal erosion, it can cause the destruction of buildings and infrastructure.
Coastal erosion has been a factor in more than 25 Federal disaster declarations during the past 20 years. In addition, the 76 disaster declarations prompted by hurricanes, tropical storms, and typhoons may have indirectly included damage from coastal erosion.
Actions to supplement natural coastal processes, such as beach nourishment and dune stabilization, can modify erosion trends. Construction of shore protection structures can mitigate the hazard, but may exacerbate it under some circumstances. Other mitigation measures include relocation of utility lines, water mains, sewer lines, and road-ways.
COASTAL EROSIONCOASTAL EROSION 161
NATURAL HAZARDS:
HAZARD IDENTIFICATION
RISK ASSESSMENT
Probability and Frequency
HYDROLOGIC HAZARDS162 NATURAL HAZARDS: HYDROLOGIC HAZARDS
HAZARD IDENTIFICATION
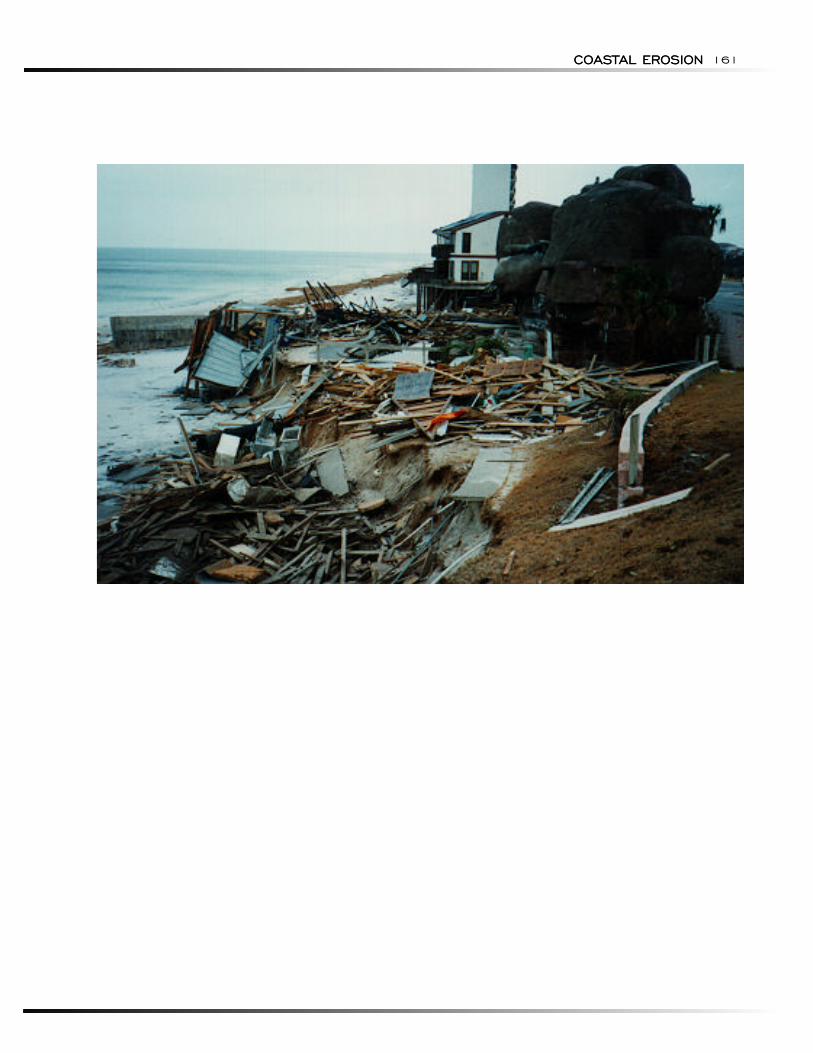
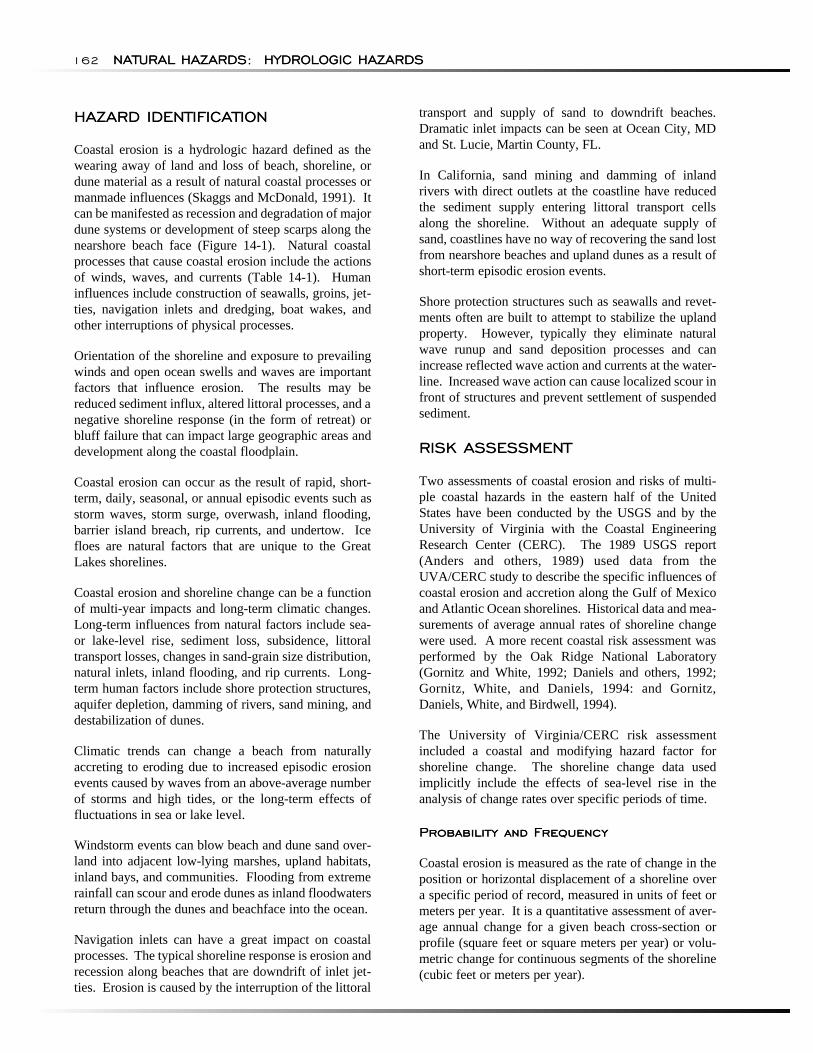
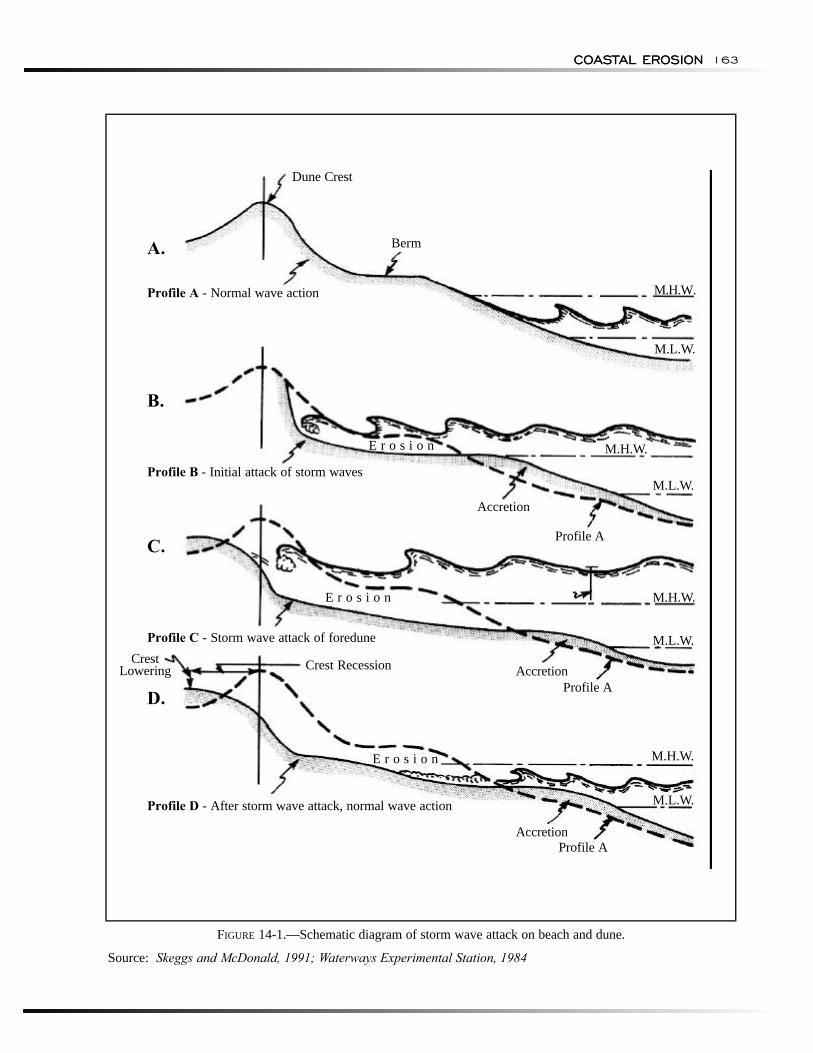
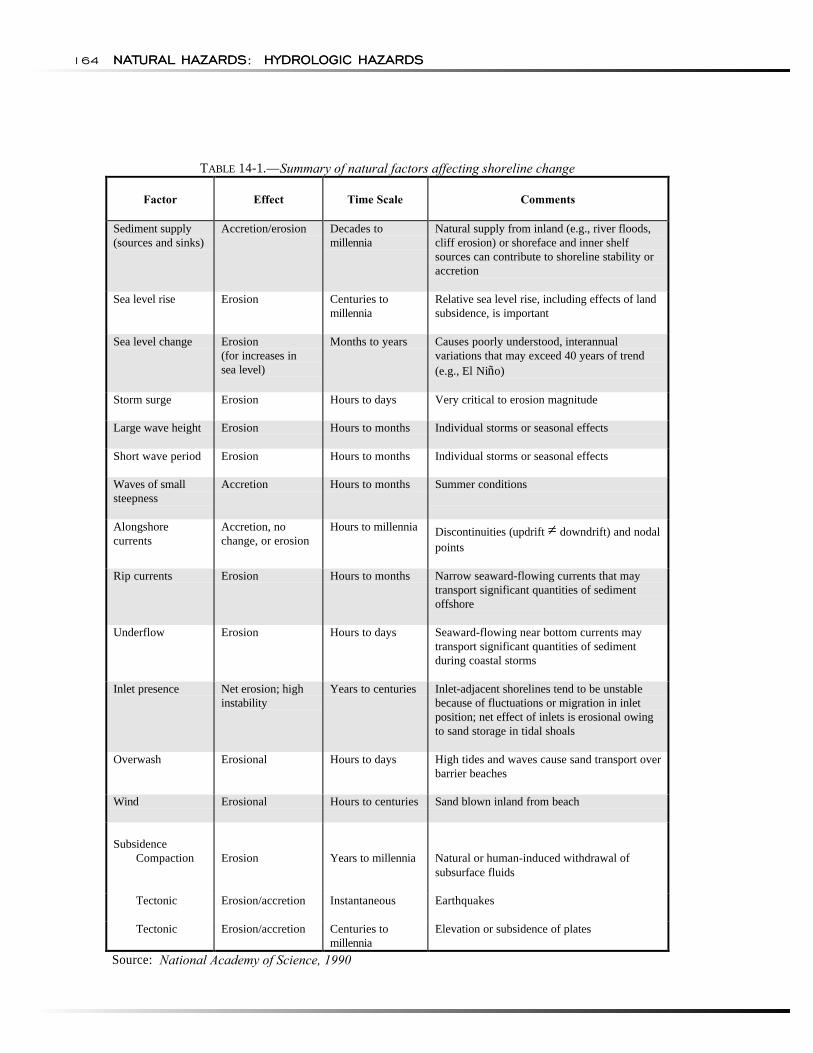
Coastal erosion is a hydrologic hazard defined as the wearing away of land and loss of beach, shoreline, or dune material as a result of natural coastal processes or manmade influences (Skaggs and McDonald, 1991). It can be manifested as recession and degradation of major dune systems or development of steep scarps along the nearshore beach face (Figure 14-1). Natural coastal processes that cause coastal erosion include the actions of winds, waves, and currents (Table 14-1). Human influences include construction of seawalls, groins, jet-ties, navigation inlets and dredging, boat wakes, and other interruptions of physical processes.
Orientation of the shoreline and exposure to prevailing winds and open ocean swells and waves are important factors that influence erosion. The results may be reduced sediment influx, altered littoral processes, and a negative shoreline response (in the form of retreat) or bluff failure that can impact large geographic areas and development along the coastal floodplain.
Coastal erosion can occur as the result of rapid, short-term, daily, seasonal, or annual episodic events such as storm waves, storm surge, overwash, inland flooding, barrier island breach, rip currents, and undertow. Ice floes are natural factors that are unique to the Great Lakes shorelines.
Coastal erosion and shoreline change can be a function of multi-year impacts and long-term climatic changes. Long-term influences from natural factors include sea-or lake-level rise, sediment loss, subsidence, littoral transport losses, changes in sand-grain size distribution, natural inlets, inland flooding, and rip currents. Long-term human factors include shore protection structures, aquifer depletion, damming of rivers, sand mining, and destabilization of dunes.
Climatic trends can change a beach from naturally accreting to eroding due to increased episodic erosion events caused by waves from an above-average number of storms and high tides, or the long-term effects of fluctuations in sea or lake level.
Windstorm events can blow beach and dune sand over-land into adjacent low-lying marshes, upland habitats, inland bays, and communities. Flooding from extreme rainfall can scour and erode dunes as inland floodwaters return through the dunes and beachface into the ocean.
Navigation inlets can have a great impact on coastal processes. The typical shoreline response is erosion and recession along beaches that are downdrift of inlet jet-ties. Erosion is caused by the interruption of the littoral
transport and supply of sand to downdrift beaches. Dramatic inlet impacts can be seen at Ocean City, MD and St. Lucie, Martin County, FL.
In California, sand mining and damming of inland rivers with direct outlets at the coastline have reduced the sediment supply entering littoral transport cells along the shoreline. Without an adequate supply of sand, coastlines have no way of recovering the sand lost from nearshore beaches and upland dunes as a result of short-term episodic erosion events.
Shore protection structures such as seawalls and revetments often are built to attempt to stabilize the upland property. However, typically they eliminate natural wave runup and sand deposition processes and can increase reflected wave action and currents at the water-line. Increased wave action can cause localized scour in front of structures and prevent settlement of suspended sediment.
RISK ASSESSMENT
Two assessments of coastal erosion and risks of multiple coastal hazards in the eastern half of the United States have been conducted by the USGS and by the University of Virginia with the Coastal Engineering Research Center (CERC). The 1989 USGS report (Anders and others, 1989) used data from the UVA/CERC study to describe the specific influences of coastal erosion and accretion along the Gulf of Mexico and Atlantic Ocean shorelines. Historical data and measurements of average annual rates of shoreline change were used. A more recent coastal risk assessment was performed by the Oak Ridge National Laboratory (Gornitz and White, 1992; Daniels and others, 1992; Gornitz, White, and Daniels, 1994: and Gornitz, Daniels, White, and Birdwell, 1994).
The University of Virginia/CERC risk assessment included a coastal and modifying hazard factor for shoreline change. The shoreline change data used implicitly include the effects of sea-level rise in the analysis of change rates over specific periods of time.
Probability and Frequency
Coastal erosion is measured as the rate of change in the position or horizontal displacement of a shoreline over a specific period of record, measured in units of feet or meters per year. It is a quantitative assessment of aver-age annual change for a given beach cross-section or profile (square feet or square meters per year) or volumetric change for continuous segments of the shoreline (cubic feet or meters per year).
COASTAL EROSIONCOASTAL EROSION 163
Dune Crest
A. Berm
Profile A - Normal wave action M.H.W.
M.L.W.
B.
E r o s i o n M.H.W.
Profile B - Initial attack of storm waves M.L.W.
Accretion
Profile AC.
E r o s i o n M.H.W.
Profile C - Storm wave attack of foredune M.L.W. Crest
Lowering Crest Recession Accretion Profile A
D.
E r o s i o n M.H.W.
Profile D - After storm wave attack, normal wave action M.L.W.
Accretion Profile A
FIGURE 14-1.—Schematic diagram of storm wave attack on beach and dune.
Source: Skeggs and McDonald, 1991; Waterways Experimental Station, 1984
NATURAL HAZARDS: HYDROLOGIC HAZARDS164 NATURAL HAZARDS: HYDROLOGIC HAZARDS
TABLE 14-1.—Summary of natural factors affecting shoreline change
Factor Effect Time Scale Comments
Sediment supply (sources and sinks)
Sea level rise
Sea level change
Storm surge
Large wave height
Short wave period
Waves of small steepness
Alongshore currents
Rip currents
Underflow
Inlet presence
Overwash
Wind
Subsidence Compaction
Tectonic
Tectonic
Accretion/erosion
Erosion
Erosion (for increases in sea level)
Erosion
Erosion
Erosion
Accretion
Accretion, no change, or erosion
Erosion
Erosion
Net erosion; high instability
Erosional
Erosional
Erosion
Erosion/accretion
Erosion/accretion
Decades to millennia
Centuries to millennia
Months to years
Hours to days
Hours to months
Hours to months
Hours to months
Hours to millennia
Hours to months
Hours to days
Years to centuries
Hours to days
Hours to centuries
Years to millennia
Instantaneous
Centuries to millennia
Natural supply from inland (e.g., river floods, cliff erosion) or shoreface and inner shelf sources can contribute to shoreline stability or accretion
Relative sea level rise, including effects of land subsidence, is important
Causes poorly understood, interannual variations that may exceed 40 years of trend (e.g., El Niño)
Very critical to erosion magnitude
Individual storms or seasonal effects
Individual storms or seasonal effects
Summer conditions
Discontinuities (updrift „ downdrift) and nodal points
Narrow seaward-flowing currents that may transport significant quantities of sediment offshore
Seaward-flowing near bottom currents may transport significant quantities of sediment during coastal storms
Inlet-adjacent shorelines tend to be unstable because of fluctuations or migration in inlet position; net effect of inlets is erosional owing to sand storage in tidal shoals
High tides and waves cause sand transport over barrier beaches
Sand blown inland from beach
Natural or human-induced withdrawal of subsurface fluids
Earthquakes
Elevation or subsidence of plates
Source: National Academy of Science, 1990
COASTAL EROSION
Exposure
COASTAL EROSION 165
Erosion rates vary as a function of shoreline type and are influenced primarily by episodic events. Monitoring of shoreline change based on a relatively short period of record does not always reflect actual conditions and can misrepresent long-term erosion rates.
The return period for an episodic erosion event is directly related to the return period of coastal storm or tropical cyclones and other factors influencing coastal processes. The 1-percent-annual-chance erosion event can be determined using a predictive model that establishes the 1-percent-annual-chance tide and water surface level, or surge elevation and the resulting wave heights. Storm wave heights, periods, and directions have specific impacts on the tides, currents, and other erosion processes. Analyses of coastal erosion impacts from the 1-percent-annual-chance flood event are included in high-hazard zone determinations shown on NFIP maps. The impacts may vary for each reach of coastline.
A more significant measure of coastal erosion is the average annual erosion rate. Erosion rates can be used in land-use and hazard management to define areas in which development should be limited or where special construction measures should be used. The average annual erosion rate is based on analysis of historical shorelines derived from maps, charts, surveys, and aerial photography obtained over a period of record.
Beaches that are accreting, stable, or experiencing mild rates of erosion over a
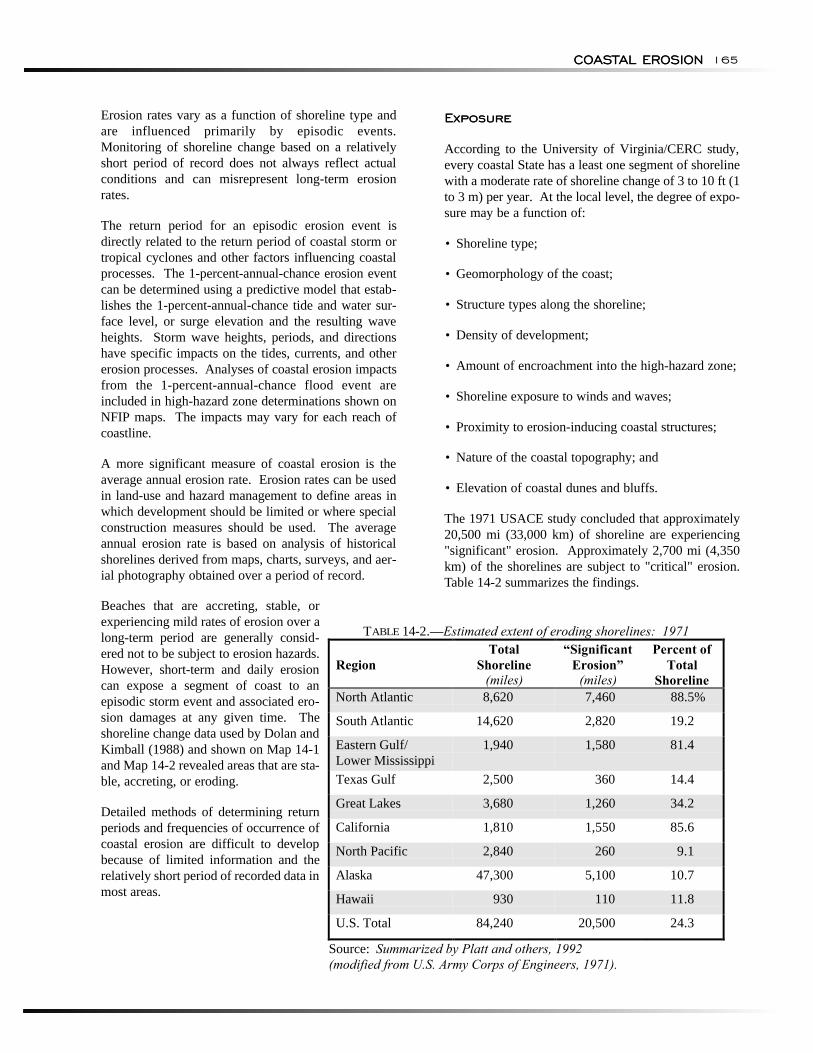
TABLE 14-2.—Estimated extent of eroding shorelines: 1971
Exposure
According to the University of Virginia/CERC study, every coastal State has a least one segment of shoreline with a moderate rate of shoreline change of 3 to 10 ft (1 to 3 m) per year. At the local level, the degree of expo-sure may be a function of:
• Shoreline type;
• Geomorphology of the coast;
• Structure types along the shoreline;
• Density of development;
• Amount of encroachment into the high-hazard zone;
• Shoreline exposure to winds and waves;
• Proximity to erosion-inducing coastal structures;
• Nature of the coastal topography; and
• Elevation of coastal dunes and bluffs.
The 1971 USACE study concluded that approximately 20,500 mi (33,000 km) of shoreline are experiencing "significant" erosion. Approximately 2,700 mi (4,350 km) of the shorelines are subject to "critical" erosion. Table 14-2 summarizes the findings.
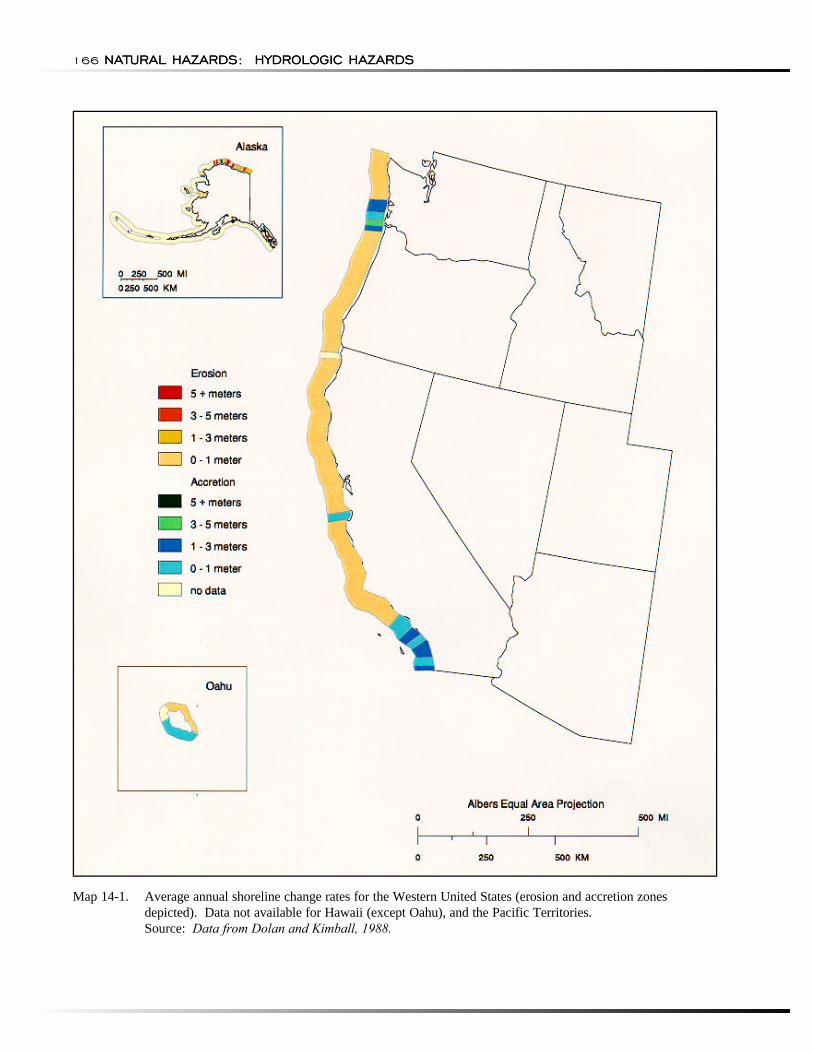
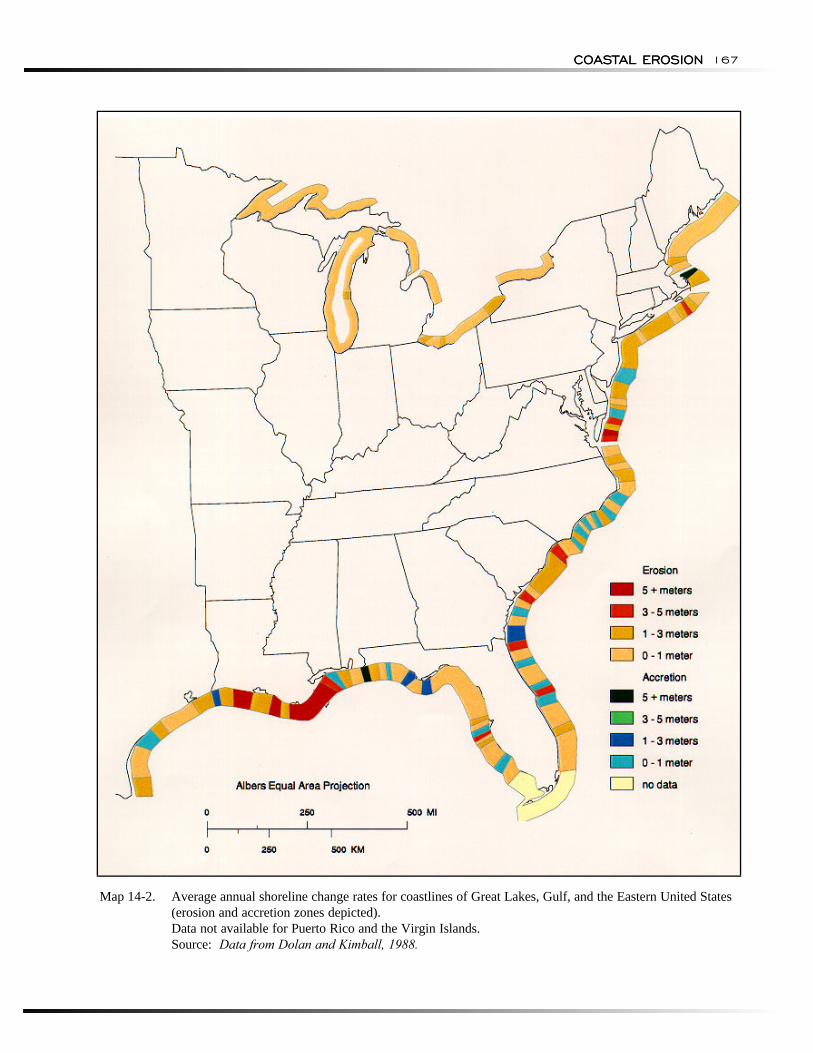
long-term period are generally considered not to be subject to erosion hazards. However, short-term and daily erosion can expose a segment of coast to an episodic storm event and associated erosion damages at any given time. The shoreline change data used by Dolan and Kimball (1988) and shown on Map 14-1 and Map 14-2 revealed areas that are stable, accreting, or eroding.
Detailed methods of determining return periods and frequencies of occurrence of coastal erosion are difficult to develop because of limited information and the relatively short period of recorded data in most areas.
Region Total
Shoreline (miles)
“Significant Erosion”
(miles)
Percent of Total
Shoreline North Atlantic 8,620 7,460 88.5%
South Atlantic 14,620 2,820 19.2
Eastern Gulf/ Lower Mississippi
1,940 1,580 81.4
Texas Gulf 2,500 360 14.4
Great Lakes 3,680 1,260 34.2
California 1,810 1,550 85.6
North Pacific 2,840 260 9.1
Alaska 47,300 5,100 10.7
Hawaii 930 110 11.8
U.S. Total 84,240 20,500 24.3
Source: Summarized by Platt and others, 1992 (modified from U.S. Army Corps of Engineers, 1971).
NATURAL HAZARDS: HYDROLOGIC HAZARDS166 NATURAL HAZARDS: HYDROLOGIC HAZARDS
Map 14-1. Average annual shoreline change rates for the Western United States (erosion and accretion zones depicted). Data not available for Hawaii (except Oahu), and the Pacific Territories. Source: Data from Dolan and Kimball, 1988.
COASTAL EROSIONCOASTAL EROSION 167
Map 14-2. Average annual shoreline change rates for coastlines of Great Lakes, Gulf, and the Eastern United States (erosion and accretion zones depicted). Data not available for Puerto Rico and the Virgin Islands. Source: Data from Dolan and Kimball, 1988.
Consequences
NATURAL HAZARDS: HYDROLOGIC HAZARDS168 NATURAL HAZARDS: HYDROLOGIC HAZARDS
Regional studies of shorelines experiencing erosion and negative rates of change have been conducted by various Federal, State, and local agencies and numerous universities. Recent studies show an increase in the percentage of shoreline experiencing problems. Increased awareness may be associated with increased development in many areas.
The Oak Ridge National Laboratory studies were per-formed for the Atlantic Coast (Gornitz and White, 1992), and the Gulf Coast (Gornitz, White and Daniels, 1994). Another Oak Ridge National Laboratory study (Daniels and others, 1992) addressed the issue of sea-level rise and specific regional impacts. In these studies, 13 variables were included in the coastal risk assessment database. Seven physical land and marine factors were subdivided to address distinct factors related to inundation and erosion potential. Six climatological factors addressed storm characteristics.
The shoreline erosion and accretion variables included in the Oak Ridge National Laboratory studies were derived from historical shoreline rates of change data obtained from the Coastal Erosion Information System (CEIS). CEIS was created from data collected by Dolan and Kimball (1988) and is accessible through the University of Virginia. Shorelines were evaluated based on mean shoreline displacement rates to deter-mine five relative risk factors. Displacement rates of plus or minus 3 ft (1 m) per year were considered stable and represent only a moderate risk. Segments with the highest risk have erosion rates greater than 7 ft (2.0 m) per year. Segments with the lowest risk have accretion rates of more than 7 ft (2.0 m) per year.
Because of the Pacific Ocean's rocky shorelines, cliffs and bluffs, and pocket beaches, many beach communities may be affected by beach erosion and shoreline retreat. Although the 1989 USGS report and mapping (Anders and others, 1989) concluded that the shorelines along the Pacific Ocean generally are stable or accreting, significant site-specific erosion takes place. Many localized areas, referred to as "hot spots," have been identified in California, Oregon, and Washington, and are subject to moderate-to-high risk.
Studies on risk and coastal hazards for California (Griggs and others, 1992), Oregon (Oregon Sea Grant, 1994 and 1992), and Washington (Canning and Shipman, 1995; Phipps, 1990) document erosion and accretion trends and erosion hazard area assessments. Coastal development and urban growth along the Pacific Ocean have increased since 1970, following a 30-year period of infrequent storm activity, and have resulted in placing a larger coastal population at risk.
In Hawaii and American Samoa, coastal erosion is experienced primarily along shorelines subject to the direct impacts of 20- to 30-ft (6- to 10-m) high waves, storm surge from tropical cyclones, and tsunami waves. Low-lying coastal developments, roads, and utilities commonly are damaged by episodic erosion, with long-term damage to water supply and agriculture from salinization due to aggravated flooding.
Consequences
Coastal erosion has been a factor in more than 25 Federal disaster declarations during the past 20 years. In addition, 76 hurricanes, tropical storms, and typhoons may have indirectly included damage from coastal erosion as an influencing factor.
While generally not an imminent threat to public safety, coastal erosion destroys buildings, roads, and infrastructure. Damage often results from the combination of an episodic event with severe storm waves and dune or bluff erosion. In some areas, the loss of buildings can be directly linked to the long-term impact of shore-line or bluff recession.
Three large events are notable for widespread erosion damage: the Ash Wednesday Nor'easter of 1962; the Halloween storm of 1991 (NOAA, 1992); and the Superstorm of March 1993 (NOAA, 1994). The Ash Wednesday storm resulted in above-normal tide levels over four astronomical tide cycles. It removed 30 per-cent of the sand from beaches and dunes, and lowered the dune crest by almost 5 ft (1.5 m) in Virginia Beach, VA (Coch, 1995).
Widespread and damaging effects of short- and long-term erosion have had the greatest impact on heavily developed coastal communities in southern California, Texas, Florida, South Carolina, North Carolina, Michigan, Maryland, New Jersey, and New York. Loss of coastal barriers along Louisiana's coastline aggravates saltwater intrusion into wetlands and marshes. In the Great Lakes States, the greatest impact on dune and bluff erosion is attributed directly to changes in lake levels and severe waves.
Along the Gulf of Mexico and Atlantic Ocean coast-lines, intense winter low pressure storm systems can cause extremely high tides that persist over several astronomical tide cycles. They often are accompanied by large wind-driven waves and strong currents that erode and overwash coastal dunes. Although the effects are experienced all along the shoreline, the North Atlantic coast from Cape Haterras, NC to Maine has been most affectedby winter storms.
RESEARCH, DATA COLLECTION, ANDMONITORING ACTIVITIES
MITIGATION APPROACHES
COASTAL EROSIONCOASTAL EROSION 169
In California, Oregon, Washington, Alaska, and Hawaii, coastal storms associated with extratropical cyclones and winter low pressure systems can cause extensive coastal erosion. Erosion during the winter of 1982–83 caused by high tides and waves caused beach erosion, cliff failure, collapse of shore protection structures, and extensive property damage along a 600-mi (965-km) segment from San Diego to San Francisco (Dean and others, 1984).
In the Hawaiian Islands, the limited sediment supply is the primary factor influencing shoreline change. Problems occur primarily along isolated pocket beaches and commercial developments in tourist resort areas, with most of the remaining shoreline protected by rocky headlands.
In Alaska, the coastal erosion that does occur is not a significant hazard because development is limited. In the U.S. territories of the western Pacific Ocean, most islands are protected by surrounding coral reefs. However, short-term impacts result from storm surges and waves from tropical cyclones.
RESEARCH, DATA COLLECTION, AND MONITORING ACTIVITIES
Assessments of shoreline change are currently under-way by many Federal, State, and local agencies using historical aerial photography and bathymetric and topographic maps. The position of shorelines is measured for positive and negative changes over known periods of record.
The Coastal Erosion Information System (CEIS) was created from data collected by Dolan and Kimball (1988). Accessible through the University of Virginia, it is a computerized database of shoreline rates of change for various geographic regions of the United States. CEIS data are used to compute average annual erosion rates for 165-ft (50-m) segments of shoreline. Many reaches are located adjacent to inlet jetties or major shore protection projects, which can influence the erosion trend data. However, these sites generally are isolated enough not to affect regional assessments.
The National Research Council documented coastal erosion hazards in a 1990 report (NRC, 1990). The report concluded that coastal erosion affects a large geographic area of the United States and has a high risk and exposure not adequately accounted for in coastal zone management programs and the National Flood Insurance Program.
The USACE CERC offices at Vicksburg, MS, and Duck, NC, are the primary centers for Federal research, data collection, and monitoring. The USGS study of coastal hazards is being updated to include assessments of shoreline change in the Great Lakes region. The USACE district office at Fort Shafter in Hawaii con-ducts research for the Hawaiian Islands and Pacific territories.
In response to the requirements of the National Flood Insurance Reform Act of 1994, FEMA is evaluating erosion hazards. The initial phase of the effort involves determining long-term erosion rates in representative coastal communities and preparing hazard maps. Subsequent phases will involve preparing an inventory of structures within mapped erosion hazard areas and an economic impact analysis of erosion and erosion hazard mapping on communities and the NFIP.
Individual State coastal zone management programs monitor, collect, and analyze shoreline change data to determine short- and long-term erosion rates. Universities are involved in research activities related to coastal erosion in the continental United States. Research on beach erosion processes, shoreline change rates, and development of numerical predictive erosion models is underway in at least one major university in each coastal State.
MITIGATION APPROACHES
Natural recovery from coastal erosion may take place over long periods of time. If dunes and beaches do not recover quickly by natural processes, property may be exposed to further damage in subsequent events. In some cases, costly artificial recovery mechanisms have been employed, including beach nourishment and dune restoration in attempts to restore the shore protection capacity of the natural beach and dune system.
Erosion trends may be modified by supplementing or mitigating interruptions in coastal processes. Beach nourishment is used to increase the amount of sand, to adjust the shoreline profile, to replenish depleted sand supplies and, through littoral transport processes, to supply sediment to downdrift shorelines.
Relocation of utility lines, water mains, sewer lines, and roadways in the immediate area of severe erosion may avoid or delay future damage. Evacuation of residents in high hazard areas prior to major storm events has proven successful in limiting injuries and deaths attributed to episodic erosion.
RECOMMENDATIONS
BIBLIOGRAPHY AND REFERENCES
NATURAL HAZARDS: HYDROLOGIC HAZARDS170 NATURAL HAZARDS: HYDROLOGIC HAZARDS
RECOMMENDATIONS
Numerous recommendations on research needs, land-use policies, regulatory programs, and mitigation of coastal erosion hazards can be found in several publications: 1990 NRC report; the 1994 Journal of Coastal Research, Special Issue No. 12; an Oregon State University publication (Oregon Sea Grant, 1994); and reports published by the Washington Department of Ecology (Phipps, 1978 and 1990; Canning and Shipman, 1995), the University of California (Griggs and others, 1992), and the University of Colorado (Platt and others, 1992).
BIBLIOGRAPHY AND REFERENCES
Anders, F., S. Kimball, and R. Dolan. 1989. Coastal Hazards: National Atlas of the United States. Map. U.S. Geological Survey.
Canning, D.J., and H. Shipman. 1995. Coastal Erosion Management Studies in Puget Sound, Washington: Executive Summary. Vol. 1. Report 94-74. Olympia, WA: Washington Department of Ecology, Shorelands Water Resources Program.
Coch, N.K. 1995. GEOHAZARDS: Natural and Human. Upper Saddle River, NJ: Prentice Hall.
Daniels, R.C., V.N. Gornitz, A.J. Mehta, S.C. Lee, and R.M. Cushman. 1992. Adapting to Sea-Level Rise in the U.S. Southeast: The Influence of Built Infrastructure and Biophysical. Oak Ridge National Laboratory, Environmental Sciences Division, Publication No. 3915. Oak Ridge, TN.
Dean, R.G., G.A. Armstrong, and N. Sitar. 1984. California Coastal Erosion and Storm Damage the Winter of 1982-83. National Research Council, Committee on Natural Disasters, Commission on Engineering and Technical Systems. Washington, DC.
Dolan, R., and S. Kimball. 1988. Coastal Erosion and Accretion: National Atlas of the United States. U.S. Geological Survey.
Federal Emergency Management Agency, Federal Insurance Administration. 1991. Projected Impact of Relative Sea Level Rise on the National Flood Insurance Program. Washington, DC.
Federal Emergency Management Agency, Federal Insurance Administration. 1994. Mitigation of Flood and Erosion Damage to Residential Buildings in Coastal Areas. Washington, DC.
Federal Emergency Management Agency, Office of Emergency Management. 1993. Principal Threats Facing Communities and Local Emergency Management Coordinators, A Report to the United States Senate Committee on Appropriations. Washington, DC: U.S. Government Printing Office.
Federal Emergency Management Agency, Federal Insurance Administration, Office of Risk Assessment. 1989. Erosion Rate Data Study Plan. Washington, DC.
Finkl, C.W., Jr. (Ed.). 1994. Journal of Coastal Research Special Issue No. 12. Coastal Hazards: Perception, Susceptibility and Mitigation. The Coastal Education and Research Foundation, Inc.
Gornitz, V.N., R.C. Daniels, T.W. White, and K.R. Birdwell. 1994. "The Development of a Coastal Risk Assessment Database: Vulnerability to Sea-Level Rise in the U.S. Southeast." Journal of Coastal Research, Special Issue No. 12. pp. 327-338.
Gornitz, V.M., T.W. White, and R.C. Daniels (ed.). 1994. A Coastal Hazards Database for the U.S. Gulf Coast. Oak Ridge National Laboratory, Environmental Sciences Division, Publication No. 4101. Oak Ridge, TN.
Gornitz, V.M., and T.W. White. 1992. A Coastal Hazards Database for the U.S. East Coast. Oak Ridge National Laboratory, Environmental Sciences Division, Publication No. 3913. Oak Ridge, TN.
Griggs, G.B., J.E. Pepper, and M.E. Jordan. 1992. California's Coastal Hazards: A Critical Assessment of Existing Land-Use Policies and Practices. California Policy Seminar Research Report. Santa Cruz, CA: University of California.
National Academy of Sciences. 1990. Managing Coastal Erosion. Washington, DC: National Academy Press.
National Oceanic and Atmospheric Administration, National Weather Service. 1992. Natural Disaster Survey Report: The Halloween Nor'easter of 1991 East Coast of the United States...Maine to Florida and Puerto Rico - October 28 to November 1, 1991. Washington, DC.
National Oceanic and Atmospheric Administration, National Weather Service. 1994. Natural Disaster Survey Report: Superstorm of March 1993, March 12-14, 1993. Washington, DC.
COASTAL EROSIONCOASTAL EROSION 171
Oregon Sea Grant. 1994. Improving Natural Hazards Management on the Oregon Coast: Recommendations of the Coastal Natural Hazards Policy Working Group. Report No. ORESU-T-94-002. Corvallis, OR: Oregon State University.
Palm, R.I., and M.E. Hodgson. 1993. Natural Hazards in Puerto Rico: Attitudes, Experience, and Behavior of Homeowners. Program on Environment and Behavior, Monograph No. 55. Boulder, CO: Institute of Behavioral Science, University of Colorado.
Phipps, J.B. April 1990. Coastal Accretion and Erosion in Southwest Washington: 1977-1987. Report 90-21. Olympia, WA: Washington Department of Ecology, Shorelands and Coastal Zone Management Program.
Phipps, J.B., and J.M. Smoth. 1978. Coastal Accretion and Erosion in Southwest Washington. Report 78-12. Aberdeen, WA: Grays Harbor College.
Platt, R.H., H.C. Miller, T. Beatley, J. Melville, and B.G. Mathenia. 1992. Coastal Erosion: Has Retreat Sounded? Program on Environment and Behavior, Monograph No. 53. Boulder, CO: Institute of Behavioral Science, University of Colorado.
Skaggs, L.L., and F.L. McDonald. 1991. National Economic Development Procedures Manual: Coastal Storm Damage and Erosion. U.S. Army Corps of Engineers, Water Resources Support Center, Institute for Water Resources. Ft. Belvoir, VA.
U.S. Army Corps of Engineers. 1971. Report on the National Shoreline Study. Washington, DC.

CHAPTERCHAPTER
15
DROUGHTSDROUGHTS
NATURAL HAZARDS:
Chapter Summary
HYDROLOGIC HAZARDS174 NATURAL HAZARDS: HYDROLOGIC HAZARDS
Chapter Summary
Drought is a normal part of virtually all climates. It is caused by a deficiency of precipitation and can be aggravated by other factors such as high tem
peratures, high winds, and low relative humidity. The severity of a drought depends not only on its duration, intensity, and geographic extent, but also on the regional water supply demands made by human activities and vegetation. This multi-dimensional nature makes it difficult to define a drought and to perform comprehensive risk assessments.
Drought, which is defined as a water shortage caused by a deficiency of rainfall, differs from other natural hazards in three significant ways. First, a drought's onset and end are difficult to determine since the effects accumulate slowly and may linger even after the apparent termination of an episode. Second, the absence of a precise and universally accepted definition adds to the confusion about whether a drought exists, and if it does, the degree of severity. Third, unlike most other natural hazards, drought impacts are less obvious and are spread over a larger geographic area. These characteristics have hindered the development of accurate, reliable, and timely estimates of drought severity and effects and, ultimately, the formulation of drought contingency plans by many governments (Wilhite, 1993).
During severe droughts, agricultural crops do not mature, wildlife and livestock are undernourished, land values decline, and unemployment increases. Droughts can cause a shortage of water for human and industrial consumption, hydroelectric power, recreation, and navigation. Water quality may decline and the number and severity of wild-fires may increase.
Nine notable droughts have occurred during the 20th century in the United States. Damage estimates are not avail-able for most, however, estimates indicate that the 1976–77 drought in the Great Plains, Upper Midwest, and far Western States caused direct losses of $10–$15 billion. The 1987–89 drought in the Central and Eastern States cost $39 billion.
Historically, many States have relied upon the Federal Government to provide relief to drought victims. Since the mid-1970s, most States have taken a more active role and drought contingency plans are now in place in at least 27 States. A variety of mitigation actions have been adopted.
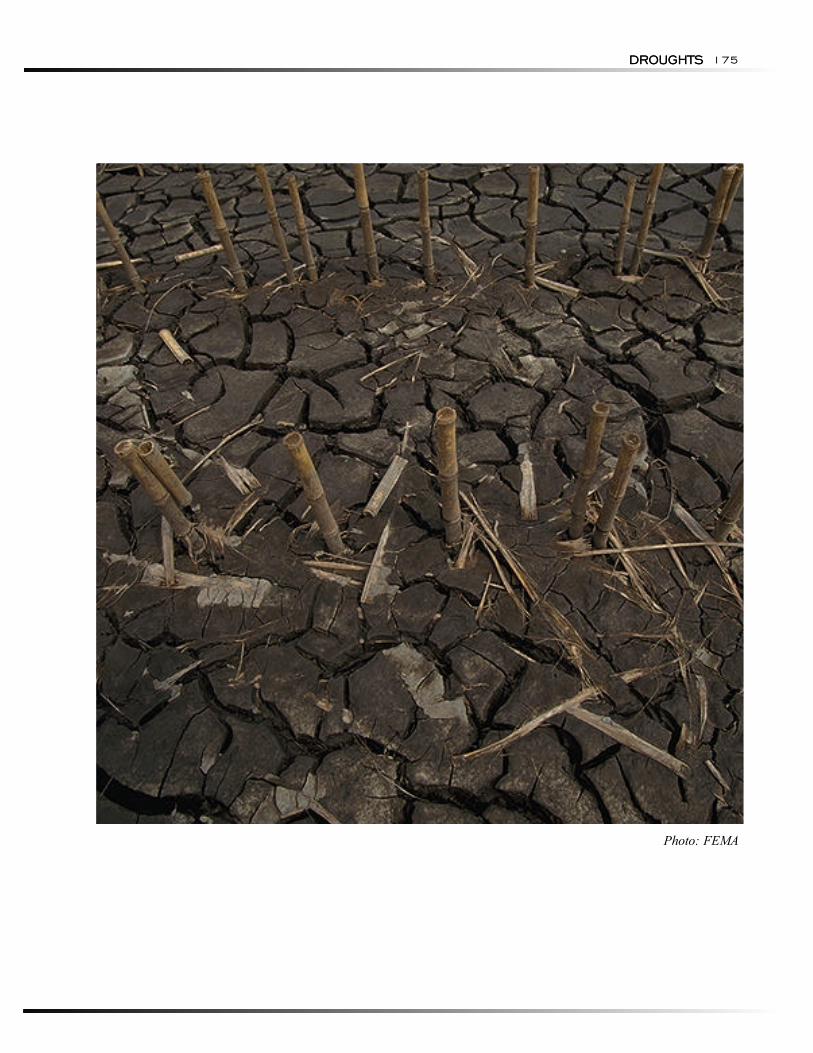
DROUGHTSDROUGHTS 175
Photo: FEMA
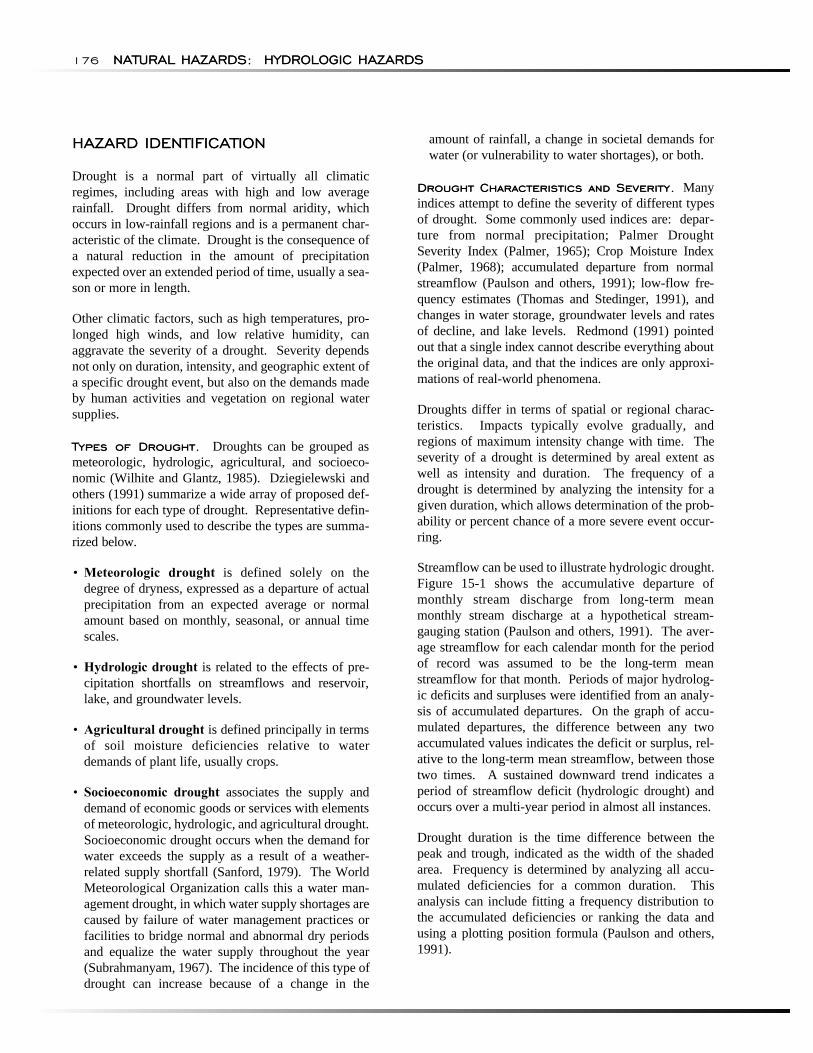
NATURAL HAZARDS:
HAZARD IDENTIFICATION
Types of Drought.
Drought Characteristics and Severity.
HYDROLOGIC HAZARDS176 NATURAL HAZARDS: HYDROLOGIC HAZARDS
HAZARD IDENTIFICATION
Drought is a normal part of virtually all climatic regimes, including areas with high and low average rainfall. Drought differs from normal aridity, which occurs in low-rainfall regions and is a permanent characteristic of the climate. Drought is the consequence of a natural reduction in the amount of precipitation expected over an extended period of time, usually a sea-son or more in length.
Other climatic factors, such as high temperatures, pro-longed high winds, and low relative humidity, can aggravate the severity of a drought. Severity depends not only on duration, intensity, and geographic extent of a specific drought event, but also on the demands made by human activities and vegetation on regional water supplies.
Types of Drought. Droughts can be grouped as meteorologic, hydrologic, agricultural, and socioeconomic (Wilhite and Glantz, 1985). Dziegielewski and others (1991) summarize a wide array of proposed definitions for each type of drought. Representative definitions commonly used to describe the types are summarized below.
• Meteorologic drought is defined solely on the degree of dryness, expressed as a departure of actual precipitation from an expected average or normal amount based on monthly, seasonal, or annual time scales.
• Hydrologic drought is related to the effects of precipitation shortfalls on streamflows and reservoir, lake, and groundwater levels.
• Agricultural drought is defined principally in terms of soil moisture deficiencies relative to water demands of plant life, usually crops.
• Socioeconomic drought associates the supply and demand of economic goods or services with elements of meteorologic, hydrologic, and agricultural drought. Socioeconomic drought occurs when the demand for water exceeds the supply as a result of a weather-related supply shortfall (Sanford, 1979). The World Meteorological Organization calls this a water management drought, in which water supply shortages are caused by failure of water management practices or facilities to bridge normal and abnormal dry periods and equalize the water supply throughout the year (Subrahmanyam, 1967). The incidence of this type of drought can increase because of a change in the
amount of rainfall, a change in societal demands for water (or vulnerability to water shortages), or both.
Drought Characteristics and Severity. Many indices attempt to define the severity of different types of drought. Some commonly used indices are: departure from normal precipitation; Palmer Drought Severity Index (Palmer, 1965); Crop Moisture Index (Palmer, 1968); accumulated departure from normal streamflow (Paulson and others, 1991); low-flow frequency estimates (Thomas and Stedinger, 1991), and changes in water storage, groundwater levels and rates of decline, and lake levels. Redmond (1991) pointed out that a single index cannot describe everything about the original data, and that the indices are only approximations of real-world phenomena.
Droughts differ in terms of spatial or regional characteristics. Impacts typically evolve gradually, and regions of maximum intensity change with time. The severity of a drought is determined by areal extent as well as intensity and duration. The frequency of a drought is determined by analyzing the intensity for a given duration, which allows determination of the probability or percent chance of a more severe event occur-ring.
Streamflow can be used to illustrate hydrologic drought. Figure 15-1 shows the accumulative departure of monthly stream discharge from long-term mean monthly stream discharge at a hypothetical stream-gauging station (Paulson and others, 1991). The aver-age streamflow for each calendar month for the period of record was assumed to be the long-term mean streamflow for that month. Periods of major hydrologic deficits and surpluses were identified from an analysis of accumulated departures. On the graph of accumulated departures, the difference between any two accumulated values indicates the deficit or surplus, relative to the long-term mean streamflow, between those two times. A sustained downward trend indicates a period of streamflow deficit (hydrologic drought) and occurs over a multi-year period in almost all instances.
Drought duration is the time difference between the peak and trough, indicated as the width of the shaded area. Frequency is determined by analyzing all accumulated deficiencies for a common duration. This analysis can include fitting a frequency distribution to the accumulated deficiencies or ranking the data and using a plotting position formula (Paulson and others, 1991).
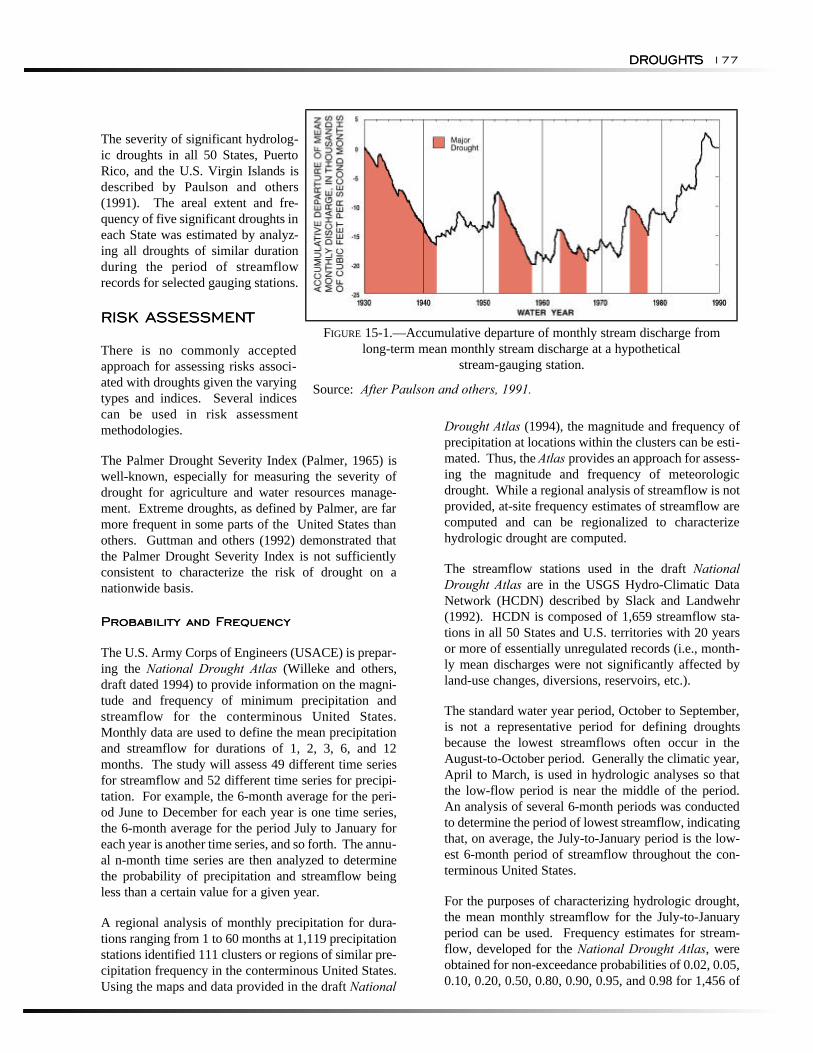
DROUGHTS
RISK ASSESSMENT
Probability and Frequency
DROUGHTS 177
The severity of significant hydrologic droughts in all 50 States, Puerto Rico, and the U.S. Virgin Islands is described by Paulson and others (1991). The areal extent and frequency of five significant droughts in each State was estimated by analyzing all droughts of similar duration during the period of streamflow records for selected gauging stations.
RISK ASSESSMENT FIGURE 15-1.—Accumulative departure of monthly stream discharge from
There is no commonly accepted long-term mean monthly stream discharge at a hypothetical approach for assessing risks associ- stream-gauging station. ated with droughts given the varying Source: After Paulson and others, 1991.types and indices. Several indices can be used in risk assessment methodologies.
The Palmer Drought Severity Index (Palmer, 1965) is well-known, especially for measuring the severity of drought for agriculture and water resources management. Extreme droughts, as defined by Palmer, are far more frequent in some parts of the United States than others. Guttman and others (1992) demonstrated that the Palmer Drought Severity Index is not sufficiently consistent to characterize the risk of drought on a nationwide basis.
Probability and Frequency
The U.S. Army Corps of Engineers (USACE) is preparing the National Drought Atlas (Willeke and others, draft dated 1994) to provide information on the magnitude and frequency of minimum precipitation and streamflow for the conterminous United States. Monthly data are used to define the mean precipitation and streamflow for durations of 1, 2, 3, 6, and 12 months. The study will assess 49 different time series for streamflow and 52 different time series for precipitation. For example, the 6-month average for the period June to December for each year is one time series, the 6-month average for the period July to January for each year is another time series, and so forth. The annual n-month time series are then analyzed to determine the probability of precipitation and streamflow being less than a certain value for a given year.
A regional analysis of monthly precipitation for durations ranging from 1 to 60 months at 1,119 precipitation stations identified 111 clusters or regions of similar precipitation frequency in the conterminous United States. Using the maps and data provided in the draft National
Drought Atlas (1994), the magnitude and frequency of precipitation at locations within the clusters can be estimated. Thus, the Atlas provides an approach for assessing the magnitude and frequency of meteorologic drought. While a regional analysis of streamflow is not provided, at-site frequency estimates of streamflow are computed and can be regionalized to characterize hydrologic drought are computed.
The streamflow stations used in the draft National Drought Atlas are in the USGS Hydro-Climatic Data Network (HCDN) described by Slack and Landwehr (1992). HCDN is composed of 1,659 streamflow stations in all 50 States and U.S. territories with 20 years or more of essentially unregulated records (i.e., monthly mean discharges were not significantly affected by land-use changes, diversions, reservoirs, etc.).
The standard water year period, October to September, is not a representative period for defining droughts because the lowest streamflows often occur in the August-to-October period. Generally the climatic year, April to March, is used in hydrologic analyses so that the low-flow period is near the middle of the period. An analysis of several 6-month periods was conducted to determine the period of lowest streamflow, indicating that, on average, the July-to-January period is the lowest 6-month period of streamflow throughout the conterminous United States.
For the purposes of characterizing hydrologic drought, the mean monthly streamflow for the July-to-January period can be used. Frequency estimates for stream-flow, developed for the National Drought Atlas, were obtained for non-exceedance probabilities of 0.02, 0.05, 0.10, 0.20, 0.50, 0.80, 0.90, 0.95, and 0.98 for 1,456 of
NATURAL HAZARDS:
Exposure
Consequences
HYDROLOGIC HAZARDS178 NATURAL HAZARDS: HYDROLOGIC HAZARDS
the stations in the HCDN. The frequency analysis of streamflow used a five-parameter Wakeby frequency distribution (Landwehr and others, 1979) fit to the various annual n-month time series. The five-parameter distribution was chosen because of the flexibility in fitting various types of hydrologic data. The parameters of the Wakeby distribution were determined using L-moments (Hosking, 1990).
Map 15-1, which shows regional trends, was constructed by determining the July-to-January mean streamflow with non-exceedance probabilities of 0.05 divided by the drainage area of the watershed to obtain cubic feet per second per square mile (cfsm.05). These values were plotted and areas of equal cfsm.05 were deter-mined.
The July-to-January mean monthly flow with nonexceedance probability of 0.05 was selected as the variable characterize hydrologic drought. It has a 5-percent-chance of not being exceeded in any given year. Stated another way, the July-to-January mean monthly streamflow will be less than this value, on average, once in 20 years.
The 20-year low flow was chosen for illustrating the spatial characteristics of a hydrologic drought because, as stated by Riggs (1972), this is usually the most extreme value used in low-flow analyses. There is no commonly accepted return period or non-exceedance probability for defining the risk from hydrologic droughts that is analogous to the 100-year or 1-percent-annual-chance flood.
Exposure
An ample water supply is critical to the economic well being of the United States. During droughts, crops do not mature, wildlife and livestock are undernourished, land values decrease, and unemployment increases. Adverse consequences occur because of deficiencies in the following:
• Public and rural water supplies for human and live-stock consumption;
• Natural soil water or irrigation water for agriculture;
• Water for hydroelectric power;
• Water for forests;
• Water quality;
• Water for recreation; and
• Water for navigation.
People throughout the United States, in high- and low-rainfall areas, may be subject to drought. The hydro-logic index of drought presented in Map 15-1 illustrates the variability in streamflow, and hence the availability of surface water supplies. Other indices of hydrologic drought could have been used, such as groundwater levels, reservoir volumes, or water levels.
The geographic variations of the July-to-January mean streamflow shown on Map 15-1 also illustrate the influence of factors such as precipitation, elevation, and evapotranspiration. The highest cfsm.05 values are in the Pacific Northwest, where mean annual precipitation exceeds 100 in (254 cm) and evapotranspiration is low. Likewise, in the Northeastern United States runoff is high because of high rainfall and low evapotranspiration. High cfsm.05 values also occur in the Gulf Coast States, where precipitation is high.
Consequences
Damage estimates are not available for most of the notable droughts that occurred in the United States during the 20th century:
1924-1934 California
1930-1940 Midwest (Dust Bowl)
1942-1956 Southwest
1952-1956 Midcontinent and Southeast
1961-1967 Northeastern States
1976-1977 Great Plains, Upper Midwest, and Western States
1980-1981 Central and Eastern States
1987-1989 Central and Eastern States
1987-1992 California and Upper Great Plains
Riebsame and others (1990) estimated that the 1976-77 drought caused total direct losses of $10-$15 billion. The California Department of Water Resources (California DWR, 1978) estimated losses of $2.7 billion in California alone. Riebsame and others (1990) and Dunbar and others (1995) estimated losses from the 1987-89 drought at $39 billion, including agricultural losses, river transportation disruption, economic impacts, water supply problems, and wildfires.
Generally speaking, States have relied on the Federal Government to provide relief to drought victims when water shortages reach near-disaster proportions
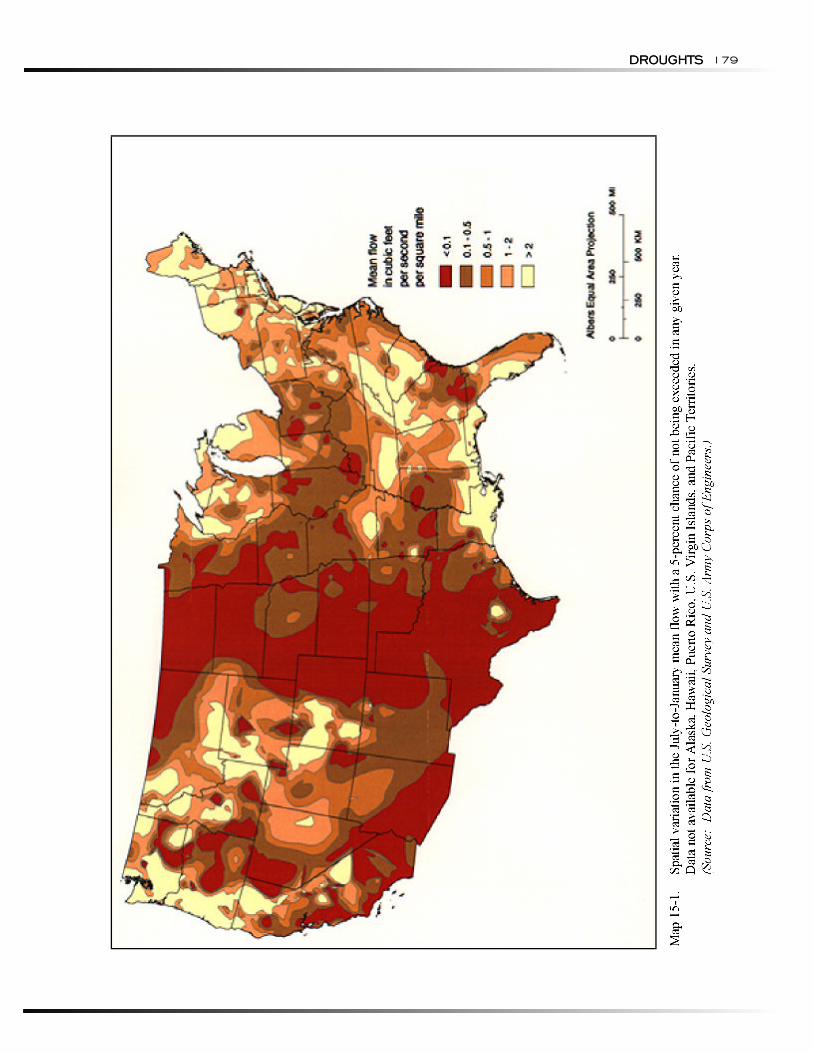
DROUGHTSDROUGHTS 179
NATURAL HAZARDS:
RESEARCH, DATA COLLECTION, ANDMONITORING ACTIVITIES
MITIGATION APPROACHES
HYDROLOGIC HAZARDS180 NATURAL HAZARDS: HYDROLOGIC HAZARDS
(Wilhite, 1993). Forty separate drought relief programs administered by 16 Federal agencies provided nearly $8 billion in relief as a result of the series of drought years during the mid-1970s (Wilhite and others, 1986). Federal assistance efforts totaled more than $5 billion in response to the 1987-89 drought (Riebsame and others, 1990).
RESEARCH, DATA COLLECTION, AND MONITORING ACTIVITIES
Since 1989, the USACE Institute for Water Resources in Fort Belvoir, VA, has conducted the National Study of Water Management During Drought. The National Drought Atlas is a part of the study. There is interest and involvement from the States and other Federal agencies.
In addition to preparation of the National Drought Atlas, USACE is conducting several regional drought preparedness studies using a common method. They encompass emergency, tactical, and strategic planning, and are oriented to customer needs rather than agency mission (USACE IWR, 1991). Brumbaugh and others (1994) provide a listing of all reports published or being prepared under the National Study of Water Management During Drought. Reports address such topics as the purposes of USACE reservoirs and their susceptibility to drought, assessment of what is known about drought, lessons learned from the 1987-92 California drought, and computer models for water resources planning and management.
USGS is the primary Federal agency that collects and analyses streamflow data, while NWS is the primary agency that collects and publishes precipitation data. Many State and local agencies, and commercial and industrial users, rely on the USGS and NWS information for water resources planning and management decisions.
More than 600 Federal, State, and local agencies pro-vide funding for the USGS stream-gaging program. In 1994, USGS operated approximately 7,300 stream-gaging stations in the 50 States, Puerto Rico, the U.S. Virgin Islands, and the Pacific territories (Wahl and others, 1995). In addition, measurements are made during low-flow periods at several hundred partial-record sites throughout the United States in order to better define the areal extent and severity of droughts. Thomas and Stedinger (1991) describe procedures for estimating low-flow characteristics at stream-gaging stations and partial-record sites that can be used in drought assessments.
In addition to streamflow data, USGS collects data on water quality, reservoir levels and contents, and ground-water levels for each State. These data are published annually in reports entitled Water Resources Data [State Name], Water Year [XXXX].
NWS publishes precipitation data from approximately 9,100 non-recording and 2,100 recording stations in the United States. These data are published monthly, by State, in reports entitled Climatological Data and Hourly Precipitation Data.
MITIGATION APPROACHES
Wilhite (1993) suggests the greatest potential for raising the level of drought preparedness, and thereby reducing losses from droughts, is through leadership by State agencies. Historically, States have played a relatively passive role in efforts to assess and respond to drought. During the widespread 1976-77 event, for example, no State had prepared a formal drought response strategy. By 1982, only three States had plans: South Dakota, New York, and Colorado.
Increasing awareness of inefficient past responses, calls for action, and the impacts of droughts of the late 1980s have generated considerable momentum at the State level for the establishment of contingency plans. By 1992, 27 States (Map 15-2) had developed and implemented formal drought contingency plans, and three more had expressed interest (Wilhite, 1993).
An examination of existing State drought plans reveals that they have certain key elements in common (Wilhite, 1991). Administratively, a task force is responsible for the operation of the system and is directly accountable to the Governor. The task force keeps the Governor advised of water availability and potential problem areas, and recommends policy options for consideration. Operationally, most drought plans have three common features (Wilhite, 1993):
• A water availability committee continuously monitors water conditions and prepares outlooks a month or season in advance;
• A formal mechanism usually exists to assess the potential impact of water shortages on the most important economic sectors; and
• A committee or task force considers current and potential impacts and recommends response options to the Governor.
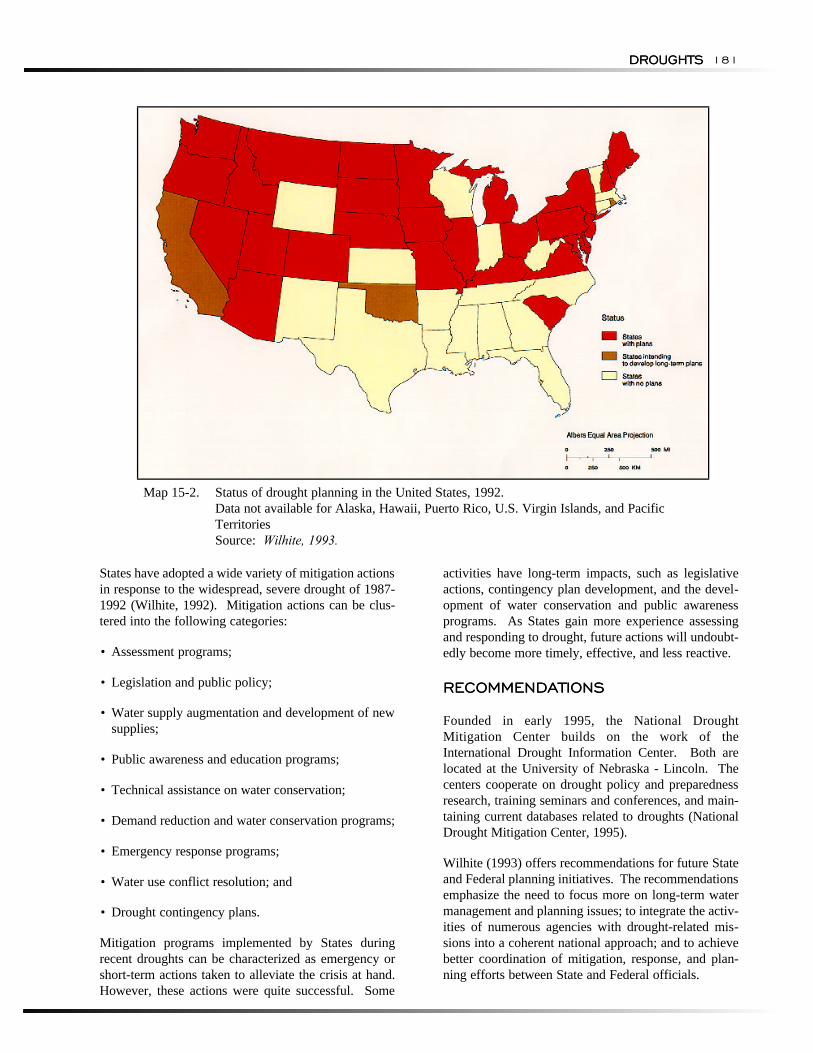
DROUGHTS
RECOMMENDATIONS
DROUGHTS 181
Map 15-2. Status of drought planning in the United States, 1992. Data not available for Alaska, Hawaii, Puerto Rico, U.S. Virgin Islands, and Pacific Territories Source: Wilhite, 1993.
States have adopted a wide variety of mitigation actions in response to the widespread, severe drought of 1987-1992 (Wilhite, 1992). Mitigation actions can be clustered into the following categories:
• Assessment programs;
• Legislation and public policy;
• Water supply augmentation and development of new supplies;
• Public awareness and education programs;
• Technical assistance on water conservation;
• Demand reduction and water conservation programs;
• Emergency response programs;
• Water use conflict resolution; and
• Drought contingency plans.
Mitigation programs implemented by States during recent droughts can be characterized as emergency or short-term actions taken to alleviate the crisis at hand. However, these actions were quite successful. Some
activities have long-term impacts, such as legislative actions, contingency plan development, and the development of water conservation and public awareness programs. As States gain more experience assessing and responding to drought, future actions will undoubtedly become more timely, effective, and less reactive.
RECOMMENDATIONS
Founded in early 1995, the National Drought Mitigation Center builds on the work of the International Drought Information Center. Both are located at the University of Nebraska - Lincoln. The centers cooperate on drought policy and preparedness research, training seminars and conferences, and maintaining current databases related to droughts (National Drought Mitigation Center, 1995).
Wilhite (1993) offers recommendations for future State and Federal planning initiatives. The recommendations emphasize the need to focus more on long-term water management and planning issues; to integrate the activities of numerous agencies with drought-related missions into a coherent national approach; and to achieve better coordination of mitigation, response, and planning efforts between State and Federal officials.
NATURAL HAZARDS:
BIBLIOGRAPHY AND REFERENCES
HYDROLOGIC HAZARDS182 NATURAL HAZARDS: HYDROLOGIC HAZARDS
Dziegielewski and others (1991) offer general research recommendations for development of an analytical framework for prioritizing all major uses of water. They recommend practical guidelines for measuring the economic value of water in alternative uses, and objective methods for quantifying non-market impacts of drought on those uses. Determining the social and environmental effects of restricting or temporarily eliminating certain uses of water during drought is advocated.
The proceedings of the National Science Foundation workshop on "Drought Research into the 3rd Millennium: Assessment of Scientific Knowledge, Monitoring, and Forecasting" contain many worthwhile recommendations on drought research and assessment in three areas: monitoring and assessment, descriptive studies and modeling, and forecasting (Haimes and Quarles, 1990).
BIBLIOGRAPHY AND REFERENCES
Brumbaugh, R., W. Werick, W. Teitz, and J. Lund. 1994. Executive Summary of Lessons Learned from the California Drought (1987-1992). U.S. Army Corps of Engineers. Institute for Water Resources Report No. 94-NDS-6.
California Department of Water Resources. 1978. The 1976–77 California Drought: A Review. Sacramento, CA.
Dunbar, P.K., S.C. Dane, and Park Kilho. 1995. Natural Hazards Data and Information in the United States. National Oceanic and Atmospheric Administration, National Geophysical Data Center, and the Geological Survey of Japan. Report No. 281, pp. 57-84.
Dziegielewski, B., G.D. Lynne, D.A. Wilhite, and D.P. Sheer. 1991. National Study of Water Management During Drought: A Research Assessment. U.S. Army Corps of Engineers. Institute for Water Resources Report No. 91-NDS-3.
Guttman, N.B., J.R. Wallis, and J.R.M. Hosking. December 1992. "Spatial Comparability of the Palmer Drought Severity Index." Water Resources Bulletin. Vol. 28, No. 6, pp. 1111-1119.
Haimes, Y.Y., and L.R. Quarles (Eds). 1990. Drought Research into the 3rd Millennium: Assessment of Scientific Knowledge, Monitoring and Forecasting. Proceedings of the National Science Foundation Workshop.
Hosking, J.R.M. 1990. "L-moments: Analysis and Estimation of Distributions Using Linear Combinations of Order Statistics." Journal of Royal Statistical Society. Bulletin 52, No. 1, pp. 105-124.
Landwehr, J.M., N.C. Matalas, and J.R. Wallis. 1979. "Estimation of Parameters and Qualities of Wakeby Distributions." Water Resources Research. Vol. 15, pp. 1055-1064.
National Drought Mitigation Center. 1995. [Online] Homepage: http://enso.unl.edu/ndmc
Palmer, W.C. 1965. Meteorological Drought. Research Paper No. 45. U.S. Department of Commerce, Weather Bureau.
Palmer, W.C. 1968. "Keeping Track of Crop Moisture Conditions Nationwide: The Crop Moisture Index." Weatherwise. Vol. 21, No 4, pp. 156-161.
Paulson, R.W., E.B. Chase, R.S. Roberts, and D.W. Moody. 1991. National Water Summary 1988-89, Hydrologic Events and Floods and Droughts. U.S. Geological Survey Water-Supply Paper 2375.
Redmond, K. 1991. "Climate Monitoring and Indices." In Drought Management and Planning. D.A. Wilhite, D.A. Wood, and P.A. Kay, eds. International Drought Information Center, Department of Agricultural Meteorology, University of Nebraska-Lincoln. IDIC Technical Report Series No. 91–1, pp. 29–33.
Riebsame, W.E., S.A. Changnon, and T.R. Karl. 1991. Drought and Natural Resources Management in the United States: Impacts and Implications of the 1987-1989 Drought. Boulder, CO: Westview Press.
Riggs, H.C. 1972. "Low Flow Investigations." U.S. Geological Survey Techniques of Water-Resources Investigations, Book 4, Chapter B1.
Sanford, S. 1979. "Towards a Definition of Drought." In M.T. Hinchey, ed., Botswana Drought Symposium. Botswana Society, Gaborone, Botswana.
Slack, J.R., and J.M. Landwehr. 1992. Hydro-Climatic Data Network (HCDN): A U.S. Geological Survey Streamflow Data Set for the United States for the Study of Climate Variations, 1874-1988. U.S. Geological Survey Open-File Report 92-129.
Subrahmanyam, V.P. 1967. Incidence and Spread of Continental Drought: World Organization, International Hydrological Decade. Reports on WMO/IHD Projects, No. 2, Geneva, Switzerland.
DROUGHTSDROUGHTS 183
Thomas, W.O., and J.R. Stedinger. 1991. Estimating Low-Flow Characteristics at Gaging Stations and Through the Use of Base-Flow Measurements. U.S. Geological Survey Open-File Report 91-244, pp. 197-206.
U.S. Army Corps of Engineers, Institute for Water Resources. 1991. The National Study of Water Management During Drought: Report on the First Year of Study. IWR Report 91-NDS-1.
Wahl, K.L., W.O.Thomas, Jr., and R.M. Hirsch. 1995. The Stream-Gaging Program of the U.S. Geological Survey. U.S. Geological Survey Circular 1123.
Wilhite, D.A., and M.H. Glantz. 1985. "Understanding the Drought Phenomenon: The Role of Definitions." Water International. Vol. 10, pp.111-20.
Wilhite, D.A., N.J. Rosenberg, and M.H. Glantz. 1986. "Improving Federal Response to Drought." Journal of Climate and Applied Meteorology. Vol. 25, No. 3, pp. 322-342.
Wilhite, D.A. 1991. "Drought Planning and State Government: Current Status." Bulletin of the American Meteorological Society. Vol. 72, No. 10.
Wilhite, D.A. 1992. "Drought." Encyclopedia of Earth Systems Science Vol. 2, pp. 81-92. Academic Press.
Wilhite, D.A. (Ed.) 1993. Drought Assessment, Management, and Planning: Theory and Case Studies. Natural Resource Management and Policy. Norwell, MA: Kluwer Academic Publishers.
Willeke, G., J.R.M. Hosking, J.R. Wallis, and N.B. Guttman. 1994. The National Drought Atlas (Draft). U.S. Army Corps of Engineers, Institute for Water Resources Report 94-NDS-4.