Embed Size (px)
Citation preview
Vol.:(0123456789)1 3
Energy Transitions (2020) 4:169–188 https://doi.org/10.1007/s41825-020-00032-z
ORIGINAL RESEARCH
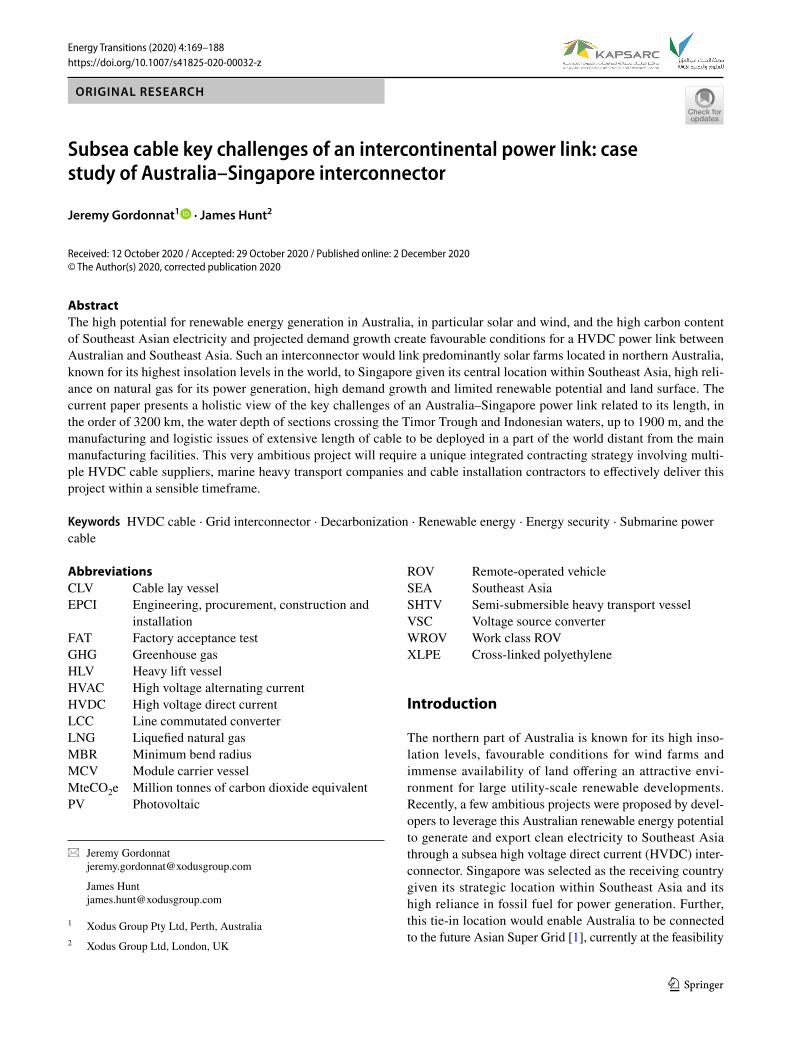
Subsea cable key challenges of an intercontinental power link: case study of Australia–Singapore interconnector
Jeremy Gordonnat1 · James Hunt2
Received: 12 October 2020 / Accepted: 29 October 2020 / Published online: 2 December 2020 © The Author(s) 2020, corrected publication 2020
AbstractThe high potential for renewable energy generation in Australia, in particular solar and wind, and the high carbon content of Southeast Asian electricity and projected demand growth create favourable conditions for a HVDC power link between Australian and Southeast Asia. Such an interconnector would link predominantly solar farms located in northern Australia, known for its highest insolation levels in the world, to Singapore given its central location within Southeast Asia, high reli-ance on natural gas for its power generation, high demand growth and limited renewable potential and land surface. The current paper presents a holistic view of the key challenges of an Australia–Singapore power link related to its length, in the order of 3200 km, the water depth of sections crossing the Timor Trough and Indonesian waters, up to 1900 m, and the manufacturing and logistic issues of extensive length of cable to be deployed in a part of the world distant from the main manufacturing facilities. This very ambitious project will require a unique integrated contracting strategy involving multi-ple HVDC cable suppliers, marine heavy transport companies and cable installation contractors to effectively deliver this project within a sensible timeframe.
Keywords HVDC cable · Grid interconnector · Decarbonization · Renewable energy · Energy security · Submarine power cable
AbbreviationsCLV Cable lay vesselEPCI Engineering, procurement, construction and
installationFAT Factory acceptance testGHG Greenhouse gasHLV Heavy lift vesselHVAC High voltage alternating currentHVDC High voltage direct currentLCC Line commutated converterLNG Liquefied natural gasMBR Minimum bend radiusMCV Module carrier vesselMteCO2e Million tonnes of carbon dioxide equivalentPV Photovoltaic
ROV Remote-operated vehicleSEA Southeast AsiaSHTV Semi-submersible heavy transport vesselVSC Voltage source converterWROV Work class ROVXLPE Cross-linked polyethylene
Introduction
The northern part of Australia is known for its high inso-lation levels, favourable conditions for wind farms and immense availability of land offering an attractive envi-ronment for large utility-scale renewable developments. Recently, a few ambitious projects were proposed by devel-opers to leverage this Australian renewable energy potential to generate and export clean electricity to Southeast Asia through a subsea high voltage direct current (HVDC) inter-connector. Singapore was selected as the receiving country given its strategic location within Southeast Asia and its high reliance in fossil fuel for power generation. Further, this tie-in location would enable Australia to be connected to the future Asian Super Grid [1], currently at the feasibility
* Jeremy Gordonnat [email protected]
James Hunt [email protected]
1 Xodus Group Pty Ltd, Perth, Australia2 Xodus Group Ltd, London, UK
170 Energy Transitions (2020) 4:169–188
1 3
stage, interconnecting most Asian countries in the long term. This paper presents a credible technical definition of an Aus-tralia—Singapore interconnector with the current technol-ogy, in terms of configuration, cable cross-section design and marine route to enable an overall project assessment and to quantify the unique challenges from a transport and installation, and cost perspectives.
Southeast Asia electricity status
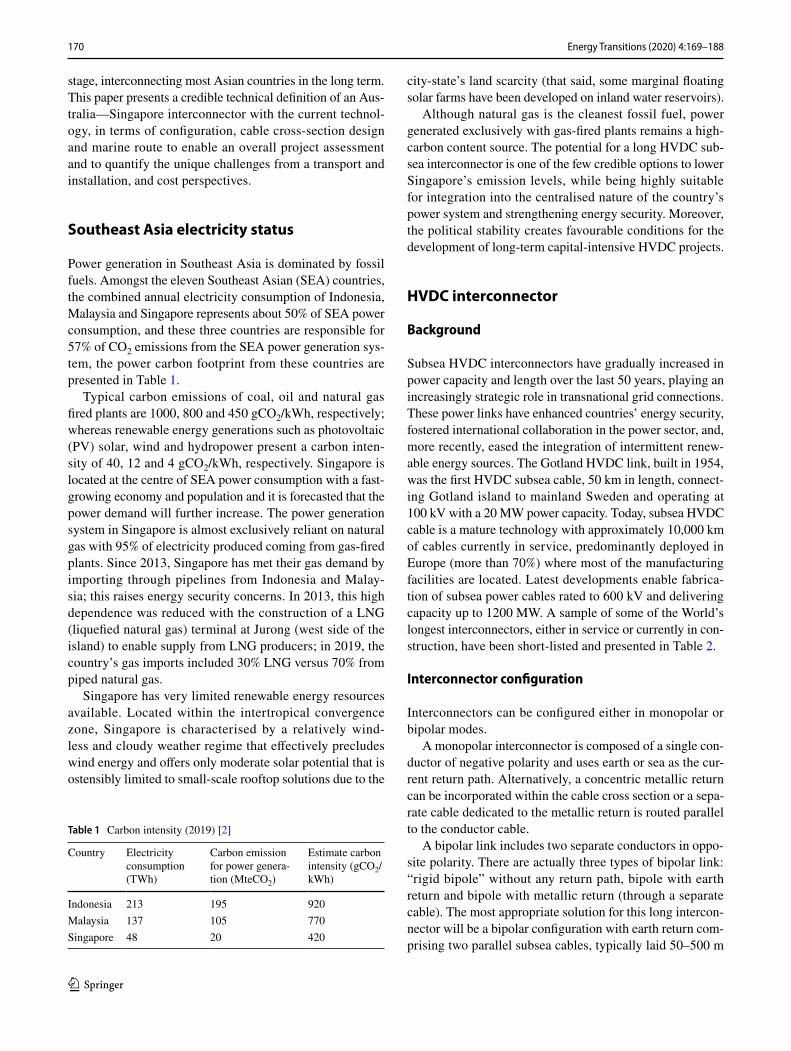
Power generation in Southeast Asia is dominated by fossil fuels. Amongst the eleven Southeast Asian (SEA) countries, the combined annual electricity consumption of Indonesia, Malaysia and Singapore represents about 50% of SEA power consumption, and these three countries are responsible for 57% of CO2 emissions from the SEA power generation sys-tem, the power carbon footprint from these countries are presented in Table 1.
Typical carbon emissions of coal, oil and natural gas fired plants are 1000, 800 and 450 gCO2/kWh, respectively; whereas renewable energy generations such as photovoltaic (PV) solar, wind and hydropower present a carbon inten-sity of 40, 12 and 4 gCO2/kWh, respectively. Singapore is located at the centre of SEA power consumption with a fast-growing economy and population and it is forecasted that the power demand will further increase. The power generation system in Singapore is almost exclusively reliant on natural gas with 95% of electricity produced coming from gas-fired plants. Since 2013, Singapore has met their gas demand by importing through pipelines from Indonesia and Malay-sia; this raises energy security concerns. In 2013, this high dependence was reduced with the construction of a LNG (liquefied natural gas) terminal at Jurong (west side of the island) to enable supply from LNG producers; in 2019, the country’s gas imports included 30% LNG versus 70% from piped natural gas.
Singapore has very limited renewable energy resources available. Located within the intertropical convergence zone, Singapore is characterised by a relatively wind-less and cloudy weather regime that effectively precludes wind energy and offers only moderate solar potential that is ostensibly limited to small-scale rooftop solutions due to the
city-state’s land scarcity (that said, some marginal floating solar farms have been developed on inland water reservoirs).
Although natural gas is the cleanest fossil fuel, power generated exclusively with gas-fired plants remains a high-carbon content source. The potential for a long HVDC sub-sea interconnector is one of the few credible options to lower Singapore’s emission levels, while being highly suitable for integration into the centralised nature of the country’s power system and strengthening energy security. Moreover, the political stability creates favourable conditions for the development of long-term capital-intensive HVDC projects.
HVDC interconnector
Background
Subsea HVDC interconnectors have gradually increased in power capacity and length over the last 50 years, playing an increasingly strategic role in transnational grid connections. These power links have enhanced countries’ energy security, fostered international collaboration in the power sector, and, more recently, eased the integration of intermittent renew-able energy sources. The Gotland HVDC link, built in 1954, was the first HVDC subsea cable, 50 km in length, connect-ing Gotland island to mainland Sweden and operating at 100 kV with a 20 MW power capacity. Today, subsea HVDC cable is a mature technology with approximately 10,000 km of cables currently in service, predominantly deployed in Europe (more than 70%) where most of the manufacturing facilities are located. Latest developments enable fabrica-tion of subsea power cables rated to 600 kV and delivering capacity up to 1200 MW. A sample of some of the World’s longest interconnectors, either in service or currently in con-struction, have been short-listed and presented in Table 2.
Interconnector configuration
Interconnectors can be configured either in monopolar or bipolar modes.
A monopolar interconnector is composed of a single con-ductor of negative polarity and uses earth or sea as the cur-rent return path. Alternatively, a concentric metallic return can be incorporated within the cable cross section or a sepa-rate cable dedicated to the metallic return is routed parallel to the conductor cable.
A bipolar link includes two separate conductors in oppo-site polarity. There are actually three types of bipolar link: “rigid bipole” without any return path, bipole with earth return and bipole with metallic return (through a separate cable). The most appropriate solution for this long intercon-nector will be a bipolar configuration with earth return com-prising two parallel subsea cables, typically laid 50–500 m
Table 1 Carbon intensity (2019) [2]
Country Electricity consumption (TWh)
Carbon emission for power genera-tion (MteCO2)
Estimate carbon intensity (gCO2/kWh)
Indonesia 213 195 920Malaysia 137 105 770Singapore 48 20 420
171Energy Transitions (2020) 4:169–188
1 3
apart along a defined route. The main advantage of this bipo-lar interconnector arrangement is the ability, in the event of one cable failure, to convert the intact cable into monopolar mode with earth return over the repair duration, allowing half of the electricity capacity to be transmitted. Further, the existing HVDC technology is qualified for cable with power capacity up to 1.2 GW. To meet the expected interconnector power capacity, between 2 and 3 GW, the interconnector shall be configured in bipolar mode.
For the purpose of this study, two individual HVDC sub-sea cables of 1.2 GW capacity each have been considered resulting in an interconnector power capacity of 2.4 GW.
HVDC cable cross‑section design
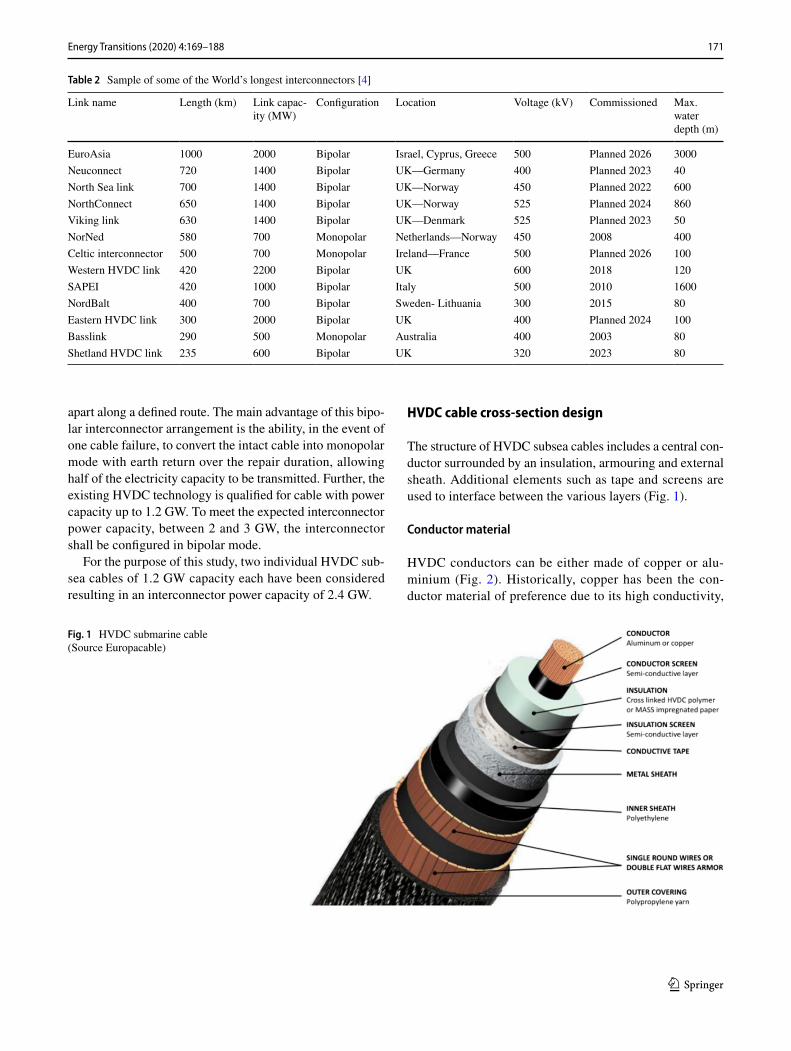
The structure of HVDC subsea cables includes a central con-ductor surrounded by an insulation, armouring and external sheath. Additional elements such as tape and screens are used to interface between the various layers (Fig. 1).
Conductor material
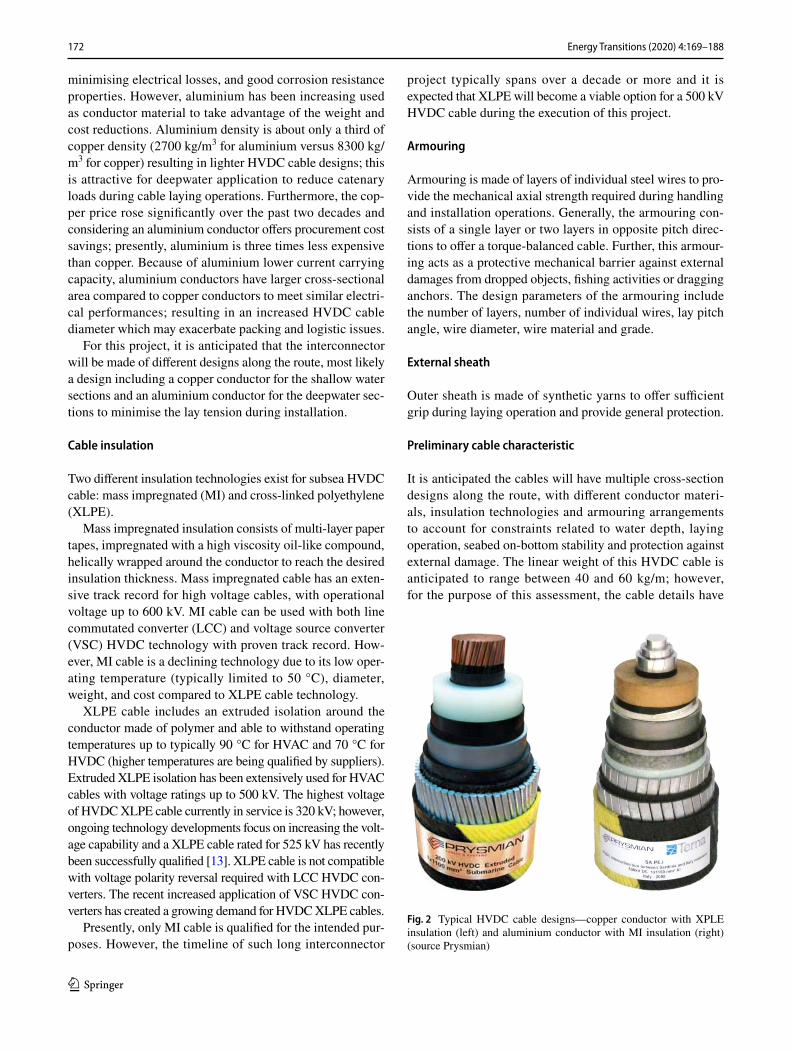
HVDC conductors can be either made of copper or alu-minium (Fig. 2). Historically, copper has been the con-ductor material of preference due to its high conductivity,
Table 2 Sample of some of the World’s longest interconnectors [4]
Link name Length (km) Link capac-ity (MW)
Configuration Location Voltage (kV) Commissioned Max. water depth (m)
EuroAsia 1000 2000 Bipolar Israel, Cyprus, Greece 500 Planned 2026 3000Neuconnect 720 1400 Bipolar UK—Germany 400 Planned 2023 40North Sea link 700 1400 Bipolar UK—Norway 450 Planned 2022 600NorthConnect 650 1400 Bipolar UK—Norway 525 Planned 2024 860Viking link 630 1400 Bipolar UK—Denmark 525 Planned 2023 50NorNed 580 700 Monopolar Netherlands—Norway 450 2008 400Celtic interconnector 500 700 Monopolar Ireland—France 500 Planned 2026 100Western HVDC link 420 2200 Bipolar UK 600 2018 120SAPEI 420 1000 Bipolar Italy 500 2010 1600NordBalt 400 700 Bipolar Sweden- Lithuania 300 2015 80Eastern HVDC link 300 2000 Bipolar UK 400 Planned 2024 100Basslink 290 500 Monopolar Australia 400 2003 80Shetland HVDC link 235 600 Bipolar UK 320 2023 80
Fig. 1 HVDC submarine cable (Source Europacable)
172 Energy Transitions (2020) 4:169–188
1 3
minimising electrical losses, and good corrosion resistance properties. However, aluminium has been increasing used as conductor material to take advantage of the weight and cost reductions. Aluminium density is about only a third of copper density (2700 kg/m3 for aluminium versus 8300 kg/m3 for copper) resulting in lighter HVDC cable designs; this is attractive for deepwater application to reduce catenary loads during cable laying operations. Furthermore, the cop-per price rose significantly over the past two decades and considering an aluminium conductor offers procurement cost savings; presently, aluminium is three times less expensive than copper. Because of aluminium lower current carrying capacity, aluminium conductors have larger cross-sectional area compared to copper conductors to meet similar electri-cal performances; resulting in an increased HVDC cable diameter which may exacerbate packing and logistic issues.
For this project, it is anticipated that the interconnector will be made of different designs along the route, most likely a design including a copper conductor for the shallow water sections and an aluminium conductor for the deepwater sec-tions to minimise the lay tension during installation.
Cable insulation
Two different insulation technologies exist for subsea HVDC cable: mass impregnated (MI) and cross-linked polyethylene (XLPE).
Mass impregnated insulation consists of multi-layer paper tapes, impregnated with a high viscosity oil-like compound, helically wrapped around the conductor to reach the desired insulation thickness. Mass impregnated cable has an exten-sive track record for high voltage cables, with operational voltage up to 600 kV. MI cable can be used with both line commutated converter (LCC) and voltage source converter (VSC) HVDC technology with proven track record. How-ever, MI cable is a declining technology due to its low oper-ating temperature (typically limited to 50 °C), diameter, weight, and cost compared to XLPE cable technology.
XLPE cable includes an extruded isolation around the conductor made of polymer and able to withstand operating temperatures up to typically 90 °C for HVAC and 70 °C for HVDC (higher temperatures are being qualified by suppliers). Extruded XLPE isolation has been extensively used for HVAC cables with voltage ratings up to 500 kV. The highest voltage of HVDC XLPE cable currently in service is 320 kV; however, ongoing technology developments focus on increasing the volt-age capability and a XLPE cable rated for 525 kV has recently been successfully qualified [13]. XLPE cable is not compatible with voltage polarity reversal required with LCC HVDC con-verters. The recent increased application of VSC HVDC con-verters has created a growing demand for HVDC XLPE cables.
Presently, only MI cable is qualified for the intended pur-poses. However, the timeline of such long interconnector
project typically spans over a decade or more and it is expected that XLPE will become a viable option for a 500 kV HVDC cable during the execution of this project.
Armouring
Armouring is made of layers of individual steel wires to pro-vide the mechanical axial strength required during handling and installation operations. Generally, the armouring con-sists of a single layer or two layers in opposite pitch direc-tions to offer a torque-balanced cable. Further, this armour-ing acts as a protective mechanical barrier against external damages from dropped objects, fishing activities or dragging anchors. The design parameters of the armouring include the number of layers, number of individual wires, lay pitch angle, wire diameter, wire material and grade.
External sheath
Outer sheath is made of synthetic yarns to offer sufficient grip during laying operation and provide general protection.
Preliminary cable characteristic
It is anticipated the cables will have multiple cross-section designs along the route, with different conductor materi-als, insulation technologies and armouring arrangements to account for constraints related to water depth, laying operation, seabed on-bottom stability and protection against external damage. The linear weight of this HVDC cable is anticipated to range between 40 and 60 kg/m; however, for the purpose of this assessment, the cable details have
Fig. 2 Typical HVDC cable designs—copper conductor with XPLE insulation (left) and aluminium conductor with MI insulation (right) (source Prysmian)
173Energy Transitions (2020) 4:169–188
1 3
been assumed identical along the route with the following characteristics:
• Cable voltage = ± 525 kV• Power cable capacity = 1.2 GW (2.4 GW in total)• Outer diameter = 150 mm• Linear weight in air = 50 kg/m
Based on these assumptions, the total cable payload of this interconnector is 320,000 te.
The electrical loss through HVDC cable is approximately 3% per 1000 km. Hence, it is anticipated that total electrical loss through this interconnector will be approximately 10% for the subsea portion.
Route selection
Renewable energy projects within Northwest Australia
A few large-scale renewable energy projects located in northern Australia are currently in the feasibility phase, such
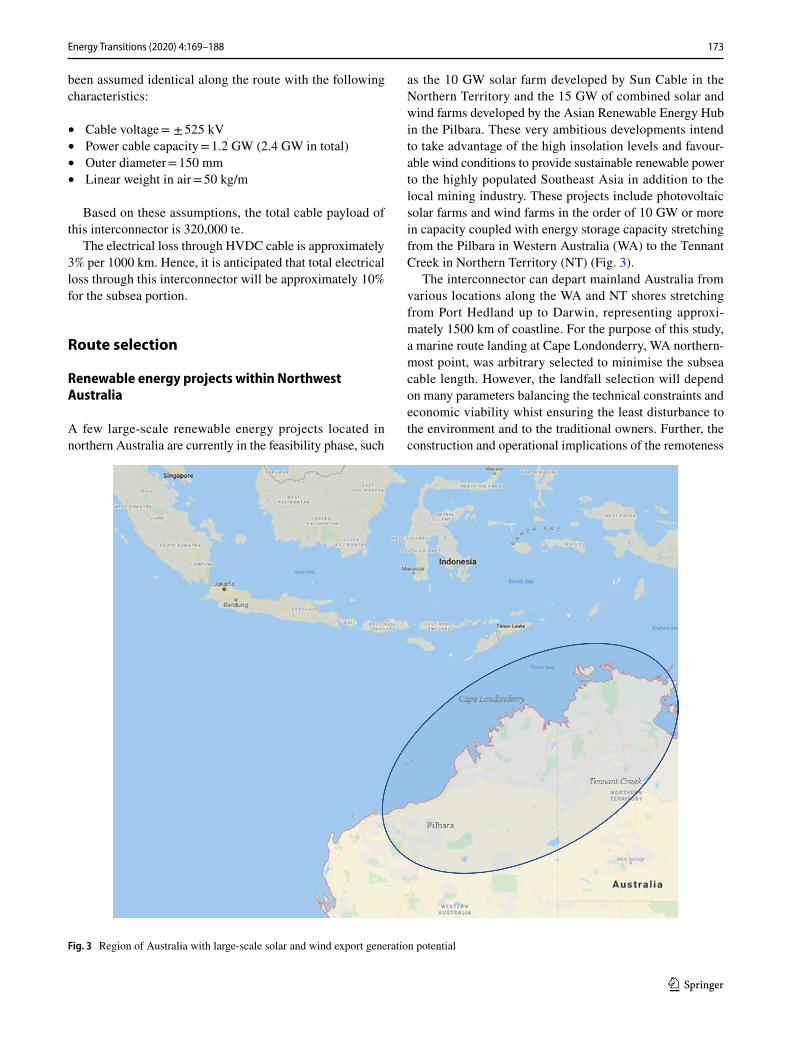
as the 10 GW solar farm developed by Sun Cable in the Northern Territory and the 15 GW of combined solar and wind farms developed by the Asian Renewable Energy Hub in the Pilbara. These very ambitious developments intend to take advantage of the high insolation levels and favour-able wind conditions to provide sustainable renewable power to the highly populated Southeast Asia in addition to the local mining industry. These projects include photovoltaic solar farms and wind farms in the order of 10 GW or more in capacity coupled with energy storage capacity stretching from the Pilbara in Western Australia (WA) to the Tennant Creek in Northern Territory (NT) (Fig. 3).
The interconnector can depart mainland Australia from various locations along the WA and NT shores stretching from Port Hedland up to Darwin, representing approxi-mately 1500 km of coastline. For the purpose of this study, a marine route landing at Cape Londonderry, WA northern-most point, was arbitrary selected to minimise the subsea cable length. However, the landfall selection will depend on many parameters balancing the technical constraints and economic viability whist ensuring the least disturbance to the environment and to the traditional owners. Further, the construction and operational implications of the remoteness
Fig. 3 Region of Australia with large-scale solar and wind export generation potential
174 Energy Transitions (2020) 4:169–188
1 3
and isolated nature of the region will need to be assessed in detail during the landfall selection process. Furthermore, wind/solar farm sites and potential synergies across develop-ments may influenced the chosen location.
Marine route
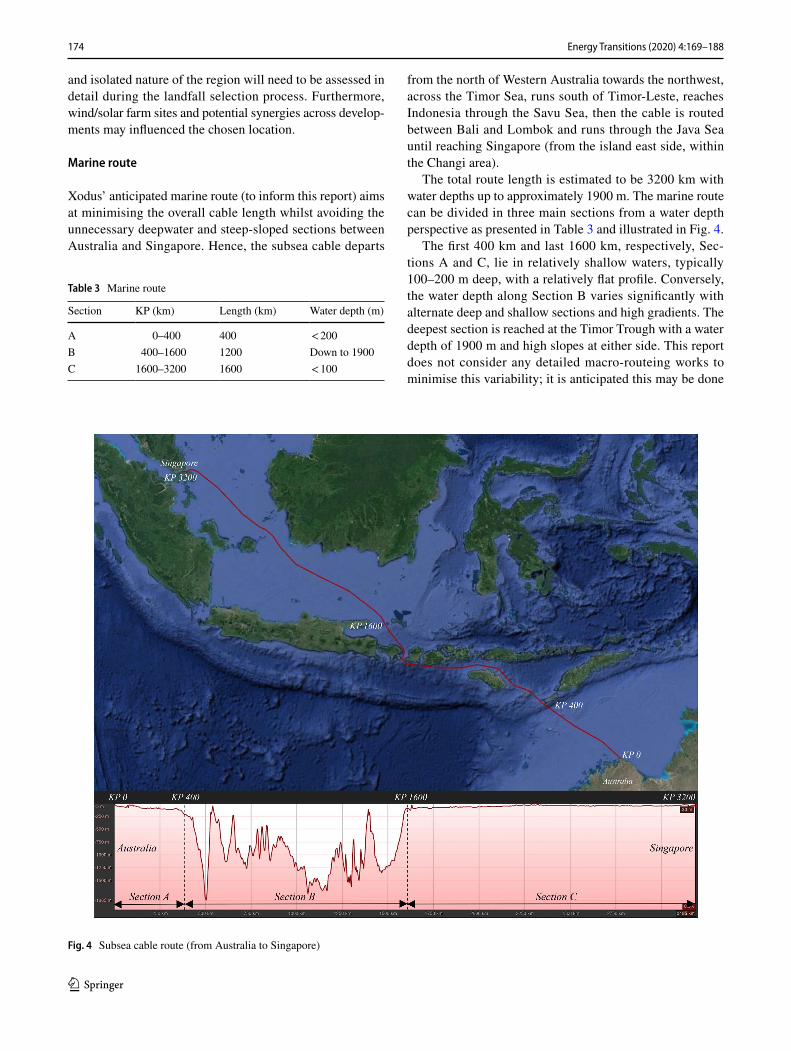
Xodus’ anticipated marine route (to inform this report) aims at minimising the overall cable length whilst avoiding the unnecessary deepwater and steep-sloped sections between Australia and Singapore. Hence, the subsea cable departs
from the north of Western Australia towards the northwest, across the Timor Sea, runs south of Timor-Leste, reaches Indonesia through the Savu Sea, then the cable is routed between Bali and Lombok and runs through the Java Sea until reaching Singapore (from the island east side, within the Changi area).
The total route length is estimated to be 3200 km with water depths up to approximately 1900 m. The marine route can be divided in three main sections from a water depth perspective as presented in Table 3 and illustrated in Fig. 4.
The first 400 km and last 1600 km, respectively, Sec-tions A and C, lie in relatively shallow waters, typically 100–200 m deep, with a relatively flat profile. Conversely, the water depth along Section B varies significantly with alternate deep and shallow sections and high gradients. The deepest section is reached at the Timor Trough with a water depth of 1900 m and high slopes at either side. This report does not consider any detailed macro-routeing works to minimise this variability; it is anticipated this may be done
Table 3 Marine route
Section KP (km) Length (km) Water depth (m)
A 0–400 400 < 200B 400–1600 1200 Down to 1900C 1600–3200 1600 < 100
Fig. 4 Subsea cable route (from Australia to Singapore)
175Energy Transitions (2020) 4:169–188
1 3
to inform development of the project, particularly for site investigation survey specification.
Key challenges
Java Sea/Singapore Strait
The Java Sea is characterised by a relatively shallow and featureless seabed with an average depth of 46 m but it is highly congested. The interconnector would run across the Java Sea, from southeast to northwest, for approximately 1500 km. The key challenges along this route portion are related to the seabed congestion level, crossing a large num-ber of existing pipelines and communication cables, and protection against damage from fishing activities that will necessitate the cables being trenched or protected by alterna-tive means over an extended route length.
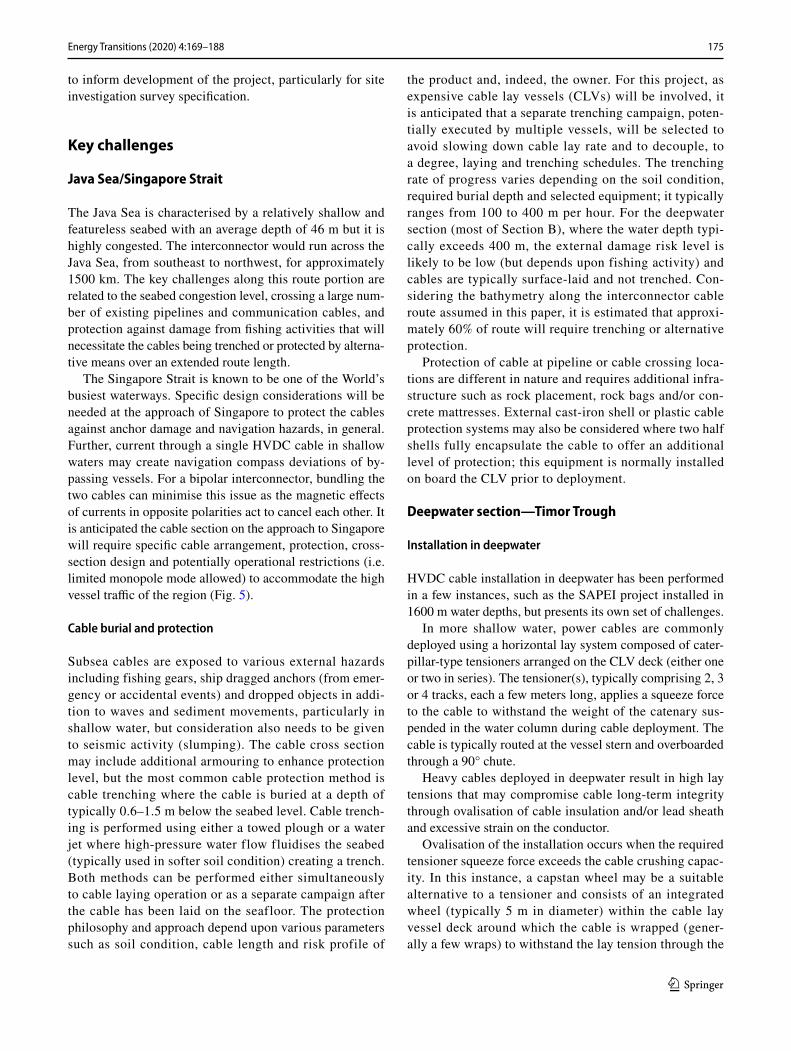
The Singapore Strait is known to be one of the World’s busiest waterways. Specific design considerations will be needed at the approach of Singapore to protect the cables against anchor damage and navigation hazards, in general. Further, current through a single HVDC cable in shallow waters may create navigation compass deviations of by-passing vessels. For a bipolar interconnector, bundling the two cables can minimise this issue as the magnetic effects of currents in opposite polarities act to cancel each other. It is anticipated the cable section on the approach to Singapore will require specific cable arrangement, protection, cross-section design and potentially operational restrictions (i.e. limited monopole mode allowed) to accommodate the high vessel traffic of the region (Fig. 5).
Cable burial and protection
Subsea cables are exposed to various external hazards including fishing gears, ship dragged anchors (from emer-gency or accidental events) and dropped objects in addi-tion to waves and sediment movements, particularly in shallow water, but consideration also needs to be given to seismic activity (slumping). The cable cross section may include additional armouring to enhance protection level, but the most common cable protection method is cable trenching where the cable is buried at a depth of typically 0.6–1.5 m below the seabed level. Cable trench-ing is performed using either a towed plough or a water jet where high-pressure water flow fluidises the seabed (typically used in softer soil condition) creating a trench. Both methods can be performed either simultaneously to cable laying operation or as a separate campaign after the cable has been laid on the seafloor. The protection philosophy and approach depend upon various parameters such as soil condition, cable length and risk profile of
the product and, indeed, the owner. For this project, as expensive cable lay vessels (CLVs) will be involved, it is anticipated that a separate trenching campaign, poten-tially executed by multiple vessels, will be selected to avoid slowing down cable lay rate and to decouple, to a degree, laying and trenching schedules. The trenching rate of progress varies depending on the soil condition, required burial depth and selected equipment; it typically ranges from 100 to 400 m per hour. For the deepwater section (most of Section B), where the water depth typi-cally exceeds 400 m, the external damage risk level is likely to be low (but depends upon fishing activity) and cables are typically surface-laid and not trenched. Con-sidering the bathymetry along the interconnector cable route assumed in this paper, it is estimated that approxi-mately 60% of route will require trenching or alternative protection.
Protection of cable at pipeline or cable crossing loca-tions are different in nature and requires additional infra-structure such as rock placement, rock bags and/or con-crete mattresses. External cast-iron shell or plastic cable protection systems may also be considered where two half shells fully encapsulate the cable to offer an additional level of protection; this equipment is normally installed on board the CLV prior to deployment.
Deepwater section—Timor Trough
Installation in deepwater
HVDC cable installation in deepwater has been performed in a few instances, such as the SAPEI project installed in 1600 m water depths, but presents its own set of challenges.
In more shallow water, power cables are commonly deployed using a horizontal lay system composed of cater-pillar-type tensioners arranged on the CLV deck (either one or two in series). The tensioner(s), typically comprising 2, 3 or 4 tracks, each a few meters long, applies a squeeze force to the cable to withstand the weight of the catenary sus-pended in the water column during cable deployment. The cable is typically routed at the vessel stern and overboarded through a 90° chute.
Heavy cables deployed in deepwater result in high lay tensions that may compromise cable long-term integrity through ovalisation of cable insulation and/or lead sheath and excessive strain on the conductor.
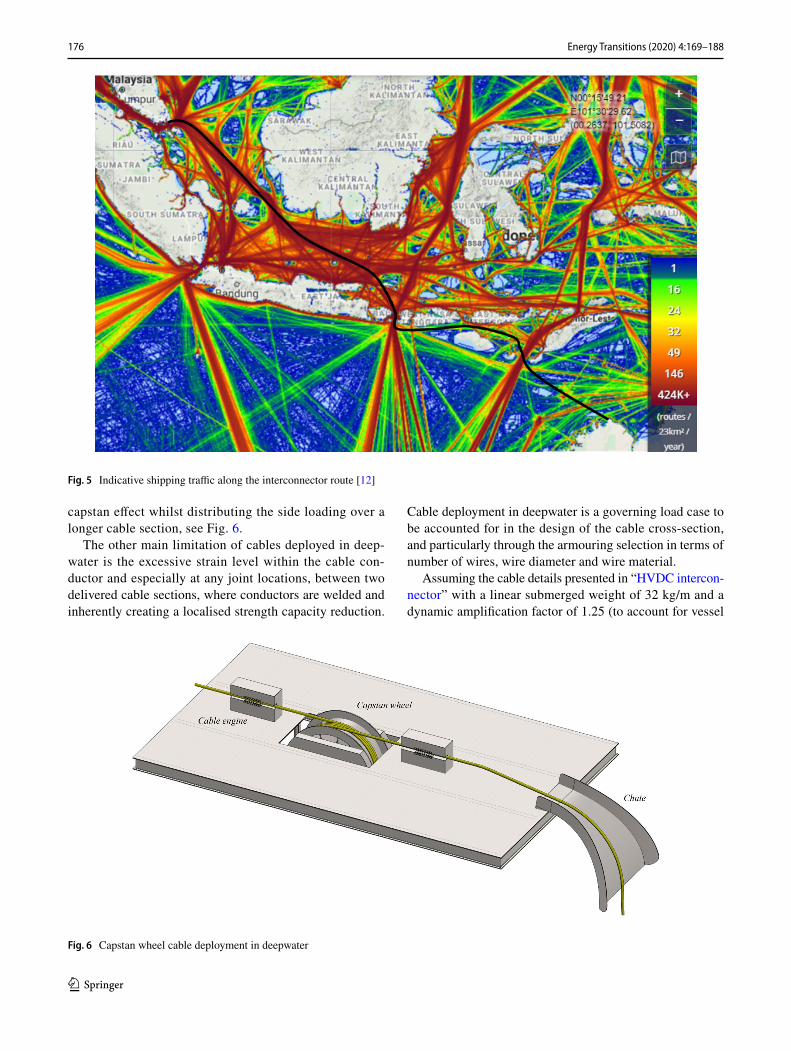
Ovalisation of the installation occurs when the required tensioner squeeze force exceeds the cable crushing capac-ity. In this instance, a capstan wheel may be a suitable alternative to a tensioner and consists of an integrated wheel (typically 5 m in diameter) within the cable lay vessel deck around which the cable is wrapped (gener-ally a few wraps) to withstand the lay tension through the
176 Energy Transitions (2020) 4:169–188
1 3
capstan effect whilst distributing the side loading over a longer cable section, see Fig. 6.
The other main limitation of cables deployed in deep-water is the excessive strain level within the cable con-ductor and especially at any joint locations, between two delivered cable sections, where conductors are welded and inherently creating a localised strength capacity reduction.
Cable deployment in deepwater is a governing load case to be accounted for in the design of the cable cross-section, and particularly through the armouring selection in terms of number of wires, wire diameter and wire material.
Assuming the cable details presented in “HVDC intercon-nector” with a linear submerged weight of 32 kg/m and a dynamic amplification factor of 1.25 (to account for vessel
Fig. 5 Indicative shipping traffic along the interconnector route [12]
Fig. 6 Capstan wheel cable deployment in deepwater
177Energy Transitions (2020) 4:169–188
1 3
heaving) in 1900 m of water, the dynamic lay tension is approximately 80 te. As a contingency, the design should account for cable recovery. For this scenario, the recovery tension, accounting for friction/capstan effect over a chute in addition to the catenary load, is expected to be in the order of 100 te.
Repair Omega loop and route corridor
In the event of a cable failure during service, the repair pro-cedure entails an extra cable length of approximately double the water depth at the repair location being laid on the sea-bed, typically, perpendicular to the initial cable route as an Omega or hairpin loop. A typical offshore cable repair pro-cedure, after fault location, consists of the following steps:
• Perform subsea cut of the existing faulty cable using a WROV.
• Recover to deck the first cut end and spool back a sacrifi-cial section, this may be a few hundred meters, to ensure the remaining cable is free of failure.
• Perform the joint on installation vessel deck between the existing cable and the replacement cable.
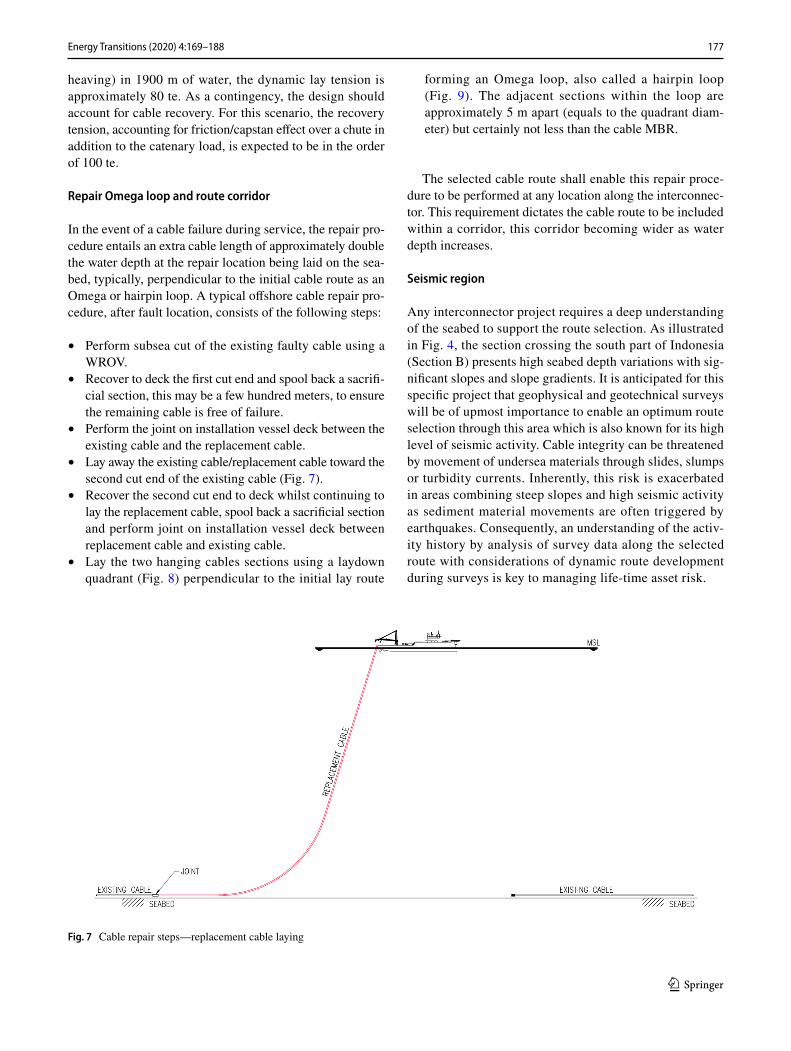
• Lay away the existing cable/replacement cable toward the second cut end of the existing cable (Fig. 7).
• Recover the second cut end to deck whilst continuing to lay the replacement cable, spool back a sacrificial section and perform joint on installation vessel deck between replacement cable and existing cable.
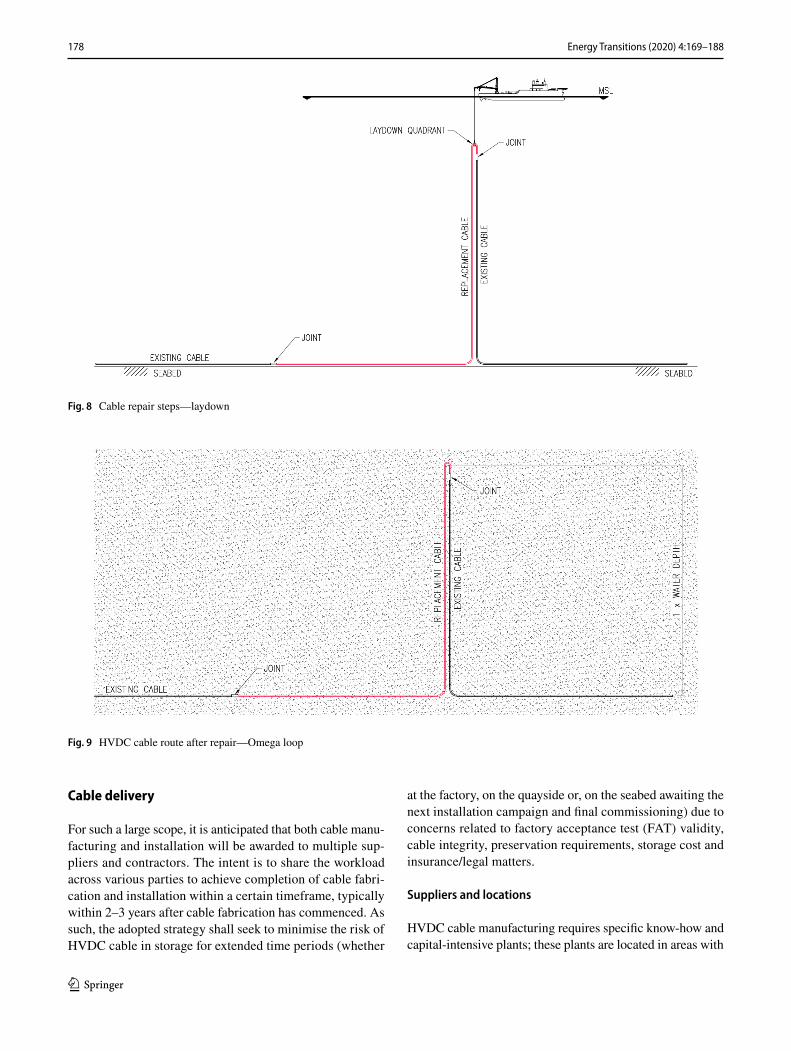
• Lay the two hanging cables sections using a laydown quadrant (Fig. 8) perpendicular to the initial lay route
forming an Omega loop, also called a hairpin loop (Fig. 9). The adjacent sections within the loop are approximately 5 m apart (equals to the quadrant diam-eter) but certainly not less than the cable MBR.
The selected cable route shall enable this repair proce-dure to be performed at any location along the interconnec-tor. This requirement dictates the cable route to be included within a corridor, this corridor becoming wider as water depth increases.
Seismic region
Any interconnector project requires a deep understanding of the seabed to support the route selection. As illustrated in Fig. 4, the section crossing the south part of Indonesia (Section B) presents high seabed depth variations with sig-nificant slopes and slope gradients. It is anticipated for this specific project that geophysical and geotechnical surveys will be of upmost importance to enable an optimum route selection through this area which is also known for its high level of seismic activity. Cable integrity can be threatened by movement of undersea materials through slides, slumps or turbidity currents. Inherently, this risk is exacerbated in areas combining steep slopes and high seismic activity as sediment material movements are often triggered by earthquakes. Consequently, an understanding of the activ-ity history by analysis of survey data along the selected route with considerations of dynamic route development during surveys is key to managing life-time asset risk.
Fig. 7 Cable repair steps—replacement cable laying
178 Energy Transitions (2020) 4:169–188
1 3
Cable delivery
For such a large scope, it is anticipated that both cable manu-facturing and installation will be awarded to multiple sup-pliers and contractors. The intent is to share the workload across various parties to achieve completion of cable fabri-cation and installation within a certain timeframe, typically within 2–3 years after cable fabrication has commenced. As such, the adopted strategy shall seek to minimise the risk of HVDC cable in storage for extended time periods (whether
at the factory, on the quayside or, on the seabed awaiting the next installation campaign and final commissioning) due to concerns related to factory acceptance test (FAT) validity, cable integrity, preservation requirements, storage cost and insurance/legal matters.
Suppliers and locations
HVDC cable manufacturing requires specific know-how and capital-intensive plants; these plants are located in areas with
Fig. 8 Cable repair steps—laydown
Fig. 9 HVDC cable route after repair—Omega loop
179Energy Transitions (2020) 4:169–188
1 3
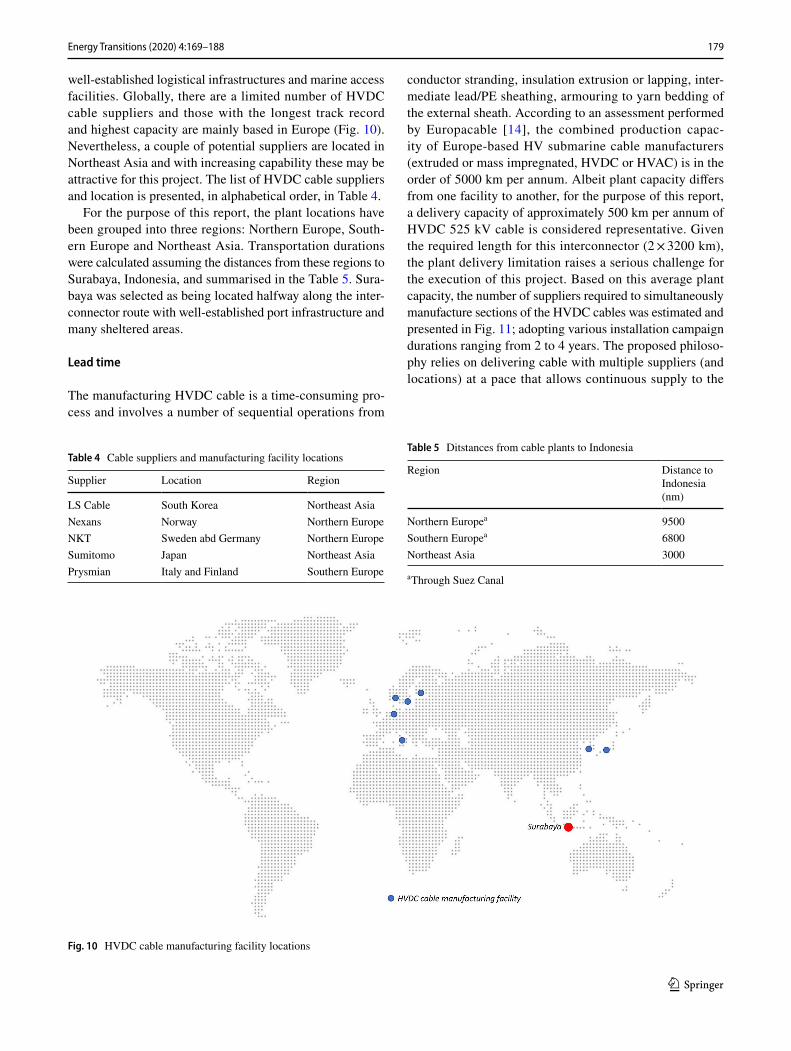
well-established logistical infrastructures and marine access facilities. Globally, there are a limited number of HVDC cable suppliers and those with the longest track record and highest capacity are mainly based in Europe (Fig. 10). Nevertheless, a couple of potential suppliers are located in Northeast Asia and with increasing capability these may be attractive for this project. The list of HVDC cable suppliers and location is presented, in alphabetical order, in Table 4.
For the purpose of this report, the plant locations have been grouped into three regions: Northern Europe, South-ern Europe and Northeast Asia. Transportation durations were calculated assuming the distances from these regions to Surabaya, Indonesia, and summarised in the Table 5. Sura-baya was selected as being located halfway along the inter-connector route with well-established port infrastructure and many sheltered areas.
Lead time
The manufacturing HVDC cable is a time-consuming pro-cess and involves a number of sequential operations from
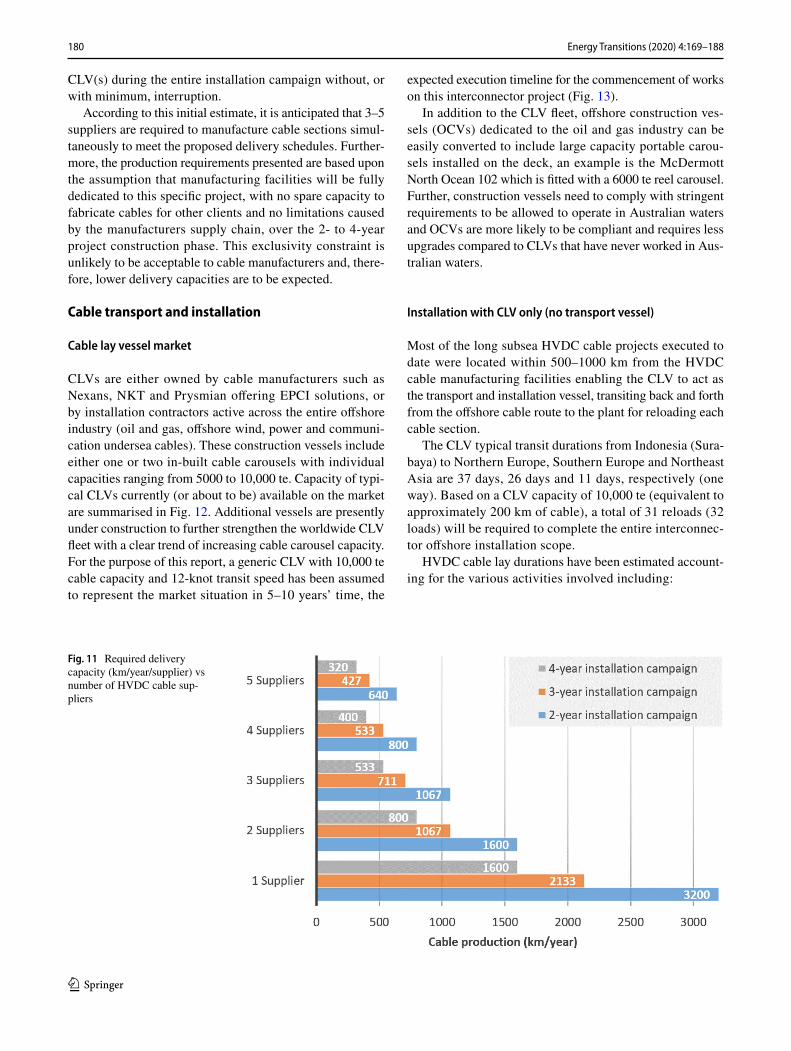
conductor stranding, insulation extrusion or lapping, inter-mediate lead/PE sheathing, armouring to yarn bedding of the external sheath. According to an assessment performed by Europacable [14], the combined production capac-ity of Europe-based HV submarine cable manufacturers (extruded or mass impregnated, HVDC or HVAC) is in the order of 5000 km per annum. Albeit plant capacity differs from one facility to another, for the purpose of this report, a delivery capacity of approximately 500 km per annum of HVDC 525 kV cable is considered representative. Given the required length for this interconnector (2 × 3200 km), the plant delivery limitation raises a serious challenge for the execution of this project. Based on this average plant capacity, the number of suppliers required to simultaneously manufacture sections of the HVDC cables was estimated and presented in Fig. 11; adopting various installation campaign durations ranging from 2 to 4 years. The proposed philoso-phy relies on delivering cable with multiple suppliers (and locations) at a pace that allows continuous supply to the
Table 4 Cable suppliers and manufacturing facility locations
Supplier Location Region
LS Cable South Korea Northeast AsiaNexans Norway Northern EuropeNKT Sweden abd Germany Northern EuropeSumitomo Japan Northeast AsiaPrysmian Italy and Finland Southern Europe
Fig. 10 HVDC cable manufacturing facility locations
Table 5 Ditstances from cable plants to Indonesia
a Through Suez Canal
Region Distance to Indonesia (nm)
Northern Europea 9500Southern Europea 6800Northeast Asia 3000
180 Energy Transitions (2020) 4:169–188
1 3
CLV(s) during the entire installation campaign without, or with minimum, interruption.
According to this initial estimate, it is anticipated that 3–5 suppliers are required to manufacture cable sections simul-taneously to meet the proposed delivery schedules. Further-more, the production requirements presented are based upon the assumption that manufacturing facilities will be fully dedicated to this specific project, with no spare capacity to fabricate cables for other clients and no limitations caused by the manufacturers supply chain, over the 2- to 4-year project construction phase. This exclusivity constraint is unlikely to be acceptable to cable manufacturers and, there-fore, lower delivery capacities are to be expected.
Cable transport and installation
Cable lay vessel market
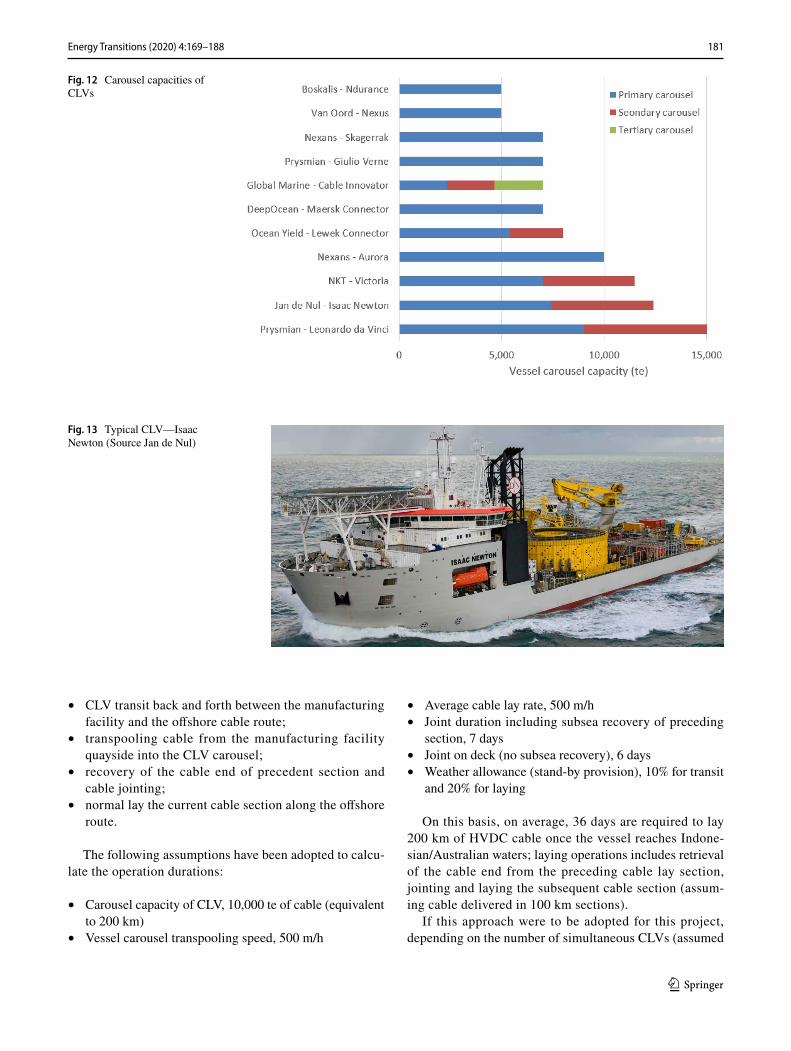
CLVs are either owned by cable manufacturers such as Nexans, NKT and Prysmian offering EPCI solutions, or by installation contractors active across the entire offshore industry (oil and gas, offshore wind, power and communi-cation undersea cables). These construction vessels include either one or two in-built cable carousels with individual capacities ranging from 5000 to 10,000 te. Capacity of typi-cal CLVs currently (or about to be) available on the market are summarised in Fig. 12. Additional vessels are presently under construction to further strengthen the worldwide CLV fleet with a clear trend of increasing cable carousel capacity. For the purpose of this report, a generic CLV with 10,000 te cable capacity and 12-knot transit speed has been assumed to represent the market situation in 5–10 years’ time, the
expected execution timeline for the commencement of works on this interconnector project (Fig. 13).
In addition to the CLV fleet, offshore construction ves-sels (OCVs) dedicated to the oil and gas industry can be easily converted to include large capacity portable carou-sels installed on the deck, an example is the McDermott North Ocean 102 which is fitted with a 6000 te reel carousel. Further, construction vessels need to comply with stringent requirements to be allowed to operate in Australian waters and OCVs are more likely to be compliant and requires less upgrades compared to CLVs that have never worked in Aus-tralian waters.
Installation with CLV only (no transport vessel)
Most of the long subsea HVDC cable projects executed to date were located within 500–1000 km from the HVDC cable manufacturing facilities enabling the CLV to act as the transport and installation vessel, transiting back and forth from the offshore cable route to the plant for reloading each cable section.
The CLV typical transit durations from Indonesia (Sura-baya) to Northern Europe, Southern Europe and Northeast Asia are 37 days, 26 days and 11 days, respectively (one way). Based on a CLV capacity of 10,000 te (equivalent to approximately 200 km of cable), a total of 31 reloads (32 loads) will be required to complete the entire interconnec-tor offshore installation scope.
HVDC cable lay durations have been estimated account-ing for the various activities involved including:
Fig. 11 Required delivery capacity (km/year/supplier) vs number of HVDC cable sup-pliers
181Energy Transitions (2020) 4:169–188
1 3
• CLV transit back and forth between the manufacturing facility and the offshore cable route;
• transpooling cable from the manufacturing facility quayside into the CLV carousel;
• recovery of the cable end of precedent section and cable jointing;
• normal lay the current cable section along the offshore route.
The following assumptions have been adopted to calcu-late the operation durations:
• Carousel capacity of CLV, 10,000 te of cable (equivalent to 200 km)
• Vessel carousel transpooling speed, 500 m/h
• Average cable lay rate, 500 m/h• Joint duration including subsea recovery of preceding
section, 7 days• Joint on deck (no subsea recovery), 6 days• Weather allowance (stand-by provision), 10% for transit
and 20% for laying
On this basis, on average, 36 days are required to lay 200 km of HVDC cable once the vessel reaches Indone-sian/Australian waters; laying operations includes retrieval of the cable end from the preceding cable lay section, jointing and laying the subsequent cable section (assum-ing cable delivered in 100 km sections).
If this approach were to be adopted for this project, depending on the number of simultaneous CLVs (assumed
Fig. 12 Carousel capacities of CLVs
Fig. 13 Typical CLV—Isaac Newton (Source Jan de Nul)
182 Energy Transitions (2020) 4:169–188
1 3
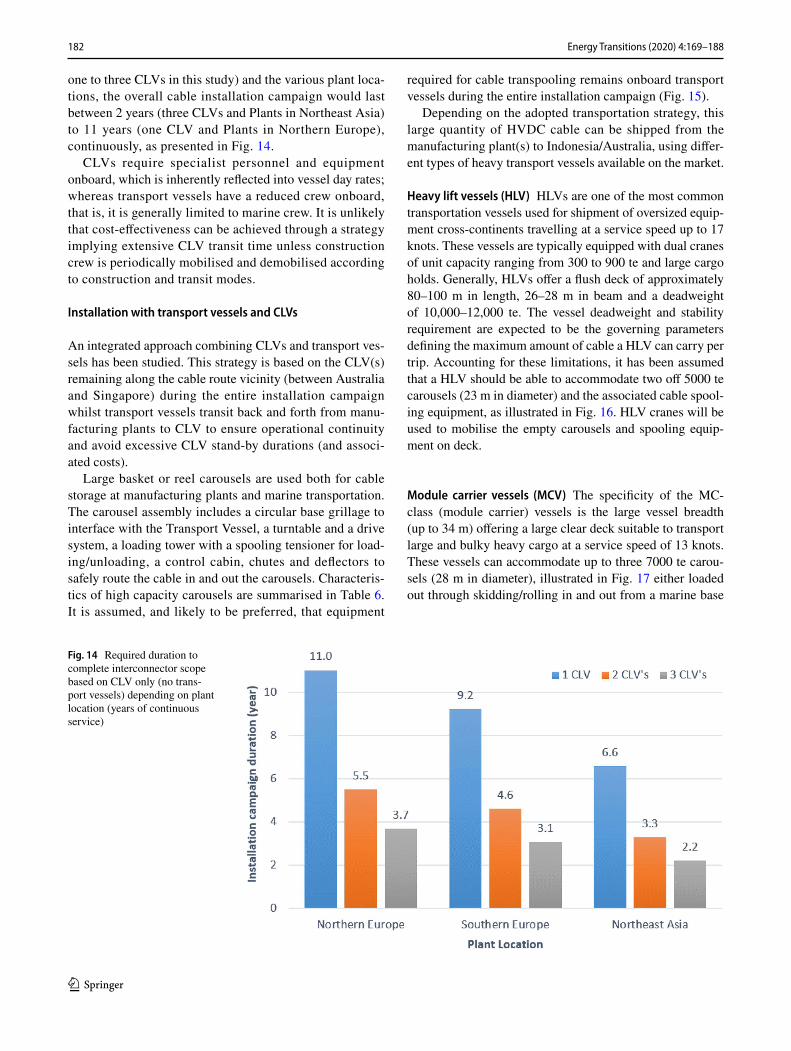
one to three CLVs in this study) and the various plant loca-tions, the overall cable installation campaign would last between 2 years (three CLVs and Plants in Northeast Asia) to 11 years (one CLV and Plants in Northern Europe), continuously, as presented in Fig. 14.
CLVs require specialist personnel and equipment onboard, which is inherently reflected into vessel day rates; whereas transport vessels have a reduced crew onboard, that is, it is generally limited to marine crew. It is unlikely that cost-effectiveness can be achieved through a strategy implying extensive CLV transit time unless construction crew is periodically mobilised and demobilised according to construction and transit modes.
Installation with transport vessels and CLVs
An integrated approach combining CLVs and transport ves-sels has been studied. This strategy is based on the CLV(s) remaining along the cable route vicinity (between Australia and Singapore) during the entire installation campaign whilst transport vessels transit back and forth from manu-facturing plants to CLV to ensure operational continuity and avoid excessive CLV stand-by durations (and associ-ated costs).
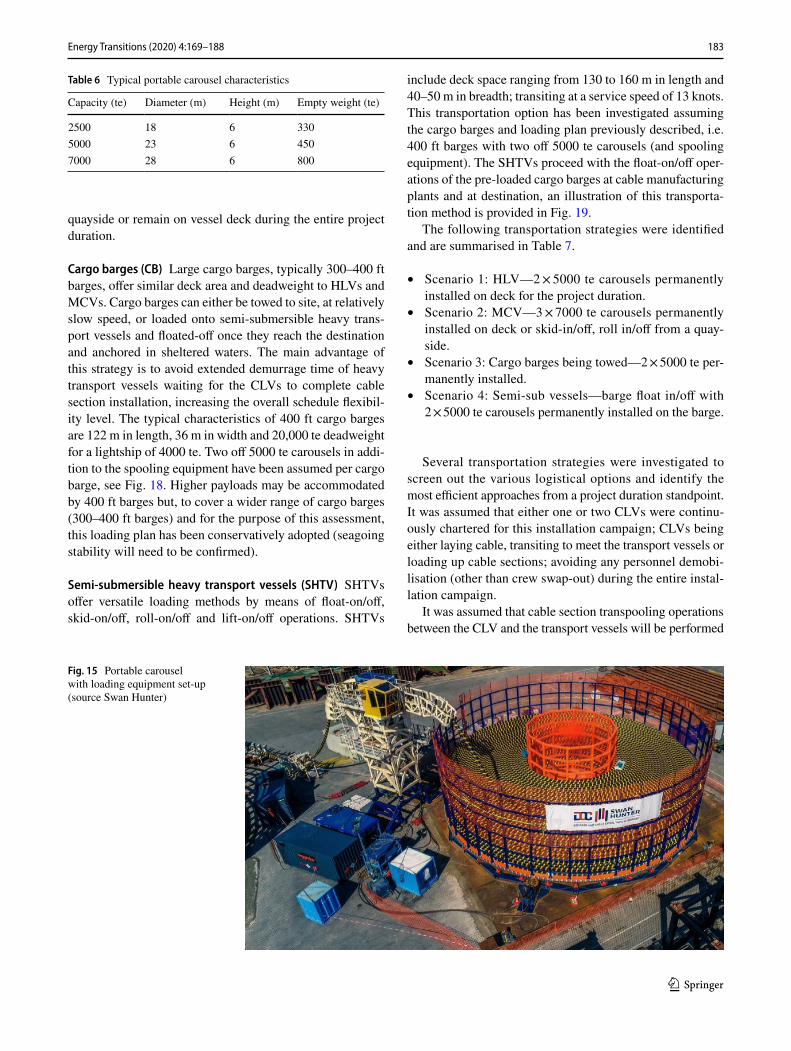
Large basket or reel carousels are used both for cable storage at manufacturing plants and marine transportation. The carousel assembly includes a circular base grillage to interface with the Transport Vessel, a turntable and a drive system, a loading tower with a spooling tensioner for load-ing/unloading, a control cabin, chutes and deflectors to safely route the cable in and out the carousels. Characteris-tics of high capacity carousels are summarised in Table 6. It is assumed, and likely to be preferred, that equipment
required for cable transpooling remains onboard transport vessels during the entire installation campaign (Fig. 15).
Depending on the adopted transportation strategy, this large quantity of HVDC cable can be shipped from the manufacturing plant(s) to Indonesia/Australia, using differ-ent types of heavy transport vessels available on the market.
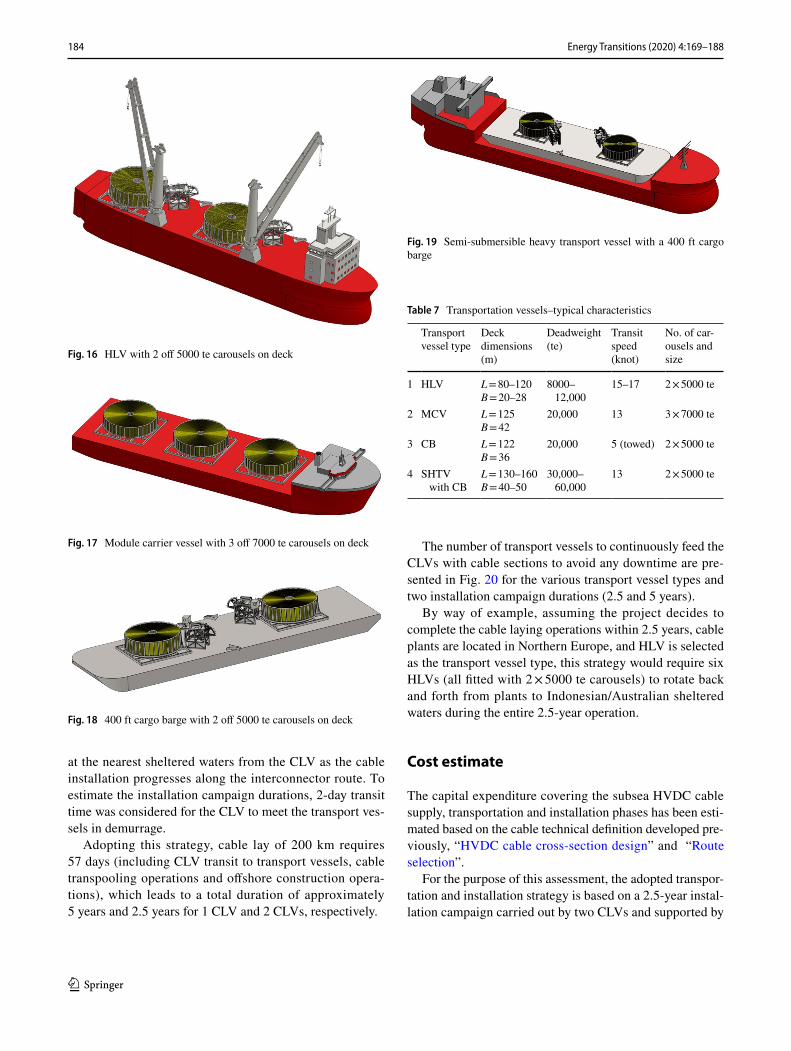
Heavy lift vessels (HLV) HLVs are one of the most common transportation vessels used for shipment of oversized equip-ment cross-continents travelling at a service speed up to 17 knots. These vessels are typically equipped with dual cranes of unit capacity ranging from 300 to 900 te and large cargo holds. Generally, HLVs offer a flush deck of approximately 80–100 m in length, 26–28 m in beam and a deadweight of 10,000–12,000 te. The vessel deadweight and stability requirement are expected to be the governing parameters defining the maximum amount of cable a HLV can carry per trip. Accounting for these limitations, it has been assumed that a HLV should be able to accommodate two off 5000 te carousels (23 m in diameter) and the associated cable spool-ing equipment, as illustrated in Fig. 16. HLV cranes will be used to mobilise the empty carousels and spooling equip-ment on deck.
Module carrier vessels (MCV) The specificity of the MC-class (module carrier) vessels is the large vessel breadth (up to 34 m) offering a large clear deck suitable to transport large and bulky heavy cargo at a service speed of 13 knots. These vessels can accommodate up to three 7000 te carou-sels (28 m in diameter), illustrated in Fig. 17 either loaded out through skidding/rolling in and out from a marine base
Fig. 14 Required duration to complete interconnector scope based on CLV only (no trans-port vessels) depending on plant location (years of continuous service)
183Energy Transitions (2020) 4:169–188
1 3
quayside or remain on vessel deck during the entire project duration.
Cargo barges (CB) Large cargo barges, typically 300–400 ft barges, offer similar deck area and deadweight to HLVs and MCVs. Cargo barges can either be towed to site, at relatively slow speed, or loaded onto semi-submersible heavy trans-port vessels and floated-off once they reach the destination and anchored in sheltered waters. The main advantage of this strategy is to avoid extended demurrage time of heavy transport vessels waiting for the CLVs to complete cable section installation, increasing the overall schedule flexibil-ity level. The typical characteristics of 400 ft cargo barges are 122 m in length, 36 m in width and 20,000 te deadweight for a lightship of 4000 te. Two off 5000 te carousels in addi-tion to the spooling equipment have been assumed per cargo barge, see Fig. 18. Higher payloads may be accommodated by 400 ft barges but, to cover a wider range of cargo barges (300–400 ft barges) and for the purpose of this assessment, this loading plan has been conservatively adopted (seagoing stability will need to be confirmed).
Semi‑submersible heavy transport vessels (SHTV) SHTVs offer versatile loading methods by means of float-on/off, skid-on/off, roll-on/off and lift-on/off operations. SHTVs
include deck space ranging from 130 to 160 m in length and 40–50 m in breadth; transiting at a service speed of 13 knots. This transportation option has been investigated assuming the cargo barges and loading plan previously described, i.e. 400 ft barges with two off 5000 te carousels (and spooling equipment). The SHTVs proceed with the float-on/off oper-ations of the pre-loaded cargo barges at cable manufacturing plants and at destination, an illustration of this transporta-tion method is provided in Fig. 19.
The following transportation strategies were identified and are summarised in Table 7.
• Scenario 1: HLV—2 × 5000 te carousels permanently installed on deck for the project duration.
• Scenario 2: MCV—3 × 7000 te carousels permanently installed on deck or skid-in/off, roll in/off from a quay-side.
• Scenario 3: Cargo barges being towed—2 × 5000 te per-manently installed.
• Scenario 4: Semi-sub vessels—barge float in/off with 2 × 5000 te carousels permanently installed on the barge.
Several transportation strategies were investigated to screen out the various logistical options and identify the most efficient approaches from a project duration standpoint. It was assumed that either one or two CLVs were continu-ously chartered for this installation campaign; CLVs being either laying cable, transiting to meet the transport vessels or loading up cable sections; avoiding any personnel demobi-lisation (other than crew swap-out) during the entire instal-lation campaign.
It was assumed that cable section transpooling operations between the CLV and the transport vessels will be performed
Table 6 Typical portable carousel characteristics
Capacity (te) Diameter (m) Height (m) Empty weight (te)
2500 18 6 3305000 23 6 4507000 28 6 800
Fig. 15 Portable carousel with loading equipment set-up (source Swan Hunter)
184 Energy Transitions (2020) 4:169–188
1 3
at the nearest sheltered waters from the CLV as the cable installation progresses along the interconnector route. To estimate the installation campaign durations, 2-day transit time was considered for the CLV to meet the transport ves-sels in demurrage.
Adopting this strategy, cable lay of 200 km requires 57 days (including CLV transit to transport vessels, cable transpooling operations and offshore construction opera-tions), which leads to a total duration of approximately 5 years and 2.5 years for 1 CLV and 2 CLVs, respectively.
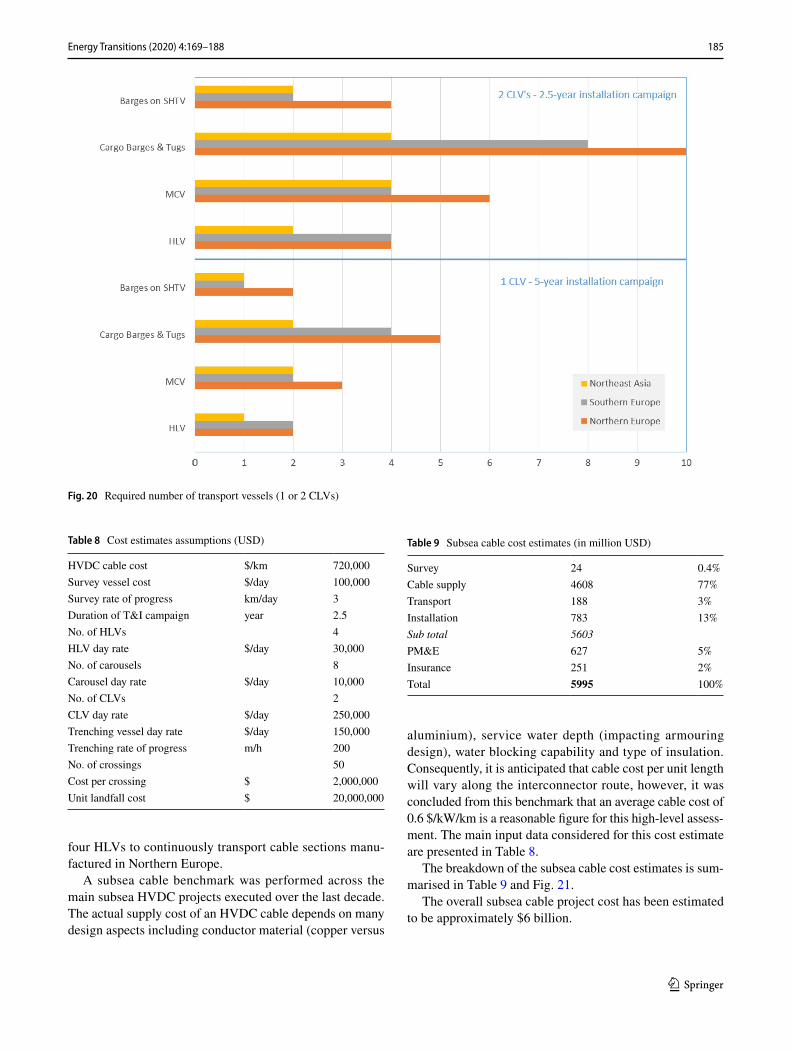
The number of transport vessels to continuously feed the CLVs with cable sections to avoid any downtime are pre-sented in Fig. 20 for the various transport vessel types and two installation campaign durations (2.5 and 5 years).
By way of example, assuming the project decides to complete the cable laying operations within 2.5 years, cable plants are located in Northern Europe, and HLV is selected as the transport vessel type, this strategy would require six HLVs (all fitted with 2 × 5000 te carousels) to rotate back and forth from plants to Indonesian/Australian sheltered waters during the entire 2.5-year operation.
Cost estimate
The capital expenditure covering the subsea HVDC cable supply, transportation and installation phases has been esti-mated based on the cable technical definition developed pre-viously, “HVDC cable cross-section design” and “Route selection”.
For the purpose of this assessment, the adopted transpor-tation and installation strategy is based on a 2.5-year instal-lation campaign carried out by two CLVs and supported by
Fig. 16 HLV with 2 off 5000 te carousels on deck
Fig. 17 Module carrier vessel with 3 off 7000 te carousels on deck
Fig. 18 400 ft cargo barge with 2 off 5000 te carousels on deck
Fig. 19 Semi-submersible heavy transport vessel with a 400 ft cargo barge
Table 7 Transportation vessels–typical characteristics
Transport vessel type
Deck dimensions (m)
Deadweight (te)
Transit speed (knot)
No. of car-ousels and size
1 HLV L = 80–120B = 20–28
8000–12,000
15–17 2 × 5000 te
2 MCV L = 125B = 42
20,000 13 3 × 7000 te
3 CB L = 122B = 36
20,000 5 (towed) 2 × 5000 te
4 SHTV with CB
L = 130–160B = 40–50
30,000–60,000
13 2 × 5000 te
185Energy Transitions (2020) 4:169–188
1 3
four HLVs to continuously transport cable sections manu-factured in Northern Europe.
A subsea cable benchmark was performed across the main subsea HVDC projects executed over the last decade. The actual supply cost of an HVDC cable depends on many design aspects including conductor material (copper versus
aluminium), service water depth (impacting armouring design), water blocking capability and type of insulation. Consequently, it is anticipated that cable cost per unit length will vary along the interconnector route, however, it was concluded from this benchmark that an average cable cost of 0.6 $/kW/km is a reasonable figure for this high-level assess-ment. The main input data considered for this cost estimate are presented in Table 8.
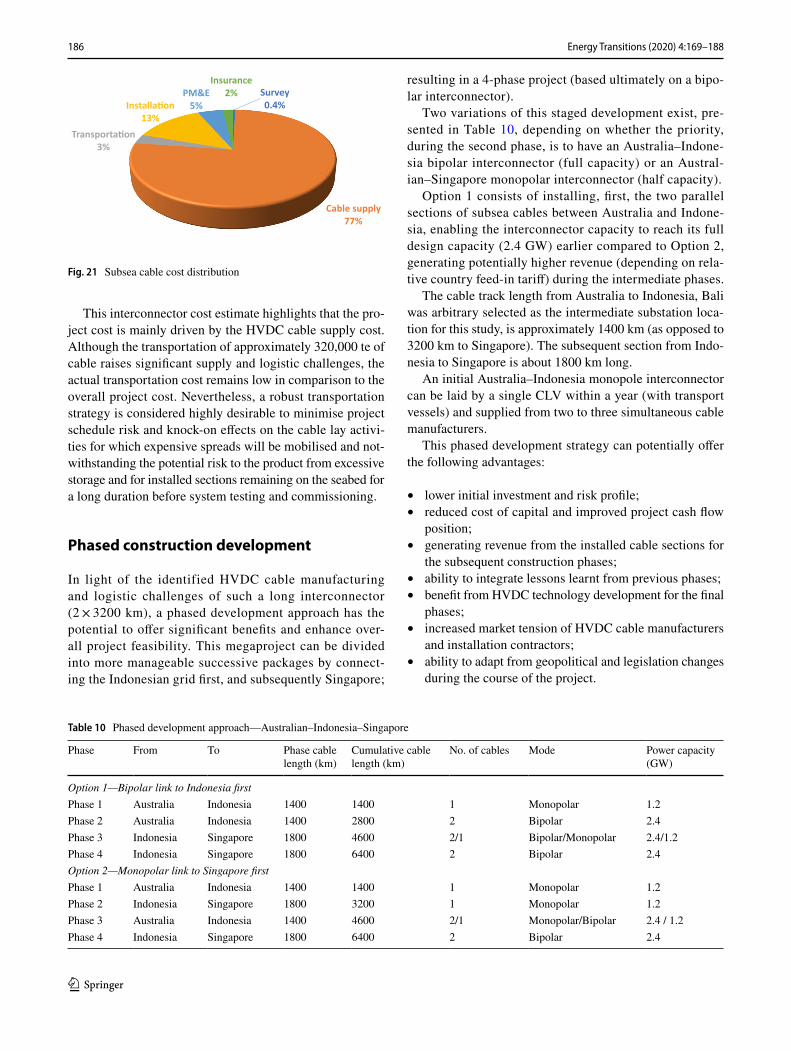
The breakdown of the subsea cable cost estimates is sum-marised in Table 9 and Fig. 21.
The overall subsea cable project cost has been estimated to be approximately $6 billion.
Fig. 20 Required number of transport vessels (1 or 2 CLVs)
Table 8 Cost estimates assumptions (USD)
HVDC cable cost $/km 720,000Survey vessel cost $/day 100,000Survey rate of progress km/day 3Duration of T&I campaign year 2.5No. of HLVs 4HLV day rate $/day 30,000No. of carousels 8Carousel day rate $/day 10,000No. of CLVs 2CLV day rate $/day 250,000Trenching vessel day rate $/day 150,000Trenching rate of progress m/h 200No. of crossings 50Cost per crossing $ 2,000,000Unit landfall cost $ 20,000,000
Table 9 Subsea cable cost estimates (in million USD)
Survey 24 0.4%Cable supply 4608 77%Transport 188 3%Installation 783 13%Sub total 5603PM&E 627 5%Insurance 251 2%Total 5995 100%
186 Energy Transitions (2020) 4:169–188
1 3
This interconnector cost estimate highlights that the pro-ject cost is mainly driven by the HVDC cable supply cost. Although the transportation of approximately 320,000 te of cable raises significant supply and logistic challenges, the actual transportation cost remains low in comparison to the overall project cost. Nevertheless, a robust transportation strategy is considered highly desirable to minimise project schedule risk and knock-on effects on the cable lay activi-ties for which expensive spreads will be mobilised and not-withstanding the potential risk to the product from excessive storage and for installed sections remaining on the seabed for a long duration before system testing and commissioning.
Phased construction development
In light of the identified HVDC cable manufacturing and logistic challenges of such a long interconnector (2 × 3200 km), a phased development approach has the potential to offer significant benefits and enhance over-all project feasibility. This megaproject can be divided into more manageable successive packages by connect-ing the Indonesian grid first, and subsequently Singapore;
resulting in a 4-phase project (based ultimately on a bipo-lar interconnector).
Two variations of this staged development exist, pre-sented in Table 10, depending on whether the priority, during the second phase, is to have an Australia–Indone-sia bipolar interconnector (full capacity) or an Austral-ian–Singapore monopolar interconnector (half capacity).
Option 1 consists of installing, first, the two parallel sections of subsea cables between Australia and Indone-sia, enabling the interconnector capacity to reach its full design capacity (2.4 GW) earlier compared to Option 2, generating potentially higher revenue (depending on rela-tive country feed-in tariff) during the intermediate phases.
The cable track length from Australia to Indonesia, Bali was arbitrary selected as the intermediate substation loca-tion for this study, is approximately 1400 km (as opposed to 3200 km to Singapore). The subsequent section from Indo-nesia to Singapore is about 1800 km long.
An initial Australia–Indonesia monopole interconnector can be laid by a single CLV within a year (with transport vessels) and supplied from two to three simultaneous cable manufacturers.
This phased development strategy can potentially offer the following advantages:
• lower initial investment and risk profile;• reduced cost of capital and improved project cash flow
position;• generating revenue from the installed cable sections for
the subsequent construction phases;• ability to integrate lessons learnt from previous phases;• benefit from HVDC technology development for the final
phases;• increased market tension of HVDC cable manufacturers
and installation contractors;• ability to adapt from geopolitical and legislation changes
during the course of the project.
Survey 0.4%
Cable supply77%
Transporta�on3%
Installa�on13%
PM&E5%
Insurance2%
Fig. 21 Subsea cable cost distribution
Table 10 Phased development approach—Australian–Indonesia–Singapore
Phase From To Phase cable length (km)
Cumulative cable length (km)
No. of cables Mode Power capacity (GW)
Option 1—Bipolar link to Indonesia firstPhase 1 Australia Indonesia 1400 1400 1 Monopolar 1.2Phase 2 Australia Indonesia 1400 2800 2 Bipolar 2.4Phase 3 Indonesia Singapore 1800 4600 2/1 Bipolar/Monopolar 2.4/1.2Phase 4 Indonesia Singapore 1800 6400 2 Bipolar 2.4Option 2—Monopolar link to Singapore firstPhase 1 Australia Indonesia 1400 1400 1 Monopolar 1.2Phase 2 Indonesia Singapore 1800 3200 1 Monopolar 1.2Phase 3 Australia Indonesia 1400 4600 2/1 Monopolar/Bipolar 2.4 / 1.2Phase 4 Indonesia Singapore 1800 6400 2 Bipolar 2.4
187Energy Transitions (2020) 4:169–188
1 3
Conclusions and discussions
Connecting Australia to Singapore through an HVDC subsea interconnector, although relatively ambitious, is technically feasible. A potentially suitable marine route has been identi-fied, 3200 km in length, which departs from north of West-ern Australia, crosses the Timor Trough (up to 1900 m water depth), crosses Indonesia (east of Bali) and runs through the Java Sea to Singapore. Adopting the current technology this interconnector can be configured in a bipolar mode to offer 2.4 GW power capacity, using two individual and identical 525 kV HVDC underwater cables, with most likely different designs along the route, such as copper and aluminium con-ductors for the shallow and deepwater sections respectively, and a mass-impregnated or XLPE insulation.
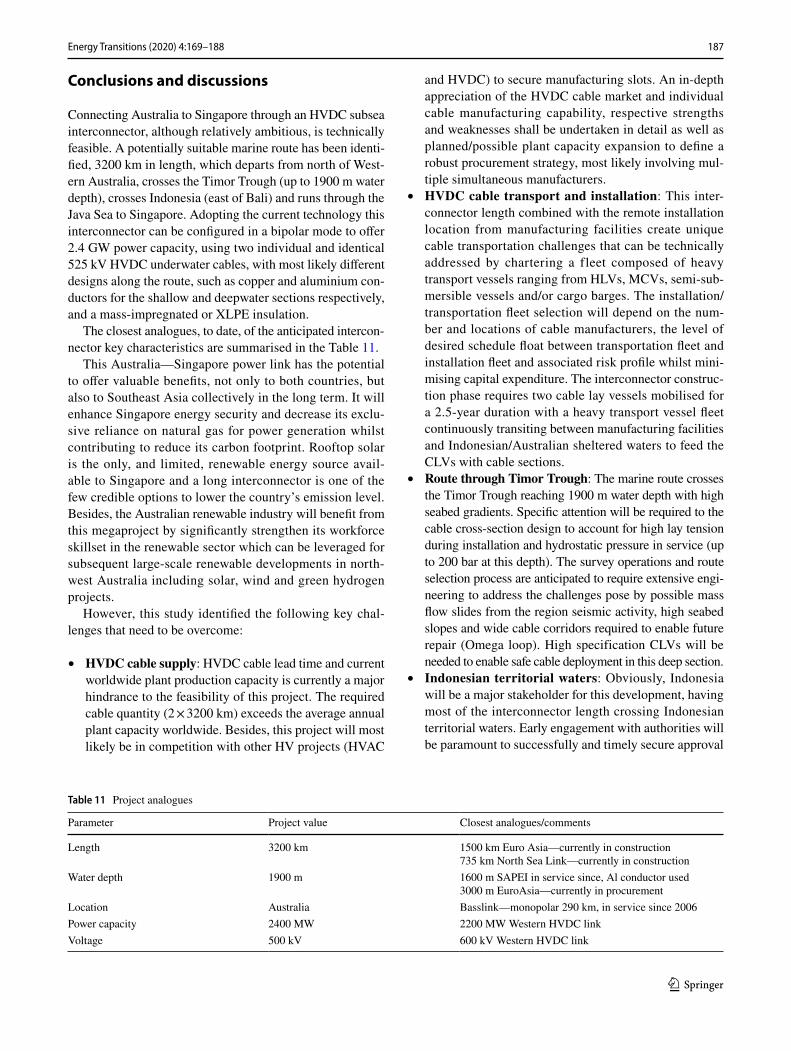
The closest analogues, to date, of the anticipated intercon-nector key characteristics are summarised in the Table 11.
This Australia—Singapore power link has the potential to offer valuable benefits, not only to both countries, but also to Southeast Asia collectively in the long term. It will enhance Singapore energy security and decrease its exclu-sive reliance on natural gas for power generation whilst contributing to reduce its carbon footprint. Rooftop solar is the only, and limited, renewable energy source avail-able to Singapore and a long interconnector is one of the few credible options to lower the country’s emission level. Besides, the Australian renewable industry will benefit from this megaproject by significantly strengthen its workforce skillset in the renewable sector which can be leveraged for subsequent large-scale renewable developments in north-west Australia including solar, wind and green hydrogen projects.
However, this study identified the following key chal-lenges that need to be overcome:
• HVDC cable supply: HVDC cable lead time and current worldwide plant production capacity is currently a major hindrance to the feasibility of this project. The required cable quantity (2 × 3200 km) exceeds the average annual plant capacity worldwide. Besides, this project will most likely be in competition with other HV projects (HVAC
and HVDC) to secure manufacturing slots. An in-depth appreciation of the HVDC cable market and individual cable manufacturing capability, respective strengths and weaknesses shall be undertaken in detail as well as planned/possible plant capacity expansion to define a robust procurement strategy, most likely involving mul-tiple simultaneous manufacturers.
• HVDC cable transport and installation: This inter-connector length combined with the remote installation location from manufacturing facilities create unique cable transportation challenges that can be technically addressed by chartering a fleet composed of heavy transport vessels ranging from HLVs, MCVs, semi-sub-mersible vessels and/or cargo barges. The installation/transportation fleet selection will depend on the num-ber and locations of cable manufacturers, the level of desired schedule float between transportation fleet and installation fleet and associated risk profile whilst mini-mising capital expenditure. The interconnector construc-tion phase requires two cable lay vessels mobilised for a 2.5-year duration with a heavy transport vessel fleet continuously transiting between manufacturing facilities and Indonesian/Australian sheltered waters to feed the CLVs with cable sections.
• Route through Timor Trough: The marine route crosses the Timor Trough reaching 1900 m water depth with high seabed gradients. Specific attention will be required to the cable cross-section design to account for high lay tension during installation and hydrostatic pressure in service (up to 200 bar at this depth). The survey operations and route selection process are anticipated to require extensive engi-neering to address the challenges pose by possible mass flow slides from the region seismic activity, high seabed slopes and wide cable corridors required to enable future repair (Omega loop). High specification CLVs will be needed to enable safe cable deployment in this deep section.
• Indonesian territorial waters: Obviously, Indonesia will be a major stakeholder for this development, having most of the interconnector length crossing Indonesian territorial waters. Early engagement with authorities will be paramount to successfully and timely secure approval
Table 11 Project analogues
Parameter Project value Closest analogues/comments
Length 3200 km 1500 km Euro Asia—currently in construction735 km North Sea Link—currently in construction
Water depth 1900 m 1600 m SAPEI in service since, Al conductor used3000 m EuroAsia—currently in procurement
Location Australia Basslink—monopolar 290 km, in service since 2006Power capacity 2400 MW 2200 MW Western HVDC linkVoltage 500 kV 600 kV Western HVDC link
188 Energy Transitions (2020) 4:169–188
1 3
of the Permit in Principle enabling cable installation within the country jurisdiction.
• Seabed congestion between Indonesia and Singapore: The route section from Indonesia to Singapore is excep-tionally shallow and flat with a high level of seabed con-gestion. Many crossings with existing pipelines and com-munication cables are expected with a need to protect the link against damage from fishing activities, ship dragged anchors and dropped objects, most likely requiring the cables to be trenched over 60% of the cable route.
The capital expenditure of this subsea interconnector pro-ject is anticipated to reach $6 billion and is mainly driven by the HVDC cable supply cost; the cable transportation represents only a small fraction of the overall project budget. However, the schedule risk profile of the complex project logistic is relatively high as it can impact the cable laying operations for which expensive spreads will be mobilised.
From project planning and financing perspectives, a staged development approach with an initial monopolar link between Australia and Indonesia appears attractive in light of the scale of the project and installation cam-paign duration. The tri-party power link model is currently being implemented by the EuroAsia interconnector project between Israel, Cyprus and Greece, which is, at the time of writing, the closest HVDC project analogue. The benefits for Indonesia include a carbon content reduction of its electric-ity and a response to the expected high demand growth in the coming decades. Also, Indonesia has the world’s second largest geothermal energy resource (after Iceland) and it is expected that its share of clean electricity from geothermal generation will grow significantly in the future.
Compliance with ethical standards
Conflict of interest The authors state that there is no conflict of inter-est.
Open Access This article is licensed under a Creative Commons Attri-bution 4.0 International License, which permits use, sharing, adapta-tion, distribution and reproduction in any medium or format, as long as you give appropriate credit to the original author(s) and the source, provide a link to the Creative Commons licence, and indicate if changes were made. The images or other third party material in this article are included in the article’s Creative Commons licence, unless indicated otherwise in a credit line to the material. If material is not included in the article’s Creative Commons licence and your intended use is not
permitted by statutory regulation or exceeds the permitted use, you will need to obtain permission directly from the copyright holder. To view a copy of this licence, visit http://creat iveco mmons .org/licen ses/by/4.0/.
Reference
1. Asian Super Grid, Renewable Energy Institute, https ://www.renew able-ei.org/en/asg/
2. Carbon Dioxide Reduction Potential in Singapore’s Power Genera-tion Sector, Anton Finenko & Lynette Cheah
3. Evaluating the potential to export Pilbara solar resources to the proposed ASEAN grid via a subsea high voltage direct current interconnector—Pre-feasibility Study, Samantha Mella, Geoff James & Kylie Chalmers, 2017
4. HVDC Submarine Power Cables in the World, JRC technical report, Mircea Ardelean & Philip Minnebo, (2015)
5. Jeroense, M., Hansson, O., Tyrberg, A., Rebillard, E., Cronholm, K., Lindhe J.:Deepwater Power Cable Systems? – Indeed!, ABB High Voltage (2016)
6. Initial feasibility report, Marinus project, TasNetwork (2019) 7. Norway-UK Interconnector, UK Marine Environmental State-
ment, National Grid NSN Link Limited (2014) 8. DNVGL-RP-0360 Subsea power cables in shallow water 9. A Review of the Carbon Footprint of Cu and Zn Production from
Primary and Secondary Sources, Anna Ekman Nilsson, Marta Macias Aragonés, Fatima Arroyo Torralvo, Vincent Dunon, Hanna Angel, Konstantinos Komnitsas and Karin Willquist
10. A General Model for Estimating Emissions from Integrated Power Generation and Energy Storage. Case Study: Integration of Solar Photovoltaic Power and Wind Power with Batteries Ian Miller, Emre Gençer and Francis M. O’Sullivan (2018)
11. EIA: Carbon dioxide emissions coefficients by fuel (2016b) 12. Marine traffic density, www.marin etraffi c.com 13. Qualification of an extruded HVDC cable system at 525 kV,
Anders Gustafsson, Marc Jeroense, Hossein Ghorbani, Tobias Quist, Markus Saltzer, Andreas Farkas, ABB AB, High Voltage Cables, Karlskrona, Sweden, (2015)
14. Demand and Capacity for HVAC and HVDC Underground and Submarine Cables (2019). https ://www.europ acabl e.eu/wp-conte nt/uploa ds/2019/09/Europ acabl e-Commu nicat ion-Deman d-and-Capac ity-for-HVAC-and-HVDC-cable s-24-Sept-2019.pdf
15. Stochastic Methodology to Estimate Costs of HVDC Transmis-sion, Edwaren Liun (2015)
16. Electricity carbon intensity in European Member States: Impacts on GHG emissions of electric vehicles, Alberto Moro, Laura Lonza (2016)
17. A General Model for Estimating Emissions from Integrated Power Generation and Energy Storage. Case Study: Integration of Solar Photovoltaic Power and Wind Power with Batteries, Ian Miller,Emre Gençer and Francis M. O’Sullivan (2018)
18. https ://www.xcele nergy .com/stati cfile s/xe/PDF/Marke ting/MN-Bus-Sol-Indus trial -Segme nt-Energ y-Savin gs-Guide .pdf